Matlacha Isles Matlacha Shores, FL Map & Demographics
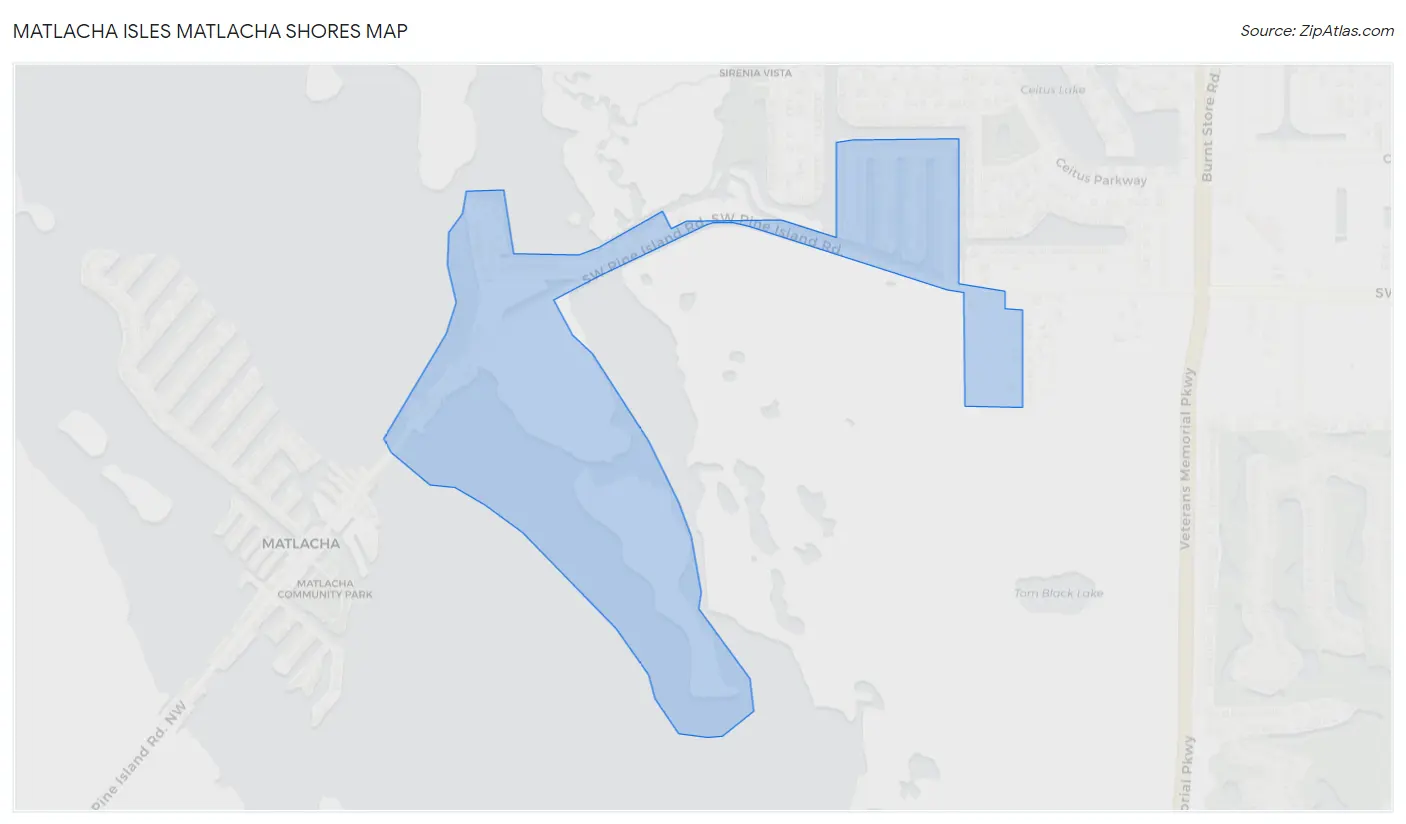
Matlacha Isles Matlacha Shores Map
Matlacha Isles Matlacha Shores Overview
$48,335
PER CAPITA INCOME
$104,565
AVG FAMILY INCOME
$103,641
AVG HOUSEHOLD INCOME
0.18
INEQUALITY / GINI INDEX
96
TOTAL POPULATION
60
MALE POPULATION
36
FEMALE POPULATION
166.67
MALES / 100 FEMALES
60.00
FEMALES / 100 MALES
69.8
MEDIAN AGE
2.1
AVG FAMILY SIZE
1.8
AVG HOUSEHOLD SIZE
48
LABOR FORCE [ PEOPLE ]
50.0%
PERCENT IN LABOR FORCE
Income in Matlacha Isles Matlacha Shores
Income Overview in Matlacha Isles Matlacha Shores
Per Capita Income in Matlacha Isles Matlacha Shores is $48,335, while median incomes of families and households are $104,565 and $103,641 respectively.
| Characteristic | Number | Measure |
| Per Capita Income | 96 | $48,335 |
| Median Family Income | 38 | $104,565 |
| Mean Family Income | 38 | $104,968 |
| Median Household Income | 55 | $103,641 |
| Mean Household Income | 55 | $83,336 |
| Income Deficit | 38 | $0 |
| Wage / Income Gap (%) | 96 | 0.00% |
| Wage / Income Gap ($) | 96 | 100.00¢ per $1 |
| Gini / Inequality Index | 96 | 0.18 |
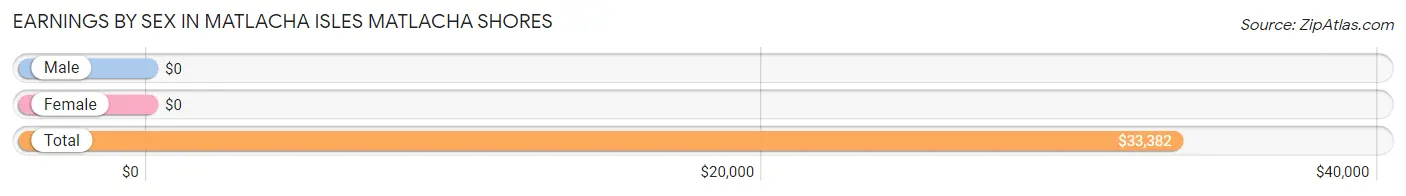
Earnings by Sex in Matlacha Isles Matlacha Shores
| Sex | Number | Average Earnings |
| Male | 35 (72.9%) | $0 |
| Female | 13 (27.1%) | $0 |
| Total | 48 (100.0%) | $33,382 |
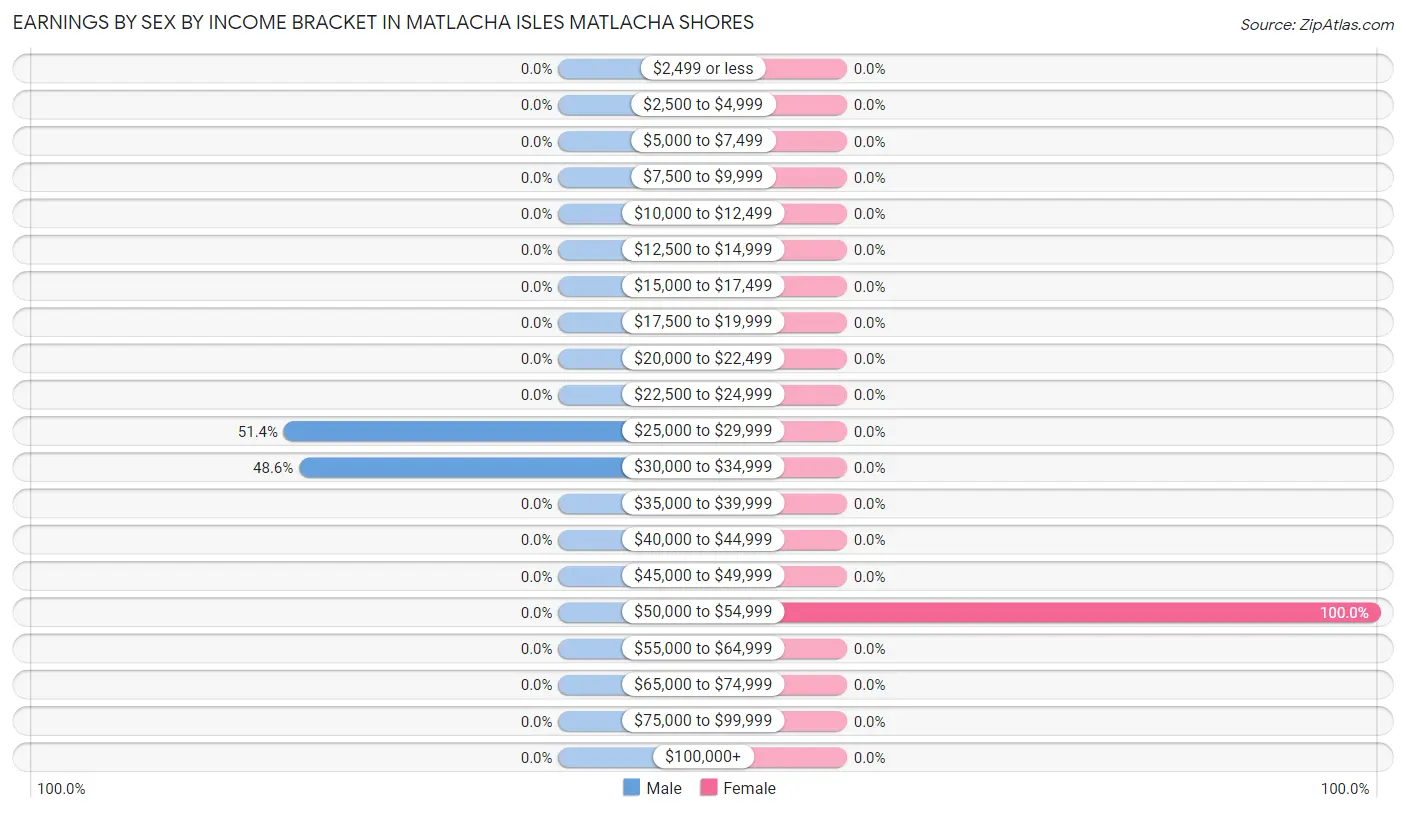
Earnings by Sex by Income Bracket in Matlacha Isles Matlacha Shores
The most common earnings brackets in Matlacha Isles Matlacha Shores are $25,000 to $29,999 for men (18 | 51.4%) and $50,000 to $54,999 for women (13 | 100.0%).
| Income | Male | Female |
| $2,499 or less | 0 (0.0%) | 0 (0.0%) |
| $2,500 to $4,999 | 0 (0.0%) | 0 (0.0%) |
| $5,000 to $7,499 | 0 (0.0%) | 0 (0.0%) |
| $7,500 to $9,999 | 0 (0.0%) | 0 (0.0%) |
| $10,000 to $12,499 | 0 (0.0%) | 0 (0.0%) |
| $12,500 to $14,999 | 0 (0.0%) | 0 (0.0%) |
| $15,000 to $17,499 | 0 (0.0%) | 0 (0.0%) |
| $17,500 to $19,999 | 0 (0.0%) | 0 (0.0%) |
| $20,000 to $22,499 | 0 (0.0%) | 0 (0.0%) |
| $22,500 to $24,999 | 0 (0.0%) | 0 (0.0%) |
| $25,000 to $29,999 | 18 (51.4%) | 0 (0.0%) |
| $30,000 to $34,999 | 17 (48.6%) | 0 (0.0%) |
| $35,000 to $39,999 | 0 (0.0%) | 0 (0.0%) |
| $40,000 to $44,999 | 0 (0.0%) | 0 (0.0%) |
| $45,000 to $49,999 | 0 (0.0%) | 0 (0.0%) |
| $50,000 to $54,999 | 0 (0.0%) | 13 (100.0%) |
| $55,000 to $64,999 | 0 (0.0%) | 0 (0.0%) |
| $65,000 to $74,999 | 0 (0.0%) | 0 (0.0%) |
| $75,000 to $99,999 | 0 (0.0%) | 0 (0.0%) |
| $100,000+ | 0 (0.0%) | 0 (0.0%) |
| Total | 35 (100.0%) | 13 (100.0%) |
Earnings by Sex by Educational Attainment in Matlacha Isles Matlacha Shores
| Educational Attainment | Male Income | Female Income |
| Less than High School | - | - |
| High School Diploma | - | - |
| College or Associate's Degree | - | - |
| Bachelor's Degree | - | - |
| Graduate Degree | - | - |
| Total | - | - |
Family Income in Matlacha Isles Matlacha Shores
Family Income Brackets in Matlacha Isles Matlacha Shores
According to the Matlacha Isles Matlacha Shores family income data, there are 38 families falling into the $100,000 to $149,999 income range, which is the most common income bracket and makes up 100.0% of all families.
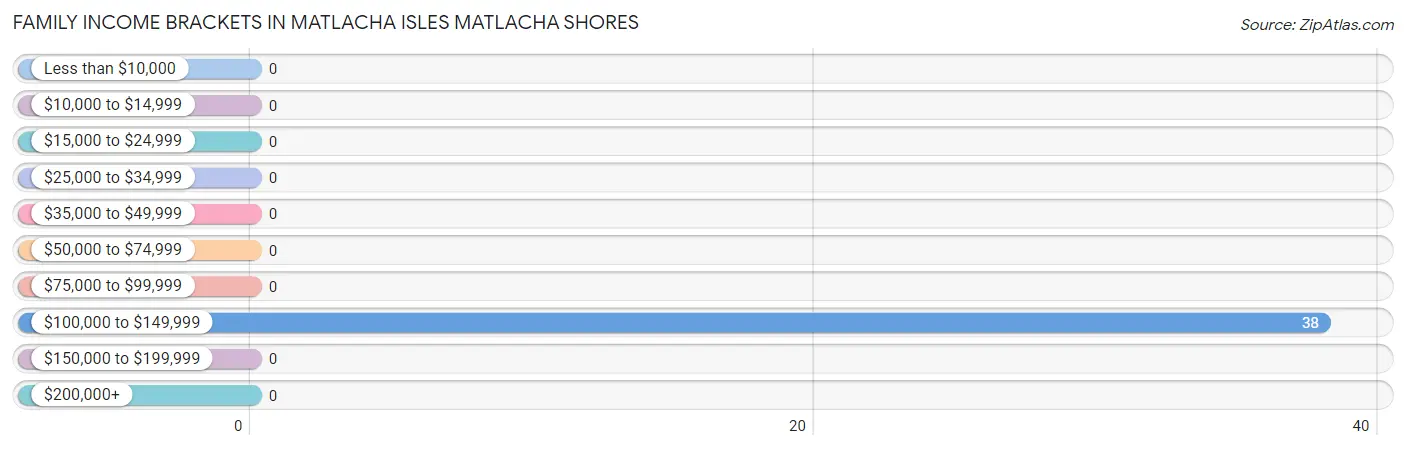
| Income Bracket | # Families | % Families |
| Less than $10,000 | 0 | 0.0% |
| $10,000 to $14,999 | 0 | 0.0% |
| $15,000 to $24,999 | 0 | 0.0% |
| $25,000 to $34,999 | 0 | 0.0% |
| $35,000 to $49,999 | 0 | 0.0% |
| $50,000 to $74,999 | 0 | 0.0% |
| $75,000 to $99,999 | 0 | 0.0% |
| $100,000 to $149,999 | 38 | 100.0% |
| $150,000 to $199,999 | 0 | 0.0% |
| $200,000+ | 0 | 0.0% |
Family Income by Famaliy Size in Matlacha Isles Matlacha Shores
2-person families (38 | 100.0%) account for the highest median family income in Matlacha Isles Matlacha Shores with $104,565 per family, while 2-person families (38 | 100.0%) have the highest median income of $52,282 per family member.
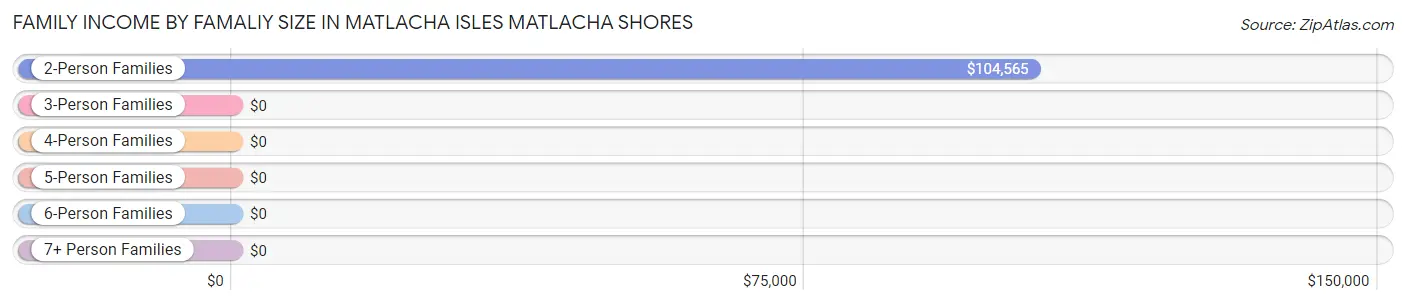
| Income Bracket | # Families | Median Income |
| 2-Person Families | 38 (100.0%) | $104,565 |
| 3-Person Families | 0 (0.0%) | $0 |
| 4-Person Families | 0 (0.0%) | $0 |
| 5-Person Families | 0 (0.0%) | $0 |
| 6-Person Families | 0 (0.0%) | $0 |
| 7+ Person Families | 0 (0.0%) | $0 |
| Total | 38 (100.0%) | $104,565 |
Family Income by Number of Earners in Matlacha Isles Matlacha Shores
| Number of Earners | # Families | Median Income |
| No Earners | 25 (65.8%) | $0 |
| 1 Earner | 0 (0.0%) | $0 |
| 2 Earners | 13 (34.2%) | $0 |
| 3+ Earners | 0 (0.0%) | $0 |
| Total | 38 (100.0%) | $104,565 |
Household Income in Matlacha Isles Matlacha Shores
Household Income Brackets in Matlacha Isles Matlacha Shores
With 38 households falling in the category, the $100,000 to $149,999 income range is the most frequent in Matlacha Isles Matlacha Shores, accounting for 69.1% of all households.
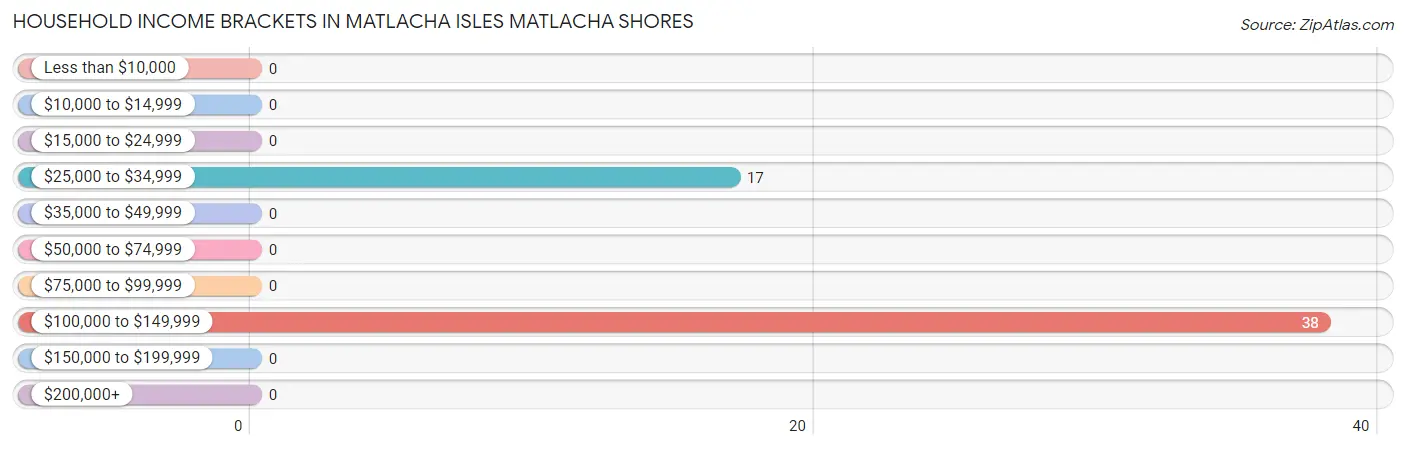
| Income Bracket | # Households | % Households |
| Less than $10,000 | 0 | 0.0% |
| $10,000 to $14,999 | 0 | 0.0% |
| $15,000 to $24,999 | 0 | 0.0% |
| $25,000 to $34,999 | 17 | 30.9% |
| $35,000 to $49,999 | 0 | 0.0% |
| $50,000 to $74,999 | 0 | 0.0% |
| $75,000 to $99,999 | 0 | 0.0% |
| $100,000 to $149,999 | 38 | 69.1% |
| $150,000 to $199,999 | 0 | 0.0% |
| $200,000+ | 0 | 0.0% |
Household Income by Householder Age in Matlacha Isles Matlacha Shores
| Income Bracket | # Households | Median Income |
| 15 to 24 Years | 0 (0.0%) | $0 |
| 25 to 44 Years | 17 (30.9%) | $0 |
| 45 to 64 Years | 23 (41.8%) | $0 |
| 65+ Years | 15 (27.3%) | $0 |
| Total | 55 (100.0%) | $103,641 |
Poverty in Matlacha Isles Matlacha Shores
Income Below Poverty by Sex and Age in Matlacha Isles Matlacha Shores
| Age Bracket | Male | Female |
| Under 5 Years | 0 (0.0%) | 0 (0.0%) |
| 5 Years | 0 (0.0%) | 0 (0.0%) |
| 6 to 11 Years | 0 (0.0%) | 0 (0.0%) |
| 12 to 14 Years | 0 (0.0%) | 0 (0.0%) |
| 15 Years | 0 (0.0%) | 0 (0.0%) |
| 16 and 17 Years | 0 (0.0%) | 0 (0.0%) |
| 18 to 24 Years | 0 (0.0%) | 0 (0.0%) |
| 25 to 34 Years | 0 (0.0%) | 0 (0.0%) |
| 35 to 44 Years | 0 (0.0%) | 0 (0.0%) |
| 45 to 54 Years | 0 (0.0%) | 0 (0.0%) |
| 55 to 64 Years | 0 (0.0%) | 0 (0.0%) |
| 65 to 74 Years | 0 (0.0%) | 0 (0.0%) |
| 75 Years and over | 0 (0.0%) | 0 (0.0%) |
| Total | 0 (0.0%) | 0 (0.0%) |
Income Above Poverty by Sex and Age in Matlacha Isles Matlacha Shores
According to the poverty statistics in Matlacha Isles Matlacha Shores, males aged 35 to 44 years and females aged 45 to 54 years are the age groups that are most secure financially, with 100.0% of males and 100.0% of females in these age groups living above the poverty line.
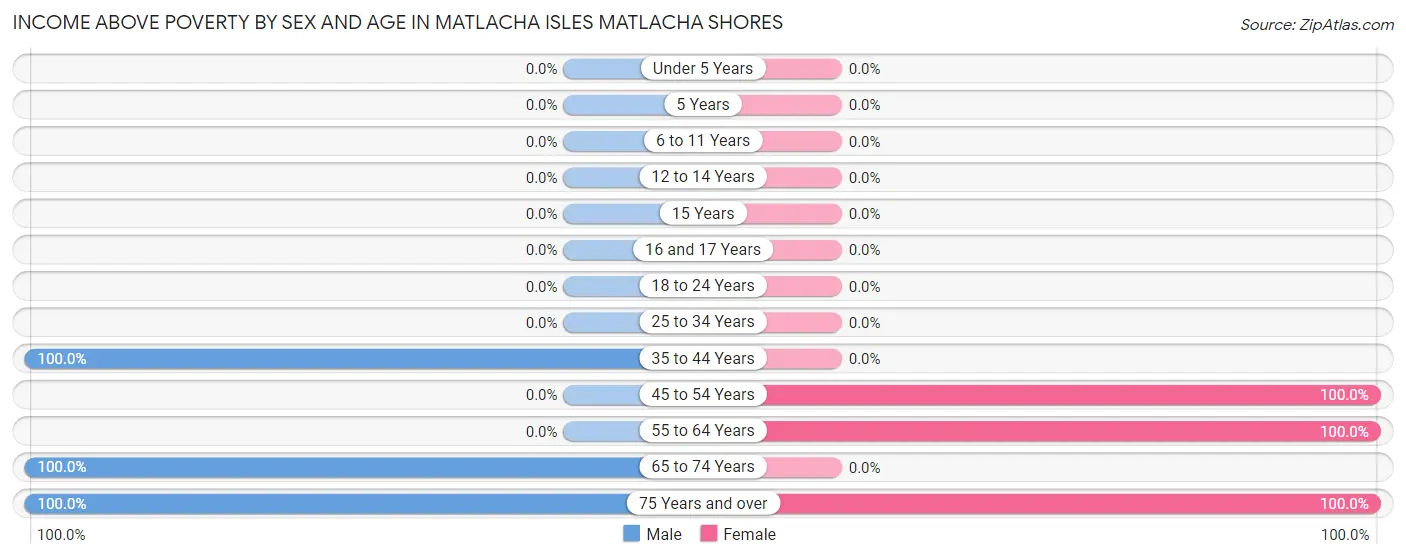
| Age Bracket | Male | Female |
| Under 5 Years | 0 (0.0%) | 0 (0.0%) |
| 5 Years | 0 (0.0%) | 0 (0.0%) |
| 6 to 11 Years | 0 (0.0%) | 0 (0.0%) |
| 12 to 14 Years | 0 (0.0%) | 0 (0.0%) |
| 15 Years | 0 (0.0%) | 0 (0.0%) |
| 16 and 17 Years | 0 (0.0%) | 0 (0.0%) |
| 18 to 24 Years | 0 (0.0%) | 0 (0.0%) |
| 25 to 34 Years | 0 (0.0%) | 0 (0.0%) |
| 35 to 44 Years | 17 (100.0%) | 0 (0.0%) |
| 45 to 54 Years | 0 (0.0%) | 10 (100.0%) |
| 55 to 64 Years | 0 (0.0%) | 13 (100.0%) |
| 65 to 74 Years | 10 (100.0%) | 0 (0.0%) |
| 75 Years and over | 33 (100.0%) | 13 (100.0%) |
| Total | 60 (100.0%) | 36 (100.0%) |
Income Below Poverty Among Married-Couple Families in Matlacha Isles Matlacha Shores
| Children | Above Poverty | Below Poverty |
| No Children | 38 (100.0%) | 0 (0.0%) |
| 1 or 2 Children | 0 (0.0%) | 0 (0.0%) |
| 3 or 4 Children | 0 (0.0%) | 0 (0.0%) |
| 5 or more Children | 0 (0.0%) | 0 (0.0%) |
| Total | 38 (100.0%) | 0 (0.0%) |
Income Below Poverty Among Single-Parent Households in Matlacha Isles Matlacha Shores
| Children | Single Father | Single Mother |
| No Children | 0 (0.0%) | 0 (0.0%) |
| 1 or 2 Children | 0 (0.0%) | 0 (0.0%) |
| 3 or 4 Children | 0 (0.0%) | 0 (0.0%) |
| 5 or more Children | 0 (0.0%) | 0 (0.0%) |
| Total | 0 (0.0%) | 0 (0.0%) |
Income Below Poverty Among Married-Couple vs Single-Parent Households in Matlacha Isles Matlacha Shores
| Children | Married-Couple Families | Single-Parent Households |
| No Children | 0 (0.0%) | 0 (0.0%) |
| 1 or 2 Children | 0 (0.0%) | 0 (0.0%) |
| 3 or 4 Children | 0 (0.0%) | 0 (0.0%) |
| 5 or more Children | 0 (0.0%) | 0 (0.0%) |
| Total | 0 (0.0%) | 0 (0.0%) |
Race in Matlacha Isles Matlacha Shores
The most populous races in Matlacha Isles Matlacha Shores are , and White / Caucasian (96 | 100.0%).
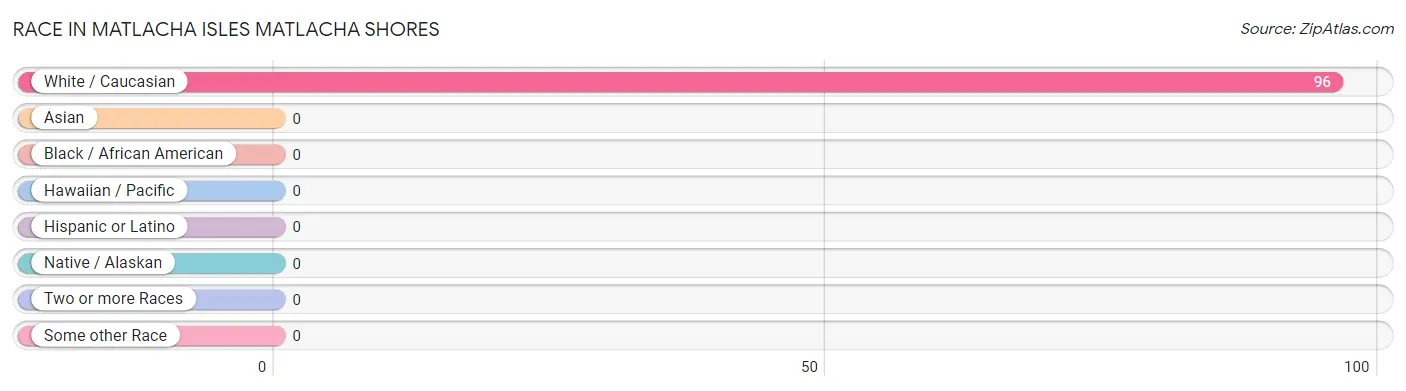
| Race | # Population | % Population |
| Asian | 0 | 0.0% |
| Black / African American | 0 | 0.0% |
| Hawaiian / Pacific | 0 | 0.0% |
| Hispanic or Latino | 0 | 0.0% |
| Native / Alaskan | 0 | 0.0% |
| White / Caucasian | 96 | 100.0% |
| Two or more Races | 0 | 0.0% |
| Some other Race | 0 | 0.0% |
| Total | 96 | 100.0% |
Ancestry in Matlacha Isles Matlacha Shores
The most populous ancestries reported in Matlacha Isles Matlacha Shores are Polish (48 | 50.0%), Irish (28 | 29.2%), Norwegian (23 | 24.0%), German (10 | 10.4%), and Italian (10 | 10.4%), together accounting for 124.0% of all Matlacha Isles Matlacha Shores residents.
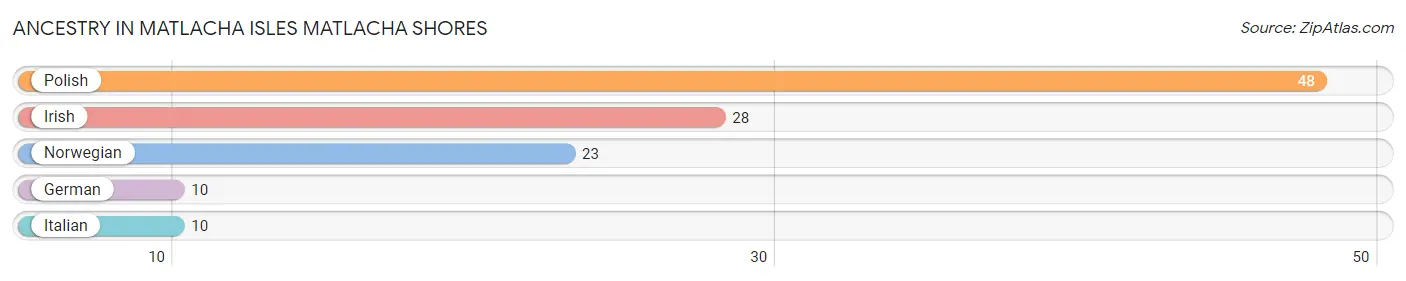
| Ancestry | # Population | % Population |
| German | 10 | 10.4% |
| Irish | 28 | 29.2% |
| Italian | 10 | 10.4% |
| Norwegian | 23 | 24.0% |
| Polish | 48 | 50.0% | View All 5 Rows |
Immigrants in Matlacha Isles Matlacha Shores

| Immigration Origin | # Population | % Population | View All 0 Rows |
Sex and Age in Matlacha Isles Matlacha Shores
Sex and Age in Matlacha Isles Matlacha Shores
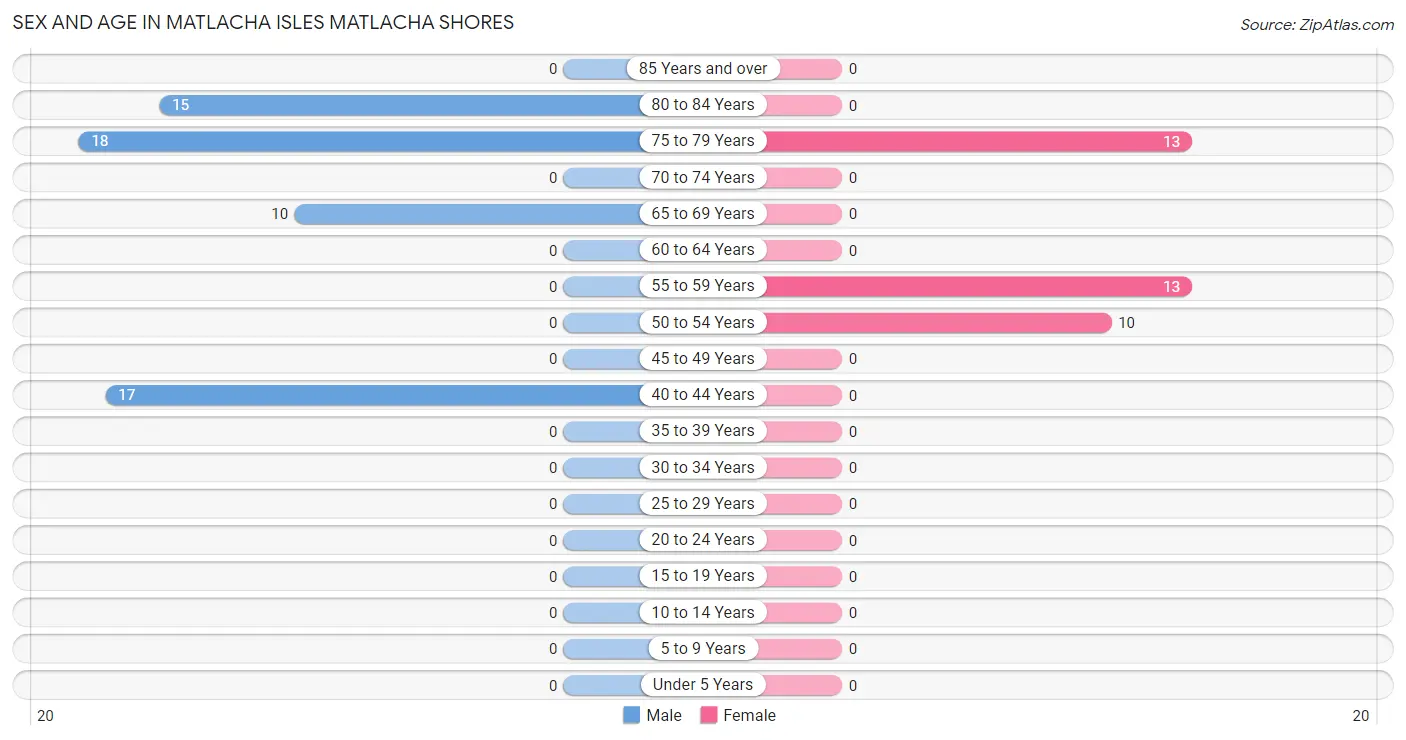
The most populous age groups in Matlacha Isles Matlacha Shores are 75 to 79 Years (18 | 30.0%) for men and 55 to 59 Years (13 | 36.1%) for women.
| Age Bracket | Male | Female |
| Under 5 Years | 0 (0.0%) | 0 (0.0%) |
| 5 to 9 Years | 0 (0.0%) | 0 (0.0%) |
| 10 to 14 Years | 0 (0.0%) | 0 (0.0%) |
| 15 to 19 Years | 0 (0.0%) | 0 (0.0%) |
| 20 to 24 Years | 0 (0.0%) | 0 (0.0%) |
| 25 to 29 Years | 0 (0.0%) | 0 (0.0%) |
| 30 to 34 Years | 0 (0.0%) | 0 (0.0%) |
| 35 to 39 Years | 0 (0.0%) | 0 (0.0%) |
| 40 to 44 Years | 17 (28.3%) | 0 (0.0%) |
| 45 to 49 Years | 0 (0.0%) | 0 (0.0%) |
| 50 to 54 Years | 0 (0.0%) | 10 (27.8%) |
| 55 to 59 Years | 0 (0.0%) | 13 (36.1%) |
| 60 to 64 Years | 0 (0.0%) | 0 (0.0%) |
| 65 to 69 Years | 10 (16.7%) | 0 (0.0%) |
| 70 to 74 Years | 0 (0.0%) | 0 (0.0%) |
| 75 to 79 Years | 18 (30.0%) | 13 (36.1%) |
| 80 to 84 Years | 15 (25.0%) | 0 (0.0%) |
| 85 Years and over | 0 (0.0%) | 0 (0.0%) |
| Total | 60 (100.0%) | 36 (100.0%) |
Families and Households in Matlacha Isles Matlacha Shores
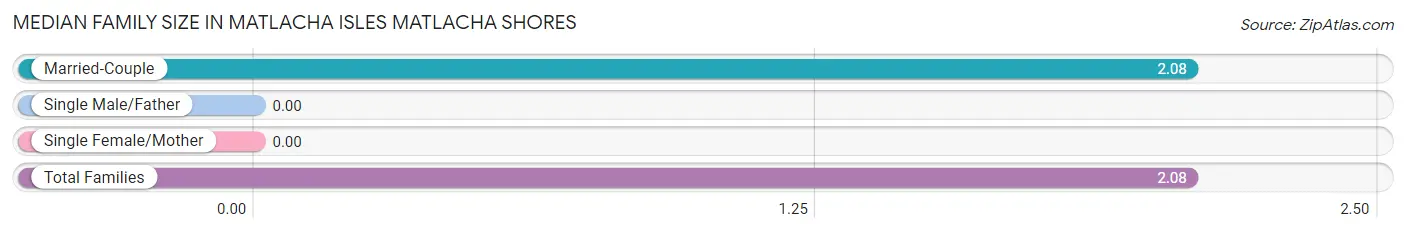
Median Family Size in Matlacha Isles Matlacha Shores
| Family Type | # Families | Family Size |
| Married-Couple | 38 (100.0%) | 2.08 |
| Single Male/Father | 0 (0.0%) | - |
| Single Female/Mother | 0 (0.0%) | - |
| Total Families | 38 (100.0%) | 2.08 |
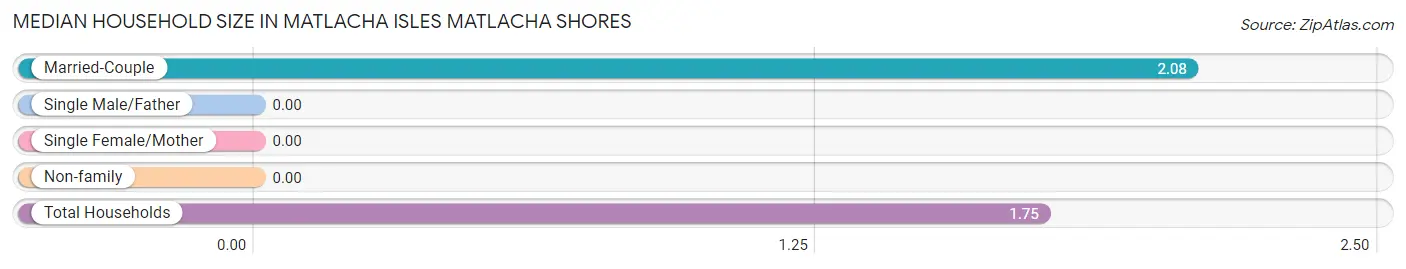
Median Household Size in Matlacha Isles Matlacha Shores
| Household Type | # Households | Household Size |
| Married-Couple | 38 (69.1%) | 2.08 |
| Single Male/Father | 0 (0.0%) | - |
| Single Female/Mother | 0 (0.0%) | - |
| Non-family | 17 (30.9%) | - |
| Total Households | 55 (100.0%) | 1.75 |
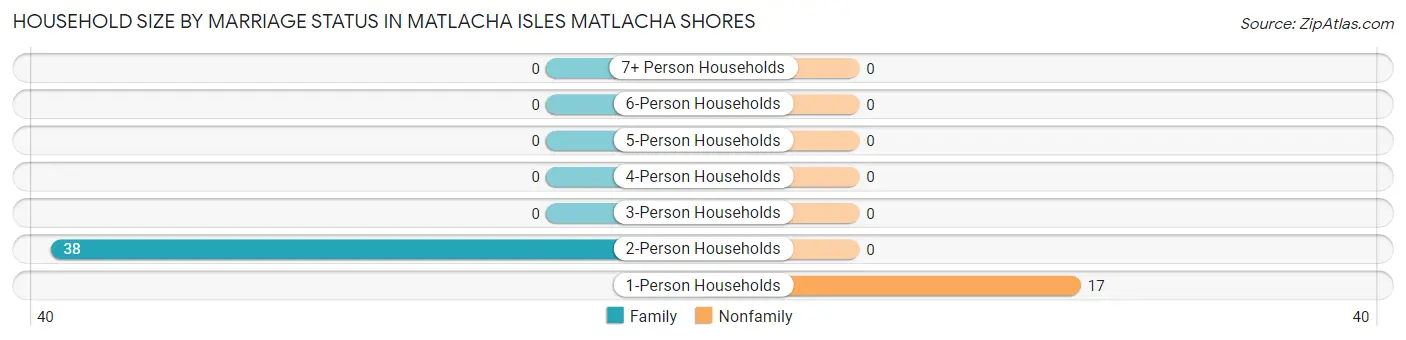
Household Size by Marriage Status in Matlacha Isles Matlacha Shores
Out of a total of 55 households in Matlacha Isles Matlacha Shores, 38 (69.1%) are family households, while 17 (30.9%) are nonfamily households. The most numerous type of family households are 2-person households, comprising 38, and the most common type of nonfamily households are 1-person households, comprising 17.
| Household Size | Family Households | Nonfamily Households |
| 1-Person Households | - | 17 (30.9%) |
| 2-Person Households | 38 (69.1%) | 0 (0.0%) |
| 3-Person Households | 0 (0.0%) | 0 (0.0%) |
| 4-Person Households | 0 (0.0%) | 0 (0.0%) |
| 5-Person Households | 0 (0.0%) | 0 (0.0%) |
| 6-Person Households | 0 (0.0%) | 0 (0.0%) |
| 7+ Person Households | 0 (0.0%) | 0 (0.0%) |
| Total | 38 (69.1%) | 17 (30.9%) |
Female Fertility in Matlacha Isles Matlacha Shores
Fertility by Age in Matlacha Isles Matlacha Shores
| Age Bracket | Women with Births | Births / 1,000 Women |
| 15 to 19 years | 0 (0.0%) | 0.0 |
| 20 to 34 years | 0 (0.0%) | 0.0 |
| 35 to 50 years | 0 (0.0%) | 0.0 |
| Total | 0 (0.0%) | 0.0 |
Fertility by Age by Marriage Status in Matlacha Isles Matlacha Shores
| Age Bracket | Married | Unmarried |
| 15 to 19 years | 0 (0.0%) | 0 (0.0%) |
| 20 to 34 years | 0 (0.0%) | 0 (0.0%) |
| 35 to 50 years | 0 (0.0%) | 0 (0.0%) |
| Total | 0 (0.0%) | 0 (0.0%) |
Fertility by Education in Matlacha Isles Matlacha Shores
| Educational Attainment | Women with Births | Births / 1,000 Women |
| Less than High School | 0 (0.0%) | 0.0 |
| High School Diploma | 0 (0.0%) | 0.0 |
| College or Associate's Degree | 0 (0.0%) | 0.0 |
| Bachelor's Degree | 0 (0.0%) | 0.0 |
| Graduate Degree | 0 (0.0%) | 0.0 |
| Total | 0 (0.0%) | 0.0 |
Fertility by Education by Marriage Status in Matlacha Isles Matlacha Shores
| Educational Attainment | Married | Unmarried |
| Less than High School | 0 (0.0%) | 0 (0.0%) |
| High School Diploma | 0 (0.0%) | 0 (0.0%) |
| College or Associate's Degree | 0 (0.0%) | 0 (0.0%) |
| Bachelor's Degree | 0 (0.0%) | 0 (0.0%) |
| Graduate Degree | 0 (0.0%) | 0 (0.0%) |
| Total | 0 (0.0%) | 0 (0.0%) |
Employment Characteristics in Matlacha Isles Matlacha Shores
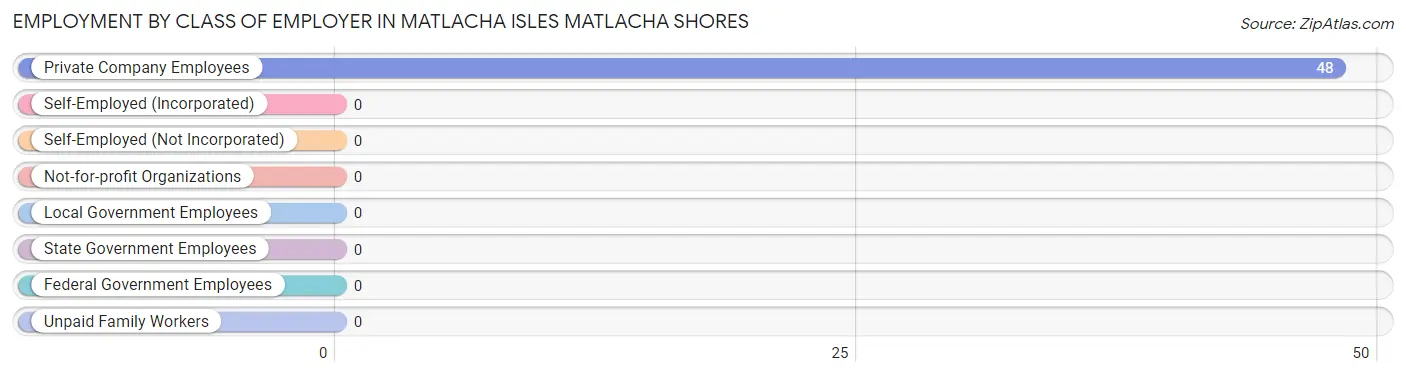
Employment by Class of Employer in Matlacha Isles Matlacha Shores
Among the 48 employed individuals in Matlacha Isles Matlacha Shores, , and private company employees (48 | 100.0%) make up the most common classes of employment.
| Employer Class | # Employees | % Employees |
| Private Company Employees | 48 | 100.0% |
| Self-Employed (Incorporated) | 0 | 0.0% |
| Self-Employed (Not Incorporated) | 0 | 0.0% |
| Not-for-profit Organizations | 0 | 0.0% |
| Local Government Employees | 0 | 0.0% |
| State Government Employees | 0 | 0.0% |
| Federal Government Employees | 0 | 0.0% |
| Unpaid Family Workers | 0 | 0.0% |
| Total | 48 | 100.0% |
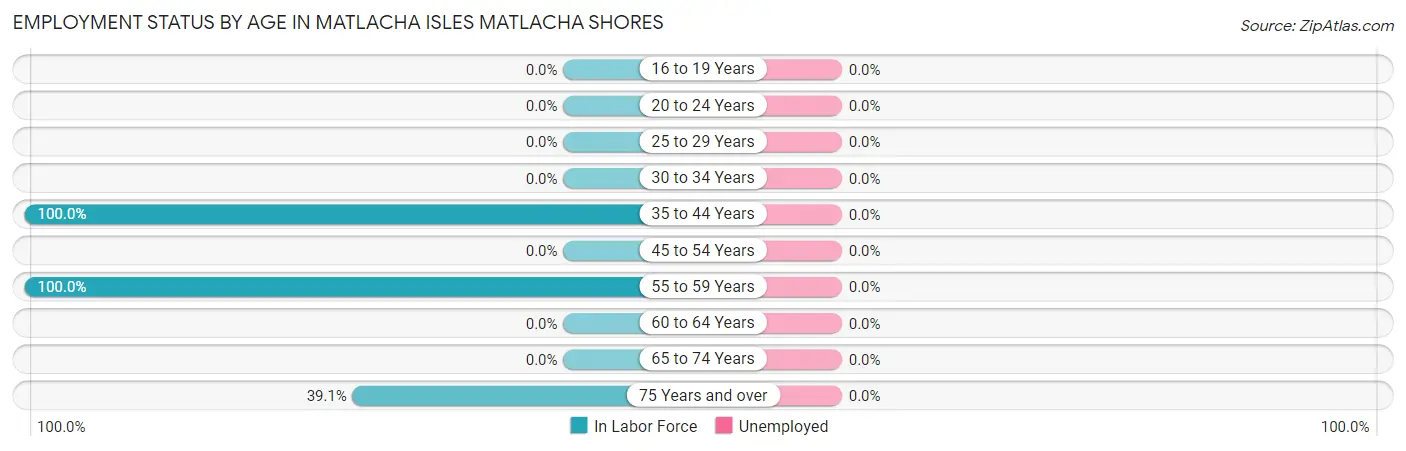
Employment Status by Age in Matlacha Isles Matlacha Shores
| Age Bracket | In Labor Force | Unemployed |
| 16 to 19 Years | 0 (0.0%) | 0 (0.0%) |
| 20 to 24 Years | 0 (0.0%) | 0 (0.0%) |
| 25 to 29 Years | 0 (0.0%) | 0 (0.0%) |
| 30 to 34 Years | 0 (0.0%) | 0 (0.0%) |
| 35 to 44 Years | 17 (100.0%) | 0 (0.0%) |
| 45 to 54 Years | 0 (0.0%) | 0 (0.0%) |
| 55 to 59 Years | 13 (100.0%) | 0 (0.0%) |
| 60 to 64 Years | 0 (0.0%) | 0 (0.0%) |
| 65 to 74 Years | 0 (0.0%) | 0 (0.0%) |
| 75 Years and over | 18 (39.1%) | 0 (0.0%) |
| Total | 48 (50.0%) | 0 (0.0%) |
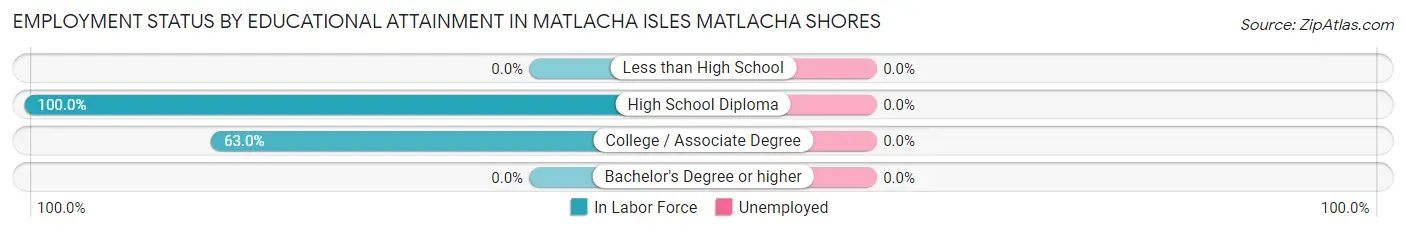
Employment Status by Educational Attainment in Matlacha Isles Matlacha Shores
| Educational Attainment | In Labor Force | Unemployed |
| Less than High School | 0 (0.0%) | 0 (0.0%) |
| High School Diploma | 13 (100.0%) | 0 (0.0%) |
| College / Associate Degree | 17 (63.0%) | 0 (0.0%) |
| Bachelor's Degree or higher | 0 (0.0%) | 0 (0.0%) |
| Total | 30 (75.0%) | 0 (0.0%) |
Employment Occupations by Sex in Matlacha Isles Matlacha Shores
Management, Business, Science and Arts Occupations
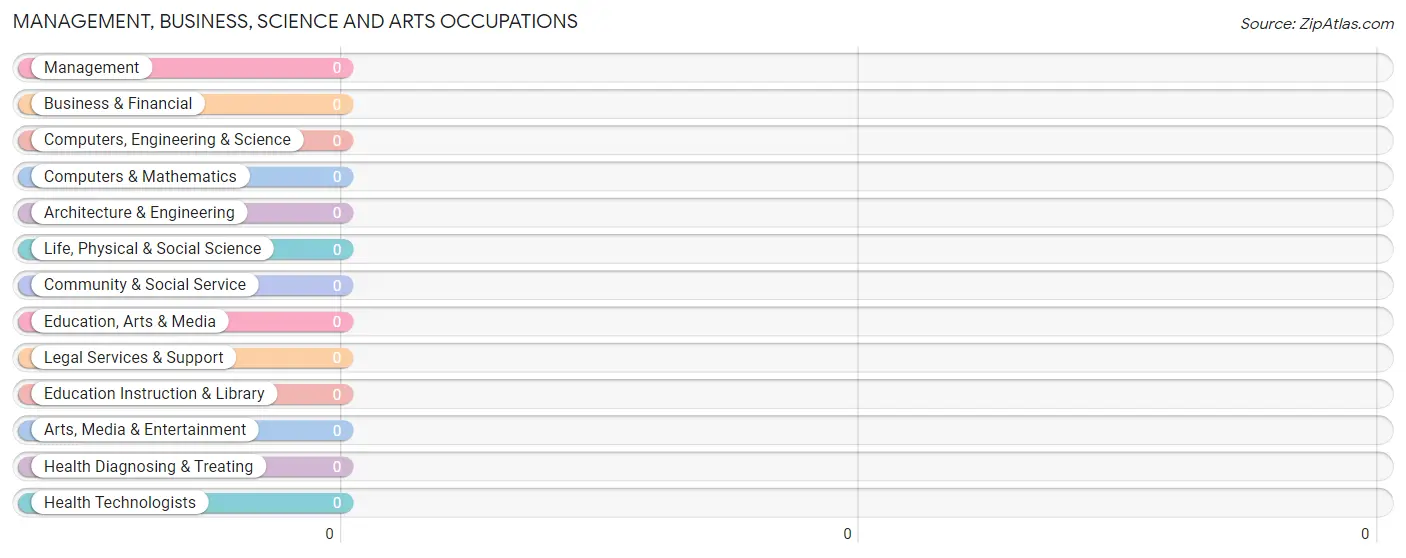
Management, Business, Science and Arts Occupations by Sex
| Occupation | Male | Female |
| Management | 0 (0.0%) | 0 (0.0%) |
| Business & Financial | 0 (0.0%) | 0 (0.0%) |
| Computers, Engineering & Science | 0 (0.0%) | 0 (0.0%) |
| Computers & Mathematics | 0 (0.0%) | 0 (0.0%) |
| Architecture & Engineering | 0 (0.0%) | 0 (0.0%) |
| Life, Physical & Social Science | 0 (0.0%) | 0 (0.0%) |
| Community & Social Service | 0 (0.0%) | 0 (0.0%) |
| Education, Arts & Media | 0 (0.0%) | 0 (0.0%) |
| Legal Services & Support | 0 (0.0%) | 0 (0.0%) |
| Education Instruction & Library | 0 (0.0%) | 0 (0.0%) |
| Arts, Media & Entertainment | 0 (0.0%) | 0 (0.0%) |
| Health Diagnosing & Treating | 0 (0.0%) | 0 (0.0%) |
| Health Technologists | 0 (0.0%) | 0 (0.0%) |
| Total (Category) | 0 (0.0%) | 0 (0.0%) |
| Total (Overall) | 35 (72.9%) | 13 (27.1%) |
Services Occupations
Services Occupations by Sex
| Occupation | Male | Female |
| Healthcare Support | 0 (0.0%) | 0 (0.0%) |
| Security & Protection | 0 (0.0%) | 0 (0.0%) |
| Firefighting & Prevention | 0 (0.0%) | 0 (0.0%) |
| Law Enforcement | 0 (0.0%) | 0 (0.0%) |
| Food Preparation & Serving | 0 (0.0%) | 0 (0.0%) |
| Cleaning & Maintenance | 0 (0.0%) | 0 (0.0%) |
| Personal Care & Service | 0 (0.0%) | 0 (0.0%) |
| Total (Category) | 0 (0.0%) | 0 (0.0%) |
| Total (Overall) | 35 (72.9%) | 13 (27.1%) |
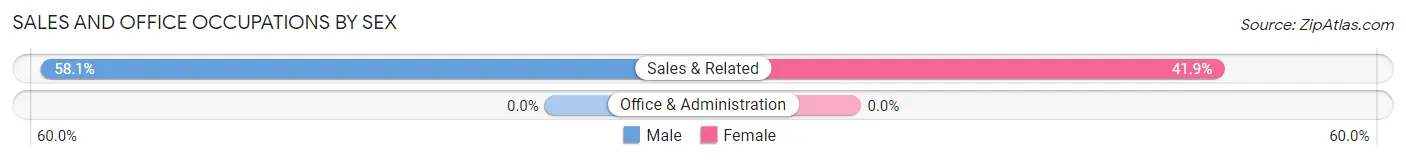
Sales and Office Occupations
The most common Sales and Office occupations in Matlacha Isles Matlacha Shores are , and Sales & Related (31 | 64.6%).
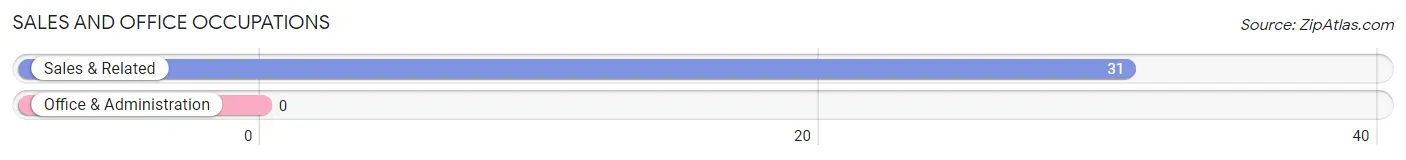
Sales and Office Occupations by Sex
| Occupation | Male | Female |
| Sales & Related | 18 (58.1%) | 13 (41.9%) |
| Office & Administration | 0 (0.0%) | 0 (0.0%) |
| Total (Category) | 18 (58.1%) | 13 (41.9%) |
| Total (Overall) | 35 (72.9%) | 13 (27.1%) |
Natural Resources, Construction and Maintenance Occupations
The most common Natural Resources, Construction and Maintenance occupations in Matlacha Isles Matlacha Shores are , and Construction & Extraction (17 | 35.4%).
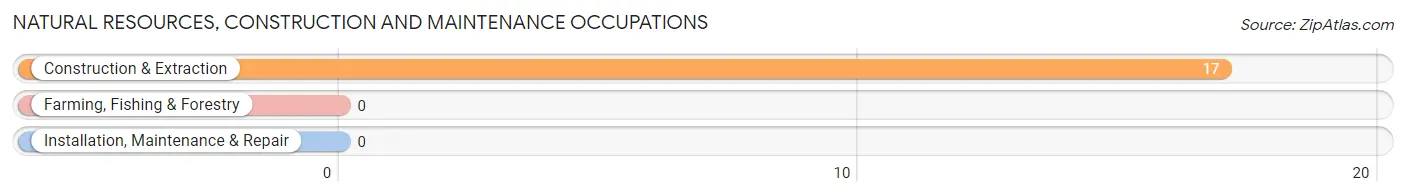
Natural Resources, Construction and Maintenance Occupations by Sex
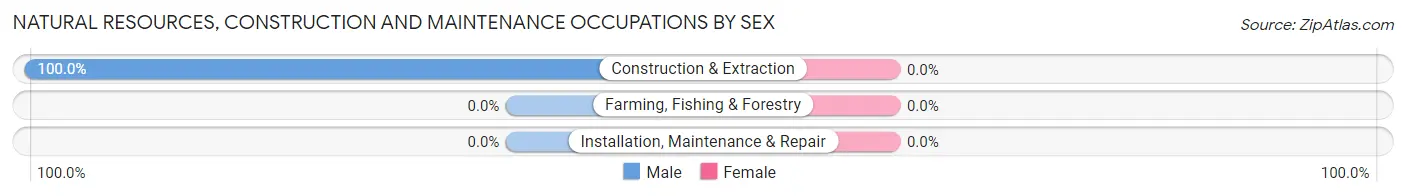
| Occupation | Male | Female |
| Farming, Fishing & Forestry | 0 (0.0%) | 0 (0.0%) |
| Construction & Extraction | 17 (100.0%) | 0 (0.0%) |
| Installation, Maintenance & Repair | 0 (0.0%) | 0 (0.0%) |
| Total (Category) | 17 (100.0%) | 0 (0.0%) |
| Total (Overall) | 35 (72.9%) | 13 (27.1%) |
Production, Transportation and Moving Occupations
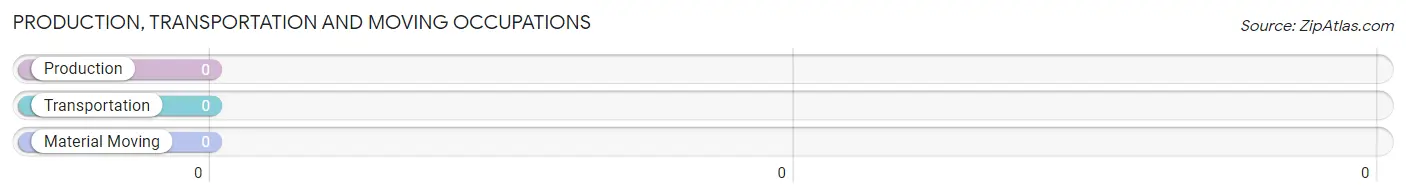
Production, Transportation and Moving Occupations by Sex
| Occupation | Male | Female |
| Production | 0 (0.0%) | 0 (0.0%) |
| Transportation | 0 (0.0%) | 0 (0.0%) |
| Material Moving | 0 (0.0%) | 0 (0.0%) |
| Total (Category) | 0 (0.0%) | 0 (0.0%) |
| Total (Overall) | 35 (72.9%) | 13 (27.1%) |
Employment Industries by Sex in Matlacha Isles Matlacha Shores
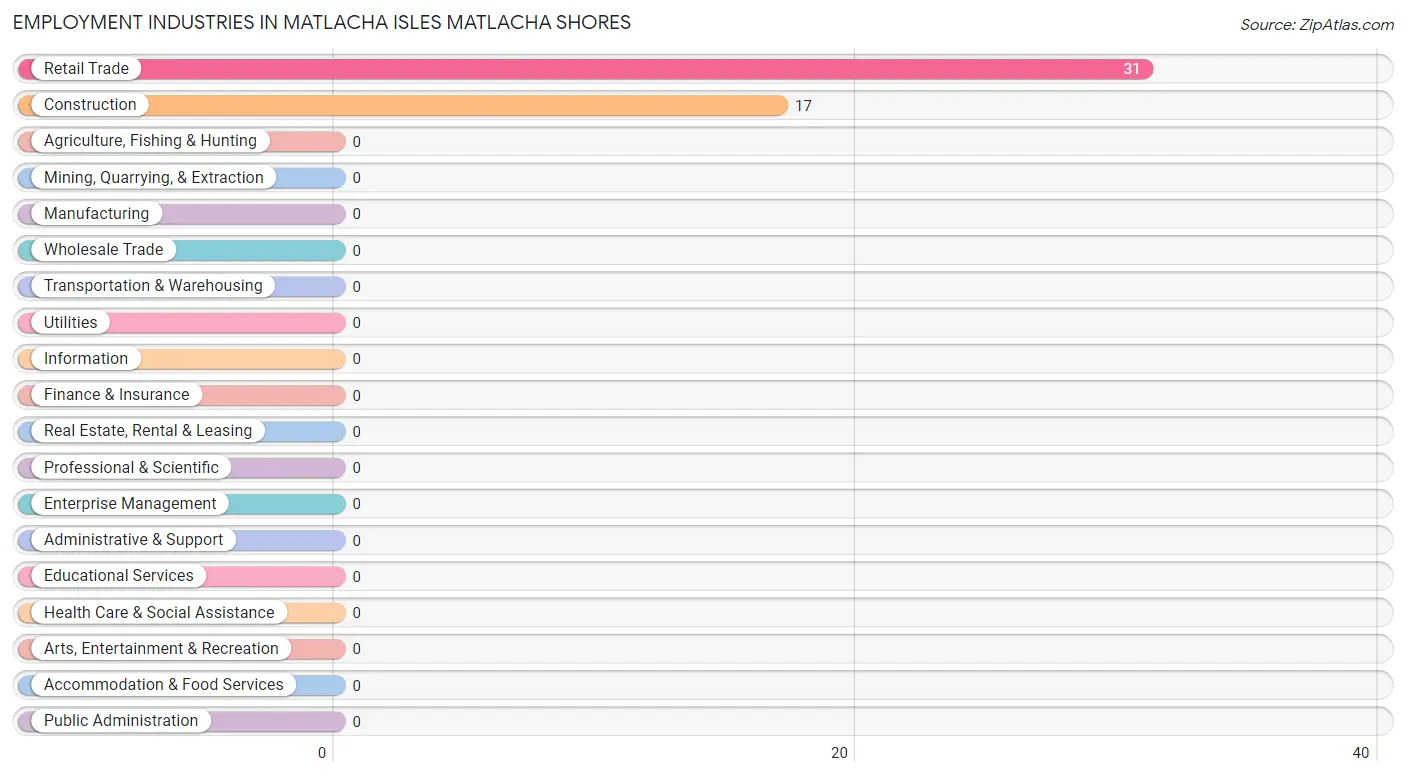
Employment Industries in Matlacha Isles Matlacha Shores
The major employment industries in Matlacha Isles Matlacha Shores include Retail Trade (31 | 64.6%), and Construction (17 | 35.4%).
Employment Industries by Sex in Matlacha Isles Matlacha Shores
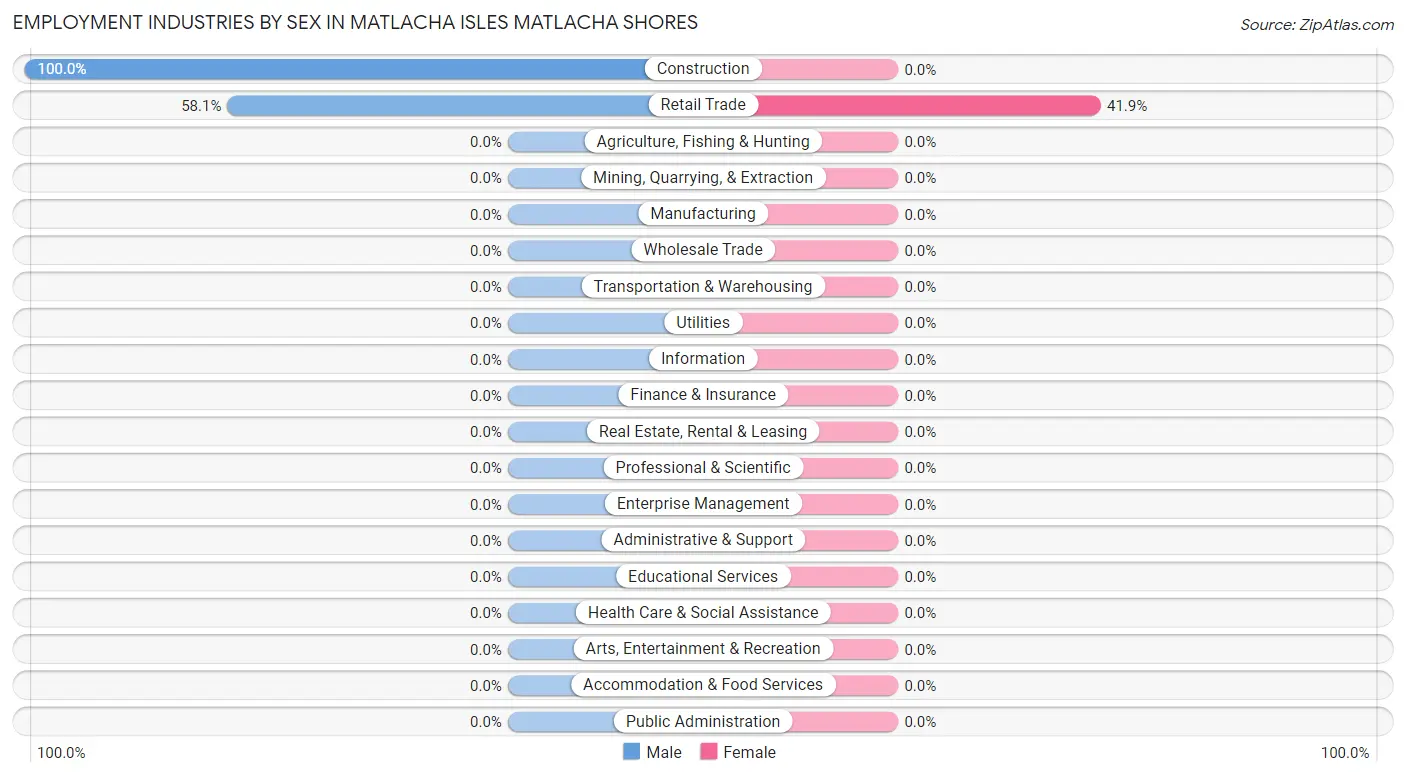
| Industry | Male | Female |
| Agriculture, Fishing & Hunting | 0 (0.0%) | 0 (0.0%) |
| Mining, Quarrying, & Extraction | 0 (0.0%) | 0 (0.0%) |
| Construction | 17 (100.0%) | 0 (0.0%) |
| Manufacturing | 0 (0.0%) | 0 (0.0%) |
| Wholesale Trade | 0 (0.0%) | 0 (0.0%) |
| Retail Trade | 18 (58.1%) | 13 (41.9%) |
| Transportation & Warehousing | 0 (0.0%) | 0 (0.0%) |
| Utilities | 0 (0.0%) | 0 (0.0%) |
| Information | 0 (0.0%) | 0 (0.0%) |
| Finance & Insurance | 0 (0.0%) | 0 (0.0%) |
| Real Estate, Rental & Leasing | 0 (0.0%) | 0 (0.0%) |
| Professional & Scientific | 0 (0.0%) | 0 (0.0%) |
| Enterprise Management | 0 (0.0%) | 0 (0.0%) |
| Administrative & Support | 0 (0.0%) | 0 (0.0%) |
| Educational Services | 0 (0.0%) | 0 (0.0%) |
| Health Care & Social Assistance | 0 (0.0%) | 0 (0.0%) |
| Arts, Entertainment & Recreation | 0 (0.0%) | 0 (0.0%) |
| Accommodation & Food Services | 0 (0.0%) | 0 (0.0%) |
| Public Administration | 0 (0.0%) | 0 (0.0%) |
| Total | 35 (72.9%) | 13 (27.1%) |
Education in Matlacha Isles Matlacha Shores
School Enrollment in Matlacha Isles Matlacha Shores
| School Level | # Students | % Students |
| Nursery / Preschool | 0 | 0.0% |
| Kindergarten | 0 | 0.0% |
| Elementary School | 0 | 0.0% |
| Middle School | 0 | 0.0% |
| High School | 0 | 0.0% |
| College / Undergraduate | 0 | 0.0% |
| Graduate / Professional | 0 | 0.0% |
| Total | 0 | 0.0% |
School Enrollment by Age by Funding Source in Matlacha Isles Matlacha Shores
| Age Bracket | Public School | Private School |
| 3 to 4 Year Olds | 0 (0.0%) | 0 (0.0%) |
| 5 to 9 Year Old | 0 (0.0%) | 0 (0.0%) |
| 10 to 14 Year Olds | 0 (0.0%) | 0 (0.0%) |
| 15 to 17 Year Olds | 0 (0.0%) | 0 (0.0%) |
| 18 to 19 Year Olds | 0 (0.0%) | 0 (0.0%) |
| 20 to 24 Year Olds | 0 (0.0%) | 0 (0.0%) |
| 25 to 34 Year Olds | 0 (0.0%) | 0 (0.0%) |
| 35 Years and over | 0 (0.0%) | 0 (0.0%) |
| Total | 0 (0.0%) | 0 (0.0%) |
Educational Attainment by Field of Study in Matlacha Isles Matlacha Shores
Social sciences (18 | 39.1%), business (15 | 32.6%), and science & technology (13 | 28.3%) are the most common fields of study among 46 individuals in Matlacha Isles Matlacha Shores who have obtained a bachelor's degree or higher.
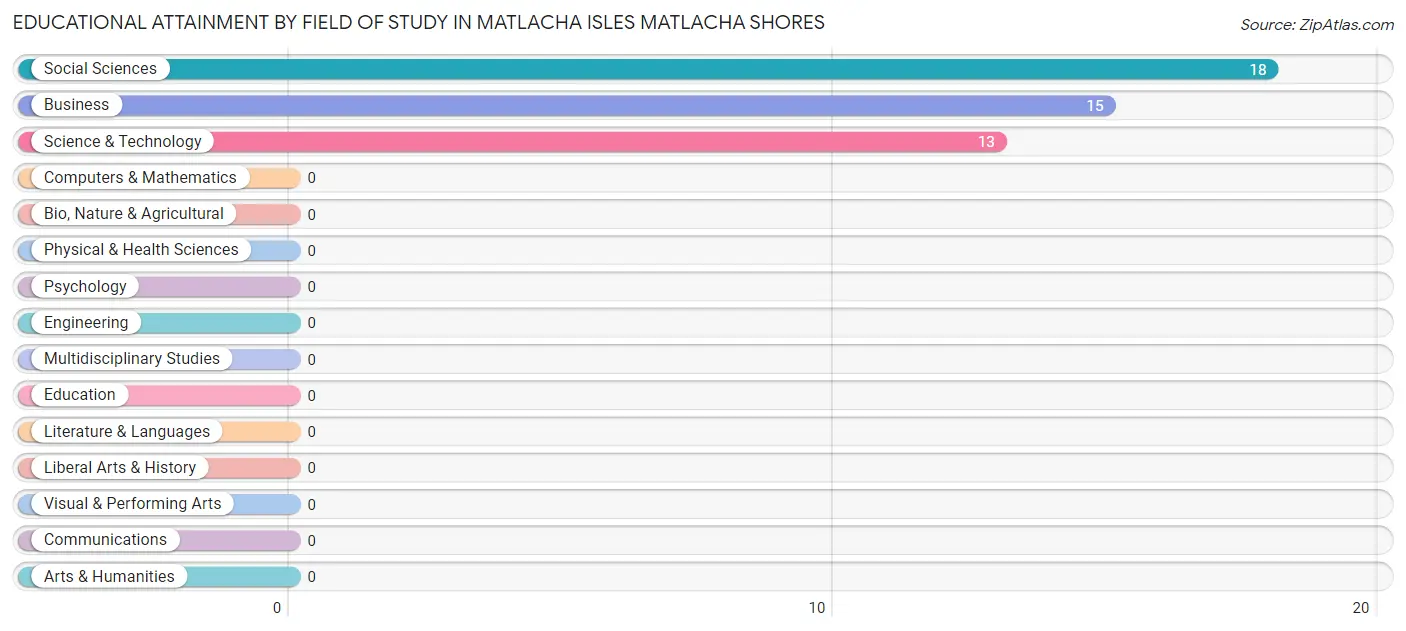
| Field of Study | # Graduates | % Graduates |
| Computers & Mathematics | 0 | 0.0% |
| Bio, Nature & Agricultural | 0 | 0.0% |
| Physical & Health Sciences | 0 | 0.0% |
| Psychology | 0 | 0.0% |
| Social Sciences | 18 | 39.1% |
| Engineering | 0 | 0.0% |
| Multidisciplinary Studies | 0 | 0.0% |
| Science & Technology | 13 | 28.3% |
| Business | 15 | 32.6% |
| Education | 0 | 0.0% |
| Literature & Languages | 0 | 0.0% |
| Liberal Arts & History | 0 | 0.0% |
| Visual & Performing Arts | 0 | 0.0% |
| Communications | 0 | 0.0% |
| Arts & Humanities | 0 | 0.0% |
| Total | 46 | 100.0% |
Transportation & Commute in Matlacha Isles Matlacha Shores
Vehicle Availability by Sex in Matlacha Isles Matlacha Shores
The most prevalent vehicle ownership categories in Matlacha Isles Matlacha Shores are males with 2 vehicles (18, accounting for 51.4%) and females with 2 vehicles (13, making up 138.5%).
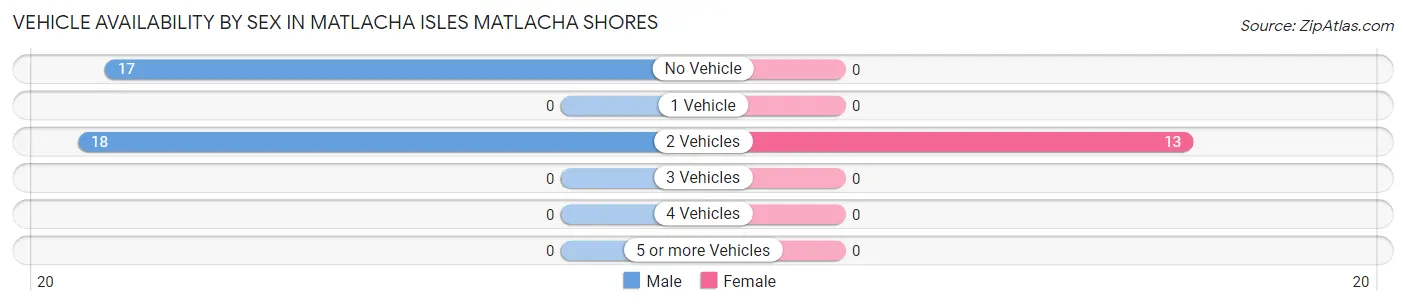
| Vehicles Available | Male | Female |
| No Vehicle | 17 (48.6%) | 0 (0.0%) |
| 1 Vehicle | 0 (0.0%) | 0 (0.0%) |
| 2 Vehicles | 18 (51.4%) | 13 (100.0%) |
| 3 Vehicles | 0 (0.0%) | 0 (0.0%) |
| 4 Vehicles | 0 (0.0%) | 0 (0.0%) |
| 5 or more Vehicles | 0 (0.0%) | 0 (0.0%) |
| Total | 35 (100.0%) | 13 (100.0%) |
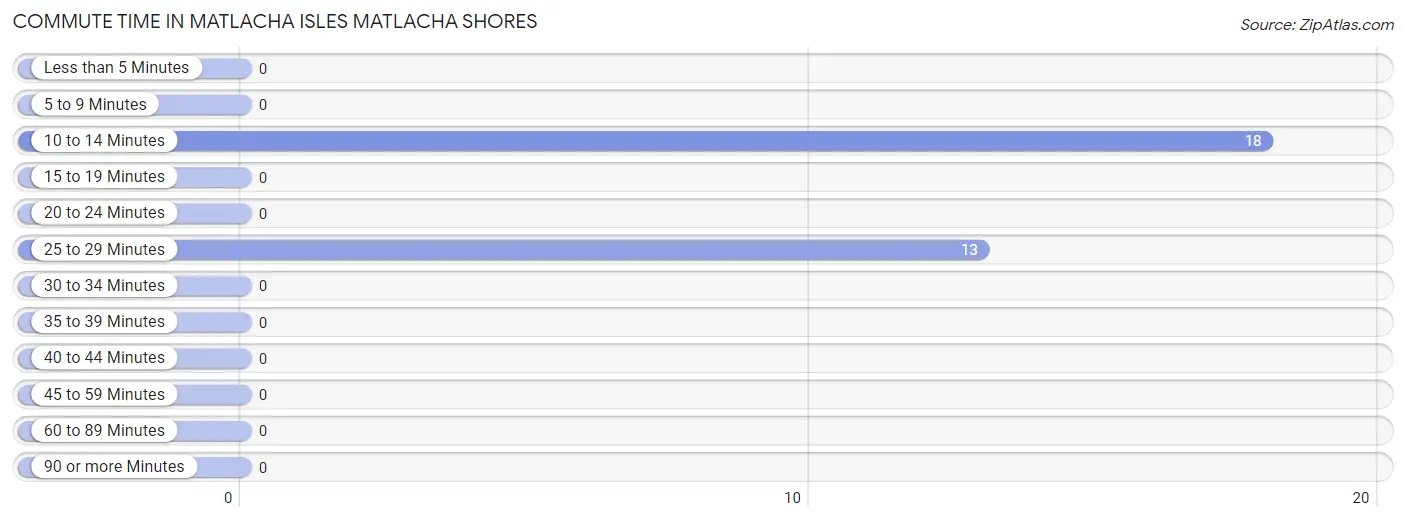
Commute Time in Matlacha Isles Matlacha Shores
The most frequently occuring commute durations in Matlacha Isles Matlacha Shores are 10 to 14 minutes (18 commuters, 58.1%), 25 to 29 minutes (13 commuters, 41.9%), and less than 5 minutes (0 commuters, 0.0%).
| Commute Time | # Commuters | % Commuters |
| Less than 5 Minutes | 0 | 0.0% |
| 5 to 9 Minutes | 0 | 0.0% |
| 10 to 14 Minutes | 18 | 58.1% |
| 15 to 19 Minutes | 0 | 0.0% |
| 20 to 24 Minutes | 0 | 0.0% |
| 25 to 29 Minutes | 13 | 41.9% |
| 30 to 34 Minutes | 0 | 0.0% |
| 35 to 39 Minutes | 0 | 0.0% |
| 40 to 44 Minutes | 0 | 0.0% |
| 45 to 59 Minutes | 0 | 0.0% |
| 60 to 89 Minutes | 0 | 0.0% |
| 90 or more Minutes | 0 | 0.0% |
Commute Time by Sex in Matlacha Isles Matlacha Shores
The most common commute times in Matlacha Isles Matlacha Shores are 10 to 14 minutes (18 commuters, 100.0%) for males and 25 to 29 minutes (13 commuters, 100.0%) for females.
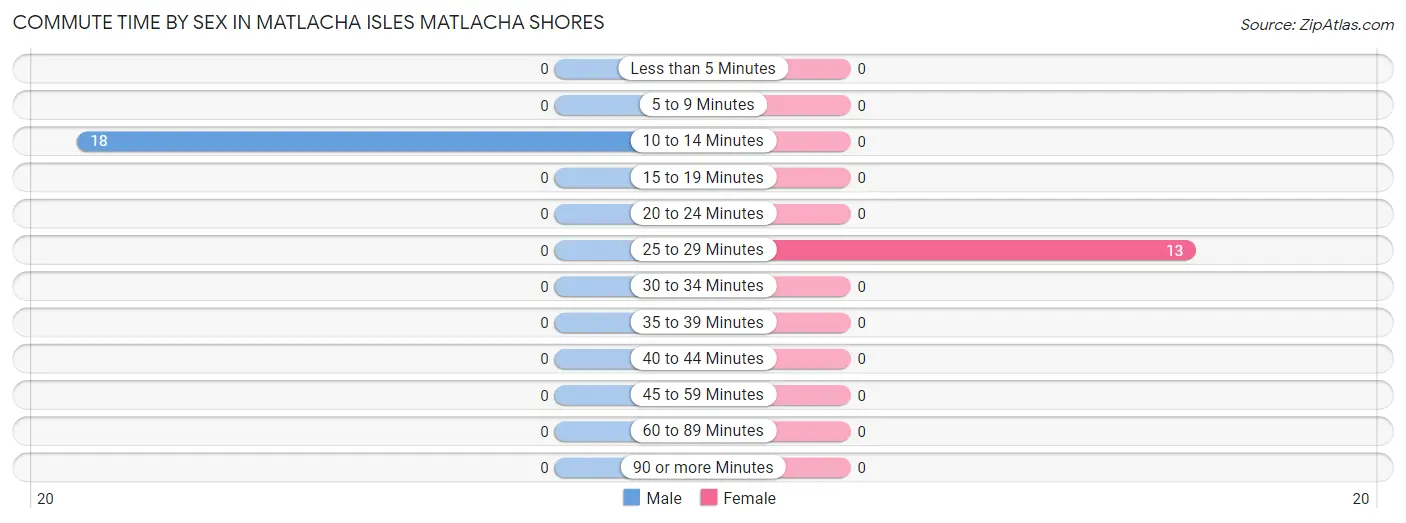
| Commute Time | Male | Female |
| Less than 5 Minutes | 0 (0.0%) | 0 (0.0%) |
| 5 to 9 Minutes | 0 (0.0%) | 0 (0.0%) |
| 10 to 14 Minutes | 18 (100.0%) | 0 (0.0%) |
| 15 to 19 Minutes | 0 (0.0%) | 0 (0.0%) |
| 20 to 24 Minutes | 0 (0.0%) | 0 (0.0%) |
| 25 to 29 Minutes | 0 (0.0%) | 13 (100.0%) |
| 30 to 34 Minutes | 0 (0.0%) | 0 (0.0%) |
| 35 to 39 Minutes | 0 (0.0%) | 0 (0.0%) |
| 40 to 44 Minutes | 0 (0.0%) | 0 (0.0%) |
| 45 to 59 Minutes | 0 (0.0%) | 0 (0.0%) |
| 60 to 89 Minutes | 0 (0.0%) | 0 (0.0%) |
| 90 or more Minutes | 0 (0.0%) | 0 (0.0%) |
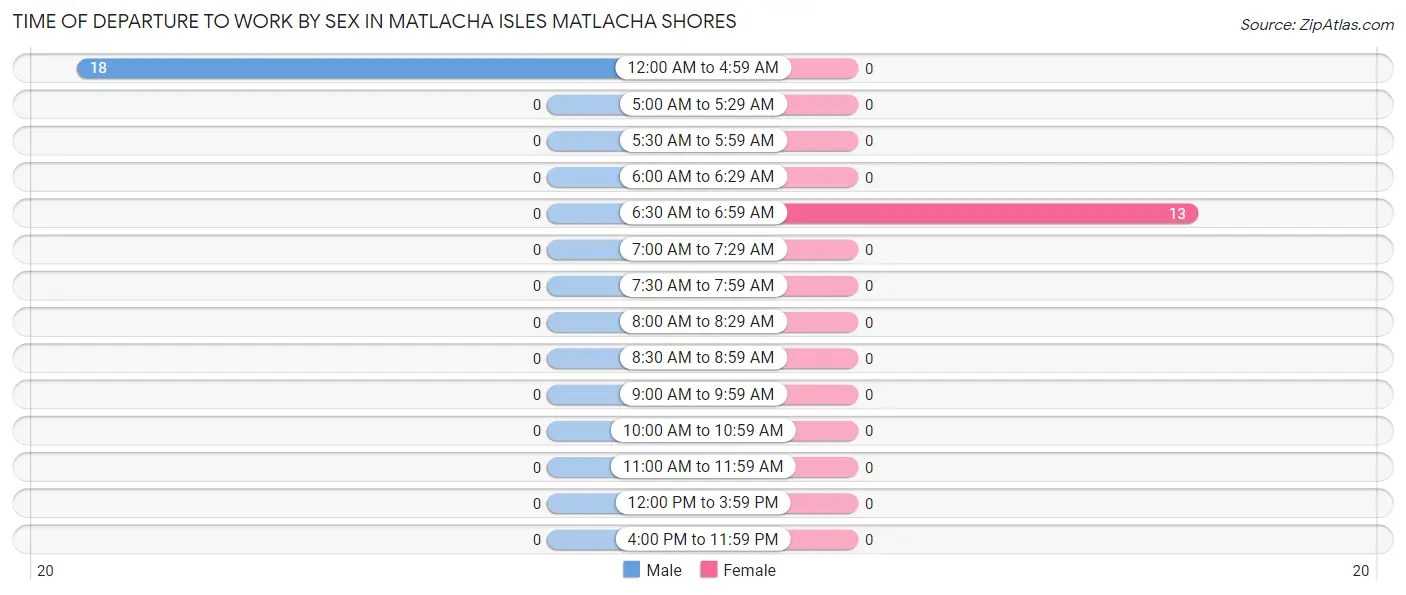
Time of Departure to Work by Sex in Matlacha Isles Matlacha Shores
The most frequent times of departure to work in Matlacha Isles Matlacha Shores are 12:00 AM to 4:59 AM (18, 100.0%) for males and 6:30 AM to 6:59 AM (13, 100.0%) for females.
| Time of Departure | Male | Female |
| 12:00 AM to 4:59 AM | 18 (100.0%) | 0 (0.0%) |
| 5:00 AM to 5:29 AM | 0 (0.0%) | 0 (0.0%) |
| 5:30 AM to 5:59 AM | 0 (0.0%) | 0 (0.0%) |
| 6:00 AM to 6:29 AM | 0 (0.0%) | 0 (0.0%) |
| 6:30 AM to 6:59 AM | 0 (0.0%) | 13 (100.0%) |
| 7:00 AM to 7:29 AM | 0 (0.0%) | 0 (0.0%) |
| 7:30 AM to 7:59 AM | 0 (0.0%) | 0 (0.0%) |
| 8:00 AM to 8:29 AM | 0 (0.0%) | 0 (0.0%) |
| 8:30 AM to 8:59 AM | 0 (0.0%) | 0 (0.0%) |
| 9:00 AM to 9:59 AM | 0 (0.0%) | 0 (0.0%) |
| 10:00 AM to 10:59 AM | 0 (0.0%) | 0 (0.0%) |
| 11:00 AM to 11:59 AM | 0 (0.0%) | 0 (0.0%) |
| 12:00 PM to 3:59 PM | 0 (0.0%) | 0 (0.0%) |
| 4:00 PM to 11:59 PM | 0 (0.0%) | 0 (0.0%) |
| Total | 18 (100.0%) | 13 (100.0%) |
Housing Occupancy in Matlacha Isles Matlacha Shores
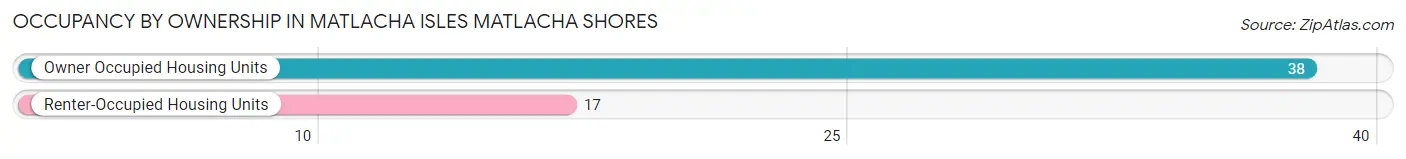
Occupancy by Ownership in Matlacha Isles Matlacha Shores
Of the total 55 dwellings in Matlacha Isles Matlacha Shores, owner-occupied units account for 38 (69.1%), while renter-occupied units make up 17 (30.9%).
| Occupancy | # Housing Units | % Housing Units |
| Owner Occupied Housing Units | 38 | 69.1% |
| Renter-Occupied Housing Units | 17 | 30.9% |
| Total Occupied Housing Units | 55 | 100.0% |
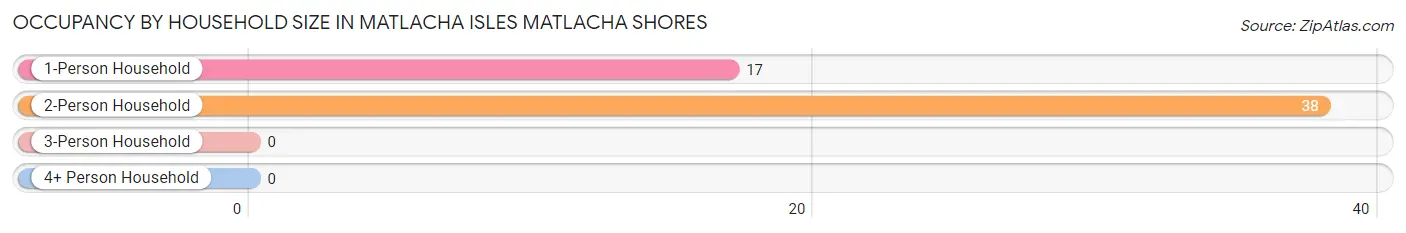
Occupancy by Household Size in Matlacha Isles Matlacha Shores
| Household Size | # Housing Units | % Housing Units |
| 1-Person Household | 17 | 30.9% |
| 2-Person Household | 38 | 69.1% |
| 3-Person Household | 0 | 0.0% |
| 4+ Person Household | 0 | 0.0% |
| Total Housing Units | 55 | 100.0% |
Occupancy by Ownership by Household Size in Matlacha Isles Matlacha Shores
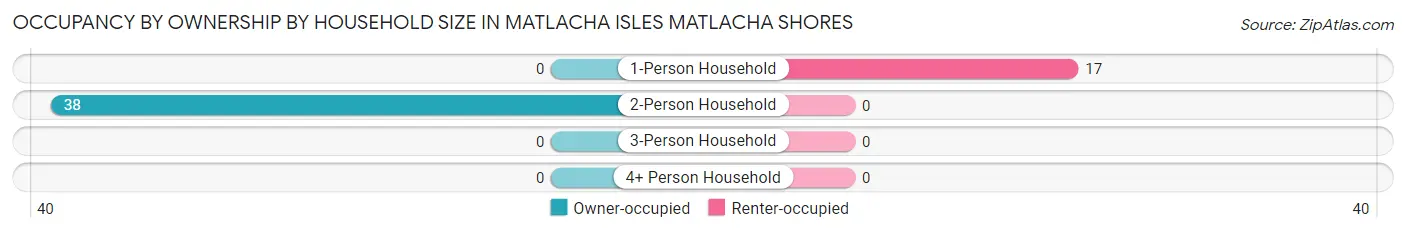
| Household Size | Owner-occupied | Renter-occupied |
| 1-Person Household | 0 (0.0%) | 17 (100.0%) |
| 2-Person Household | 38 (100.0%) | 0 (0.0%) |
| 3-Person Household | 0 (0.0%) | 0 (0.0%) |
| 4+ Person Household | 0 (0.0%) | 0 (0.0%) |
| Total Housing Units | 38 (69.1%) | 17 (30.9%) |
Occupancy by Educational Attainment in Matlacha Isles Matlacha Shores
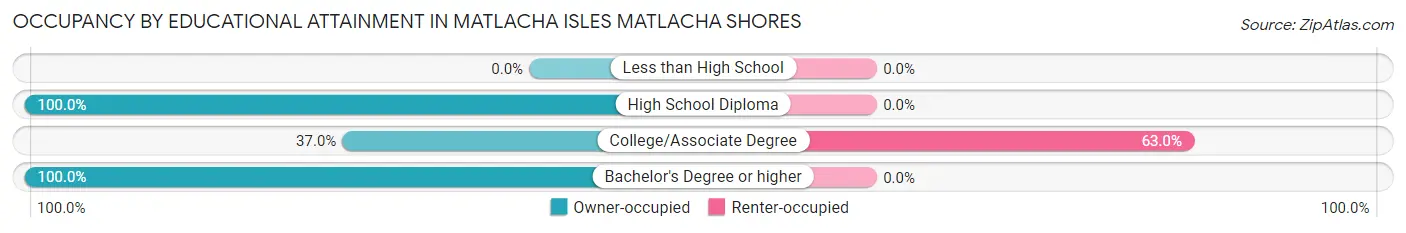
| Household Size | Owner-occupied | Renter-occupied |
| Less than High School | 0 (0.0%) | 0 (0.0%) |
| High School Diploma | 13 (100.0%) | 0 (0.0%) |
| College/Associate Degree | 10 (37.0%) | 17 (63.0%) |
| Bachelor's Degree or higher | 15 (100.0%) | 0 (0.0%) |
Occupancy by Age of Householder in Matlacha Isles Matlacha Shores
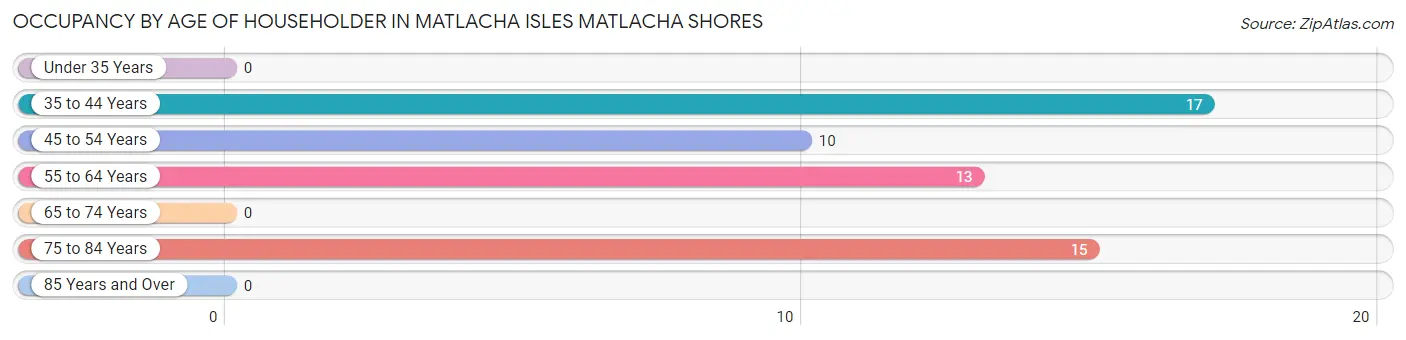
| Age Bracket | # Households | % Households |
| Under 35 Years | 0 | 0.0% |
| 35 to 44 Years | 17 | 30.9% |
| 45 to 54 Years | 10 | 18.2% |
| 55 to 64 Years | 13 | 23.6% |
| 65 to 74 Years | 0 | 0.0% |
| 75 to 84 Years | 15 | 27.3% |
| 85 Years and Over | 0 | 0.0% |
| Total | 55 | 100.0% |
Housing Finances in Matlacha Isles Matlacha Shores
Median Income by Occupancy in Matlacha Isles Matlacha Shores
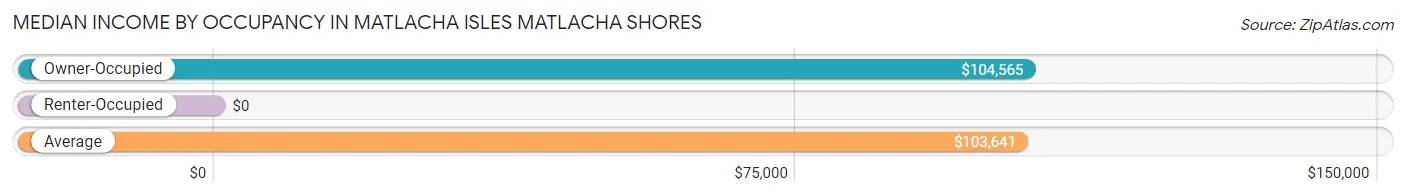
| Occupancy Type | # Households | Median Income |
| Owner-Occupied | 38 (69.1%) | $104,565 |
| Renter-Occupied | 17 (30.9%) | $0 |
| Average | 55 (100.0%) | $103,641 |
Occupancy by Householder Income Bracket in Matlacha Isles Matlacha Shores
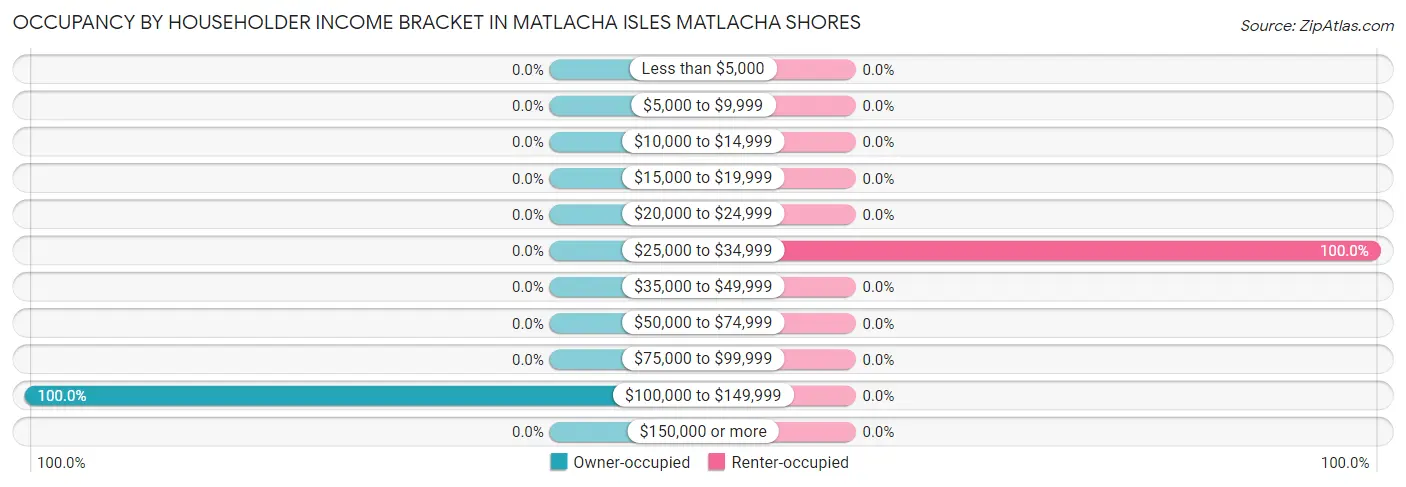
| Income Bracket | Owner-occupied | Renter-occupied |
| Less than $5,000 | 0 (0.0%) | 0 (0.0%) |
| $5,000 to $9,999 | 0 (0.0%) | 0 (0.0%) |
| $10,000 to $14,999 | 0 (0.0%) | 0 (0.0%) |
| $15,000 to $19,999 | 0 (0.0%) | 0 (0.0%) |
| $20,000 to $24,999 | 0 (0.0%) | 0 (0.0%) |
| $25,000 to $34,999 | 0 (0.0%) | 17 (100.0%) |
| $35,000 to $49,999 | 0 (0.0%) | 0 (0.0%) |
| $50,000 to $74,999 | 0 (0.0%) | 0 (0.0%) |
| $75,000 to $99,999 | 0 (0.0%) | 0 (0.0%) |
| $100,000 to $149,999 | 38 (100.0%) | 0 (0.0%) |
| $150,000 or more | 0 (0.0%) | 0 (0.0%) |
| Total | 38 (100.0%) | 17 (100.0%) |
Monthly Housing Cost Tiers in Matlacha Isles Matlacha Shores
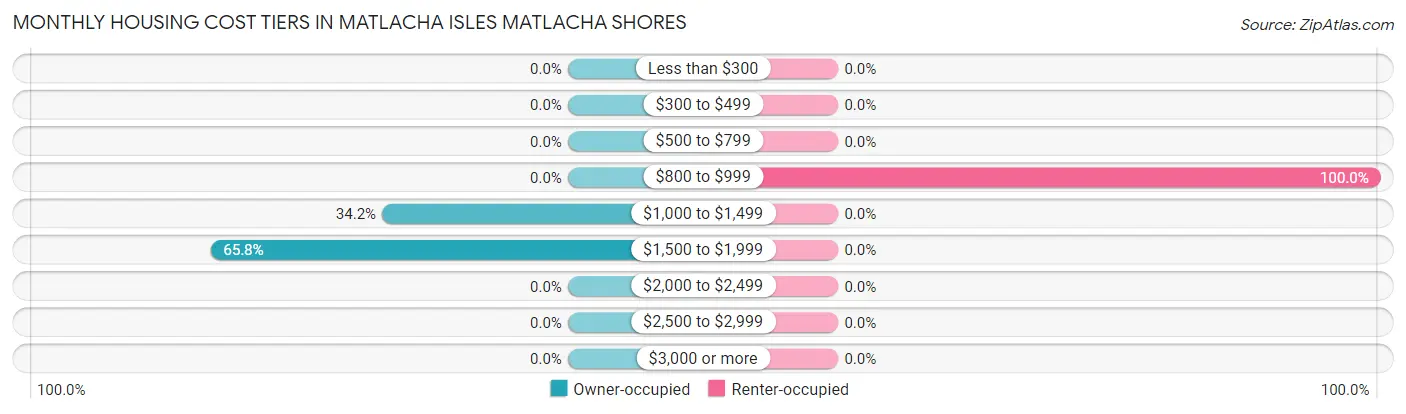
| Monthly Cost | Owner-occupied | Renter-occupied |
| Less than $300 | 0 (0.0%) | 0 (0.0%) |
| $300 to $499 | 0 (0.0%) | 0 (0.0%) |
| $500 to $799 | 0 (0.0%) | 0 (0.0%) |
| $800 to $999 | 0 (0.0%) | 17 (100.0%) |
| $1,000 to $1,499 | 13 (34.2%) | 0 (0.0%) |
| $1,500 to $1,999 | 25 (65.8%) | 0 (0.0%) |
| $2,000 to $2,499 | 0 (0.0%) | 0 (0.0%) |
| $2,500 to $2,999 | 0 (0.0%) | 0 (0.0%) |
| $3,000 or more | 0 (0.0%) | 0 (0.0%) |
| Total | 38 (100.0%) | 17 (100.0%) |
Physical Housing Characteristics in Matlacha Isles Matlacha Shores
Housing Structures in Matlacha Isles Matlacha Shores
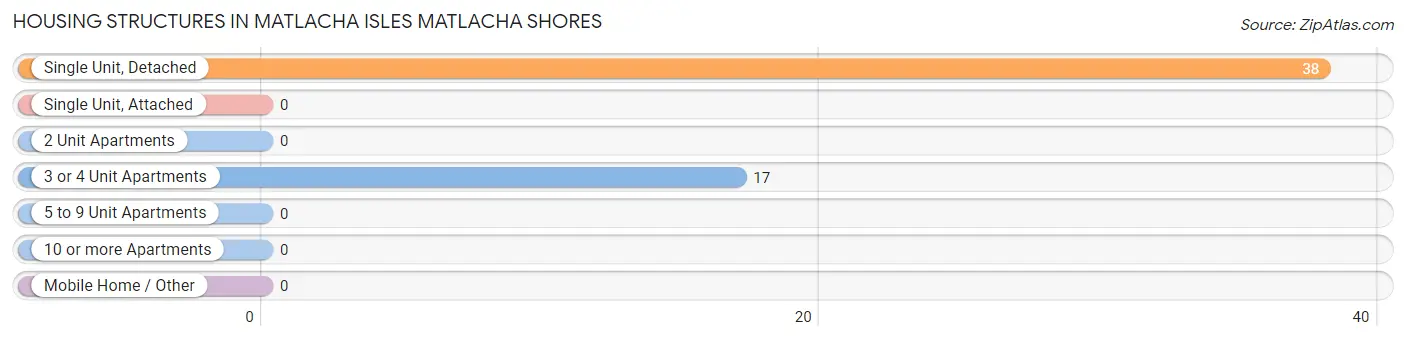
| Structure Type | # Housing Units | % Housing Units |
| Single Unit, Detached | 38 | 69.1% |
| Single Unit, Attached | 0 | 0.0% |
| 2 Unit Apartments | 0 | 0.0% |
| 3 or 4 Unit Apartments | 17 | 30.9% |
| 5 to 9 Unit Apartments | 0 | 0.0% |
| 10 or more Apartments | 0 | 0.0% |
| Mobile Home / Other | 0 | 0.0% |
| Total | 55 | 100.0% |
Housing Structures by Occupancy in Matlacha Isles Matlacha Shores
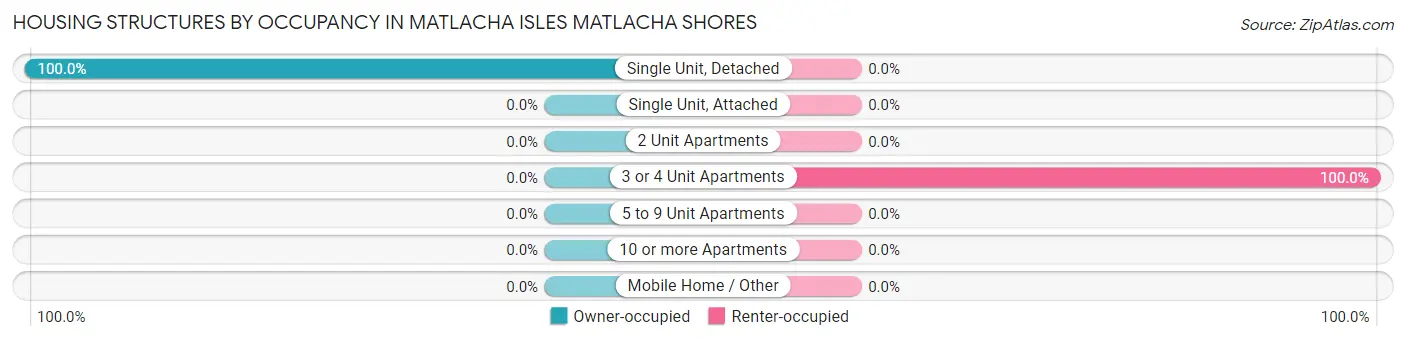
| Structure Type | Owner-occupied | Renter-occupied |
| Single Unit, Detached | 38 (100.0%) | 0 (0.0%) |
| Single Unit, Attached | 0 (0.0%) | 0 (0.0%) |
| 2 Unit Apartments | 0 (0.0%) | 0 (0.0%) |
| 3 or 4 Unit Apartments | 0 (0.0%) | 17 (100.0%) |
| 5 to 9 Unit Apartments | 0 (0.0%) | 0 (0.0%) |
| 10 or more Apartments | 0 (0.0%) | 0 (0.0%) |
| Mobile Home / Other | 0 (0.0%) | 0 (0.0%) |
| Total | 38 (69.1%) | 17 (30.9%) |
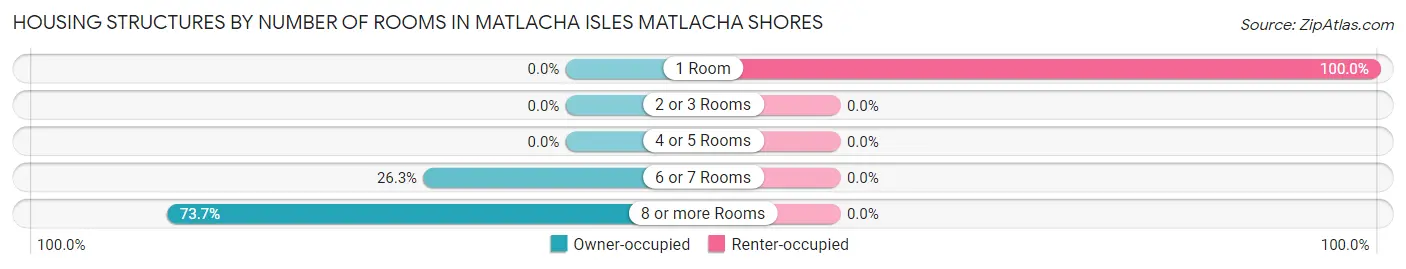
Housing Structures by Number of Rooms in Matlacha Isles Matlacha Shores
| Number of Rooms | Owner-occupied | Renter-occupied |
| 1 Room | 0 (0.0%) | 17 (100.0%) |
| 2 or 3 Rooms | 0 (0.0%) | 0 (0.0%) |
| 4 or 5 Rooms | 0 (0.0%) | 0 (0.0%) |
| 6 or 7 Rooms | 10 (26.3%) | 0 (0.0%) |
| 8 or more Rooms | 28 (73.7%) | 0 (0.0%) |
| Total | 38 (100.0%) | 17 (100.0%) |
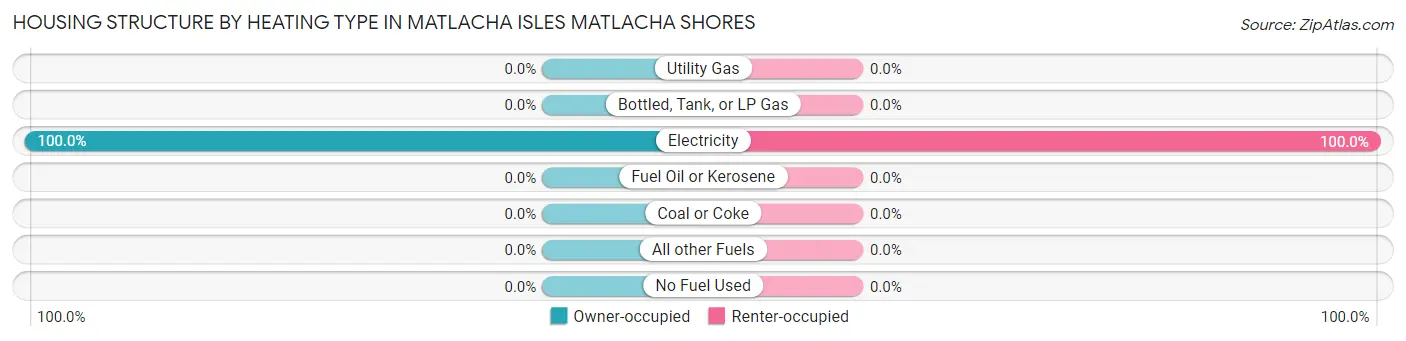
Housing Structure by Heating Type in Matlacha Isles Matlacha Shores
| Heating Type | Owner-occupied | Renter-occupied |
| Utility Gas | 0 (0.0%) | 0 (0.0%) |
| Bottled, Tank, or LP Gas | 0 (0.0%) | 0 (0.0%) |
| Electricity | 38 (100.0%) | 17 (100.0%) |
| Fuel Oil or Kerosene | 0 (0.0%) | 0 (0.0%) |
| Coal or Coke | 0 (0.0%) | 0 (0.0%) |
| All other Fuels | 0 (0.0%) | 0 (0.0%) |
| No Fuel Used | 0 (0.0%) | 0 (0.0%) |
| Total | 38 (100.0%) | 17 (100.0%) |
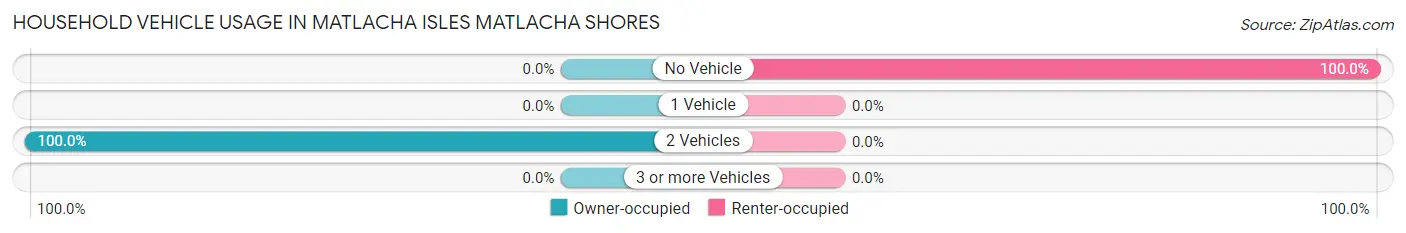
Household Vehicle Usage in Matlacha Isles Matlacha Shores
| Vehicles per Household | Owner-occupied | Renter-occupied |
| No Vehicle | 0 (0.0%) | 17 (100.0%) |
| 1 Vehicle | 0 (0.0%) | 0 (0.0%) |
| 2 Vehicles | 38 (100.0%) | 0 (0.0%) |
| 3 or more Vehicles | 0 (0.0%) | 0 (0.0%) |
| Total | 38 (100.0%) | 17 (100.0%) |
Real Estate & Mortgages in Matlacha Isles Matlacha Shores
Real Estate and Mortgage Overview in Matlacha Isles Matlacha Shores
| Characteristic | Without Mortgage | With Mortgage |
| Housing Units | 0 | 38 |
| Median Property Value | - | - |
| Median Household Income | - | - |
| Monthly Housing Costs | - | - |
| Real Estate Taxes | - | - |
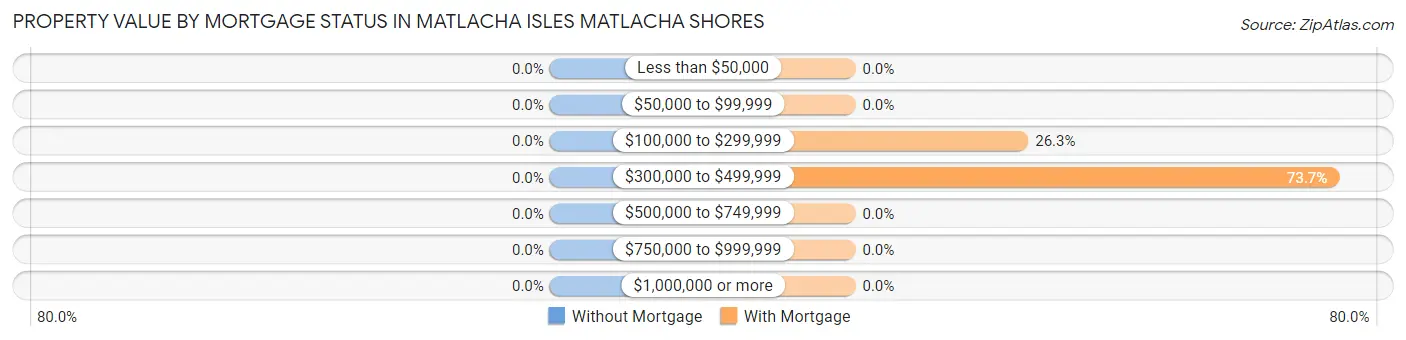
Property Value by Mortgage Status in Matlacha Isles Matlacha Shores
| Property Value | Without Mortgage | With Mortgage |
| Less than $50,000 | 0 (0.0%) | 0 (0.0%) |
| $50,000 to $99,999 | 0 (0.0%) | 0 (0.0%) |
| $100,000 to $299,999 | 0 (0.0%) | 10 (26.3%) |
| $300,000 to $499,999 | 0 (0.0%) | 28 (73.7%) |
| $500,000 to $749,999 | 0 (0.0%) | 0 (0.0%) |
| $750,000 to $999,999 | 0 (0.0%) | 0 (0.0%) |
| $1,000,000 or more | 0 (0.0%) | 0 (0.0%) |
| Total | 0 (0.0%) | 38 (100.0%) |
Household Income by Mortgage Status in Matlacha Isles Matlacha Shores
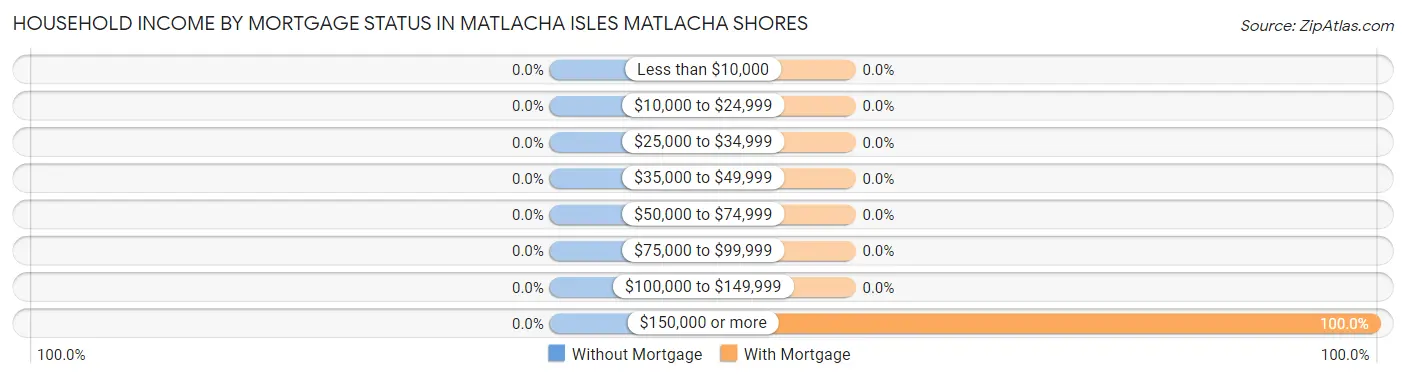
| Household Income | Without Mortgage | With Mortgage |
| Less than $10,000 | 0 (0.0%) | 0 (0.0%) |
| $10,000 to $24,999 | 0 (0.0%) | 0 (0.0%) |
| $25,000 to $34,999 | 0 (0.0%) | 0 (0.0%) |
| $35,000 to $49,999 | 0 (0.0%) | 0 (0.0%) |
| $50,000 to $74,999 | 0 (0.0%) | 0 (0.0%) |
| $75,000 to $99,999 | 0 (0.0%) | 0 (0.0%) |
| $100,000 to $149,999 | 0 (0.0%) | 0 (0.0%) |
| $150,000 or more | 0 (0.0%) | 38 (100.0%) |
| Total | 0 (0.0%) | 38 (100.0%) |
Property Value to Household Income Ratio in Matlacha Isles Matlacha Shores
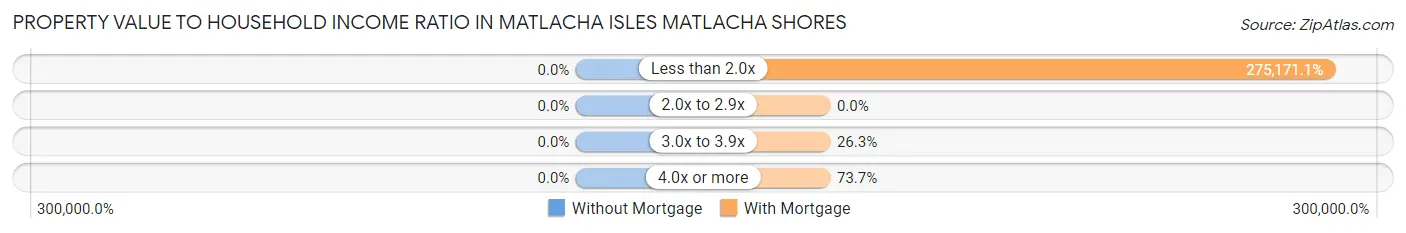
| Value-to-Income Ratio | Without Mortgage | With Mortgage |
| Less than 2.0x | 0 (0.0%) | 104,565 (275,171.1%) |
| 2.0x to 2.9x | 0 (0.0%) | 0 (0.0%) |
| 3.0x to 3.9x | 0 (0.0%) | 10 (26.3%) |
| 4.0x or more | 0 (0.0%) | 28 (73.7%) |
| Total | 0 (0.0%) | 38 (100.0%) |
Real Estate Taxes by Mortgage Status in Matlacha Isles Matlacha Shores
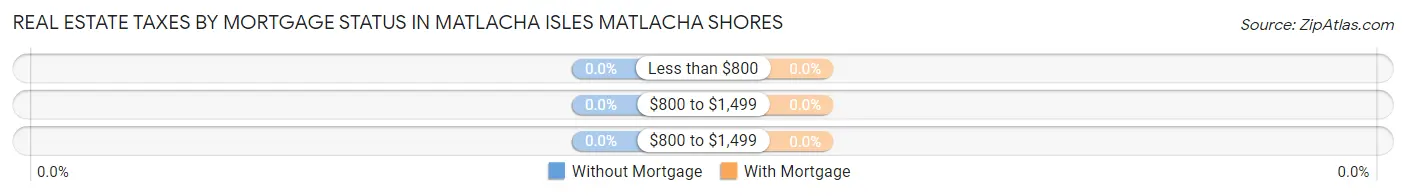
| Property Taxes | Without Mortgage | With Mortgage |
| Less than $800 | 0 (0.0%) | 0 (0.0%) |
| $800 to $1,499 | 0 (0.0%) | 0 (0.0%) |
| $800 to $1,499 | 0 (0.0%) | 0 (0.0%) |
| Total | 0 (0.0%) | 38 (100.0%) |
Health & Disability in Matlacha Isles Matlacha Shores
Health Insurance Coverage by Age in Matlacha Isles Matlacha Shores
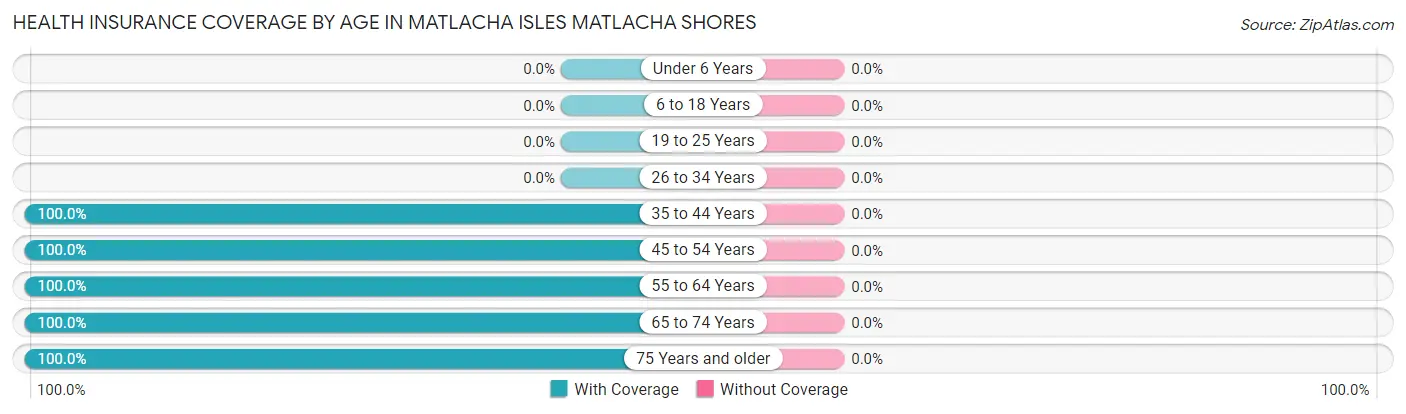
| Age Bracket | With Coverage | Without Coverage |
| Under 6 Years | 0 (0.0%) | 0 (0.0%) |
| 6 to 18 Years | 0 (0.0%) | 0 (0.0%) |
| 19 to 25 Years | 0 (0.0%) | 0 (0.0%) |
| 26 to 34 Years | 0 (0.0%) | 0 (0.0%) |
| 35 to 44 Years | 17 (100.0%) | 0 (0.0%) |
| 45 to 54 Years | 10 (100.0%) | 0 (0.0%) |
| 55 to 64 Years | 13 (100.0%) | 0 (0.0%) |
| 65 to 74 Years | 10 (100.0%) | 0 (0.0%) |
| 75 Years and older | 46 (100.0%) | 0 (0.0%) |
| Total | 96 (100.0%) | 0 (0.0%) |
Health Insurance Coverage by Citizenship Status in Matlacha Isles Matlacha Shores
| Citizenship Status | With Coverage | Without Coverage |
| Native Born | 0 (0.0%) | 0 (0.0%) |
| Foreign Born, Citizen | 0 (0.0%) | 0 (0.0%) |
| Foreign Born, not a Citizen | 0 (0.0%) | 0 (0.0%) |
Health Insurance Coverage by Household Income in Matlacha Isles Matlacha Shores
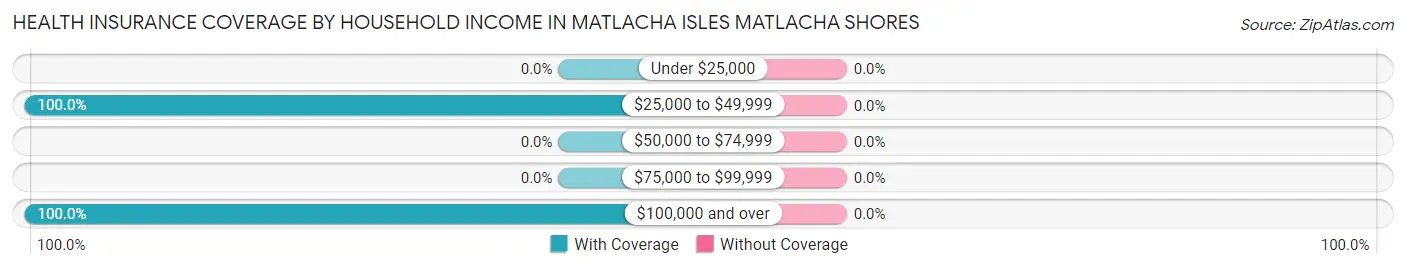
| Household Income | With Coverage | Without Coverage |
| Under $25,000 | 0 (0.0%) | 0 (0.0%) |
| $25,000 to $49,999 | 17 (100.0%) | 0 (0.0%) |
| $50,000 to $74,999 | 0 (0.0%) | 0 (0.0%) |
| $75,000 to $99,999 | 0 (0.0%) | 0 (0.0%) |
| $100,000 and over | 79 (100.0%) | 0 (0.0%) |
Public vs Private Health Insurance Coverage by Age in Matlacha Isles Matlacha Shores
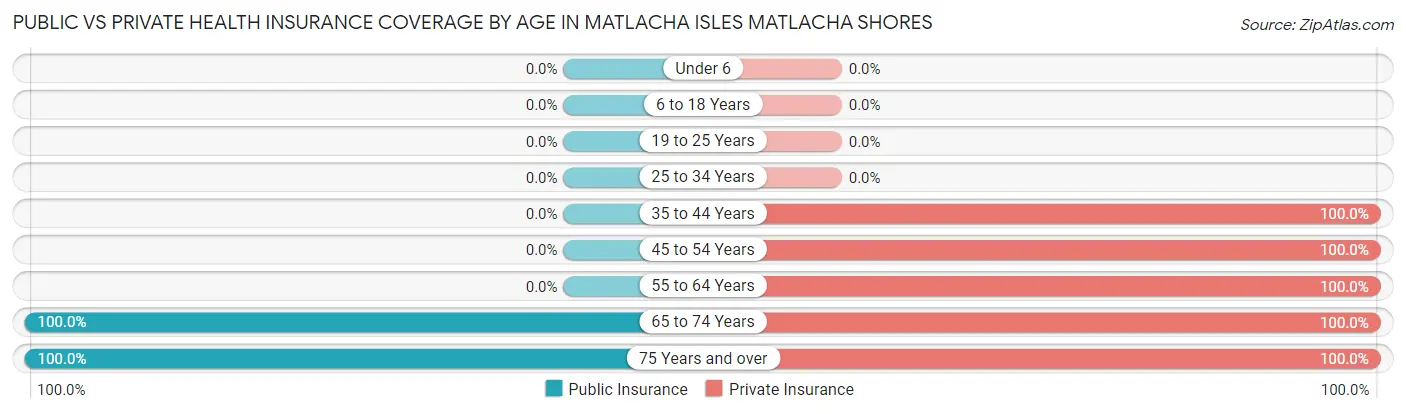
| Age Bracket | Public Insurance | Private Insurance |
| Under 6 | 0 (0.0%) | 0 (0.0%) |
| 6 to 18 Years | 0 (0.0%) | 0 (0.0%) |
| 19 to 25 Years | 0 (0.0%) | 0 (0.0%) |
| 25 to 34 Years | 0 (0.0%) | 0 (0.0%) |
| 35 to 44 Years | 0 (0.0%) | 17 (100.0%) |
| 45 to 54 Years | 0 (0.0%) | 10 (100.0%) |
| 55 to 64 Years | 0 (0.0%) | 13 (100.0%) |
| 65 to 74 Years | 10 (100.0%) | 10 (100.0%) |
| 75 Years and over | 46 (100.0%) | 46 (100.0%) |
| Total | 56 (58.3%) | 96 (100.0%) |
Disability Status by Sex by Age in Matlacha Isles Matlacha Shores
| Age Bracket | Male | Female |
| Under 5 Years | 0 (0.0%) | 0 (0.0%) |
| 5 to 17 Years | 0 (0.0%) | 0 (0.0%) |
| 18 to 34 Years | 0 (0.0%) | 0 (0.0%) |
| 35 to 64 Years | 0 (0.0%) | 0 (0.0%) |
| 65 to 74 Years | 0 (0.0%) | 0 (0.0%) |
| 75 Years and over | 0 (0.0%) | 0 (0.0%) |
Disability Class by Sex by Age in Matlacha Isles Matlacha Shores
Disability Class: Hearing Difficulty
| Age Bracket | Male | Female |
| Under 5 Years | 0 (0.0%) | 0 (0.0%) |
| 5 to 17 Years | 0 (0.0%) | 0 (0.0%) |
| 18 to 34 Years | 0 (0.0%) | 0 (0.0%) |
| 35 to 64 Years | 0 (0.0%) | 0 (0.0%) |
| 65 to 74 Years | 0 (0.0%) | 0 (0.0%) |
| 75 Years and over | 0 (0.0%) | 0 (0.0%) |
Disability Class: Vision Difficulty
| Age Bracket | Male | Female |
| Under 5 Years | 0 (0.0%) | 0 (0.0%) |
| 5 to 17 Years | 0 (0.0%) | 0 (0.0%) |
| 18 to 34 Years | 0 (0.0%) | 0 (0.0%) |
| 35 to 64 Years | 0 (0.0%) | 0 (0.0%) |
| 65 to 74 Years | 0 (0.0%) | 0 (0.0%) |
| 75 Years and over | 0 (0.0%) | 0 (0.0%) |
Disability Class: Cognitive Difficulty
| Age Bracket | Male | Female |
| 5 to 17 Years | 0 (0.0%) | 0 (0.0%) |
| 18 to 34 Years | 0 (0.0%) | 0 (0.0%) |
| 35 to 64 Years | 0 (0.0%) | 0 (0.0%) |
| 65 to 74 Years | 0 (0.0%) | 0 (0.0%) |
| 75 Years and over | 0 (0.0%) | 0 (0.0%) |
Disability Class: Ambulatory Difficulty
| Age Bracket | Male | Female |
| 5 to 17 Years | 0 (0.0%) | 0 (0.0%) |
| 18 to 34 Years | 0 (0.0%) | 0 (0.0%) |
| 35 to 64 Years | 0 (0.0%) | 0 (0.0%) |
| 65 to 74 Years | 0 (0.0%) | 0 (0.0%) |
| 75 Years and over | 0 (0.0%) | 0 (0.0%) |
Disability Class: Self-Care Difficulty
| Age Bracket | Male | Female |
| 5 to 17 Years | 0 (0.0%) | 0 (0.0%) |
| 18 to 34 Years | 0 (0.0%) | 0 (0.0%) |
| 35 to 64 Years | 0 (0.0%) | 0 (0.0%) |
| 65 to 74 Years | 0 (0.0%) | 0 (0.0%) |
| 75 Years and over | 0 (0.0%) | 0 (0.0%) |
Technology Access in Matlacha Isles Matlacha Shores
Computing Device Access in Matlacha Isles Matlacha Shores
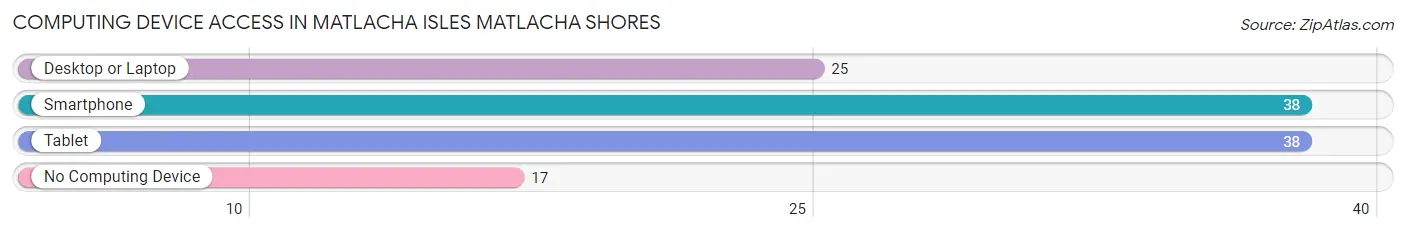
| Device Type | # Households | % Households |
| Desktop or Laptop | 25 | 45.5% |
| Smartphone | 38 | 69.1% |
| Tablet | 38 | 69.1% |
| No Computing Device | 17 | 30.9% |
| Total | 55 | 100.0% |
Internet Access in Matlacha Isles Matlacha Shores
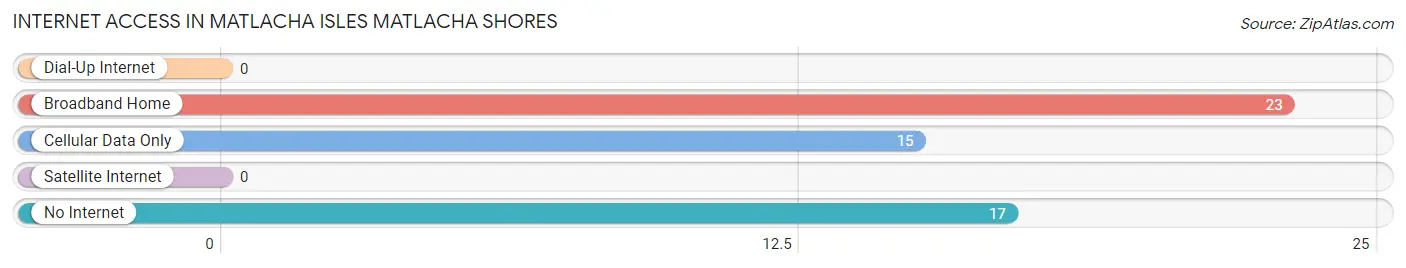
| Internet Type | # Households | % Households |
| Dial-Up Internet | 0 | 0.0% |
| Broadband Home | 23 | 41.8% |
| Cellular Data Only | 15 | 27.3% |
| Satellite Internet | 0 | 0.0% |
| No Internet | 17 | 30.9% |
| Total | 55 | 100.0% |
Matlacha Isles Matlacha Shores Summary
Matlacha Isles-Matlacha Shores is a small, unincorporated community located in Lee County, Florida. It is situated on the west side of Pine Island, just south of the city of Cape Coral. The community is made up of two distinct neighborhoods, Matlacha Isles and Matlacha Shores, which are separated by a canal. The area is known for its laid-back atmosphere, beautiful scenery, and abundance of wildlife.
History
Matlacha Isles-Matlacha Shores has a long and colorful history. The area was originally inhabited by the Calusa Indians, who were known for their fishing and shellfish harvesting. The Calusa were eventually displaced by the Spanish, who established a mission in the area in the late 1700s. The mission was abandoned in the early 1800s, and the area was largely uninhabited until the late 19th century.
In the late 1800s, the area was settled by a group of fishermen from the Bahamas. These fishermen established a small fishing village, which they named Matlacha. The village was a popular spot for fishing and crabbing, and it quickly became a popular tourist destination.
In the early 1900s, the area was developed as a resort community. The first hotel was built in 1912, and the area quickly became a popular destination for vacationers. The area was also home to a number of fishing camps, which attracted anglers from all over the country.
In the 1950s, the area was developed as a residential community. The first homes were built in the Matlacha Isles neighborhood, and the Matlacha Shores neighborhood was developed in the 1960s. The area has since become a popular destination for retirees and vacationers alike.
Geography
Matlacha Isles-Matlacha Shores is located on the west side of Pine Island, just south of the city of Cape Coral. The area is bordered by Matlacha Pass to the north, Pine Island Sound to the east, and the Caloosahatchee River to the south. The area is made up of two distinct neighborhoods, Matlacha Isles and Matlacha Shores, which are separated by a canal.
The area is known for its beautiful scenery and abundance of wildlife. The area is home to a variety of birds, fish, and other wildlife, including manatees, dolphins, and sea turtles. The area is also home to a number of parks and preserves, including Matlacha Pass Aquatic Preserve, Matlacha Pass National Wildlife Refuge, and Matlacha Pass State Park.
Economy
Matlacha Isles-Matlacha Shores is a popular tourist destination, and the area’s economy is largely driven by tourism. The area is home to a number of hotels, restaurants, and other businesses catering to tourists. The area is also home to a number of marinas, which attract boaters from all over the country.
The area is also home to a number of commercial fishing operations, which provide employment for many of the area’s residents. The area is also home to a number of art galleries, which attract visitors from all over the world.
Demographics
As of the 2010 census, the population of Matlacha Isles-Matlacha Shores was 2,845. The population is largely white (90.3%), with a small percentage of African Americans (3.2%) and Hispanics (2.7%). The median household income is $45,945, and the median home value is $220,000. The area is largely made up of retirees, with nearly half (47.3%) of the population over the age of 65.
Common Questions
What is Per Capita Income in Matlacha Isles Matlacha Shores?
Per Capita income in Matlacha Isles Matlacha Shores is $48,335.
What is the Median Family Income in Matlacha Isles Matlacha Shores?
Median Family Income in Matlacha Isles Matlacha Shores is $104,565.
What is the Median Household income in Matlacha Isles Matlacha Shores?
Median Household Income in Matlacha Isles Matlacha Shores is $103,641.
What is Inequality or Gini Index in Matlacha Isles Matlacha Shores?
Inequality or Gini Index in Matlacha Isles Matlacha Shores is 0.18.
What is the Total Population of Matlacha Isles Matlacha Shores?
Total Population of Matlacha Isles Matlacha Shores is 96.
What is the Total Male Population of Matlacha Isles Matlacha Shores?
Total Male Population of Matlacha Isles Matlacha Shores is 60.
What is the Total Female Population of Matlacha Isles Matlacha Shores?
Total Female Population of Matlacha Isles Matlacha Shores is 36.
What is the Ratio of Males per 100 Females in Matlacha Isles Matlacha Shores?
There are 166.67 Males per 100 Females in Matlacha Isles Matlacha Shores.
What is the Ratio of Females per 100 Males in Matlacha Isles Matlacha Shores?
There are 60.00 Females per 100 Males in Matlacha Isles Matlacha Shores.
What is the Median Population Age in Matlacha Isles Matlacha Shores?
Median Population Age in Matlacha Isles Matlacha Shores is 69.8 Years.
What is the Average Family Size in Matlacha Isles Matlacha Shores
Average Family Size in Matlacha Isles Matlacha Shores is 2.1 People.
What is the Average Household Size in Matlacha Isles Matlacha Shores
Average Household Size in Matlacha Isles Matlacha Shores is 1.8 People.
How Large is the Labor Force in Matlacha Isles Matlacha Shores?
There are 48 People in the Labor Forcein in Matlacha Isles Matlacha Shores.
What is the Percentage of People in the Labor Force in Matlacha Isles Matlacha Shores?
50.0% of People are in the Labor Force in Matlacha Isles Matlacha Shores.