Lake Wales, FL Map & Demographics
Lake Wales Map
Lake Wales Overview
$26,994
PER CAPITA INCOME
$69,323
AVG FAMILY INCOME
$55,833
AVG HOUSEHOLD INCOME
19.3%
WAGE / INCOME GAP [ % ]
80.7¢/ $1
WAGE / INCOME GAP [ $ ]
$11,275
FAMILY INCOME DEFICIT
0.43
INEQUALITY / GINI INDEX
16,455
TOTAL POPULATION
7,922
MALE POPULATION
8,533
FEMALE POPULATION
92.84
MALES / 100 FEMALES
107.71
FEMALES / 100 MALES
43.1
MEDIAN AGE
3.0
AVG FAMILY SIZE
2.4
AVG HOUSEHOLD SIZE
6,497
LABOR FORCE [ PEOPLE ]
48.0%
PERCENT IN LABOR FORCE
5.7%
UNEMPLOYMENT RATE
Lake Wales Area Codes
Income in Lake Wales
Income Overview in Lake Wales
Per Capita Income in Lake Wales is $26,994, while median incomes of families and households are $69,323 and $55,833 respectively.
| Characteristic | Number | Measure |
| Per Capita Income | 16,455 | $26,994 |
| Median Family Income | 4,176 | $69,323 |
| Mean Family Income | 4,176 | $74,233 |
| Median Household Income | 6,734 | $55,833 |
| Mean Household Income | 6,734 | $62,927 |
| Income Deficit | 4,176 | $11,275 |
| Wage / Income Gap (%) | 16,455 | 19.34% |
| Wage / Income Gap ($) | 16,455 | 80.66¢ per $1 |
| Gini / Inequality Index | 16,455 | 0.43 |
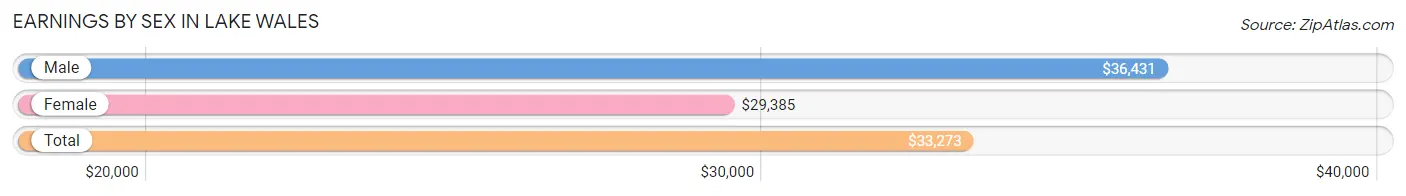
Earnings by Sex in Lake Wales
Average Earnings in Lake Wales are $33,273, $36,431 for men and $29,385 for women, a difference of 19.3%.
| Sex | Number | Average Earnings |
| Male | 3,383 (49.9%) | $36,431 |
| Female | 3,398 (50.1%) | $29,385 |
| Total | 6,781 (100.0%) | $33,273 |
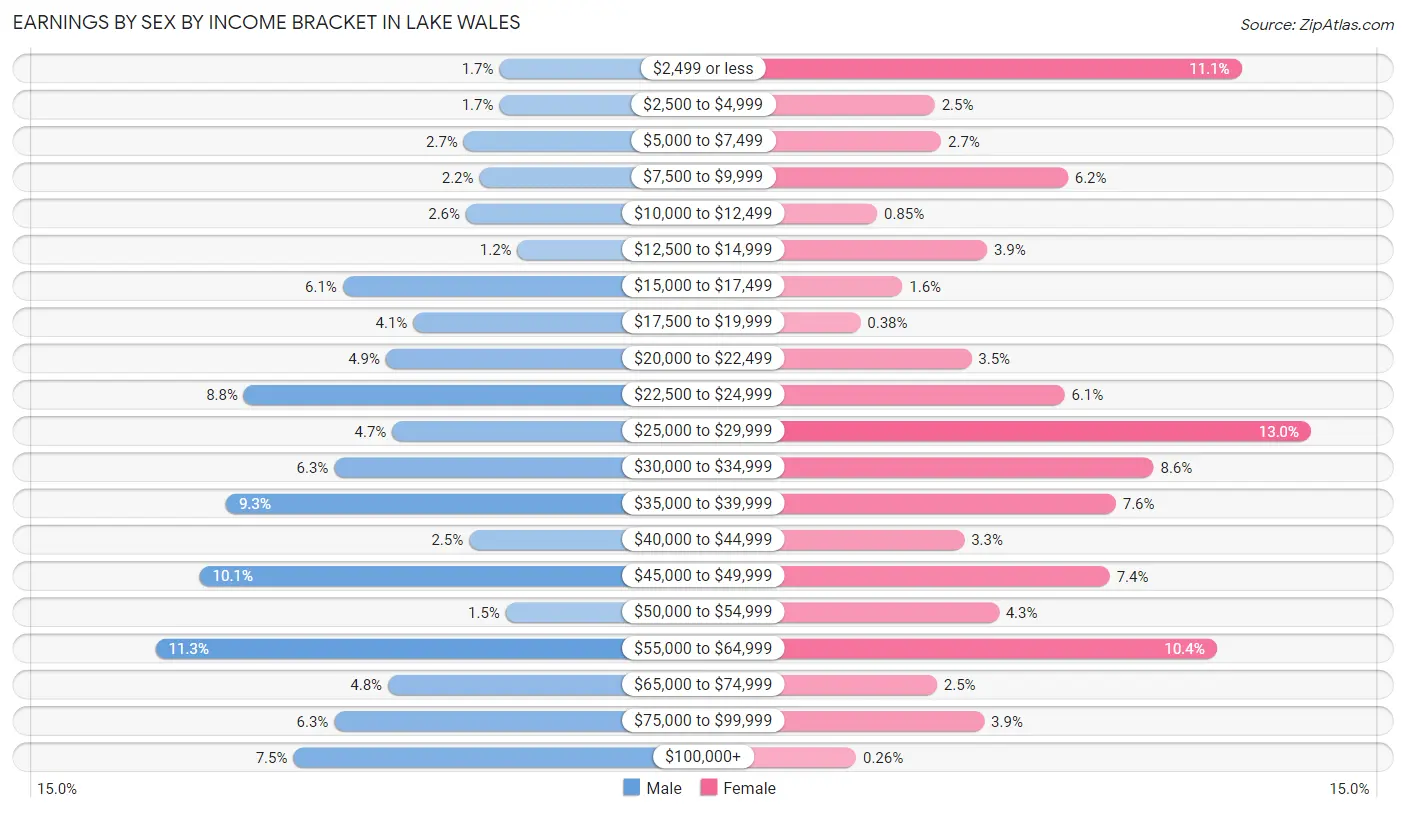
Earnings by Sex by Income Bracket in Lake Wales
The most common earnings brackets in Lake Wales are $55,000 to $64,999 for men (383 | 11.3%) and $25,000 to $29,999 for women (443 | 13.0%).
| Income | Male | Female |
| $2,499 or less | 56 (1.7%) | 377 (11.1%) |
| $2,500 to $4,999 | 56 (1.7%) | 84 (2.5%) |
| $5,000 to $7,499 | 90 (2.7%) | 90 (2.6%) |
| $7,500 to $9,999 | 75 (2.2%) | 211 (6.2%) |
| $10,000 to $12,499 | 88 (2.6%) | 29 (0.9%) |
| $12,500 to $14,999 | 39 (1.1%) | 134 (3.9%) |
| $15,000 to $17,499 | 205 (6.1%) | 53 (1.6%) |
| $17,500 to $19,999 | 138 (4.1%) | 13 (0.4%) |
| $20,000 to $22,499 | 164 (4.9%) | 119 (3.5%) |
| $22,500 to $24,999 | 299 (8.8%) | 208 (6.1%) |
| $25,000 to $29,999 | 158 (4.7%) | 443 (13.0%) |
| $30,000 to $34,999 | 213 (6.3%) | 293 (8.6%) |
| $35,000 to $39,999 | 316 (9.3%) | 257 (7.6%) |
| $40,000 to $44,999 | 85 (2.5%) | 112 (3.3%) |
| $45,000 to $49,999 | 341 (10.1%) | 251 (7.4%) |
| $50,000 to $54,999 | 50 (1.5%) | 145 (4.3%) |
| $55,000 to $64,999 | 383 (11.3%) | 353 (10.4%) |
| $65,000 to $74,999 | 162 (4.8%) | 86 (2.5%) |
| $75,000 to $99,999 | 213 (6.3%) | 131 (3.9%) |
| $100,000+ | 252 (7.4%) | 9 (0.3%) |
| Total | 3,383 (100.0%) | 3,398 (100.0%) |
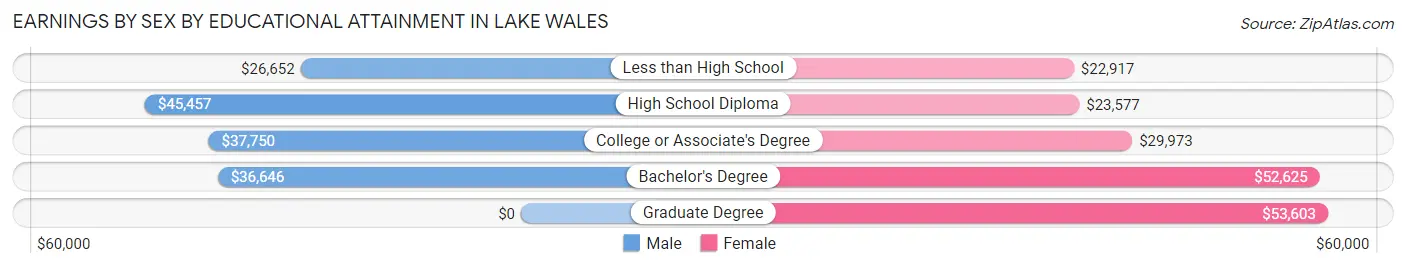
Earnings by Sex by Educational Attainment in Lake Wales
Average earnings in Lake Wales are $38,112 for men and $32,833 for women, a difference of 13.9%. Men with an educational attainment of high school diploma enjoy the highest average annual earnings of $45,457, while those with less than high school education earn the least with $26,652. Women with an educational attainment of graduate degree earn the most with the average annual earnings of $53,603, while those with less than high school education have the smallest earnings of $22,917.
| Educational Attainment | Male Income | Female Income |
| Less than High School | $26,652 | $22,917 |
| High School Diploma | $45,457 | $23,577 |
| College or Associate's Degree | $37,750 | $29,973 |
| Bachelor's Degree | $36,646 | $52,625 |
| Graduate Degree | - | - |
| Total | $38,112 | $32,833 |
Family Income in Lake Wales
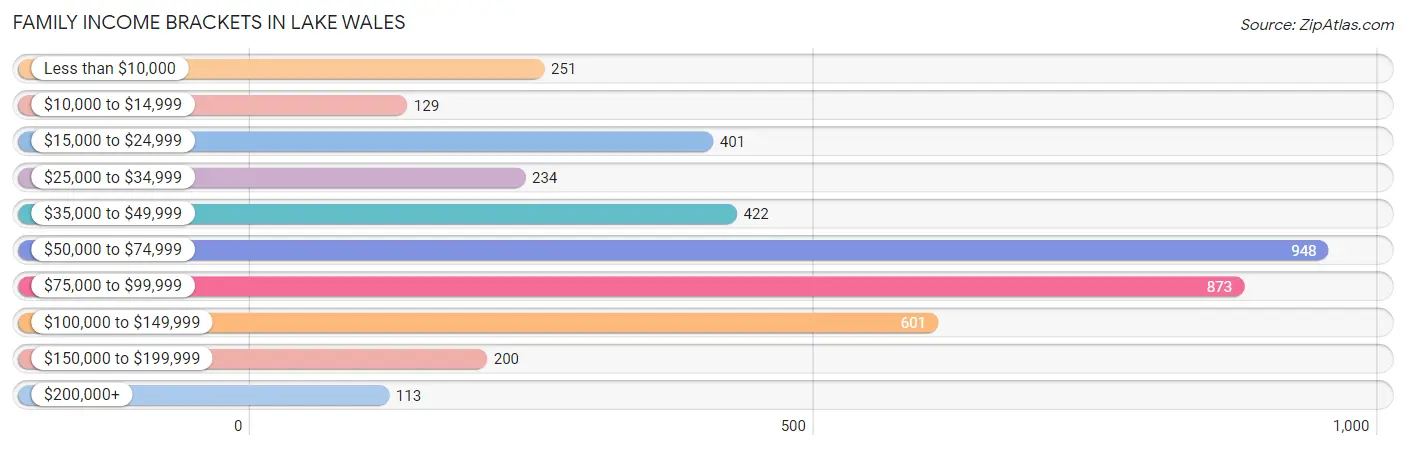
Family Income Brackets in Lake Wales
According to the Lake Wales family income data, there are 948 families falling into the $50,000 to $74,999 income range, which is the most common income bracket and makes up 22.7% of all families. Conversely, the $200,000+ income bracket is the least frequent group with only 113 families (2.7%) belonging to this category.
| Income Bracket | # Families | % Families |
| Less than $10,000 | 251 | 6.0% |
| $10,000 to $14,999 | 129 | 3.1% |
| $15,000 to $24,999 | 401 | 9.6% |
| $25,000 to $34,999 | 234 | 5.6% |
| $35,000 to $49,999 | 422 | 10.1% |
| $50,000 to $74,999 | 948 | 22.7% |
| $75,000 to $99,999 | 873 | 20.9% |
| $100,000 to $149,999 | 601 | 14.4% |
| $150,000 to $199,999 | 200 | 4.8% |
| $200,000+ | 113 | 2.7% |
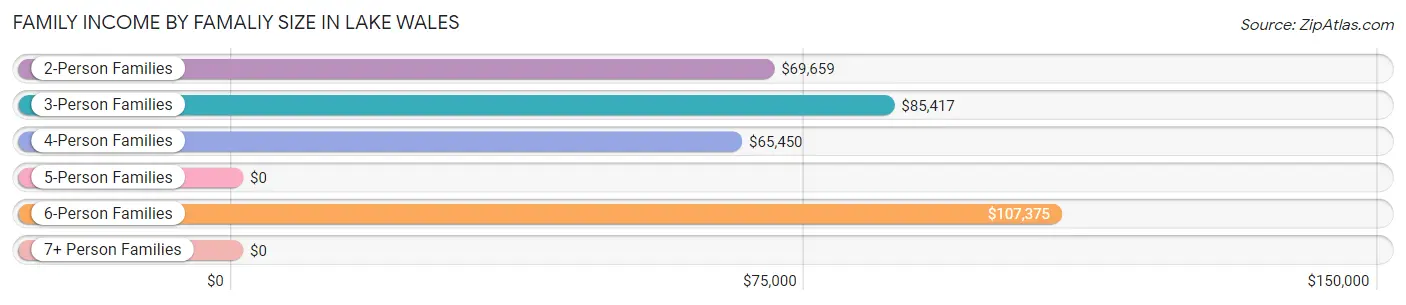
Family Income by Famaliy Size in Lake Wales
6-person families (91 | 2.2%) account for the highest median family income in Lake Wales with $107,375 per family, while 2-person families (2,249 | 53.9%) have the highest median income of $34,830 per family member.
| Income Bracket | # Families | Median Income |
| 2-Person Families | 2,249 (53.9%) | $69,659 |
| 3-Person Families | 767 (18.4%) | $85,417 |
| 4-Person Families | 701 (16.8%) | $65,450 |
| 5-Person Families | 337 (8.1%) | $0 |
| 6-Person Families | 91 (2.2%) | $107,375 |
| 7+ Person Families | 31 (0.7%) | $0 |
| Total | 4,176 (100.0%) | $69,323 |
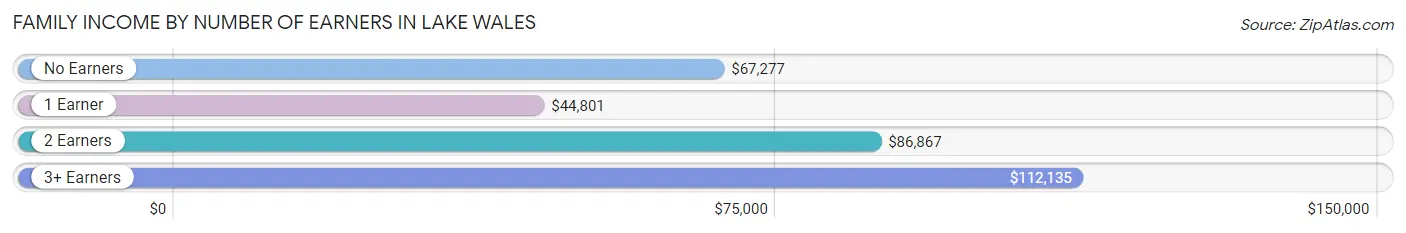
Family Income by Number of Earners in Lake Wales
The median family income in Lake Wales is $69,323, with families comprising 3+ earners (321) having the highest median family income of $112,135, while families with 1 earner (1,381) have the lowest median family income of $44,801, accounting for 7.7% and 33.1% of families, respectively.
| Number of Earners | # Families | Median Income |
| No Earners | 1,234 (29.5%) | $67,277 |
| 1 Earner | 1,381 (33.1%) | $44,801 |
| 2 Earners | 1,240 (29.7%) | $86,867 |
| 3+ Earners | 321 (7.7%) | $112,135 |
| Total | 4,176 (100.0%) | $69,323 |
Household Income in Lake Wales
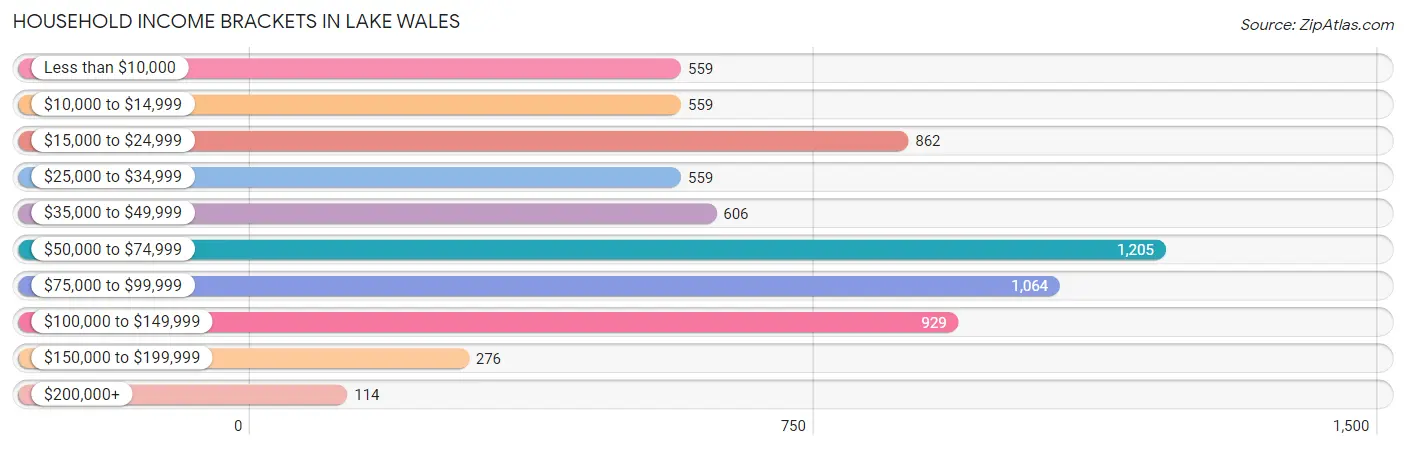
Household Income Brackets in Lake Wales
With 1,205 households falling in the category, the $50,000 to $74,999 income range is the most frequent in Lake Wales, accounting for 17.9% of all households. In contrast, only 114 households (1.7%) fall into the $200,000+ income bracket, making it the least populous group.
| Income Bracket | # Households | % Households |
| Less than $10,000 | 559 | 8.3% |
| $10,000 to $14,999 | 559 | 8.3% |
| $15,000 to $24,999 | 862 | 12.8% |
| $25,000 to $34,999 | 559 | 8.3% |
| $35,000 to $49,999 | 606 | 9.0% |
| $50,000 to $74,999 | 1,205 | 17.9% |
| $75,000 to $99,999 | 1,064 | 15.8% |
| $100,000 to $149,999 | 929 | 13.8% |
| $150,000 to $199,999 | 276 | 4.1% |
| $200,000+ | 114 | 1.7% |
Household Income by Householder Age in Lake Wales
The median household income in Lake Wales is $55,833, with the highest median household income of $69,095 found in the 45 to 64 years age bracket for the primary householder. A total of 2,035 households (30.2%) fall into this category. Meanwhile, the 15 to 24 years age bracket for the primary householder has the lowest median household income of $40,473, with 209 households (3.1%) in this group.
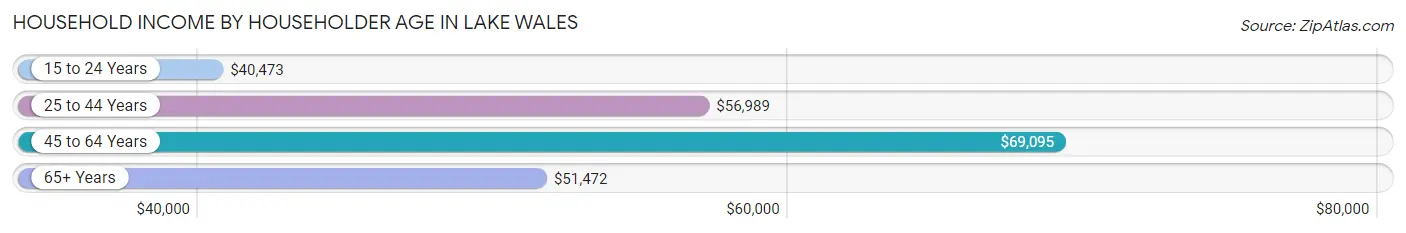
| Income Bracket | # Households | Median Income |
| 15 to 24 Years | 209 (3.1%) | $40,473 |
| 25 to 44 Years | 1,789 (26.6%) | $56,989 |
| 45 to 64 Years | 2,035 (30.2%) | $69,095 |
| 65+ Years | 2,701 (40.1%) | $51,472 |
| Total | 6,734 (100.0%) | $55,833 |
Poverty in Lake Wales
Income Below Poverty by Sex and Age in Lake Wales
With 19.7% poverty level for males and 20.9% for females among the residents of Lake Wales, 6 to 11 year old males and 5 year old females are the most vulnerable to poverty, with 265 males (58.5%) and 21 females (65.6%) in their respective age groups living below the poverty level.
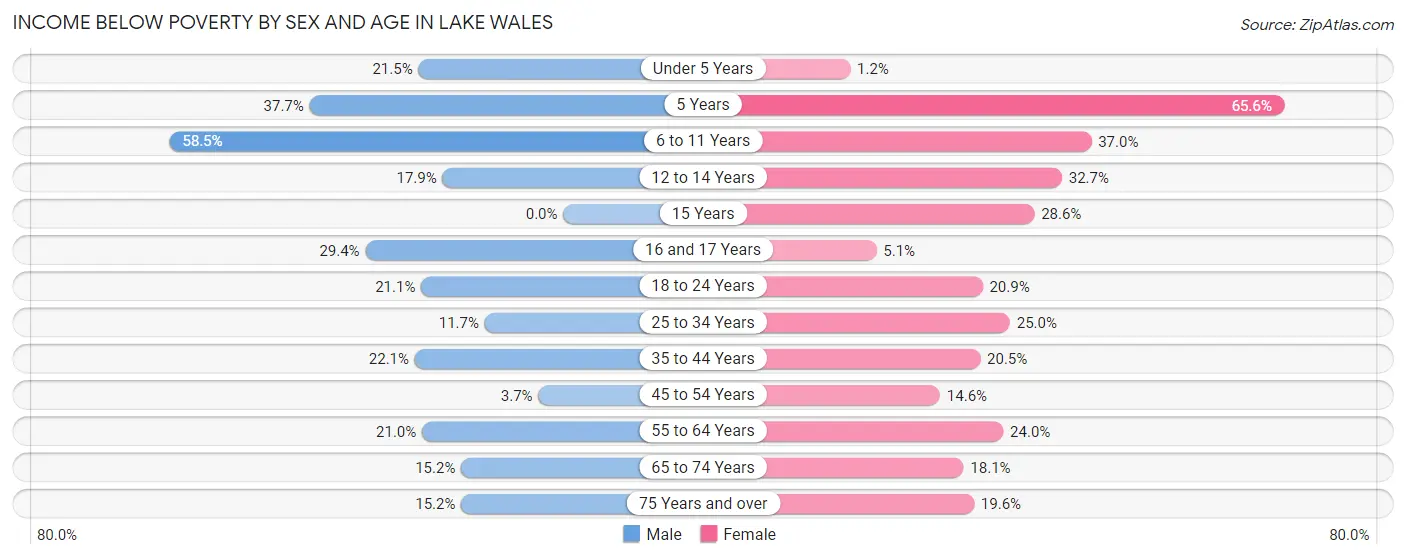
| Age Bracket | Male | Female |
| Under 5 Years | 80 (21.5%) | 5 (1.2%) |
| 5 Years | 52 (37.7%) | 21 (65.6%) |
| 6 to 11 Years | 265 (58.5%) | 250 (37.0%) |
| 12 to 14 Years | 101 (17.9%) | 66 (32.7%) |
| 15 Years | 0 (0.0%) | 4 (28.6%) |
| 16 and 17 Years | 72 (29.4%) | 8 (5.1%) |
| 18 to 24 Years | 119 (21.1%) | 117 (20.9%) |
| 25 to 34 Years | 123 (11.7%) | 228 (24.9%) |
| 35 to 44 Years | 237 (22.1%) | 191 (20.5%) |
| 45 to 54 Years | 20 (3.7%) | 140 (14.6%) |
| 55 to 64 Years | 181 (21.0%) | 293 (24.0%) |
| 65 to 74 Years | 156 (15.2%) | 276 (18.1%) |
| 75 Years and over | 130 (15.1%) | 134 (19.6%) |
| Total | 1,536 (19.7%) | 1,733 (20.9%) |
Income Above Poverty by Sex and Age in Lake Wales
According to the poverty statistics in Lake Wales, males aged 15 years and females aged under 5 years are the age groups that are most secure financially, with 100.0% of males and 98.8% of females in these age groups living above the poverty line.
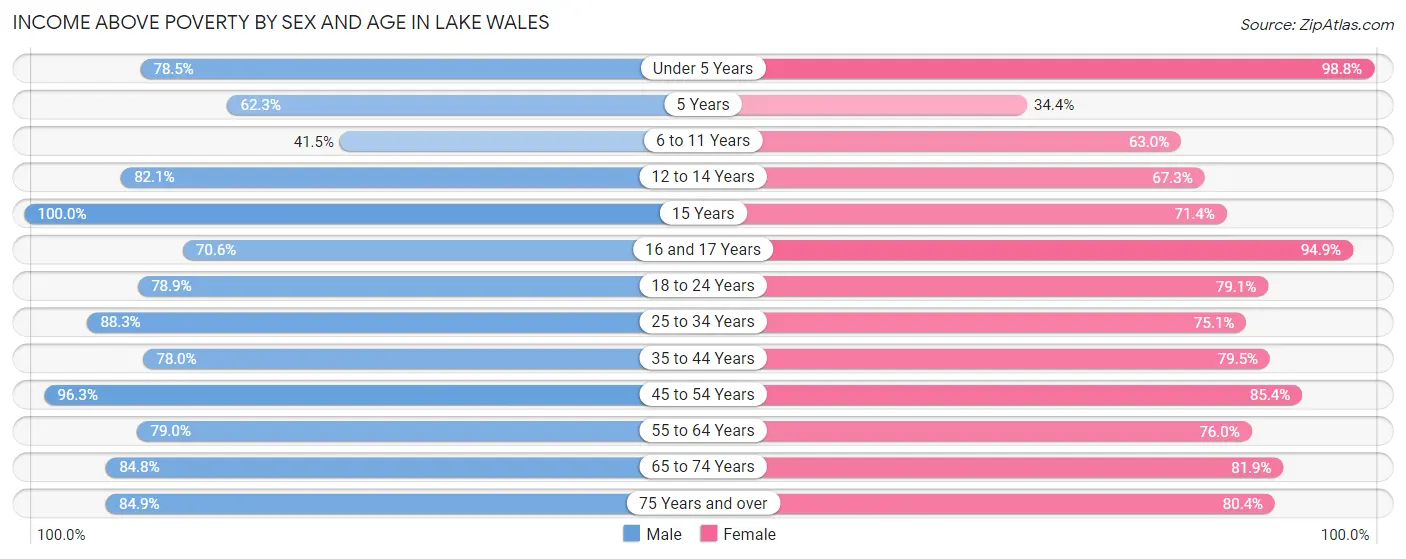
| Age Bracket | Male | Female |
| Under 5 Years | 292 (78.5%) | 402 (98.8%) |
| 5 Years | 86 (62.3%) | 11 (34.4%) |
| 6 to 11 Years | 188 (41.5%) | 425 (63.0%) |
| 12 to 14 Years | 462 (82.1%) | 136 (67.3%) |
| 15 Years | 46 (100.0%) | 10 (71.4%) |
| 16 and 17 Years | 173 (70.6%) | 148 (94.9%) |
| 18 to 24 Years | 445 (78.9%) | 443 (79.1%) |
| 25 to 34 Years | 931 (88.3%) | 686 (75.0%) |
| 35 to 44 Years | 838 (77.9%) | 739 (79.5%) |
| 45 to 54 Years | 521 (96.3%) | 821 (85.4%) |
| 55 to 64 Years | 682 (79.0%) | 930 (76.0%) |
| 65 to 74 Years | 873 (84.8%) | 1,252 (81.9%) |
| 75 Years and over | 728 (84.9%) | 549 (80.4%) |
| Total | 6,265 (80.3%) | 6,552 (79.1%) |
Income Below Poverty Among Married-Couple Families in Lake Wales
The poverty statistics for married-couple families in Lake Wales show that 13.1% or 402 of the total 3,081 families live below the poverty line. Families with 5 or more children have the highest poverty rate of 100.0%, comprising of 13 families. On the other hand, families with no children have the lowest poverty rate of 9.4%, which includes 179 families.
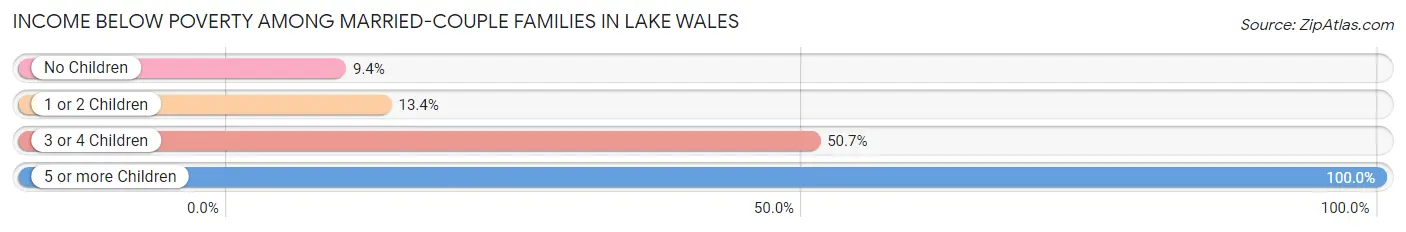
| Children | Above Poverty | Below Poverty |
| No Children | 1,725 (90.6%) | 179 (9.4%) |
| 1 or 2 Children | 882 (86.6%) | 136 (13.4%) |
| 3 or 4 Children | 72 (49.3%) | 74 (50.7%) |
| 5 or more Children | 0 (0.0%) | 13 (100.0%) |
| Total | 2,679 (87.0%) | 402 (13.1%) |
Income Below Poverty Among Single-Parent Households in Lake Wales
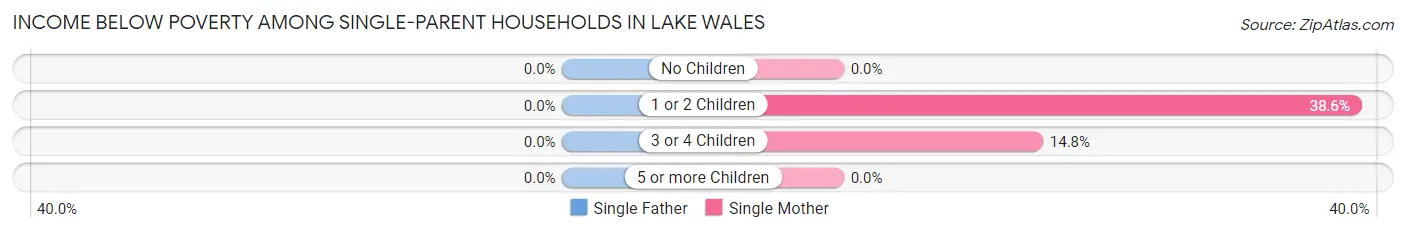
| Children | Single Father | Single Mother |
| No Children | 0 (0.0%) | 0 (0.0%) |
| 1 or 2 Children | 0 (0.0%) | 188 (38.6%) |
| 3 or 4 Children | 0 (0.0%) | 27 (14.8%) |
| 5 or more Children | 0 (0.0%) | 0 (0.0%) |
| Total | 0 (0.0%) | 215 (21.2%) |
Income Below Poverty Among Married-Couple vs Single-Parent Households in Lake Wales
The poverty data for Lake Wales shows that 402 of the married-couple family households (13.1%) and 215 of the single-parent households (19.6%) are living below the poverty level. Within the married-couple family households, those with 5 or more children have the highest poverty rate, with 13 households (100.0%) falling below the poverty line. Among the single-parent households, those with 1 or 2 children have the highest poverty rate, with 188 household (37.2%) living below poverty.
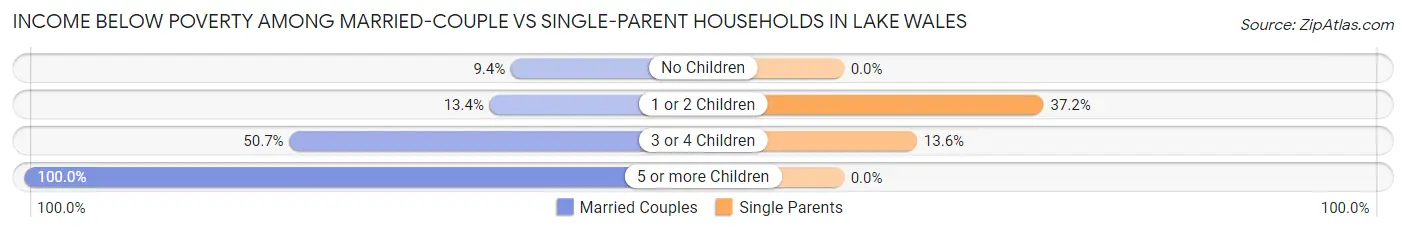
| Children | Married-Couple Families | Single-Parent Households |
| No Children | 179 (9.4%) | 0 (0.0%) |
| 1 or 2 Children | 136 (13.4%) | 188 (37.2%) |
| 3 or 4 Children | 74 (50.7%) | 27 (13.6%) |
| 5 or more Children | 13 (100.0%) | 0 (0.0%) |
| Total | 402 (13.1%) | 215 (19.6%) |
Race in Lake Wales
The most populous races in Lake Wales are White / Caucasian (9,681 | 58.8%), Hispanic or Latino (4,530 | 27.5%), and Black / African American (3,226 | 19.6%).
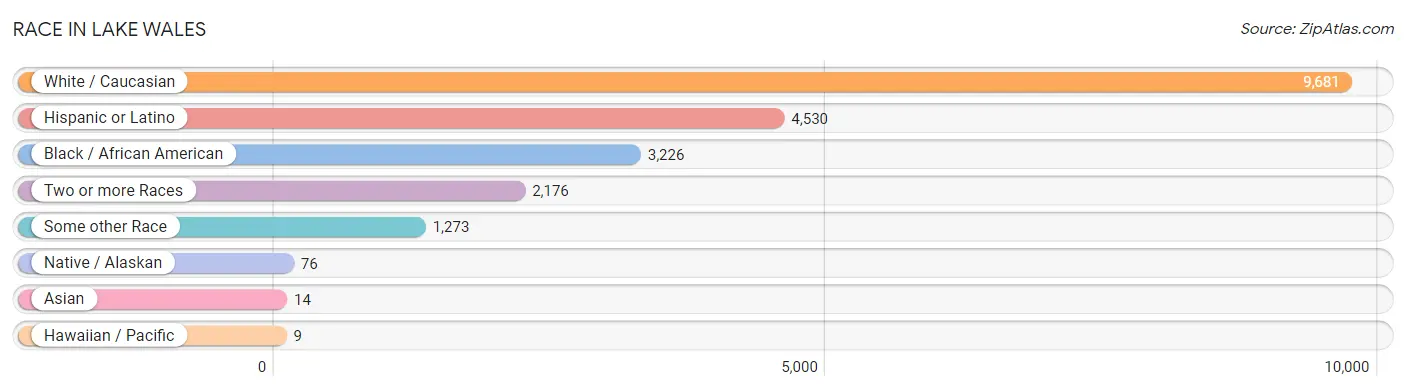
| Race | # Population | % Population |
| Asian | 14 | 0.1% |
| Black / African American | 3,226 | 19.6% |
| Hawaiian / Pacific | 9 | 0.1% |
| Hispanic or Latino | 4,530 | 27.5% |
| Native / Alaskan | 76 | 0.5% |
| White / Caucasian | 9,681 | 58.8% |
| Two or more Races | 2,176 | 13.2% |
| Some other Race | 1,273 | 7.7% |
| Total | 16,455 | 100.0% |
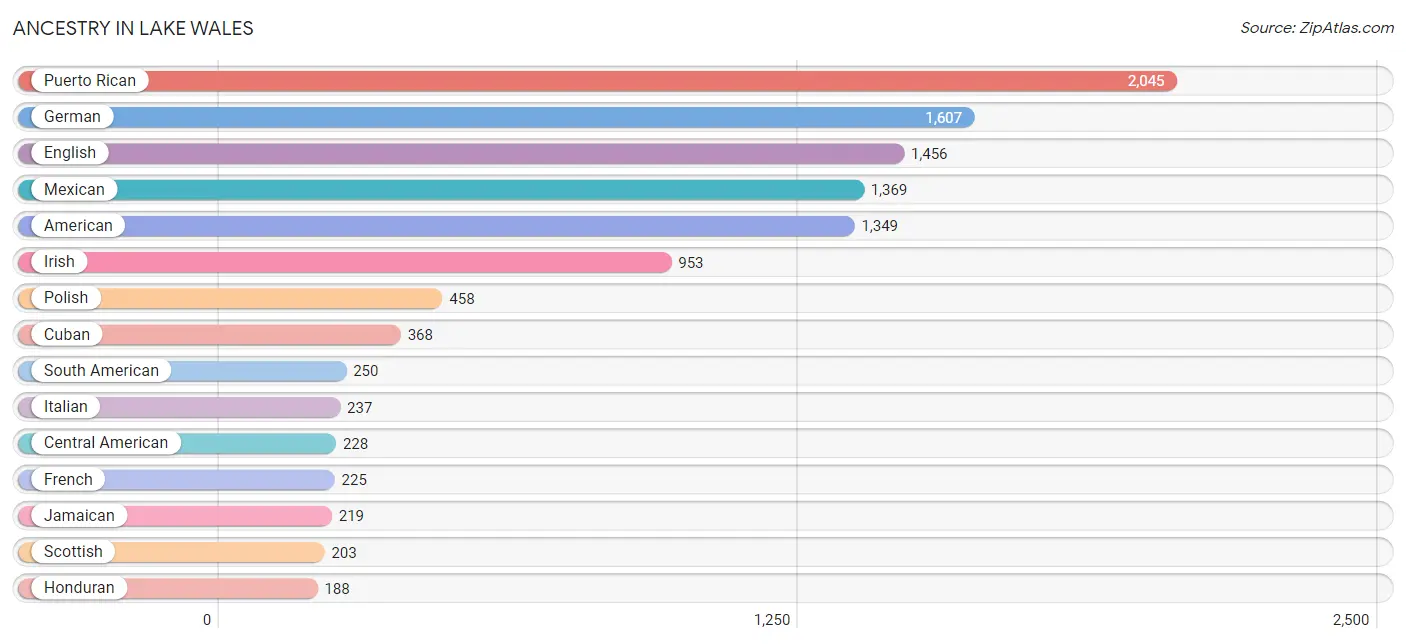
Ancestry in Lake Wales
The most populous ancestries reported in Lake Wales are Puerto Rican (2,045 | 12.4%), German (1,607 | 9.8%), English (1,456 | 8.8%), Mexican (1,369 | 8.3%), and American (1,349 | 8.2%), together accounting for 47.6% of all Lake Wales residents.
| Ancestry | # Population | % Population |
| African | 55 | 0.3% |
| American | 1,349 | 8.2% |
| Arab | 23 | 0.1% |
| Austrian | 10 | 0.1% |
| Bahamian | 11 | 0.1% |
| Belgian | 11 | 0.1% |
| Bhutanese | 132 | 0.8% |
| British | 174 | 1.1% |
| Canadian | 6 | 0.0% |
| Celtic | 25 | 0.2% |
| Central American | 228 | 1.4% |
| Cherokee | 24 | 0.2% |
| Chickasaw | 31 | 0.2% |
| Colombian | 21 | 0.1% |
| Croatian | 26 | 0.2% |
| Cuban | 368 | 2.2% |
| Czech | 69 | 0.4% |
| Danish | 27 | 0.2% |
| Dominican | 16 | 0.1% |
| Dutch | 112 | 0.7% |
| Eastern European | 12 | 0.1% |
| Ecuadorian | 68 | 0.4% |
| English | 1,456 | 8.8% |
| European | 42 | 0.3% |
| Fijian | 9 | 0.1% |
| French | 225 | 1.4% |
| French Canadian | 70 | 0.4% |
| German | 1,607 | 9.8% |
| Guyanese | 83 | 0.5% |
| Haitian | 41 | 0.3% |
| Honduran | 188 | 1.1% |
| Hungarian | 30 | 0.2% |
| Indian (Asian) | 14 | 0.1% |
| Iranian | 8 | 0.1% |
| Irish | 953 | 5.8% |
| Italian | 237 | 1.4% |
| Jamaican | 219 | 1.3% |
| Korean | 121 | 0.7% |
| Lebanese | 17 | 0.1% |
| Lithuanian | 20 | 0.1% |
| Mexican | 1,369 | 8.3% |
| Mexican American Indian | 21 | 0.1% |
| Navajo | 10 | 0.1% |
| Nicaraguan | 29 | 0.2% |
| Northern European | 24 | 0.2% |
| Norwegian | 48 | 0.3% |
| Ottawa | 36 | 0.2% |
| Panamanian | 11 | 0.1% |
| Pennsylvania German | 22 | 0.1% |
| Peruvian | 11 | 0.1% |
| Polish | 458 | 2.8% |
| Portuguese | 107 | 0.6% |
| Puerto Rican | 2,045 | 12.4% |
| Romanian | 37 | 0.2% |
| Scandinavian | 31 | 0.2% |
| Scotch-Irish | 129 | 0.8% |
| Scottish | 203 | 1.2% |
| Slovak | 25 | 0.2% |
| South American | 250 | 1.5% |
| Spaniard | 144 | 0.9% |
| Subsaharan African | 55 | 0.3% |
| Swedish | 63 | 0.4% |
| Swiss | 29 | 0.2% |
| Syrian | 6 | 0.0% |
| Thai | 16 | 0.1% |
| Trinidadian and Tobagonian | 18 | 0.1% |
| Ukrainian | 39 | 0.2% |
| Venezuelan | 150 | 0.9% |
| Welsh | 83 | 0.5% | View All 69 Rows |
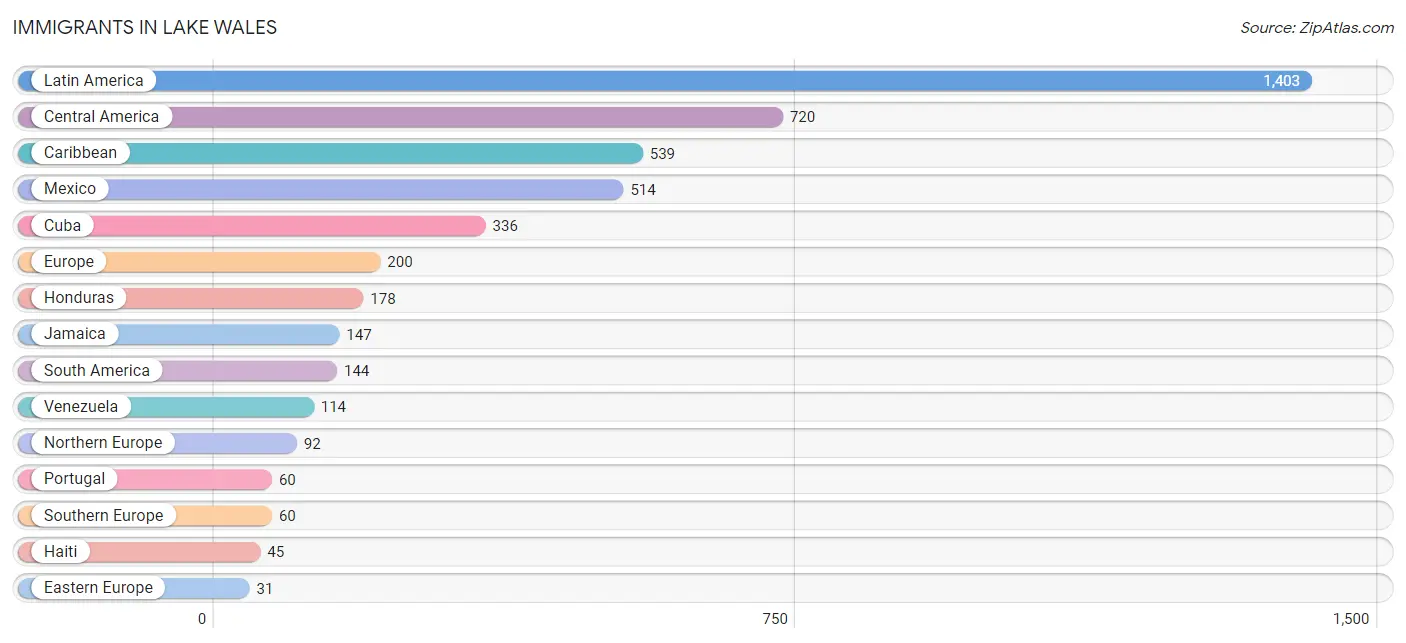
Immigrants in Lake Wales
The most numerous immigrant groups reported in Lake Wales came from Latin America (1,403 | 8.5%), Central America (720 | 4.4%), Caribbean (539 | 3.3%), Mexico (514 | 3.1%), and Cuba (336 | 2.0%), together accounting for 21.3% of all Lake Wales residents.
| Immigration Origin | # Population | % Population |
| Africa | 24 | 0.2% |
| Asia | 22 | 0.1% |
| Australia | 15 | 0.1% |
| Bahamas | 11 | 0.1% |
| Brazil | 9 | 0.1% |
| Canada | 17 | 0.1% |
| Caribbean | 539 | 3.3% |
| Central America | 720 | 4.4% |
| China | 14 | 0.1% |
| Colombia | 9 | 0.1% |
| Cuba | 336 | 2.0% |
| Eastern Asia | 14 | 0.1% |
| Eastern Europe | 31 | 0.2% |
| Ecuador | 1 | 0.0% |
| England | 20 | 0.1% |
| Europe | 200 | 1.2% |
| Germany | 17 | 0.1% |
| Haiti | 45 | 0.3% |
| Honduras | 178 | 1.1% |
| Hong Kong | 14 | 0.1% |
| Iran | 8 | 0.1% |
| Ireland | 22 | 0.1% |
| Jamaica | 147 | 0.9% |
| Latin America | 1,403 | 8.5% |
| Liberia | 9 | 0.1% |
| Lithuania | 20 | 0.1% |
| Mexico | 514 | 3.1% |
| Nicaragua | 28 | 0.2% |
| Northern Europe | 92 | 0.6% |
| Oceania | 15 | 0.1% |
| Peru | 11 | 0.1% |
| Portugal | 60 | 0.4% |
| Romania | 11 | 0.1% |
| South Africa | 15 | 0.1% |
| South America | 144 | 0.9% |
| South Central Asia | 8 | 0.1% |
| Southern Europe | 60 | 0.4% |
| Venezuela | 114 | 0.7% |
| Western Africa | 9 | 0.1% |
| Western Europe | 17 | 0.1% | View All 40 Rows |
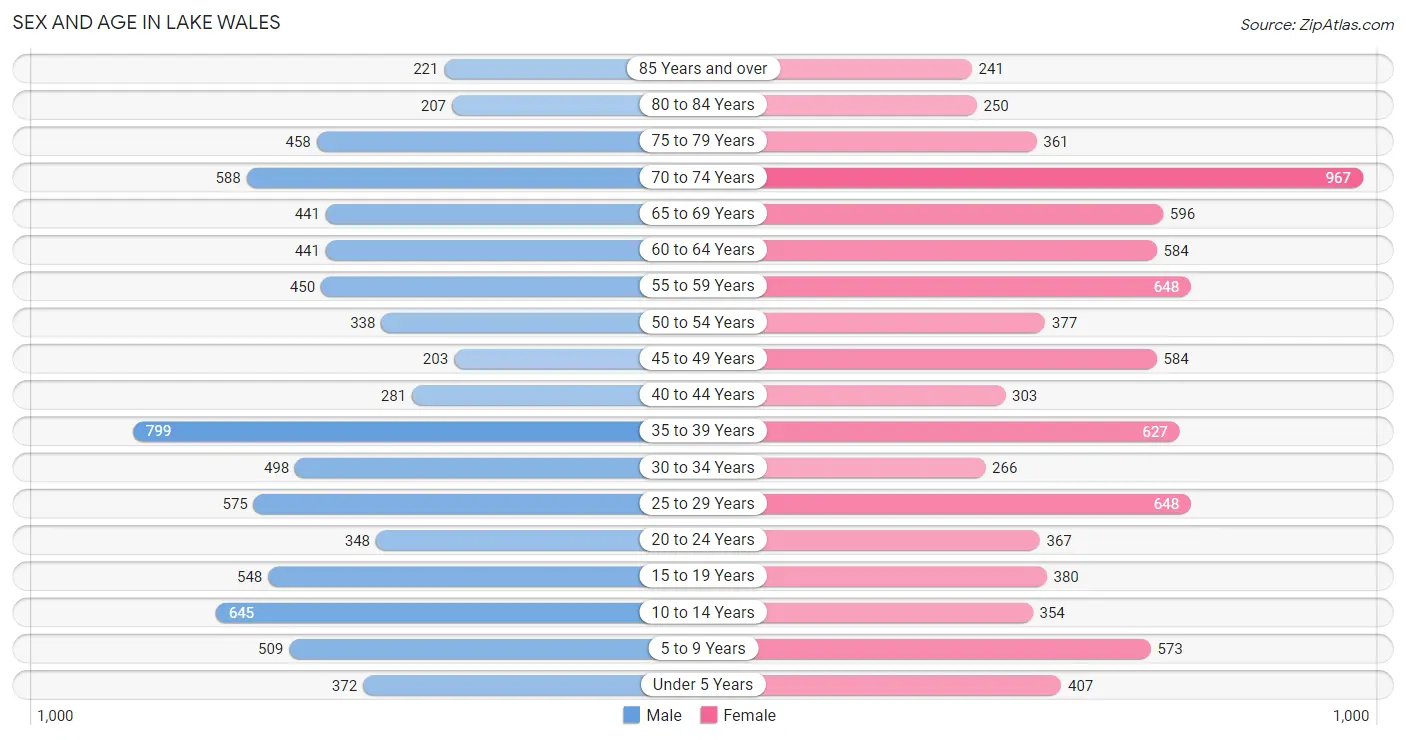
Sex and Age in Lake Wales
Sex and Age in Lake Wales
The most populous age groups in Lake Wales are 35 to 39 Years (799 | 10.1%) for men and 70 to 74 Years (967 | 11.3%) for women.
| Age Bracket | Male | Female |
| Under 5 Years | 372 (4.7%) | 407 (4.8%) |
| 5 to 9 Years | 509 (6.4%) | 573 (6.7%) |
| 10 to 14 Years | 645 (8.1%) | 354 (4.2%) |
| 15 to 19 Years | 548 (6.9%) | 380 (4.4%) |
| 20 to 24 Years | 348 (4.4%) | 367 (4.3%) |
| 25 to 29 Years | 575 (7.3%) | 648 (7.6%) |
| 30 to 34 Years | 498 (6.3%) | 266 (3.1%) |
| 35 to 39 Years | 799 (10.1%) | 627 (7.3%) |
| 40 to 44 Years | 281 (3.5%) | 303 (3.5%) |
| 45 to 49 Years | 203 (2.6%) | 584 (6.8%) |
| 50 to 54 Years | 338 (4.3%) | 377 (4.4%) |
| 55 to 59 Years | 450 (5.7%) | 648 (7.6%) |
| 60 to 64 Years | 441 (5.6%) | 584 (6.8%) |
| 65 to 69 Years | 441 (5.6%) | 596 (7.0%) |
| 70 to 74 Years | 588 (7.4%) | 967 (11.3%) |
| 75 to 79 Years | 458 (5.8%) | 361 (4.2%) |
| 80 to 84 Years | 207 (2.6%) | 250 (2.9%) |
| 85 Years and over | 221 (2.8%) | 241 (2.8%) |
| Total | 7,922 (100.0%) | 8,533 (100.0%) |
Families and Households in Lake Wales
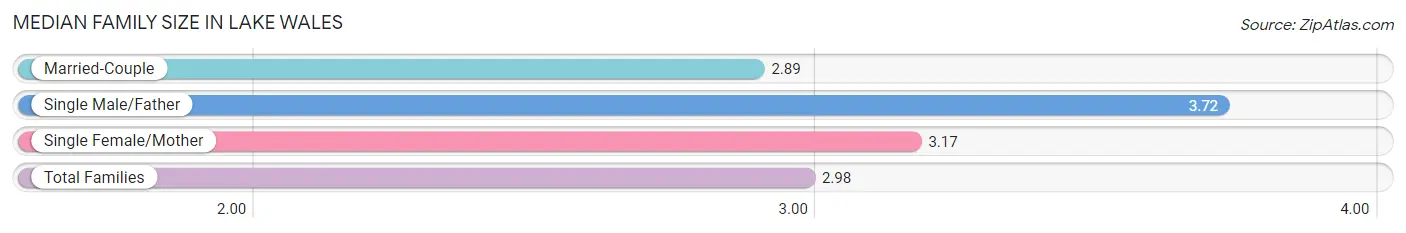
Median Family Size in Lake Wales
The median family size in Lake Wales is 2.98 persons per family, with single male/father families (82 | 2.0%) accounting for the largest median family size of 3.72 persons per family. On the other hand, married-couple families (3,081 | 73.8%) represent the smallest median family size with 2.89 persons per family.
| Family Type | # Families | Family Size |
| Married-Couple | 3,081 (73.8%) | 2.89 |
| Single Male/Father | 82 (2.0%) | 3.72 |
| Single Female/Mother | 1,013 (24.3%) | 3.17 |
| Total Families | 4,176 (100.0%) | 2.98 |
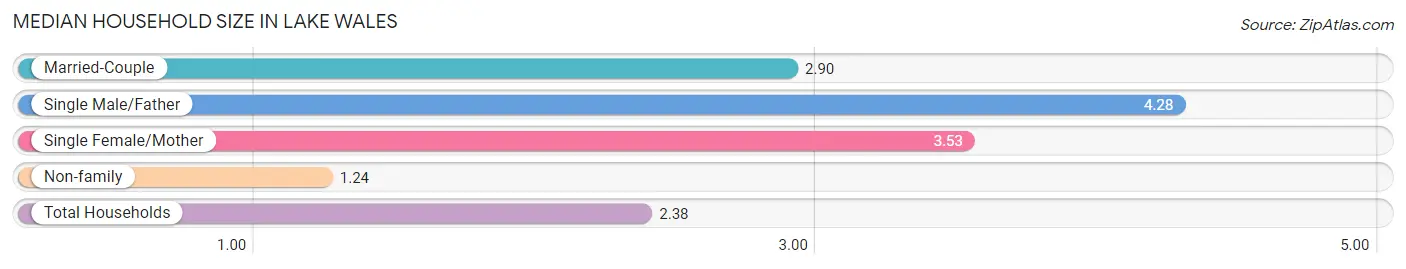
Median Household Size in Lake Wales
The median household size in Lake Wales is 2.38 persons per household, with single male/father households (82 | 1.2%) accounting for the largest median household size of 4.28 persons per household. non-family households (2,558 | 38.0%) represent the smallest median household size with 1.24 persons per household.
| Household Type | # Households | Household Size |
| Married-Couple | 3,081 (45.8%) | 2.90 |
| Single Male/Father | 82 (1.2%) | 4.28 |
| Single Female/Mother | 1,013 (15.0%) | 3.53 |
| Non-family | 2,558 (38.0%) | 1.24 |
| Total Households | 6,734 (100.0%) | 2.38 |
Household Size by Marriage Status in Lake Wales
Out of a total of 6,734 households in Lake Wales, 4,176 (62.0%) are family households, while 2,558 (38.0%) are nonfamily households. The most numerous type of family households are 2-person households, comprising 2,204, and the most common type of nonfamily households are 1-person households, comprising 2,135.
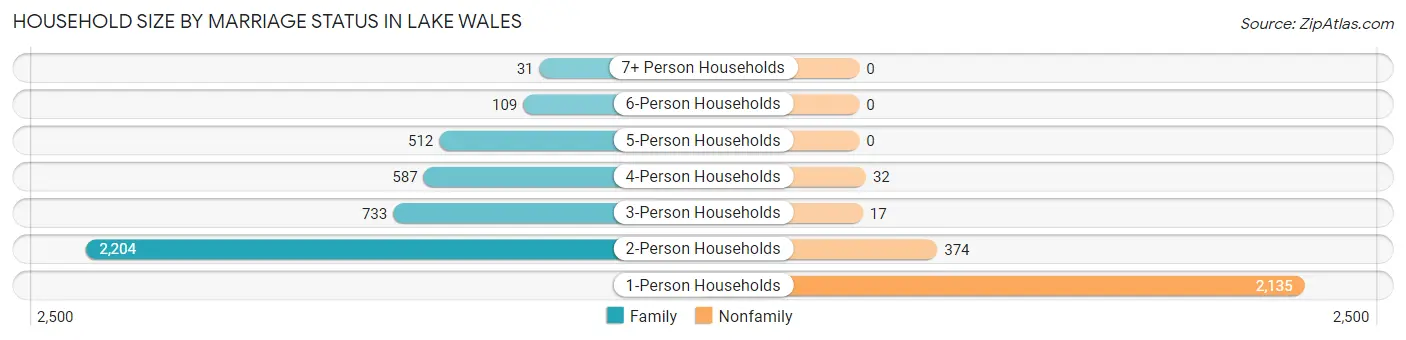
| Household Size | Family Households | Nonfamily Households |
| 1-Person Households | - | 2,135 (31.7%) |
| 2-Person Households | 2,204 (32.7%) | 374 (5.6%) |
| 3-Person Households | 733 (10.9%) | 17 (0.3%) |
| 4-Person Households | 587 (8.7%) | 32 (0.5%) |
| 5-Person Households | 512 (7.6%) | 0 (0.0%) |
| 6-Person Households | 109 (1.6%) | 0 (0.0%) |
| 7+ Person Households | 31 (0.5%) | 0 (0.0%) |
| Total | 4,176 (62.0%) | 2,558 (38.0%) |
Female Fertility in Lake Wales
Fertility by Age in Lake Wales
Average fertility rate in Lake Wales is 59.0 births per 1,000 women. Women in the age bracket of 20 to 34 years have the highest fertility rate with 129.0 births per 1,000 women. Women in the age bracket of 20 to 34 years acount for 85.1% of all women with births.
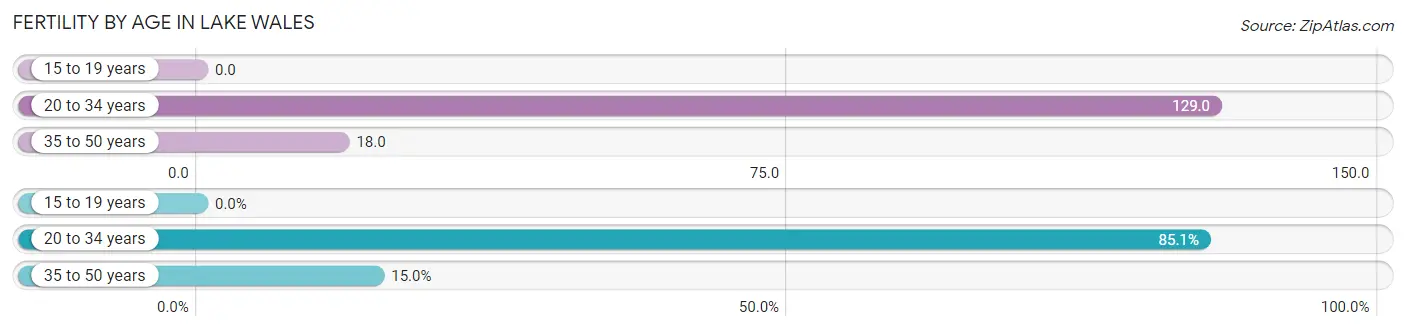
| Age Bracket | Women with Births | Births / 1,000 Women |
| 15 to 19 years | 0 (0.0%) | 0.0 |
| 20 to 34 years | 165 (85.1%) | 129.0 |
| 35 to 50 years | 29 (14.9%) | 18.0 |
| Total | 194 (100.0%) | 59.0 |
Fertility by Age by Marriage Status in Lake Wales
78.9% of women with births (194) in Lake Wales are married. The highest percentage of unmarried women with births falls into 20 to 34 years age bracket with 24.8% of them unmarried at the time of birth, while the lowest percentage of unmarried women with births belong to 35 to 50 years age bracket with 0.0% of them unmarried.
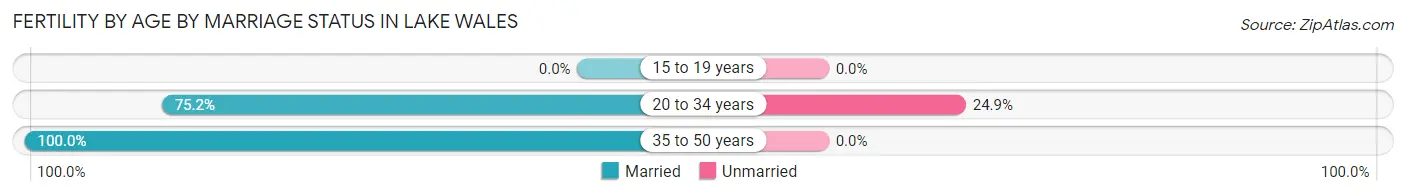
| Age Bracket | Married | Unmarried |
| 15 to 19 years | 0 (0.0%) | 0 (0.0%) |
| 20 to 34 years | 124 (75.1%) | 41 (24.8%) |
| 35 to 50 years | 29 (100.0%) | 0 (0.0%) |
| Total | 153 (78.9%) | 41 (21.1%) |
Fertility by Education in Lake Wales
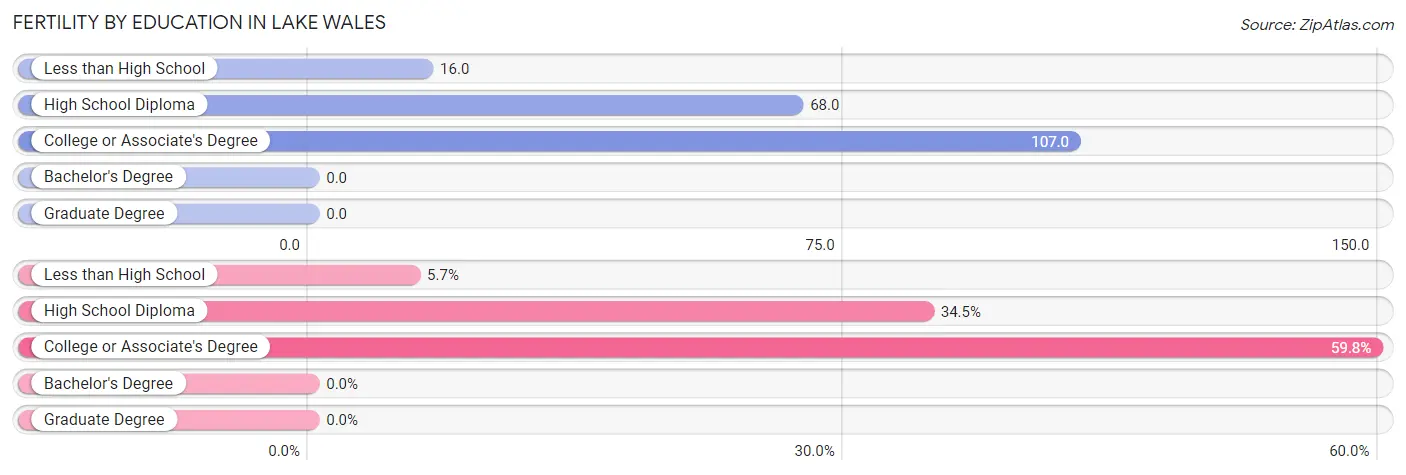
| Educational Attainment | Women with Births | Births / 1,000 Women |
| Less than High School | 11 (5.7%) | 16.0 |
| High School Diploma | 67 (34.5%) | 68.0 |
| College or Associate's Degree | 116 (59.8%) | 107.0 |
| Bachelor's Degree | 0 (0.0%) | 0.0 |
| Graduate Degree | 0 (0.0%) | 0.0 |
| Total | 194 (100.0%) | 59.0 |
Fertility by Education by Marriage Status in Lake Wales
21.1% of women with births in Lake Wales are unmarried. Women with the educational attainment of college or associate's degree are most likely to be married with 94.0% of them married at childbirth, while women with the educational attainment of less than high school are least likely to be married with 100.0% of them unmarried at childbirth.
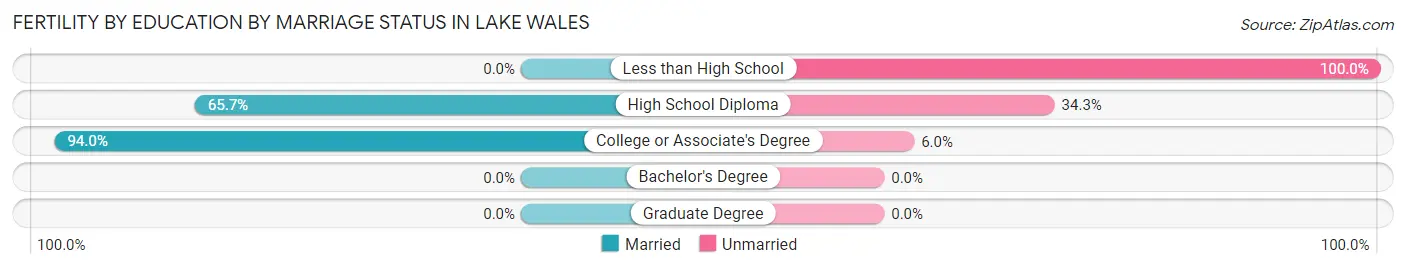
| Educational Attainment | Married | Unmarried |
| Less than High School | 0 (0.0%) | 11 (100.0%) |
| High School Diploma | 44 (65.7%) | 23 (34.3%) |
| College or Associate's Degree | 109 (94.0%) | 7 (6.0%) |
| Bachelor's Degree | 0 (0.0%) | 0 (0.0%) |
| Graduate Degree | 0 (0.0%) | 0 (0.0%) |
| Total | 153 (78.9%) | 41 (21.1%) |
Employment Characteristics in Lake Wales
Employment by Class of Employer in Lake Wales
Among the 6,012 employed individuals in Lake Wales, private company employees (4,051 | 67.4%), not-for-profit organizations (608 | 10.1%), and local government employees (492 | 8.2%) make up the most common classes of employment.
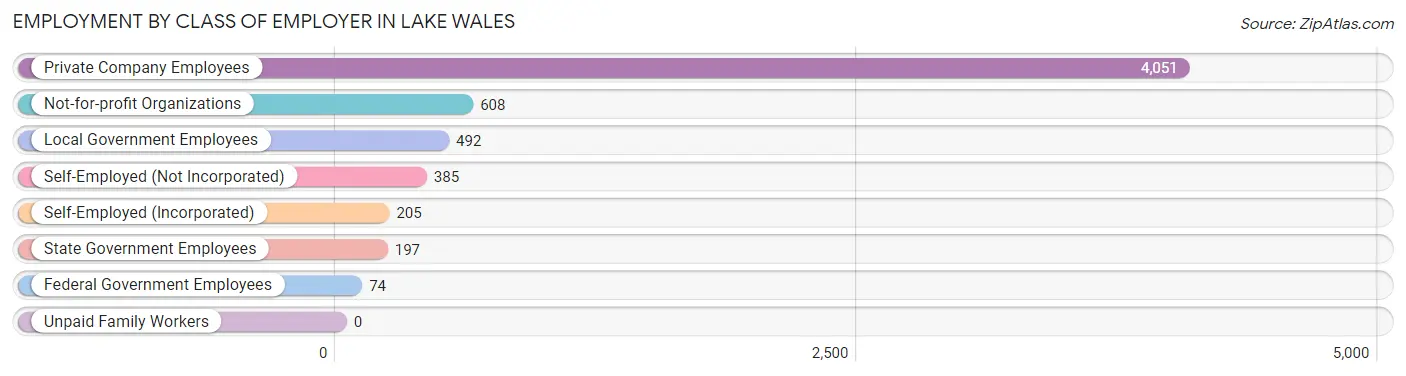
| Employer Class | # Employees | % Employees |
| Private Company Employees | 4,051 | 67.4% |
| Self-Employed (Incorporated) | 205 | 3.4% |
| Self-Employed (Not Incorporated) | 385 | 6.4% |
| Not-for-profit Organizations | 608 | 10.1% |
| Local Government Employees | 492 | 8.2% |
| State Government Employees | 197 | 3.3% |
| Federal Government Employees | 74 | 1.2% |
| Unpaid Family Workers | 0 | 0.0% |
| Total | 6,012 | 100.0% |
Employment Status by Age in Lake Wales
According to the labor force statistics for Lake Wales, out of the total population over 16 years of age (13,535), 48.0% or 6,497 individuals are in the labor force, with 5.7% or 370 of them unemployed. The age group with the highest labor force participation rate is 30 to 34 years, with 85.2% or 651 individuals in the labor force. Within the labor force, the 45 to 54 years age range has the highest percentage of unemployed individuals, with 10.5% or 110 of them being unemployed.
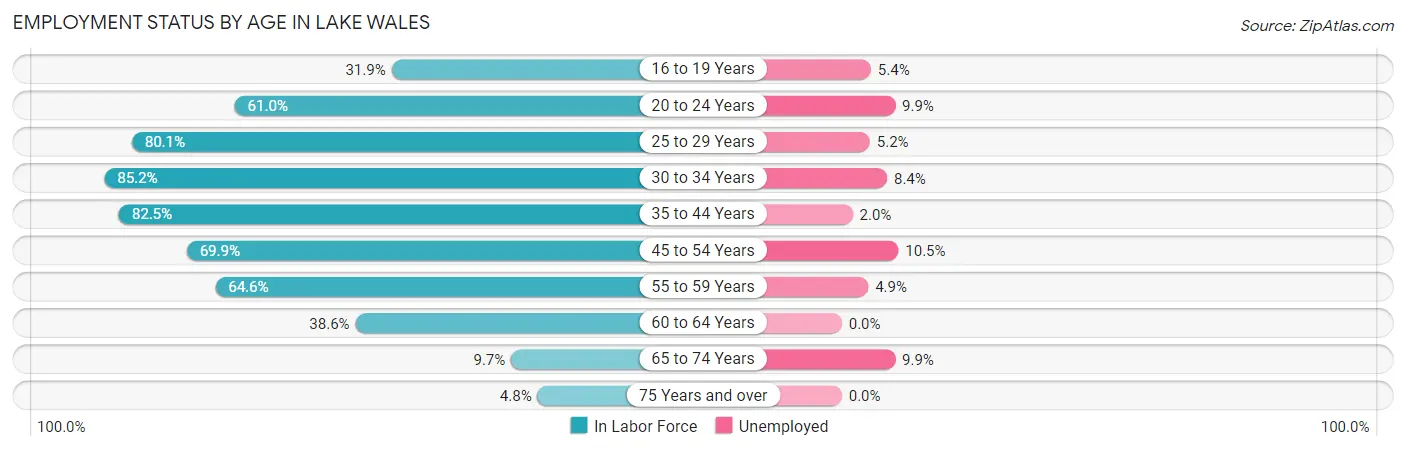
| Age Bracket | In Labor Force | Unemployed |
| 16 to 19 Years | 277 (31.9%) | 15 (5.4%) |
| 20 to 24 Years | 436 (61.0%) | 43 (9.9%) |
| 25 to 29 Years | 980 (80.1%) | 51 (5.2%) |
| 30 to 34 Years | 651 (85.2%) | 55 (8.4%) |
| 35 to 44 Years | 1,658 (82.5%) | 33 (2.0%) |
| 45 to 54 Years | 1,050 (69.9%) | 110 (10.5%) |
| 55 to 59 Years | 709 (64.6%) | 35 (4.9%) |
| 60 to 64 Years | 396 (38.6%) | 0 (0.0%) |
| 65 to 74 Years | 251 (9.7%) | 25 (9.9%) |
| 75 Years and over | 83 (4.8%) | 0 (0.0%) |
| Total | 6,497 (48.0%) | 370 (5.7%) |
Employment Status by Educational Attainment in Lake Wales
According to labor force statistics for Lake Wales, 71.4% of individuals (5,442) out of the total population between 25 and 64 years of age (7,622) are in the labor force, with 5.2% or 283 of them being unemployed. The group with the highest labor force participation rate are those with the educational attainment of bachelor's degree or higher, with 84.0% or 1,342 individuals in the labor force. Within the labor force, individuals with high school diploma education have the highest percentage of unemployment, with 6.8% or 130 of them being unemployed.
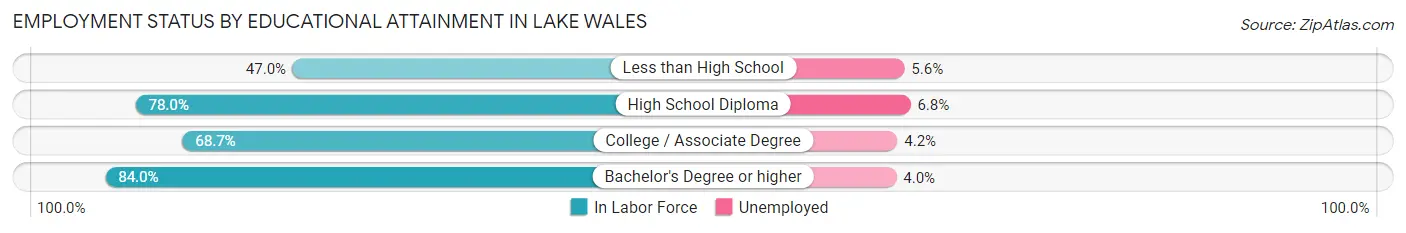
| Educational Attainment | In Labor Force | Unemployed |
| Less than High School | 571 (47.0%) | 68 (5.6%) |
| High School Diploma | 1,907 (78.0%) | 166 (6.8%) |
| College / Associate Degree | 1,624 (68.7%) | 99 (4.2%) |
| Bachelor's Degree or higher | 1,342 (84.0%) | 64 (4.0%) |
| Total | 5,442 (71.4%) | 396 (5.2%) |
Employment Occupations by Sex in Lake Wales
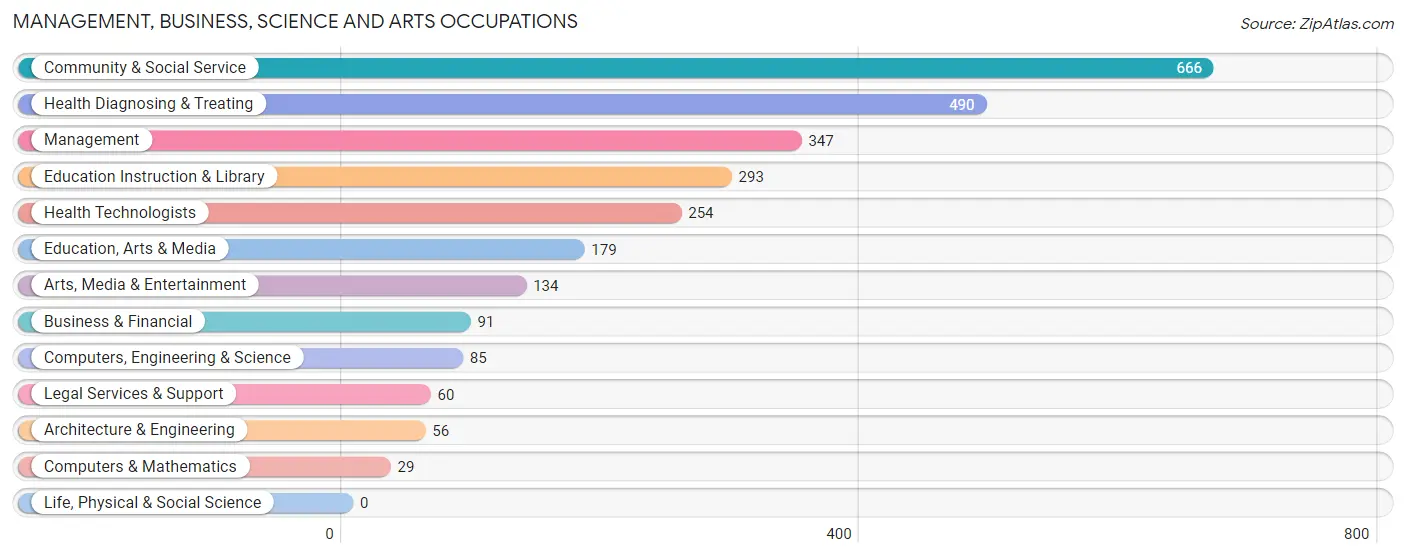
Management, Business, Science and Arts Occupations
The most common Management, Business, Science and Arts occupations in Lake Wales are Community & Social Service (666 | 10.9%), Health Diagnosing & Treating (490 | 8.0%), Management (347 | 5.7%), Education Instruction & Library (293 | 4.8%), and Health Technologists (254 | 4.2%).
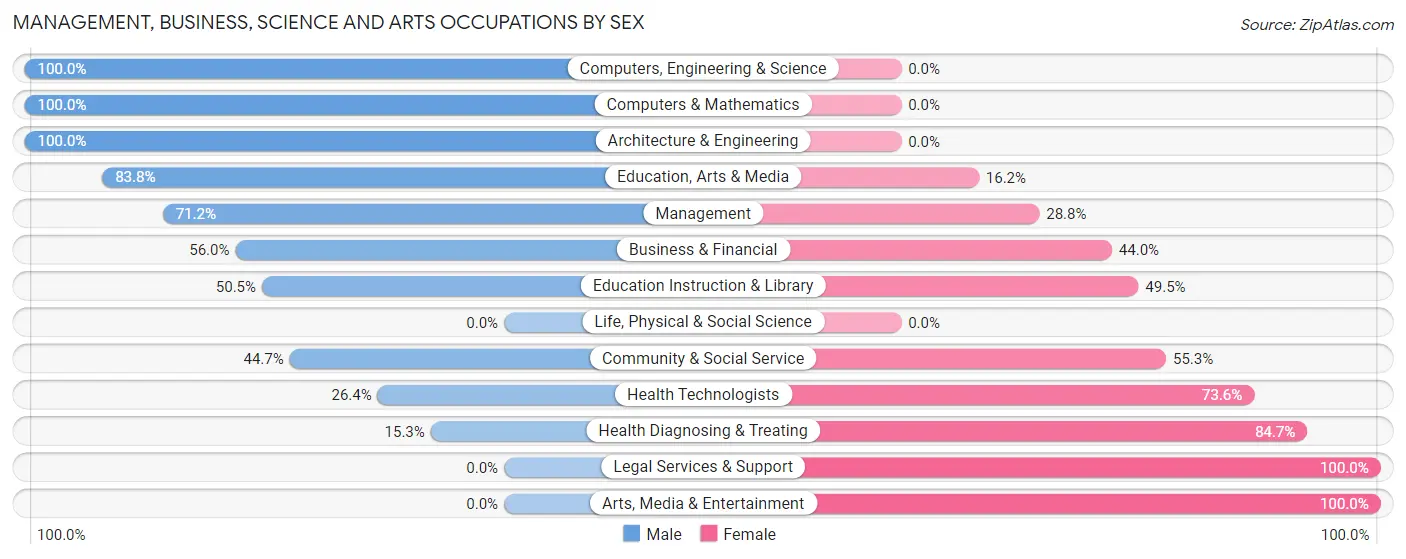
Management, Business, Science and Arts Occupations by Sex
Within the Management, Business, Science and Arts occupations in Lake Wales, the most male-oriented occupations are Computers, Engineering & Science (100.0%), Computers & Mathematics (100.0%), and Architecture & Engineering (100.0%), while the most female-oriented occupations are Legal Services & Support (100.0%), Arts, Media & Entertainment (100.0%), and Health Diagnosing & Treating (84.7%).
| Occupation | Male | Female |
| Management | 247 (71.2%) | 100 (28.8%) |
| Business & Financial | 51 (56.0%) | 40 (44.0%) |
| Computers, Engineering & Science | 85 (100.0%) | 0 (0.0%) |
| Computers & Mathematics | 29 (100.0%) | 0 (0.0%) |
| Architecture & Engineering | 56 (100.0%) | 0 (0.0%) |
| Life, Physical & Social Science | 0 (0.0%) | 0 (0.0%) |
| Community & Social Service | 298 (44.7%) | 368 (55.3%) |
| Education, Arts & Media | 150 (83.8%) | 29 (16.2%) |
| Legal Services & Support | 0 (0.0%) | 60 (100.0%) |
| Education Instruction & Library | 148 (50.5%) | 145 (49.5%) |
| Arts, Media & Entertainment | 0 (0.0%) | 134 (100.0%) |
| Health Diagnosing & Treating | 75 (15.3%) | 415 (84.7%) |
| Health Technologists | 67 (26.4%) | 187 (73.6%) |
| Total (Category) | 756 (45.0%) | 923 (55.0%) |
| Total (Overall) | 3,123 (51.0%) | 3,003 (49.0%) |
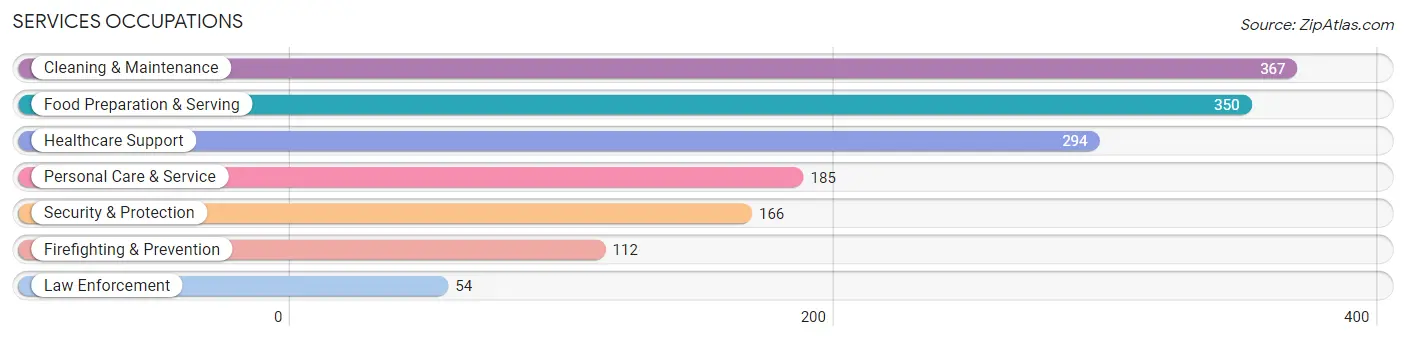
Services Occupations
The most common Services occupations in Lake Wales are Cleaning & Maintenance (367 | 6.0%), Food Preparation & Serving (350 | 5.7%), Healthcare Support (294 | 4.8%), Personal Care & Service (185 | 3.0%), and Security & Protection (166 | 2.7%).
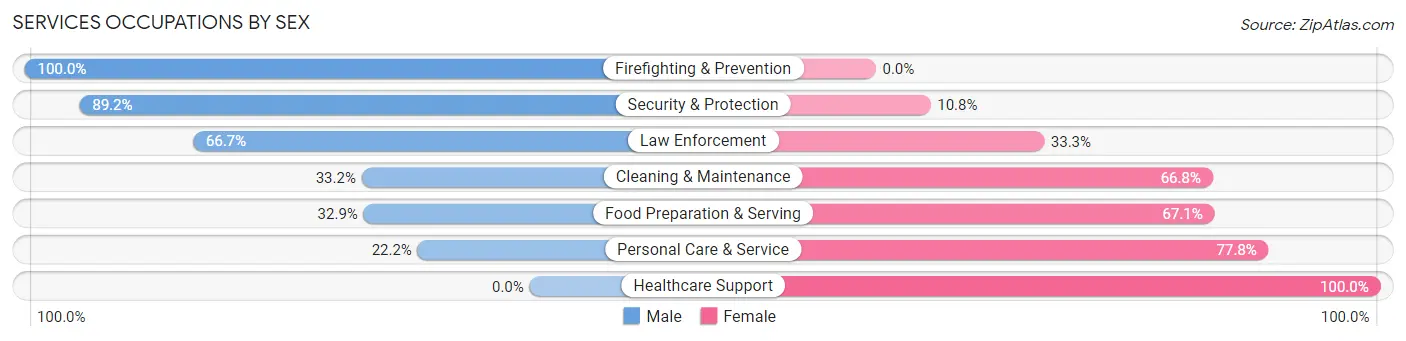
Services Occupations by Sex
Within the Services occupations in Lake Wales, the most male-oriented occupations are Firefighting & Prevention (100.0%), Security & Protection (89.2%), and Law Enforcement (66.7%), while the most female-oriented occupations are Healthcare Support (100.0%), Personal Care & Service (77.8%), and Food Preparation & Serving (67.1%).
| Occupation | Male | Female |
| Healthcare Support | 0 (0.0%) | 294 (100.0%) |
| Security & Protection | 148 (89.2%) | 18 (10.8%) |
| Firefighting & Prevention | 112 (100.0%) | 0 (0.0%) |
| Law Enforcement | 36 (66.7%) | 18 (33.3%) |
| Food Preparation & Serving | 115 (32.9%) | 235 (67.1%) |
| Cleaning & Maintenance | 122 (33.2%) | 245 (66.8%) |
| Personal Care & Service | 41 (22.2%) | 144 (77.8%) |
| Total (Category) | 426 (31.3%) | 936 (68.7%) |
| Total (Overall) | 3,123 (51.0%) | 3,003 (49.0%) |
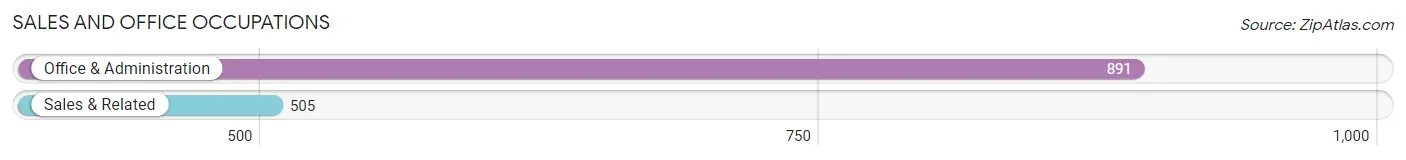
Sales and Office Occupations
The most common Sales and Office occupations in Lake Wales are Office & Administration (891 | 14.5%), and Sales & Related (505 | 8.2%).
Sales and Office Occupations by Sex
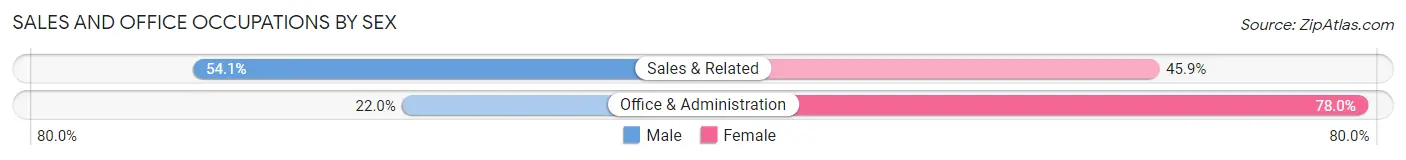
| Occupation | Male | Female |
| Sales & Related | 273 (54.1%) | 232 (45.9%) |
| Office & Administration | 196 (22.0%) | 695 (78.0%) |
| Total (Category) | 469 (33.6%) | 927 (66.4%) |
| Total (Overall) | 3,123 (51.0%) | 3,003 (49.0%) |
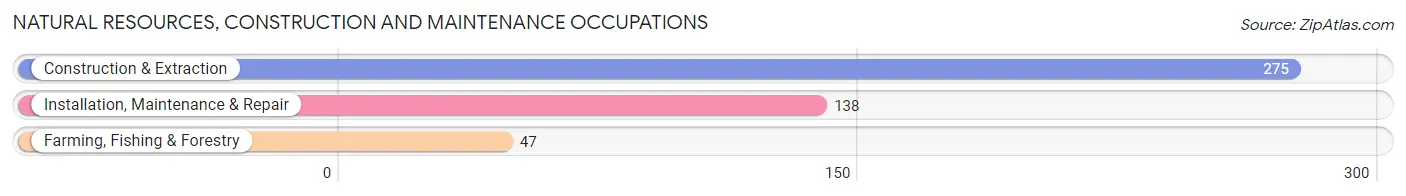
Natural Resources, Construction and Maintenance Occupations
The most common Natural Resources, Construction and Maintenance occupations in Lake Wales are Construction & Extraction (275 | 4.5%), Installation, Maintenance & Repair (138 | 2.2%), and Farming, Fishing & Forestry (47 | 0.8%).
Natural Resources, Construction and Maintenance Occupations by Sex
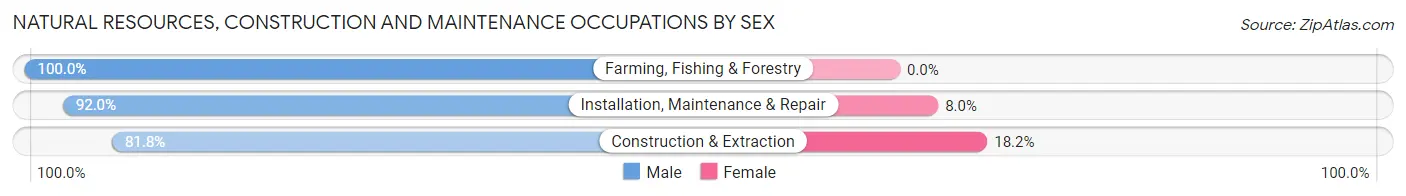
| Occupation | Male | Female |
| Farming, Fishing & Forestry | 47 (100.0%) | 0 (0.0%) |
| Construction & Extraction | 225 (81.8%) | 50 (18.2%) |
| Installation, Maintenance & Repair | 127 (92.0%) | 11 (8.0%) |
| Total (Category) | 399 (86.7%) | 61 (13.3%) |
| Total (Overall) | 3,123 (51.0%) | 3,003 (49.0%) |
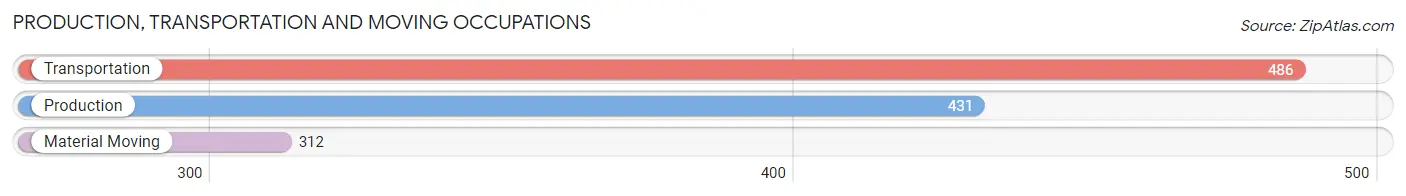
Production, Transportation and Moving Occupations
The most common Production, Transportation and Moving occupations in Lake Wales are Transportation (486 | 7.9%), Production (431 | 7.0%), and Material Moving (312 | 5.1%).
Production, Transportation and Moving Occupations by Sex
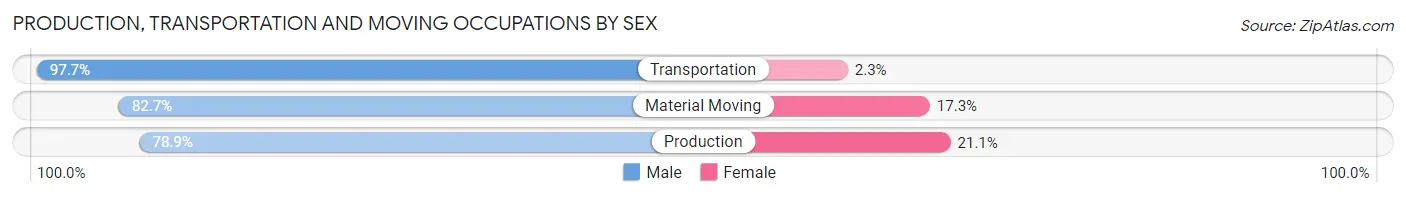
| Occupation | Male | Female |
| Production | 340 (78.9%) | 91 (21.1%) |
| Transportation | 475 (97.7%) | 11 (2.3%) |
| Material Moving | 258 (82.7%) | 54 (17.3%) |
| Total (Category) | 1,073 (87.3%) | 156 (12.7%) |
| Total (Overall) | 3,123 (51.0%) | 3,003 (49.0%) |
Employment Industries by Sex in Lake Wales
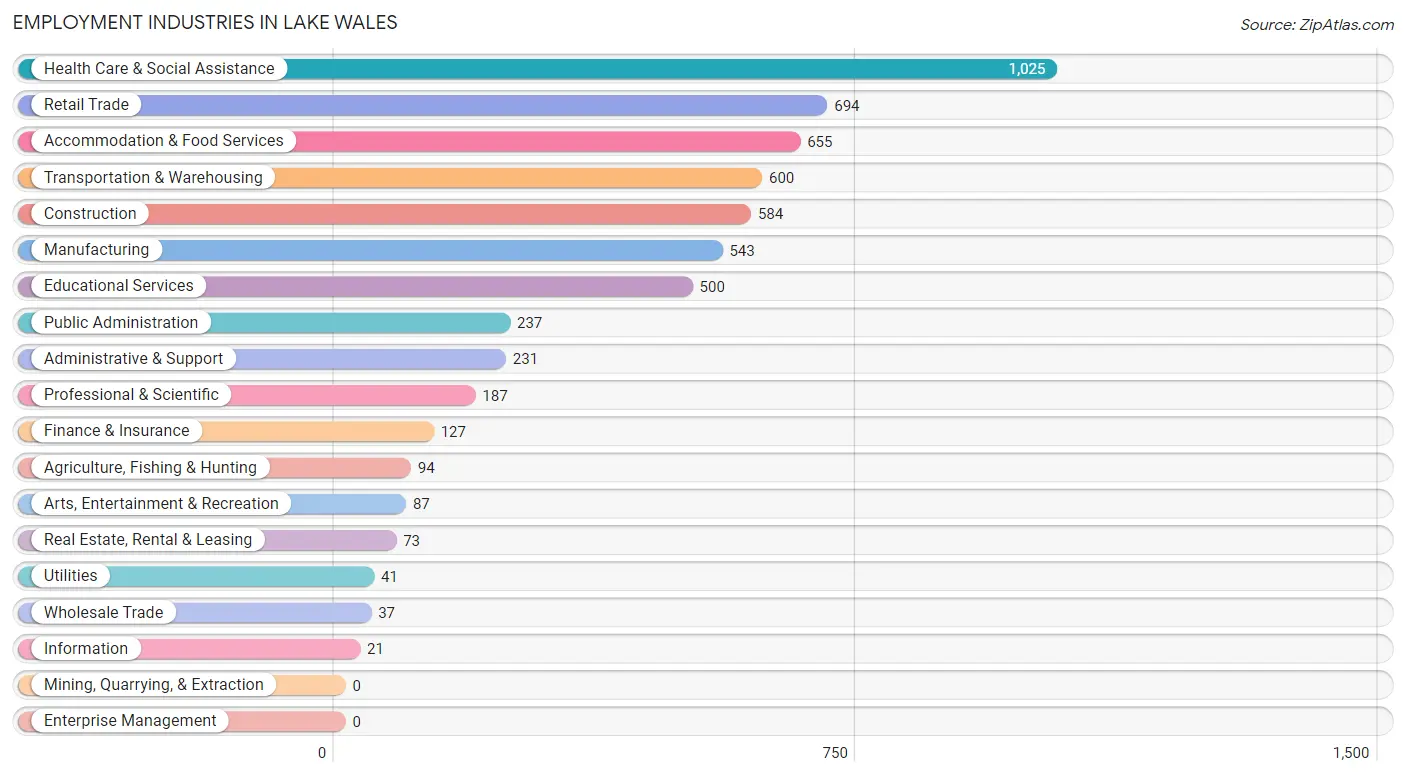
Employment Industries in Lake Wales
The major employment industries in Lake Wales include Health Care & Social Assistance (1,025 | 16.7%), Retail Trade (694 | 11.3%), Accommodation & Food Services (655 | 10.7%), Transportation & Warehousing (600 | 9.8%), and Construction (584 | 9.5%).
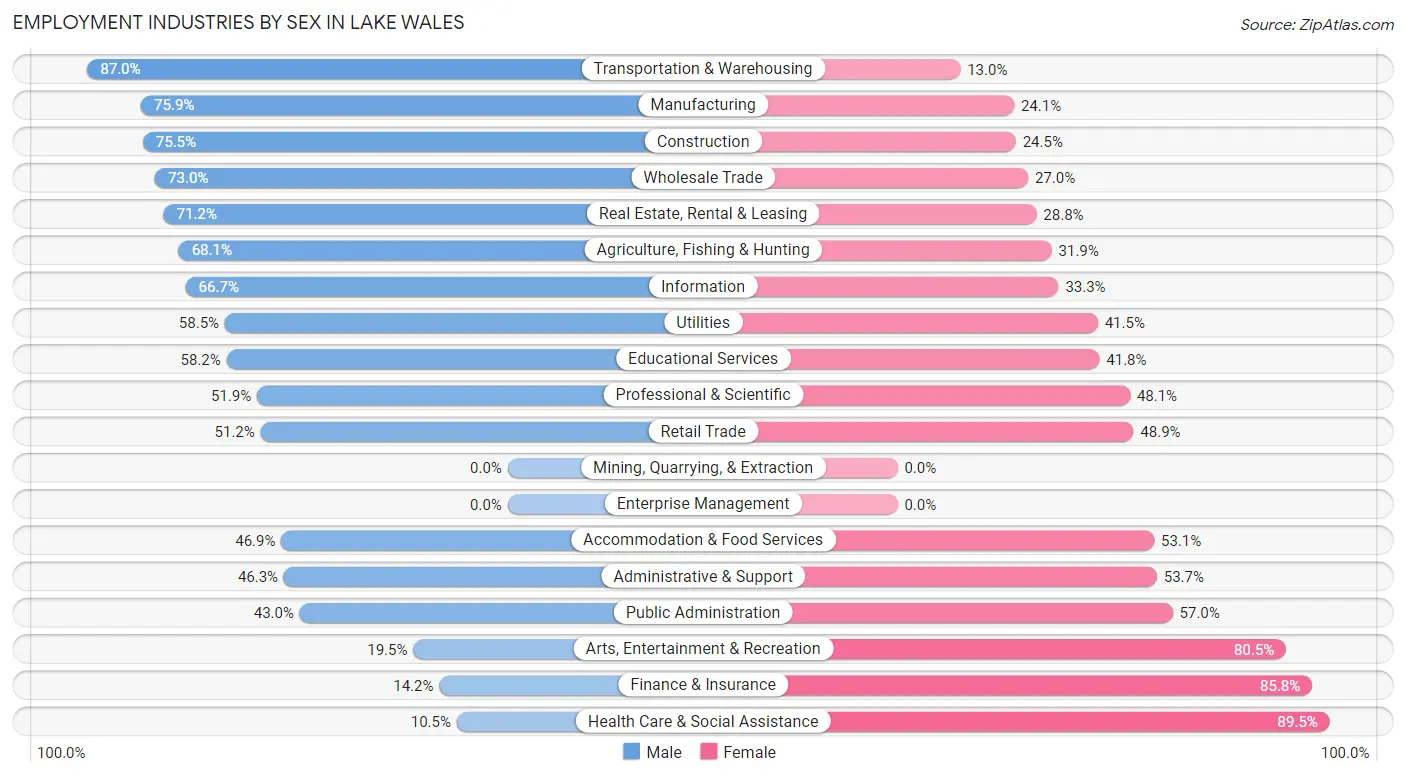
Employment Industries by Sex in Lake Wales
The Lake Wales industries that see more men than women are Transportation & Warehousing (87.0%), Manufacturing (75.9%), and Construction (75.5%), whereas the industries that tend to have a higher number of women are Health Care & Social Assistance (89.5%), Finance & Insurance (85.8%), and Arts, Entertainment & Recreation (80.5%).
| Industry | Male | Female |
| Agriculture, Fishing & Hunting | 64 (68.1%) | 30 (31.9%) |
| Mining, Quarrying, & Extraction | 0 (0.0%) | 0 (0.0%) |
| Construction | 441 (75.5%) | 143 (24.5%) |
| Manufacturing | 412 (75.9%) | 131 (24.1%) |
| Wholesale Trade | 27 (73.0%) | 10 (27.0%) |
| Retail Trade | 355 (51.1%) | 339 (48.8%) |
| Transportation & Warehousing | 522 (87.0%) | 78 (13.0%) |
| Utilities | 24 (58.5%) | 17 (41.5%) |
| Information | 14 (66.7%) | 7 (33.3%) |
| Finance & Insurance | 18 (14.2%) | 109 (85.8%) |
| Real Estate, Rental & Leasing | 52 (71.2%) | 21 (28.8%) |
| Professional & Scientific | 97 (51.9%) | 90 (48.1%) |
| Enterprise Management | 0 (0.0%) | 0 (0.0%) |
| Administrative & Support | 107 (46.3%) | 124 (53.7%) |
| Educational Services | 291 (58.2%) | 209 (41.8%) |
| Health Care & Social Assistance | 108 (10.5%) | 917 (89.5%) |
| Arts, Entertainment & Recreation | 17 (19.5%) | 70 (80.5%) |
| Accommodation & Food Services | 307 (46.9%) | 348 (53.1%) |
| Public Administration | 102 (43.0%) | 135 (57.0%) |
| Total | 3,123 (51.0%) | 3,003 (49.0%) |
Education in Lake Wales
School Enrollment in Lake Wales
The most common levels of schooling among the 3,273 students in Lake Wales are elementary school (794 | 24.3%), high school (717 | 21.9%), and middle school (711 | 21.7%).
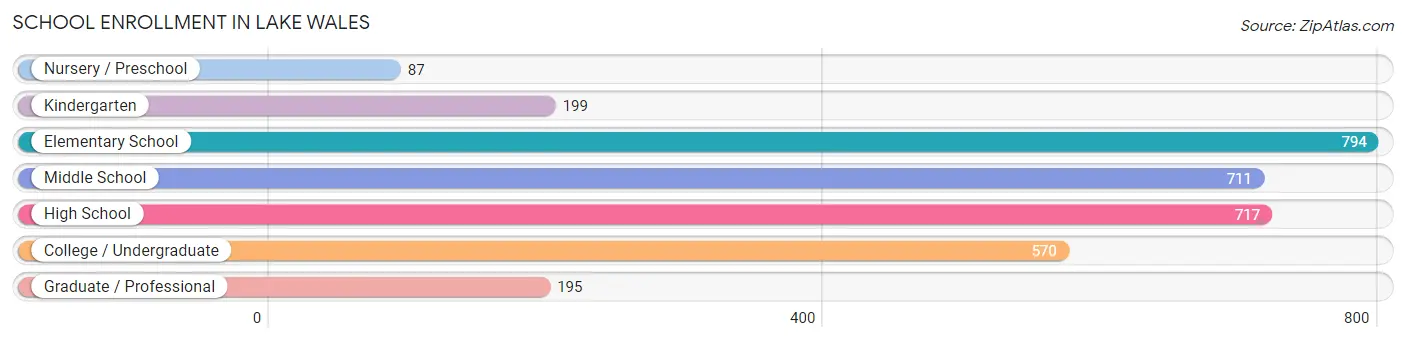
| School Level | # Students | % Students |
| Nursery / Preschool | 87 | 2.7% |
| Kindergarten | 199 | 6.1% |
| Elementary School | 794 | 24.3% |
| Middle School | 711 | 21.7% |
| High School | 717 | 21.9% |
| College / Undergraduate | 570 | 17.4% |
| Graduate / Professional | 195 | 6.0% |
| Total | 3,273 | 100.0% |
School Enrollment by Age by Funding Source in Lake Wales
Out of a total of 3,273 students who are enrolled in schools in Lake Wales, 468 (14.3%) attend a private institution, while the remaining 2,805 (85.7%) are enrolled in public schools. The age group of 18 to 19 year olds has the highest likelihood of being enrolled in private schools, with 71 (34.3% in the age bracket) enrolled. Conversely, the age group of 10 to 14 year olds has the lowest likelihood of being enrolled in a private school, with 792 (92.7% in the age bracket) attending a public institution.
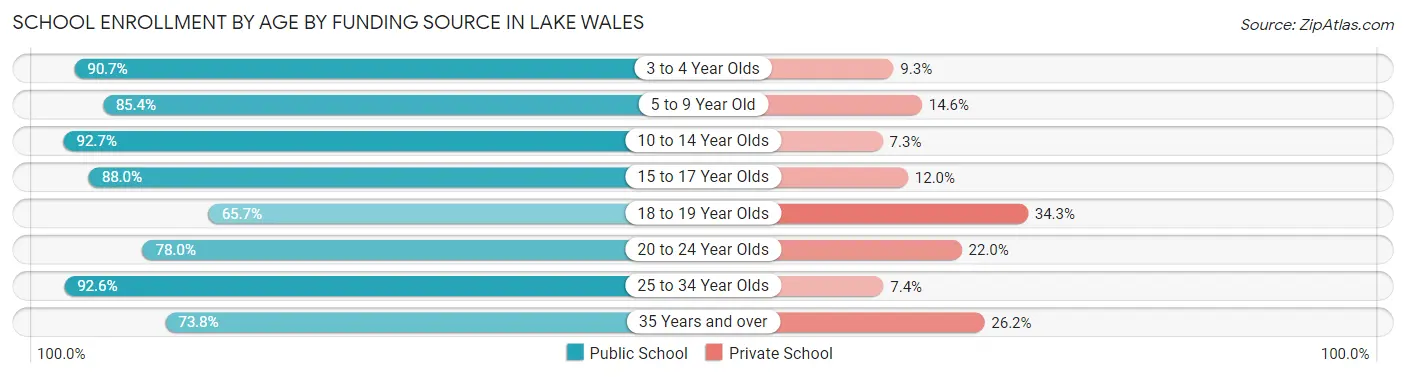
| Age Bracket | Public School | Private School |
| 3 to 4 Year Olds | 49 (90.7%) | 5 (9.3%) |
| 5 to 9 Year Old | 833 (85.4%) | 142 (14.6%) |
| 10 to 14 Year Olds | 792 (92.7%) | 62 (7.3%) |
| 15 to 17 Year Olds | 427 (88.0%) | 58 (12.0%) |
| 18 to 19 Year Olds | 136 (65.7%) | 71 (34.3%) |
| 20 to 24 Year Olds | 103 (78.0%) | 29 (22.0%) |
| 25 to 34 Year Olds | 238 (92.6%) | 19 (7.4%) |
| 35 Years and over | 228 (73.8%) | 81 (26.2%) |
| Total | 2,805 (85.7%) | 468 (14.3%) |
Educational Attainment by Field of Study in Lake Wales
Business (592 | 19.3%), science & technology (526 | 17.2%), education (494 | 16.1%), arts & humanities (319 | 10.4%), and liberal arts & history (253 | 8.3%) are the most common fields of study among 3,062 individuals in Lake Wales who have obtained a bachelor's degree or higher.
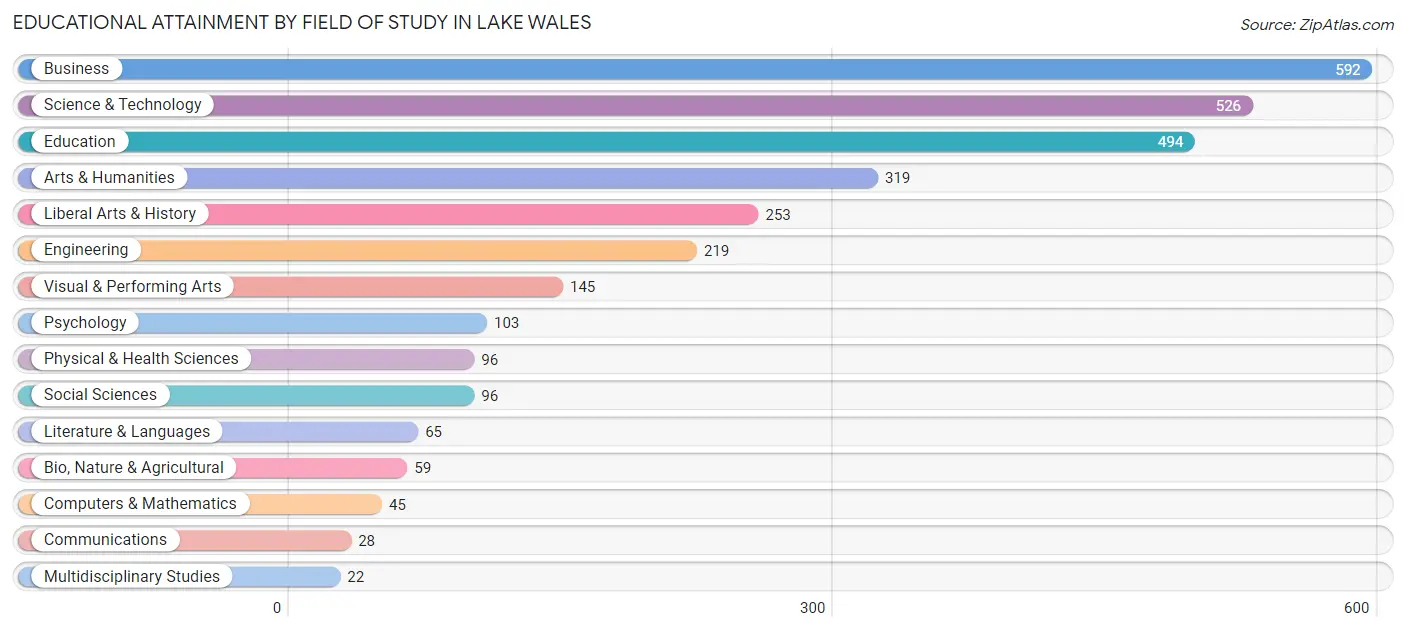
| Field of Study | # Graduates | % Graduates |
| Computers & Mathematics | 45 | 1.5% |
| Bio, Nature & Agricultural | 59 | 1.9% |
| Physical & Health Sciences | 96 | 3.1% |
| Psychology | 103 | 3.4% |
| Social Sciences | 96 | 3.1% |
| Engineering | 219 | 7.1% |
| Multidisciplinary Studies | 22 | 0.7% |
| Science & Technology | 526 | 17.2% |
| Business | 592 | 19.3% |
| Education | 494 | 16.1% |
| Literature & Languages | 65 | 2.1% |
| Liberal Arts & History | 253 | 8.3% |
| Visual & Performing Arts | 145 | 4.7% |
| Communications | 28 | 0.9% |
| Arts & Humanities | 319 | 10.4% |
| Total | 3,062 | 100.0% |
Transportation & Commute in Lake Wales
Vehicle Availability by Sex in Lake Wales
The most prevalent vehicle ownership categories in Lake Wales are males with 2 vehicles (1,299, accounting for 42.2%) and females with 2 vehicles (1,149, making up 44.6%).
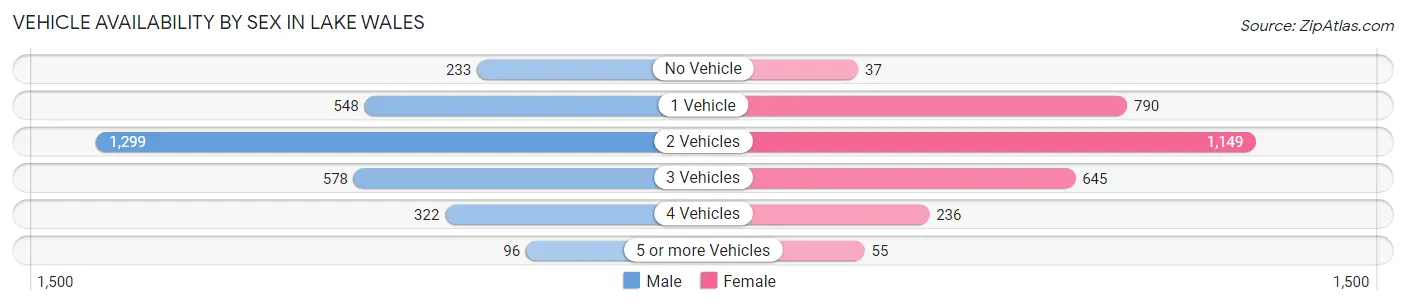
| Vehicles Available | Male | Female |
| No Vehicle | 233 (7.6%) | 37 (1.3%) |
| 1 Vehicle | 548 (17.8%) | 790 (27.1%) |
| 2 Vehicles | 1,299 (42.2%) | 1,149 (39.5%) |
| 3 Vehicles | 578 (18.8%) | 645 (22.2%) |
| 4 Vehicles | 322 (10.5%) | 236 (8.1%) |
| 5 or more Vehicles | 96 (3.1%) | 55 (1.9%) |
| Total | 3,076 (100.0%) | 2,912 (100.0%) |
Commute Time in Lake Wales
The most frequently occuring commute durations in Lake Wales are 30 to 34 minutes (967 commuters, 16.8%), 15 to 19 minutes (928 commuters, 16.2%), and 10 to 14 minutes (912 commuters, 15.9%).
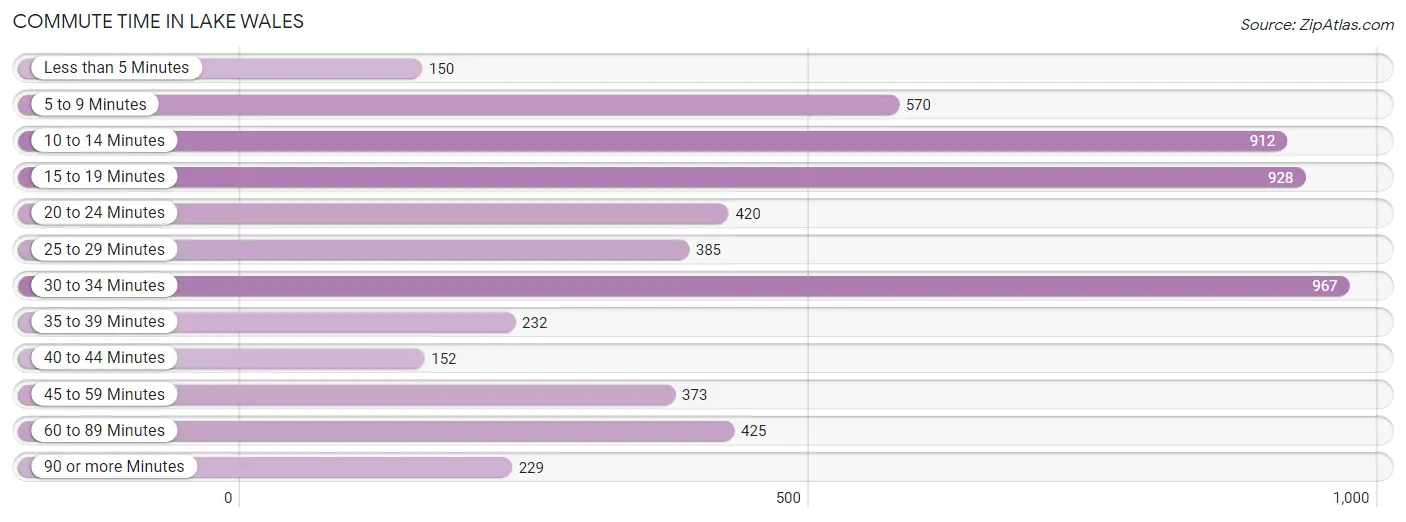
| Commute Time | # Commuters | % Commuters |
| Less than 5 Minutes | 150 | 2.6% |
| 5 to 9 Minutes | 570 | 9.9% |
| 10 to 14 Minutes | 912 | 15.9% |
| 15 to 19 Minutes | 928 | 16.2% |
| 20 to 24 Minutes | 420 | 7.3% |
| 25 to 29 Minutes | 385 | 6.7% |
| 30 to 34 Minutes | 967 | 16.8% |
| 35 to 39 Minutes | 232 | 4.0% |
| 40 to 44 Minutes | 152 | 2.6% |
| 45 to 59 Minutes | 373 | 6.5% |
| 60 to 89 Minutes | 425 | 7.4% |
| 90 or more Minutes | 229 | 4.0% |
Commute Time by Sex in Lake Wales
The most common commute times in Lake Wales are 30 to 34 minutes (623 commuters, 20.3%) for males and 10 to 14 minutes (520 commuters, 19.4%) for females.
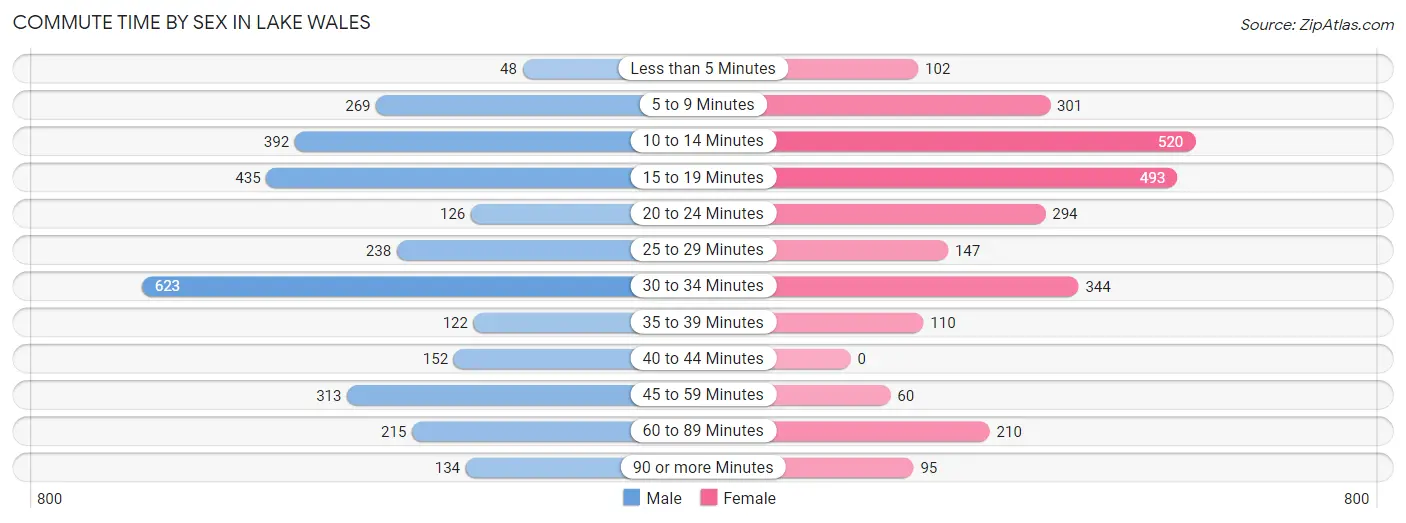
| Commute Time | Male | Female |
| Less than 5 Minutes | 48 (1.6%) | 102 (3.8%) |
| 5 to 9 Minutes | 269 (8.8%) | 301 (11.3%) |
| 10 to 14 Minutes | 392 (12.8%) | 520 (19.4%) |
| 15 to 19 Minutes | 435 (14.2%) | 493 (18.4%) |
| 20 to 24 Minutes | 126 (4.1%) | 294 (11.0%) |
| 25 to 29 Minutes | 238 (7.8%) | 147 (5.5%) |
| 30 to 34 Minutes | 623 (20.3%) | 344 (12.9%) |
| 35 to 39 Minutes | 122 (4.0%) | 110 (4.1%) |
| 40 to 44 Minutes | 152 (5.0%) | 0 (0.0%) |
| 45 to 59 Minutes | 313 (10.2%) | 60 (2.2%) |
| 60 to 89 Minutes | 215 (7.0%) | 210 (7.9%) |
| 90 or more Minutes | 134 (4.4%) | 95 (3.5%) |
Time of Departure to Work by Sex in Lake Wales
The most frequent times of departure to work in Lake Wales are 5:00 AM to 5:29 AM (542, 17.7%) for males and 7:00 AM to 7:29 AM (751, 28.1%) for females.
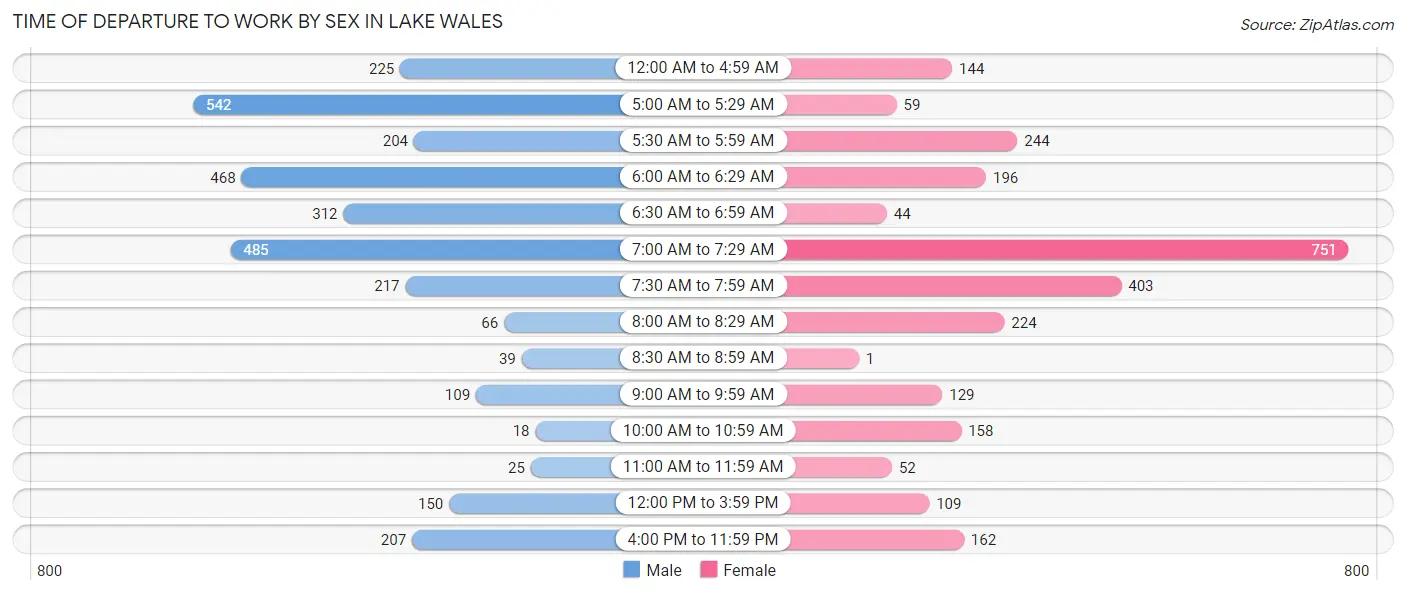
| Time of Departure | Male | Female |
| 12:00 AM to 4:59 AM | 225 (7.3%) | 144 (5.4%) |
| 5:00 AM to 5:29 AM | 542 (17.7%) | 59 (2.2%) |
| 5:30 AM to 5:59 AM | 204 (6.7%) | 244 (9.1%) |
| 6:00 AM to 6:29 AM | 468 (15.3%) | 196 (7.3%) |
| 6:30 AM to 6:59 AM | 312 (10.2%) | 44 (1.6%) |
| 7:00 AM to 7:29 AM | 485 (15.8%) | 751 (28.1%) |
| 7:30 AM to 7:59 AM | 217 (7.1%) | 403 (15.1%) |
| 8:00 AM to 8:29 AM | 66 (2.1%) | 224 (8.4%) |
| 8:30 AM to 8:59 AM | 39 (1.3%) | 1 (0.0%) |
| 9:00 AM to 9:59 AM | 109 (3.5%) | 129 (4.8%) |
| 10:00 AM to 10:59 AM | 18 (0.6%) | 158 (5.9%) |
| 11:00 AM to 11:59 AM | 25 (0.8%) | 52 (1.9%) |
| 12:00 PM to 3:59 PM | 150 (4.9%) | 109 (4.1%) |
| 4:00 PM to 11:59 PM | 207 (6.8%) | 162 (6.0%) |
| Total | 3,067 (100.0%) | 2,676 (100.0%) |
Housing Occupancy in Lake Wales
Occupancy by Ownership in Lake Wales
Of the total 6,734 dwellings in Lake Wales, owner-occupied units account for 4,024 (59.8%), while renter-occupied units make up 2,710 (40.2%).
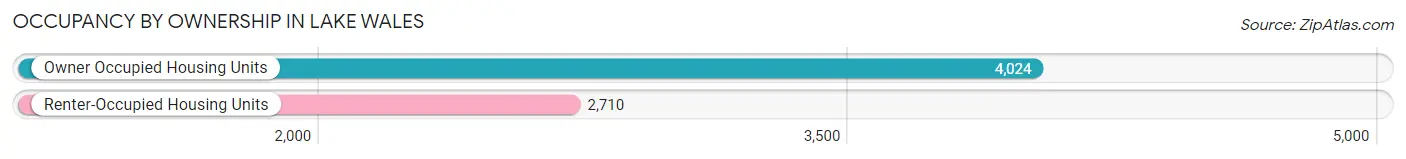
| Occupancy | # Housing Units | % Housing Units |
| Owner Occupied Housing Units | 4,024 | 59.8% |
| Renter-Occupied Housing Units | 2,710 | 40.2% |
| Total Occupied Housing Units | 6,734 | 100.0% |
Occupancy by Household Size in Lake Wales
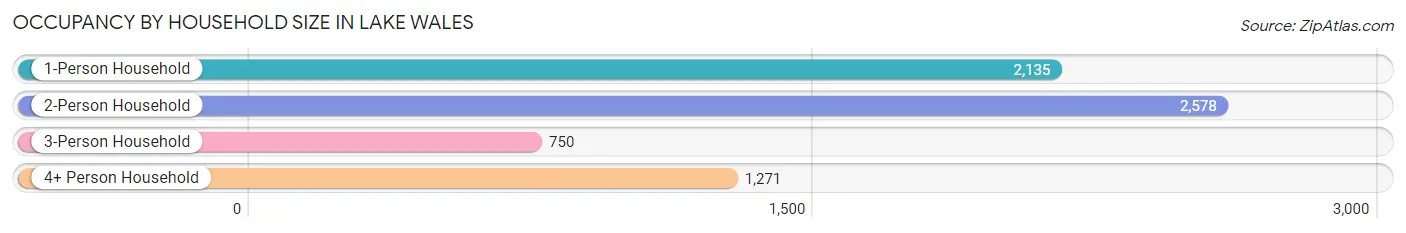
| Household Size | # Housing Units | % Housing Units |
| 1-Person Household | 2,135 | 31.7% |
| 2-Person Household | 2,578 | 38.3% |
| 3-Person Household | 750 | 11.1% |
| 4+ Person Household | 1,271 | 18.9% |
| Total Housing Units | 6,734 | 100.0% |
Occupancy by Ownership by Household Size in Lake Wales
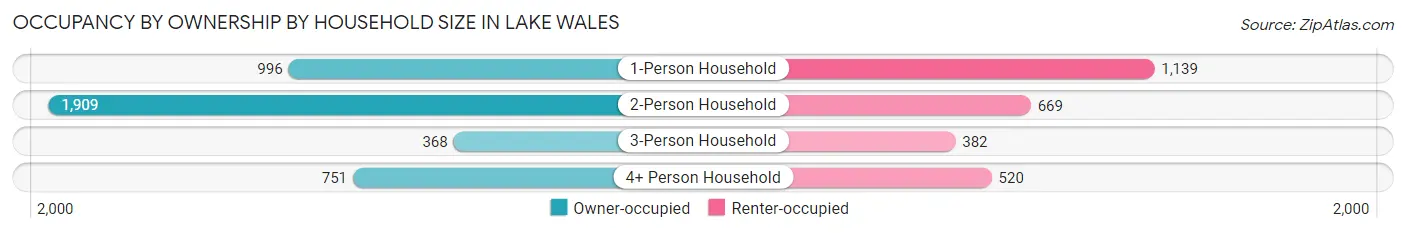
| Household Size | Owner-occupied | Renter-occupied |
| 1-Person Household | 996 (46.7%) | 1,139 (53.3%) |
| 2-Person Household | 1,909 (74.1%) | 669 (26.0%) |
| 3-Person Household | 368 (49.1%) | 382 (50.9%) |
| 4+ Person Household | 751 (59.1%) | 520 (40.9%) |
| Total Housing Units | 4,024 (59.8%) | 2,710 (40.2%) |
Occupancy by Educational Attainment in Lake Wales
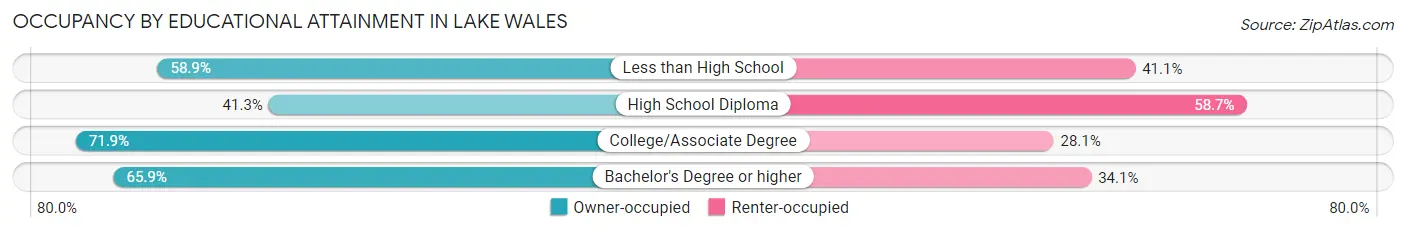
| Household Size | Owner-occupied | Renter-occupied |
| Less than High School | 476 (58.9%) | 332 (41.1%) |
| High School Diploma | 818 (41.3%) | 1,163 (58.7%) |
| College/Associate Degree | 1,573 (71.9%) | 616 (28.1%) |
| Bachelor's Degree or higher | 1,157 (65.9%) | 599 (34.1%) |
Occupancy by Age of Householder in Lake Wales
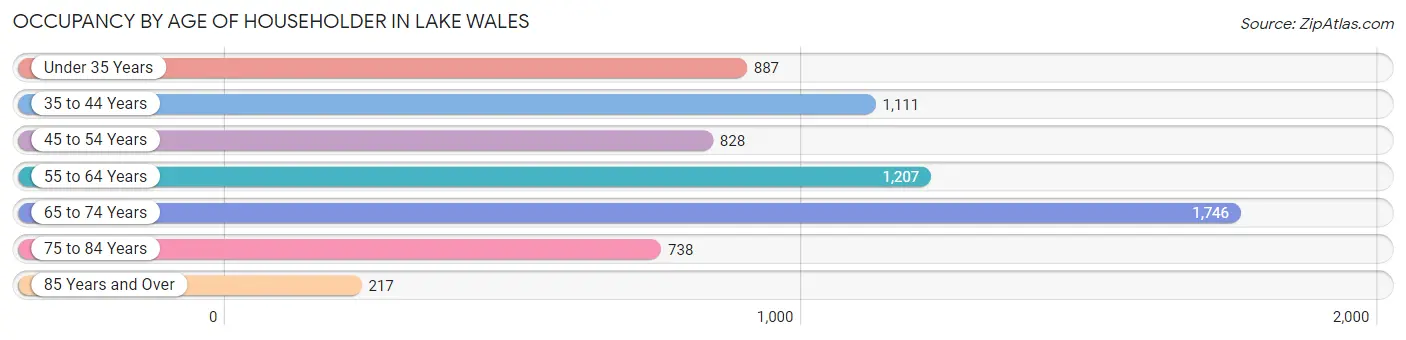
| Age Bracket | # Households | % Households |
| Under 35 Years | 887 | 13.2% |
| 35 to 44 Years | 1,111 | 16.5% |
| 45 to 54 Years | 828 | 12.3% |
| 55 to 64 Years | 1,207 | 17.9% |
| 65 to 74 Years | 1,746 | 25.9% |
| 75 to 84 Years | 738 | 11.0% |
| 85 Years and Over | 217 | 3.2% |
| Total | 6,734 | 100.0% |
Housing Finances in Lake Wales
Median Income by Occupancy in Lake Wales
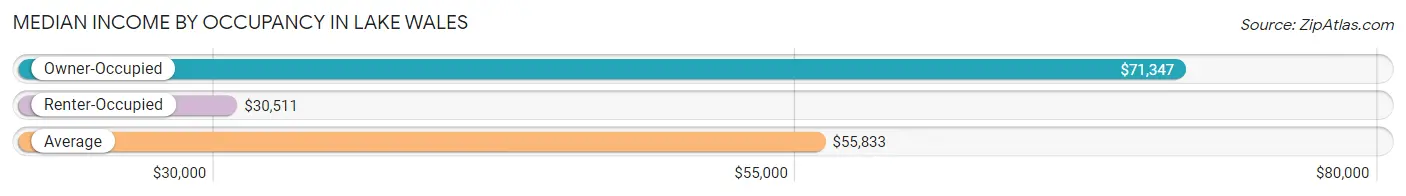
| Occupancy Type | # Households | Median Income |
| Owner-Occupied | 4,024 (59.8%) | $71,347 |
| Renter-Occupied | 2,710 (40.2%) | $30,511 |
| Average | 6,734 (100.0%) | $55,833 |
Occupancy by Householder Income Bracket in Lake Wales
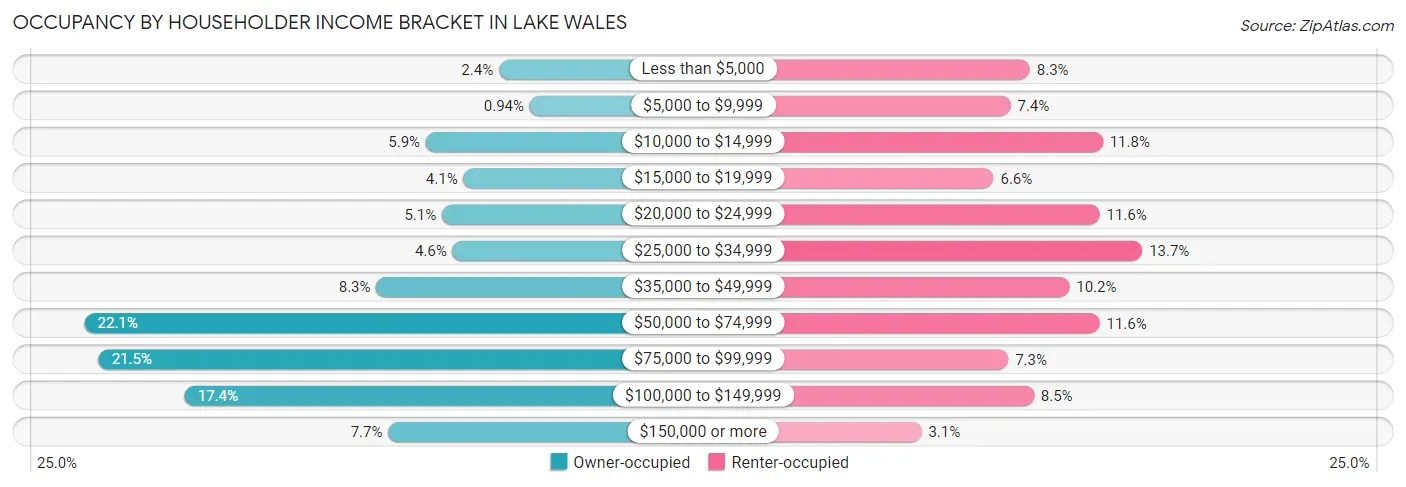
| Income Bracket | Owner-occupied | Renter-occupied |
| Less than $5,000 | 97 (2.4%) | 225 (8.3%) |
| $5,000 to $9,999 | 38 (0.9%) | 200 (7.4%) |
| $10,000 to $14,999 | 237 (5.9%) | 319 (11.8%) |
| $15,000 to $19,999 | 165 (4.1%) | 178 (6.6%) |
| $20,000 to $24,999 | 206 (5.1%) | 315 (11.6%) |
| $25,000 to $34,999 | 186 (4.6%) | 370 (13.7%) |
| $35,000 to $49,999 | 332 (8.3%) | 276 (10.2%) |
| $50,000 to $74,999 | 891 (22.1%) | 315 (11.6%) |
| $75,000 to $99,999 | 864 (21.5%) | 197 (7.3%) |
| $100,000 to $149,999 | 699 (17.4%) | 230 (8.5%) |
| $150,000 or more | 309 (7.7%) | 85 (3.1%) |
| Total | 4,024 (100.0%) | 2,710 (100.0%) |
Monthly Housing Cost Tiers in Lake Wales
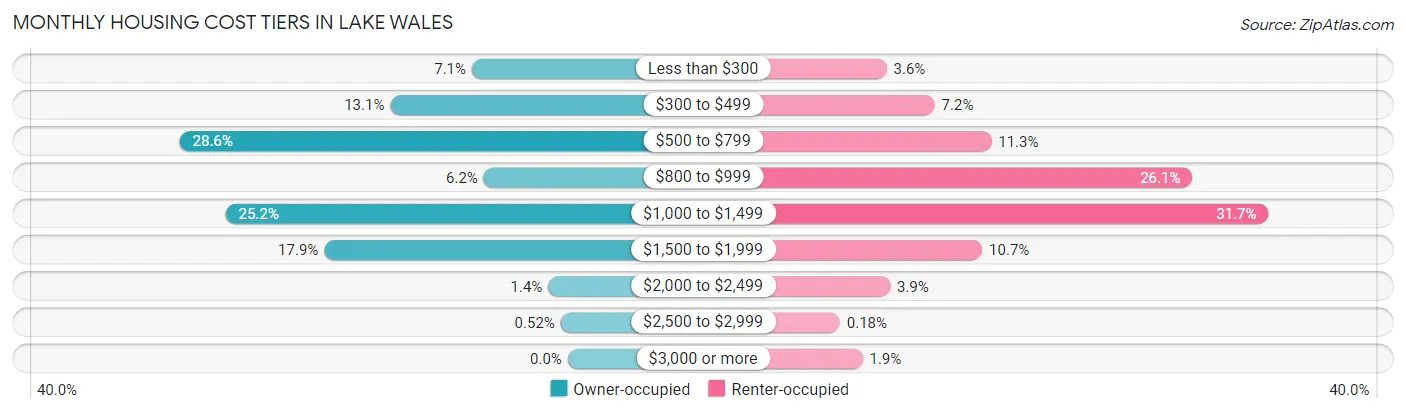
| Monthly Cost | Owner-occupied | Renter-occupied |
| Less than $300 | 284 (7.1%) | 98 (3.6%) |
| $300 to $499 | 526 (13.1%) | 194 (7.2%) |
| $500 to $799 | 1,150 (28.6%) | 307 (11.3%) |
| $800 to $999 | 249 (6.2%) | 708 (26.1%) |
| $1,000 to $1,499 | 1,014 (25.2%) | 860 (31.7%) |
| $1,500 to $1,999 | 722 (17.9%) | 289 (10.7%) |
| $2,000 to $2,499 | 58 (1.4%) | 105 (3.9%) |
| $2,500 to $2,999 | 21 (0.5%) | 5 (0.2%) |
| $3,000 or more | 0 (0.0%) | 50 (1.8%) |
| Total | 4,024 (100.0%) | 2,710 (100.0%) |
Physical Housing Characteristics in Lake Wales
Housing Structures in Lake Wales
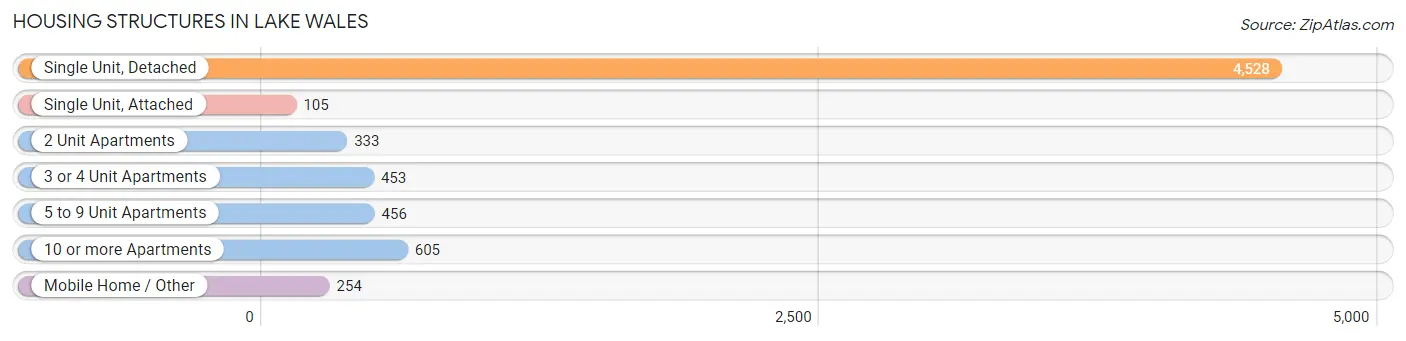
| Structure Type | # Housing Units | % Housing Units |
| Single Unit, Detached | 4,528 | 67.2% |
| Single Unit, Attached | 105 | 1.6% |
| 2 Unit Apartments | 333 | 5.0% |
| 3 or 4 Unit Apartments | 453 | 6.7% |
| 5 to 9 Unit Apartments | 456 | 6.8% |
| 10 or more Apartments | 605 | 9.0% |
| Mobile Home / Other | 254 | 3.8% |
| Total | 6,734 | 100.0% |
Housing Structures by Occupancy in Lake Wales
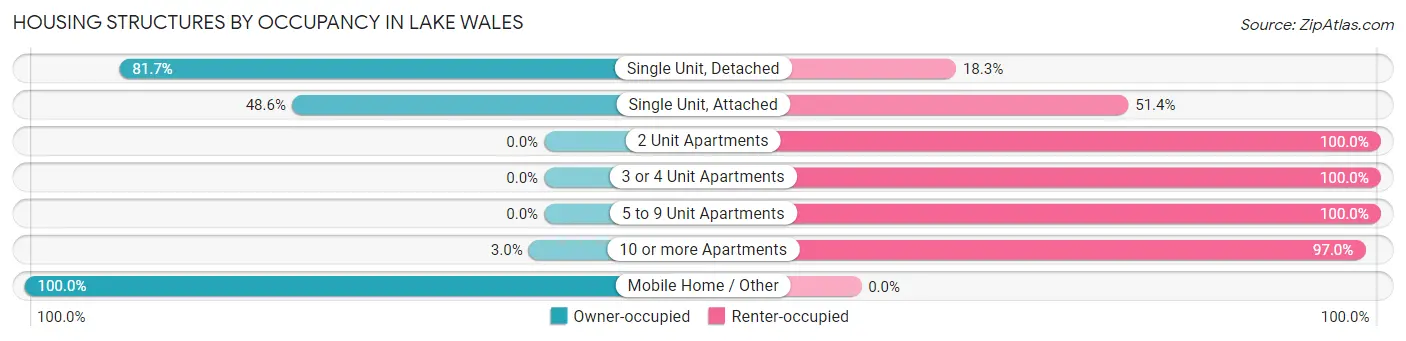
| Structure Type | Owner-occupied | Renter-occupied |
| Single Unit, Detached | 3,701 (81.7%) | 827 (18.3%) |
| Single Unit, Attached | 51 (48.6%) | 54 (51.4%) |
| 2 Unit Apartments | 0 (0.0%) | 333 (100.0%) |
| 3 or 4 Unit Apartments | 0 (0.0%) | 453 (100.0%) |
| 5 to 9 Unit Apartments | 0 (0.0%) | 456 (100.0%) |
| 10 or more Apartments | 18 (3.0%) | 587 (97.0%) |
| Mobile Home / Other | 254 (100.0%) | 0 (0.0%) |
| Total | 4,024 (59.8%) | 2,710 (40.2%) |
Housing Structures by Number of Rooms in Lake Wales
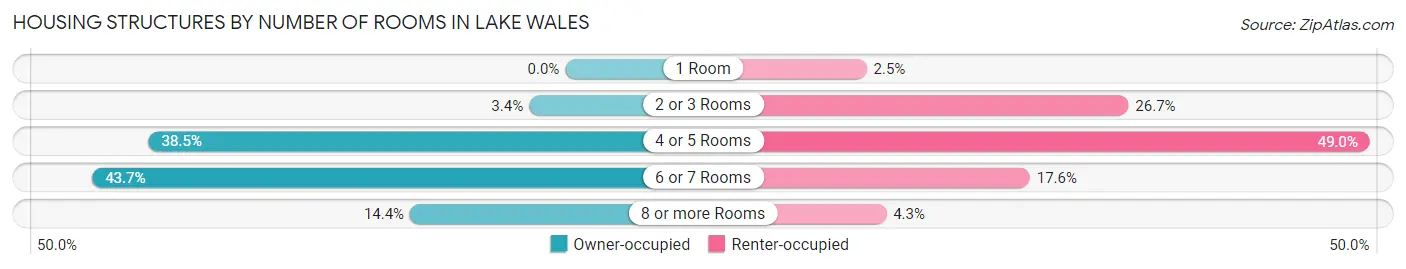
| Number of Rooms | Owner-occupied | Renter-occupied |
| 1 Room | 0 (0.0%) | 67 (2.5%) |
| 2 or 3 Rooms | 135 (3.4%) | 723 (26.7%) |
| 4 or 5 Rooms | 1,551 (38.5%) | 1,328 (49.0%) |
| 6 or 7 Rooms | 1,760 (43.7%) | 476 (17.6%) |
| 8 or more Rooms | 578 (14.4%) | 116 (4.3%) |
| Total | 4,024 (100.0%) | 2,710 (100.0%) |
Housing Structure by Heating Type in Lake Wales
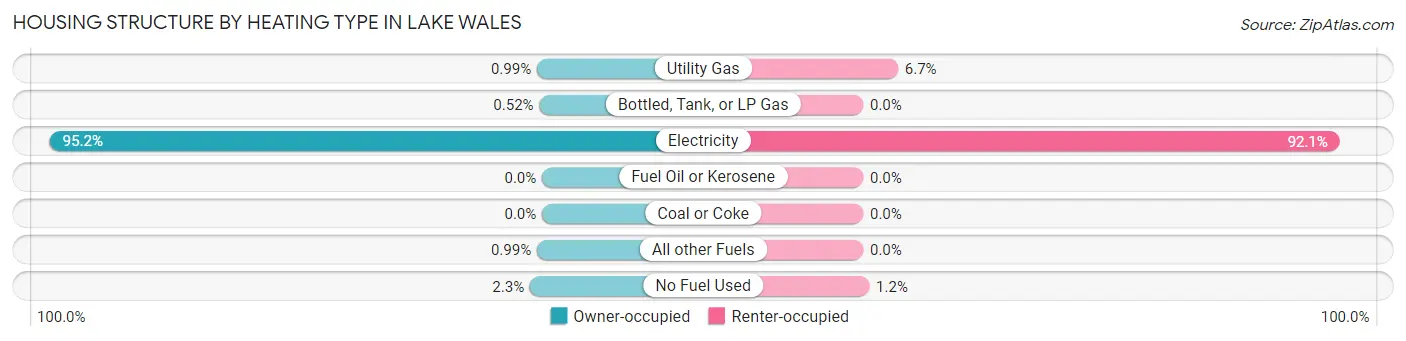
| Heating Type | Owner-occupied | Renter-occupied |
| Utility Gas | 40 (1.0%) | 182 (6.7%) |
| Bottled, Tank, or LP Gas | 21 (0.5%) | 0 (0.0%) |
| Electricity | 3,829 (95.2%) | 2,496 (92.1%) |
| Fuel Oil or Kerosene | 0 (0.0%) | 0 (0.0%) |
| Coal or Coke | 0 (0.0%) | 0 (0.0%) |
| All other Fuels | 40 (1.0%) | 0 (0.0%) |
| No Fuel Used | 94 (2.3%) | 32 (1.2%) |
| Total | 4,024 (100.0%) | 2,710 (100.0%) |
Household Vehicle Usage in Lake Wales
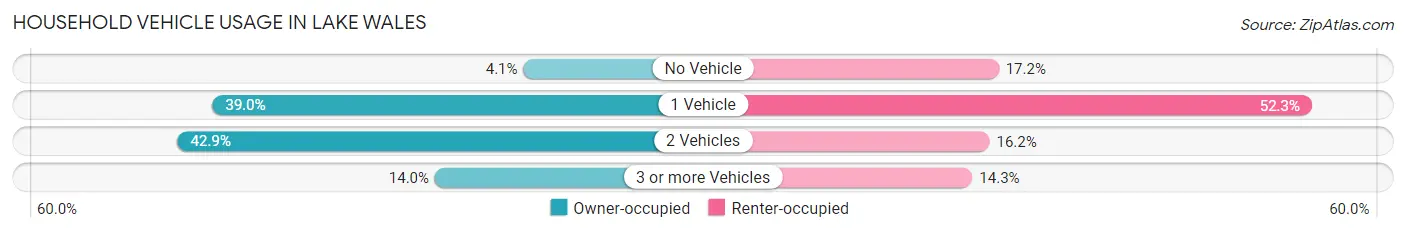
| Vehicles per Household | Owner-occupied | Renter-occupied |
| No Vehicle | 166 (4.1%) | 467 (17.2%) |
| 1 Vehicle | 1,568 (39.0%) | 1,417 (52.3%) |
| 2 Vehicles | 1,725 (42.9%) | 439 (16.2%) |
| 3 or more Vehicles | 565 (14.0%) | 387 (14.3%) |
| Total | 4,024 (100.0%) | 2,710 (100.0%) |
Real Estate & Mortgages in Lake Wales
Real Estate and Mortgage Overview in Lake Wales
| Characteristic | Without Mortgage | With Mortgage |
| Housing Units | 2,024 | 2,000 |
| Median Property Value | $204,300 | $211,400 |
| Median Household Income | $66,642 | $181 |
| Monthly Housing Costs | $545 | $0 |
| Real Estate Taxes | $1,855 | $70 |
Property Value by Mortgage Status in Lake Wales
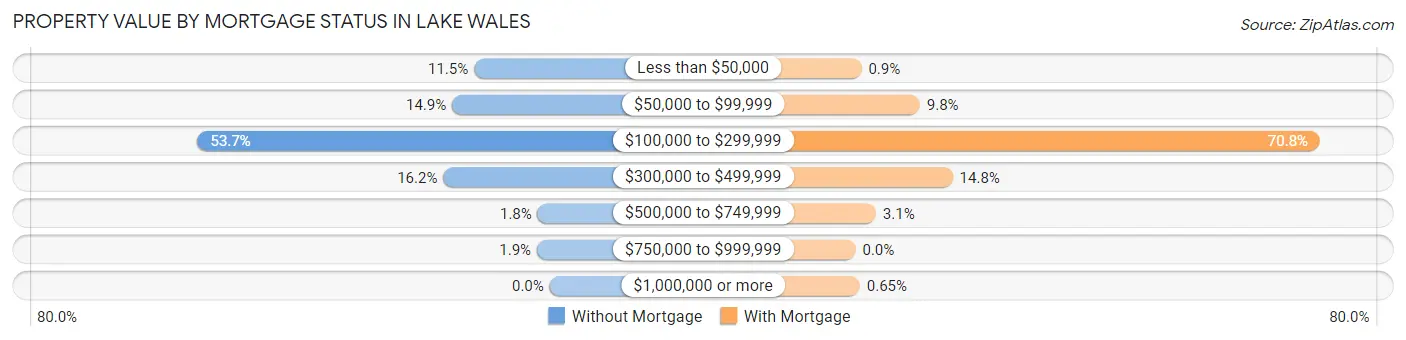
| Property Value | Without Mortgage | With Mortgage |
| Less than $50,000 | 233 (11.5%) | 18 (0.9%) |
| $50,000 to $99,999 | 301 (14.9%) | 196 (9.8%) |
| $100,000 to $299,999 | 1,086 (53.7%) | 1,415 (70.8%) |
| $300,000 to $499,999 | 328 (16.2%) | 296 (14.8%) |
| $500,000 to $749,999 | 37 (1.8%) | 62 (3.1%) |
| $750,000 to $999,999 | 39 (1.9%) | 0 (0.0%) |
| $1,000,000 or more | 0 (0.0%) | 13 (0.6%) |
| Total | 2,024 (100.0%) | 2,000 (100.0%) |
Household Income by Mortgage Status in Lake Wales
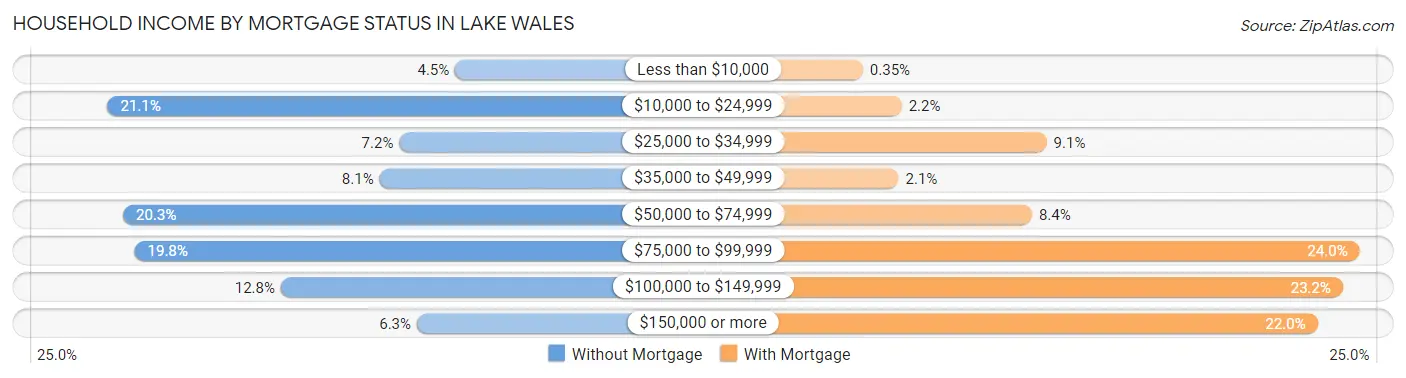
| Household Income | Without Mortgage | With Mortgage |
| Less than $10,000 | 91 (4.5%) | 7 (0.4%) |
| $10,000 to $24,999 | 426 (21.0%) | 44 (2.2%) |
| $25,000 to $34,999 | 145 (7.2%) | 182 (9.1%) |
| $35,000 to $49,999 | 164 (8.1%) | 41 (2.1%) |
| $50,000 to $74,999 | 411 (20.3%) | 168 (8.4%) |
| $75,000 to $99,999 | 400 (19.8%) | 480 (24.0%) |
| $100,000 to $149,999 | 259 (12.8%) | 464 (23.2%) |
| $150,000 or more | 128 (6.3%) | 440 (22.0%) |
| Total | 2,024 (100.0%) | 2,000 (100.0%) |
Property Value to Household Income Ratio in Lake Wales
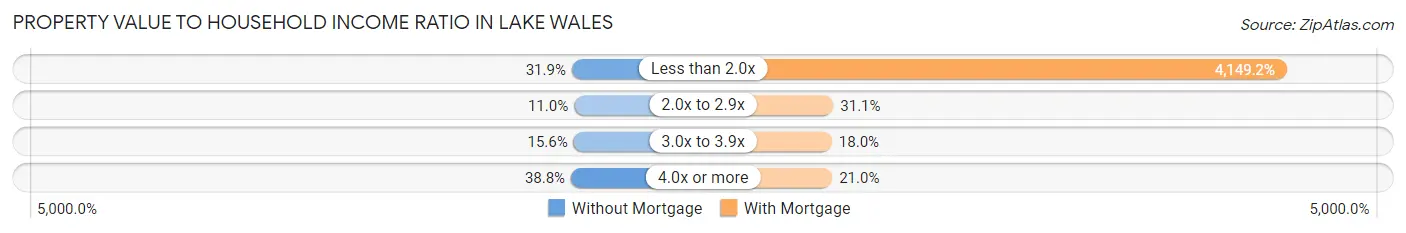
| Value-to-Income Ratio | Without Mortgage | With Mortgage |
| Less than 2.0x | 646 (31.9%) | 82,984 (4,149.2%) |
| 2.0x to 2.9x | 223 (11.0%) | 622 (31.1%) |
| 3.0x to 3.9x | 315 (15.6%) | 359 (17.9%) |
| 4.0x or more | 786 (38.8%) | 420 (21.0%) |
| Total | 2,024 (100.0%) | 2,000 (100.0%) |
Real Estate Taxes by Mortgage Status in Lake Wales
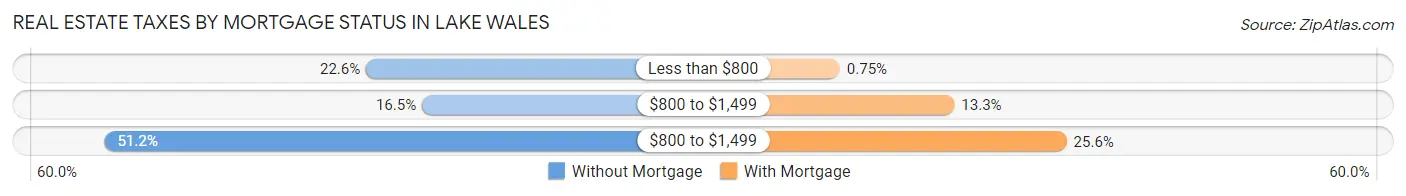
| Property Taxes | Without Mortgage | With Mortgage |
| Less than $800 | 457 (22.6%) | 15 (0.7%) |
| $800 to $1,499 | 333 (16.5%) | 266 (13.3%) |
| $800 to $1,499 | 1,037 (51.2%) | 512 (25.6%) |
| Total | 2,024 (100.0%) | 2,000 (100.0%) |
Health & Disability in Lake Wales
Health Insurance Coverage by Age in Lake Wales
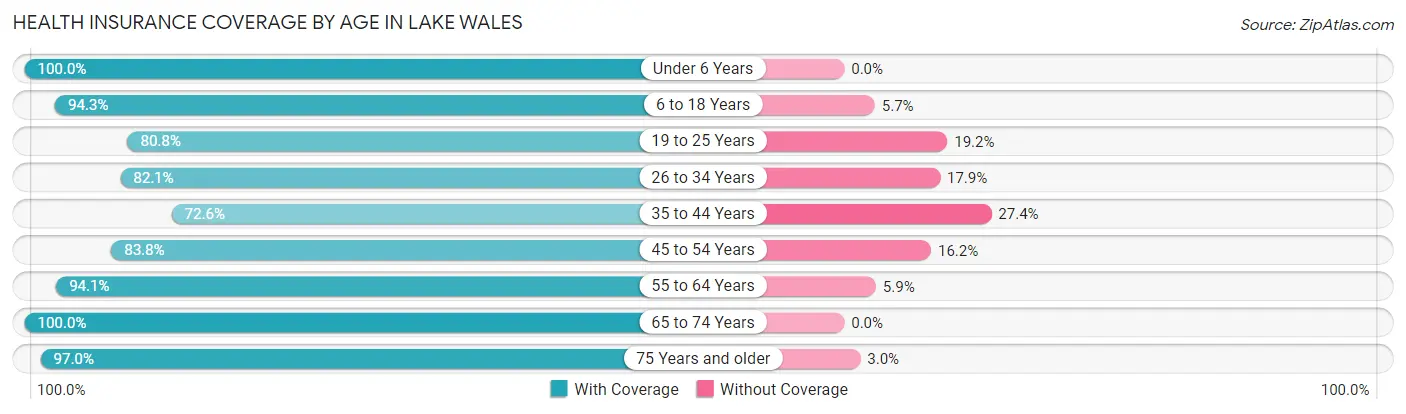
| Age Bracket | With Coverage | Without Coverage |
| Under 6 Years | 949 (100.0%) | 0 (0.0%) |
| 6 to 18 Years | 2,554 (94.3%) | 154 (5.7%) |
| 19 to 25 Years | 841 (80.8%) | 200 (19.2%) |
| 26 to 34 Years | 1,394 (82.1%) | 303 (17.9%) |
| 35 to 44 Years | 1,455 (72.6%) | 550 (27.4%) |
| 45 to 54 Years | 1,259 (83.8%) | 243 (16.2%) |
| 55 to 64 Years | 1,963 (94.1%) | 123 (5.9%) |
| 65 to 74 Years | 2,557 (100.0%) | 0 (0.0%) |
| 75 Years and older | 1,495 (97.0%) | 46 (3.0%) |
| Total | 14,467 (89.9%) | 1,619 (10.1%) |
Health Insurance Coverage by Citizenship Status in Lake Wales
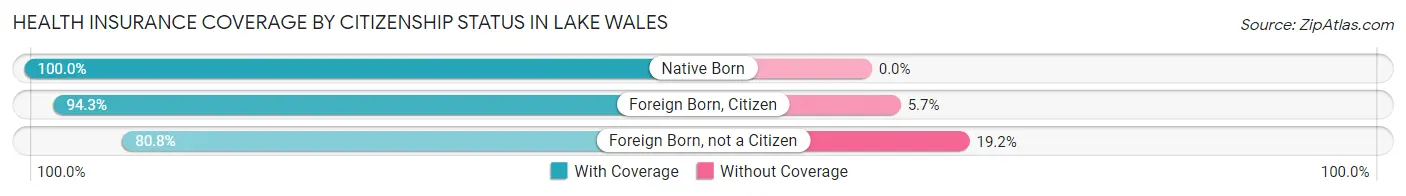
| Citizenship Status | With Coverage | Without Coverage |
| Native Born | 949 (100.0%) | 0 (0.0%) |
| Foreign Born, Citizen | 2,554 (94.3%) | 154 (5.7%) |
| Foreign Born, not a Citizen | 841 (80.8%) | 200 (19.2%) |
Health Insurance Coverage by Household Income in Lake Wales
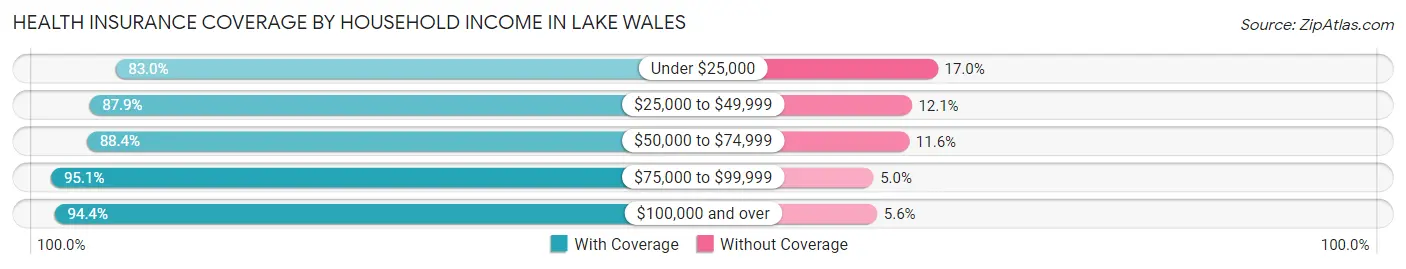
| Household Income | With Coverage | Without Coverage |
| Under $25,000 | 2,709 (83.0%) | 555 (17.0%) |
| $25,000 to $49,999 | 2,293 (87.9%) | 316 (12.1%) |
| $50,000 to $74,999 | 2,566 (88.4%) | 338 (11.6%) |
| $75,000 to $99,999 | 2,514 (95.1%) | 131 (5.0%) |
| $100,000 and over | 4,344 (94.4%) | 259 (5.6%) |
Public vs Private Health Insurance Coverage by Age in Lake Wales
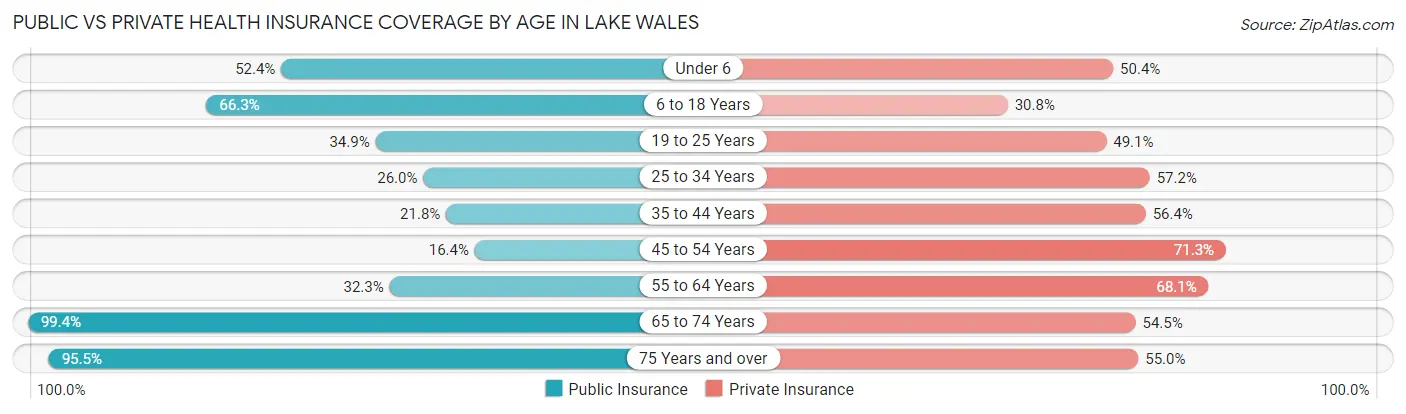
| Age Bracket | Public Insurance | Private Insurance |
| Under 6 | 497 (52.4%) | 478 (50.4%) |
| 6 to 18 Years | 1,794 (66.2%) | 834 (30.8%) |
| 19 to 25 Years | 363 (34.9%) | 511 (49.1%) |
| 25 to 34 Years | 441 (26.0%) | 970 (57.2%) |
| 35 to 44 Years | 436 (21.7%) | 1,131 (56.4%) |
| 45 to 54 Years | 247 (16.4%) | 1,071 (71.3%) |
| 55 to 64 Years | 673 (32.3%) | 1,420 (68.1%) |
| 65 to 74 Years | 2,542 (99.4%) | 1,394 (54.5%) |
| 75 Years and over | 1,472 (95.5%) | 848 (55.0%) |
| Total | 8,465 (52.6%) | 8,657 (53.8%) |
Disability Status by Sex by Age in Lake Wales
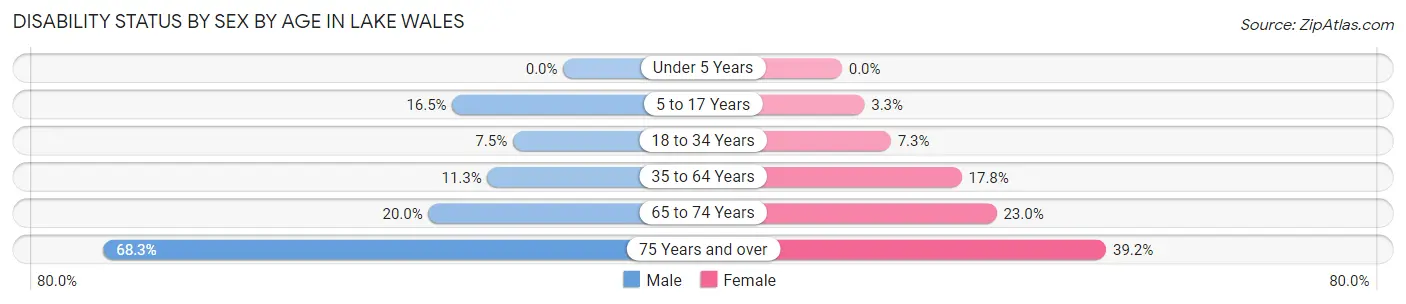
| Age Bracket | Male | Female |
| Under 5 Years | 0 (0.0%) | 0 (0.0%) |
| 5 to 17 Years | 238 (16.5%) | 36 (3.3%) |
| 18 to 34 Years | 121 (7.5%) | 107 (7.3%) |
| 35 to 64 Years | 279 (11.3%) | 554 (17.8%) |
| 65 to 74 Years | 206 (20.0%) | 351 (23.0%) |
| 75 Years and over | 586 (68.3%) | 268 (39.2%) |
Disability Class by Sex by Age in Lake Wales
Disability Class: Hearing Difficulty
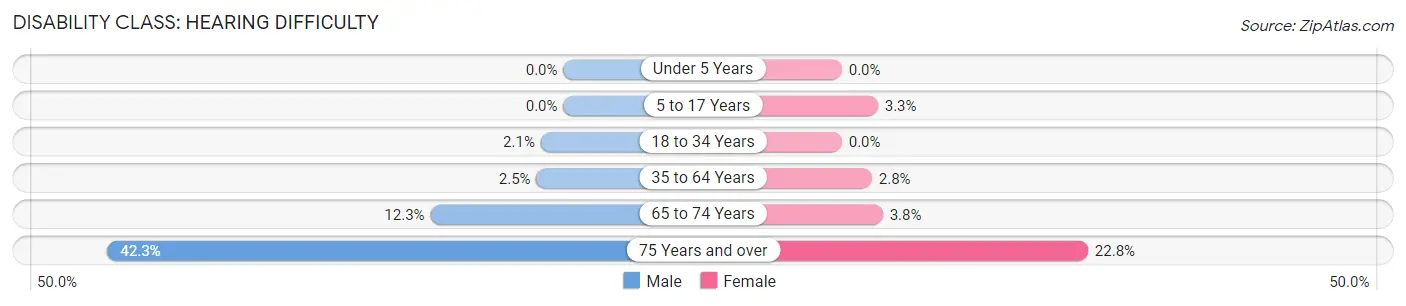
| Age Bracket | Male | Female |
| Under 5 Years | 0 (0.0%) | 0 (0.0%) |
| 5 to 17 Years | 0 (0.0%) | 36 (3.3%) |
| 18 to 34 Years | 34 (2.1%) | 0 (0.0%) |
| 35 to 64 Years | 62 (2.5%) | 87 (2.8%) |
| 65 to 74 Years | 127 (12.3%) | 58 (3.8%) |
| 75 Years and over | 363 (42.3%) | 156 (22.8%) |
Disability Class: Vision Difficulty
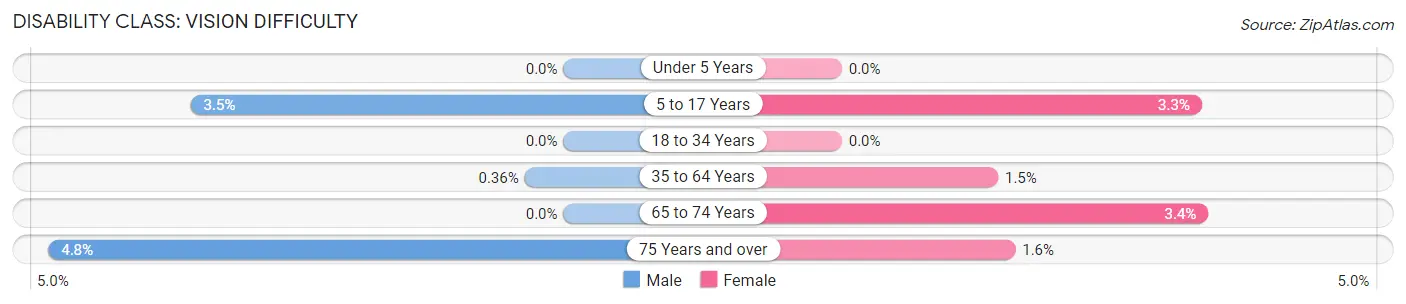
| Age Bracket | Male | Female |
| Under 5 Years | 0 (0.0%) | 0 (0.0%) |
| 5 to 17 Years | 50 (3.5%) | 36 (3.3%) |
| 18 to 34 Years | 0 (0.0%) | 0 (0.0%) |
| 35 to 64 Years | 9 (0.4%) | 45 (1.5%) |
| 65 to 74 Years | 0 (0.0%) | 52 (3.4%) |
| 75 Years and over | 41 (4.8%) | 11 (1.6%) |
Disability Class: Cognitive Difficulty
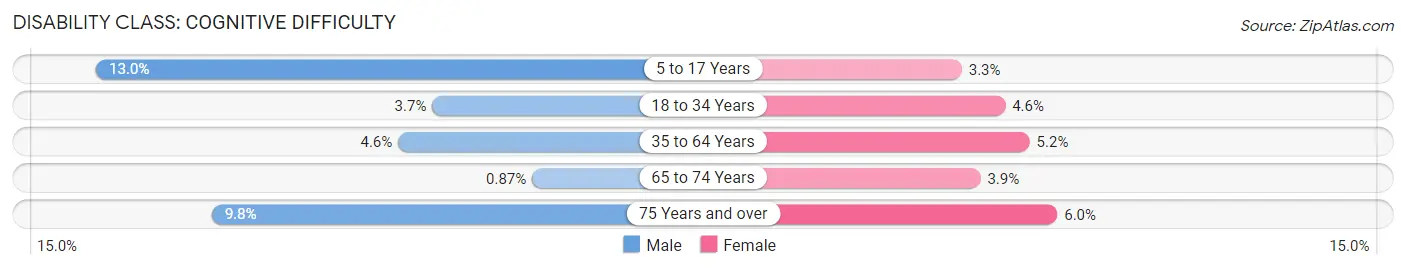
| Age Bracket | Male | Female |
| 5 to 17 Years | 188 (13.0%) | 36 (3.3%) |
| 18 to 34 Years | 59 (3.6%) | 67 (4.5%) |
| 35 to 64 Years | 114 (4.6%) | 163 (5.2%) |
| 65 to 74 Years | 9 (0.9%) | 59 (3.9%) |
| 75 Years and over | 84 (9.8%) | 41 (6.0%) |
Disability Class: Ambulatory Difficulty
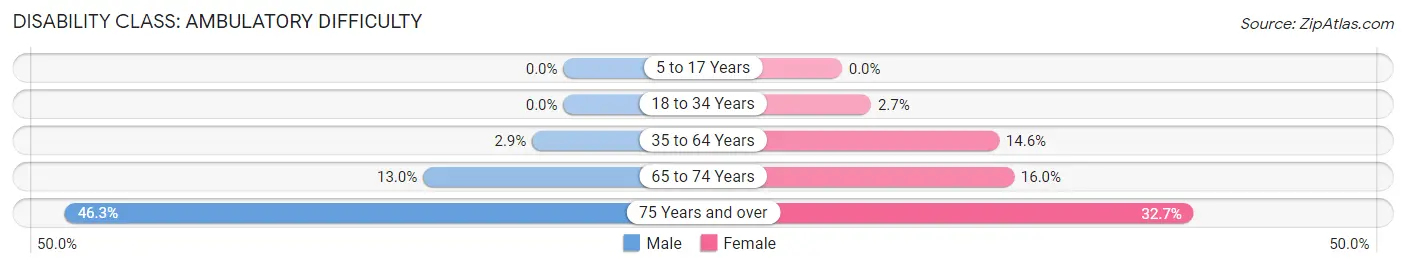
| Age Bracket | Male | Female |
| 5 to 17 Years | 0 (0.0%) | 0 (0.0%) |
| 18 to 34 Years | 0 (0.0%) | 40 (2.7%) |
| 35 to 64 Years | 72 (2.9%) | 454 (14.6%) |
| 65 to 74 Years | 134 (13.0%) | 244 (16.0%) |
| 75 Years and over | 397 (46.3%) | 223 (32.7%) |
Disability Class: Self-Care Difficulty
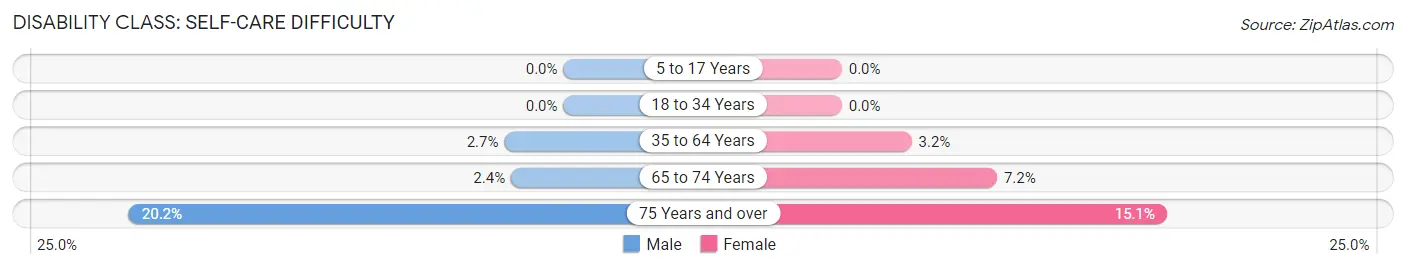
| Age Bracket | Male | Female |
| 5 to 17 Years | 0 (0.0%) | 0 (0.0%) |
| 18 to 34 Years | 0 (0.0%) | 0 (0.0%) |
| 35 to 64 Years | 68 (2.7%) | 101 (3.2%) |
| 65 to 74 Years | 25 (2.4%) | 110 (7.2%) |
| 75 Years and over | 173 (20.2%) | 103 (15.1%) |
Technology Access in Lake Wales
Computing Device Access in Lake Wales
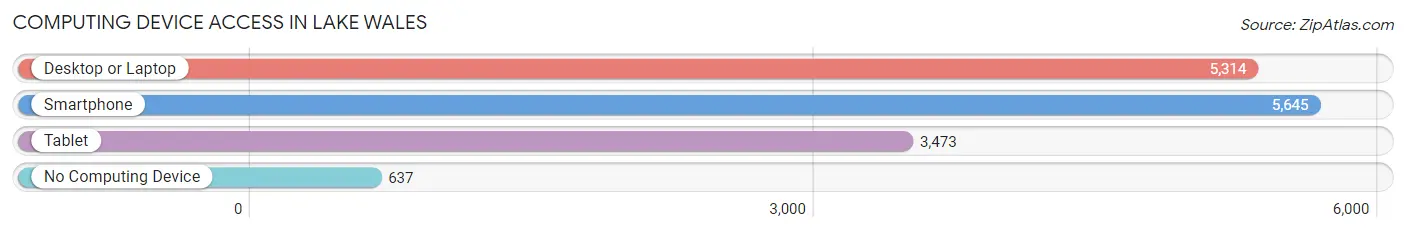
| Device Type | # Households | % Households |
| Desktop or Laptop | 5,314 | 78.9% |
| Smartphone | 5,645 | 83.8% |
| Tablet | 3,473 | 51.6% |
| No Computing Device | 637 | 9.5% |
| Total | 6,734 | 100.0% |
Internet Access in Lake Wales
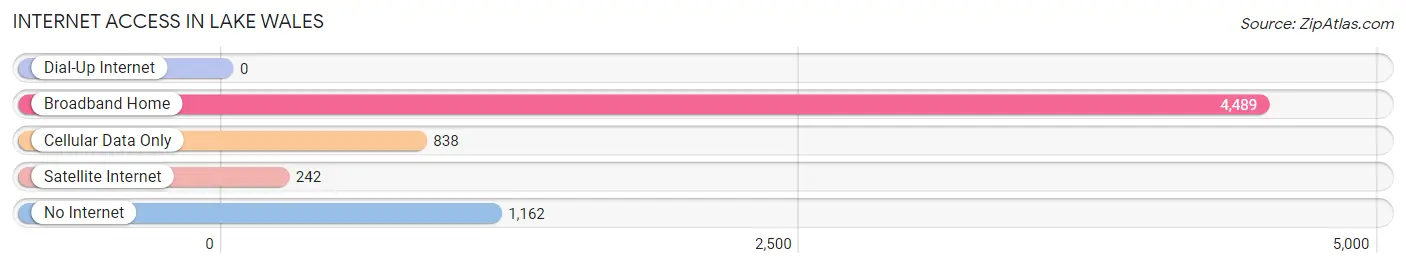
| Internet Type | # Households | % Households |
| Dial-Up Internet | 0 | 0.0% |
| Broadband Home | 4,489 | 66.7% |
| Cellular Data Only | 838 | 12.4% |
| Satellite Internet | 242 | 3.6% |
| No Internet | 1,162 | 17.3% |
| Total | 6,734 | 100.0% |
Lake Wales Summary
History
The city of Lake Wales, Florida is located in Polk County in the central part of the state. It is situated between the cities of Winter Haven and Bartow, and is approximately 50 miles east of Tampa. The city was founded in 1911 by the Lake Wales Land Company, which was led by the prominent Philadelphia banker, C.C. Post. The city was named after the nearby Lake Wales, which was named after the Welsh settlers who had moved to the area in the late 19th century.
The city of Lake Wales was incorporated in 1917 and has since grown to become a thriving community. The city is home to a variety of businesses, including a large citrus industry, as well as a number of tourist attractions. The city is also home to the historic Bok Tower Gardens, which was built in 1929 by Edward Bok, a Pulitzer Prize-winning author and philanthropist.
Geography
Lake Wales is located in central Florida, approximately 50 miles east of Tampa. The city is situated between the cities of Winter Haven and Bartow, and is bordered by the Peace River to the north and the Kissimmee River to the south. The city is located in the Lake Wales Ridge, a narrow strip of land that runs through the center of the state. The city is located at an elevation of approximately 100 feet above sea level.
The city of Lake Wales covers an area of approximately 11.5 square miles, and is home to a population of approximately 14,225 people. The city is divided into several neighborhoods, including Lake Wales East, Lake Wales West, and Lake Wales South.
Economy
The economy of Lake Wales is largely based on the citrus industry, which has been a major part of the city’s economy since its founding. The city is home to a number of citrus processing plants, as well as a number of citrus groves. The city is also home to a number of other businesses, including manufacturing, retail, and tourism.
The city is home to a number of tourist attractions, including the historic Bok Tower Gardens, which was built in 1929 by Edward Bok, a Pulitzer Prize-winning author and philanthropist. The city is also home to a number of other attractions, including the Lake Wales Museum and Cultural Center, the Lake Wales Arts Center, and the Lake Wales Historical Society.
Demographics
As of the 2010 census, the city of Lake Wales had a population of 14,225 people. The racial makeup of the city was 79.2% White, 15.3% African American, 0.4% Native American, 0.7% Asian, 0.1% Pacific Islander, 2.3% from other races, and 2.0% from two or more races. Hispanic or Latino of any race were 8.2% of the population.
The median income for a household in the city was $35,945, and the median income for a family was $41,945. The per capita income for the city was $18,945. About 17.2% of families and 20.3% of the population were below the poverty line, including 28.2% of those under age 18 and 11.2% of those age 65 or over.
Common Questions
What is Per Capita Income in Lake Wales?
Per Capita income in Lake Wales is $26,994.
What is the Median Family Income in Lake Wales?
Median Family Income in Lake Wales is $69,323.
What is the Median Household income in Lake Wales?
Median Household Income in Lake Wales is $55,833.
What is Income or Wage Gap in Lake Wales?
Income or Wage Gap in Lake Wales is 19.3%.
Women in Lake Wales earn 80.7 cents for every dollar earned by a man.
What is Family Income Deficit in Lake Wales?
Family Income Deficit in Lake Wales is $11,275.
Families that are below poverty line in Lake Wales earn $11,275 less on average than the poverty threshold level.
What is Inequality or Gini Index in Lake Wales?
Inequality or Gini Index in Lake Wales is 0.43.
What is the Total Population of Lake Wales?
Total Population of Lake Wales is 16,455.
What is the Total Male Population of Lake Wales?
Total Male Population of Lake Wales is 7,922.
What is the Total Female Population of Lake Wales?
Total Female Population of Lake Wales is 8,533.
What is the Ratio of Males per 100 Females in Lake Wales?
There are 92.84 Males per 100 Females in Lake Wales.
What is the Ratio of Females per 100 Males in Lake Wales?
There are 107.71 Females per 100 Males in Lake Wales.
What is the Median Population Age in Lake Wales?
Median Population Age in Lake Wales is 43.1 Years.
What is the Average Family Size in Lake Wales
Average Family Size in Lake Wales is 3.0 People.
What is the Average Household Size in Lake Wales
Average Household Size in Lake Wales is 2.4 People.
How Large is the Labor Force in Lake Wales?
There are 6,497 People in the Labor Forcein in Lake Wales.
What is the Percentage of People in the Labor Force in Lake Wales?
48.0% of People are in the Labor Force in Lake Wales.
What is the Unemployment Rate in Lake Wales?
Unemployment Rate in Lake Wales is 5.7%.