Zip Codes with the Highest Percentage of Population Employed in Health Diagnosing & Treating in Jacksonville, FL
RELATED REPORTS & OPTIONS
Health Diagnosing & Treating
Jacksonville
Compare Zip Codes
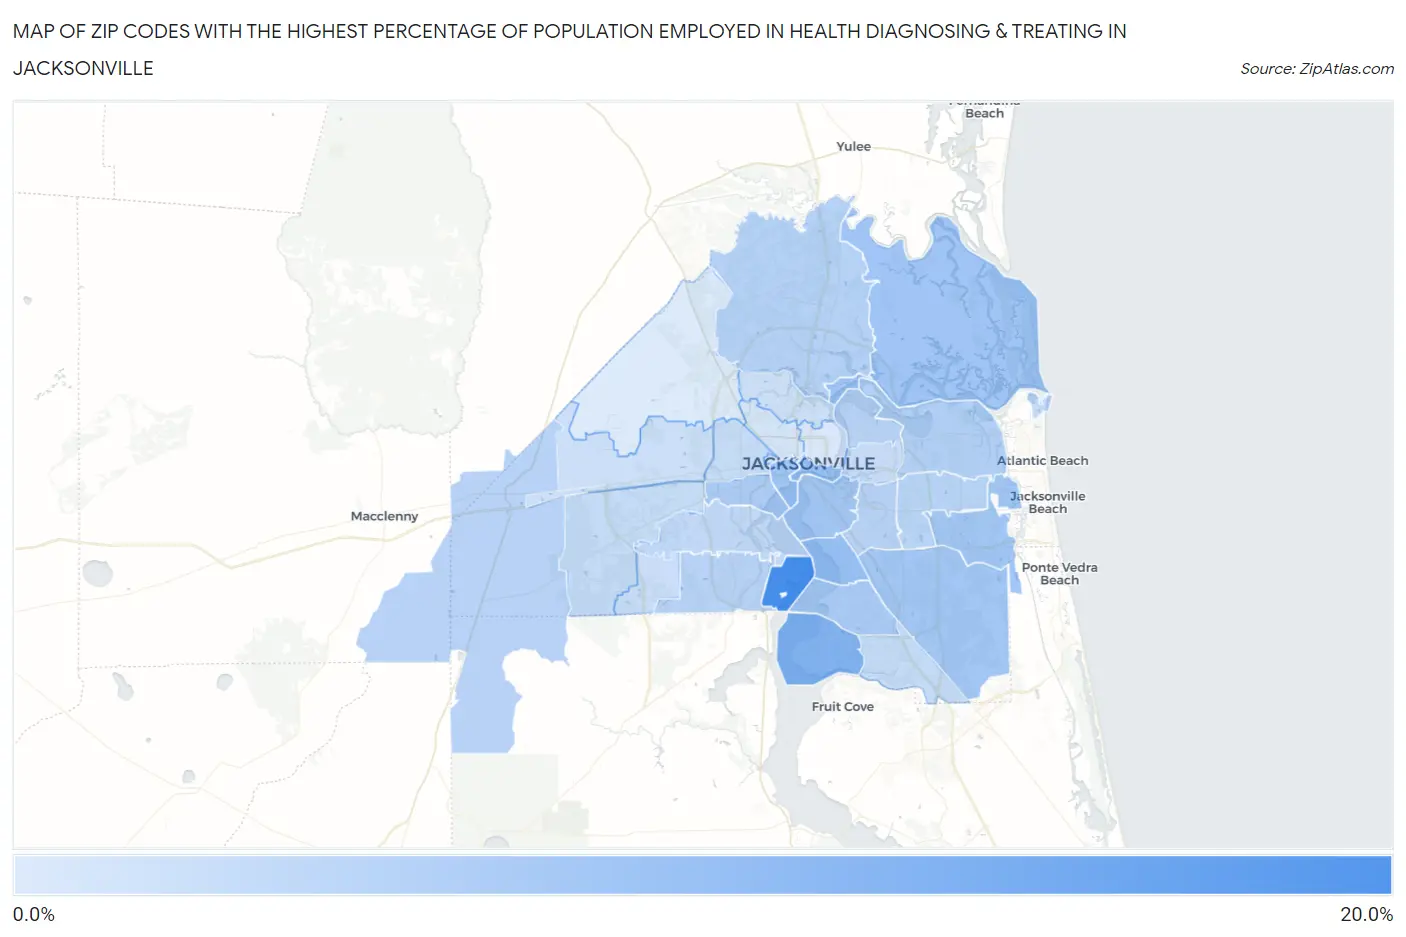
Map of Zip Codes with the Highest Percentage of Population Employed in Health Diagnosing & Treating in Jacksonville
2.3%
17.9%
Zip Codes with the Highest Percentage of Population Employed in Health Diagnosing & Treating in Jacksonville, FL
| Zip Code | % Employed | vs State | vs National | |
| 1. | 32212 | 17.9% | 6.4%(+11.5)#14 | 6.2%(+11.7)#715 |
| 2. | 32223 | 11.5% | 6.4%(+5.08)#62 | 6.2%(+5.28)#2,506 |
| 3. | 32217 | 9.3% | 6.4%(+2.86)#132 | 6.2%(+3.06)#4,854 |
| 4. | 32202 | 9.2% | 6.4%(+2.77)#138 | 6.2%(+2.98)#4,985 |
| 5. | 32226 | 8.4% | 6.4%(+1.97)#190 | 6.2%(+2.18)#6,491 |
| 6. | 32204 | 8.3% | 6.4%(+1.81)#205 | 6.2%(+2.01)#6,872 |
| 7. | 32224 | 8.2% | 6.4%(+1.71)#213 | 6.2%(+1.91)#7,110 |
| 8. | 32256 | 8.1% | 6.4%(+1.70)#214 | 6.2%(+1.90)#7,130 |
| 9. | 32207 | 8.1% | 6.4%(+1.68)#215 | 6.2%(+1.88)#7,183 |
| 10. | 32257 | 7.3% | 6.4%(+0.835)#298 | 6.2%(+1.04)#9,460 |
| 11. | 32205 | 7.0% | 6.4%(+0.577)#339 | 6.2%(+0.781)#10,284 |
| 12. | 32225 | 6.5% | 6.4%(+0.055)#416 | 6.2%(+0.260)#12,012 |
| 13. | 32218 | 6.2% | 6.4%(-0.231)#475 | 6.2%(-0.026)#13,087 |
| 14. | 32216 | 6.1% | 6.4%(-0.386)#501 | 6.2%(-0.181)#13,634 |
| 15. | 32234 | 6.0% | 6.4%(-0.455)#513 | 6.2%(-0.250)#13,889 |
| 16. | 32277 | 5.9% | 6.4%(-0.504)#518 | 6.2%(-0.300)#14,063 |
| 17. | 32244 | 5.9% | 6.4%(-0.569)#527 | 6.2%(-0.365)#14,313 |
| 18. | 32246 | 5.6% | 6.4%(-0.826)#560 | 6.2%(-0.622)#15,303 |
| 19. | 32210 | 5.1% | 6.4%(-1.32)#632 | 6.2%(-1.12)#17,242 |
| 20. | 32227 | 4.9% | 6.4%(-1.54)#663 | 6.2%(-1.34)#18,070 |
| 21. | 32254 | 4.7% | 6.4%(-1.78)#689 | 6.2%(-1.57)#18,969 |
| 22. | 32258 | 4.7% | 6.4%(-1.80)#691 | 6.2%(-1.59)#19,044 |
| 23. | 32221 | 4.5% | 6.4%(-1.91)#710 | 6.2%(-1.71)#19,510 |
| 24. | 32211 | 4.2% | 6.4%(-2.24)#751 | 6.2%(-2.04)#20,673 |
| 25. | 32222 | 4.2% | 6.4%(-2.29)#757 | 6.2%(-2.08)#20,845 |
| 26. | 32220 | 3.9% | 6.4%(-2.60)#791 | 6.2%(-2.39)#21,834 |
| 27. | 32208 | 3.7% | 6.4%(-2.79)#813 | 6.2%(-2.58)#22,422 |
| 28. | 32209 | 3.0% | 6.4%(-3.43)#862 | 6.2%(-3.22)#24,260 |
| 29. | 32206 | 2.5% | 6.4%(-3.95)#888 | 6.2%(-3.74)#25,504 |
| 30. | 32219 | 2.3% | 6.4%(-4.12)#892 | 6.2%(-3.92)#25,852 |
1
Common Questions
What are the Top 10 Zip Codes with the Highest Percentage of Population Employed in Health Diagnosing & Treating in Jacksonville, FL?
Top 10 Zip Codes with the Highest Percentage of Population Employed in Health Diagnosing & Treating in Jacksonville, FL are:
What zip code has the Highest Percentage of Population Employed in Health Diagnosing & Treating in Jacksonville, FL?
32212 has the Highest Percentage of Population Employed in Health Diagnosing & Treating in Jacksonville, FL with 17.9%.
What is the Percentage of Population Employed in Health Diagnosing & Treating in Jacksonville, FL?
Percentage of Population Employed in Health Diagnosing & Treating in Jacksonville is 6.2%.
What is the Percentage of Population Employed in Health Diagnosing & Treating in Florida?
Percentage of Population Employed in Health Diagnosing & Treating in Florida is 6.4%.
What is the Percentage of Population Employed in Health Diagnosing & Treating in the United States?
Percentage of Population Employed in Health Diagnosing & Treating in the United States is 6.2%.