Highland Park, FL Map & Demographics
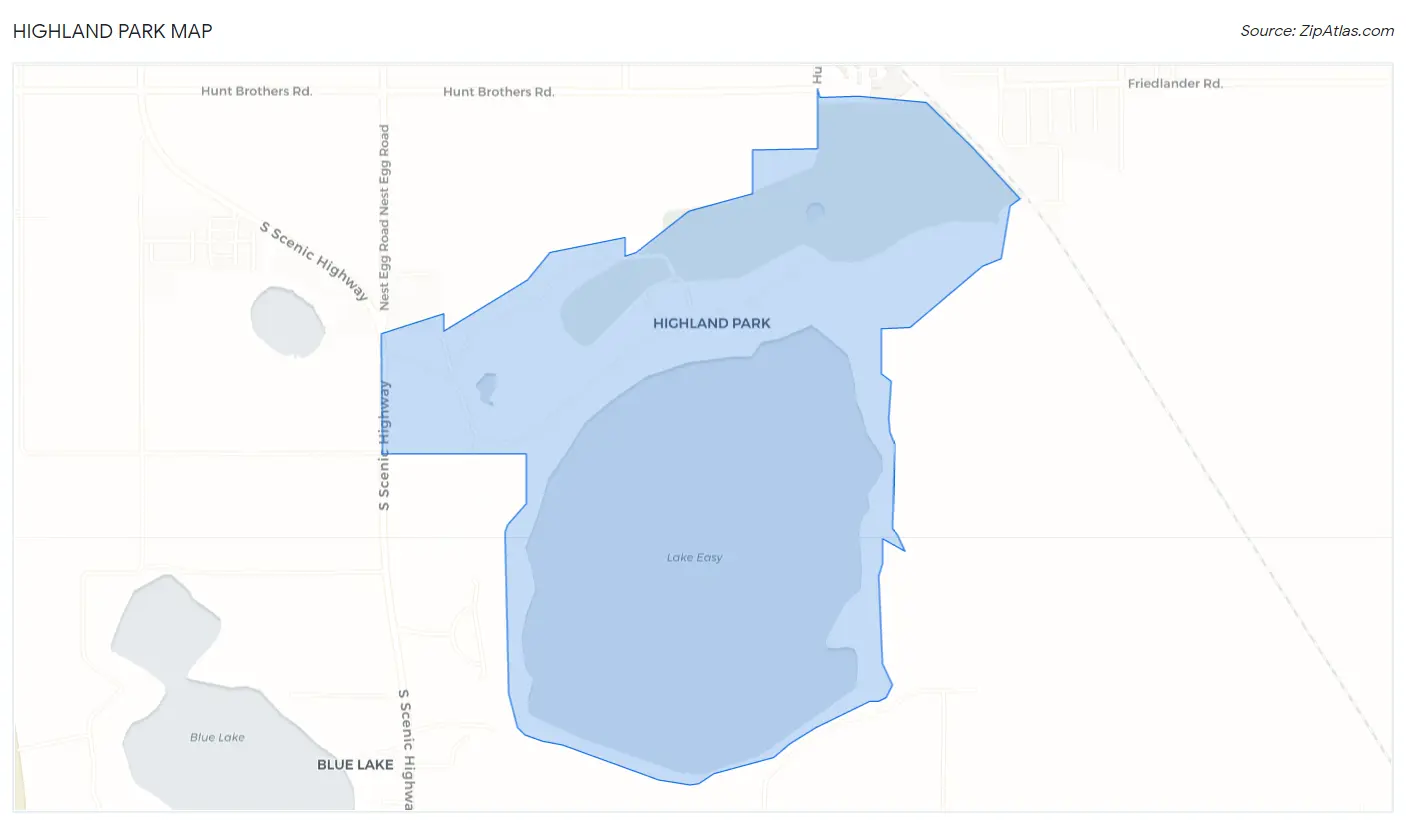
Highland Park Map
Highland Park Overview
$42,085
PER CAPITA INCOME
$118,125
AVG FAMILY INCOME
$84,688
AVG HOUSEHOLD INCOME
60.1%
WAGE / INCOME GAP [ % ]
39.9¢/ $1
WAGE / INCOME GAP [ $ ]
0.37
INEQUALITY / GINI INDEX
178
TOTAL POPULATION
82
MALE POPULATION
96
FEMALE POPULATION
85.42
MALES / 100 FEMALES
117.07
FEMALES / 100 MALES
41.0
MEDIAN AGE
3.2
AVG FAMILY SIZE
2.7
AVG HOUSEHOLD SIZE
92
LABOR FORCE [ PEOPLE ]
67.6%
PERCENT IN LABOR FORCE
2.2%
UNEMPLOYMENT RATE
Highland Park Area Codes
Income in Highland Park
Income Overview in Highland Park
Per Capita Income in Highland Park is $42,085, while median incomes of families and households are $118,125 and $84,688 respectively.
| Characteristic | Number | Measure |
| Per Capita Income | 178 | $42,085 |
| Median Family Income | 50 | $118,125 |
| Mean Family Income | 50 | $126,062 |
| Median Household Income | 67 | $84,688 |
| Mean Household Income | 67 | $107,542 |
| Income Deficit | 50 | $0 |
| Wage / Income Gap (%) | 178 | 60.14% |
| Wage / Income Gap ($) | 178 | 39.86¢ per $1 |
| Gini / Inequality Index | 178 | 0.37 |
Earnings by Sex in Highland Park
Average Earnings in Highland Park are $42,917, $57,500 for men and $22,917 for women, a difference of 60.1%.
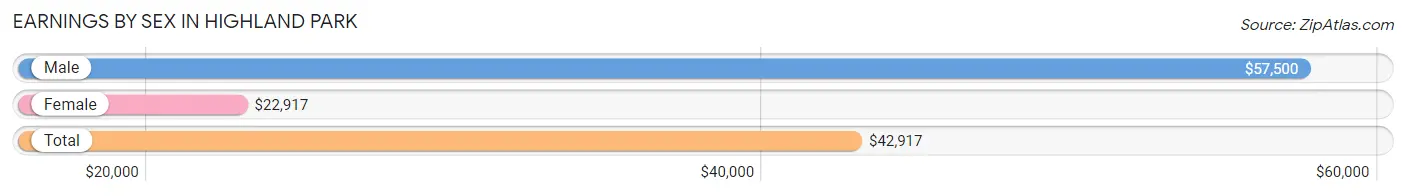
| Sex | Number | Average Earnings |
| Male | 54 (56.8%) | $57,500 |
| Female | 41 (43.2%) | $22,917 |
| Total | 95 (100.0%) | $42,917 |
Earnings by Sex by Income Bracket in Highland Park
The most common earnings brackets in Highland Park are $100,000+ for men (16 | 29.6%) and $30,000 to $34,999 for women (5 | 12.2%).
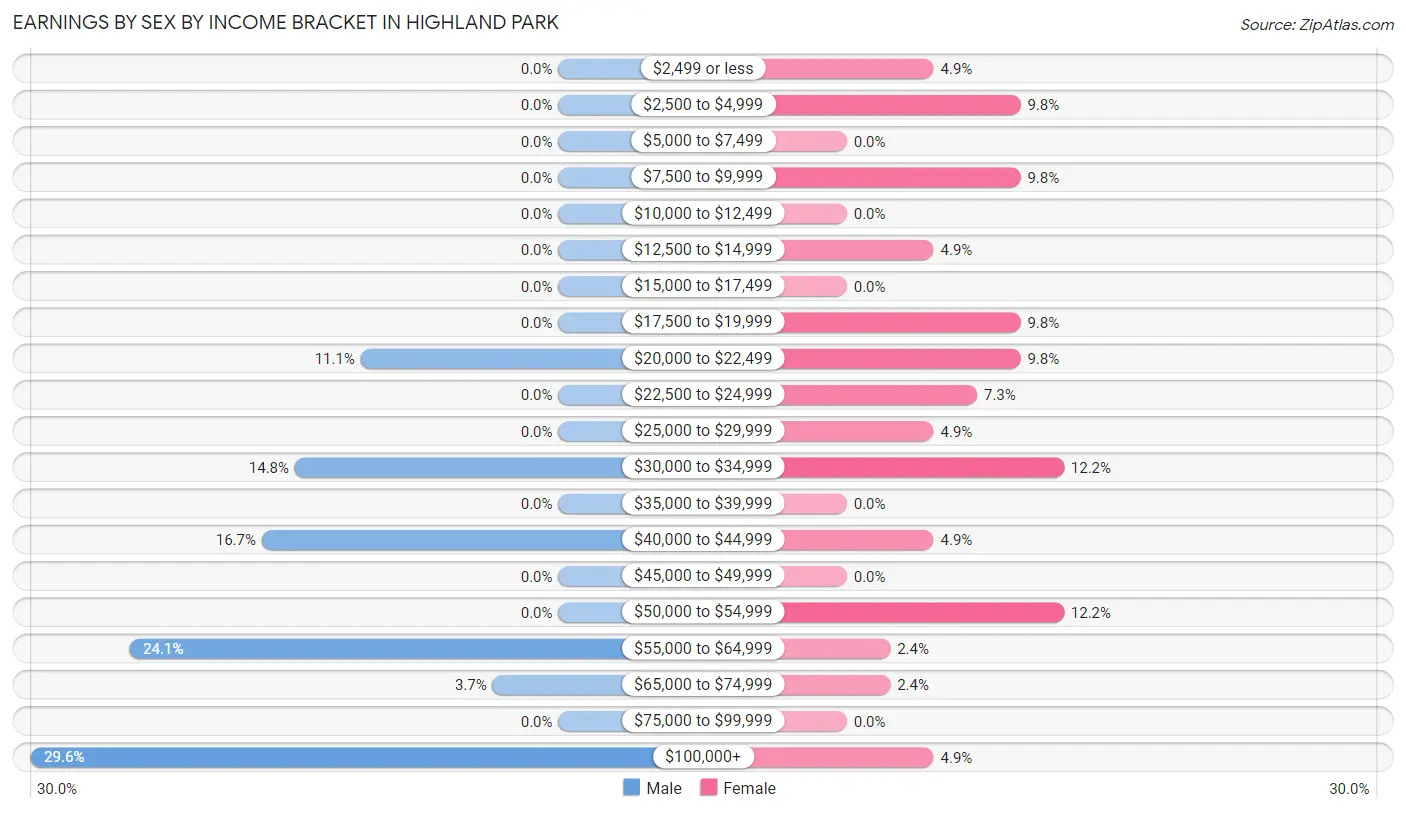
| Income | Male | Female |
| $2,499 or less | 0 (0.0%) | 2 (4.9%) |
| $2,500 to $4,999 | 0 (0.0%) | 4 (9.8%) |
| $5,000 to $7,499 | 0 (0.0%) | 0 (0.0%) |
| $7,500 to $9,999 | 0 (0.0%) | 4 (9.8%) |
| $10,000 to $12,499 | 0 (0.0%) | 0 (0.0%) |
| $12,500 to $14,999 | 0 (0.0%) | 2 (4.9%) |
| $15,000 to $17,499 | 0 (0.0%) | 0 (0.0%) |
| $17,500 to $19,999 | 0 (0.0%) | 4 (9.8%) |
| $20,000 to $22,499 | 6 (11.1%) | 4 (9.8%) |
| $22,500 to $24,999 | 0 (0.0%) | 3 (7.3%) |
| $25,000 to $29,999 | 0 (0.0%) | 2 (4.9%) |
| $30,000 to $34,999 | 8 (14.8%) | 5 (12.2%) |
| $35,000 to $39,999 | 0 (0.0%) | 0 (0.0%) |
| $40,000 to $44,999 | 9 (16.7%) | 2 (4.9%) |
| $45,000 to $49,999 | 0 (0.0%) | 0 (0.0%) |
| $50,000 to $54,999 | 0 (0.0%) | 5 (12.2%) |
| $55,000 to $64,999 | 13 (24.1%) | 1 (2.4%) |
| $65,000 to $74,999 | 2 (3.7%) | 1 (2.4%) |
| $75,000 to $99,999 | 0 (0.0%) | 0 (0.0%) |
| $100,000+ | 16 (29.6%) | 2 (4.9%) |
| Total | 54 (100.0%) | 41 (100.0%) |
Earnings by Sex by Educational Attainment in Highland Park
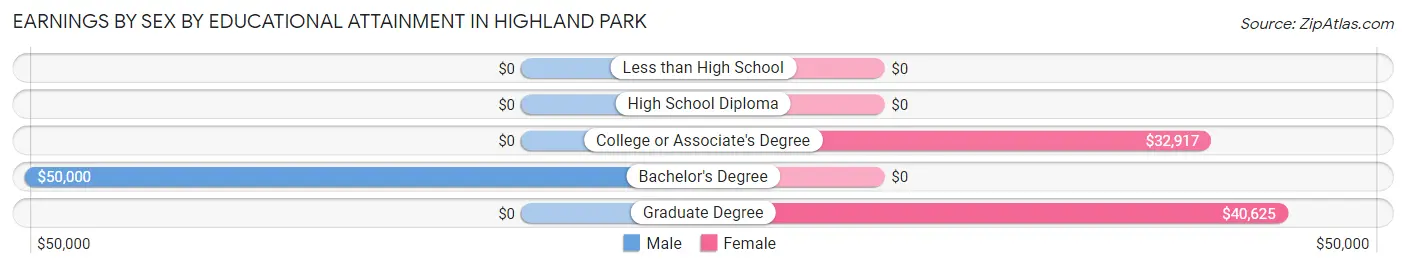
| Educational Attainment | Male Income | Female Income |
| Less than High School | - | - |
| High School Diploma | - | - |
| College or Associate's Degree | - | - |
| Bachelor's Degree | $50,000 | $0 |
| Graduate Degree | - | - |
| Total | $57,500 | $0 |
Family Income in Highland Park
Family Income Brackets in Highland Park
According to the Highland Park family income data, there are 16 families falling into the $100,000 to $149,999 income range, which is the most common income bracket and makes up 32.0% of all families.
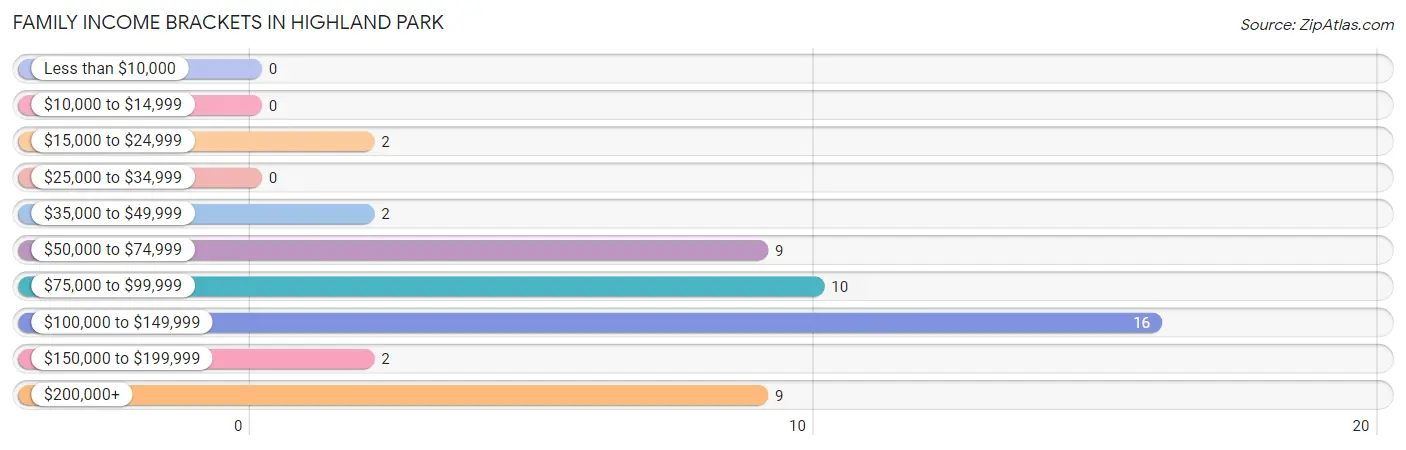
| Income Bracket | # Families | % Families |
| Less than $10,000 | 0 | 0.0% |
| $10,000 to $14,999 | 0 | 0.0% |
| $15,000 to $24,999 | 2 | 4.0% |
| $25,000 to $34,999 | 0 | 0.0% |
| $35,000 to $49,999 | 2 | 4.0% |
| $50,000 to $74,999 | 9 | 18.0% |
| $75,000 to $99,999 | 10 | 20.0% |
| $100,000 to $149,999 | 16 | 32.0% |
| $150,000 to $199,999 | 2 | 4.0% |
| $200,000+ | 9 | 18.0% |
Family Income by Famaliy Size in Highland Park
4-person families (11 | 22.0%) account for the highest median family income in Highland Park with $117,813 per family, while 2-person families (21 | 42.0%) have the highest median income of $43,125 per family member.
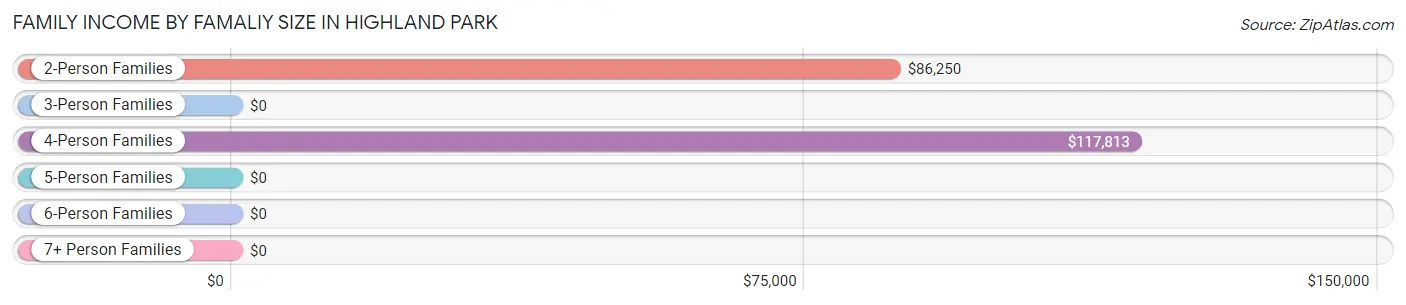
| Income Bracket | # Families | Median Income |
| 2-Person Families | 21 (42.0%) | $86,250 |
| 3-Person Families | 12 (24.0%) | $0 |
| 4-Person Families | 11 (22.0%) | $117,813 |
| 5-Person Families | 6 (12.0%) | $0 |
| 6-Person Families | 0 (0.0%) | $0 |
| 7+ Person Families | 0 (0.0%) | $0 |
| Total | 50 (100.0%) | $118,125 |
Family Income by Number of Earners in Highland Park
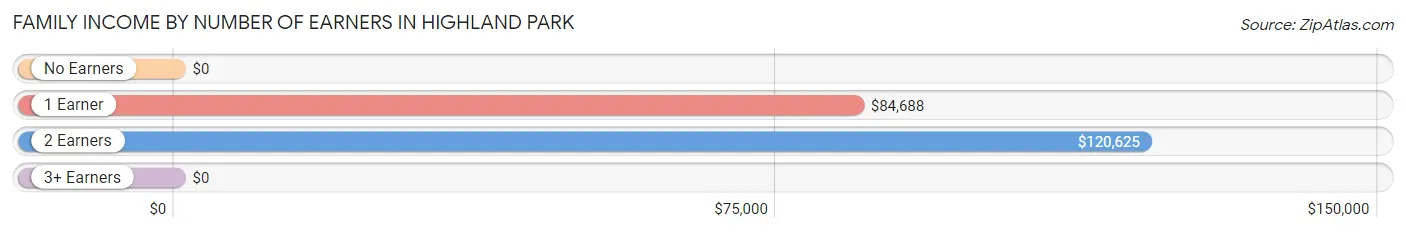
| Number of Earners | # Families | Median Income |
| No Earners | 8 (16.0%) | $0 |
| 1 Earner | 15 (30.0%) | $84,688 |
| 2 Earners | 19 (38.0%) | $120,625 |
| 3+ Earners | 8 (16.0%) | $0 |
| Total | 50 (100.0%) | $118,125 |
Household Income in Highland Park
Household Income Brackets in Highland Park
With 18 households falling in the category, the $100,000 to $149,999 income range is the most frequent in Highland Park, accounting for 26.9% of all households.
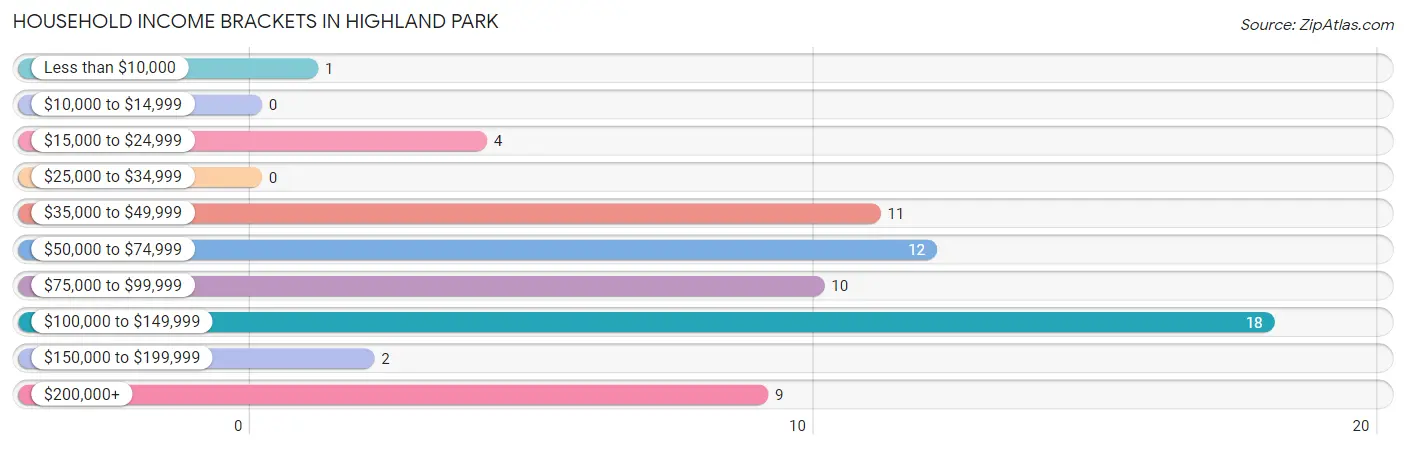
| Income Bracket | # Households | % Households |
| Less than $10,000 | 1 | 1.5% |
| $10,000 to $14,999 | 0 | 0.0% |
| $15,000 to $24,999 | 4 | 6.0% |
| $25,000 to $34,999 | 0 | 0.0% |
| $35,000 to $49,999 | 11 | 16.4% |
| $50,000 to $74,999 | 12 | 17.9% |
| $75,000 to $99,999 | 10 | 14.9% |
| $100,000 to $149,999 | 18 | 26.9% |
| $150,000 to $199,999 | 2 | 3.0% |
| $200,000+ | 9 | 13.4% |
Household Income by Householder Age in Highland Park
The median household income in Highland Park is $84,688, with the highest median household income of $118,438 found in the 45 to 64 years age bracket for the primary householder. A total of 15 households (22.4%) fall into this category.
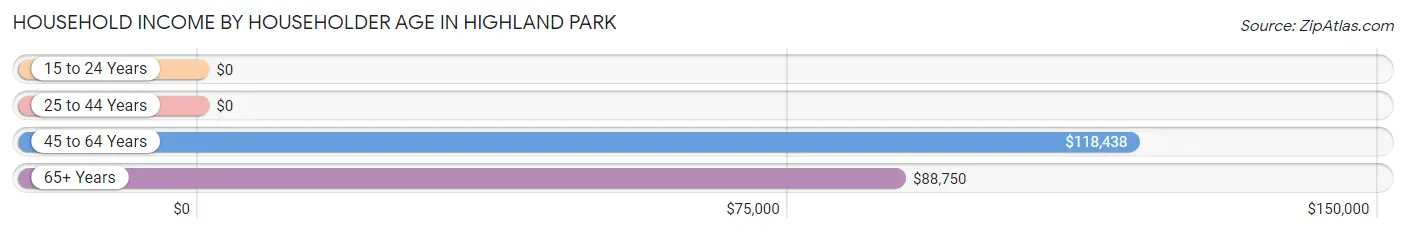
| Income Bracket | # Households | Median Income |
| 15 to 24 Years | 0 (0.0%) | $0 |
| 25 to 44 Years | 26 (38.8%) | $0 |
| 45 to 64 Years | 15 (22.4%) | $118,438 |
| 65+ Years | 26 (38.8%) | $88,750 |
| Total | 67 (100.0%) | $84,688 |
Poverty in Highland Park
Income Below Poverty by Sex and Age in Highland Park
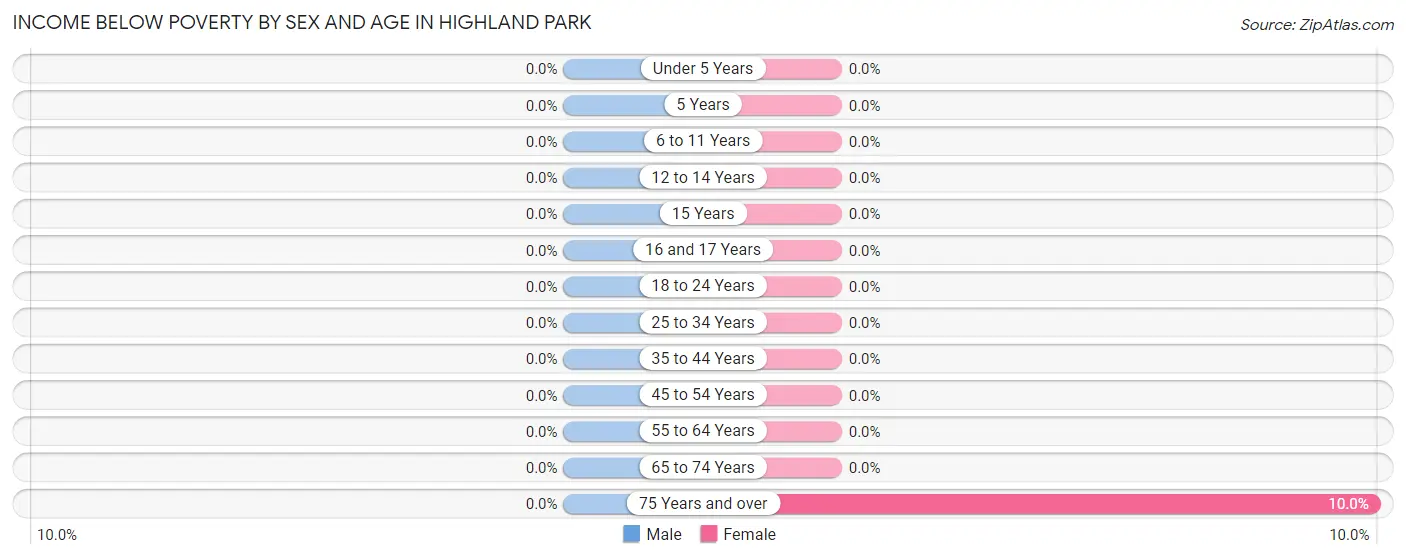
| Age Bracket | Male | Female |
| Under 5 Years | 0 (0.0%) | 0 (0.0%) |
| 5 Years | 0 (0.0%) | 0 (0.0%) |
| 6 to 11 Years | 0 (0.0%) | 0 (0.0%) |
| 12 to 14 Years | 0 (0.0%) | 0 (0.0%) |
| 15 Years | 0 (0.0%) | 0 (0.0%) |
| 16 and 17 Years | 0 (0.0%) | 0 (0.0%) |
| 18 to 24 Years | 0 (0.0%) | 0 (0.0%) |
| 25 to 34 Years | 0 (0.0%) | 0 (0.0%) |
| 35 to 44 Years | 0 (0.0%) | 0 (0.0%) |
| 45 to 54 Years | 0 (0.0%) | 0 (0.0%) |
| 55 to 64 Years | 0 (0.0%) | 0 (0.0%) |
| 65 to 74 Years | 0 (0.0%) | 0 (0.0%) |
| 75 Years and over | 0 (0.0%) | 1 (10.0%) |
| Total | 0 (0.0%) | 1 (1.0%) |
Income Above Poverty by Sex and Age in Highland Park
According to the poverty statistics in Highland Park, males aged under 5 years and females aged under 5 years are the age groups that are most secure financially, with 100.0% of males and 100.0% of females in these age groups living above the poverty line.
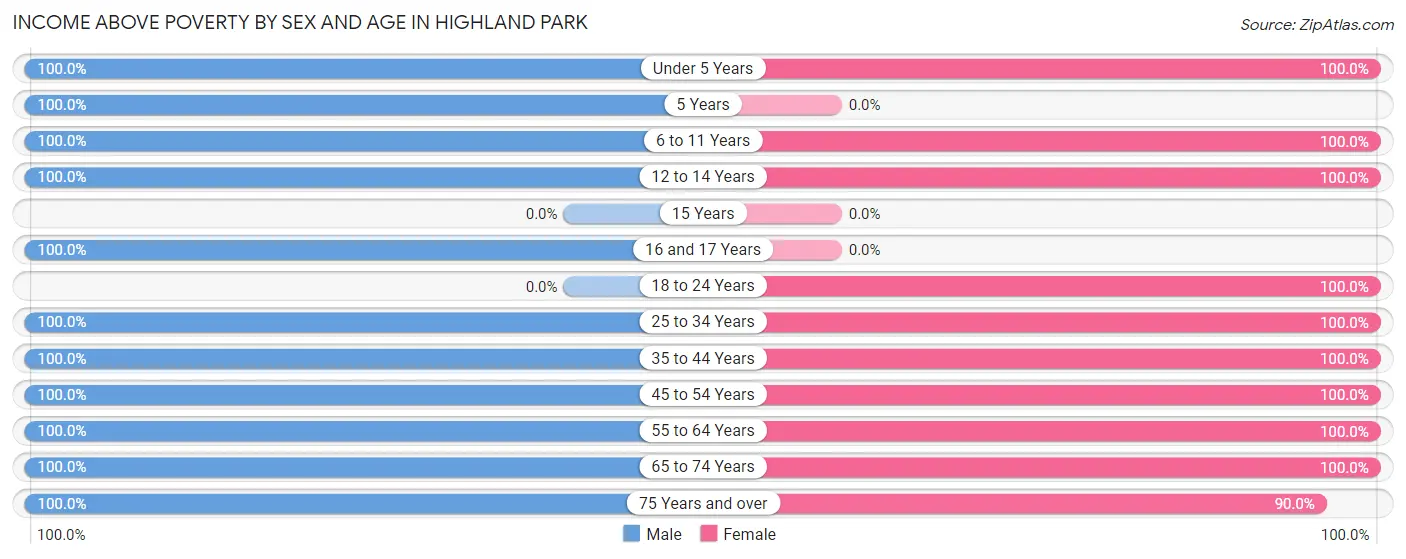
| Age Bracket | Male | Female |
| Under 5 Years | 6 (100.0%) | 5 (100.0%) |
| 5 Years | 1 (100.0%) | 0 (0.0%) |
| 6 to 11 Years | 3 (100.0%) | 15 (100.0%) |
| 12 to 14 Years | 3 (100.0%) | 9 (100.0%) |
| 15 Years | 0 (0.0%) | 0 (0.0%) |
| 16 and 17 Years | 2 (100.0%) | 0 (0.0%) |
| 18 to 24 Years | 0 (0.0%) | 3 (100.0%) |
| 25 to 34 Years | 11 (100.0%) | 5 (100.0%) |
| 35 to 44 Years | 22 (100.0%) | 16 (100.0%) |
| 45 to 54 Years | 10 (100.0%) | 13 (100.0%) |
| 55 to 64 Years | 5 (100.0%) | 10 (100.0%) |
| 65 to 74 Years | 11 (100.0%) | 10 (100.0%) |
| 75 Years and over | 8 (100.0%) | 9 (90.0%) |
| Total | 82 (100.0%) | 95 (99.0%) |
Income Below Poverty Among Married-Couple Families in Highland Park
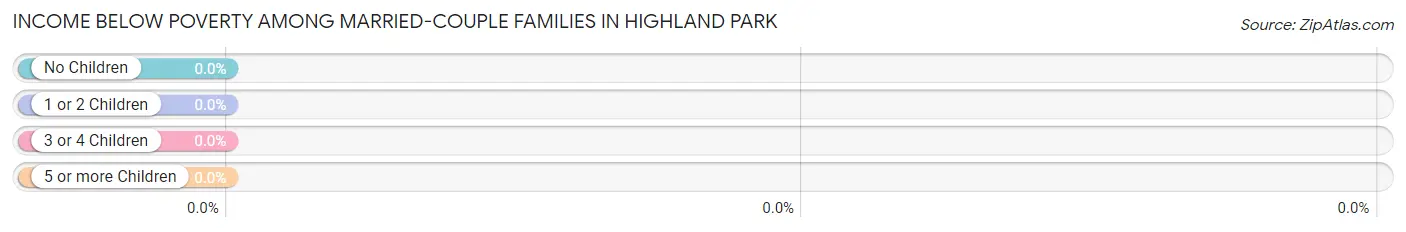
| Children | Above Poverty | Below Poverty |
| No Children | 25 (100.0%) | 0 (0.0%) |
| 1 or 2 Children | 13 (100.0%) | 0 (0.0%) |
| 3 or 4 Children | 6 (100.0%) | 0 (0.0%) |
| 5 or more Children | 0 (0.0%) | 0 (0.0%) |
| Total | 44 (100.0%) | 0 (0.0%) |
Income Below Poverty Among Single-Parent Households in Highland Park
| Children | Single Father | Single Mother |
| No Children | 0 (0.0%) | 0 (0.0%) |
| 1 or 2 Children | 0 (0.0%) | 0 (0.0%) |
| 3 or 4 Children | 0 (0.0%) | 0 (0.0%) |
| 5 or more Children | 0 (0.0%) | 0 (0.0%) |
| Total | 0 (0.0%) | 0 (0.0%) |
Income Below Poverty Among Married-Couple vs Single-Parent Households in Highland Park
| Children | Married-Couple Families | Single-Parent Households |
| No Children | 0 (0.0%) | 0 (0.0%) |
| 1 or 2 Children | 0 (0.0%) | 0 (0.0%) |
| 3 or 4 Children | 0 (0.0%) | 0 (0.0%) |
| 5 or more Children | 0 (0.0%) | 0 (0.0%) |
| Total | 0 (0.0%) | 0 (0.0%) |
Race in Highland Park
The most populous races in Highland Park are White / Caucasian (171 | 96.1%), Hispanic or Latino (14 | 7.9%), and Asian (6 | 3.4%).
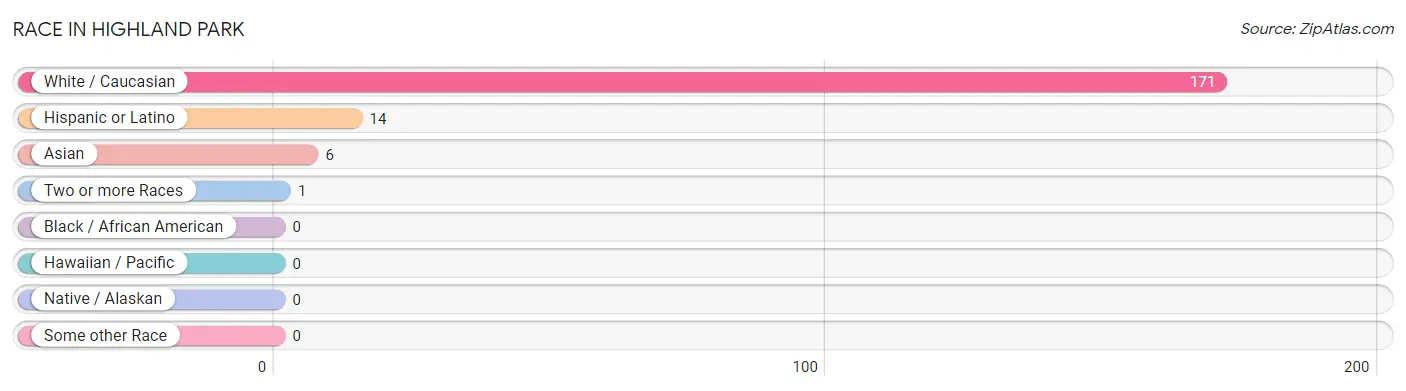
| Race | # Population | % Population |
| Asian | 6 | 3.4% |
| Black / African American | 0 | 0.0% |
| Hawaiian / Pacific | 0 | 0.0% |
| Hispanic or Latino | 14 | 7.9% |
| Native / Alaskan | 0 | 0.0% |
| White / Caucasian | 171 | 96.1% |
| Two or more Races | 1 | 0.6% |
| Some other Race | 0 | 0.0% |
| Total | 178 | 100.0% |
Ancestry in Highland Park
The most populous ancestries reported in Highland Park are English (60 | 33.7%), Irish (29 | 16.3%), German (26 | 14.6%), American (20 | 11.2%), and European (16 | 9.0%), together accounting for 84.8% of all Highland Park residents.
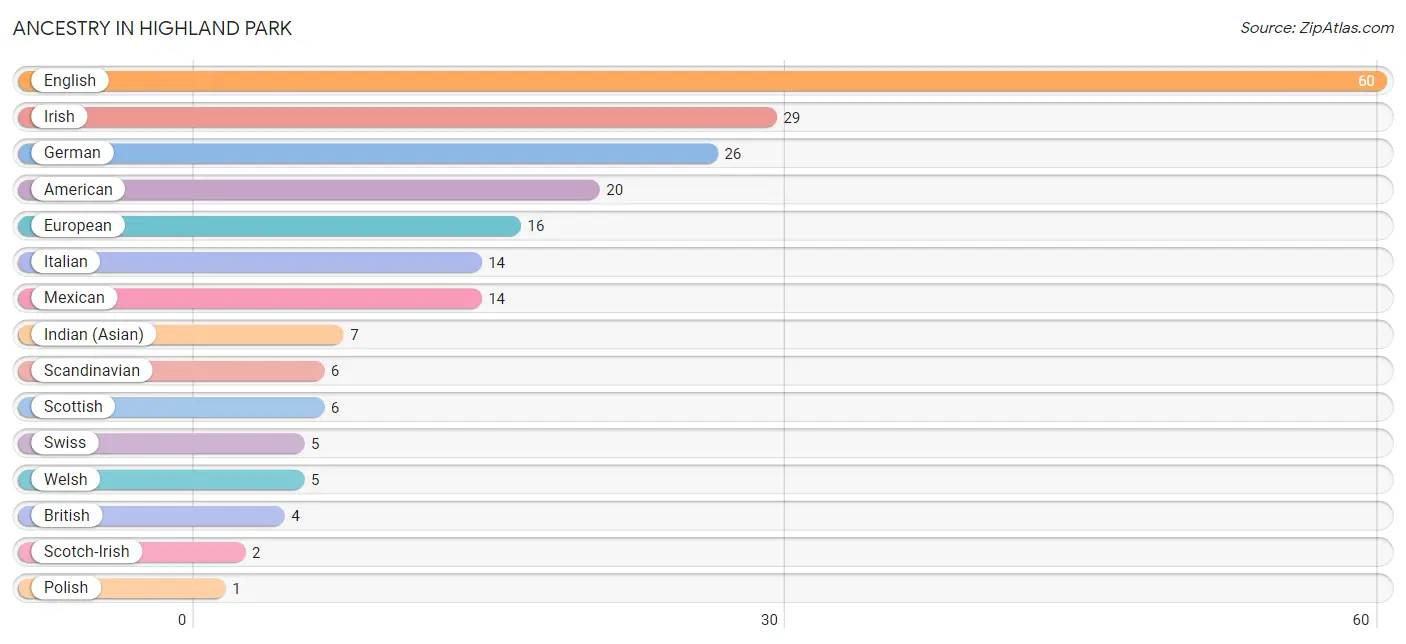
| Ancestry | # Population | % Population |
| American | 20 | 11.2% |
| British | 4 | 2.2% |
| English | 60 | 33.7% |
| European | 16 | 9.0% |
| German | 26 | 14.6% |
| Indian (Asian) | 7 | 3.9% |
| Irish | 29 | 16.3% |
| Italian | 14 | 7.9% |
| Mexican | 14 | 7.9% |
| Polish | 1 | 0.6% |
| Scandinavian | 6 | 3.4% |
| Scotch-Irish | 2 | 1.1% |
| Scottish | 6 | 3.4% |
| Swiss | 5 | 2.8% |
| Welsh | 5 | 2.8% | View All 15 Rows |
Immigrants in Highland Park
The most numerous immigrant groups reported in Highland Park came from Central America (8 | 4.5%), Latin America (8 | 4.5%), Mexico (8 | 4.5%), Asia (2 | 1.1%), and Canada (2 | 1.1%), together accounting for 15.7% of all Highland Park residents.
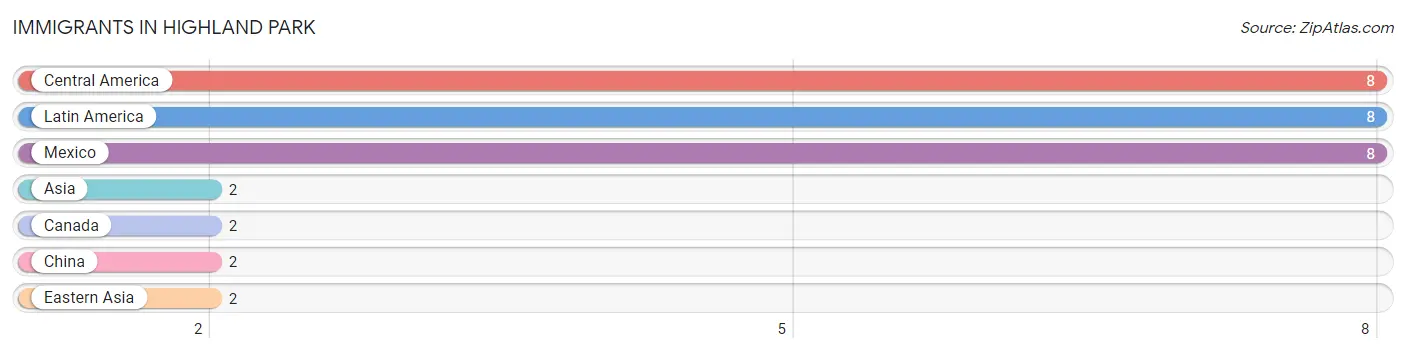
| Immigration Origin | # Population | % Population |
| Asia | 2 | 1.1% |
| Canada | 2 | 1.1% |
| Central America | 8 | 4.5% |
| China | 2 | 1.1% |
| Eastern Asia | 2 | 1.1% |
| Latin America | 8 | 4.5% |
| Mexico | 8 | 4.5% | View All 7 Rows |
Sex and Age in Highland Park
Sex and Age in Highland Park
The most populous age groups in Highland Park are 35 to 39 Years (14 | 17.1%) for men and 10 to 14 Years (13 | 13.5%) for women.
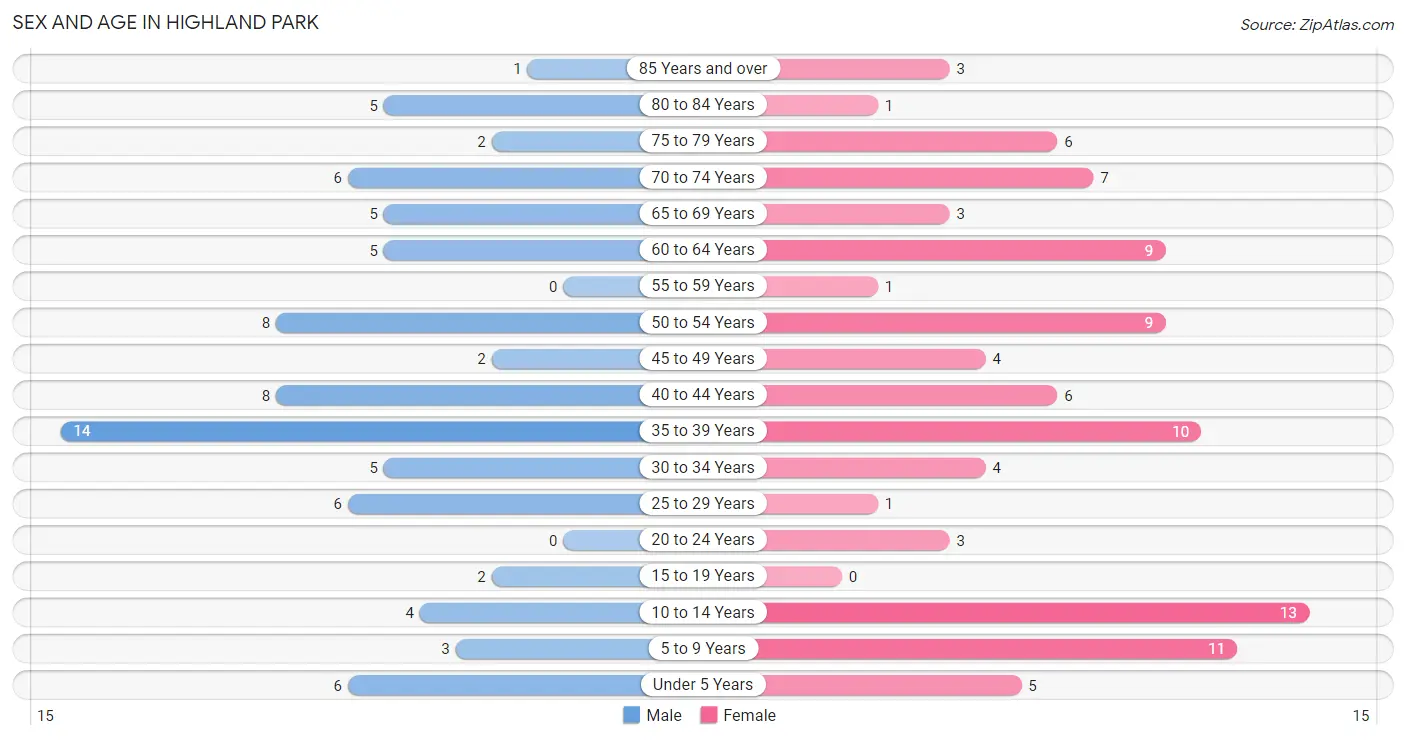
| Age Bracket | Male | Female |
| Under 5 Years | 6 (7.3%) | 5 (5.2%) |
| 5 to 9 Years | 3 (3.7%) | 11 (11.5%) |
| 10 to 14 Years | 4 (4.9%) | 13 (13.5%) |
| 15 to 19 Years | 2 (2.4%) | 0 (0.0%) |
| 20 to 24 Years | 0 (0.0%) | 3 (3.1%) |
| 25 to 29 Years | 6 (7.3%) | 1 (1.0%) |
| 30 to 34 Years | 5 (6.1%) | 4 (4.2%) |
| 35 to 39 Years | 14 (17.1%) | 10 (10.4%) |
| 40 to 44 Years | 8 (9.8%) | 6 (6.2%) |
| 45 to 49 Years | 2 (2.4%) | 4 (4.2%) |
| 50 to 54 Years | 8 (9.8%) | 9 (9.4%) |
| 55 to 59 Years | 0 (0.0%) | 1 (1.0%) |
| 60 to 64 Years | 5 (6.1%) | 9 (9.4%) |
| 65 to 69 Years | 5 (6.1%) | 3 (3.1%) |
| 70 to 74 Years | 6 (7.3%) | 7 (7.3%) |
| 75 to 79 Years | 2 (2.4%) | 6 (6.2%) |
| 80 to 84 Years | 5 (6.1%) | 1 (1.0%) |
| 85 Years and over | 1 (1.2%) | 3 (3.1%) |
| Total | 82 (100.0%) | 96 (100.0%) |
Families and Households in Highland Park
Median Family Size in Highland Park
The median family size in Highland Park is 3.22 persons per family, with married-couple families (44 | 88.0%) accounting for the largest median family size of 3.32 persons per family. On the other hand, single male/father families (2 | 4.0%) represent the smallest median family size with 2.00 persons per family.
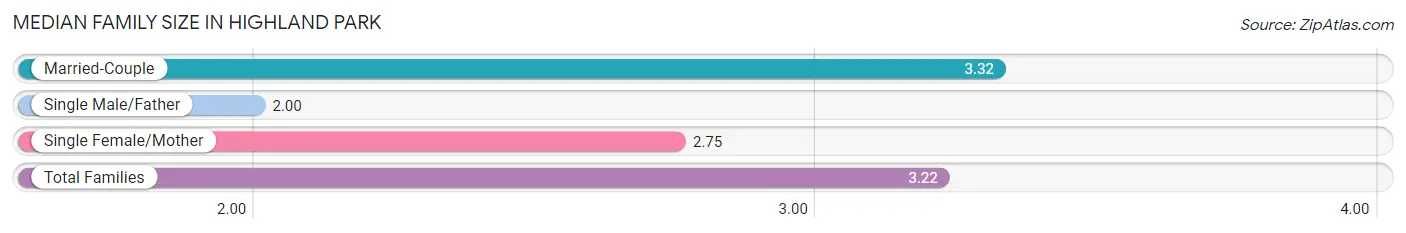
| Family Type | # Families | Family Size |
| Married-Couple | 44 (88.0%) | 3.32 |
| Single Male/Father | 2 (4.0%) | 2.00 |
| Single Female/Mother | 4 (8.0%) | 2.75 |
| Total Families | 50 (100.0%) | 3.22 |
Median Household Size in Highland Park
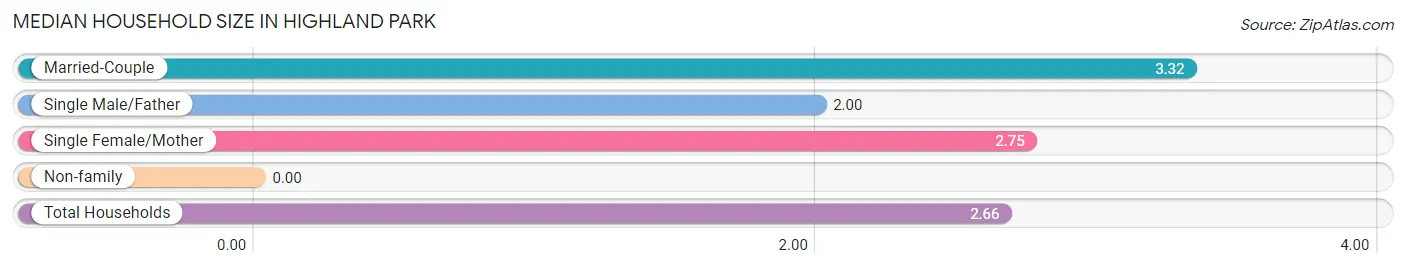
| Household Type | # Households | Household Size |
| Married-Couple | 44 (65.7%) | 3.32 |
| Single Male/Father | 2 (3.0%) | 2.00 |
| Single Female/Mother | 4 (6.0%) | 2.75 |
| Non-family | 17 (25.4%) | - |
| Total Households | 67 (100.0%) | 2.66 |
Household Size by Marriage Status in Highland Park
Out of a total of 67 households in Highland Park, 50 (74.6%) are family households, while 17 (25.4%) are nonfamily households. The most numerous type of family households are 2-person households, comprising 21, and the most common type of nonfamily households are 1-person households, comprising 17.
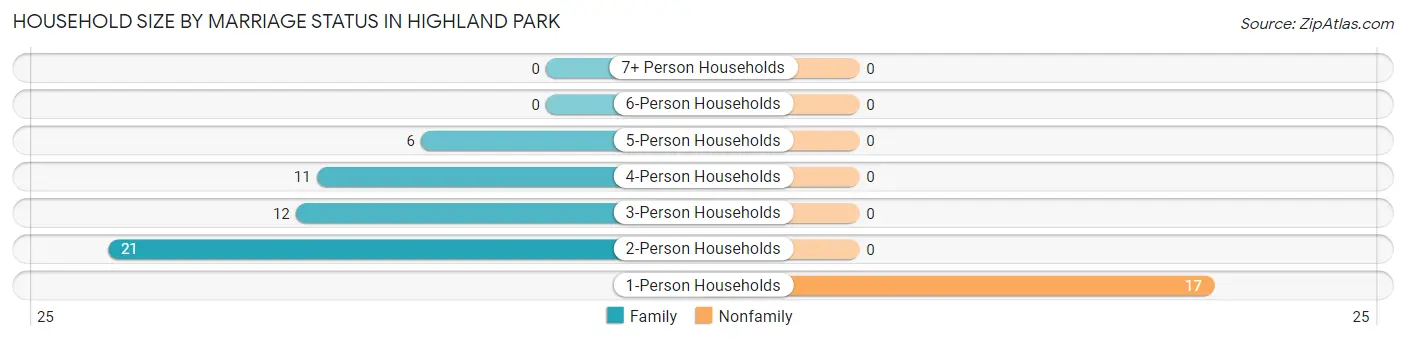
| Household Size | Family Households | Nonfamily Households |
| 1-Person Households | - | 17 (25.4%) |
| 2-Person Households | 21 (31.3%) | 0 (0.0%) |
| 3-Person Households | 12 (17.9%) | 0 (0.0%) |
| 4-Person Households | 11 (16.4%) | 0 (0.0%) |
| 5-Person Households | 6 (9.0%) | 0 (0.0%) |
| 6-Person Households | 0 (0.0%) | 0 (0.0%) |
| 7+ Person Households | 0 (0.0%) | 0 (0.0%) |
| Total | 50 (74.6%) | 17 (25.4%) |
Female Fertility in Highland Park
Fertility by Age in Highland Park
Average fertility rate in Highland Park is 69.0 births per 1,000 women. Women in the age bracket of 35 to 50 years have the highest fertility rate with 95.0 births per 1,000 women. Women in the age bracket of 35 to 50 years acount for 100.0% of all women with births.
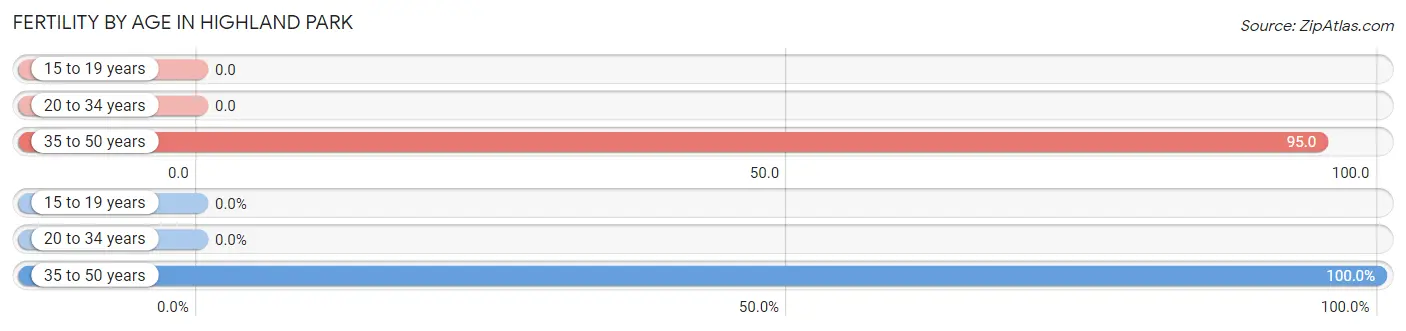
| Age Bracket | Women with Births | Births / 1,000 Women |
| 15 to 19 years | 0 (0.0%) | 0.0 |
| 20 to 34 years | 0 (0.0%) | 0.0 |
| 35 to 50 years | 2 (100.0%) | 95.0 |
| Total | 2 (100.0%) | 69.0 |
Fertility by Age by Marriage Status in Highland Park
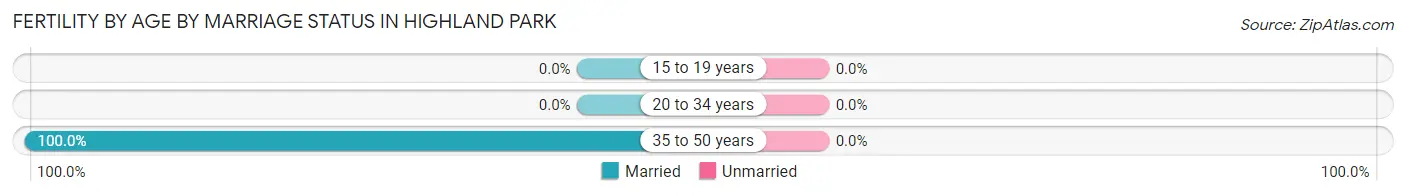
| Age Bracket | Married | Unmarried |
| 15 to 19 years | 0 (0.0%) | 0 (0.0%) |
| 20 to 34 years | 0 (0.0%) | 0 (0.0%) |
| 35 to 50 years | 2 (100.0%) | 0 (0.0%) |
| Total | 2 (100.0%) | 0 (0.0%) |
Fertility by Education in Highland Park
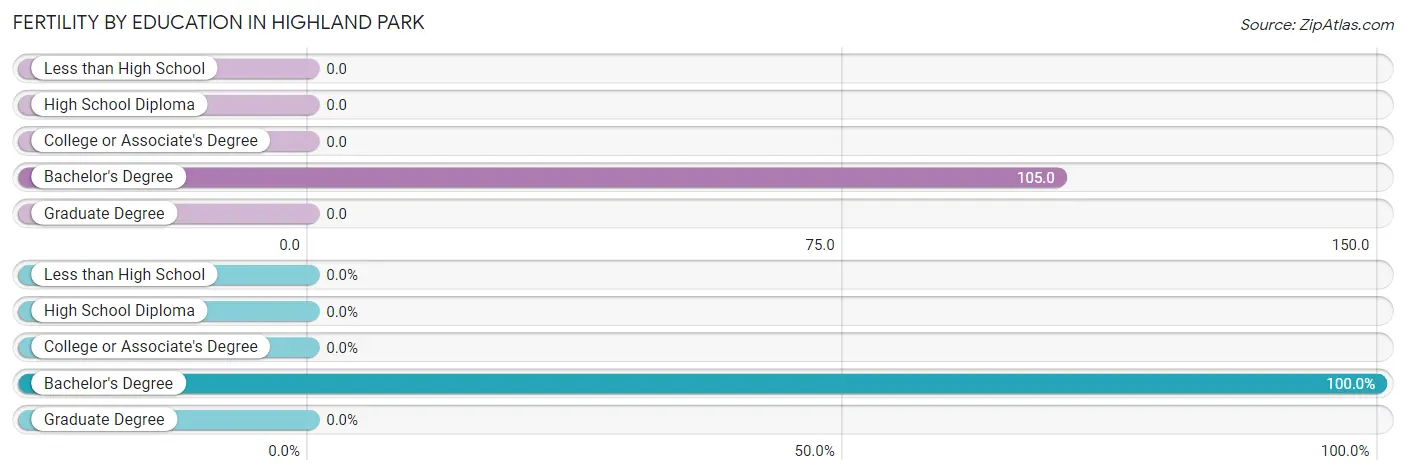
| Educational Attainment | Women with Births | Births / 1,000 Women |
| Less than High School | 0 (0.0%) | 0.0 |
| High School Diploma | 0 (0.0%) | 0.0 |
| College or Associate's Degree | 0 (0.0%) | 0.0 |
| Bachelor's Degree | 2 (100.0%) | 105.0 |
| Graduate Degree | 0 (0.0%) | 0.0 |
| Total | 2 (100.0%) | 69.0 |
Fertility by Education by Marriage Status in Highland Park
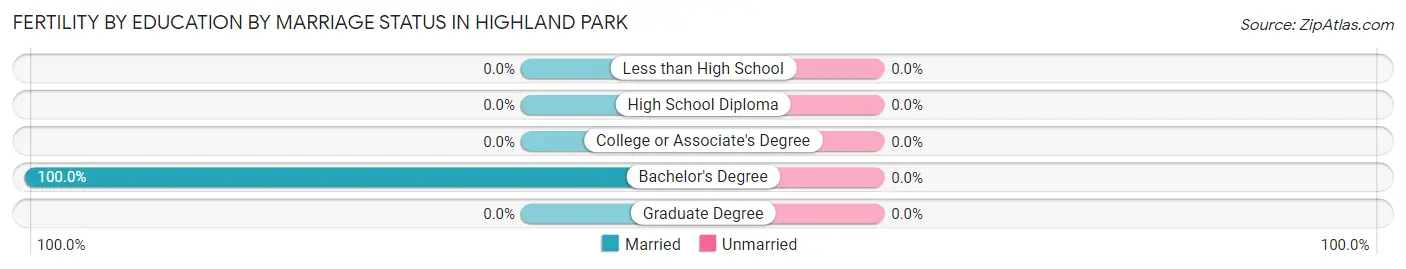
| Educational Attainment | Married | Unmarried |
| Less than High School | 0 (0.0%) | 0 (0.0%) |
| High School Diploma | 0 (0.0%) | 0 (0.0%) |
| College or Associate's Degree | 0 (0.0%) | 0 (0.0%) |
| Bachelor's Degree | 2 (100.0%) | 0 (0.0%) |
| Graduate Degree | 0 (0.0%) | 0 (0.0%) |
| Total | 2 (100.0%) | 0 (0.0%) |
Employment Characteristics in Highland Park
Employment by Class of Employer in Highland Park
Among the 90 employed individuals in Highland Park, private company employees (38 | 42.2%), local government employees (24 | 26.7%), and not-for-profit organizations (11 | 12.2%) make up the most common classes of employment.
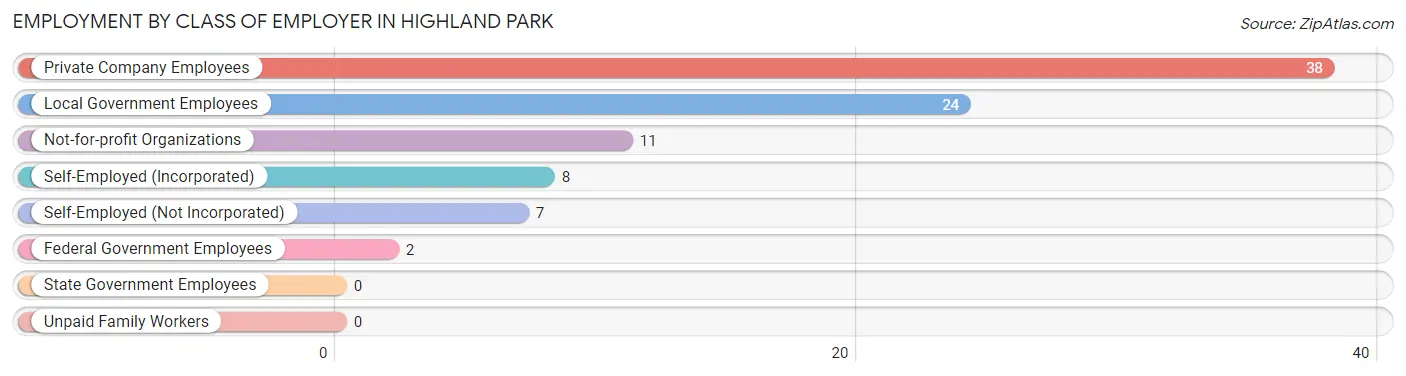
| Employer Class | # Employees | % Employees |
| Private Company Employees | 38 | 42.2% |
| Self-Employed (Incorporated) | 8 | 8.9% |
| Self-Employed (Not Incorporated) | 7 | 7.8% |
| Not-for-profit Organizations | 11 | 12.2% |
| Local Government Employees | 24 | 26.7% |
| State Government Employees | 0 | 0.0% |
| Federal Government Employees | 2 | 2.2% |
| Unpaid Family Workers | 0 | 0.0% |
| Total | 90 | 100.0% |
Employment Status by Age in Highland Park
According to the labor force statistics for Highland Park, out of the total population over 16 years of age (136), 67.6% or 92 individuals are in the labor force, with 2.2% or 2 of them unemployed. The age group with the highest labor force participation rate is 20 to 24 years, with 100.0% or 3 individuals in the labor force. Within the labor force, the 60 to 64 years age range has the highest percentage of unemployed individuals, with 25.0% or 2 of them being unemployed.
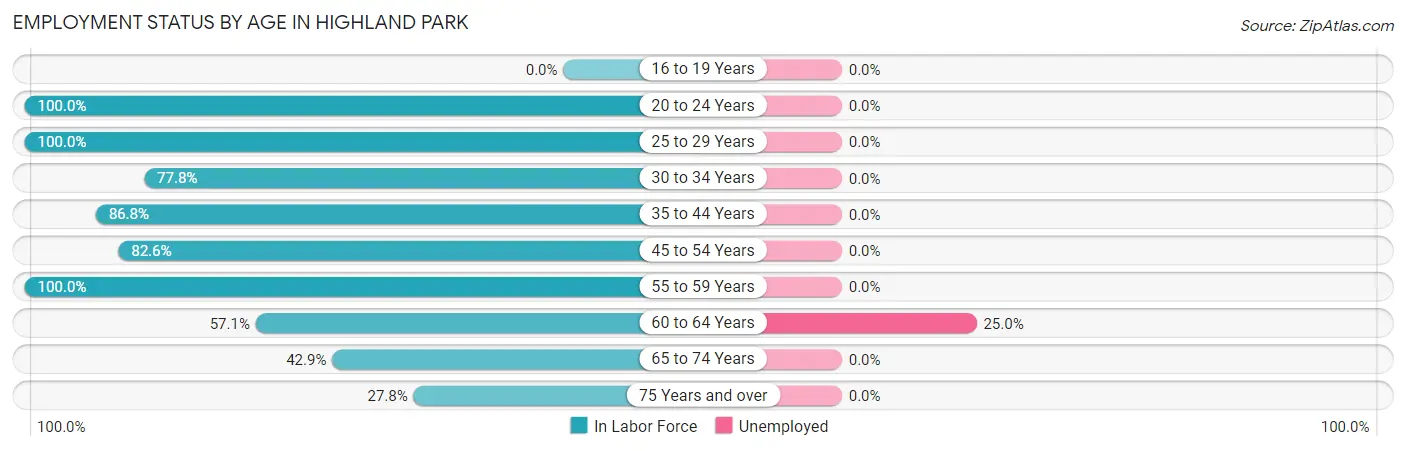
| Age Bracket | In Labor Force | Unemployed |
| 16 to 19 Years | 0 (0.0%) | 0 (0.0%) |
| 20 to 24 Years | 3 (100.0%) | 0 (0.0%) |
| 25 to 29 Years | 7 (100.0%) | 0 (0.0%) |
| 30 to 34 Years | 7 (77.8%) | 0 (0.0%) |
| 35 to 44 Years | 33 (86.8%) | 0 (0.0%) |
| 45 to 54 Years | 19 (82.6%) | 0 (0.0%) |
| 55 to 59 Years | 1 (100.0%) | 0 (0.0%) |
| 60 to 64 Years | 8 (57.1%) | 2 (25.0%) |
| 65 to 74 Years | 9 (42.9%) | 0 (0.0%) |
| 75 Years and over | 5 (27.8%) | 0 (0.0%) |
| Total | 92 (67.6%) | 2 (2.2%) |
Employment Status by Educational Attainment in Highland Park
According to labor force statistics for Highland Park, 81.5% of individuals (75) out of the total population between 25 and 64 years of age (92) are in the labor force, with 2.7% or 2 of them being unemployed. The group with the highest labor force participation rate are those with the educational attainment of bachelor's degree or higher, with 86.5% or 45 individuals in the labor force. Within the labor force, individuals with bachelor's degree or higher education have the highest percentage of unemployment, with 4.7% or 2 of them being unemployed.
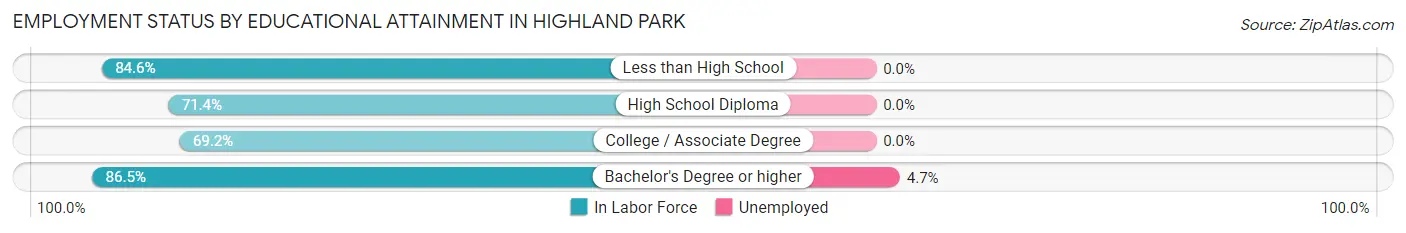
| Educational Attainment | In Labor Force | Unemployed |
| Less than High School | 11 (84.6%) | 0 (0.0%) |
| High School Diploma | 10 (71.4%) | 0 (0.0%) |
| College / Associate Degree | 9 (69.2%) | 0 (0.0%) |
| Bachelor's Degree or higher | 45 (86.5%) | 2 (4.7%) |
| Total | 75 (81.5%) | 2 (2.7%) |
Employment Occupations by Sex in Highland Park
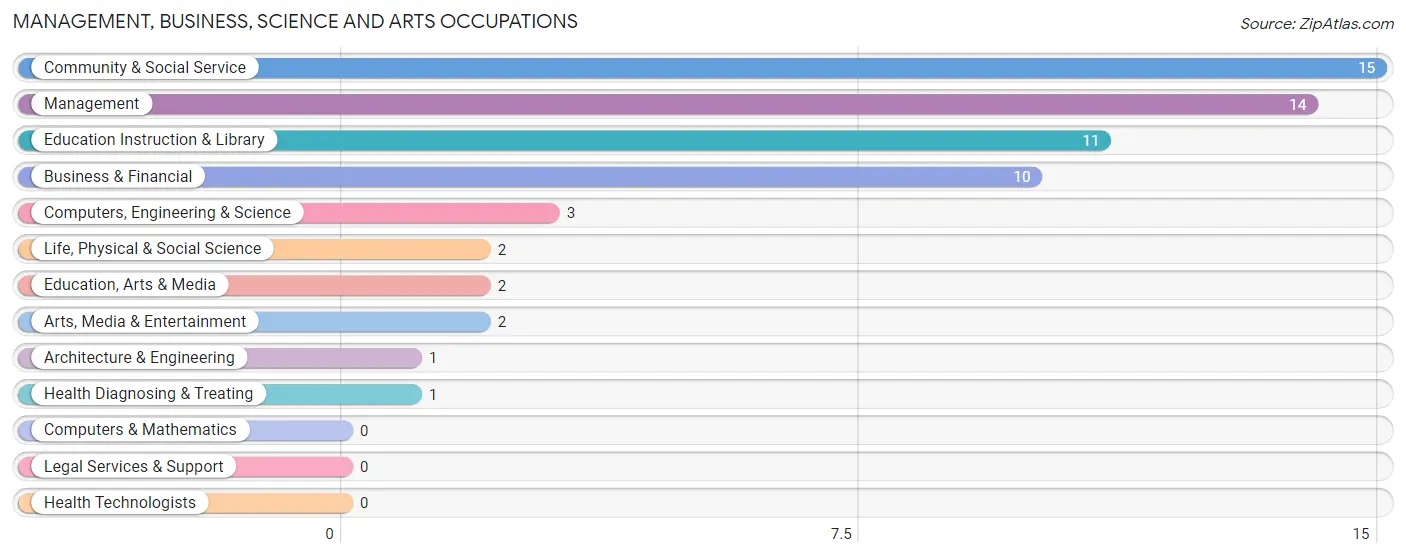
Management, Business, Science and Arts Occupations
The most common Management, Business, Science and Arts occupations in Highland Park are Community & Social Service (15 | 17.1%), Management (14 | 15.9%), Education Instruction & Library (11 | 12.5%), Business & Financial (10 | 11.4%), and Computers, Engineering & Science (3 | 3.4%).
Management, Business, Science and Arts Occupations by Sex
Within the Management, Business, Science and Arts occupations in Highland Park, the most male-oriented occupations are Management (100.0%), Computers, Engineering & Science (100.0%), and Architecture & Engineering (100.0%), while the most female-oriented occupations are Education Instruction & Library (100.0%), Arts, Media & Entertainment (100.0%), and Health Diagnosing & Treating (100.0%).
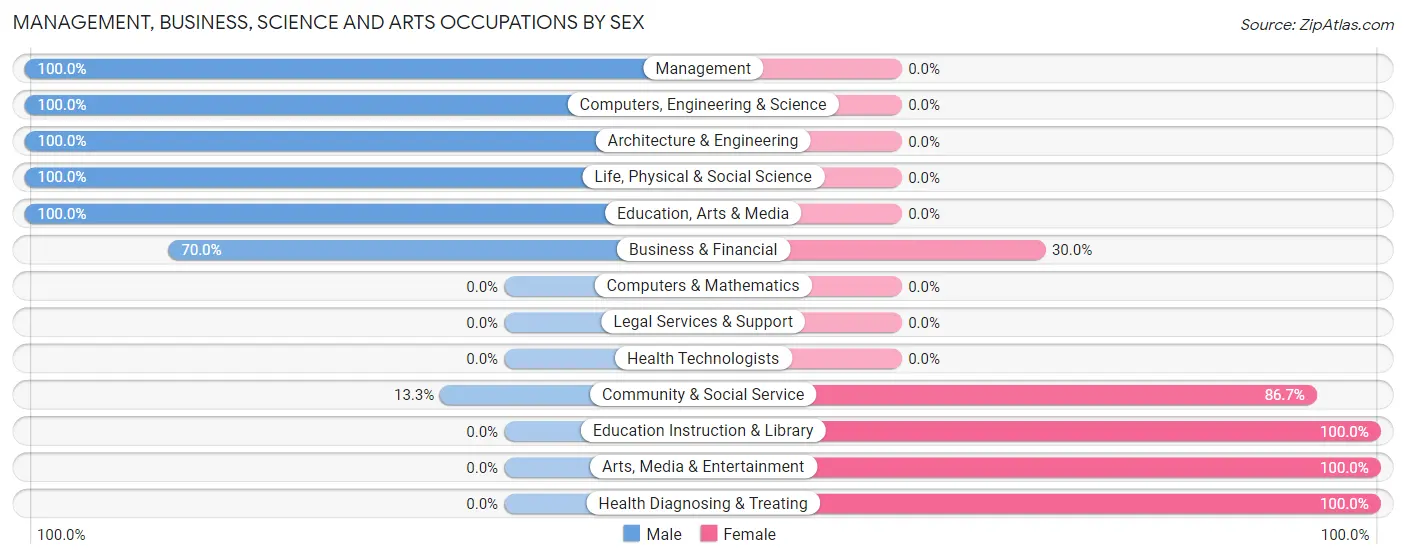
| Occupation | Male | Female |
| Management | 14 (100.0%) | 0 (0.0%) |
| Business & Financial | 7 (70.0%) | 3 (30.0%) |
| Computers, Engineering & Science | 3 (100.0%) | 0 (0.0%) |
| Computers & Mathematics | 0 (0.0%) | 0 (0.0%) |
| Architecture & Engineering | 1 (100.0%) | 0 (0.0%) |
| Life, Physical & Social Science | 2 (100.0%) | 0 (0.0%) |
| Community & Social Service | 2 (13.3%) | 13 (86.7%) |
| Education, Arts & Media | 2 (100.0%) | 0 (0.0%) |
| Legal Services & Support | 0 (0.0%) | 0 (0.0%) |
| Education Instruction & Library | 0 (0.0%) | 11 (100.0%) |
| Arts, Media & Entertainment | 0 (0.0%) | 2 (100.0%) |
| Health Diagnosing & Treating | 0 (0.0%) | 1 (100.0%) |
| Health Technologists | 0 (0.0%) | 0 (0.0%) |
| Total (Category) | 26 (60.5%) | 17 (39.5%) |
| Total (Overall) | 52 (59.1%) | 36 (40.9%) |
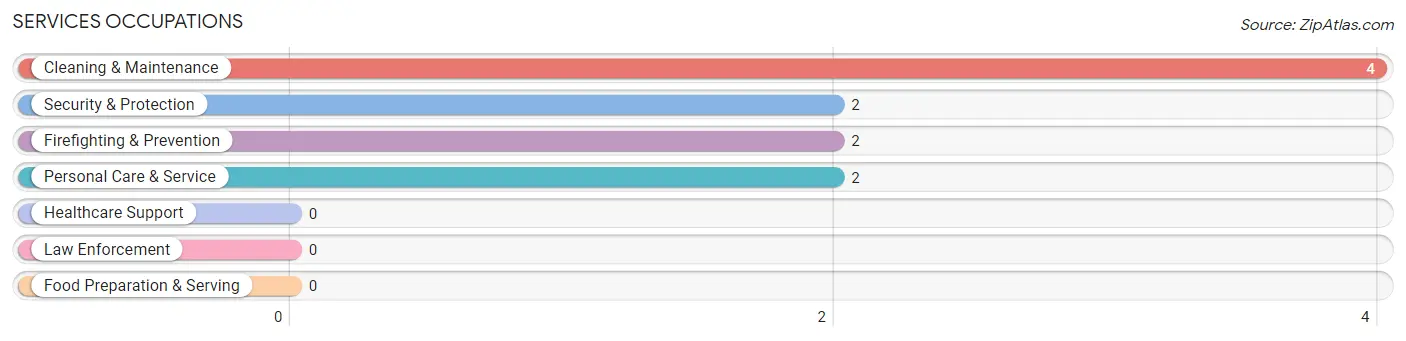
Services Occupations
The most common Services occupations in Highland Park are Cleaning & Maintenance (4 | 4.5%), Security & Protection (2 | 2.3%), Firefighting & Prevention (2 | 2.3%), and Personal Care & Service (2 | 2.3%).
Services Occupations by Sex
Within the Services occupations in Highland Park, the most male-oriented occupations are Security & Protection (100.0%), and Firefighting & Prevention (100.0%), while the most female-oriented occupations are Cleaning & Maintenance (100.0%), and Personal Care & Service (100.0%).
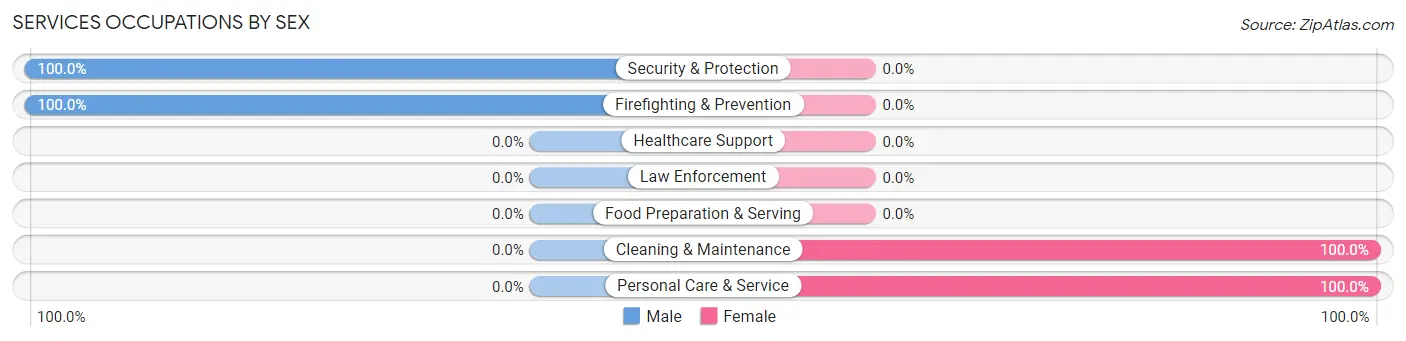
| Occupation | Male | Female |
| Healthcare Support | 0 (0.0%) | 0 (0.0%) |
| Security & Protection | 2 (100.0%) | 0 (0.0%) |
| Firefighting & Prevention | 2 (100.0%) | 0 (0.0%) |
| Law Enforcement | 0 (0.0%) | 0 (0.0%) |
| Food Preparation & Serving | 0 (0.0%) | 0 (0.0%) |
| Cleaning & Maintenance | 0 (0.0%) | 4 (100.0%) |
| Personal Care & Service | 0 (0.0%) | 2 (100.0%) |
| Total (Category) | 2 (25.0%) | 6 (75.0%) |
| Total (Overall) | 52 (59.1%) | 36 (40.9%) |
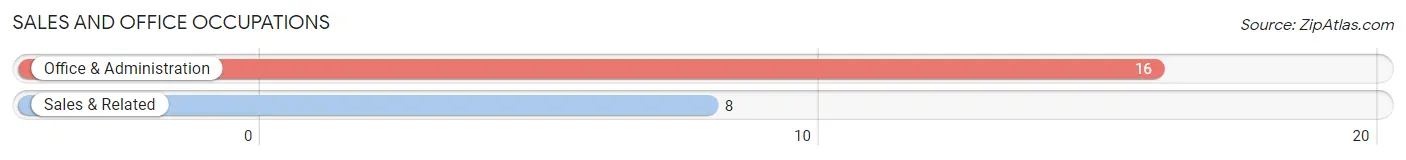
Sales and Office Occupations
The most common Sales and Office occupations in Highland Park are Office & Administration (16 | 18.2%), and Sales & Related (8 | 9.1%).
Sales and Office Occupations by Sex
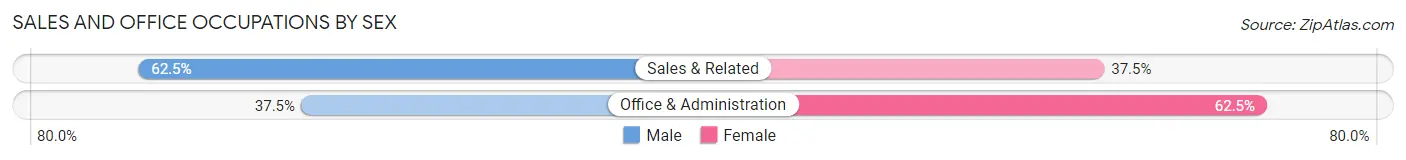
| Occupation | Male | Female |
| Sales & Related | 5 (62.5%) | 3 (37.5%) |
| Office & Administration | 6 (37.5%) | 10 (62.5%) |
| Total (Category) | 11 (45.8%) | 13 (54.2%) |
| Total (Overall) | 52 (59.1%) | 36 (40.9%) |
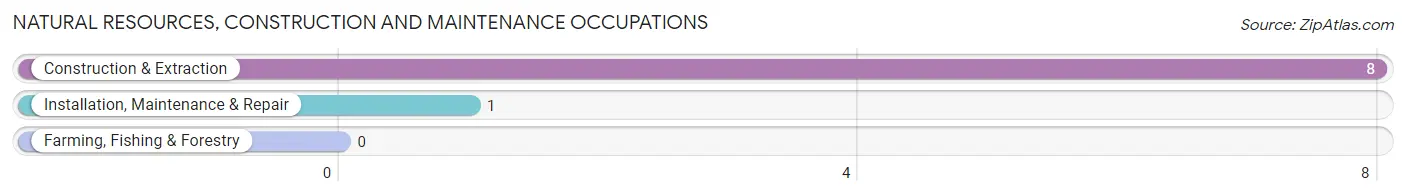
Natural Resources, Construction and Maintenance Occupations
The most common Natural Resources, Construction and Maintenance occupations in Highland Park are Construction & Extraction (8 | 9.1%), and Installation, Maintenance & Repair (1 | 1.1%).
Natural Resources, Construction and Maintenance Occupations by Sex
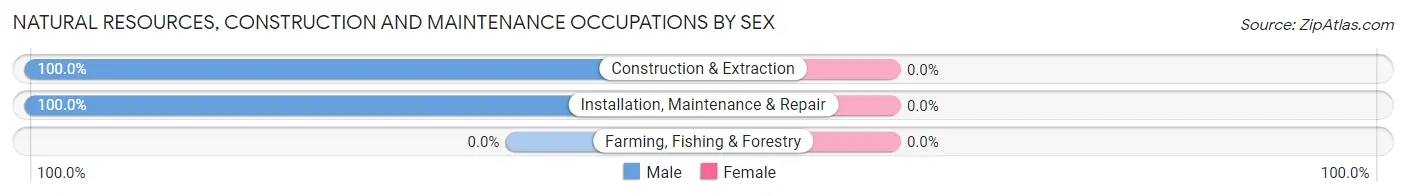
| Occupation | Male | Female |
| Farming, Fishing & Forestry | 0 (0.0%) | 0 (0.0%) |
| Construction & Extraction | 8 (100.0%) | 0 (0.0%) |
| Installation, Maintenance & Repair | 1 (100.0%) | 0 (0.0%) |
| Total (Category) | 9 (100.0%) | 0 (0.0%) |
| Total (Overall) | 52 (59.1%) | 36 (40.9%) |
Production, Transportation and Moving Occupations
The most common Production, Transportation and Moving occupations in Highland Park are , and Production (4 | 4.5%).
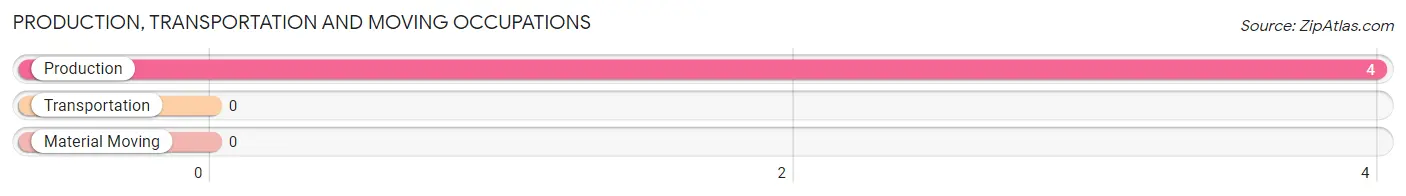
Production, Transportation and Moving Occupations by Sex
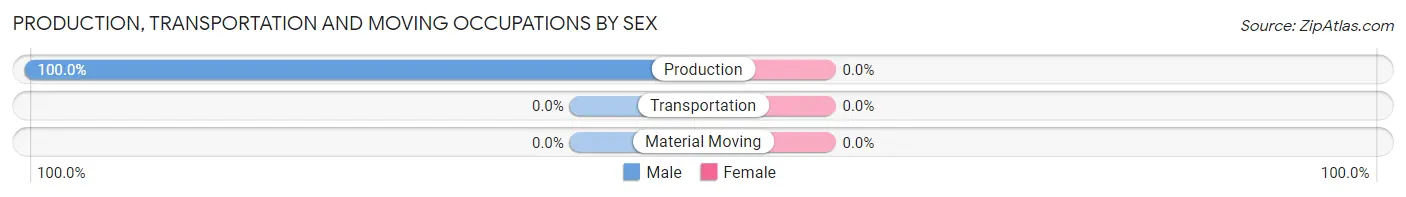
| Occupation | Male | Female |
| Production | 4 (100.0%) | 0 (0.0%) |
| Transportation | 0 (0.0%) | 0 (0.0%) |
| Material Moving | 0 (0.0%) | 0 (0.0%) |
| Total (Category) | 4 (100.0%) | 0 (0.0%) |
| Total (Overall) | 52 (59.1%) | 36 (40.9%) |
Employment Industries by Sex in Highland Park
Employment Industries in Highland Park
The major employment industries in Highland Park include Educational Services (17 | 19.3%), Construction (12 | 13.6%), Finance & Insurance (9 | 10.2%), Retail Trade (8 | 9.1%), and Professional & Scientific (7 | 8.0%).
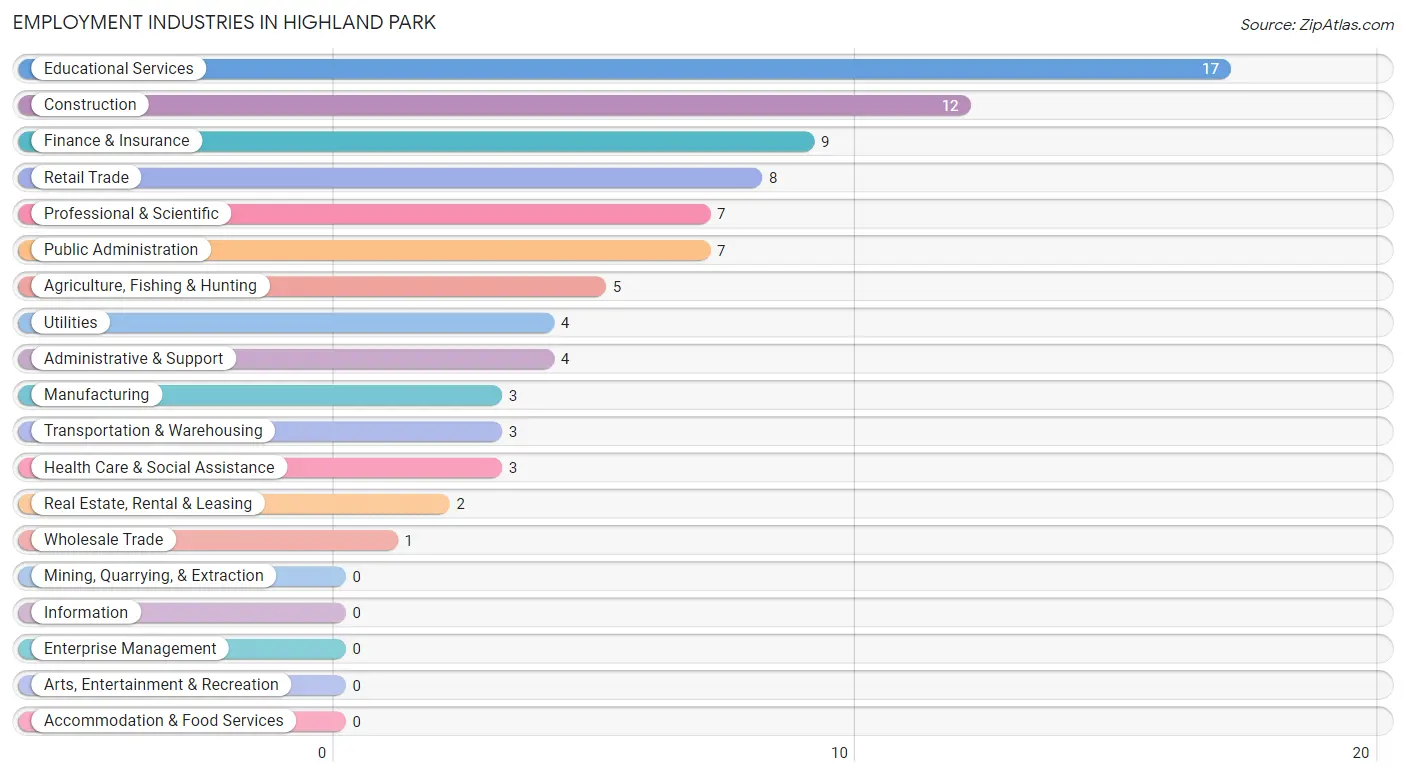
Employment Industries by Sex in Highland Park
The Highland Park industries that see more men than women are Agriculture, Fishing & Hunting (100.0%), Construction (100.0%), and Wholesale Trade (100.0%), whereas the industries that tend to have a higher number of women are Administrative & Support (100.0%), Educational Services (94.1%), and Retail Trade (75.0%).
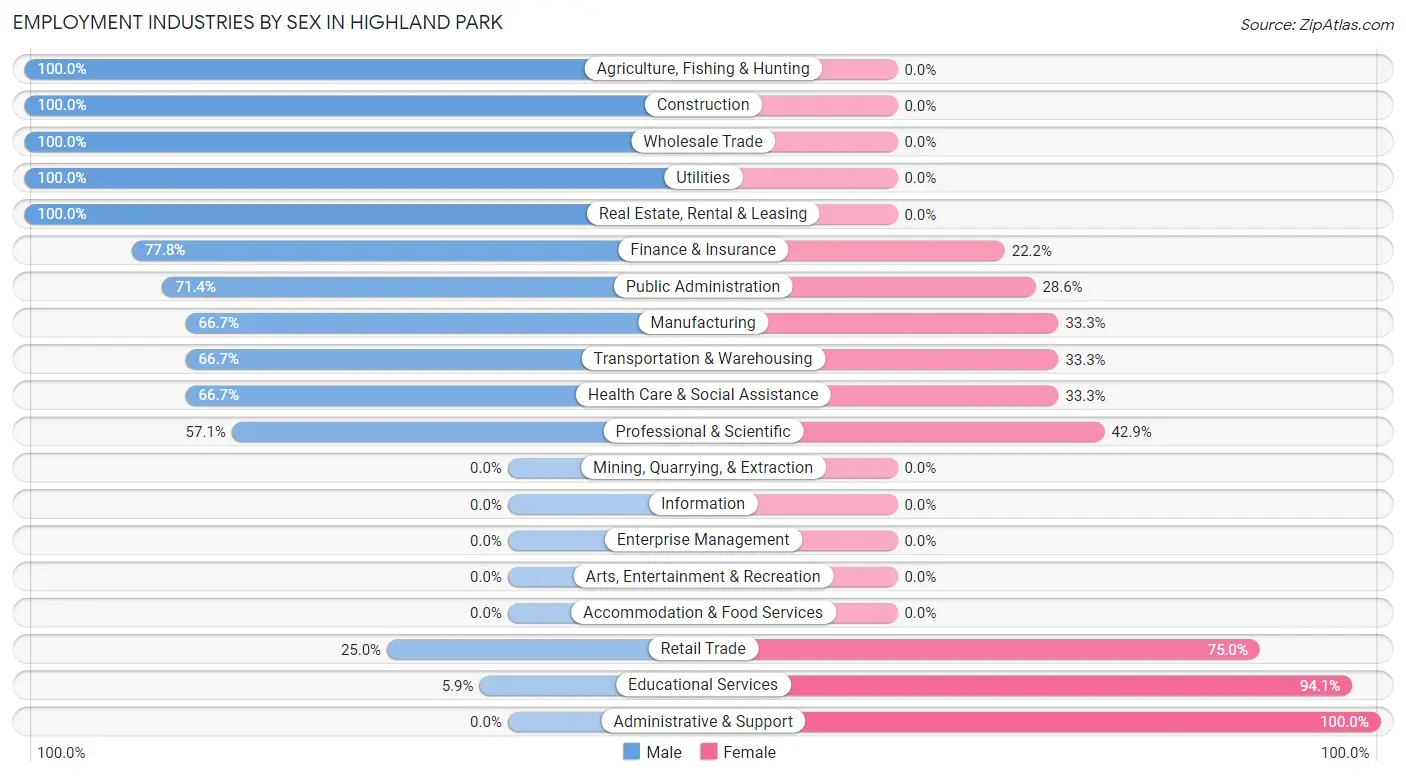
| Industry | Male | Female |
| Agriculture, Fishing & Hunting | 5 (100.0%) | 0 (0.0%) |
| Mining, Quarrying, & Extraction | 0 (0.0%) | 0 (0.0%) |
| Construction | 12 (100.0%) | 0 (0.0%) |
| Manufacturing | 2 (66.7%) | 1 (33.3%) |
| Wholesale Trade | 1 (100.0%) | 0 (0.0%) |
| Retail Trade | 2 (25.0%) | 6 (75.0%) |
| Transportation & Warehousing | 2 (66.7%) | 1 (33.3%) |
| Utilities | 4 (100.0%) | 0 (0.0%) |
| Information | 0 (0.0%) | 0 (0.0%) |
| Finance & Insurance | 7 (77.8%) | 2 (22.2%) |
| Real Estate, Rental & Leasing | 2 (100.0%) | 0 (0.0%) |
| Professional & Scientific | 4 (57.1%) | 3 (42.9%) |
| Enterprise Management | 0 (0.0%) | 0 (0.0%) |
| Administrative & Support | 0 (0.0%) | 4 (100.0%) |
| Educational Services | 1 (5.9%) | 16 (94.1%) |
| Health Care & Social Assistance | 2 (66.7%) | 1 (33.3%) |
| Arts, Entertainment & Recreation | 0 (0.0%) | 0 (0.0%) |
| Accommodation & Food Services | 0 (0.0%) | 0 (0.0%) |
| Public Administration | 5 (71.4%) | 2 (28.6%) |
| Total | 52 (59.1%) | 36 (40.9%) |
Education in Highland Park
School Enrollment in Highland Park
The most common levels of schooling among the 41 students in Highland Park are middle school (17 | 41.5%), elementary school (11 | 26.8%), and nursery / preschool (7 | 17.1%).
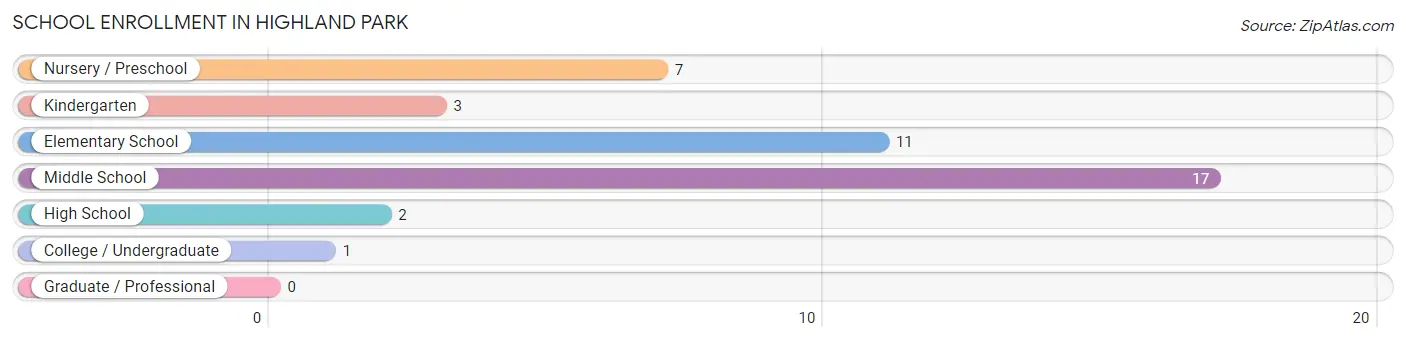
| School Level | # Students | % Students |
| Nursery / Preschool | 7 | 17.1% |
| Kindergarten | 3 | 7.3% |
| Elementary School | 11 | 26.8% |
| Middle School | 17 | 41.5% |
| High School | 2 | 4.9% |
| College / Undergraduate | 1 | 2.4% |
| Graduate / Professional | 0 | 0.0% |
| Total | 41 | 100.0% |
School Enrollment by Age by Funding Source in Highland Park
Out of a total of 41 students who are enrolled in schools in Highland Park, 12 (29.3%) attend a private institution, while the remaining 29 (70.7%) are enrolled in public schools. The age group of 3 to 4 year olds has the highest likelihood of being enrolled in private schools, with 6 (85.7% in the age bracket) enrolled. Conversely, the age group of 15 to 17 year olds has the lowest likelihood of being enrolled in a private school, with 2 (100.0% in the age bracket) attending a public institution.
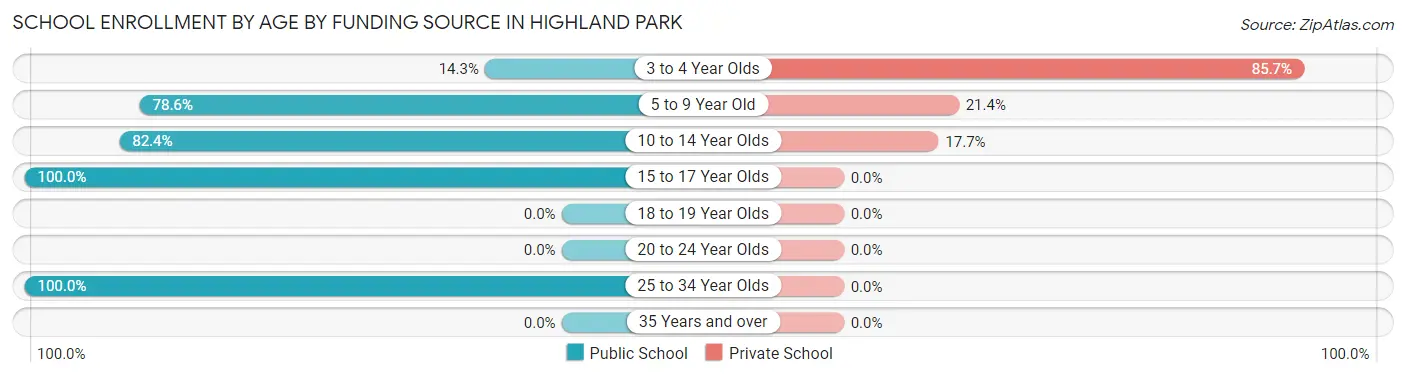
| Age Bracket | Public School | Private School |
| 3 to 4 Year Olds | 1 (14.3%) | 6 (85.7%) |
| 5 to 9 Year Old | 11 (78.6%) | 3 (21.4%) |
| 10 to 14 Year Olds | 14 (82.4%) | 3 (17.6%) |
| 15 to 17 Year Olds | 2 (100.0%) | 0 (0.0%) |
| 18 to 19 Year Olds | 0 (0.0%) | 0 (0.0%) |
| 20 to 24 Year Olds | 0 (0.0%) | 0 (0.0%) |
| 25 to 34 Year Olds | 1 (100.0%) | 0 (0.0%) |
| 35 Years and over | 0 (0.0%) | 0 (0.0%) |
| Total | 29 (70.7%) | 12 (29.3%) |
Educational Attainment by Field of Study in Highland Park
Business (21 | 26.9%), education (11 | 14.1%), bio, nature & agricultural (10 | 12.8%), liberal arts & history (8 | 10.3%), and literature & languages (7 | 9.0%) are the most common fields of study among 78 individuals in Highland Park who have obtained a bachelor's degree or higher.
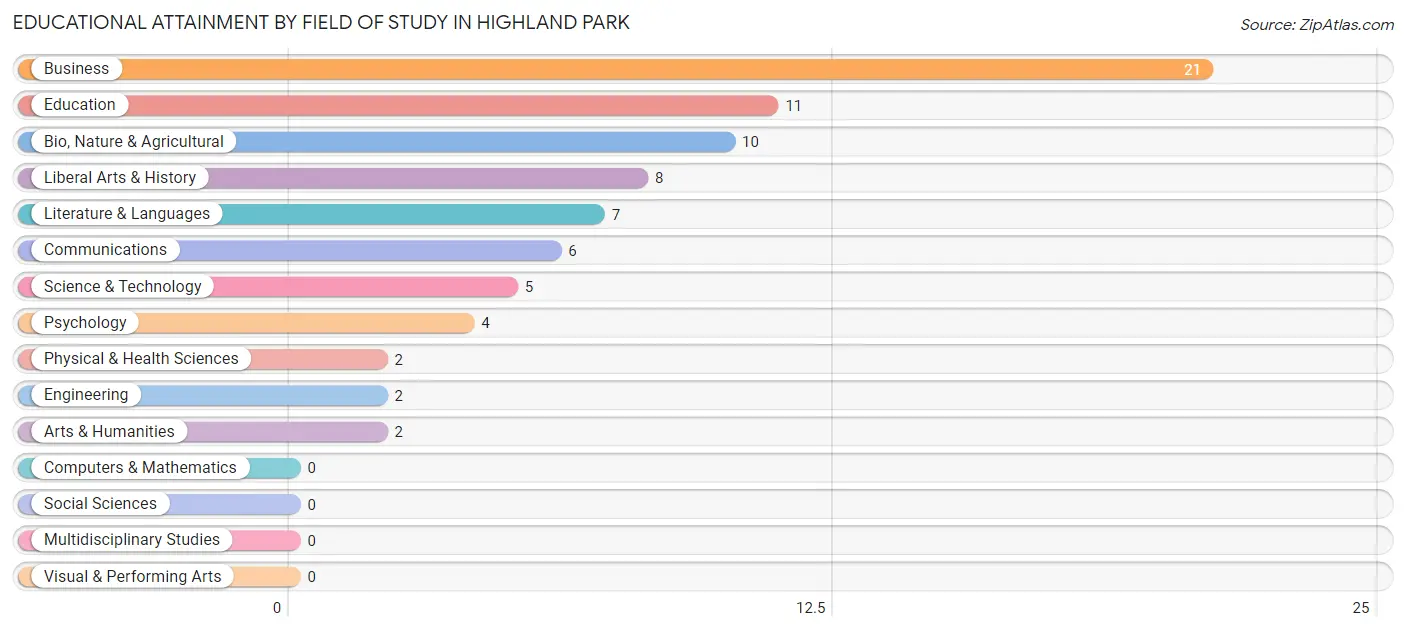
| Field of Study | # Graduates | % Graduates |
| Computers & Mathematics | 0 | 0.0% |
| Bio, Nature & Agricultural | 10 | 12.8% |
| Physical & Health Sciences | 2 | 2.6% |
| Psychology | 4 | 5.1% |
| Social Sciences | 0 | 0.0% |
| Engineering | 2 | 2.6% |
| Multidisciplinary Studies | 0 | 0.0% |
| Science & Technology | 5 | 6.4% |
| Business | 21 | 26.9% |
| Education | 11 | 14.1% |
| Literature & Languages | 7 | 9.0% |
| Liberal Arts & History | 8 | 10.3% |
| Visual & Performing Arts | 0 | 0.0% |
| Communications | 6 | 7.7% |
| Arts & Humanities | 2 | 2.6% |
| Total | 78 | 100.0% |
Transportation & Commute in Highland Park
Vehicle Availability by Sex in Highland Park
The most prevalent vehicle ownership categories in Highland Park are males with 2 vehicles (29, accounting for 53.7%) and females with 2 vehicles (17, making up 80.6%).
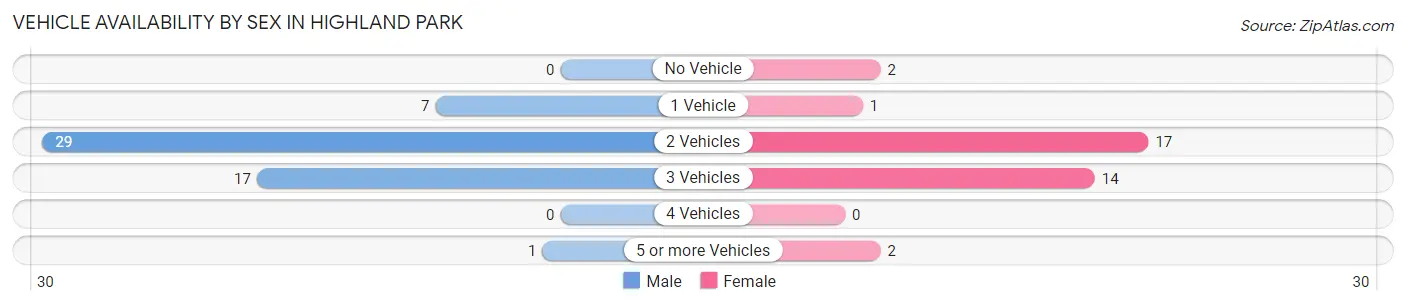
| Vehicles Available | Male | Female |
| No Vehicle | 0 (0.0%) | 2 (5.6%) |
| 1 Vehicle | 7 (13.0%) | 1 (2.8%) |
| 2 Vehicles | 29 (53.7%) | 17 (47.2%) |
| 3 Vehicles | 17 (31.5%) | 14 (38.9%) |
| 4 Vehicles | 0 (0.0%) | 0 (0.0%) |
| 5 or more Vehicles | 1 (1.8%) | 2 (5.6%) |
| Total | 54 (100.0%) | 36 (100.0%) |
Commute Time in Highland Park
The most frequently occuring commute durations in Highland Park are 5 to 9 minutes (20 commuters, 24.4%), 10 to 14 minutes (18 commuters, 22.0%), and 15 to 19 minutes (11 commuters, 13.4%).
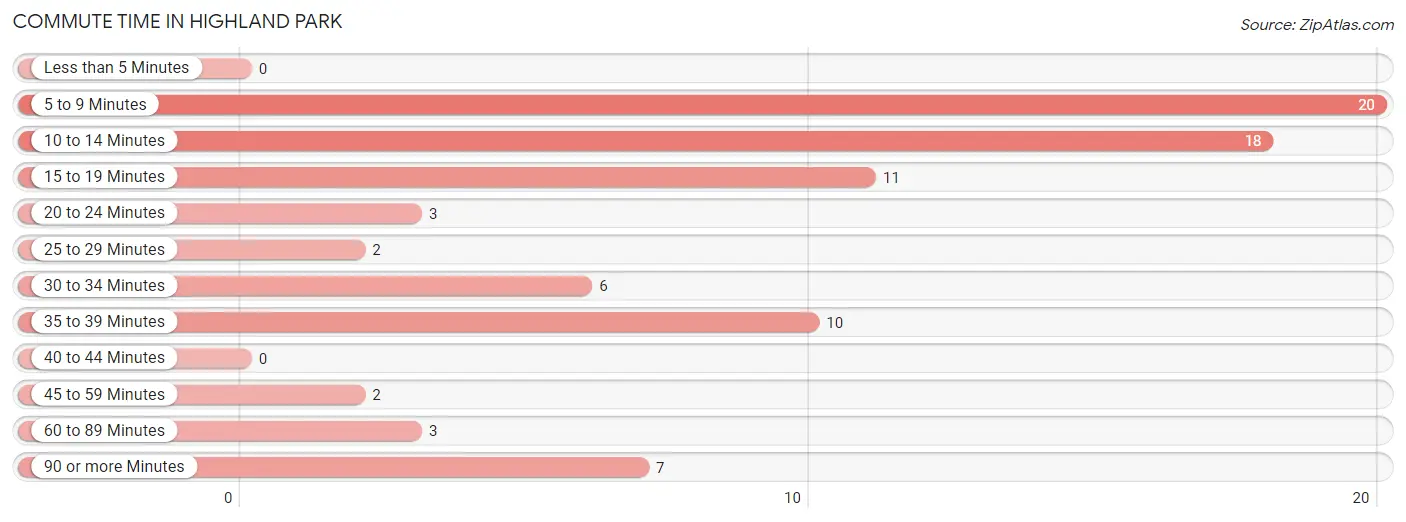
| Commute Time | # Commuters | % Commuters |
| Less than 5 Minutes | 0 | 0.0% |
| 5 to 9 Minutes | 20 | 24.4% |
| 10 to 14 Minutes | 18 | 22.0% |
| 15 to 19 Minutes | 11 | 13.4% |
| 20 to 24 Minutes | 3 | 3.7% |
| 25 to 29 Minutes | 2 | 2.4% |
| 30 to 34 Minutes | 6 | 7.3% |
| 35 to 39 Minutes | 10 | 12.2% |
| 40 to 44 Minutes | 0 | 0.0% |
| 45 to 59 Minutes | 2 | 2.4% |
| 60 to 89 Minutes | 3 | 3.7% |
| 90 or more Minutes | 7 | 8.5% |
Commute Time by Sex in Highland Park
The most common commute times in Highland Park are 5 to 9 minutes (13 commuters, 25.0%) for males and 15 to 19 minutes (9 commuters, 30.0%) for females.
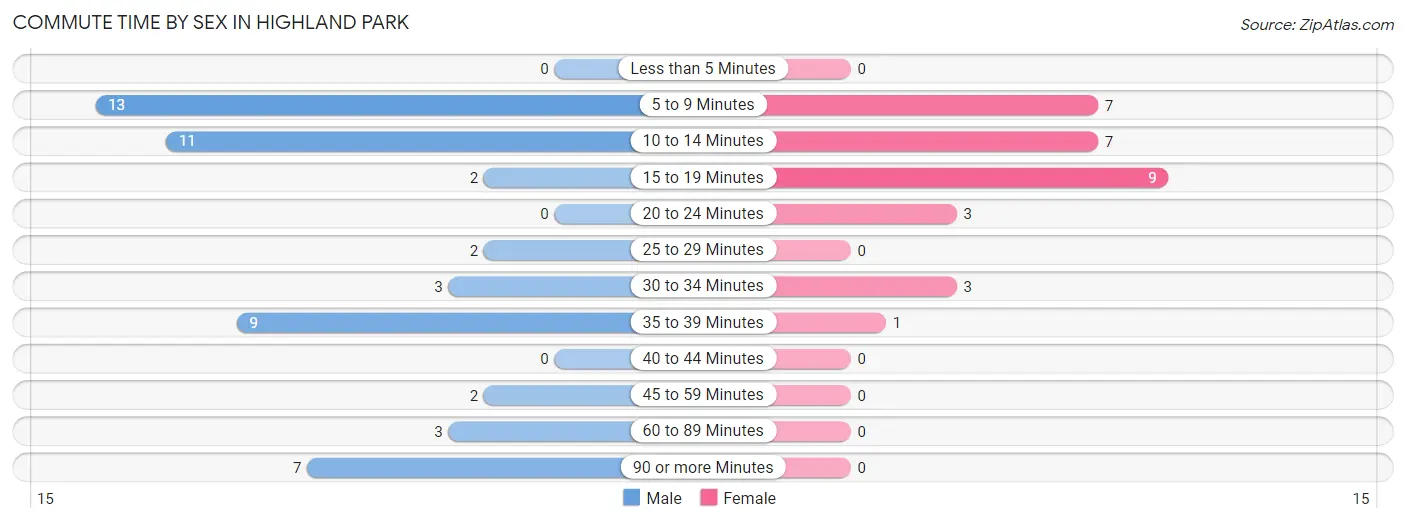
| Commute Time | Male | Female |
| Less than 5 Minutes | 0 (0.0%) | 0 (0.0%) |
| 5 to 9 Minutes | 13 (25.0%) | 7 (23.3%) |
| 10 to 14 Minutes | 11 (21.1%) | 7 (23.3%) |
| 15 to 19 Minutes | 2 (3.8%) | 9 (30.0%) |
| 20 to 24 Minutes | 0 (0.0%) | 3 (10.0%) |
| 25 to 29 Minutes | 2 (3.8%) | 0 (0.0%) |
| 30 to 34 Minutes | 3 (5.8%) | 3 (10.0%) |
| 35 to 39 Minutes | 9 (17.3%) | 1 (3.3%) |
| 40 to 44 Minutes | 0 (0.0%) | 0 (0.0%) |
| 45 to 59 Minutes | 2 (3.8%) | 0 (0.0%) |
| 60 to 89 Minutes | 3 (5.8%) | 0 (0.0%) |
| 90 or more Minutes | 7 (13.5%) | 0 (0.0%) |
Time of Departure to Work by Sex in Highland Park
The most frequent times of departure to work in Highland Park are 7:00 AM to 7:29 AM (13, 25.0%) for males and 9:00 AM to 9:59 AM (10, 33.3%) for females.
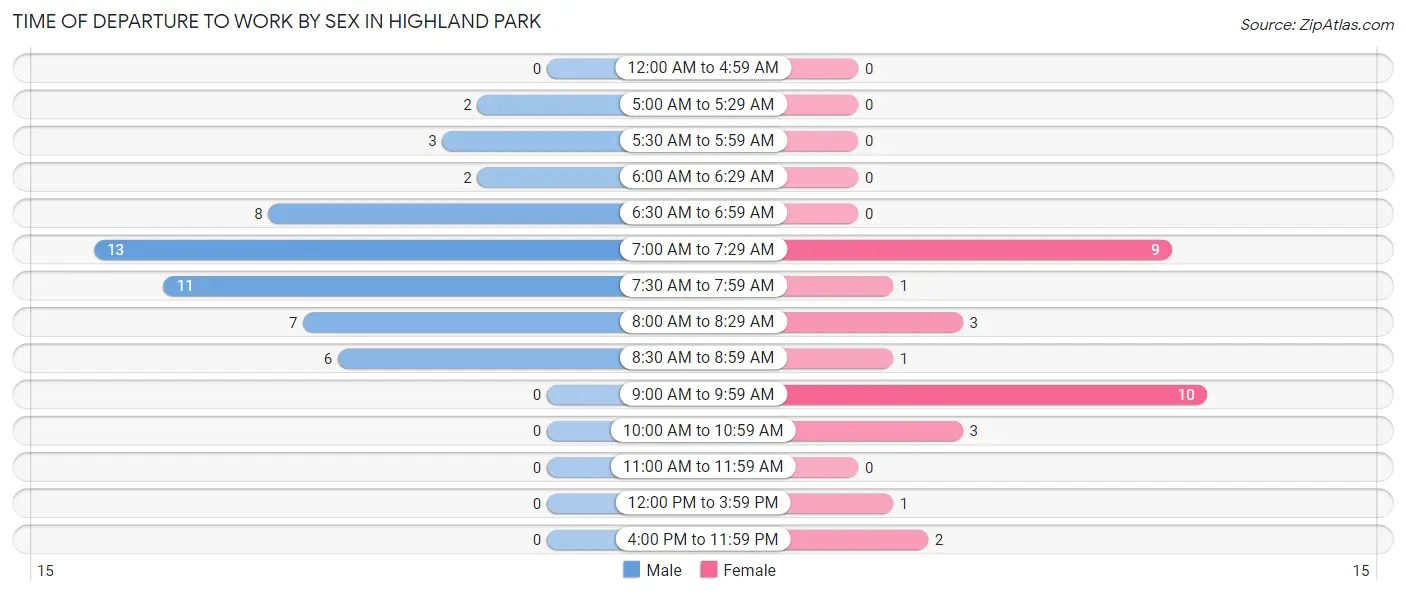
| Time of Departure | Male | Female |
| 12:00 AM to 4:59 AM | 0 (0.0%) | 0 (0.0%) |
| 5:00 AM to 5:29 AM | 2 (3.8%) | 0 (0.0%) |
| 5:30 AM to 5:59 AM | 3 (5.8%) | 0 (0.0%) |
| 6:00 AM to 6:29 AM | 2 (3.8%) | 0 (0.0%) |
| 6:30 AM to 6:59 AM | 8 (15.4%) | 0 (0.0%) |
| 7:00 AM to 7:29 AM | 13 (25.0%) | 9 (30.0%) |
| 7:30 AM to 7:59 AM | 11 (21.1%) | 1 (3.3%) |
| 8:00 AM to 8:29 AM | 7 (13.5%) | 3 (10.0%) |
| 8:30 AM to 8:59 AM | 6 (11.5%) | 1 (3.3%) |
| 9:00 AM to 9:59 AM | 0 (0.0%) | 10 (33.3%) |
| 10:00 AM to 10:59 AM | 0 (0.0%) | 3 (10.0%) |
| 11:00 AM to 11:59 AM | 0 (0.0%) | 0 (0.0%) |
| 12:00 PM to 3:59 PM | 0 (0.0%) | 1 (3.3%) |
| 4:00 PM to 11:59 PM | 0 (0.0%) | 2 (6.7%) |
| Total | 52 (100.0%) | 30 (100.0%) |
Housing Occupancy in Highland Park
Occupancy by Ownership in Highland Park
Of the total 67 dwellings in Highland Park, owner-occupied units account for 67 (100.0%), while renter-occupied units make up 0 (0.0%).
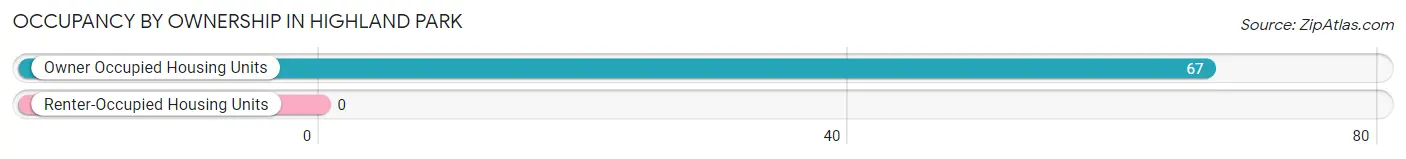
| Occupancy | # Housing Units | % Housing Units |
| Owner Occupied Housing Units | 67 | 100.0% |
| Renter-Occupied Housing Units | 0 | 0.0% |
| Total Occupied Housing Units | 67 | 100.0% |
Occupancy by Household Size in Highland Park
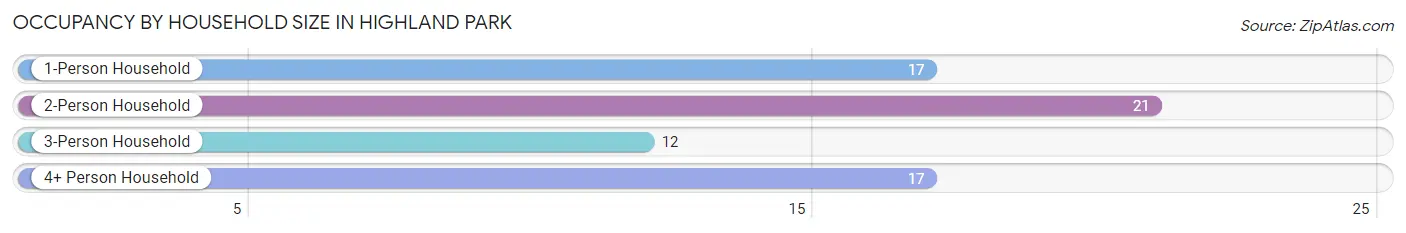
| Household Size | # Housing Units | % Housing Units |
| 1-Person Household | 17 | 25.4% |
| 2-Person Household | 21 | 31.3% |
| 3-Person Household | 12 | 17.9% |
| 4+ Person Household | 17 | 25.4% |
| Total Housing Units | 67 | 100.0% |
Occupancy by Ownership by Household Size in Highland Park
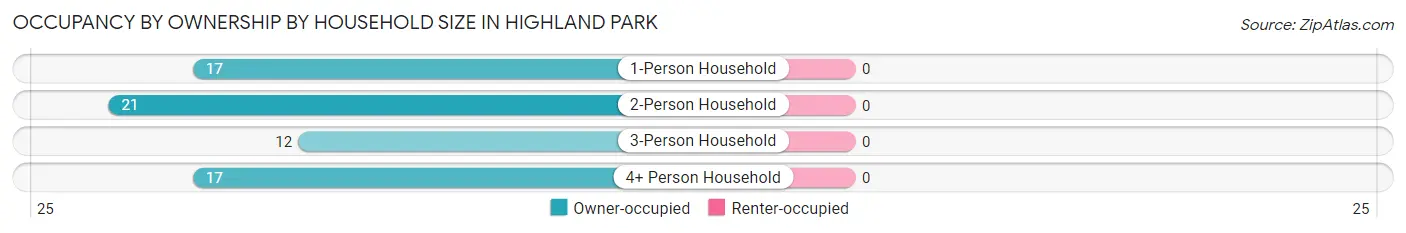
| Household Size | Owner-occupied | Renter-occupied |
| 1-Person Household | 17 (100.0%) | 0 (0.0%) |
| 2-Person Household | 21 (100.0%) | 0 (0.0%) |
| 3-Person Household | 12 (100.0%) | 0 (0.0%) |
| 4+ Person Household | 17 (100.0%) | 0 (0.0%) |
| Total Housing Units | 67 (100.0%) | 0 (0.0%) |
Occupancy by Educational Attainment in Highland Park
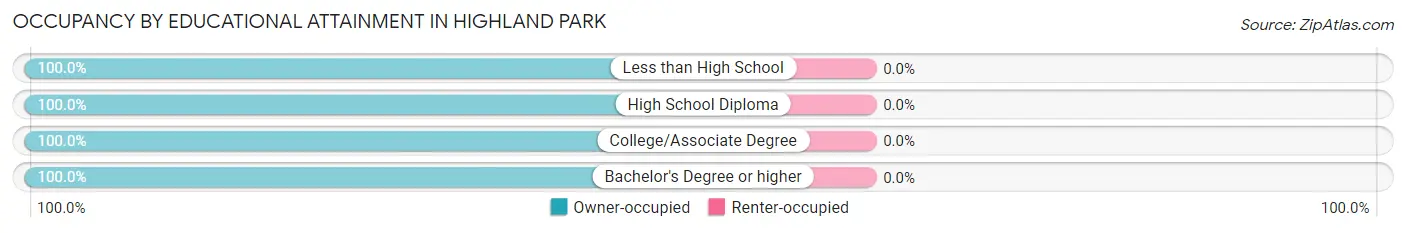
| Household Size | Owner-occupied | Renter-occupied |
| Less than High School | 9 (100.0%) | 0 (0.0%) |
| High School Diploma | 5 (100.0%) | 0 (0.0%) |
| College/Associate Degree | 16 (100.0%) | 0 (0.0%) |
| Bachelor's Degree or higher | 37 (100.0%) | 0 (0.0%) |
Occupancy by Age of Householder in Highland Park
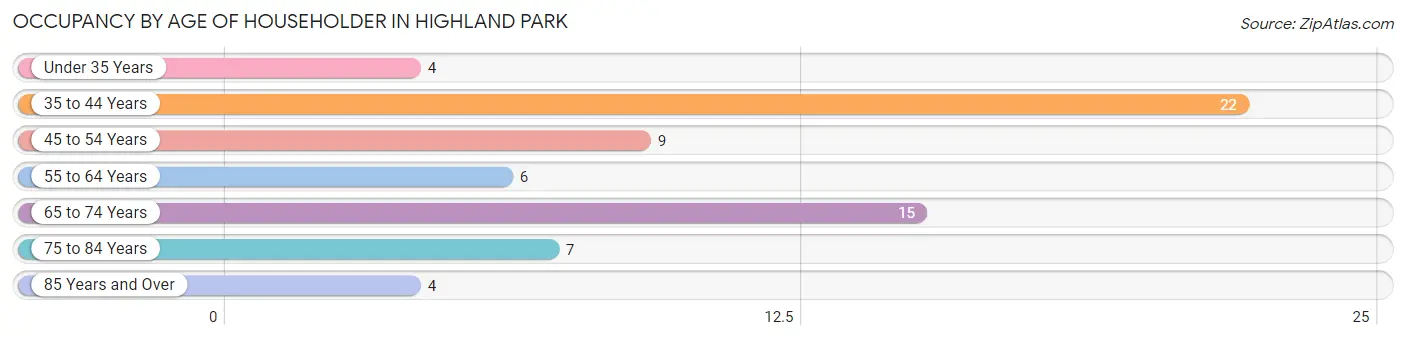
| Age Bracket | # Households | % Households |
| Under 35 Years | 4 | 6.0% |
| 35 to 44 Years | 22 | 32.8% |
| 45 to 54 Years | 9 | 13.4% |
| 55 to 64 Years | 6 | 9.0% |
| 65 to 74 Years | 15 | 22.4% |
| 75 to 84 Years | 7 | 10.4% |
| 85 Years and Over | 4 | 6.0% |
| Total | 67 | 100.0% |
Housing Finances in Highland Park
Median Income by Occupancy in Highland Park
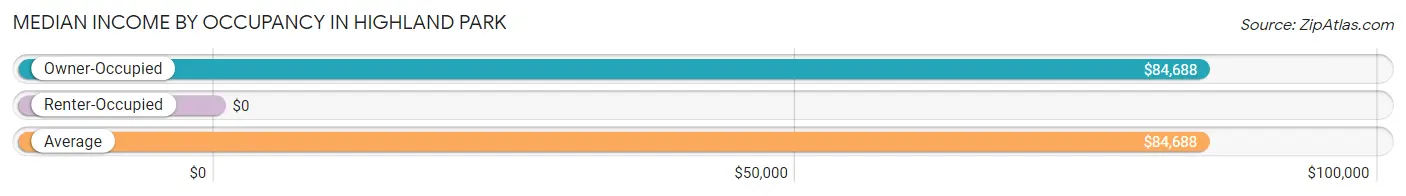
| Occupancy Type | # Households | Median Income |
| Owner-Occupied | 67 (100.0%) | $84,688 |
| Renter-Occupied | 0 (0.0%) | $0 |
| Average | 67 (100.0%) | $84,688 |
Occupancy by Householder Income Bracket in Highland Park
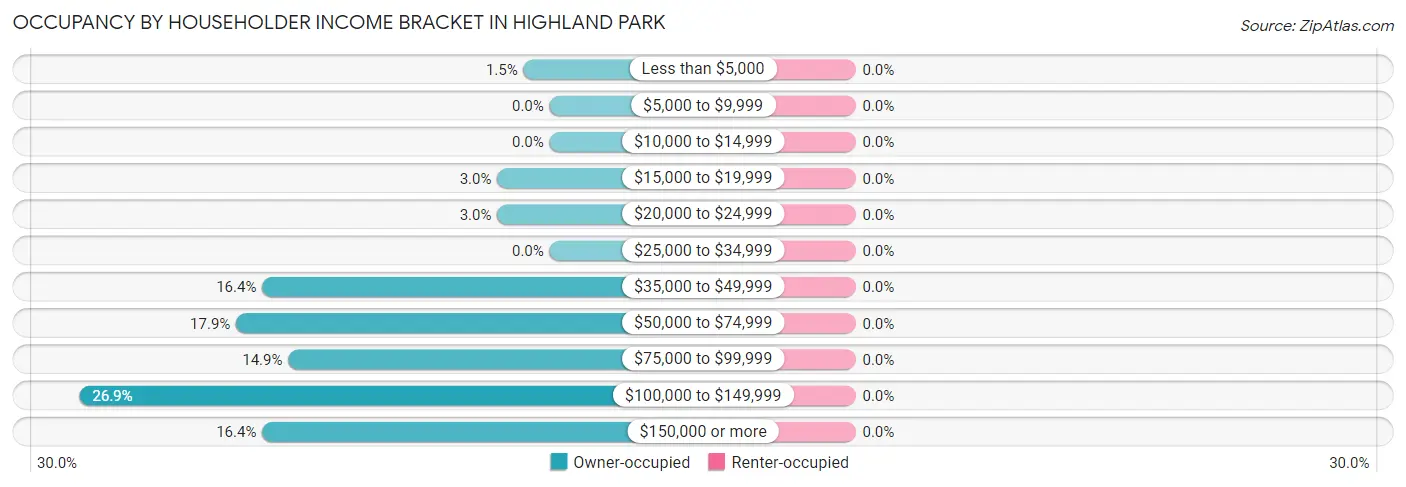
| Income Bracket | Owner-occupied | Renter-occupied |
| Less than $5,000 | 1 (1.5%) | 0 (0.0%) |
| $5,000 to $9,999 | 0 (0.0%) | 0 (0.0%) |
| $10,000 to $14,999 | 0 (0.0%) | 0 (0.0%) |
| $15,000 to $19,999 | 2 (3.0%) | 0 (0.0%) |
| $20,000 to $24,999 | 2 (3.0%) | 0 (0.0%) |
| $25,000 to $34,999 | 0 (0.0%) | 0 (0.0%) |
| $35,000 to $49,999 | 11 (16.4%) | 0 (0.0%) |
| $50,000 to $74,999 | 12 (17.9%) | 0 (0.0%) |
| $75,000 to $99,999 | 10 (14.9%) | 0 (0.0%) |
| $100,000 to $149,999 | 18 (26.9%) | 0 (0.0%) |
| $150,000 or more | 11 (16.4%) | 0 (0.0%) |
| Total | 67 (100.0%) | 0 (0.0%) |
Monthly Housing Cost Tiers in Highland Park
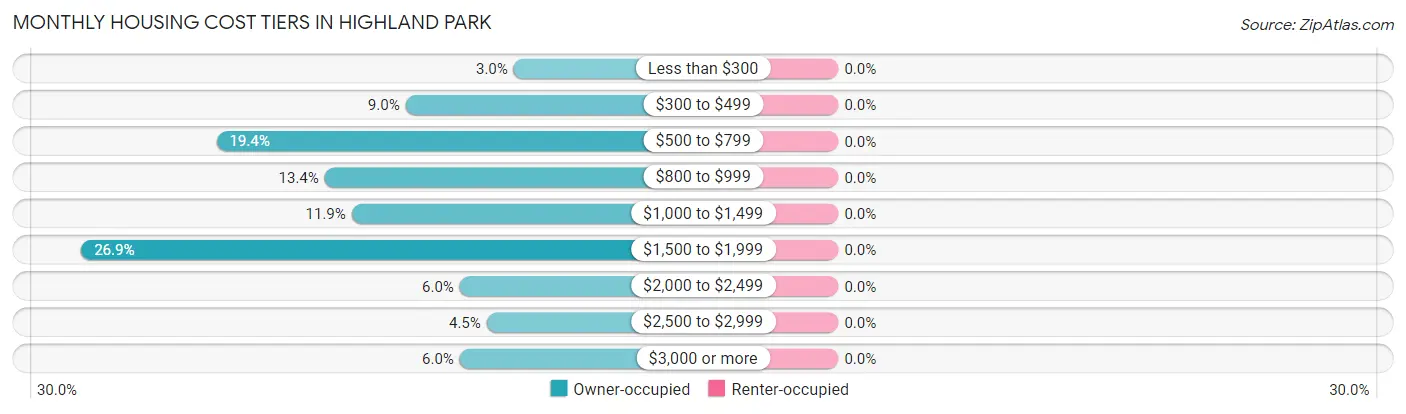
| Monthly Cost | Owner-occupied | Renter-occupied |
| Less than $300 | 2 (3.0%) | 0 (0.0%) |
| $300 to $499 | 6 (9.0%) | 0 (0.0%) |
| $500 to $799 | 13 (19.4%) | 0 (0.0%) |
| $800 to $999 | 9 (13.4%) | 0 (0.0%) |
| $1,000 to $1,499 | 8 (11.9%) | 0 (0.0%) |
| $1,500 to $1,999 | 18 (26.9%) | 0 (0.0%) |
| $2,000 to $2,499 | 4 (6.0%) | 0 (0.0%) |
| $2,500 to $2,999 | 3 (4.5%) | 0 (0.0%) |
| $3,000 or more | 4 (6.0%) | 0 (0.0%) |
| Total | 67 (100.0%) | 0 (0.0%) |
Physical Housing Characteristics in Highland Park
Housing Structures in Highland Park
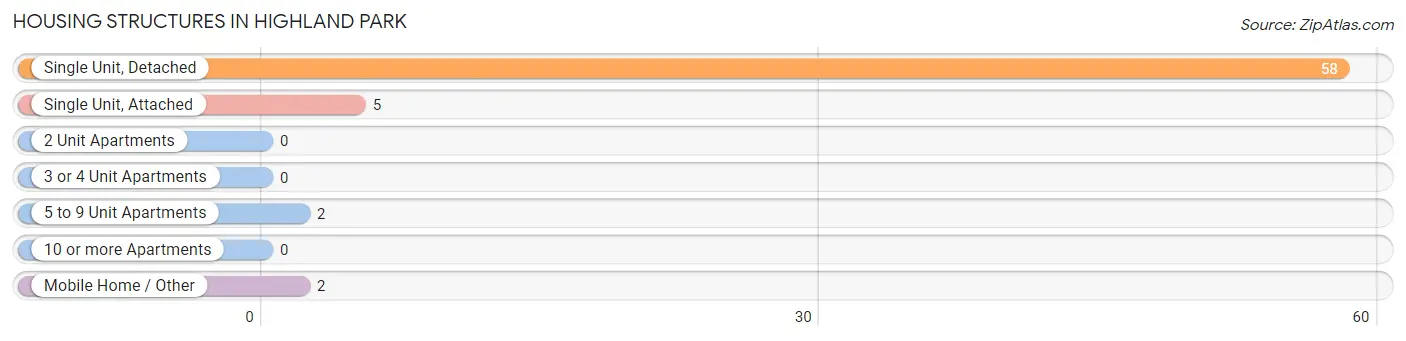
| Structure Type | # Housing Units | % Housing Units |
| Single Unit, Detached | 58 | 86.6% |
| Single Unit, Attached | 5 | 7.5% |
| 2 Unit Apartments | 0 | 0.0% |
| 3 or 4 Unit Apartments | 0 | 0.0% |
| 5 to 9 Unit Apartments | 2 | 3.0% |
| 10 or more Apartments | 0 | 0.0% |
| Mobile Home / Other | 2 | 3.0% |
| Total | 67 | 100.0% |
Housing Structures by Occupancy in Highland Park
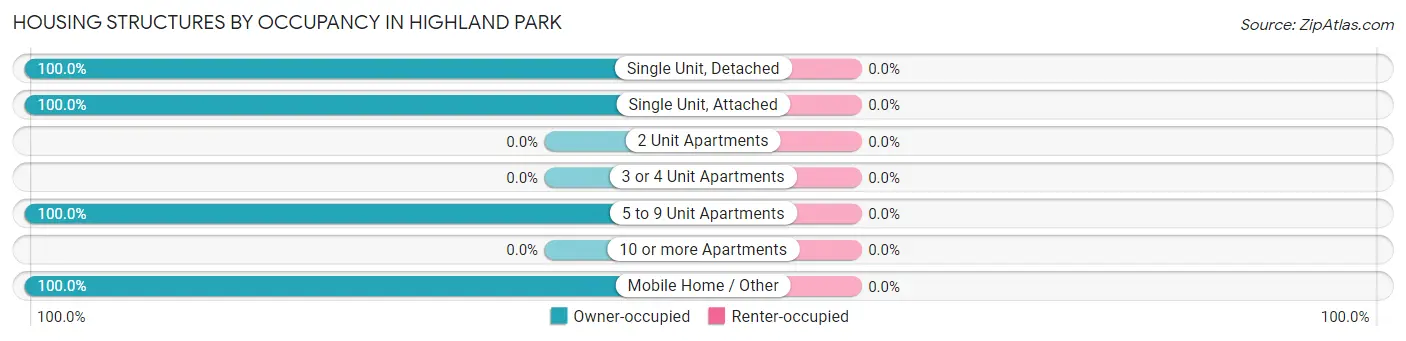
| Structure Type | Owner-occupied | Renter-occupied |
| Single Unit, Detached | 58 (100.0%) | 0 (0.0%) |
| Single Unit, Attached | 5 (100.0%) | 0 (0.0%) |
| 2 Unit Apartments | 0 (0.0%) | 0 (0.0%) |
| 3 or 4 Unit Apartments | 0 (0.0%) | 0 (0.0%) |
| 5 to 9 Unit Apartments | 2 (100.0%) | 0 (0.0%) |
| 10 or more Apartments | 0 (0.0%) | 0 (0.0%) |
| Mobile Home / Other | 2 (100.0%) | 0 (0.0%) |
| Total | 67 (100.0%) | 0 (0.0%) |
Housing Structures by Number of Rooms in Highland Park
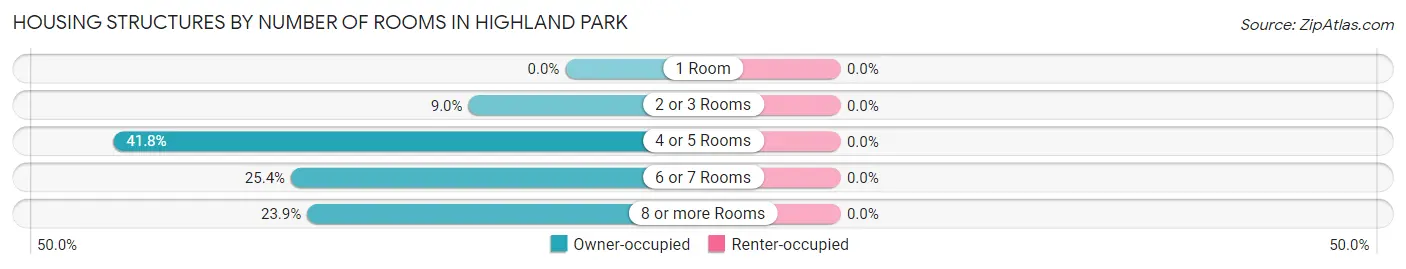
| Number of Rooms | Owner-occupied | Renter-occupied |
| 1 Room | 0 (0.0%) | 0 (0.0%) |
| 2 or 3 Rooms | 6 (9.0%) | 0 (0.0%) |
| 4 or 5 Rooms | 28 (41.8%) | 0 (0.0%) |
| 6 or 7 Rooms | 17 (25.4%) | 0 (0.0%) |
| 8 or more Rooms | 16 (23.9%) | 0 (0.0%) |
| Total | 67 (100.0%) | 0 (0.0%) |
Housing Structure by Heating Type in Highland Park
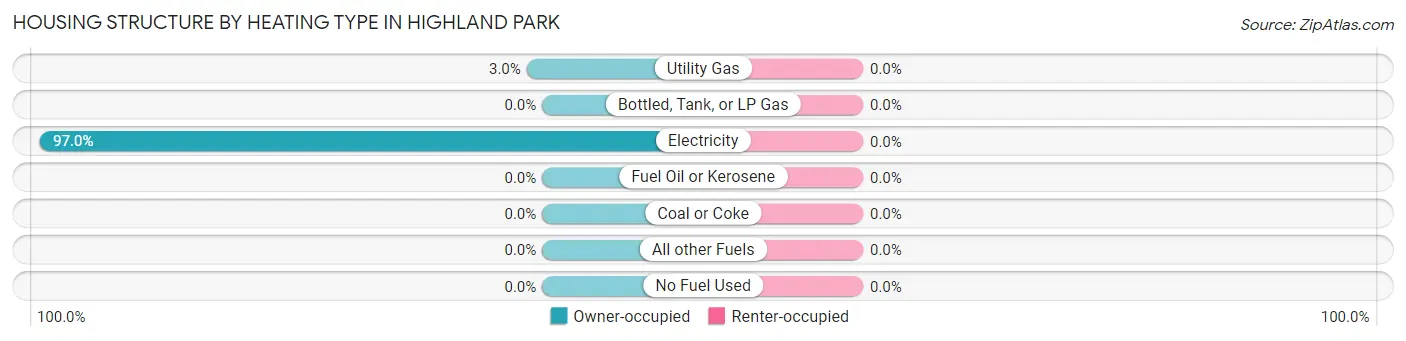
| Heating Type | Owner-occupied | Renter-occupied |
| Utility Gas | 2 (3.0%) | 0 (0.0%) |
| Bottled, Tank, or LP Gas | 0 (0.0%) | 0 (0.0%) |
| Electricity | 65 (97.0%) | 0 (0.0%) |
| Fuel Oil or Kerosene | 0 (0.0%) | 0 (0.0%) |
| Coal or Coke | 0 (0.0%) | 0 (0.0%) |
| All other Fuels | 0 (0.0%) | 0 (0.0%) |
| No Fuel Used | 0 (0.0%) | 0 (0.0%) |
| Total | 67 (100.0%) | 0 (0.0%) |
Household Vehicle Usage in Highland Park
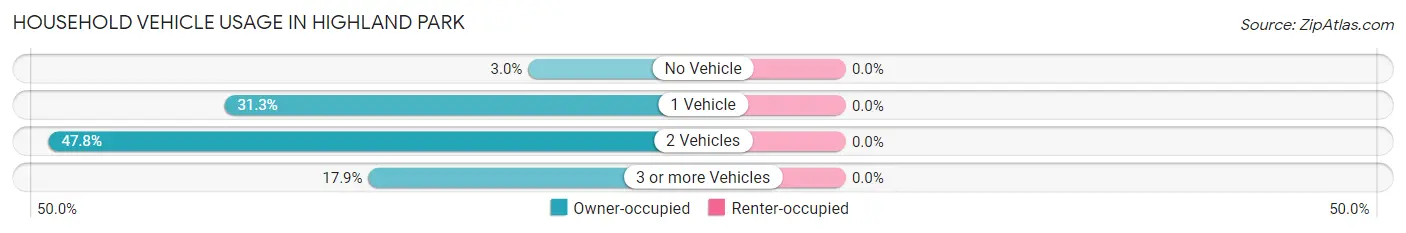
| Vehicles per Household | Owner-occupied | Renter-occupied |
| No Vehicle | 2 (3.0%) | 0 (0.0%) |
| 1 Vehicle | 21 (31.3%) | 0 (0.0%) |
| 2 Vehicles | 32 (47.8%) | 0 (0.0%) |
| 3 or more Vehicles | 12 (17.9%) | 0 (0.0%) |
| Total | 67 (100.0%) | 0 (0.0%) |
Real Estate & Mortgages in Highland Park
Real Estate and Mortgage Overview in Highland Park
| Characteristic | Without Mortgage | With Mortgage |
| Housing Units | 25 | 42 |
| Median Property Value | $256,300 | $337,500 |
| Median Household Income | $59,375 | $8 |
| Monthly Housing Costs | $625 | $4 |
| Real Estate Taxes | $2,667 | $4 |
Property Value by Mortgage Status in Highland Park
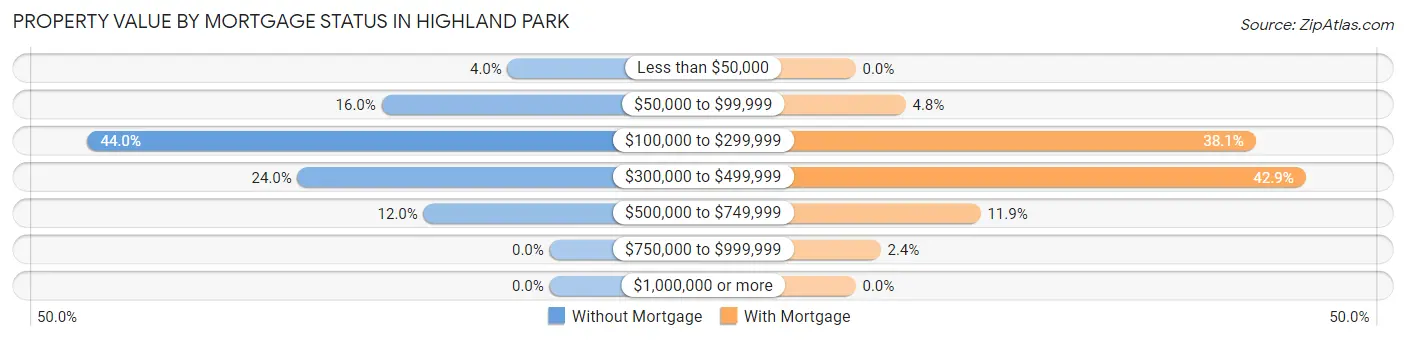
| Property Value | Without Mortgage | With Mortgage |
| Less than $50,000 | 1 (4.0%) | 0 (0.0%) |
| $50,000 to $99,999 | 4 (16.0%) | 2 (4.8%) |
| $100,000 to $299,999 | 11 (44.0%) | 16 (38.1%) |
| $300,000 to $499,999 | 6 (24.0%) | 18 (42.9%) |
| $500,000 to $749,999 | 3 (12.0%) | 5 (11.9%) |
| $750,000 to $999,999 | 0 (0.0%) | 1 (2.4%) |
| $1,000,000 or more | 0 (0.0%) | 0 (0.0%) |
| Total | 25 (100.0%) | 42 (100.0%) |
Household Income by Mortgage Status in Highland Park
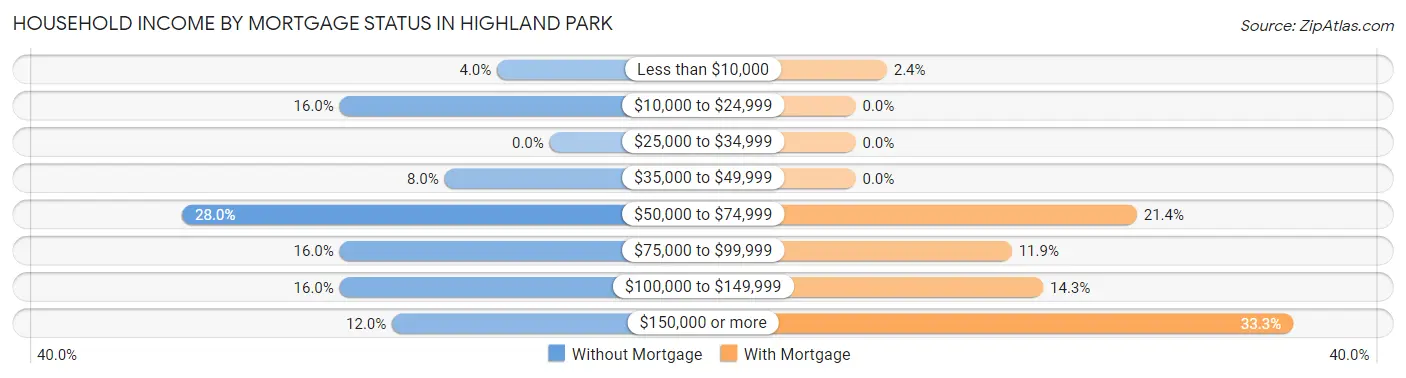
| Household Income | Without Mortgage | With Mortgage |
| Less than $10,000 | 1 (4.0%) | 1 (2.4%) |
| $10,000 to $24,999 | 4 (16.0%) | 0 (0.0%) |
| $25,000 to $34,999 | 0 (0.0%) | 0 (0.0%) |
| $35,000 to $49,999 | 2 (8.0%) | 0 (0.0%) |
| $50,000 to $74,999 | 7 (28.0%) | 9 (21.4%) |
| $75,000 to $99,999 | 4 (16.0%) | 5 (11.9%) |
| $100,000 to $149,999 | 4 (16.0%) | 6 (14.3%) |
| $150,000 or more | 3 (12.0%) | 14 (33.3%) |
| Total | 25 (100.0%) | 42 (100.0%) |
Property Value to Household Income Ratio in Highland Park
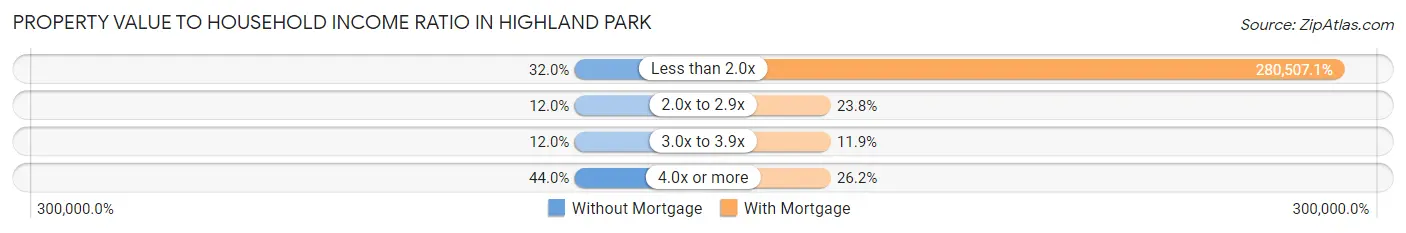
| Value-to-Income Ratio | Without Mortgage | With Mortgage |
| Less than 2.0x | 8 (32.0%) | 117,813 (280,507.1%) |
| 2.0x to 2.9x | 3 (12.0%) | 10 (23.8%) |
| 3.0x to 3.9x | 3 (12.0%) | 5 (11.9%) |
| 4.0x or more | 11 (44.0%) | 11 (26.2%) |
| Total | 25 (100.0%) | 42 (100.0%) |
Real Estate Taxes by Mortgage Status in Highland Park
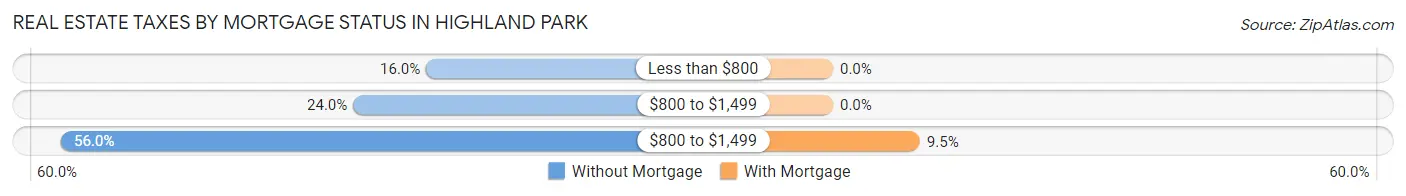
| Property Taxes | Without Mortgage | With Mortgage |
| Less than $800 | 4 (16.0%) | 0 (0.0%) |
| $800 to $1,499 | 6 (24.0%) | 0 (0.0%) |
| $800 to $1,499 | 14 (56.0%) | 4 (9.5%) |
| Total | 25 (100.0%) | 42 (100.0%) |
Health & Disability in Highland Park
Health Insurance Coverage by Age in Highland Park
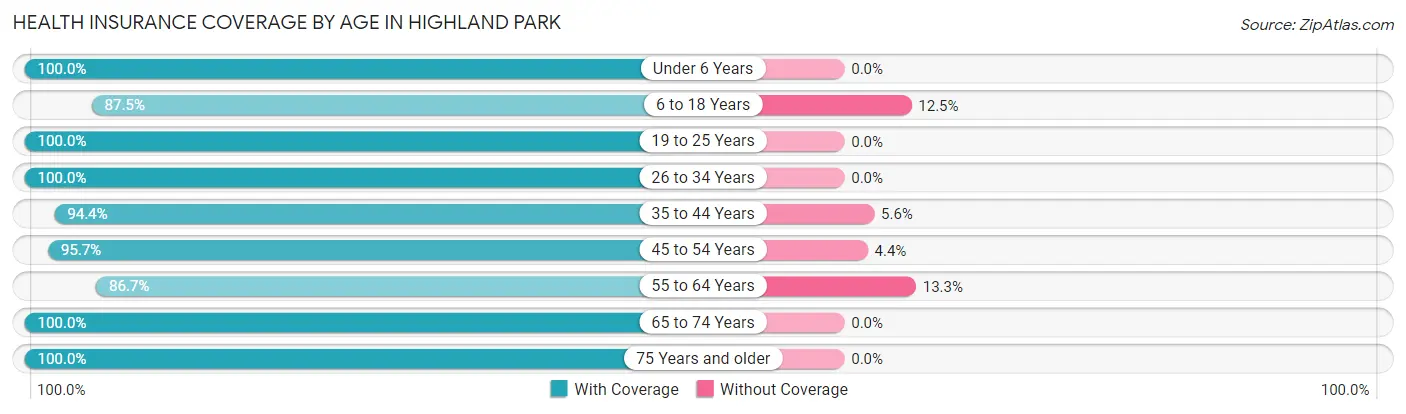
| Age Bracket | With Coverage | Without Coverage |
| Under 6 Years | 12 (100.0%) | 0 (0.0%) |
| 6 to 18 Years | 28 (87.5%) | 4 (12.5%) |
| 19 to 25 Years | 3 (100.0%) | 0 (0.0%) |
| 26 to 34 Years | 16 (100.0%) | 0 (0.0%) |
| 35 to 44 Years | 34 (94.4%) | 2 (5.6%) |
| 45 to 54 Years | 22 (95.7%) | 1 (4.3%) |
| 55 to 64 Years | 13 (86.7%) | 2 (13.3%) |
| 65 to 74 Years | 21 (100.0%) | 0 (0.0%) |
| 75 Years and older | 18 (100.0%) | 0 (0.0%) |
| Total | 167 (94.9%) | 9 (5.1%) |
Health Insurance Coverage by Citizenship Status in Highland Park
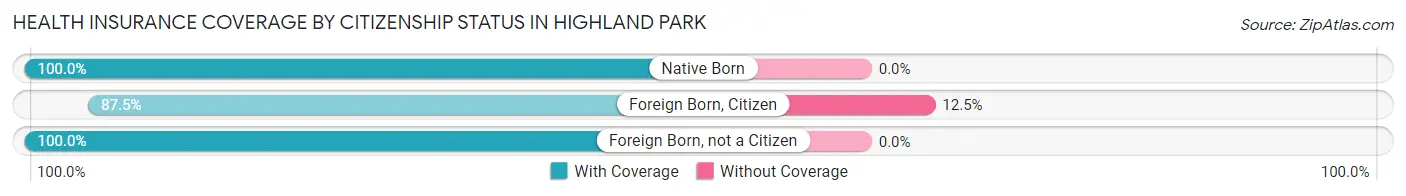
| Citizenship Status | With Coverage | Without Coverage |
| Native Born | 12 (100.0%) | 0 (0.0%) |
| Foreign Born, Citizen | 28 (87.5%) | 4 (12.5%) |
| Foreign Born, not a Citizen | 3 (100.0%) | 0 (0.0%) |
Health Insurance Coverage by Household Income in Highland Park
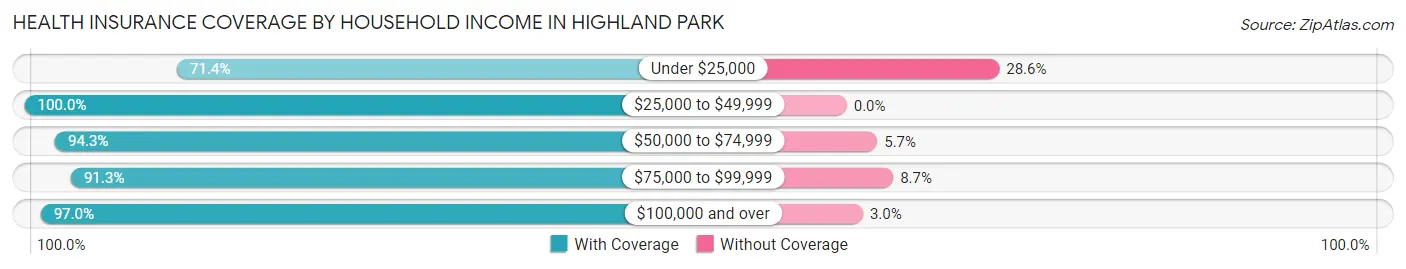
| Household Income | With Coverage | Without Coverage |
| Under $25,000 | 5 (71.4%) | 2 (28.6%) |
| $25,000 to $49,999 | 12 (100.0%) | 0 (0.0%) |
| $50,000 to $74,999 | 33 (94.3%) | 2 (5.7%) |
| $75,000 to $99,999 | 21 (91.3%) | 2 (8.7%) |
| $100,000 and over | 96 (97.0%) | 3 (3.0%) |
Public vs Private Health Insurance Coverage by Age in Highland Park
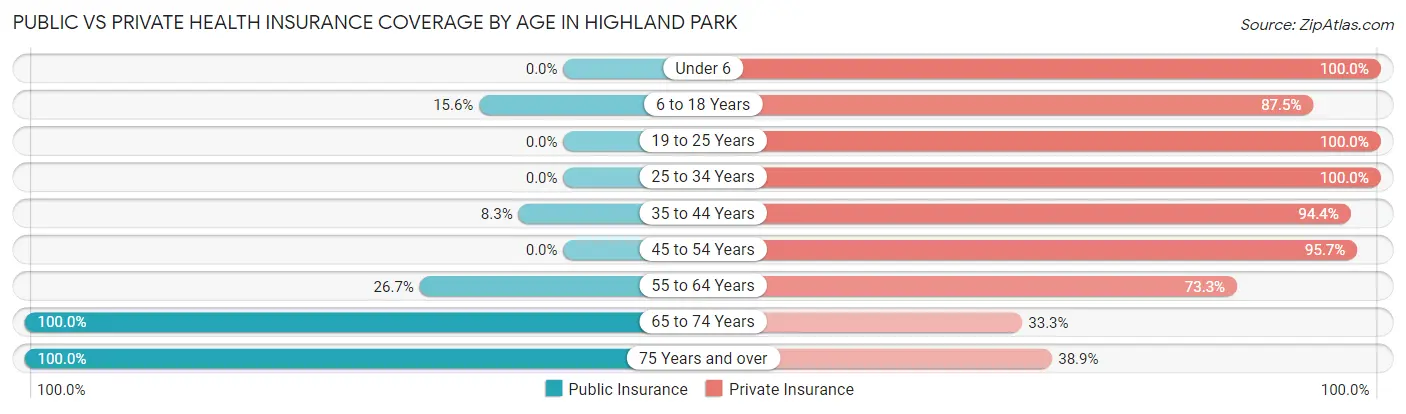
| Age Bracket | Public Insurance | Private Insurance |
| Under 6 | 0 (0.0%) | 12 (100.0%) |
| 6 to 18 Years | 5 (15.6%) | 28 (87.5%) |
| 19 to 25 Years | 0 (0.0%) | 3 (100.0%) |
| 25 to 34 Years | 0 (0.0%) | 16 (100.0%) |
| 35 to 44 Years | 3 (8.3%) | 34 (94.4%) |
| 45 to 54 Years | 0 (0.0%) | 22 (95.7%) |
| 55 to 64 Years | 4 (26.7%) | 11 (73.3%) |
| 65 to 74 Years | 21 (100.0%) | 7 (33.3%) |
| 75 Years and over | 18 (100.0%) | 7 (38.9%) |
| Total | 51 (29.0%) | 140 (79.5%) |
Disability Status by Sex by Age in Highland Park
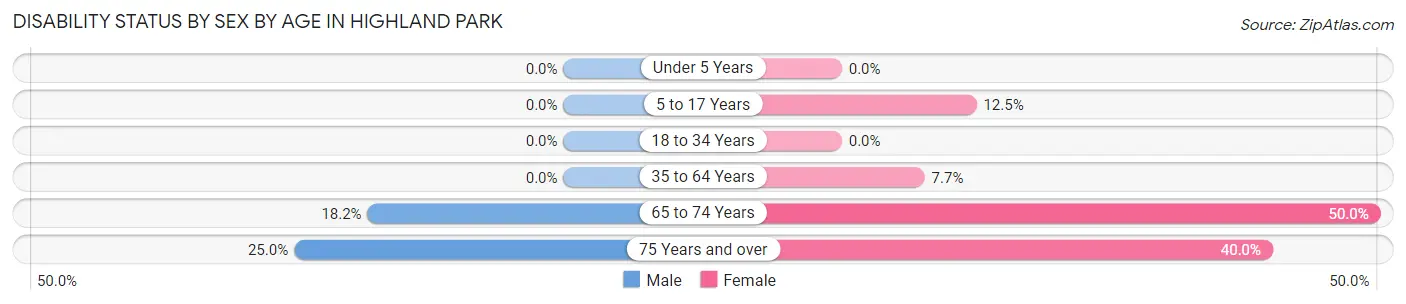
| Age Bracket | Male | Female |
| Under 5 Years | 0 (0.0%) | 0 (0.0%) |
| 5 to 17 Years | 0 (0.0%) | 3 (12.5%) |
| 18 to 34 Years | 0 (0.0%) | 0 (0.0%) |
| 35 to 64 Years | 0 (0.0%) | 3 (7.7%) |
| 65 to 74 Years | 2 (18.2%) | 5 (50.0%) |
| 75 Years and over | 2 (25.0%) | 4 (40.0%) |
Disability Class by Sex by Age in Highland Park
Disability Class: Hearing Difficulty
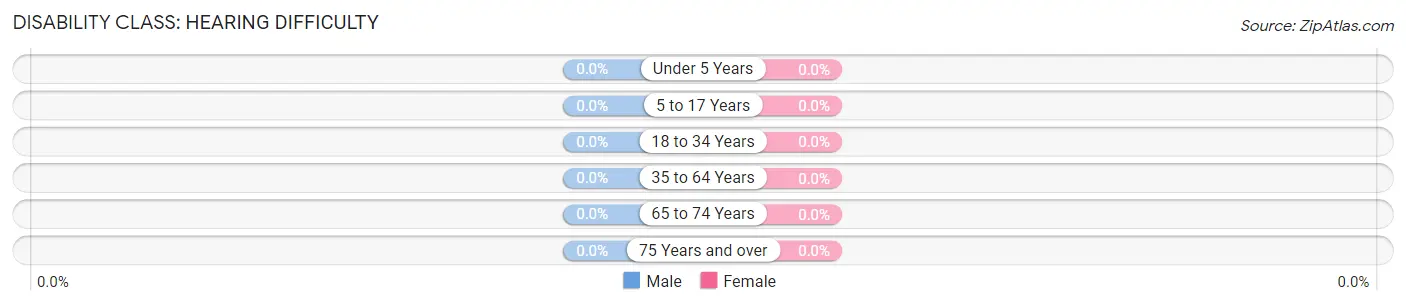
| Age Bracket | Male | Female |
| Under 5 Years | 0 (0.0%) | 0 (0.0%) |
| 5 to 17 Years | 0 (0.0%) | 0 (0.0%) |
| 18 to 34 Years | 0 (0.0%) | 0 (0.0%) |
| 35 to 64 Years | 0 (0.0%) | 0 (0.0%) |
| 65 to 74 Years | 0 (0.0%) | 0 (0.0%) |
| 75 Years and over | 0 (0.0%) | 0 (0.0%) |
Disability Class: Vision Difficulty
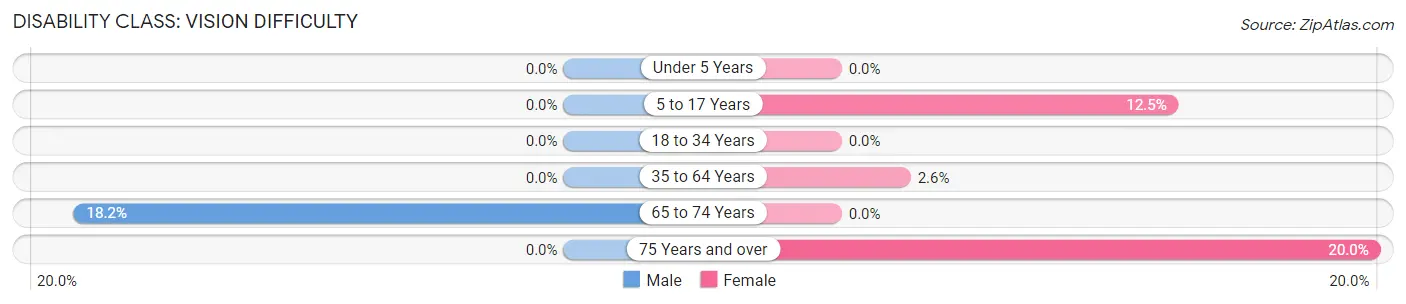
| Age Bracket | Male | Female |
| Under 5 Years | 0 (0.0%) | 0 (0.0%) |
| 5 to 17 Years | 0 (0.0%) | 3 (12.5%) |
| 18 to 34 Years | 0 (0.0%) | 0 (0.0%) |
| 35 to 64 Years | 0 (0.0%) | 1 (2.6%) |
| 65 to 74 Years | 2 (18.2%) | 0 (0.0%) |
| 75 Years and over | 0 (0.0%) | 2 (20.0%) |
Disability Class: Cognitive Difficulty
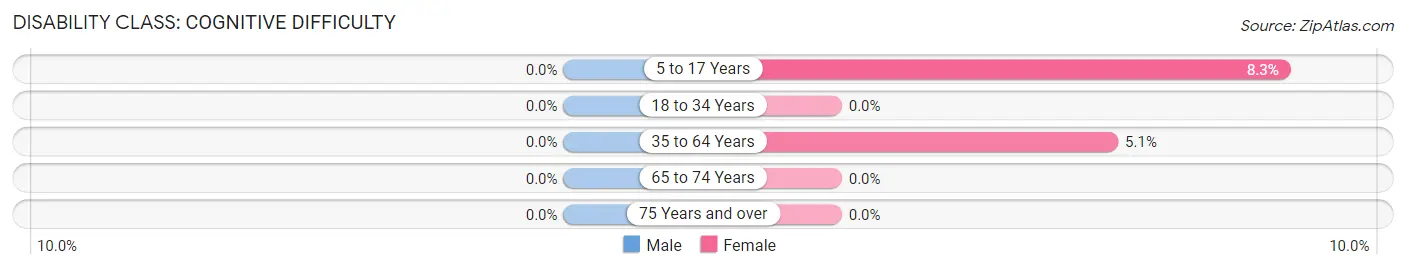
| Age Bracket | Male | Female |
| 5 to 17 Years | 0 (0.0%) | 2 (8.3%) |
| 18 to 34 Years | 0 (0.0%) | 0 (0.0%) |
| 35 to 64 Years | 0 (0.0%) | 2 (5.1%) |
| 65 to 74 Years | 0 (0.0%) | 0 (0.0%) |
| 75 Years and over | 0 (0.0%) | 0 (0.0%) |
Disability Class: Ambulatory Difficulty
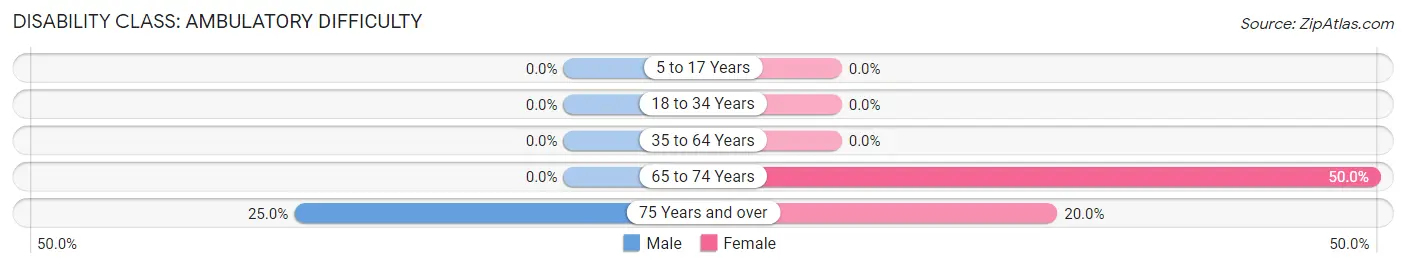
| Age Bracket | Male | Female |
| 5 to 17 Years | 0 (0.0%) | 0 (0.0%) |
| 18 to 34 Years | 0 (0.0%) | 0 (0.0%) |
| 35 to 64 Years | 0 (0.0%) | 0 (0.0%) |
| 65 to 74 Years | 0 (0.0%) | 5 (50.0%) |
| 75 Years and over | 2 (25.0%) | 2 (20.0%) |
Disability Class: Self-Care Difficulty
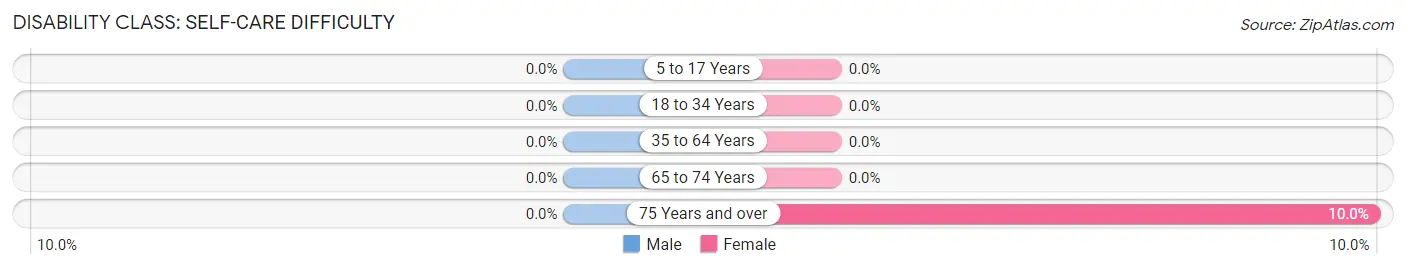
| Age Bracket | Male | Female |
| 5 to 17 Years | 0 (0.0%) | 0 (0.0%) |
| 18 to 34 Years | 0 (0.0%) | 0 (0.0%) |
| 35 to 64 Years | 0 (0.0%) | 0 (0.0%) |
| 65 to 74 Years | 0 (0.0%) | 0 (0.0%) |
| 75 Years and over | 0 (0.0%) | 1 (10.0%) |
Technology Access in Highland Park
Computing Device Access in Highland Park
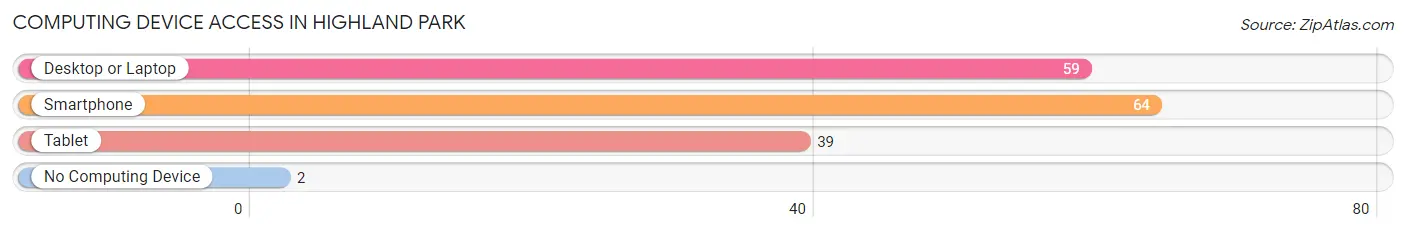
| Device Type | # Households | % Households |
| Desktop or Laptop | 59 | 88.1% |
| Smartphone | 64 | 95.5% |
| Tablet | 39 | 58.2% |
| No Computing Device | 2 | 3.0% |
| Total | 67 | 100.0% |
Internet Access in Highland Park
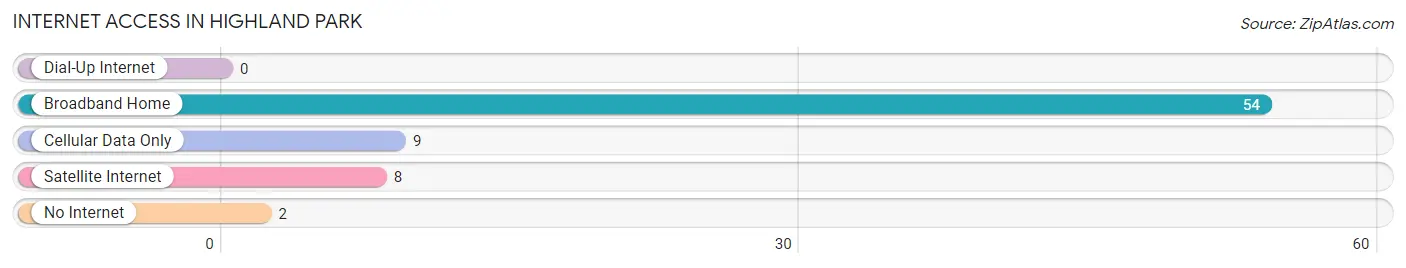
| Internet Type | # Households | % Households |
| Dial-Up Internet | 0 | 0.0% |
| Broadband Home | 54 | 80.6% |
| Cellular Data Only | 9 | 13.4% |
| Satellite Internet | 8 | 11.9% |
| No Internet | 2 | 3.0% |
| Total | 67 | 100.0% |
Highland Park Summary
Highland Park is a small, unincorporated community located in Hillsborough County, Florida. It is situated in the southeastern part of the county, approximately 20 miles east of Tampa. The community is bordered by the cities of Plant City and Thonotosassa, and is part of the Tampa-St. Petersburg-Clearwater Metropolitan Statistical Area.
History
Highland Park was first settled in the late 1800s by a group of settlers from Scotland. The settlers were attracted to the area due to its fertile soil and abundant wildlife. The community was originally known as “Highland Park” due to its location on a high ridge of land. The first post office was established in 1887, and the community was officially incorporated in 1891.
In the early 1900s, the community began to grow and develop. The first school was built in 1906, and the first church was established in 1908. The community also had a general store, a blacksmith shop, and a sawmill.
In the 1920s, the community began to decline due to the Great Depression. Many of the residents moved away in search of work, and the population decreased significantly. The post office closed in 1933, and the school closed in 1935.
In the 1950s, the community began to experience a resurgence. The population began to increase, and new businesses began to open. The post office reopened in 1954, and the school reopened in 1956.
Geography
Highland Park is located in southeastern Hillsborough County, approximately 20 miles east of Tampa. The community is bordered by the cities of Plant City and Thonotosassa. The terrain is mostly flat, with some rolling hills. The area is mostly rural, with some residential and commercial development.
The climate in Highland Park is subtropical, with hot, humid summers and mild winters. The average annual temperature is 73 degrees Fahrenheit, and the average annual precipitation is 50 inches.
Economy
Highland Park’s economy is largely based on agriculture and tourism. The area is home to several farms, which produce a variety of crops, including citrus, vegetables, and hay. The community is also home to several tourist attractions, including a wildlife refuge and a historic village.
The community is also home to several small businesses, including restaurants, retail stores, and service providers. The community is served by several major highways, which provide access to nearby cities and towns.
Demographics
As of the 2010 census, the population of Highland Park was 1,845. The population is mostly white (90.2%), with small percentages of African American (4.2%), Hispanic (3.2%), and Asian (1.2%) residents. The median household income is $45,000, and the median home value is $125,000.
Highland Park is a small, rural community with a rich history and a bright future. The community is home to a diverse population, and offers a variety of economic opportunities. The area is also home to several tourist attractions, which draw visitors from all over the world.
Common Questions
What is Per Capita Income in Highland Park?
Per Capita income in Highland Park is $42,085.
What is the Median Family Income in Highland Park?
Median Family Income in Highland Park is $118,125.
What is the Median Household income in Highland Park?
Median Household Income in Highland Park is $84,688.
What is Income or Wage Gap in Highland Park?
Income or Wage Gap in Highland Park is 60.1%.
Women in Highland Park earn 39.9 cents for every dollar earned by a man.
What is Inequality or Gini Index in Highland Park?
Inequality or Gini Index in Highland Park is 0.37.
What is the Total Population of Highland Park?
Total Population of Highland Park is 178.
What is the Total Male Population of Highland Park?
Total Male Population of Highland Park is 82.
What is the Total Female Population of Highland Park?
Total Female Population of Highland Park is 96.
What is the Ratio of Males per 100 Females in Highland Park?
There are 85.42 Males per 100 Females in Highland Park.
What is the Ratio of Females per 100 Males in Highland Park?
There are 117.07 Females per 100 Males in Highland Park.
What is the Median Population Age in Highland Park?
Median Population Age in Highland Park is 41.0 Years.
What is the Average Family Size in Highland Park
Average Family Size in Highland Park is 3.2 People.
What is the Average Household Size in Highland Park
Average Household Size in Highland Park is 2.7 People.
How Large is the Labor Force in Highland Park?
There are 92 People in the Labor Forcein in Highland Park.
What is the Percentage of People in the Labor Force in Highland Park?
67.6% of People are in the Labor Force in Highland Park.
What is the Unemployment Rate in Highland Park?
Unemployment Rate in Highland Park is 2.2%.