Freeport, FL Map & Demographics
Freeport Map
Freeport Overview
$41,752
PER CAPITA INCOME
$90,128
AVG FAMILY INCOME
$81,594
AVG HOUSEHOLD INCOME
37.6%
WAGE / INCOME GAP [ % ]
62.4¢/ $1
WAGE / INCOME GAP [ $ ]
0.40
INEQUALITY / GINI INDEX
5,858
TOTAL POPULATION
2,911
MALE POPULATION
2,947
FEMALE POPULATION
98.78
MALES / 100 FEMALES
101.24
FEMALES / 100 MALES
41.6
MEDIAN AGE
2.8
AVG FAMILY SIZE
2.4
AVG HOUSEHOLD SIZE
2,911
LABOR FORCE [ PEOPLE ]
62.1%
PERCENT IN LABOR FORCE
4.2%
UNEMPLOYMENT RATE
Freeport Zip Codes
Freeport Area Codes
Income in Freeport
Income Overview in Freeport
Per Capita Income in Freeport is $41,752, while median incomes of families and households are $90,128 and $81,594 respectively.
| Characteristic | Number | Measure |
| Per Capita Income | 5,858 | $41,752 |
| Median Family Income | 1,824 | $90,128 |
| Mean Family Income | 1,824 | $110,499 |
| Median Household Income | 2,478 | $81,594 |
| Mean Household Income | 2,478 | $100,390 |
| Income Deficit | 1,824 | $0 |
| Wage / Income Gap (%) | 5,858 | 37.56% |
| Wage / Income Gap ($) | 5,858 | 62.44¢ per $1 |
| Gini / Inequality Index | 5,858 | 0.40 |
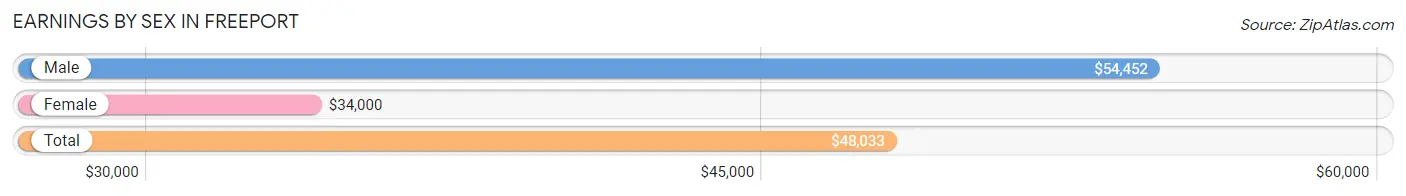
Earnings by Sex in Freeport
Average Earnings in Freeport are $48,033, $54,452 for men and $34,000 for women, a difference of 37.6%.
| Sex | Number | Average Earnings |
| Male | 1,891 (59.5%) | $54,452 |
| Female | 1,290 (40.6%) | $34,000 |
| Total | 3,181 (100.0%) | $48,033 |
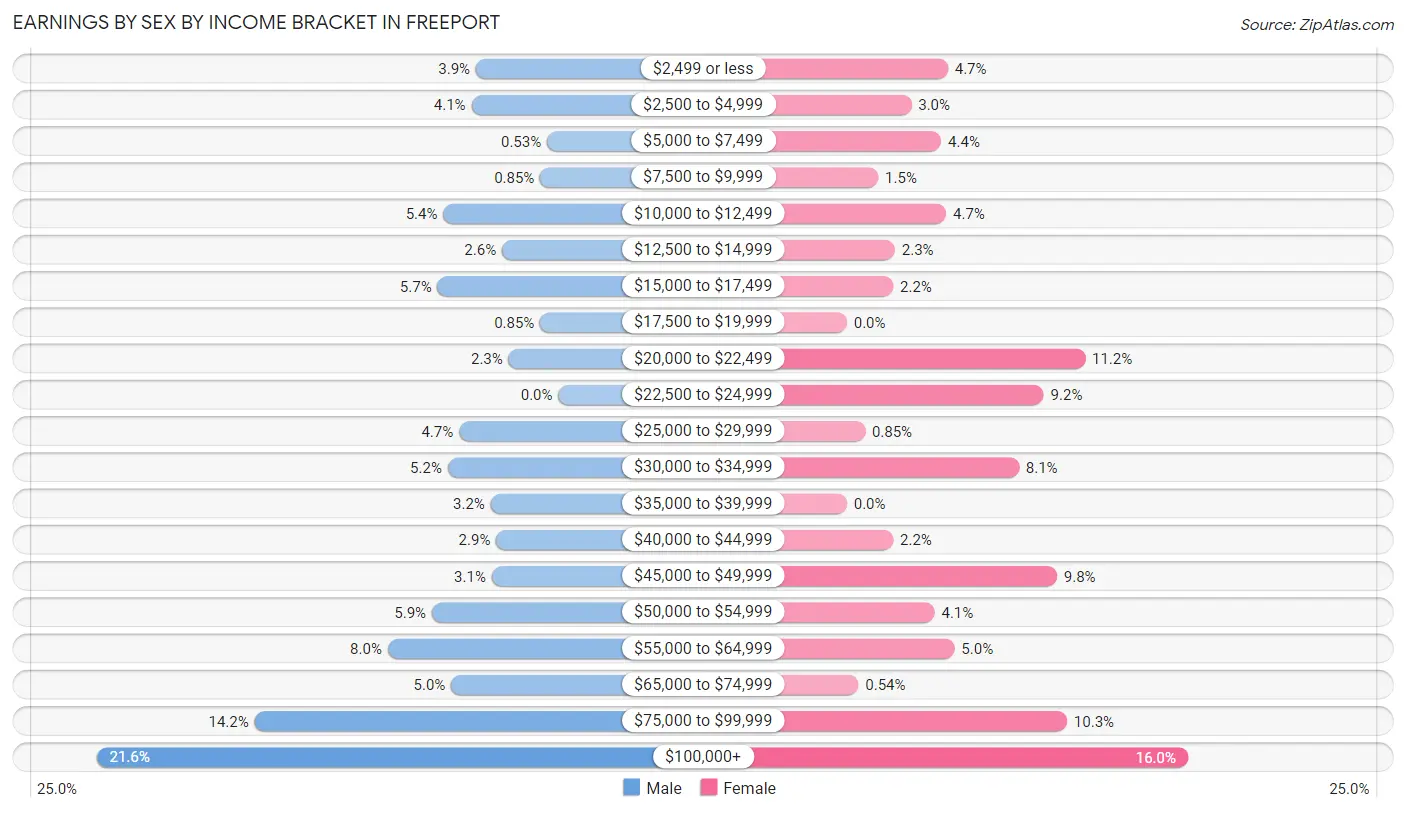
Earnings by Sex by Income Bracket in Freeport
The most common earnings brackets in Freeport are $100,000+ for men (409 | 21.6%) and $100,000+ for women (206 | 16.0%).
| Income | Male | Female |
| $2,499 or less | 73 (3.9%) | 61 (4.7%) |
| $2,500 to $4,999 | 77 (4.1%) | 39 (3.0%) |
| $5,000 to $7,499 | 10 (0.5%) | 57 (4.4%) |
| $7,500 to $9,999 | 16 (0.9%) | 19 (1.5%) |
| $10,000 to $12,499 | 102 (5.4%) | 60 (4.6%) |
| $12,500 to $14,999 | 50 (2.6%) | 29 (2.2%) |
| $15,000 to $17,499 | 107 (5.7%) | 28 (2.2%) |
| $17,500 to $19,999 | 16 (0.9%) | 0 (0.0%) |
| $20,000 to $22,499 | 44 (2.3%) | 144 (11.2%) |
| $22,500 to $24,999 | 0 (0.0%) | 119 (9.2%) |
| $25,000 to $29,999 | 88 (4.6%) | 11 (0.9%) |
| $30,000 to $34,999 | 98 (5.2%) | 104 (8.1%) |
| $35,000 to $39,999 | 60 (3.2%) | 0 (0.0%) |
| $40,000 to $44,999 | 55 (2.9%) | 28 (2.2%) |
| $45,000 to $49,999 | 59 (3.1%) | 127 (9.8%) |
| $50,000 to $54,999 | 112 (5.9%) | 53 (4.1%) |
| $55,000 to $64,999 | 151 (8.0%) | 65 (5.0%) |
| $65,000 to $74,999 | 95 (5.0%) | 7 (0.5%) |
| $75,000 to $99,999 | 269 (14.2%) | 133 (10.3%) |
| $100,000+ | 409 (21.6%) | 206 (16.0%) |
| Total | 1,891 (100.0%) | 1,290 (100.0%) |
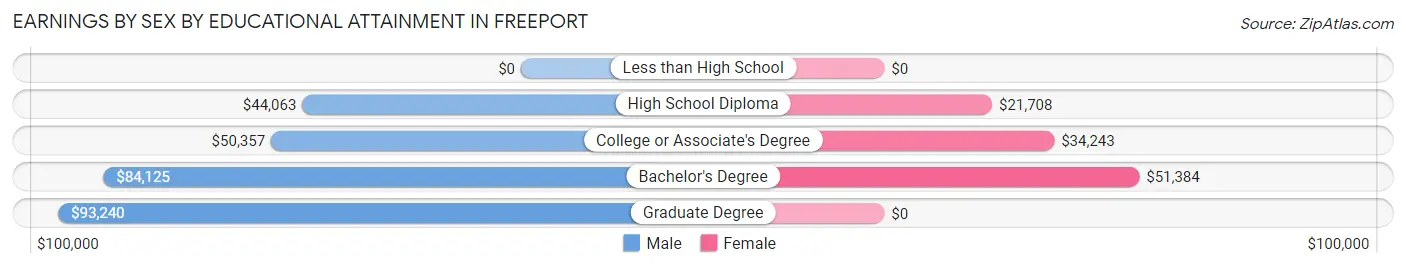
Earnings by Sex by Educational Attainment in Freeport
Average earnings in Freeport are $62,777 for men and $45,710 for women, a difference of 27.2%. Men with an educational attainment of graduate degree enjoy the highest average annual earnings of $93,240, while those with high school diploma education earn the least with $44,063. Women with an educational attainment of bachelor's degree earn the most with the average annual earnings of $51,384, while those with high school diploma education have the smallest earnings of $21,708.
| Educational Attainment | Male Income | Female Income |
| Less than High School | - | - |
| High School Diploma | $44,063 | $21,708 |
| College or Associate's Degree | $50,357 | $34,243 |
| Bachelor's Degree | $84,125 | $51,384 |
| Graduate Degree | $93,240 | $0 |
| Total | $62,777 | $45,710 |
Family Income in Freeport
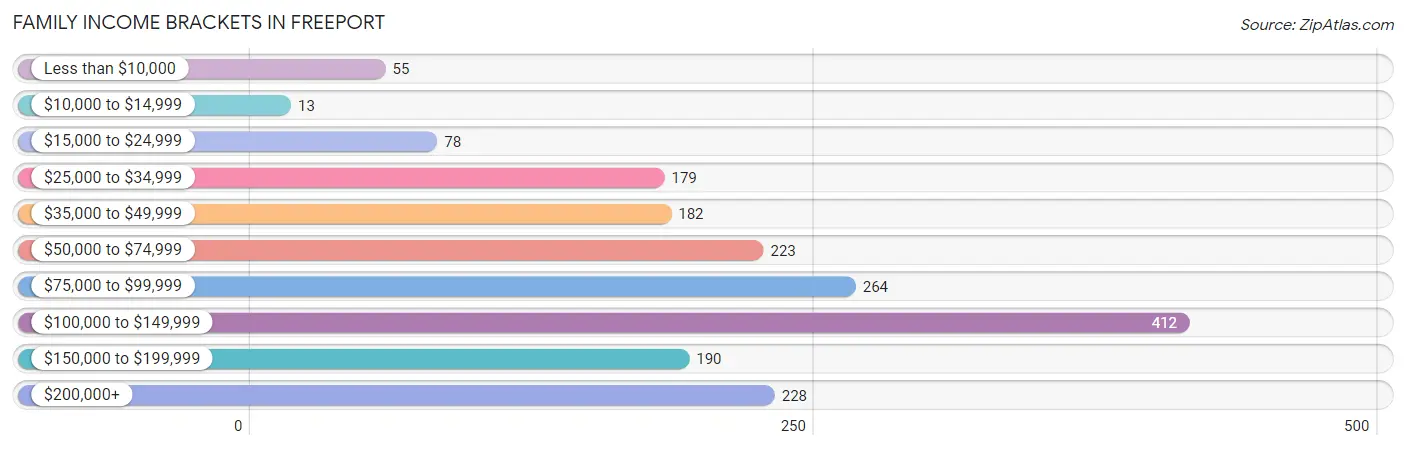
Family Income Brackets in Freeport
According to the Freeport family income data, there are 412 families falling into the $100,000 to $149,999 income range, which is the most common income bracket and makes up 22.6% of all families. Conversely, the $10,000 to $14,999 income bracket is the least frequent group with only 13 families (0.7%) belonging to this category.
| Income Bracket | # Families | % Families |
| Less than $10,000 | 55 | 3.0% |
| $10,000 to $14,999 | 13 | 0.7% |
| $15,000 to $24,999 | 78 | 4.3% |
| $25,000 to $34,999 | 179 | 9.8% |
| $35,000 to $49,999 | 182 | 10.0% |
| $50,000 to $74,999 | 223 | 12.2% |
| $75,000 to $99,999 | 264 | 14.5% |
| $100,000 to $149,999 | 412 | 22.6% |
| $150,000 to $199,999 | 190 | 10.4% |
| $200,000+ | 228 | 12.5% |
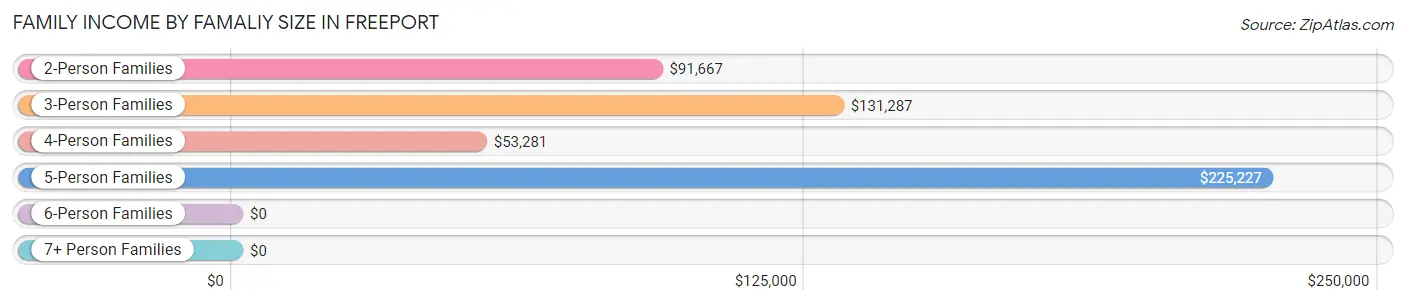
Family Income by Famaliy Size in Freeport
5-person families (50 | 2.7%) account for the highest median family income in Freeport with $225,227 per family, while 2-person families (738 | 40.5%) have the highest median income of $45,834 per family member.
| Income Bracket | # Families | Median Income |
| 2-Person Families | 738 (40.5%) | $91,667 |
| 3-Person Families | 553 (30.3%) | $131,287 |
| 4-Person Families | 483 (26.5%) | $53,281 |
| 5-Person Families | 50 (2.7%) | $225,227 |
| 6-Person Families | 0 (0.0%) | $0 |
| 7+ Person Families | 0 (0.0%) | $0 |
| Total | 1,824 (100.0%) | $90,128 |
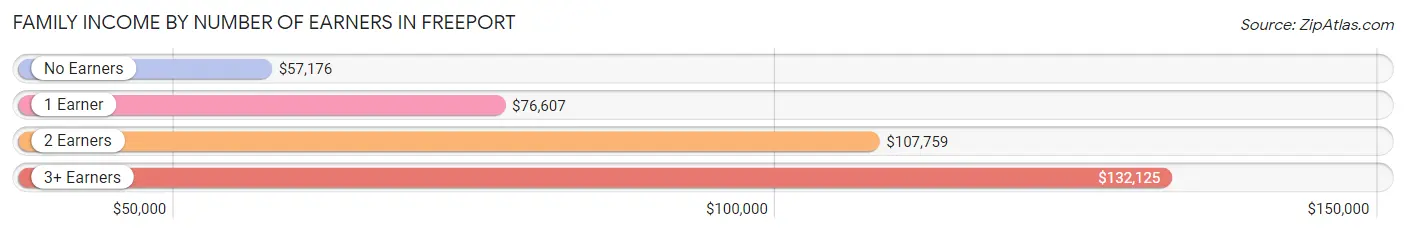
Family Income by Number of Earners in Freeport
The median family income in Freeport is $90,128, with families comprising 3+ earners (138) having the highest median family income of $132,125, while families with no earners (263) have the lowest median family income of $57,176, accounting for 7.6% and 14.4% of families, respectively.
| Number of Earners | # Families | Median Income |
| No Earners | 263 (14.4%) | $57,176 |
| 1 Earner | 665 (36.5%) | $76,607 |
| 2 Earners | 758 (41.6%) | $107,759 |
| 3+ Earners | 138 (7.6%) | $132,125 |
| Total | 1,824 (100.0%) | $90,128 |
Household Income in Freeport
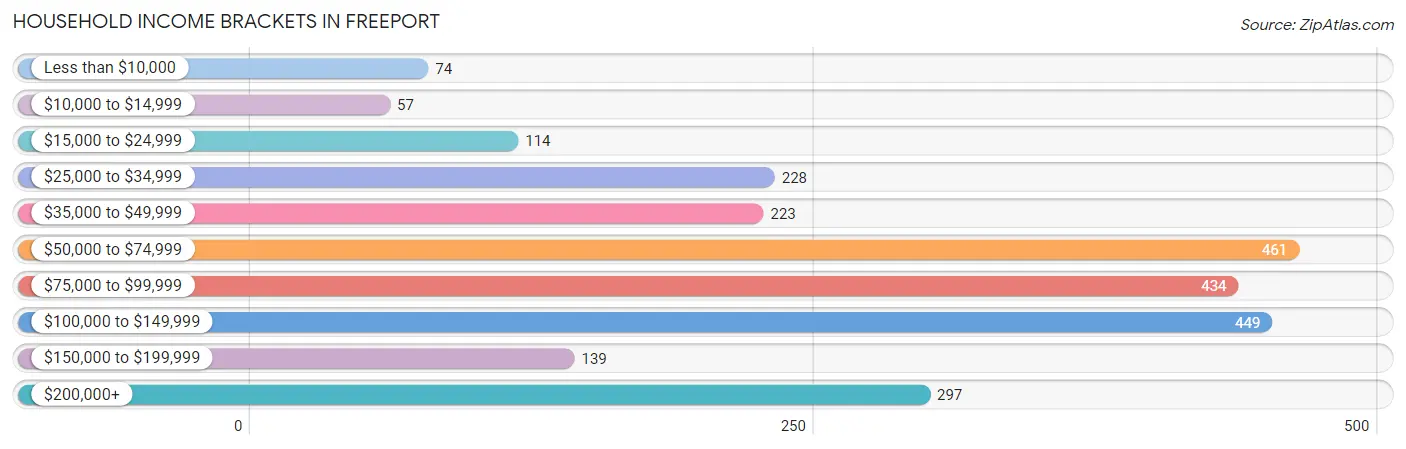
Household Income Brackets in Freeport
With 461 households falling in the category, the $50,000 to $74,999 income range is the most frequent in Freeport, accounting for 18.6% of all households. In contrast, only 57 households (2.3%) fall into the $10,000 to $14,999 income bracket, making it the least populous group.
| Income Bracket | # Households | % Households |
| Less than $10,000 | 74 | 3.0% |
| $10,000 to $14,999 | 57 | 2.3% |
| $15,000 to $24,999 | 114 | 4.6% |
| $25,000 to $34,999 | 228 | 9.2% |
| $35,000 to $49,999 | 223 | 9.0% |
| $50,000 to $74,999 | 461 | 18.6% |
| $75,000 to $99,999 | 434 | 17.5% |
| $100,000 to $149,999 | 449 | 18.1% |
| $150,000 to $199,999 | 139 | 5.6% |
| $200,000+ | 297 | 12.0% |
Household Income by Householder Age in Freeport
The median household income in Freeport is $81,594, with the highest median household income of $129,175 found in the 45 to 64 years age bracket for the primary householder. A total of 855 households (34.5%) fall into this category. Meanwhile, the 15 to 24 years age bracket for the primary householder has the lowest median household income of $0, with 71 households (2.9%) in this group.
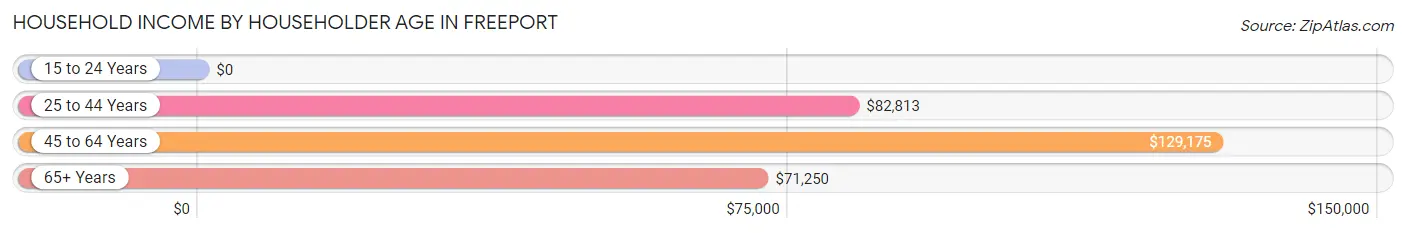
| Income Bracket | # Households | Median Income |
| 15 to 24 Years | 71 (2.9%) | $0 |
| 25 to 44 Years | 918 (37.0%) | $82,813 |
| 45 to 64 Years | 855 (34.5%) | $129,175 |
| 65+ Years | 634 (25.6%) | $71,250 |
| Total | 2,478 (100.0%) | $81,594 |
Poverty in Freeport
Income Below Poverty by Sex and Age in Freeport
With 7.6% poverty level for males and 7.5% for females among the residents of Freeport, under 5 year old males and 6 to 11 year old females are the most vulnerable to poverty, with 69 males (31.4%) and 75 females (44.1%) in their respective age groups living below the poverty level.
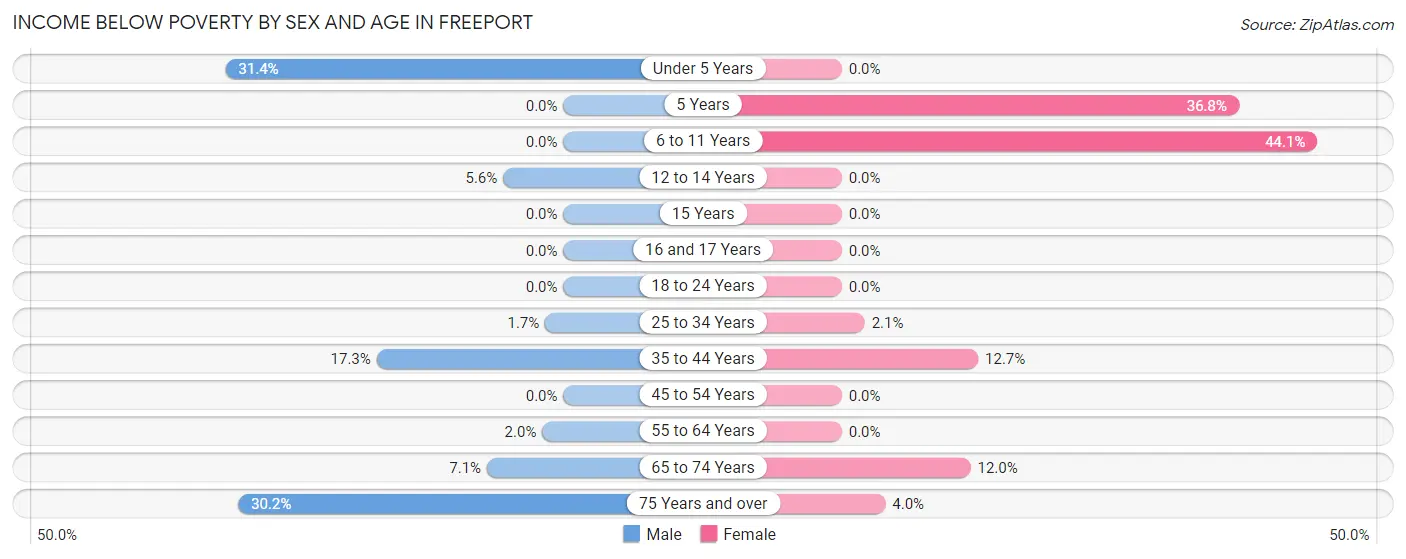
| Age Bracket | Male | Female |
| Under 5 Years | 69 (31.4%) | 0 (0.0%) |
| 5 Years | 0 (0.0%) | 21 (36.8%) |
| 6 to 11 Years | 0 (0.0%) | 75 (44.1%) |
| 12 to 14 Years | 10 (5.6%) | 0 (0.0%) |
| 15 Years | 0 (0.0%) | 0 (0.0%) |
| 16 and 17 Years | 0 (0.0%) | 0 (0.0%) |
| 18 to 24 Years | 0 (0.0%) | 0 (0.0%) |
| 25 to 34 Years | 7 (1.7%) | 6 (2.1%) |
| 35 to 44 Years | 92 (17.3%) | 63 (12.7%) |
| 45 to 54 Years | 0 (0.0%) | 0 (0.0%) |
| 55 to 64 Years | 8 (2.0%) | 0 (0.0%) |
| 65 to 74 Years | 19 (7.1%) | 46 (11.9%) |
| 75 Years and over | 16 (30.2%) | 11 (4.0%) |
| Total | 221 (7.6%) | 222 (7.5%) |
Income Above Poverty by Sex and Age in Freeport
According to the poverty statistics in Freeport, males aged 5 years and females aged under 5 years are the age groups that are most secure financially, with 100.0% of males and 100.0% of females in these age groups living above the poverty line.
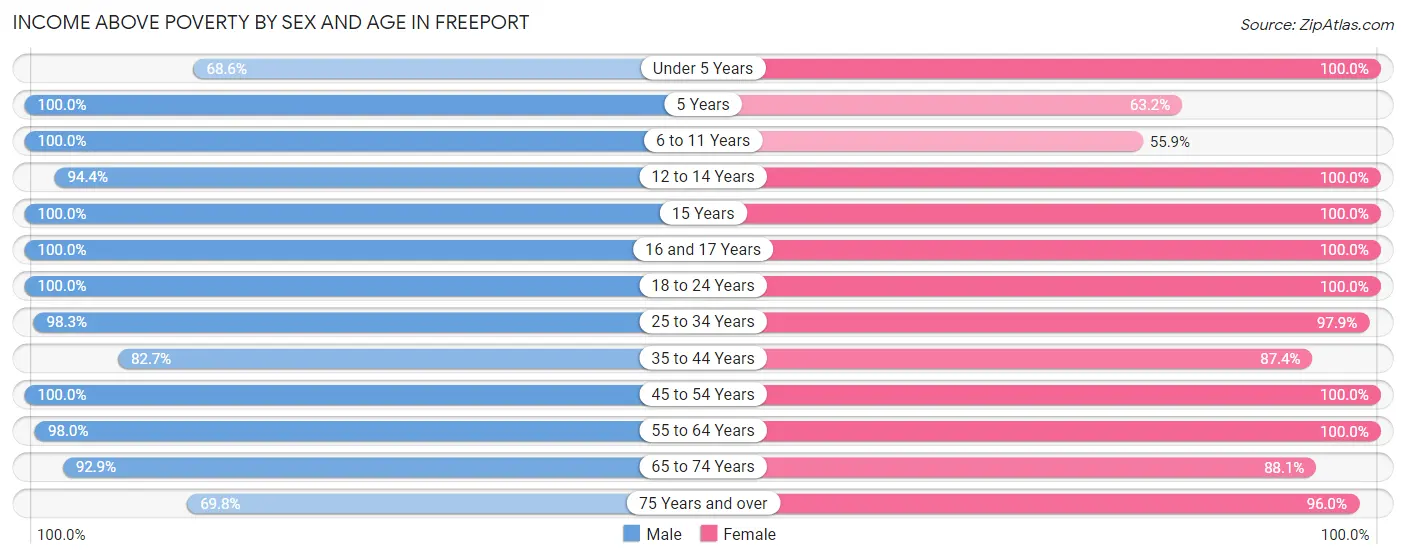
| Age Bracket | Male | Female |
| Under 5 Years | 151 (68.6%) | 157 (100.0%) |
| 5 Years | 13 (100.0%) | 36 (63.2%) |
| 6 to 11 Years | 149 (100.0%) | 95 (55.9%) |
| 12 to 14 Years | 169 (94.4%) | 152 (100.0%) |
| 15 Years | 50 (100.0%) | 6 (100.0%) |
| 16 and 17 Years | 29 (100.0%) | 75 (100.0%) |
| 18 to 24 Years | 85 (100.0%) | 197 (100.0%) |
| 25 to 34 Years | 406 (98.3%) | 276 (97.9%) |
| 35 to 44 Years | 439 (82.7%) | 435 (87.4%) |
| 45 to 54 Years | 503 (100.0%) | 314 (100.0%) |
| 55 to 64 Years | 401 (98.0%) | 374 (100.0%) |
| 65 to 74 Years | 249 (92.9%) | 339 (88.0%) |
| 75 Years and over | 37 (69.8%) | 261 (96.0%) |
| Total | 2,681 (92.4%) | 2,717 (92.4%) |
Income Below Poverty Among Married-Couple Families in Freeport
The poverty statistics for married-couple families in Freeport show that 3.5% or 54 of the total 1,553 families live below the poverty line. Families with no children have the highest poverty rate of 6.7%, comprising of 54 families. On the other hand, families with 1 or 2 children have the lowest poverty rate of 0.0%, which includes 0 families.
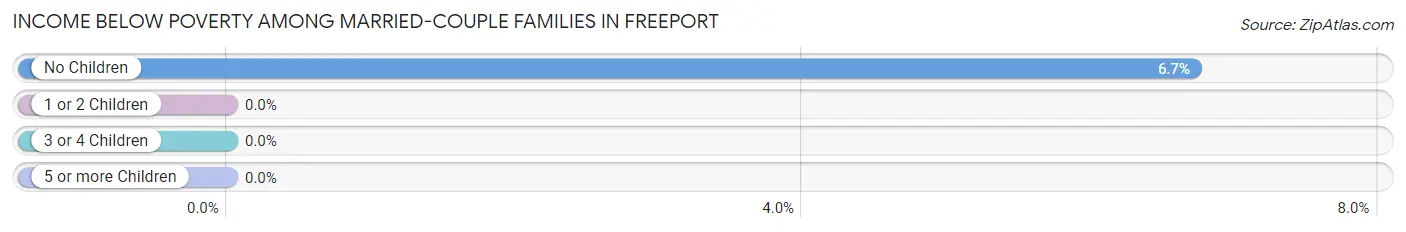
| Children | Above Poverty | Below Poverty |
| No Children | 751 (93.3%) | 54 (6.7%) |
| 1 or 2 Children | 728 (100.0%) | 0 (0.0%) |
| 3 or 4 Children | 20 (100.0%) | 0 (0.0%) |
| 5 or more Children | 0 (0.0%) | 0 (0.0%) |
| Total | 1,499 (96.5%) | 54 (3.5%) |
Income Below Poverty Among Single-Parent Households in Freeport
According to the poverty data in Freeport, 42.1% or 72 single-father households and 19.0% or 19 single-mother households are living below the poverty line. Among single-father households, those with 1 or 2 children have the highest poverty rate, with 72 households (47.4%) experiencing poverty. Likewise, among single-mother households, those with 3 or 4 children have the highest poverty rate, with 12 households (100.0%) falling below the poverty line.
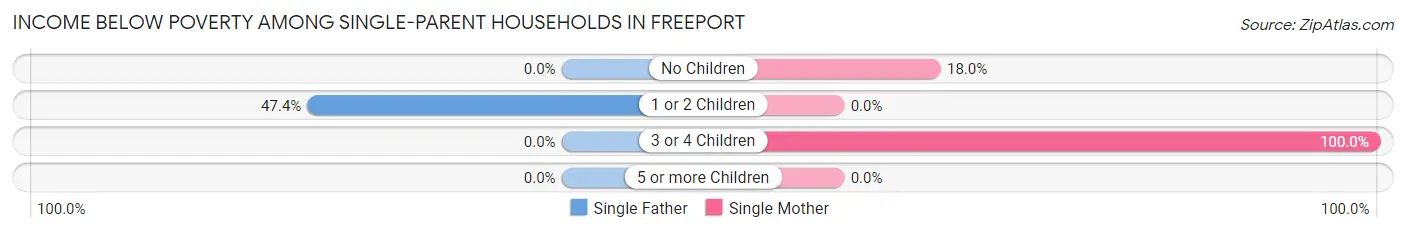
| Children | Single Father | Single Mother |
| No Children | 0 (0.0%) | 7 (17.9%) |
| 1 or 2 Children | 72 (47.4%) | 0 (0.0%) |
| 3 or 4 Children | 0 (0.0%) | 12 (100.0%) |
| 5 or more Children | 0 (0.0%) | 0 (0.0%) |
| Total | 72 (42.1%) | 19 (19.0%) |
Income Below Poverty Among Married-Couple vs Single-Parent Households in Freeport
The poverty data for Freeport shows that 54 of the married-couple family households (3.5%) and 91 of the single-parent households (33.6%) are living below the poverty level. Within the married-couple family households, those with no children have the highest poverty rate, with 54 households (6.7%) falling below the poverty line. Among the single-parent households, those with 3 or 4 children have the highest poverty rate, with 12 household (100.0%) living below poverty.
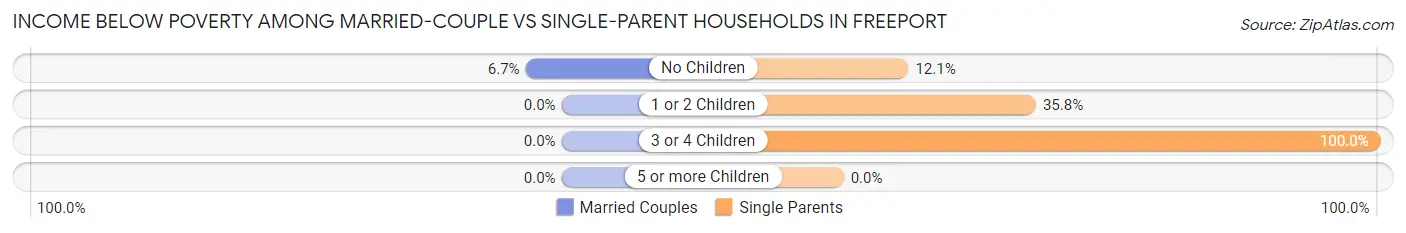
| Children | Married-Couple Families | Single-Parent Households |
| No Children | 54 (6.7%) | 7 (12.1%) |
| 1 or 2 Children | 0 (0.0%) | 72 (35.8%) |
| 3 or 4 Children | 0 (0.0%) | 12 (100.0%) |
| 5 or more Children | 0 (0.0%) | 0 (0.0%) |
| Total | 54 (3.5%) | 91 (33.6%) |
Race in Freeport
The most populous races in Freeport are White / Caucasian (4,981 | 85.0%), Two or more Races (428 | 7.3%), and Hispanic or Latino (415 | 7.1%).
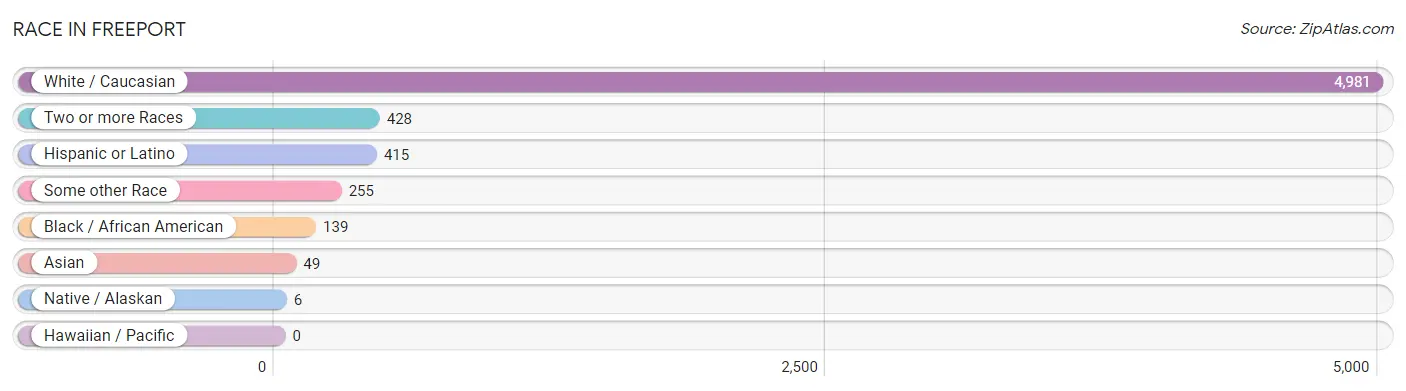
| Race | # Population | % Population |
| Asian | 49 | 0.8% |
| Black / African American | 139 | 2.4% |
| Hawaiian / Pacific | 0 | 0.0% |
| Hispanic or Latino | 415 | 7.1% |
| Native / Alaskan | 6 | 0.1% |
| White / Caucasian | 4,981 | 85.0% |
| Two or more Races | 428 | 7.3% |
| Some other Race | 255 | 4.3% |
| Total | 5,858 | 100.0% |
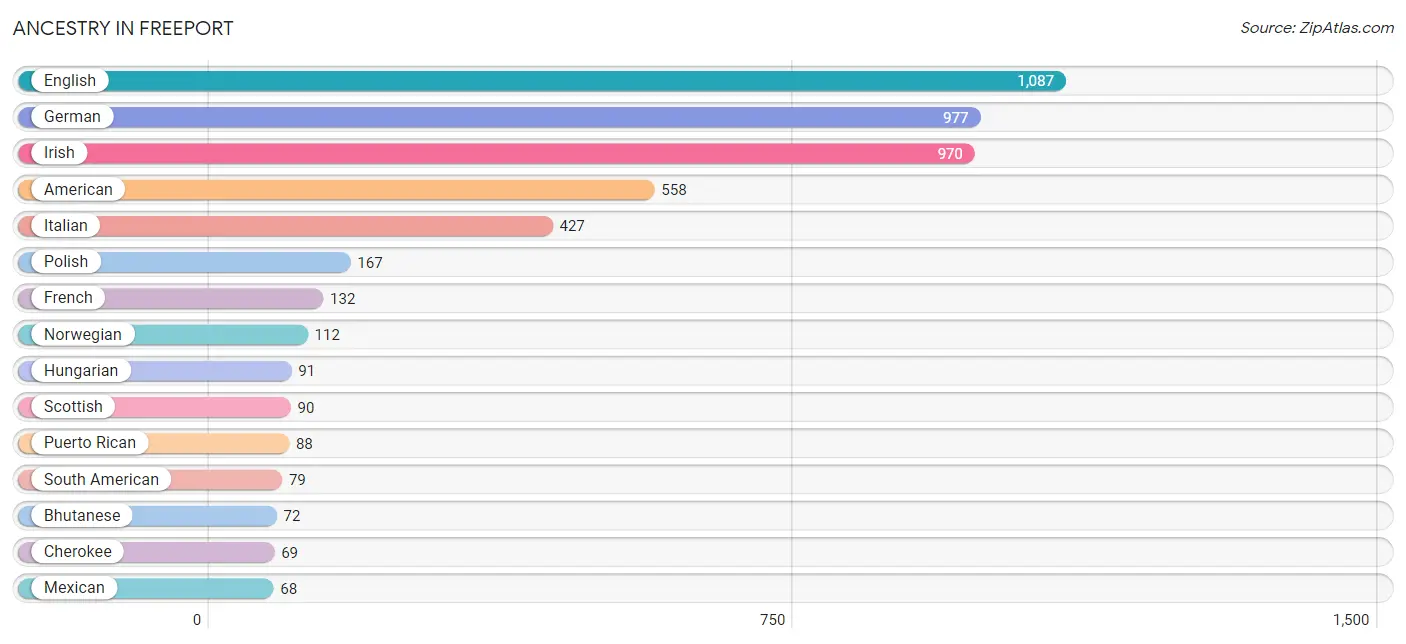
Ancestry in Freeport
The most populous ancestries reported in Freeport are English (1,087 | 18.6%), German (977 | 16.7%), Irish (970 | 16.6%), American (558 | 9.5%), and Italian (427 | 7.3%), together accounting for 68.6% of all Freeport residents.
| Ancestry | # Population | % Population |
| American | 558 | 9.5% |
| Austrian | 5 | 0.1% |
| Bhutanese | 72 | 1.2% |
| Brazilian | 41 | 0.7% |
| British | 56 | 1.0% |
| Canadian | 14 | 0.2% |
| Central American | 48 | 0.8% |
| Cherokee | 69 | 1.2% |
| Colombian | 36 | 0.6% |
| Creek | 31 | 0.5% |
| Danish | 5 | 0.1% |
| Dutch | 21 | 0.4% |
| English | 1,087 | 18.6% |
| European | 19 | 0.3% |
| Finnish | 35 | 0.6% |
| French | 132 | 2.2% |
| French Canadian | 32 | 0.5% |
| German | 977 | 16.7% |
| Guatemalan | 48 | 0.8% |
| Hungarian | 91 | 1.5% |
| Indian (Asian) | 4 | 0.1% |
| Irish | 970 | 16.6% |
| Italian | 427 | 7.3% |
| Korean | 19 | 0.3% |
| Malaysian | 6 | 0.1% |
| Mexican | 68 | 1.2% |
| Norwegian | 112 | 1.9% |
| Peruvian | 43 | 0.7% |
| Polish | 167 | 2.9% |
| Portuguese | 14 | 0.2% |
| Puerto Rican | 88 | 1.5% |
| Russian | 54 | 0.9% |
| Scandinavian | 13 | 0.2% |
| Scotch-Irish | 61 | 1.0% |
| Scottish | 90 | 1.5% |
| Slavic | 20 | 0.3% |
| South American | 79 | 1.3% |
| Spaniard | 10 | 0.2% |
| Sri Lankan | 32 | 0.5% |
| Swedish | 68 | 1.2% |
| Ukrainian | 66 | 1.1% | View All 41 Rows |
Immigrants in Freeport
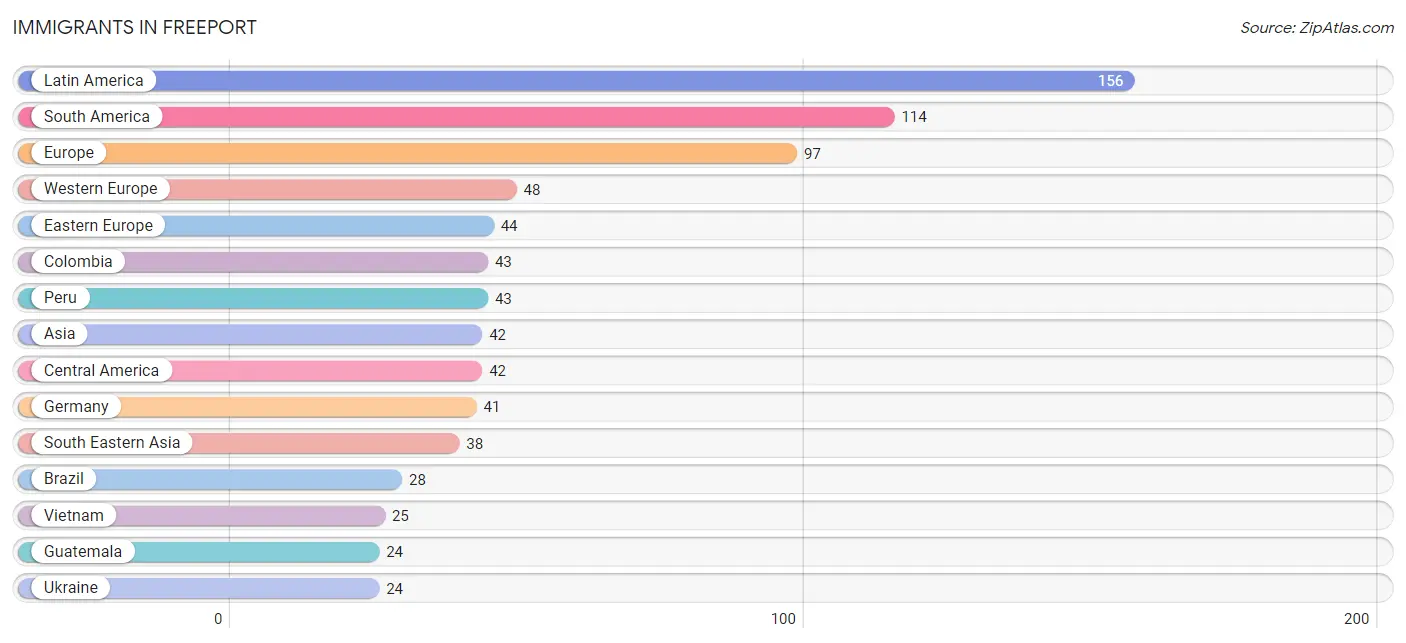
The most numerous immigrant groups reported in Freeport came from Latin America (156 | 2.7%), South America (114 | 1.9%), Europe (97 | 1.7%), Western Europe (48 | 0.8%), and Eastern Europe (44 | 0.7%), together accounting for 7.8% of all Freeport residents.
| Immigration Origin | # Population | % Population |
| Asia | 42 | 0.7% |
| Australia | 16 | 0.3% |
| Belize | 18 | 0.3% |
| Brazil | 28 | 0.5% |
| Central America | 42 | 0.7% |
| China | 4 | 0.1% |
| Colombia | 43 | 0.7% |
| Eastern Asia | 4 | 0.1% |
| Eastern Europe | 44 | 0.7% |
| England | 5 | 0.1% |
| Europe | 97 | 1.7% |
| France | 7 | 0.1% |
| Germany | 41 | 0.7% |
| Guatemala | 24 | 0.4% |
| Laos | 6 | 0.1% |
| Latin America | 156 | 2.7% |
| Northern Europe | 5 | 0.1% |
| Oceania | 16 | 0.3% |
| Peru | 43 | 0.7% |
| Philippines | 7 | 0.1% |
| Russia | 20 | 0.3% |
| South America | 114 | 1.9% |
| South Eastern Asia | 38 | 0.6% |
| Ukraine | 24 | 0.4% |
| Vietnam | 25 | 0.4% |
| Western Europe | 48 | 0.8% | View All 26 Rows |
Sex and Age in Freeport
Sex and Age in Freeport
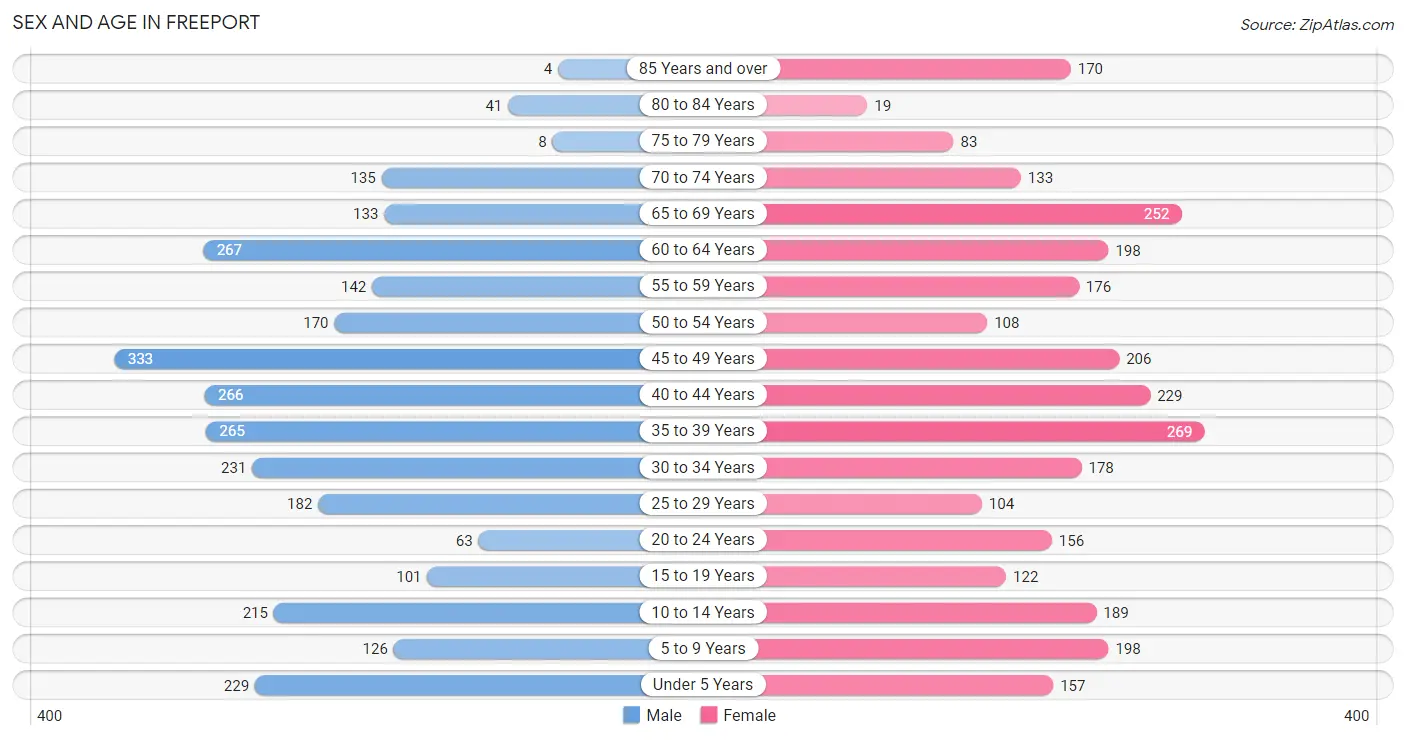
The most populous age groups in Freeport are 45 to 49 Years (333 | 11.4%) for men and 35 to 39 Years (269 | 9.1%) for women.
| Age Bracket | Male | Female |
| Under 5 Years | 229 (7.9%) | 157 (5.3%) |
| 5 to 9 Years | 126 (4.3%) | 198 (6.7%) |
| 10 to 14 Years | 215 (7.4%) | 189 (6.4%) |
| 15 to 19 Years | 101 (3.5%) | 122 (4.1%) |
| 20 to 24 Years | 63 (2.2%) | 156 (5.3%) |
| 25 to 29 Years | 182 (6.2%) | 104 (3.5%) |
| 30 to 34 Years | 231 (7.9%) | 178 (6.0%) |
| 35 to 39 Years | 265 (9.1%) | 269 (9.1%) |
| 40 to 44 Years | 266 (9.1%) | 229 (7.8%) |
| 45 to 49 Years | 333 (11.4%) | 206 (7.0%) |
| 50 to 54 Years | 170 (5.8%) | 108 (3.7%) |
| 55 to 59 Years | 142 (4.9%) | 176 (6.0%) |
| 60 to 64 Years | 267 (9.2%) | 198 (6.7%) |
| 65 to 69 Years | 133 (4.6%) | 252 (8.6%) |
| 70 to 74 Years | 135 (4.6%) | 133 (4.5%) |
| 75 to 79 Years | 8 (0.3%) | 83 (2.8%) |
| 80 to 84 Years | 41 (1.4%) | 19 (0.6%) |
| 85 Years and over | 4 (0.1%) | 170 (5.8%) |
| Total | 2,911 (100.0%) | 2,947 (100.0%) |
Families and Households in Freeport
Median Family Size in Freeport
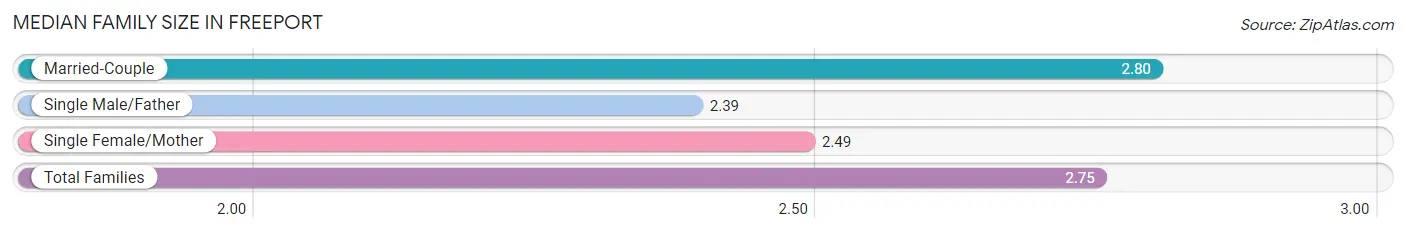
The median family size in Freeport is 2.75 persons per family, with married-couple families (1,553 | 85.1%) accounting for the largest median family size of 2.8 persons per family. On the other hand, single male/father families (171 | 9.4%) represent the smallest median family size with 2.39 persons per family.
| Family Type | # Families | Family Size |
| Married-Couple | 1,553 (85.1%) | 2.80 |
| Single Male/Father | 171 (9.4%) | 2.39 |
| Single Female/Mother | 100 (5.5%) | 2.49 |
| Total Families | 1,824 (100.0%) | 2.75 |
Median Household Size in Freeport
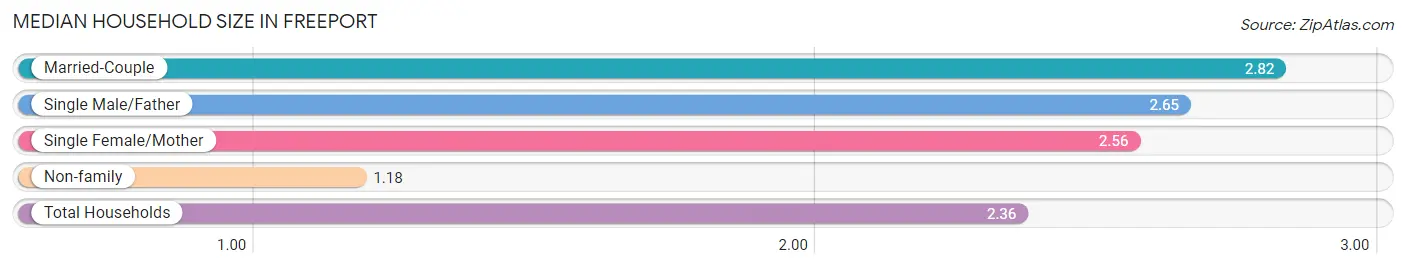
The median household size in Freeport is 2.36 persons per household, with married-couple households (1,553 | 62.7%) accounting for the largest median household size of 2.82 persons per household. non-family households (654 | 26.4%) represent the smallest median household size with 1.18 persons per household.
| Household Type | # Households | Household Size |
| Married-Couple | 1,553 (62.7%) | 2.82 |
| Single Male/Father | 171 (6.9%) | 2.65 |
| Single Female/Mother | 100 (4.0%) | 2.56 |
| Non-family | 654 (26.4%) | 1.18 |
| Total Households | 2,478 (100.0%) | 2.36 |
Household Size by Marriage Status in Freeport
Out of a total of 2,478 households in Freeport, 1,824 (73.6%) are family households, while 654 (26.4%) are nonfamily households. The most numerous type of family households are 2-person households, comprising 704, and the most common type of nonfamily households are 1-person households, comprising 458.
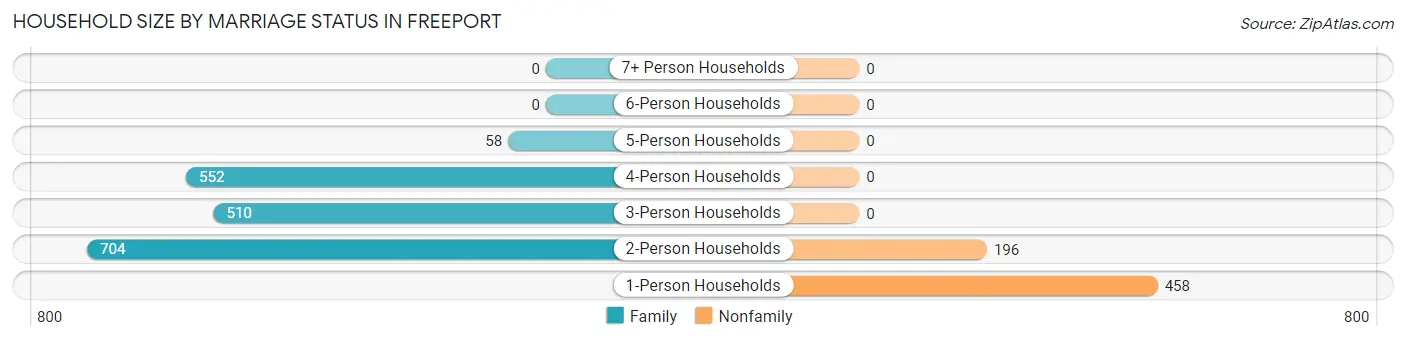
| Household Size | Family Households | Nonfamily Households |
| 1-Person Households | - | 458 (18.5%) |
| 2-Person Households | 704 (28.4%) | 196 (7.9%) |
| 3-Person Households | 510 (20.6%) | 0 (0.0%) |
| 4-Person Households | 552 (22.3%) | 0 (0.0%) |
| 5-Person Households | 58 (2.3%) | 0 (0.0%) |
| 6-Person Households | 0 (0.0%) | 0 (0.0%) |
| 7+ Person Households | 0 (0.0%) | 0 (0.0%) |
| Total | 1,824 (73.6%) | 654 (26.4%) |
Female Fertility in Freeport
Fertility by Age in Freeport
Average fertility rate in Freeport is 26.0 births per 1,000 women. Women in the age bracket of 20 to 34 years have the highest fertility rate with 50.0 births per 1,000 women. Women in the age bracket of 20 to 34 years acount for 66.7% of all women with births.
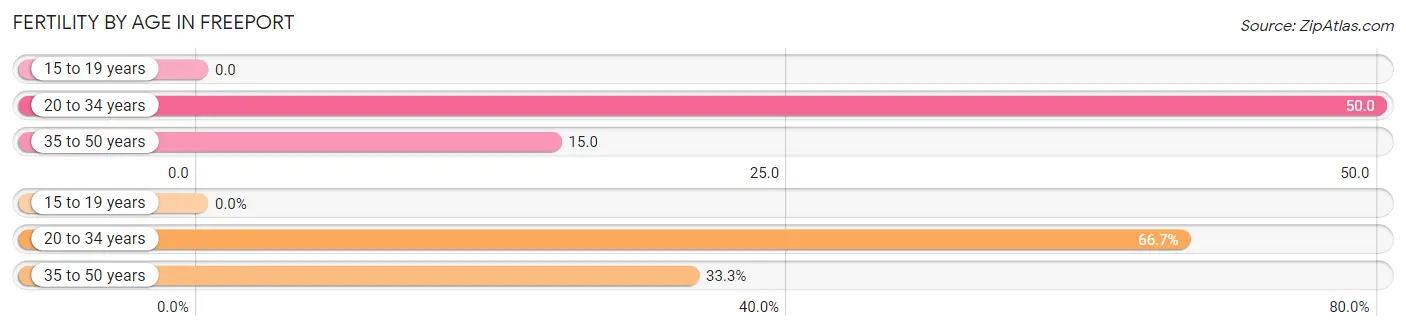
| Age Bracket | Women with Births | Births / 1,000 Women |
| 15 to 19 years | 0 (0.0%) | 0.0 |
| 20 to 34 years | 22 (66.7%) | 50.0 |
| 35 to 50 years | 11 (33.3%) | 15.0 |
| Total | 33 (100.0%) | 26.0 |
Fertility by Age by Marriage Status in Freeport
81.8% of women with births (33) in Freeport are married. The highest percentage of unmarried women with births falls into 20 to 34 years age bracket with 27.3% of them unmarried at the time of birth, while the lowest percentage of unmarried women with births belong to 35 to 50 years age bracket with 0.0% of them unmarried.
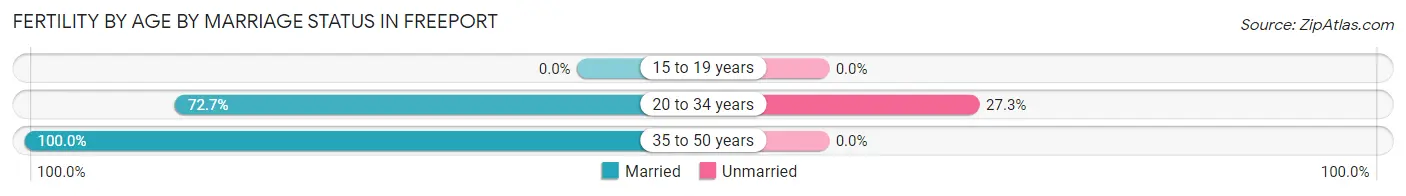
| Age Bracket | Married | Unmarried |
| 15 to 19 years | 0 (0.0%) | 0 (0.0%) |
| 20 to 34 years | 16 (72.7%) | 6 (27.3%) |
| 35 to 50 years | 11 (100.0%) | 0 (0.0%) |
| Total | 27 (81.8%) | 6 (18.2%) |
Fertility by Education in Freeport
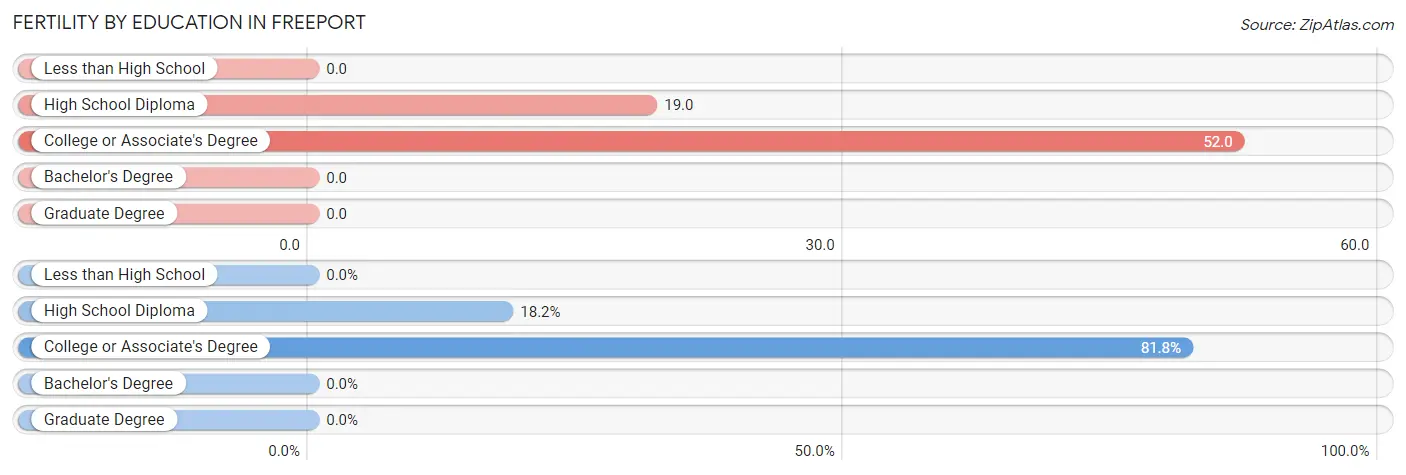
| Educational Attainment | Women with Births | Births / 1,000 Women |
| Less than High School | 0 (0.0%) | 0.0 |
| High School Diploma | 6 (18.2%) | 19.0 |
| College or Associate's Degree | 27 (81.8%) | 52.0 |
| Bachelor's Degree | 0 (0.0%) | 0.0 |
| Graduate Degree | 0 (0.0%) | 0.0 |
| Total | 33 (100.0%) | 26.0 |
Fertility by Education by Marriage Status in Freeport
18.2% of women with births in Freeport are unmarried. Women with the educational attainment of college or associate's degree are most likely to be married with 100.0% of them married at childbirth, while women with the educational attainment of high school diploma are least likely to be married with 100.0% of them unmarried at childbirth.
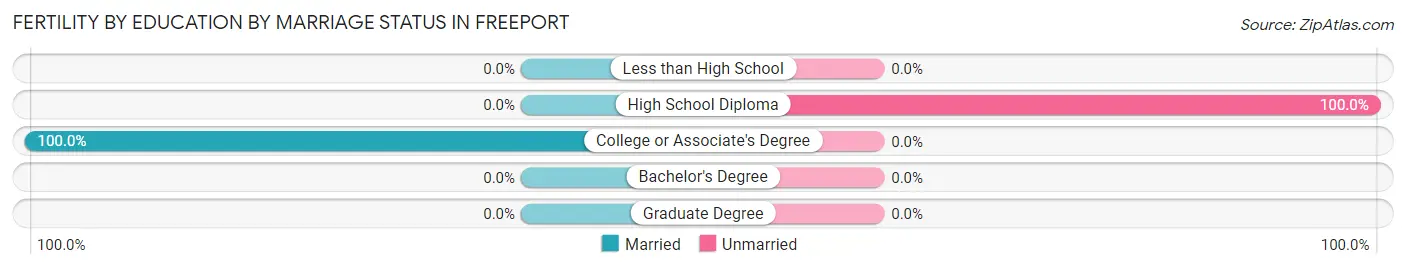
| Educational Attainment | Married | Unmarried |
| Less than High School | 0 (0.0%) | 0 (0.0%) |
| High School Diploma | 0 (0.0%) | 6 (100.0%) |
| College or Associate's Degree | 27 (100.0%) | 0 (0.0%) |
| Bachelor's Degree | 0 (0.0%) | 0 (0.0%) |
| Graduate Degree | 0 (0.0%) | 0 (0.0%) |
| Total | 27 (81.8%) | 6 (18.2%) |
Employment Characteristics in Freeport
Employment by Class of Employer in Freeport
Among the 2,784 employed individuals in Freeport, private company employees (1,742 | 62.6%), self-employed (incorporated) (311 | 11.2%), and self-employed (not incorporated) (222 | 8.0%) make up the most common classes of employment.
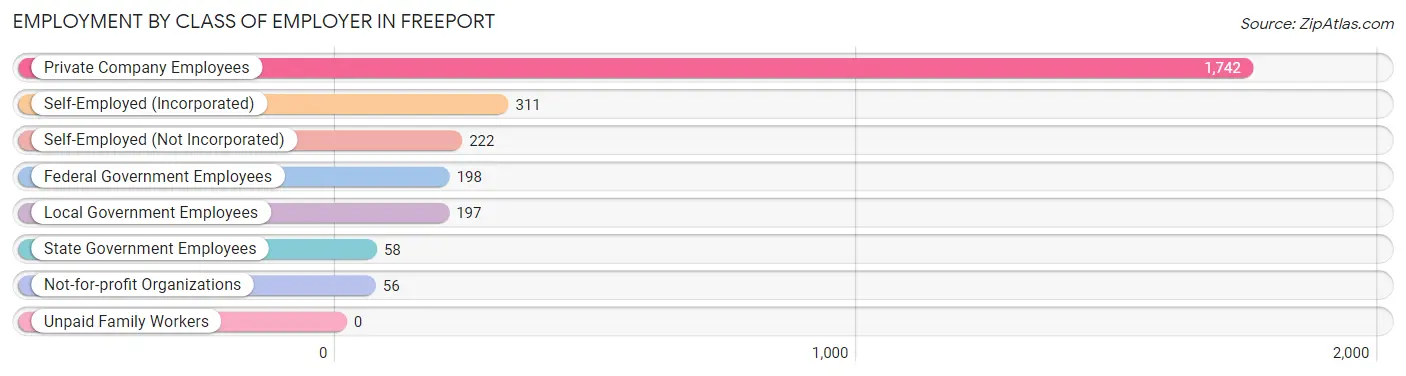
| Employer Class | # Employees | % Employees |
| Private Company Employees | 1,742 | 62.6% |
| Self-Employed (Incorporated) | 311 | 11.2% |
| Self-Employed (Not Incorporated) | 222 | 8.0% |
| Not-for-profit Organizations | 56 | 2.0% |
| Local Government Employees | 197 | 7.1% |
| State Government Employees | 58 | 2.1% |
| Federal Government Employees | 198 | 7.1% |
| Unpaid Family Workers | 0 | 0.0% |
| Total | 2,784 | 100.0% |
Employment Status by Age in Freeport
According to the labor force statistics for Freeport, out of the total population over 16 years of age (4,688), 62.1% or 2,911 individuals are in the labor force, with 4.2% or 122 of them unemployed. The age group with the highest labor force participation rate is 35 to 44 years, with 81.0% or 833 individuals in the labor force. Within the labor force, the 45 to 54 years age range has the highest percentage of unemployed individuals, with 12.7% or 84 of them being unemployed.
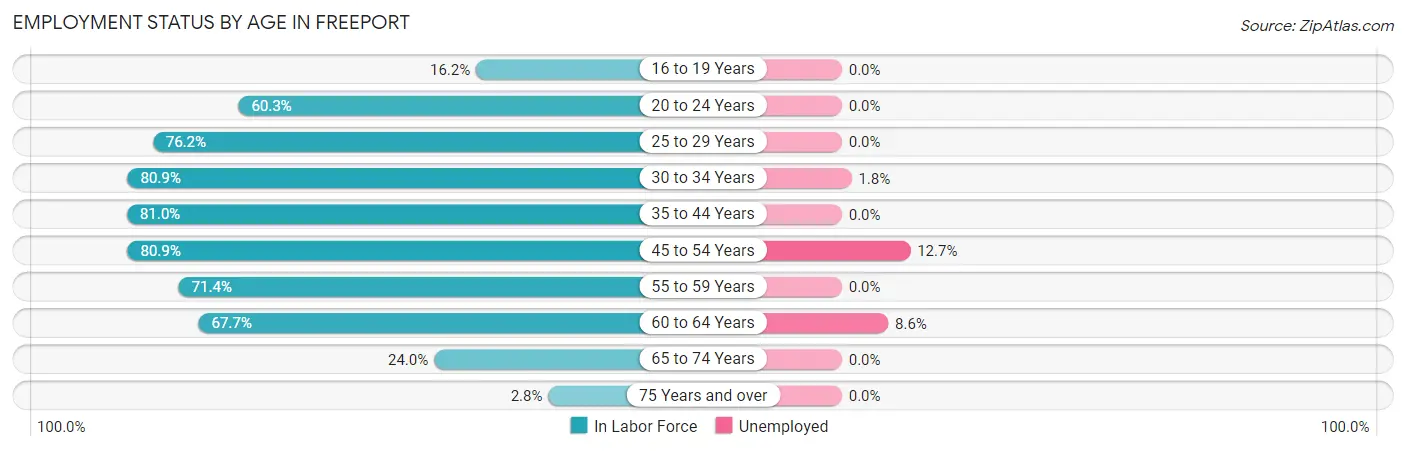
| Age Bracket | In Labor Force | Unemployed |
| 16 to 19 Years | 27 (16.2%) | 0 (0.0%) |
| 20 to 24 Years | 132 (60.3%) | 0 (0.0%) |
| 25 to 29 Years | 218 (76.2%) | 0 (0.0%) |
| 30 to 34 Years | 331 (80.9%) | 6 (1.8%) |
| 35 to 44 Years | 833 (81.0%) | 0 (0.0%) |
| 45 to 54 Years | 661 (80.9%) | 84 (12.7%) |
| 55 to 59 Years | 227 (71.4%) | 0 (0.0%) |
| 60 to 64 Years | 315 (67.7%) | 27 (8.6%) |
| 65 to 74 Years | 157 (24.0%) | 0 (0.0%) |
| 75 Years and over | 9 (2.8%) | 0 (0.0%) |
| Total | 2,911 (62.1%) | 122 (4.2%) |
Employment Status by Educational Attainment in Freeport
According to labor force statistics for Freeport, 77.8% of individuals (2,586) out of the total population between 25 and 64 years of age (3,324) are in the labor force, with 4.7% or 122 of them being unemployed. The group with the highest labor force participation rate are those with the educational attainment of bachelor's degree or higher, with 82.7% or 749 individuals in the labor force. Within the labor force, individuals with college / associate degree education have the highest percentage of unemployment, with 6.2% or 87 of them being unemployed.
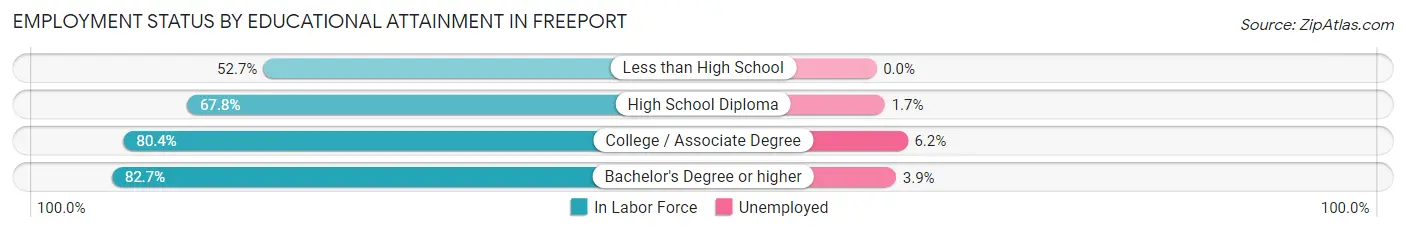
| Educational Attainment | In Labor Force | Unemployed |
| Less than High School | 79 (52.7%) | 0 (0.0%) |
| High School Diploma | 349 (67.8%) | 9 (1.7%) |
| College / Associate Degree | 1,409 (80.4%) | 109 (6.2%) |
| Bachelor's Degree or higher | 749 (82.7%) | 35 (3.9%) |
| Total | 2,586 (77.8%) | 156 (4.7%) |
Employment Occupations by Sex in Freeport
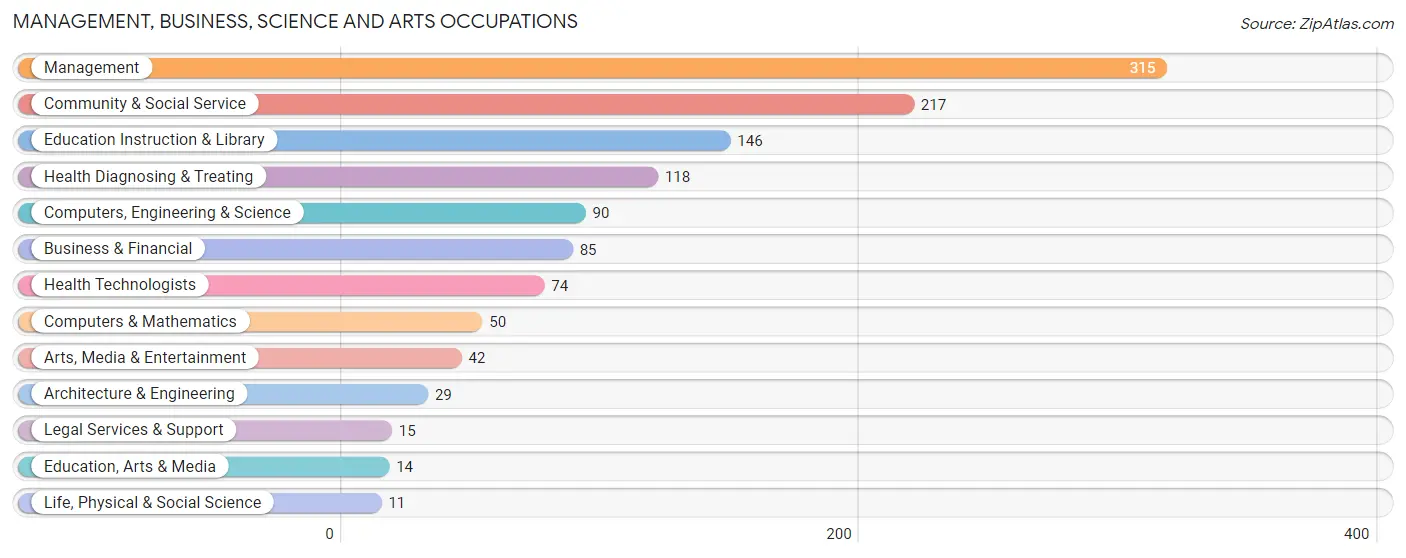
Management, Business, Science and Arts Occupations
The most common Management, Business, Science and Arts occupations in Freeport are Management (315 | 11.7%), Community & Social Service (217 | 8.1%), Education Instruction & Library (146 | 5.4%), Health Diagnosing & Treating (118 | 4.4%), and Computers, Engineering & Science (90 | 3.4%).
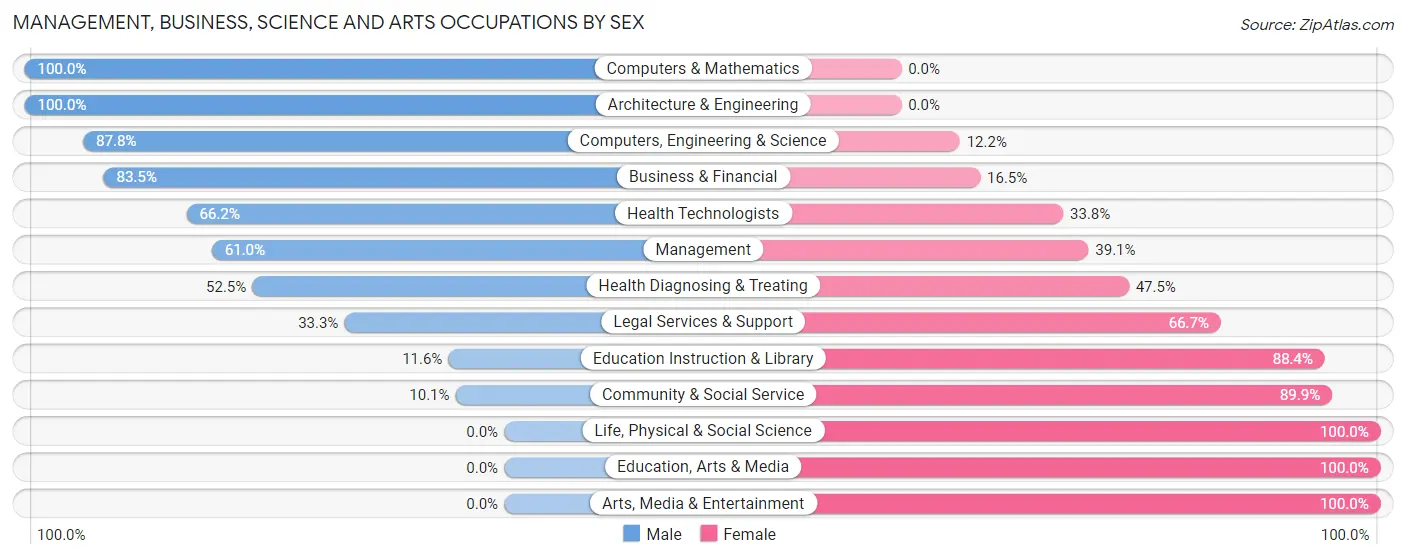
Management, Business, Science and Arts Occupations by Sex
Within the Management, Business, Science and Arts occupations in Freeport, the most male-oriented occupations are Computers & Mathematics (100.0%), Architecture & Engineering (100.0%), and Computers, Engineering & Science (87.8%), while the most female-oriented occupations are Life, Physical & Social Science (100.0%), Education, Arts & Media (100.0%), and Arts, Media & Entertainment (100.0%).
| Occupation | Male | Female |
| Management | 192 (61.0%) | 123 (39.1%) |
| Business & Financial | 71 (83.5%) | 14 (16.5%) |
| Computers, Engineering & Science | 79 (87.8%) | 11 (12.2%) |
| Computers & Mathematics | 50 (100.0%) | 0 (0.0%) |
| Architecture & Engineering | 29 (100.0%) | 0 (0.0%) |
| Life, Physical & Social Science | 0 (0.0%) | 11 (100.0%) |
| Community & Social Service | 22 (10.1%) | 195 (89.9%) |
| Education, Arts & Media | 0 (0.0%) | 14 (100.0%) |
| Legal Services & Support | 5 (33.3%) | 10 (66.7%) |
| Education Instruction & Library | 17 (11.6%) | 129 (88.4%) |
| Arts, Media & Entertainment | 0 (0.0%) | 42 (100.0%) |
| Health Diagnosing & Treating | 62 (52.5%) | 56 (47.5%) |
| Health Technologists | 49 (66.2%) | 25 (33.8%) |
| Total (Category) | 426 (51.6%) | 399 (48.4%) |
| Total (Overall) | 1,535 (57.1%) | 1,155 (42.9%) |
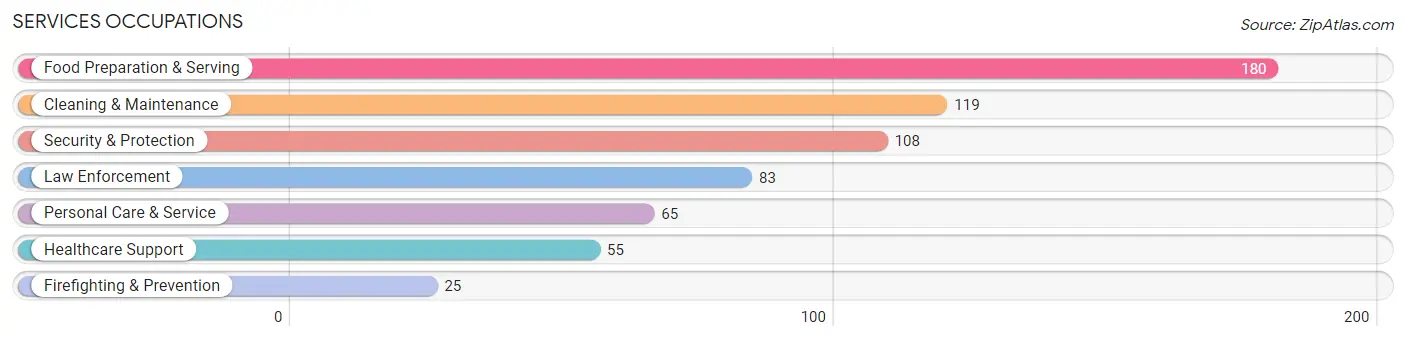
Services Occupations
The most common Services occupations in Freeport are Food Preparation & Serving (180 | 6.7%), Cleaning & Maintenance (119 | 4.4%), Security & Protection (108 | 4.0%), Law Enforcement (83 | 3.1%), and Personal Care & Service (65 | 2.4%).
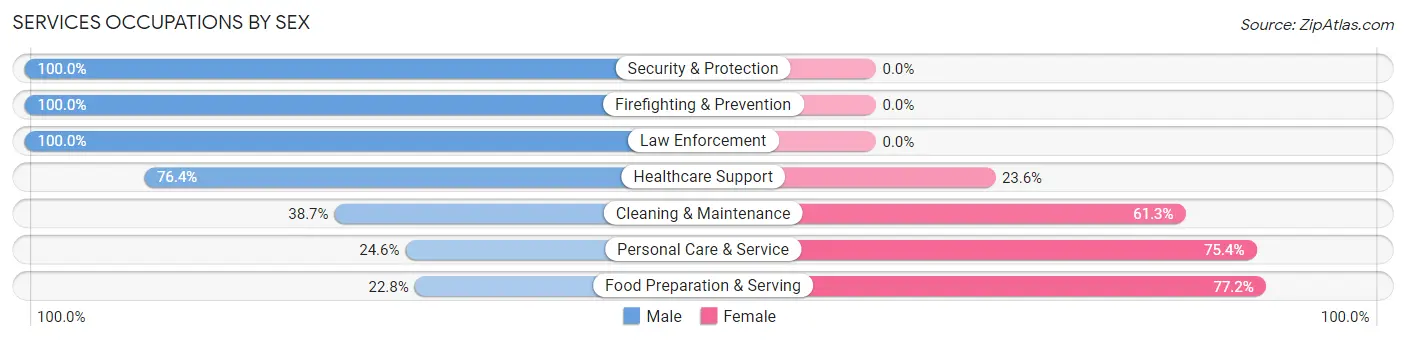
Services Occupations by Sex
Within the Services occupations in Freeport, the most male-oriented occupations are Security & Protection (100.0%), Firefighting & Prevention (100.0%), and Law Enforcement (100.0%), while the most female-oriented occupations are Food Preparation & Serving (77.2%), Personal Care & Service (75.4%), and Cleaning & Maintenance (61.3%).
| Occupation | Male | Female |
| Healthcare Support | 42 (76.4%) | 13 (23.6%) |
| Security & Protection | 108 (100.0%) | 0 (0.0%) |
| Firefighting & Prevention | 25 (100.0%) | 0 (0.0%) |
| Law Enforcement | 83 (100.0%) | 0 (0.0%) |
| Food Preparation & Serving | 41 (22.8%) | 139 (77.2%) |
| Cleaning & Maintenance | 46 (38.7%) | 73 (61.3%) |
| Personal Care & Service | 16 (24.6%) | 49 (75.4%) |
| Total (Category) | 253 (48.0%) | 274 (52.0%) |
| Total (Overall) | 1,535 (57.1%) | 1,155 (42.9%) |
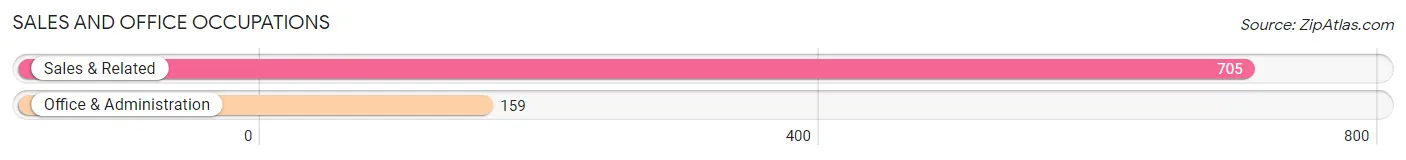
Sales and Office Occupations
The most common Sales and Office occupations in Freeport are Sales & Related (705 | 26.2%), and Office & Administration (159 | 5.9%).
Sales and Office Occupations by Sex
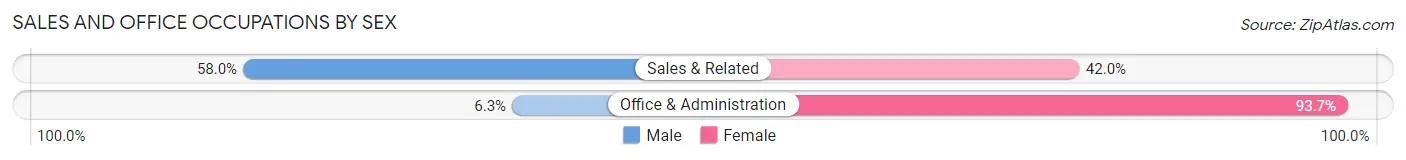
| Occupation | Male | Female |
| Sales & Related | 409 (58.0%) | 296 (42.0%) |
| Office & Administration | 10 (6.3%) | 149 (93.7%) |
| Total (Category) | 419 (48.5%) | 445 (51.5%) |
| Total (Overall) | 1,535 (57.1%) | 1,155 (42.9%) |
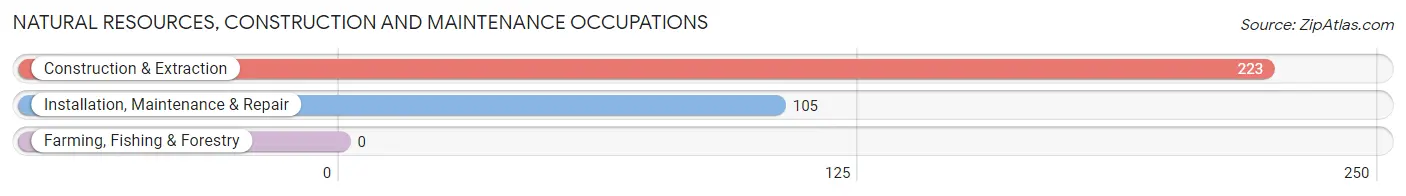
Natural Resources, Construction and Maintenance Occupations
The most common Natural Resources, Construction and Maintenance occupations in Freeport are Construction & Extraction (223 | 8.3%), and Installation, Maintenance & Repair (105 | 3.9%).
Natural Resources, Construction and Maintenance Occupations by Sex
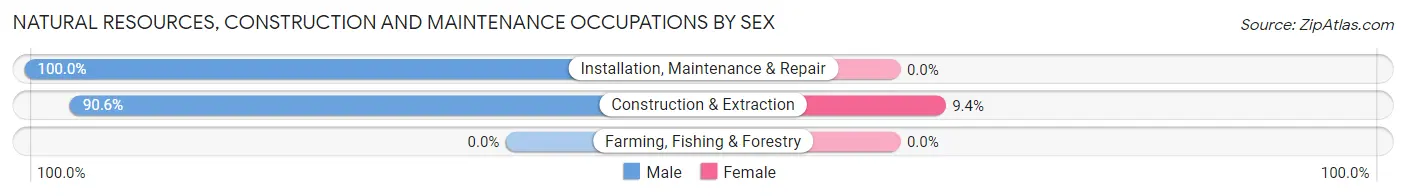
| Occupation | Male | Female |
| Farming, Fishing & Forestry | 0 (0.0%) | 0 (0.0%) |
| Construction & Extraction | 202 (90.6%) | 21 (9.4%) |
| Installation, Maintenance & Repair | 105 (100.0%) | 0 (0.0%) |
| Total (Category) | 307 (93.6%) | 21 (6.4%) |
| Total (Overall) | 1,535 (57.1%) | 1,155 (42.9%) |
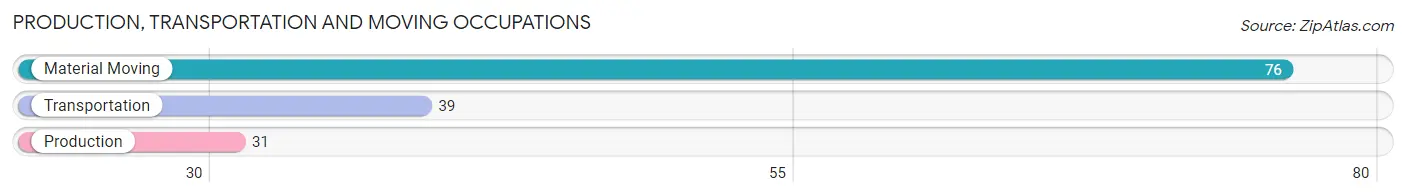
Production, Transportation and Moving Occupations
The most common Production, Transportation and Moving occupations in Freeport are Material Moving (76 | 2.8%), Transportation (39 | 1.5%), and Production (31 | 1.1%).
Production, Transportation and Moving Occupations by Sex
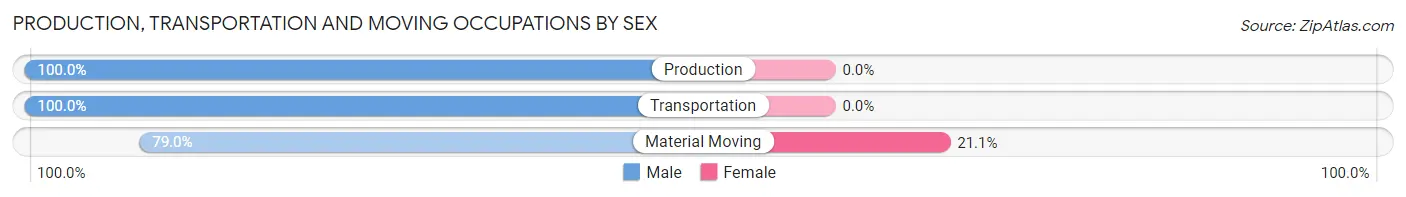
| Occupation | Male | Female |
| Production | 31 (100.0%) | 0 (0.0%) |
| Transportation | 39 (100.0%) | 0 (0.0%) |
| Material Moving | 60 (78.9%) | 16 (21.0%) |
| Total (Category) | 130 (89.0%) | 16 (11.0%) |
| Total (Overall) | 1,535 (57.1%) | 1,155 (42.9%) |
Employment Industries by Sex in Freeport
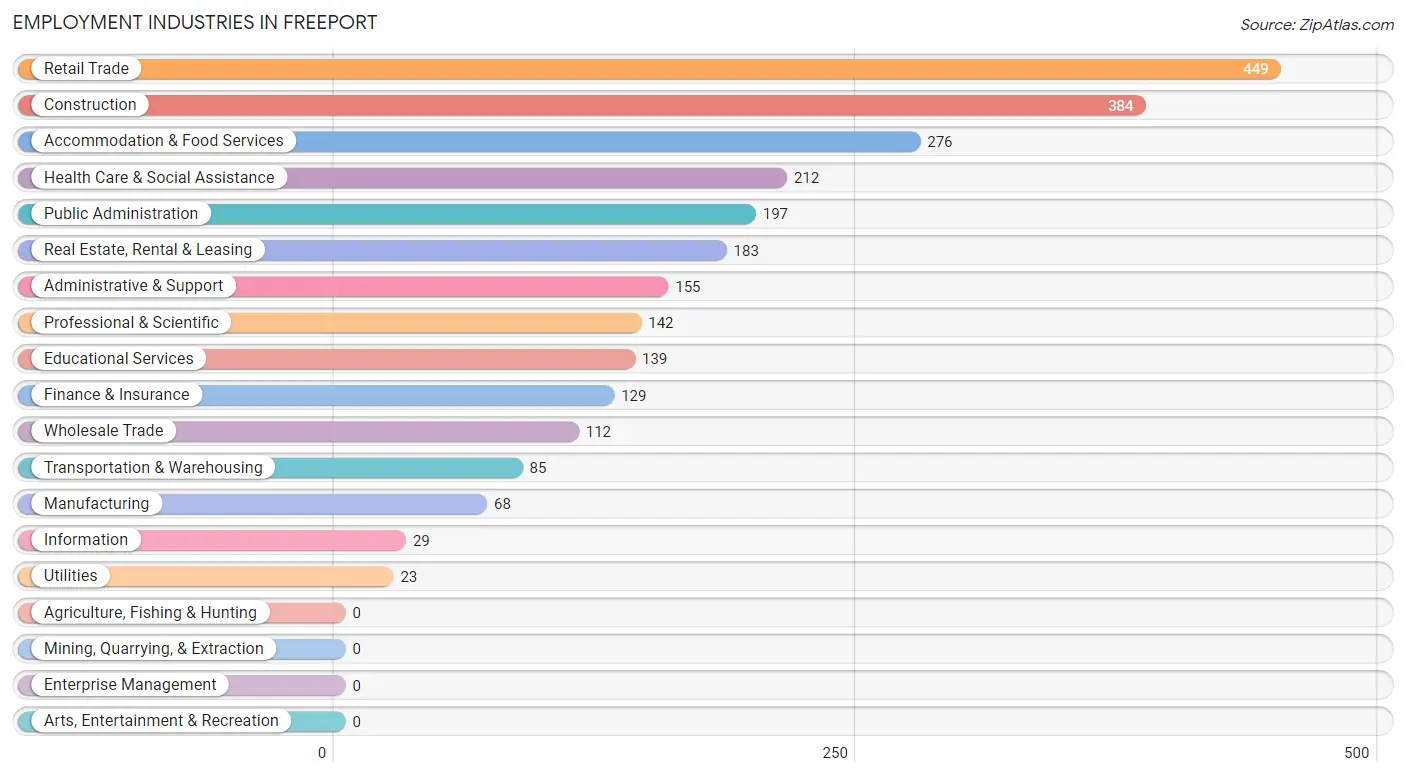
Employment Industries in Freeport
The major employment industries in Freeport include Retail Trade (449 | 16.7%), Construction (384 | 14.3%), Accommodation & Food Services (276 | 10.3%), Health Care & Social Assistance (212 | 7.9%), and Public Administration (197 | 7.3%).
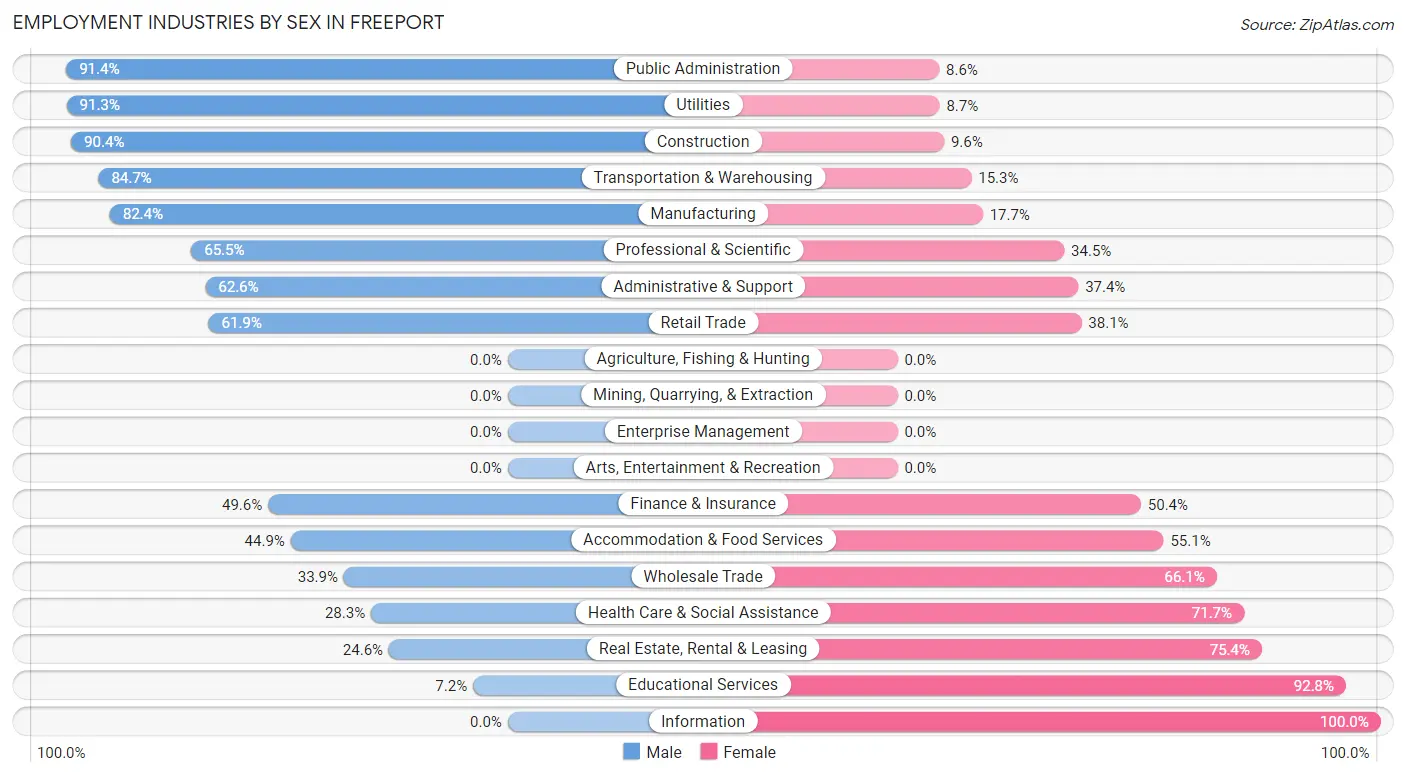
Employment Industries by Sex in Freeport
The Freeport industries that see more men than women are Public Administration (91.4%), Utilities (91.3%), and Construction (90.4%), whereas the industries that tend to have a higher number of women are Information (100.0%), Educational Services (92.8%), and Real Estate, Rental & Leasing (75.4%).
| Industry | Male | Female |
| Agriculture, Fishing & Hunting | 0 (0.0%) | 0 (0.0%) |
| Mining, Quarrying, & Extraction | 0 (0.0%) | 0 (0.0%) |
| Construction | 347 (90.4%) | 37 (9.6%) |
| Manufacturing | 56 (82.4%) | 12 (17.6%) |
| Wholesale Trade | 38 (33.9%) | 74 (66.1%) |
| Retail Trade | 278 (61.9%) | 171 (38.1%) |
| Transportation & Warehousing | 72 (84.7%) | 13 (15.3%) |
| Utilities | 21 (91.3%) | 2 (8.7%) |
| Information | 0 (0.0%) | 29 (100.0%) |
| Finance & Insurance | 64 (49.6%) | 65 (50.4%) |
| Real Estate, Rental & Leasing | 45 (24.6%) | 138 (75.4%) |
| Professional & Scientific | 93 (65.5%) | 49 (34.5%) |
| Enterprise Management | 0 (0.0%) | 0 (0.0%) |
| Administrative & Support | 97 (62.6%) | 58 (37.4%) |
| Educational Services | 10 (7.2%) | 129 (92.8%) |
| Health Care & Social Assistance | 60 (28.3%) | 152 (71.7%) |
| Arts, Entertainment & Recreation | 0 (0.0%) | 0 (0.0%) |
| Accommodation & Food Services | 124 (44.9%) | 152 (55.1%) |
| Public Administration | 180 (91.4%) | 17 (8.6%) |
| Total | 1,535 (57.1%) | 1,155 (42.9%) |
Education in Freeport
School Enrollment in Freeport
The most common levels of schooling among the 1,226 students in Freeport are middle school (343 | 28.0%), elementary school (257 | 21.0%), and high school (232 | 18.9%).
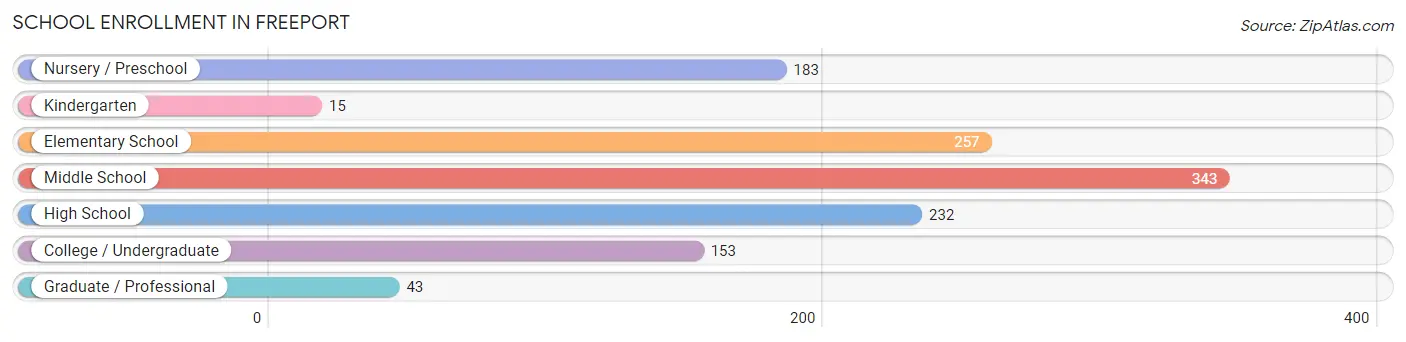
| School Level | # Students | % Students |
| Nursery / Preschool | 183 | 14.9% |
| Kindergarten | 15 | 1.2% |
| Elementary School | 257 | 21.0% |
| Middle School | 343 | 28.0% |
| High School | 232 | 18.9% |
| College / Undergraduate | 153 | 12.5% |
| Graduate / Professional | 43 | 3.5% |
| Total | 1,226 | 100.0% |
School Enrollment by Age by Funding Source in Freeport
Out of a total of 1,226 students who are enrolled in schools in Freeport, 194 (15.8%) attend a private institution, while the remaining 1,032 (84.2%) are enrolled in public schools. The age group of 3 to 4 year olds has the highest likelihood of being enrolled in private schools, with 119 (100.0% in the age bracket) enrolled. Conversely, the age group of 5 to 9 year old has the lowest likelihood of being enrolled in a private school, with 308 (100.0% in the age bracket) attending a public institution.
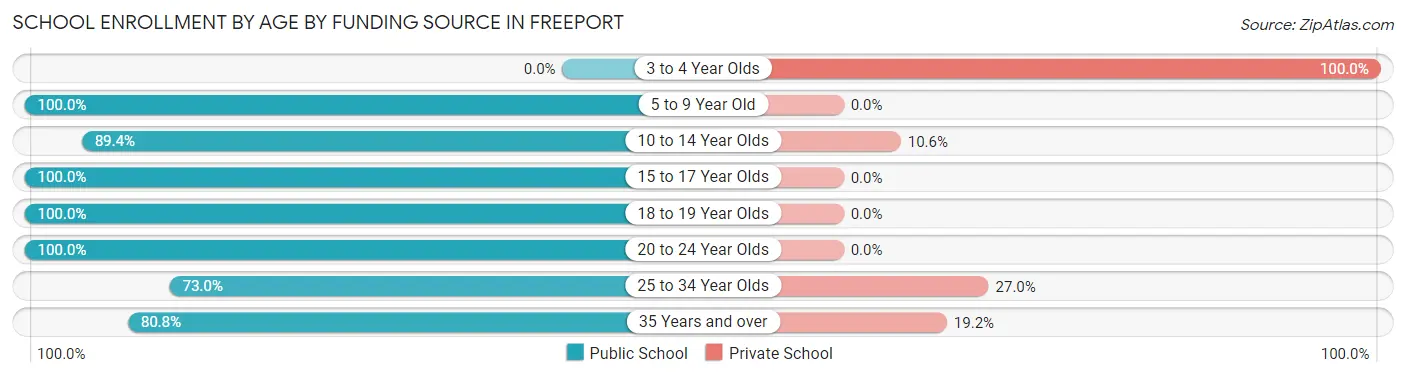
| Age Bracket | Public School | Private School |
| 3 to 4 Year Olds | 0 (0.0%) | 119 (100.0%) |
| 5 to 9 Year Old | 308 (100.0%) | 0 (0.0%) |
| 10 to 14 Year Olds | 361 (89.4%) | 43 (10.6%) |
| 15 to 17 Year Olds | 160 (100.0%) | 0 (0.0%) |
| 18 to 19 Year Olds | 63 (100.0%) | 0 (0.0%) |
| 20 to 24 Year Olds | 46 (100.0%) | 0 (0.0%) |
| 25 to 34 Year Olds | 73 (73.0%) | 27 (27.0%) |
| 35 Years and over | 21 (80.8%) | 5 (19.2%) |
| Total | 1,032 (84.2%) | 194 (15.8%) |
Educational Attainment by Field of Study in Freeport
Business (365 | 27.7%), education (285 | 21.6%), engineering (140 | 10.6%), visual & performing arts (111 | 8.4%), and bio, nature & agricultural (86 | 6.5%) are the most common fields of study among 1,317 individuals in Freeport who have obtained a bachelor's degree or higher.
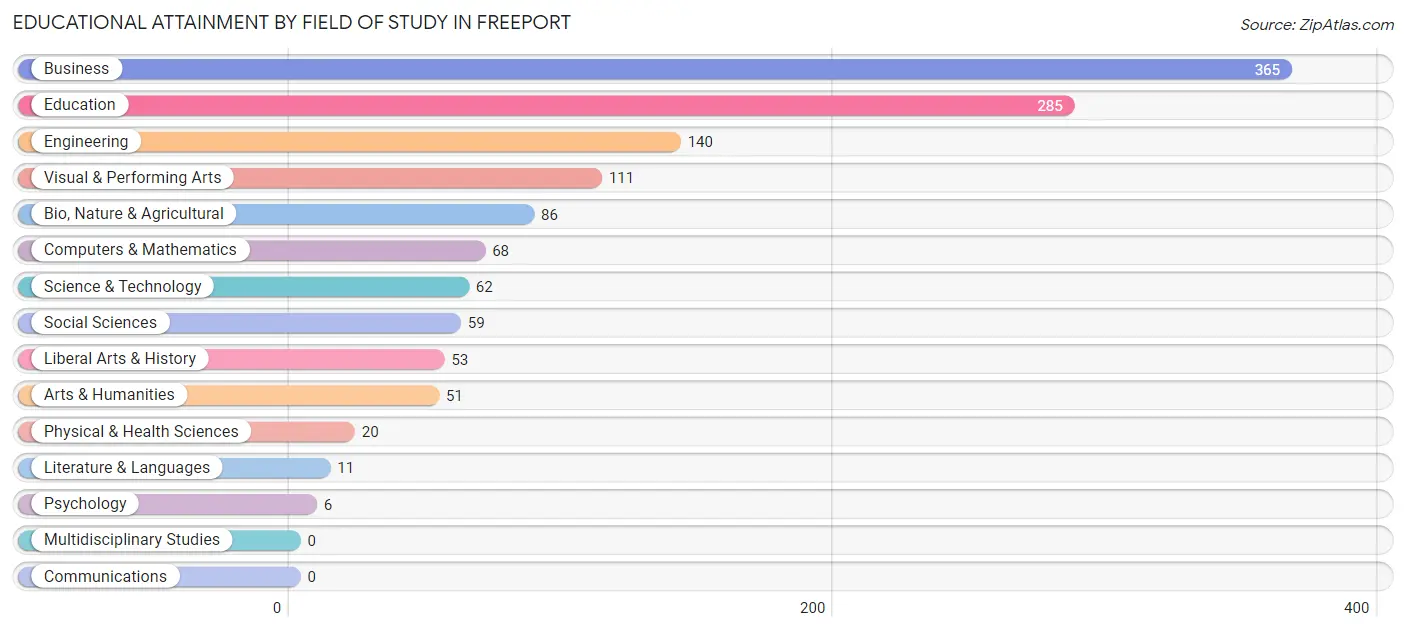
| Field of Study | # Graduates | % Graduates |
| Computers & Mathematics | 68 | 5.2% |
| Bio, Nature & Agricultural | 86 | 6.5% |
| Physical & Health Sciences | 20 | 1.5% |
| Psychology | 6 | 0.5% |
| Social Sciences | 59 | 4.5% |
| Engineering | 140 | 10.6% |
| Multidisciplinary Studies | 0 | 0.0% |
| Science & Technology | 62 | 4.7% |
| Business | 365 | 27.7% |
| Education | 285 | 21.6% |
| Literature & Languages | 11 | 0.8% |
| Liberal Arts & History | 53 | 4.0% |
| Visual & Performing Arts | 111 | 8.4% |
| Communications | 0 | 0.0% |
| Arts & Humanities | 51 | 3.9% |
| Total | 1,317 | 100.0% |
Transportation & Commute in Freeport
Vehicle Availability by Sex in Freeport
The most prevalent vehicle ownership categories in Freeport are males with 2 vehicles (822, accounting for 51.5%) and females with 2 vehicles (668, making up 69.1%).
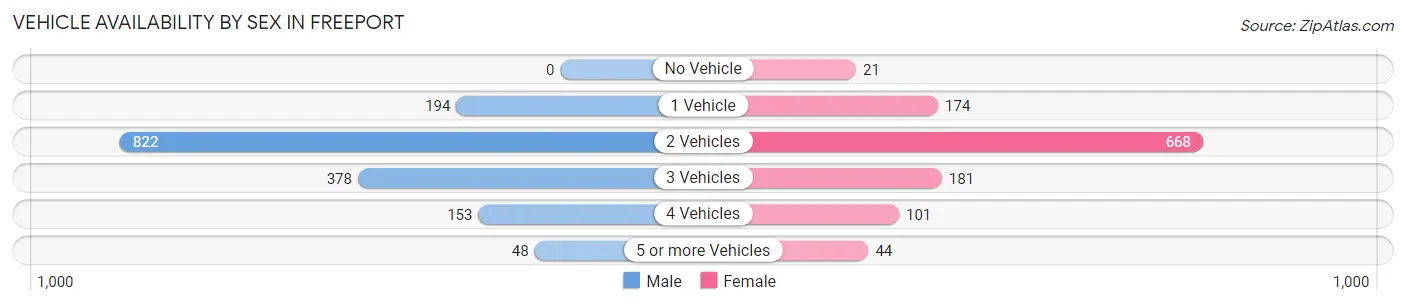
| Vehicles Available | Male | Female |
| No Vehicle | 0 (0.0%) | 21 (1.8%) |
| 1 Vehicle | 194 (12.2%) | 174 (14.6%) |
| 2 Vehicles | 822 (51.5%) | 668 (56.2%) |
| 3 Vehicles | 378 (23.7%) | 181 (15.2%) |
| 4 Vehicles | 153 (9.6%) | 101 (8.5%) |
| 5 or more Vehicles | 48 (3.0%) | 44 (3.7%) |
| Total | 1,595 (100.0%) | 1,189 (100.0%) |
Commute Time in Freeport
The most frequently occuring commute durations in Freeport are 30 to 34 minutes (373 commuters, 16.0%), 45 to 59 minutes (370 commuters, 15.9%), and 15 to 19 minutes (227 commuters, 9.7%).
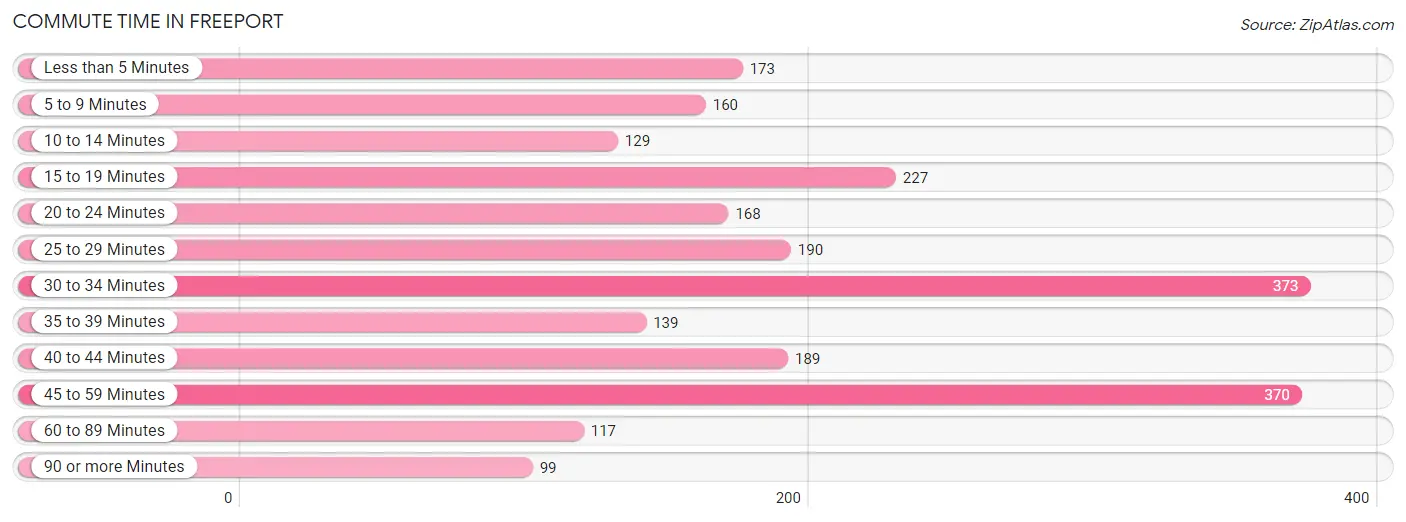
| Commute Time | # Commuters | % Commuters |
| Less than 5 Minutes | 173 | 7.4% |
| 5 to 9 Minutes | 160 | 6.9% |
| 10 to 14 Minutes | 129 | 5.5% |
| 15 to 19 Minutes | 227 | 9.7% |
| 20 to 24 Minutes | 168 | 7.2% |
| 25 to 29 Minutes | 190 | 8.1% |
| 30 to 34 Minutes | 373 | 16.0% |
| 35 to 39 Minutes | 139 | 6.0% |
| 40 to 44 Minutes | 189 | 8.1% |
| 45 to 59 Minutes | 370 | 15.9% |
| 60 to 89 Minutes | 117 | 5.0% |
| 90 or more Minutes | 99 | 4.2% |
Commute Time by Sex in Freeport
The most common commute times in Freeport are 30 to 34 minutes (282 commuters, 21.4%) for males and less than 5 minutes (173 commuters, 17.1%) for females.
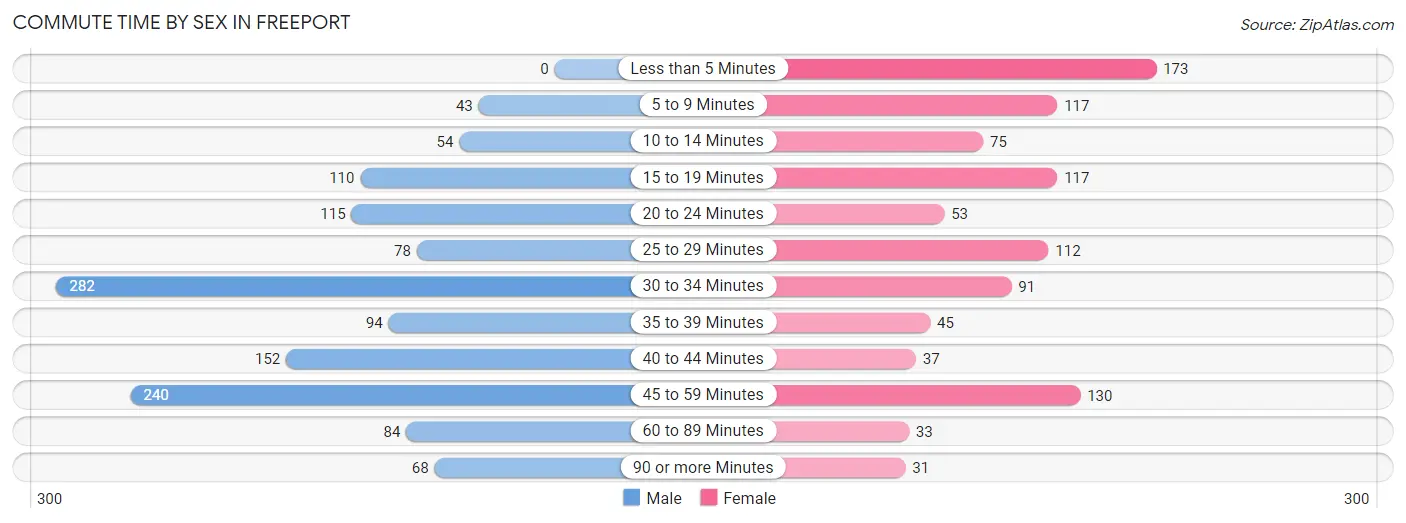
| Commute Time | Male | Female |
| Less than 5 Minutes | 0 (0.0%) | 173 (17.1%) |
| 5 to 9 Minutes | 43 (3.3%) | 117 (11.5%) |
| 10 to 14 Minutes | 54 (4.1%) | 75 (7.4%) |
| 15 to 19 Minutes | 110 (8.3%) | 117 (11.5%) |
| 20 to 24 Minutes | 115 (8.7%) | 53 (5.2%) |
| 25 to 29 Minutes | 78 (5.9%) | 112 (11.1%) |
| 30 to 34 Minutes | 282 (21.4%) | 91 (9.0%) |
| 35 to 39 Minutes | 94 (7.1%) | 45 (4.4%) |
| 40 to 44 Minutes | 152 (11.5%) | 37 (3.6%) |
| 45 to 59 Minutes | 240 (18.2%) | 130 (12.8%) |
| 60 to 89 Minutes | 84 (6.4%) | 33 (3.3%) |
| 90 or more Minutes | 68 (5.1%) | 31 (3.1%) |
Time of Departure to Work by Sex in Freeport
The most frequent times of departure to work in Freeport are 6:00 AM to 6:29 AM (234, 17.7%) for males and 7:00 AM to 7:29 AM (292, 28.8%) for females.
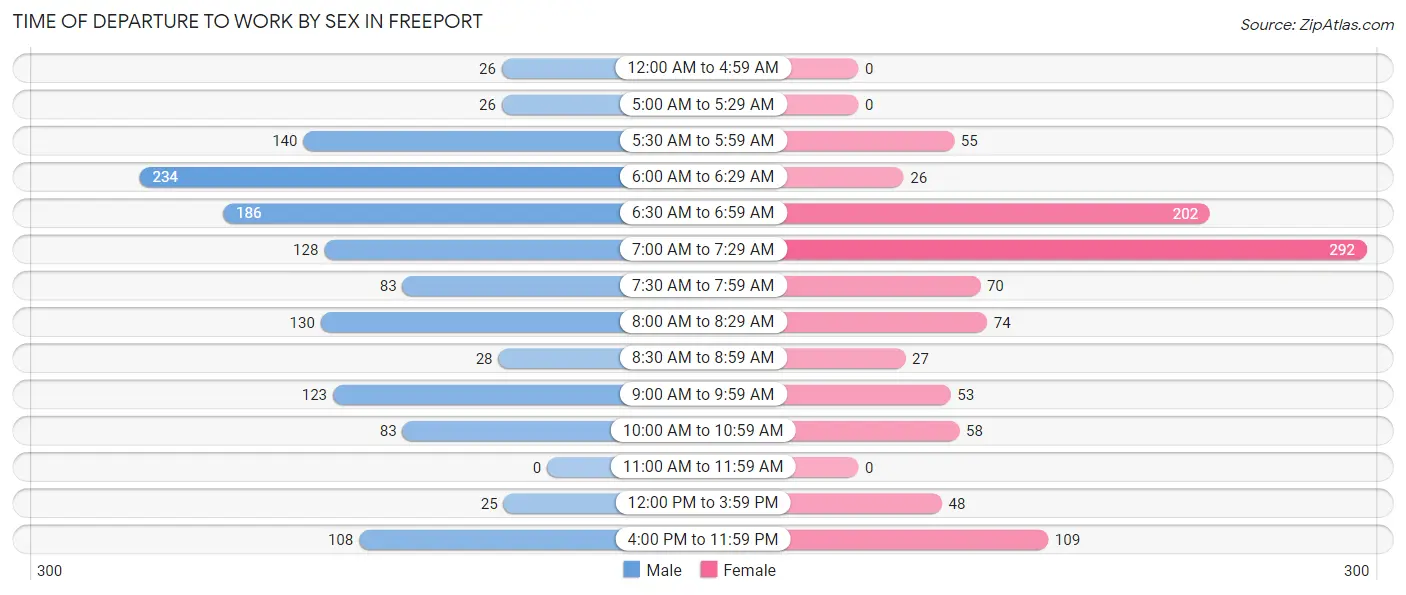
| Time of Departure | Male | Female |
| 12:00 AM to 4:59 AM | 26 (2.0%) | 0 (0.0%) |
| 5:00 AM to 5:29 AM | 26 (2.0%) | 0 (0.0%) |
| 5:30 AM to 5:59 AM | 140 (10.6%) | 55 (5.4%) |
| 6:00 AM to 6:29 AM | 234 (17.7%) | 26 (2.6%) |
| 6:30 AM to 6:59 AM | 186 (14.1%) | 202 (19.9%) |
| 7:00 AM to 7:29 AM | 128 (9.7%) | 292 (28.8%) |
| 7:30 AM to 7:59 AM | 83 (6.3%) | 70 (6.9%) |
| 8:00 AM to 8:29 AM | 130 (9.9%) | 74 (7.3%) |
| 8:30 AM to 8:59 AM | 28 (2.1%) | 27 (2.7%) |
| 9:00 AM to 9:59 AM | 123 (9.3%) | 53 (5.2%) |
| 10:00 AM to 10:59 AM | 83 (6.3%) | 58 (5.7%) |
| 11:00 AM to 11:59 AM | 0 (0.0%) | 0 (0.0%) |
| 12:00 PM to 3:59 PM | 25 (1.9%) | 48 (4.7%) |
| 4:00 PM to 11:59 PM | 108 (8.2%) | 109 (10.7%) |
| Total | 1,320 (100.0%) | 1,014 (100.0%) |
Housing Occupancy in Freeport
Occupancy by Ownership in Freeport
Of the total 2,478 dwellings in Freeport, owner-occupied units account for 1,910 (77.1%), while renter-occupied units make up 568 (22.9%).
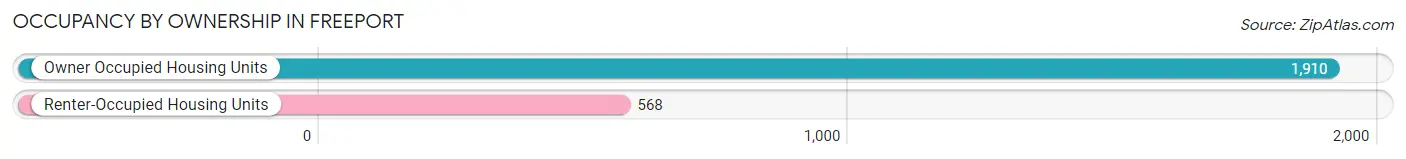
| Occupancy | # Housing Units | % Housing Units |
| Owner Occupied Housing Units | 1,910 | 77.1% |
| Renter-Occupied Housing Units | 568 | 22.9% |
| Total Occupied Housing Units | 2,478 | 100.0% |
Occupancy by Household Size in Freeport
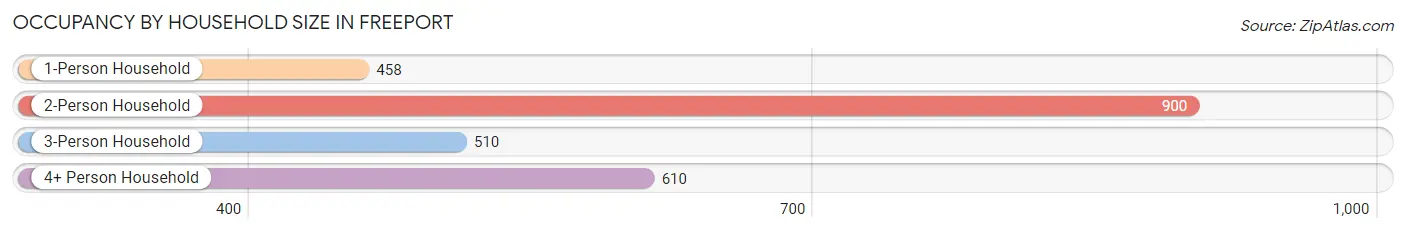
| Household Size | # Housing Units | % Housing Units |
| 1-Person Household | 458 | 18.5% |
| 2-Person Household | 900 | 36.3% |
| 3-Person Household | 510 | 20.6% |
| 4+ Person Household | 610 | 24.6% |
| Total Housing Units | 2,478 | 100.0% |
Occupancy by Ownership by Household Size in Freeport
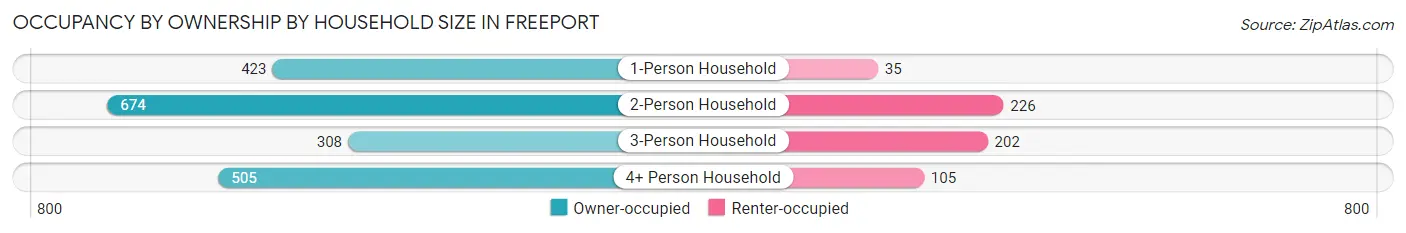
| Household Size | Owner-occupied | Renter-occupied |
| 1-Person Household | 423 (92.4%) | 35 (7.6%) |
| 2-Person Household | 674 (74.9%) | 226 (25.1%) |
| 3-Person Household | 308 (60.4%) | 202 (39.6%) |
| 4+ Person Household | 505 (82.8%) | 105 (17.2%) |
| Total Housing Units | 1,910 (77.1%) | 568 (22.9%) |
Occupancy by Educational Attainment in Freeport
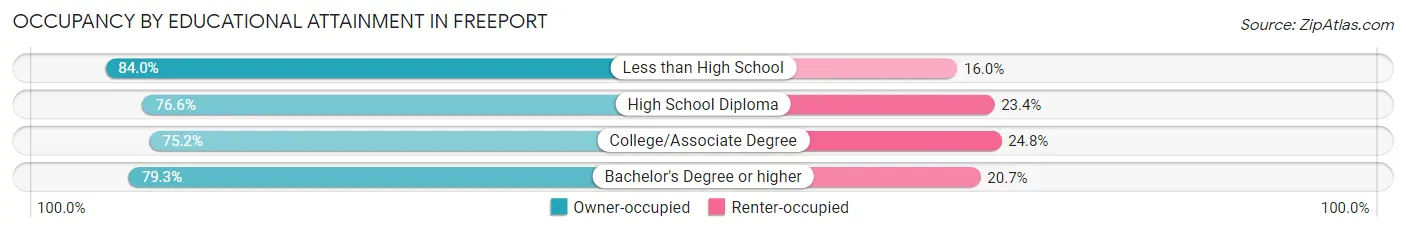
| Household Size | Owner-occupied | Renter-occupied |
| Less than High School | 110 (84.0%) | 21 (16.0%) |
| High School Diploma | 360 (76.6%) | 110 (23.4%) |
| College/Associate Degree | 895 (75.2%) | 295 (24.8%) |
| Bachelor's Degree or higher | 545 (79.3%) | 142 (20.7%) |
Occupancy by Age of Householder in Freeport
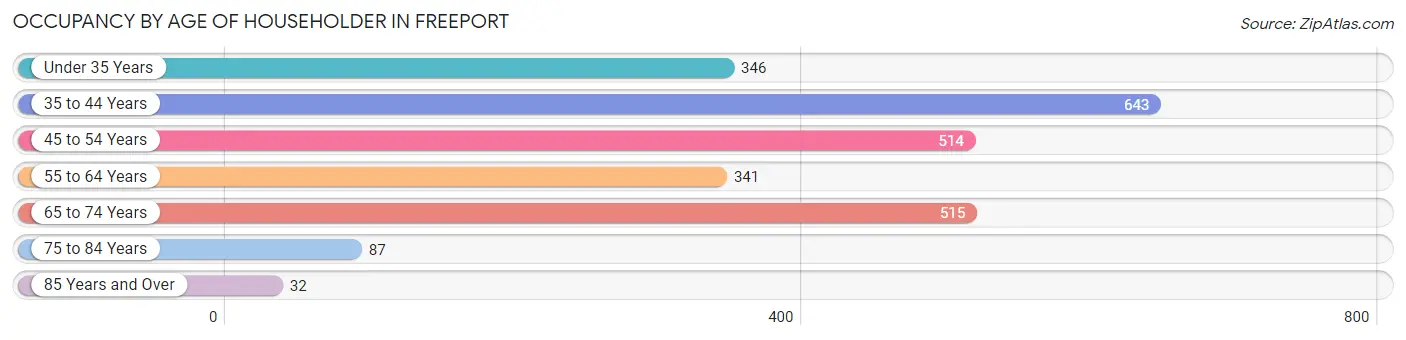
| Age Bracket | # Households | % Households |
| Under 35 Years | 346 | 14.0% |
| 35 to 44 Years | 643 | 26.0% |
| 45 to 54 Years | 514 | 20.7% |
| 55 to 64 Years | 341 | 13.8% |
| 65 to 74 Years | 515 | 20.8% |
| 75 to 84 Years | 87 | 3.5% |
| 85 Years and Over | 32 | 1.3% |
| Total | 2,478 | 100.0% |
Housing Finances in Freeport
Median Income by Occupancy in Freeport
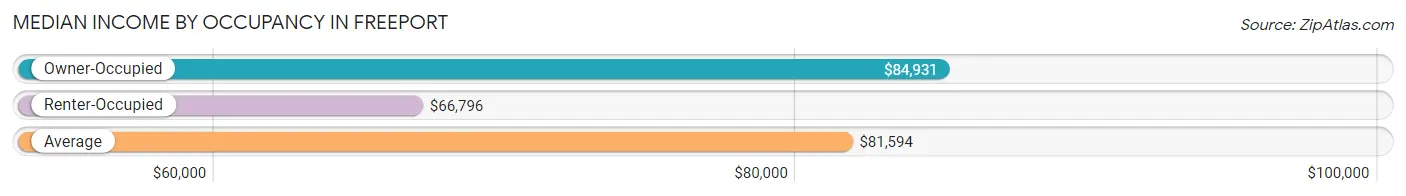
| Occupancy Type | # Households | Median Income |
| Owner-Occupied | 1,910 (77.1%) | $84,931 |
| Renter-Occupied | 568 (22.9%) | $66,796 |
| Average | 2,478 (100.0%) | $81,594 |
Occupancy by Householder Income Bracket in Freeport
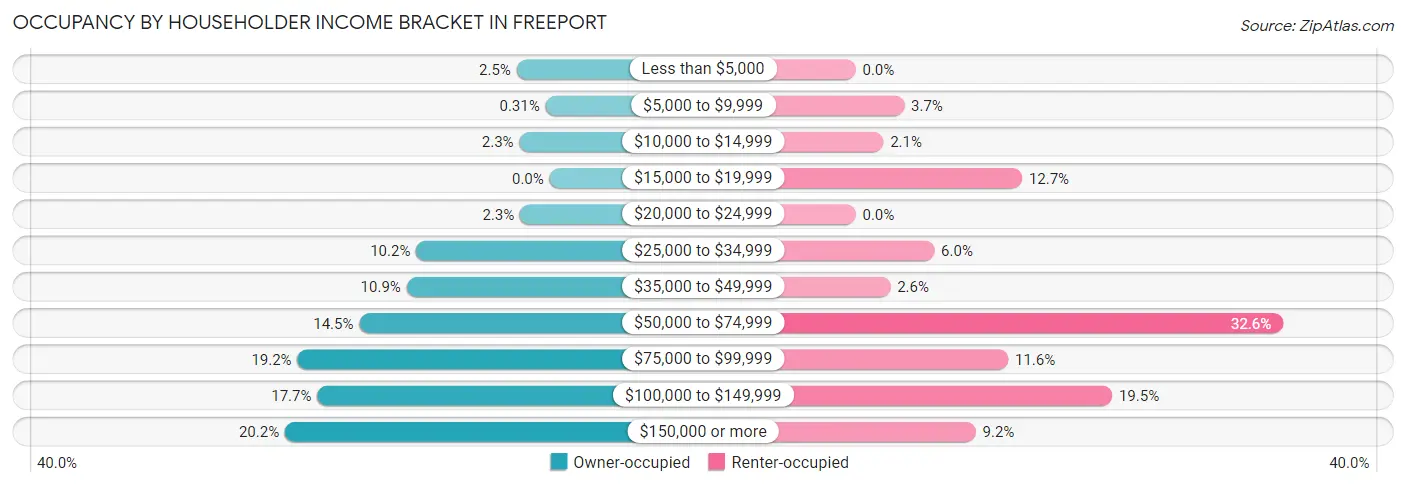
| Income Bracket | Owner-occupied | Renter-occupied |
| Less than $5,000 | 48 (2.5%) | 0 (0.0%) |
| $5,000 to $9,999 | 6 (0.3%) | 21 (3.7%) |
| $10,000 to $14,999 | 44 (2.3%) | 12 (2.1%) |
| $15,000 to $19,999 | 0 (0.0%) | 72 (12.7%) |
| $20,000 to $24,999 | 43 (2.2%) | 0 (0.0%) |
| $25,000 to $34,999 | 194 (10.2%) | 34 (6.0%) |
| $35,000 to $49,999 | 208 (10.9%) | 15 (2.6%) |
| $50,000 to $74,999 | 277 (14.5%) | 185 (32.6%) |
| $75,000 to $99,999 | 367 (19.2%) | 66 (11.6%) |
| $100,000 to $149,999 | 338 (17.7%) | 111 (19.5%) |
| $150,000 or more | 385 (20.2%) | 52 (9.1%) |
| Total | 1,910 (100.0%) | 568 (100.0%) |
Monthly Housing Cost Tiers in Freeport
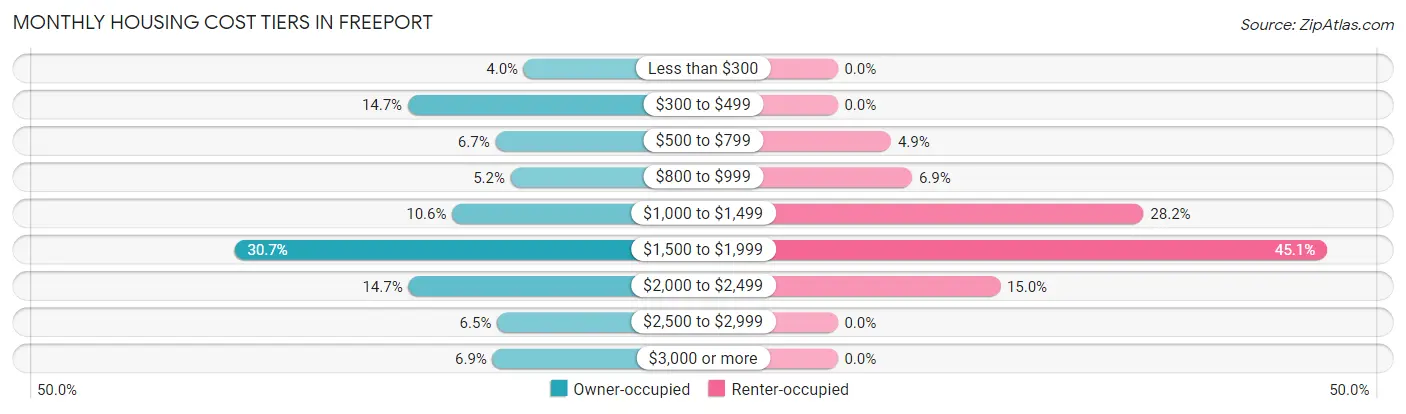
| Monthly Cost | Owner-occupied | Renter-occupied |
| Less than $300 | 77 (4.0%) | 0 (0.0%) |
| $300 to $499 | 281 (14.7%) | 0 (0.0%) |
| $500 to $799 | 127 (6.7%) | 28 (4.9%) |
| $800 to $999 | 100 (5.2%) | 39 (6.9%) |
| $1,000 to $1,499 | 203 (10.6%) | 160 (28.2%) |
| $1,500 to $1,999 | 586 (30.7%) | 256 (45.1%) |
| $2,000 to $2,499 | 280 (14.7%) | 85 (15.0%) |
| $2,500 to $2,999 | 124 (6.5%) | 0 (0.0%) |
| $3,000 or more | 132 (6.9%) | 0 (0.0%) |
| Total | 1,910 (100.0%) | 568 (100.0%) |
Physical Housing Characteristics in Freeport
Housing Structures in Freeport
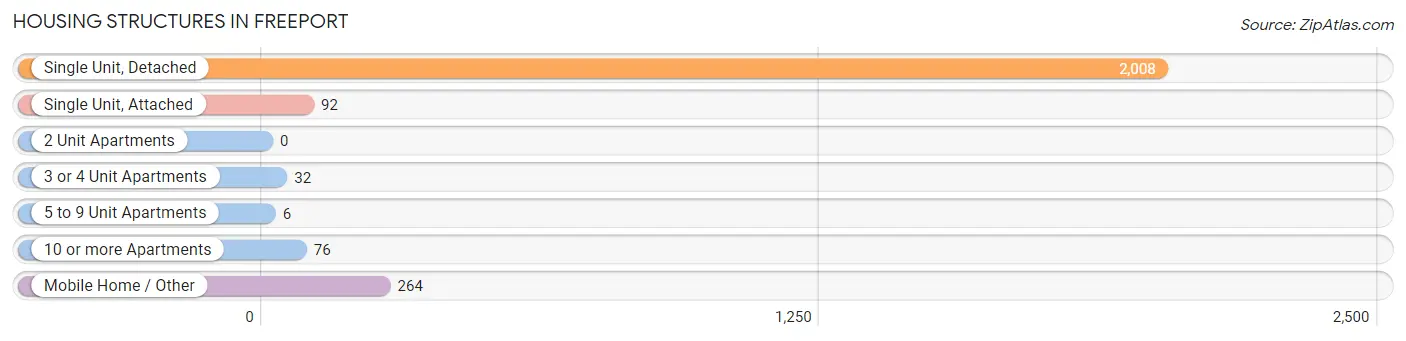
| Structure Type | # Housing Units | % Housing Units |
| Single Unit, Detached | 2,008 | 81.0% |
| Single Unit, Attached | 92 | 3.7% |
| 2 Unit Apartments | 0 | 0.0% |
| 3 or 4 Unit Apartments | 32 | 1.3% |
| 5 to 9 Unit Apartments | 6 | 0.2% |
| 10 or more Apartments | 76 | 3.1% |
| Mobile Home / Other | 264 | 10.6% |
| Total | 2,478 | 100.0% |
Housing Structures by Occupancy in Freeport
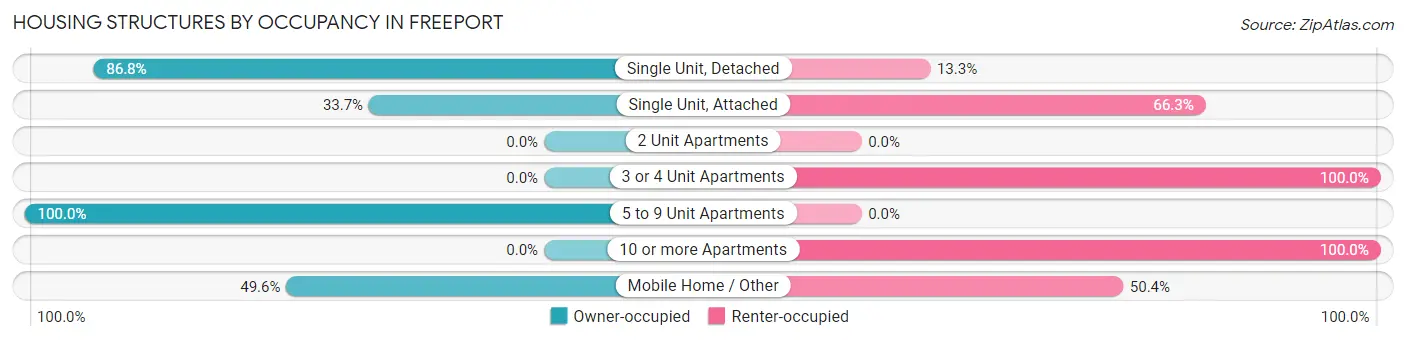
| Structure Type | Owner-occupied | Renter-occupied |
| Single Unit, Detached | 1,742 (86.8%) | 266 (13.3%) |
| Single Unit, Attached | 31 (33.7%) | 61 (66.3%) |
| 2 Unit Apartments | 0 (0.0%) | 0 (0.0%) |
| 3 or 4 Unit Apartments | 0 (0.0%) | 32 (100.0%) |
| 5 to 9 Unit Apartments | 6 (100.0%) | 0 (0.0%) |
| 10 or more Apartments | 0 (0.0%) | 76 (100.0%) |
| Mobile Home / Other | 131 (49.6%) | 133 (50.4%) |
| Total | 1,910 (77.1%) | 568 (22.9%) |
Housing Structures by Number of Rooms in Freeport
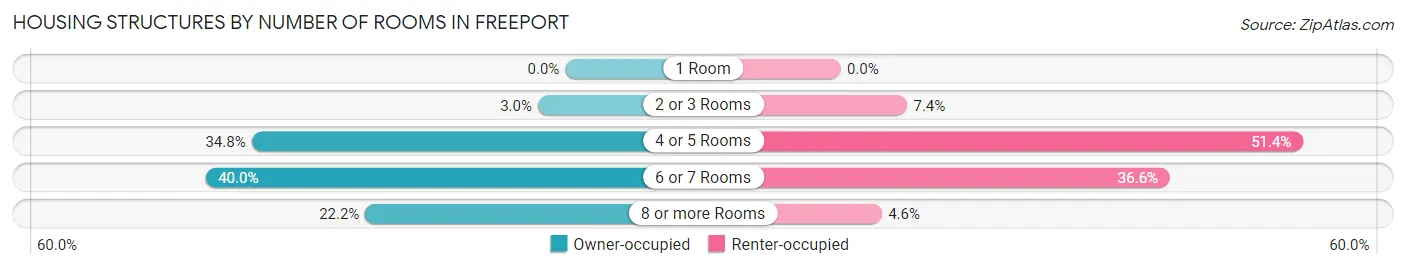
| Number of Rooms | Owner-occupied | Renter-occupied |
| 1 Room | 0 (0.0%) | 0 (0.0%) |
| 2 or 3 Rooms | 58 (3.0%) | 42 (7.4%) |
| 4 or 5 Rooms | 665 (34.8%) | 292 (51.4%) |
| 6 or 7 Rooms | 763 (40.0%) | 208 (36.6%) |
| 8 or more Rooms | 424 (22.2%) | 26 (4.6%) |
| Total | 1,910 (100.0%) | 568 (100.0%) |
Housing Structure by Heating Type in Freeport
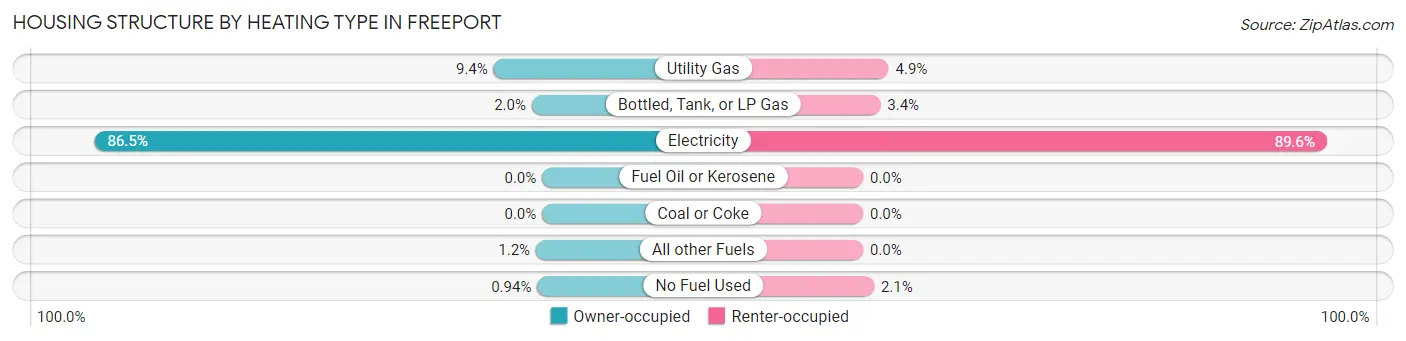
| Heating Type | Owner-occupied | Renter-occupied |
| Utility Gas | 179 (9.4%) | 28 (4.9%) |
| Bottled, Tank, or LP Gas | 38 (2.0%) | 19 (3.4%) |
| Electricity | 1,652 (86.5%) | 509 (89.6%) |
| Fuel Oil or Kerosene | 0 (0.0%) | 0 (0.0%) |
| Coal or Coke | 0 (0.0%) | 0 (0.0%) |
| All other Fuels | 23 (1.2%) | 0 (0.0%) |
| No Fuel Used | 18 (0.9%) | 12 (2.1%) |
| Total | 1,910 (100.0%) | 568 (100.0%) |
Household Vehicle Usage in Freeport
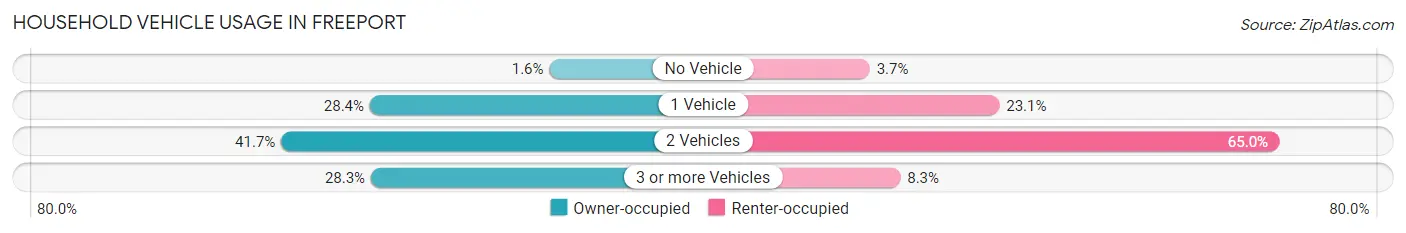
| Vehicles per Household | Owner-occupied | Renter-occupied |
| No Vehicle | 31 (1.6%) | 21 (3.7%) |
| 1 Vehicle | 543 (28.4%) | 131 (23.1%) |
| 2 Vehicles | 796 (41.7%) | 369 (65.0%) |
| 3 or more Vehicles | 540 (28.3%) | 47 (8.3%) |
| Total | 1,910 (100.0%) | 568 (100.0%) |
Real Estate & Mortgages in Freeport
Real Estate and Mortgage Overview in Freeport
| Characteristic | Without Mortgage | With Mortgage |
| Housing Units | 451 | 1,459 |
| Median Property Value | $318,200 | $344,900 |
| Median Household Income | $56,917 | $310 |
| Monthly Housing Costs | $432 | $132 |
| Real Estate Taxes | $1,149 | $30 |
Property Value by Mortgage Status in Freeport
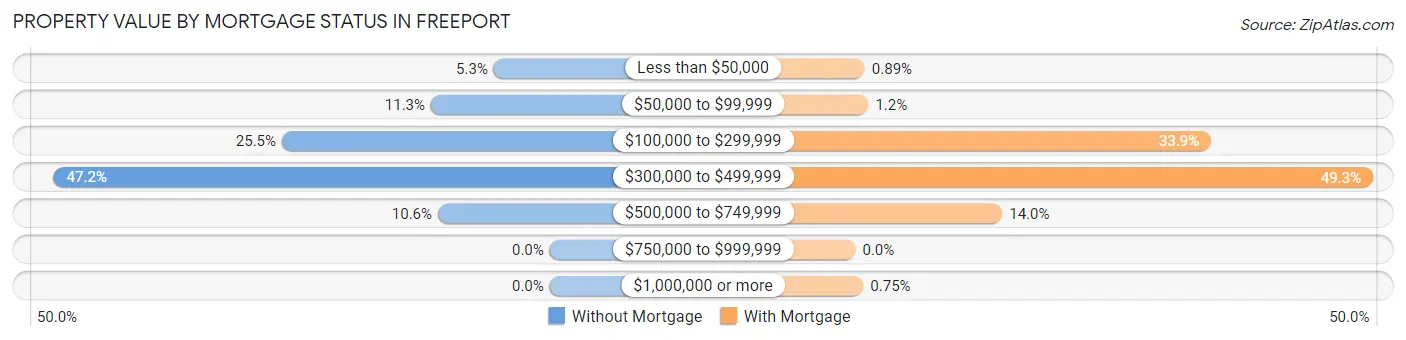
| Property Value | Without Mortgage | With Mortgage |
| Less than $50,000 | 24 (5.3%) | 13 (0.9%) |
| $50,000 to $99,999 | 51 (11.3%) | 18 (1.2%) |
| $100,000 to $299,999 | 115 (25.5%) | 494 (33.9%) |
| $300,000 to $499,999 | 213 (47.2%) | 719 (49.3%) |
| $500,000 to $749,999 | 48 (10.6%) | 204 (14.0%) |
| $750,000 to $999,999 | 0 (0.0%) | 0 (0.0%) |
| $1,000,000 or more | 0 (0.0%) | 11 (0.7%) |
| Total | 451 (100.0%) | 1,459 (100.0%) |
Household Income by Mortgage Status in Freeport
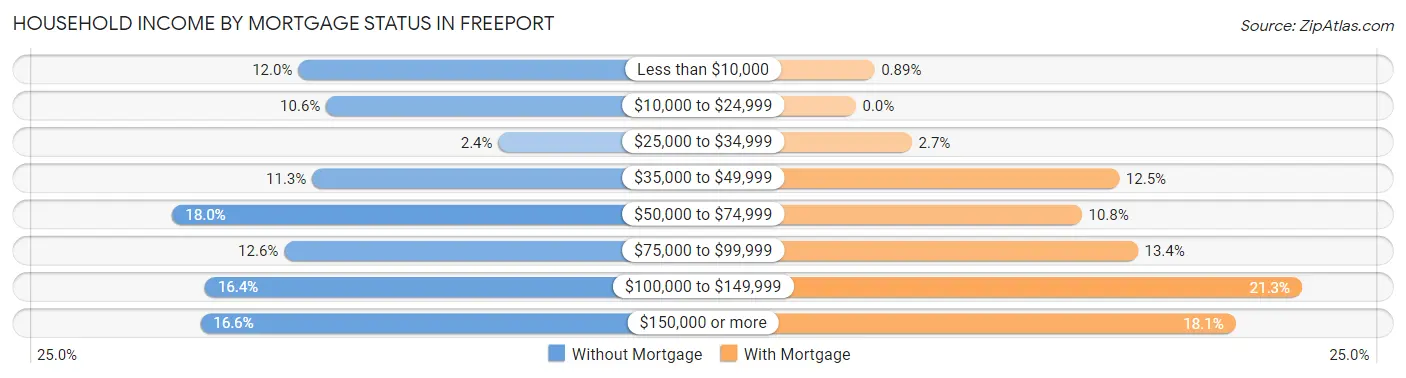
| Household Income | Without Mortgage | With Mortgage |
| Less than $10,000 | 54 (12.0%) | 13 (0.9%) |
| $10,000 to $24,999 | 48 (10.6%) | 0 (0.0%) |
| $25,000 to $34,999 | 11 (2.4%) | 39 (2.7%) |
| $35,000 to $49,999 | 51 (11.3%) | 183 (12.5%) |
| $50,000 to $74,999 | 81 (18.0%) | 157 (10.8%) |
| $75,000 to $99,999 | 57 (12.6%) | 196 (13.4%) |
| $100,000 to $149,999 | 74 (16.4%) | 310 (21.2%) |
| $150,000 or more | 75 (16.6%) | 264 (18.1%) |
| Total | 451 (100.0%) | 1,459 (100.0%) |
Property Value to Household Income Ratio in Freeport
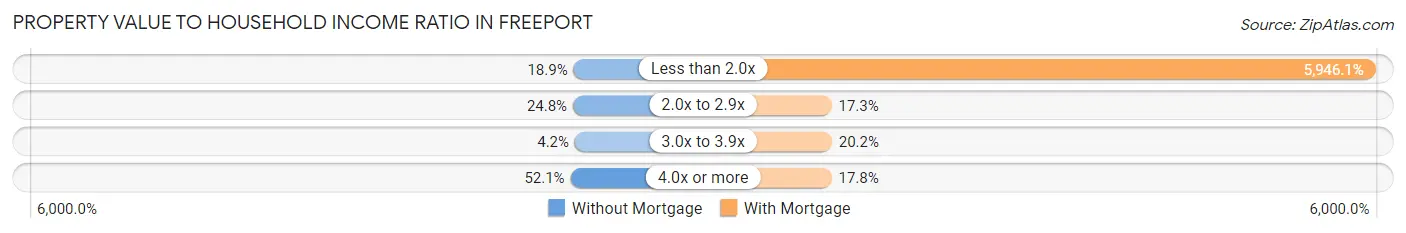
| Value-to-Income Ratio | Without Mortgage | With Mortgage |
| Less than 2.0x | 85 (18.9%) | 86,753 (5,946.1%) |
| 2.0x to 2.9x | 112 (24.8%) | 253 (17.3%) |
| 3.0x to 3.9x | 19 (4.2%) | 294 (20.2%) |
| 4.0x or more | 235 (52.1%) | 259 (17.7%) |
| Total | 451 (100.0%) | 1,459 (100.0%) |
Real Estate Taxes by Mortgage Status in Freeport
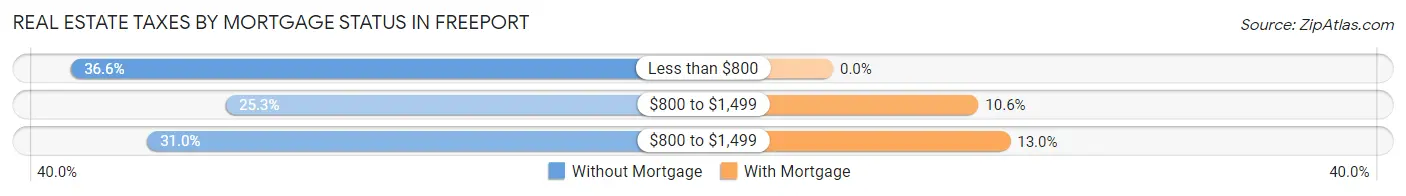
| Property Taxes | Without Mortgage | With Mortgage |
| Less than $800 | 165 (36.6%) | 0 (0.0%) |
| $800 to $1,499 | 114 (25.3%) | 155 (10.6%) |
| $800 to $1,499 | 140 (31.0%) | 189 (13.0%) |
| Total | 451 (100.0%) | 1,459 (100.0%) |
Health & Disability in Freeport
Health Insurance Coverage by Age in Freeport
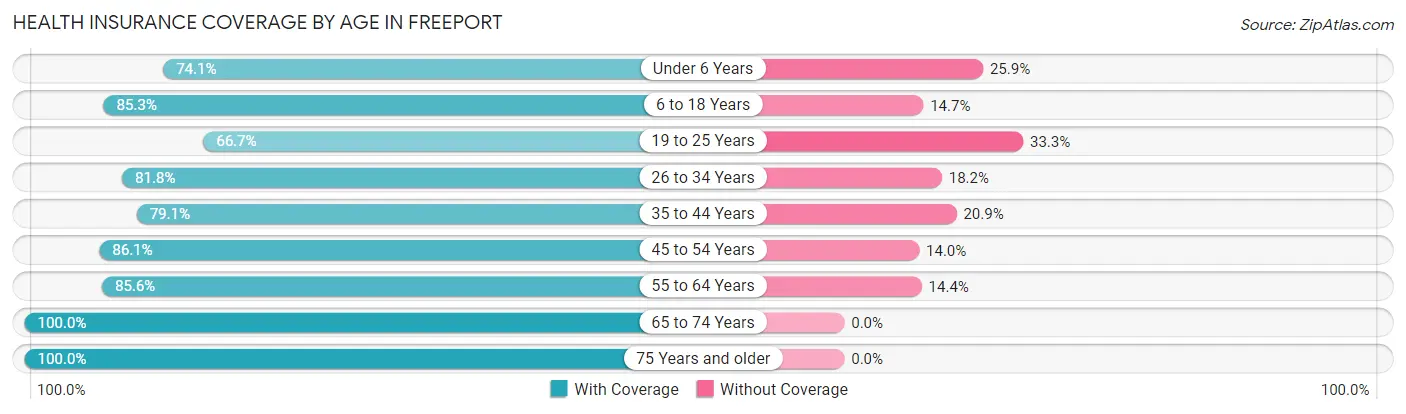
| Age Bracket | With Coverage | Without Coverage |
| Under 6 Years | 344 (74.1%) | 120 (25.9%) |
| 6 to 18 Years | 730 (85.3%) | 126 (14.7%) |
| 19 to 25 Years | 184 (66.7%) | 92 (33.3%) |
| 26 to 34 Years | 495 (81.8%) | 110 (18.2%) |
| 35 to 44 Years | 771 (79.1%) | 204 (20.9%) |
| 45 to 54 Years | 703 (86.1%) | 114 (14.0%) |
| 55 to 64 Years | 670 (85.6%) | 113 (14.4%) |
| 65 to 74 Years | 653 (100.0%) | 0 (0.0%) |
| 75 Years and older | 325 (100.0%) | 0 (0.0%) |
| Total | 4,875 (84.7%) | 879 (15.3%) |
Health Insurance Coverage by Citizenship Status in Freeport
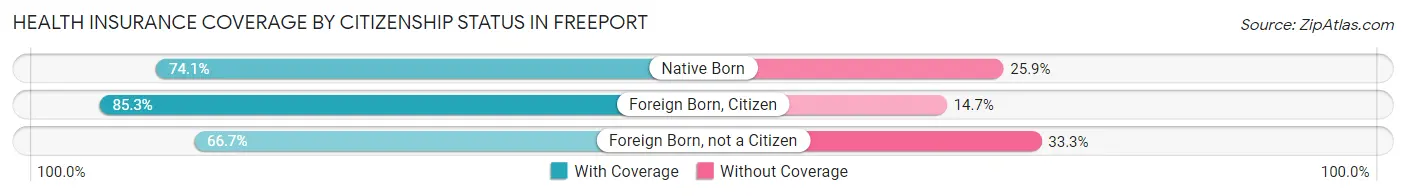
| Citizenship Status | With Coverage | Without Coverage |
| Native Born | 344 (74.1%) | 120 (25.9%) |
| Foreign Born, Citizen | 730 (85.3%) | 126 (14.7%) |
| Foreign Born, not a Citizen | 184 (66.7%) | 92 (33.3%) |
Health Insurance Coverage by Household Income in Freeport
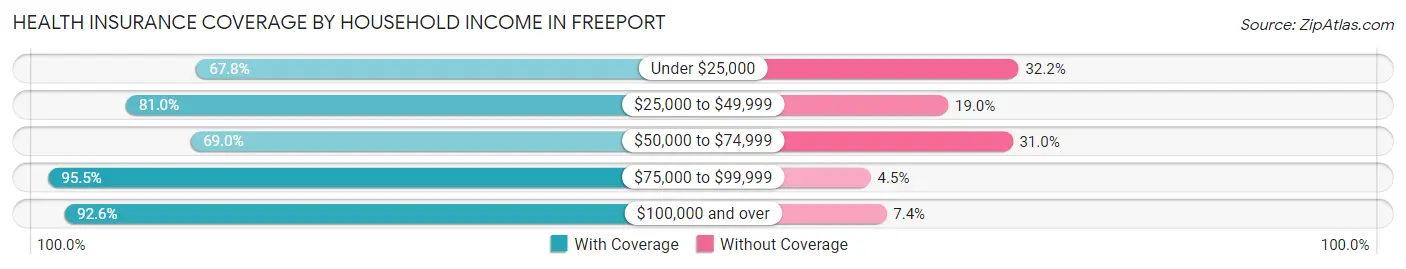
| Household Income | With Coverage | Without Coverage |
| Under $25,000 | 310 (67.8%) | 147 (32.2%) |
| $25,000 to $49,999 | 781 (81.0%) | 183 (19.0%) |
| $50,000 to $74,999 | 742 (69.0%) | 334 (31.0%) |
| $75,000 to $99,999 | 855 (95.5%) | 40 (4.5%) |
| $100,000 and over | 2,187 (92.6%) | 175 (7.4%) |
Public vs Private Health Insurance Coverage by Age in Freeport
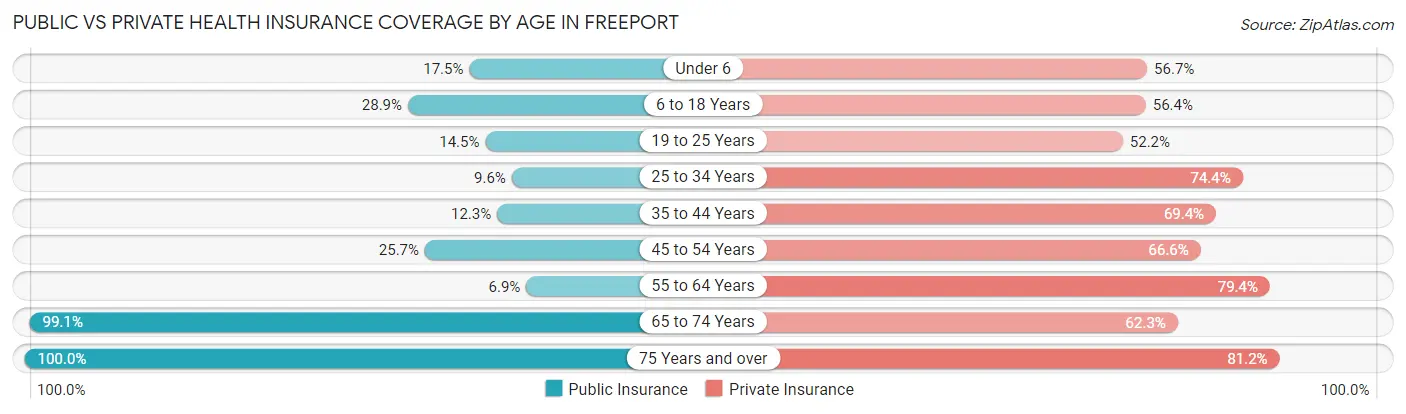
| Age Bracket | Public Insurance | Private Insurance |
| Under 6 | 81 (17.5%) | 263 (56.7%) |
| 6 to 18 Years | 247 (28.9%) | 483 (56.4%) |
| 19 to 25 Years | 40 (14.5%) | 144 (52.2%) |
| 25 to 34 Years | 58 (9.6%) | 450 (74.4%) |
| 35 to 44 Years | 120 (12.3%) | 677 (69.4%) |
| 45 to 54 Years | 210 (25.7%) | 544 (66.6%) |
| 55 to 64 Years | 54 (6.9%) | 622 (79.4%) |
| 65 to 74 Years | 647 (99.1%) | 407 (62.3%) |
| 75 Years and over | 325 (100.0%) | 264 (81.2%) |
| Total | 1,782 (31.0%) | 3,854 (67.0%) |
Disability Status by Sex by Age in Freeport
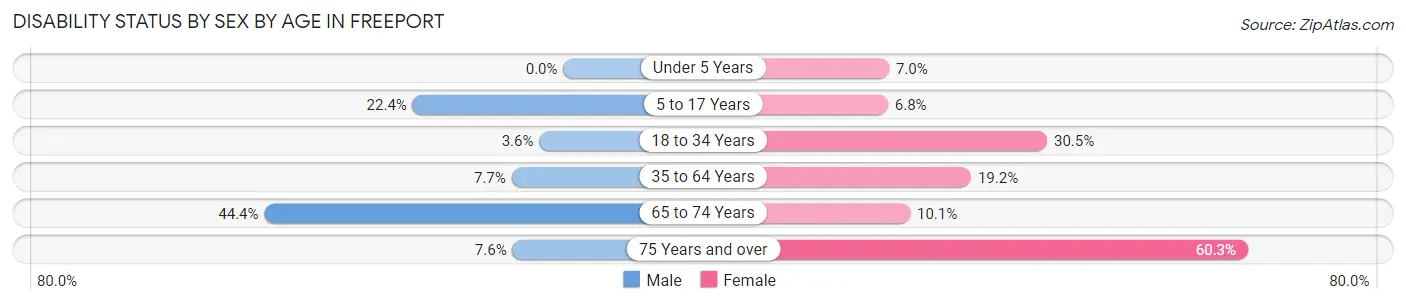
| Age Bracket | Male | Female |
| Under 5 Years | 0 (0.0%) | 11 (7.0%) |
| 5 to 17 Years | 94 (22.4%) | 32 (6.8%) |
| 18 to 34 Years | 16 (3.6%) | 146 (30.5%) |
| 35 to 64 Years | 110 (7.7%) | 219 (19.2%) |
| 65 to 74 Years | 119 (44.4%) | 39 (10.1%) |
| 75 Years and over | 4 (7.5%) | 164 (60.3%) |
Disability Class by Sex by Age in Freeport
Disability Class: Hearing Difficulty
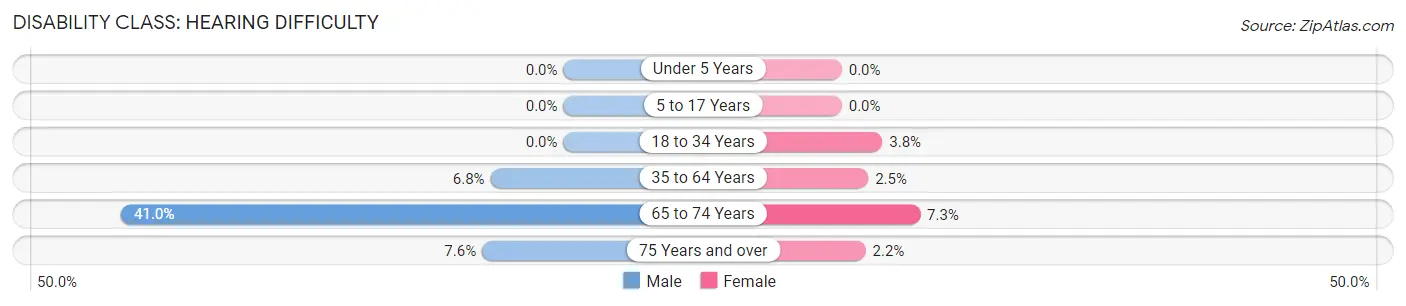
| Age Bracket | Male | Female |
| Under 5 Years | 0 (0.0%) | 0 (0.0%) |
| 5 to 17 Years | 0 (0.0%) | 0 (0.0%) |
| 18 to 34 Years | 0 (0.0%) | 18 (3.8%) |
| 35 to 64 Years | 97 (6.8%) | 28 (2.5%) |
| 65 to 74 Years | 110 (41.0%) | 28 (7.3%) |
| 75 Years and over | 4 (7.5%) | 6 (2.2%) |
Disability Class: Vision Difficulty
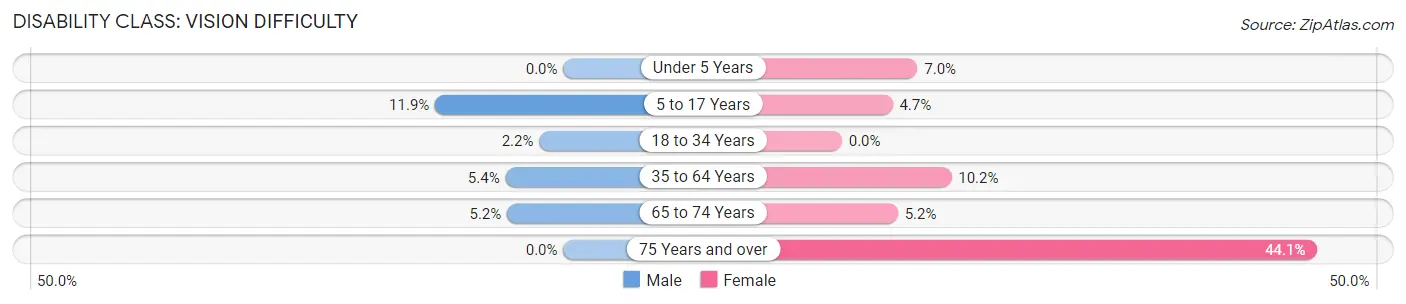
| Age Bracket | Male | Female |
| Under 5 Years | 0 (0.0%) | 11 (7.0%) |
| 5 to 17 Years | 50 (11.9%) | 22 (4.7%) |
| 18 to 34 Years | 10 (2.2%) | 0 (0.0%) |
| 35 to 64 Years | 77 (5.4%) | 116 (10.2%) |
| 65 to 74 Years | 14 (5.2%) | 20 (5.2%) |
| 75 Years and over | 0 (0.0%) | 120 (44.1%) |
Disability Class: Cognitive Difficulty
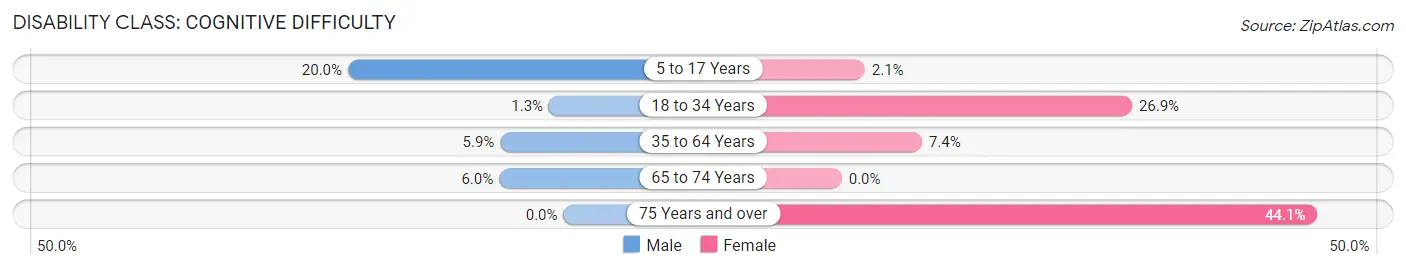
| Age Bracket | Male | Female |
| 5 to 17 Years | 84 (20.0%) | 10 (2.1%) |
| 18 to 34 Years | 6 (1.3%) | 129 (26.9%) |
| 35 to 64 Years | 84 (5.9%) | 85 (7.4%) |
| 65 to 74 Years | 16 (6.0%) | 0 (0.0%) |
| 75 Years and over | 0 (0.0%) | 120 (44.1%) |
Disability Class: Ambulatory Difficulty
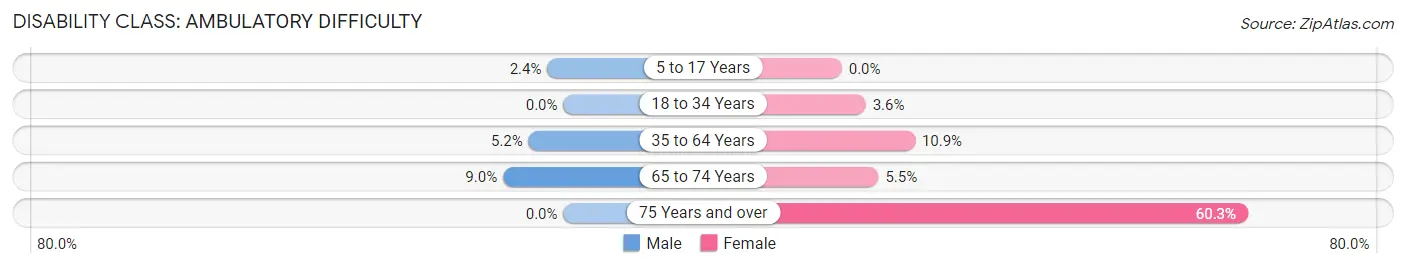
| Age Bracket | Male | Female |
| 5 to 17 Years | 10 (2.4%) | 0 (0.0%) |
| 18 to 34 Years | 0 (0.0%) | 17 (3.5%) |
| 35 to 64 Years | 74 (5.2%) | 124 (10.9%) |
| 65 to 74 Years | 24 (9.0%) | 21 (5.4%) |
| 75 Years and over | 0 (0.0%) | 164 (60.3%) |
Disability Class: Self-Care Difficulty
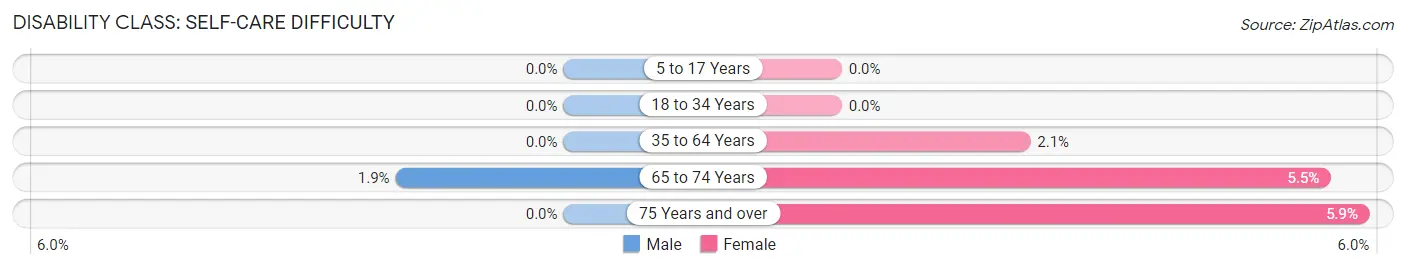
| Age Bracket | Male | Female |
| 5 to 17 Years | 0 (0.0%) | 0 (0.0%) |
| 18 to 34 Years | 0 (0.0%) | 0 (0.0%) |
| 35 to 64 Years | 0 (0.0%) | 24 (2.1%) |
| 65 to 74 Years | 5 (1.9%) | 21 (5.4%) |
| 75 Years and over | 0 (0.0%) | 16 (5.9%) |
Technology Access in Freeport
Computing Device Access in Freeport
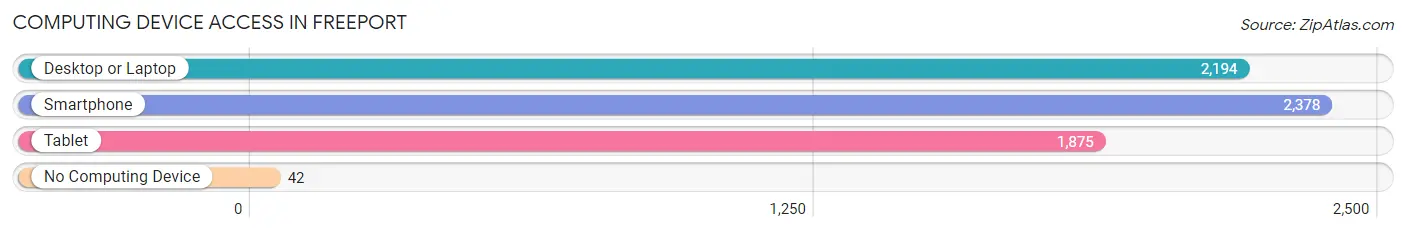
| Device Type | # Households | % Households |
| Desktop or Laptop | 2,194 | 88.5% |
| Smartphone | 2,378 | 96.0% |
| Tablet | 1,875 | 75.7% |
| No Computing Device | 42 | 1.7% |
| Total | 2,478 | 100.0% |
Internet Access in Freeport
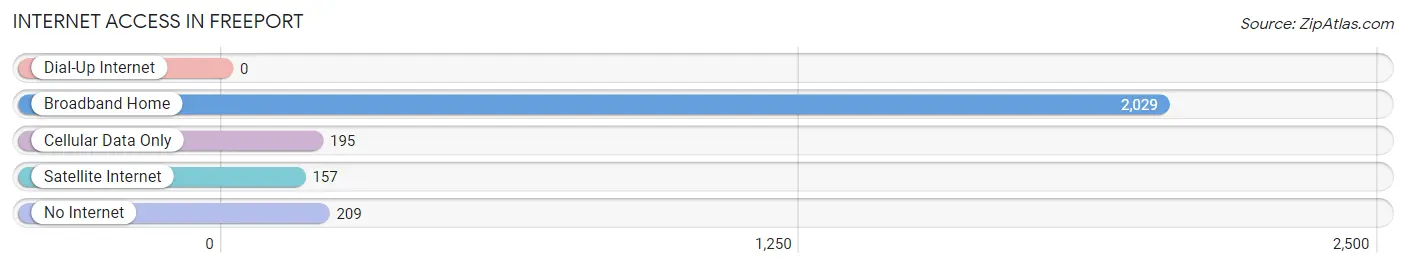
| Internet Type | # Households | % Households |
| Dial-Up Internet | 0 | 0.0% |
| Broadband Home | 2,029 | 81.9% |
| Cellular Data Only | 195 | 7.9% |
| Satellite Internet | 157 | 6.3% |
| No Internet | 209 | 8.4% |
| Total | 2,478 | 100.0% |
Freeport Summary
Freeport, Florida is a small town located in Walton County, in the Florida Panhandle. It is situated on the Choctawhatchee Bay, and is part of the Fort Walton Beach-Crestview-Destin Metropolitan Statistical Area. The town has a population of approximately 2,000 people, and is known for its beautiful beaches, fishing, and outdoor activities.
History
Freeport was first settled in the early 1800s by settlers from the Choctaw Nation. The town was originally known as “Choctawhatchee”, and was a trading post for the Choctaw people. In 1885, the town was renamed Freeport, after the nearby port of Freeport, Texas. The town was incorporated in 1925, and has remained a small, rural community ever since.
Geography
Freeport is located in the Florida Panhandle, in Walton County. It is situated on the Choctawhatchee Bay, and is bordered by the cities of Destin and Fort Walton Beach. The town is located approximately 25 miles east of Pensacola, and is part of the Fort Walton Beach-Crestview-Destin Metropolitan Statistical Area. The town has a total area of 4.2 square miles, and is home to several parks and nature preserves.
Economy
Freeport’s economy is largely based on tourism and fishing. The town is home to several marinas, and is a popular destination for fishing and boating. The town is also home to several restaurants, shops, and other businesses. In addition, Freeport is home to several manufacturing companies, including a paper mill and a plastics factory.
Demographics
As of the 2010 census, Freeport had a population of 2,000 people. The racial makeup of the town was 94.2% White, 2.2% African American, 0.7% Native American, 0.7% Asian, 0.3% from other races, and 1.9% from two or more races. Hispanic or Latino of any race were 2.2% of the population. The median household income was $37,500, and the median family income was $45,000.
Freeport is a small, rural town with a rich history and a vibrant economy. The town is known for its beautiful beaches, fishing, and outdoor activities, and is a popular destination for tourists and locals alike. With its diverse population and strong economy, Freeport is a great place to live and visit.
Common Questions
What is Per Capita Income in Freeport?
Per Capita income in Freeport is $41,752.
What is the Median Family Income in Freeport?
Median Family Income in Freeport is $90,128.
What is the Median Household income in Freeport?
Median Household Income in Freeport is $81,594.
What is Income or Wage Gap in Freeport?
Income or Wage Gap in Freeport is 37.6%.
Women in Freeport earn 62.4 cents for every dollar earned by a man.
What is Inequality or Gini Index in Freeport?
Inequality or Gini Index in Freeport is 0.40.
What is the Total Population of Freeport?
Total Population of Freeport is 5,858.
What is the Total Male Population of Freeport?
Total Male Population of Freeport is 2,911.
What is the Total Female Population of Freeport?
Total Female Population of Freeport is 2,947.
What is the Ratio of Males per 100 Females in Freeport?
There are 98.78 Males per 100 Females in Freeport.
What is the Ratio of Females per 100 Males in Freeport?
There are 101.24 Females per 100 Males in Freeport.
What is the Median Population Age in Freeport?
Median Population Age in Freeport is 41.6 Years.
What is the Average Family Size in Freeport
Average Family Size in Freeport is 2.8 People.
What is the Average Household Size in Freeport
Average Household Size in Freeport is 2.4 People.
How Large is the Labor Force in Freeport?
There are 2,911 People in the Labor Forcein in Freeport.
What is the Percentage of People in the Labor Force in Freeport?
62.1% of People are in the Labor Force in Freeport.
What is the Unemployment Rate in Freeport?
Unemployment Rate in Freeport is 4.2%.