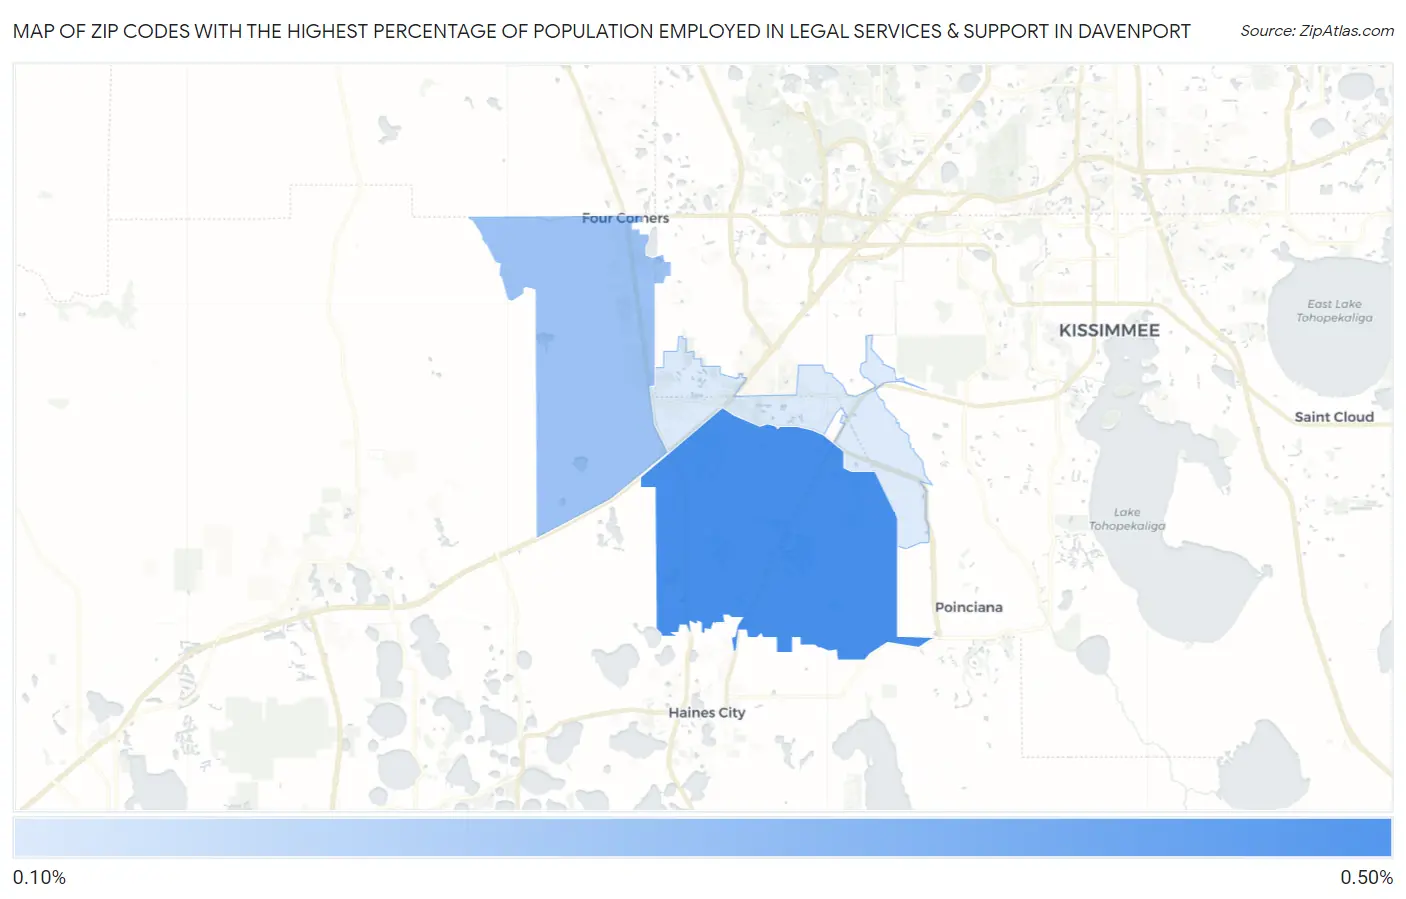
Zip Codes with the Highest Percentage of Population Employed in Legal Services & Support in Davenport, FL
RELATED REPORTS & OPTIONS
Legal Services & Support
Davenport
Compare Zip Codes
Map of Zip Codes with the Highest Percentage of Population Employed in Legal Services & Support in Davenport
0.10%
0.47%
Zip Codes with the Highest Percentage of Population Employed in Legal Services & Support in Davenport, FL
| Zip Code | % Employed | vs State | vs National | |
| 1. | 33837 | 0.47% | 1.3%(-0.851)#652 | 1.2%(-0.718)#13,053 |
| 2. | 33897 | 0.27% | 1.3%(-1.05)#732 | 1.2%(-0.917)#15,423 |
| 3. | 33896 | 0.10% | 1.3%(-1.21)#785 | 1.2%(-1.08)#17,094 |
1
Common Questions
What are the Top Zip Codes with the Highest Percentage of Population Employed in Legal Services & Support in Davenport, FL?
Top Zip Codes with the Highest Percentage of Population Employed in Legal Services & Support in Davenport, FL are:
What zip code has the Highest Percentage of Population Employed in Legal Services & Support in Davenport, FL?
33837 has the Highest Percentage of Population Employed in Legal Services & Support in Davenport, FL with 0.47%.
What is the Percentage of Population Employed in Legal Services & Support in Davenport, FL?
Percentage of Population Employed in Legal Services & Support in Davenport is 0.29%.
What is the Percentage of Population Employed in Legal Services & Support in Florida?
Percentage of Population Employed in Legal Services & Support in Florida is 1.3%.
What is the Percentage of Population Employed in Legal Services & Support in the United States?
Percentage of Population Employed in Legal Services & Support in the United States is 1.2%.