Zip Codes with the Highest Percentage of Population Employed in Office & Administration in Davenport, FL
RELATED REPORTS & OPTIONS
Office & Administration
Davenport
Compare Zip Codes
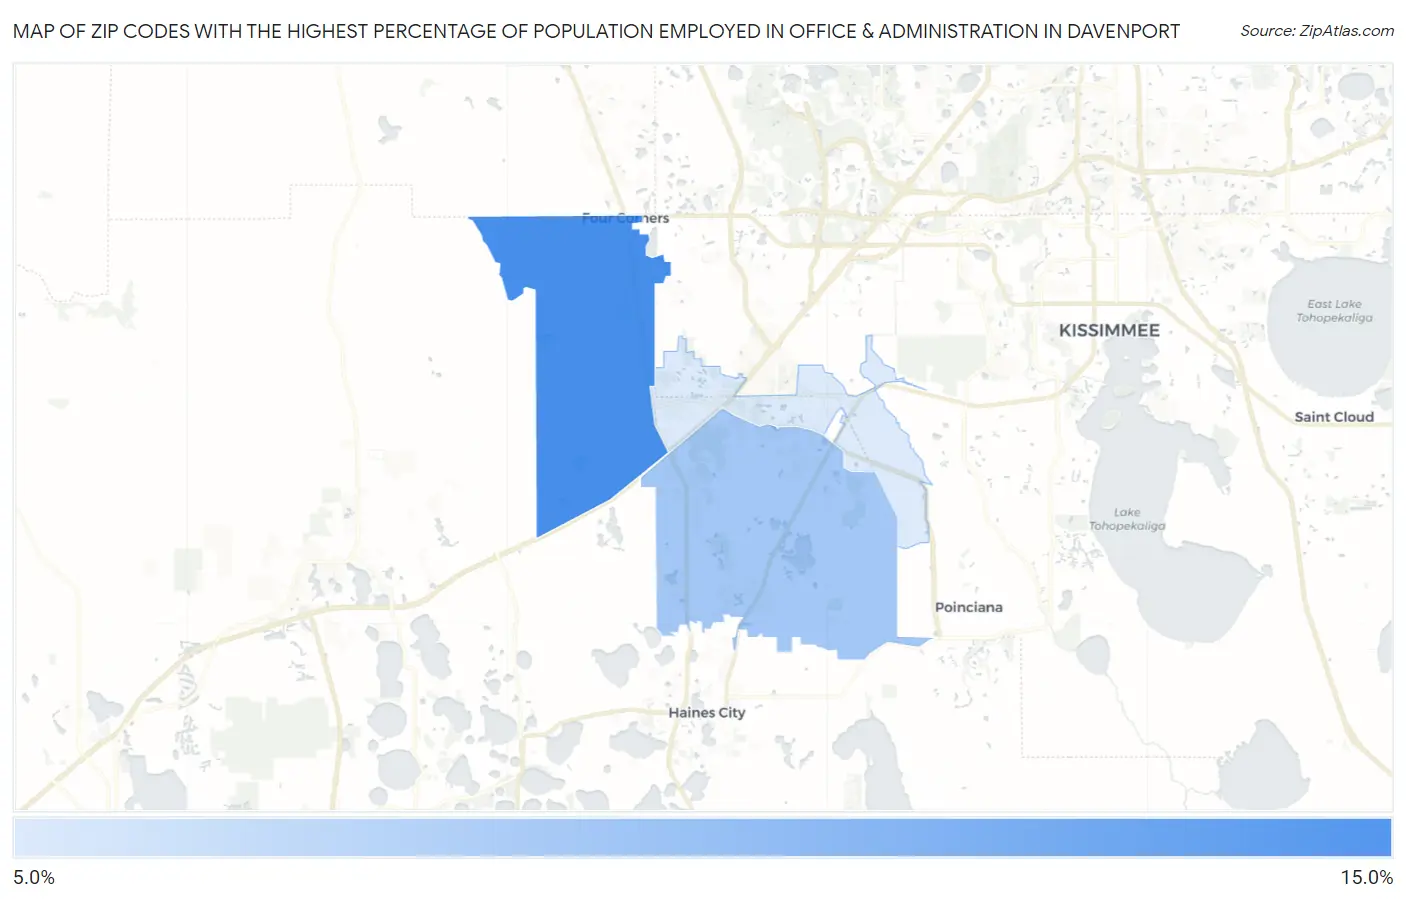
Map of Zip Codes with the Highest Percentage of Population Employed in Office & Administration in Davenport
10.6%
14.0%
Zip Codes with the Highest Percentage of Population Employed in Office & Administration in Davenport, FL
| Zip Code | % Employed | vs State | vs National | |
| 1. | 33897 | 14.0% | 11.9%(+2.06)#209 | 10.9%(+3.12)#6,065 |
| 2. | 33837 | 11.9% | 11.9%(-0.049)#443 | 10.9%(+1.01)#11,139 |
| 3. | 33896 | 10.6% | 11.9%(-1.35)#596 | 10.9%(-0.292)#15,247 |
1
Common Questions
What are the Top Zip Codes with the Highest Percentage of Population Employed in Office & Administration in Davenport, FL?
Top Zip Codes with the Highest Percentage of Population Employed in Office & Administration in Davenport, FL are:
What zip code has the Highest Percentage of Population Employed in Office & Administration in Davenport, FL?
33897 has the Highest Percentage of Population Employed in Office & Administration in Davenport, FL with 14.0%.
What is the Percentage of Population Employed in Office & Administration in Davenport, FL?
Percentage of Population Employed in Office & Administration in Davenport is 16.0%.
What is the Percentage of Population Employed in Office & Administration in Florida?
Percentage of Population Employed in Office & Administration in Florida is 11.9%.
What is the Percentage of Population Employed in Office & Administration in the United States?
Percentage of Population Employed in Office & Administration in the United States is 10.9%.