Wakulla County, FL Map & Demographics
Wakulla County Map
Wakulla County Overview
$31,683
PER CAPITA INCOME
$84,357
AVG FAMILY INCOME
$72,035
AVG HOUSEHOLD INCOME
16.7%
WAGE / INCOME GAP [ % ]
83.3¢/ $1
WAGE / INCOME GAP [ $ ]
$10,874
FAMILY INCOME DEFICIT
0.41
INEQUALITY / GINI INDEX
33,732
TOTAL POPULATION
18,653
MALE POPULATION
15,079
FEMALE POPULATION
123.70
MALES / 100 FEMALES
80.84
FEMALES / 100 MALES
42.3
MEDIAN AGE
3.1
AVG FAMILY SIZE
2.6
AVG HOUSEHOLD SIZE
15,941
LABOR FORCE [ PEOPLE ]
57.5%
PERCENT IN LABOR FORCE
3.6%
UNEMPLOYMENT RATE
Wakulla County Area Codes
Income in Wakulla County
Income Overview in Wakulla County
Per Capita Income in Wakulla County is $31,683, while median incomes of families and households are $84,357 and $72,035 respectively.
| Characteristic | Number | Measure |
| Per Capita Income | 33,732 | $31,683 |
| Median Family Income | 8,154 | $84,357 |
| Mean Family Income | 8,154 | $101,648 |
| Median Household Income | 11,932 | $72,035 |
| Mean Household Income | 11,932 | $87,288 |
| Income Deficit | 8,154 | $10,874 |
| Wage / Income Gap (%) | 33,732 | 16.70% |
| Wage / Income Gap ($) | 33,732 | 83.30¢ per $1 |
| Gini / Inequality Index | 33,732 | 0.41 |
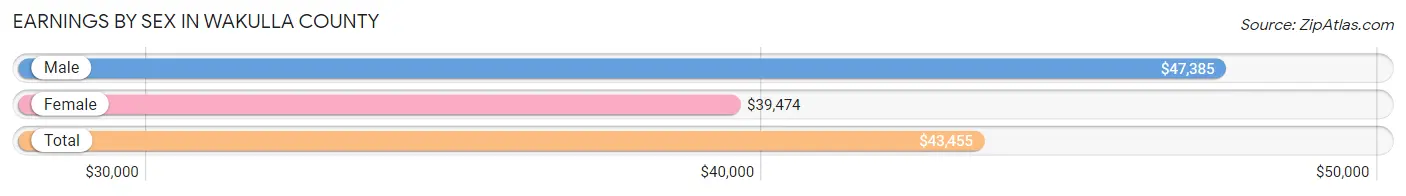
Earnings by Sex in Wakulla County
Average Earnings in Wakulla County are $43,455, $47,385 for men and $39,474 for women, a difference of 16.7%.
| Sex | Number | Average Earnings |
| Male | 8,984 (54.7%) | $47,385 |
| Female | 7,443 (45.3%) | $39,474 |
| Total | 16,427 (100.0%) | $43,455 |
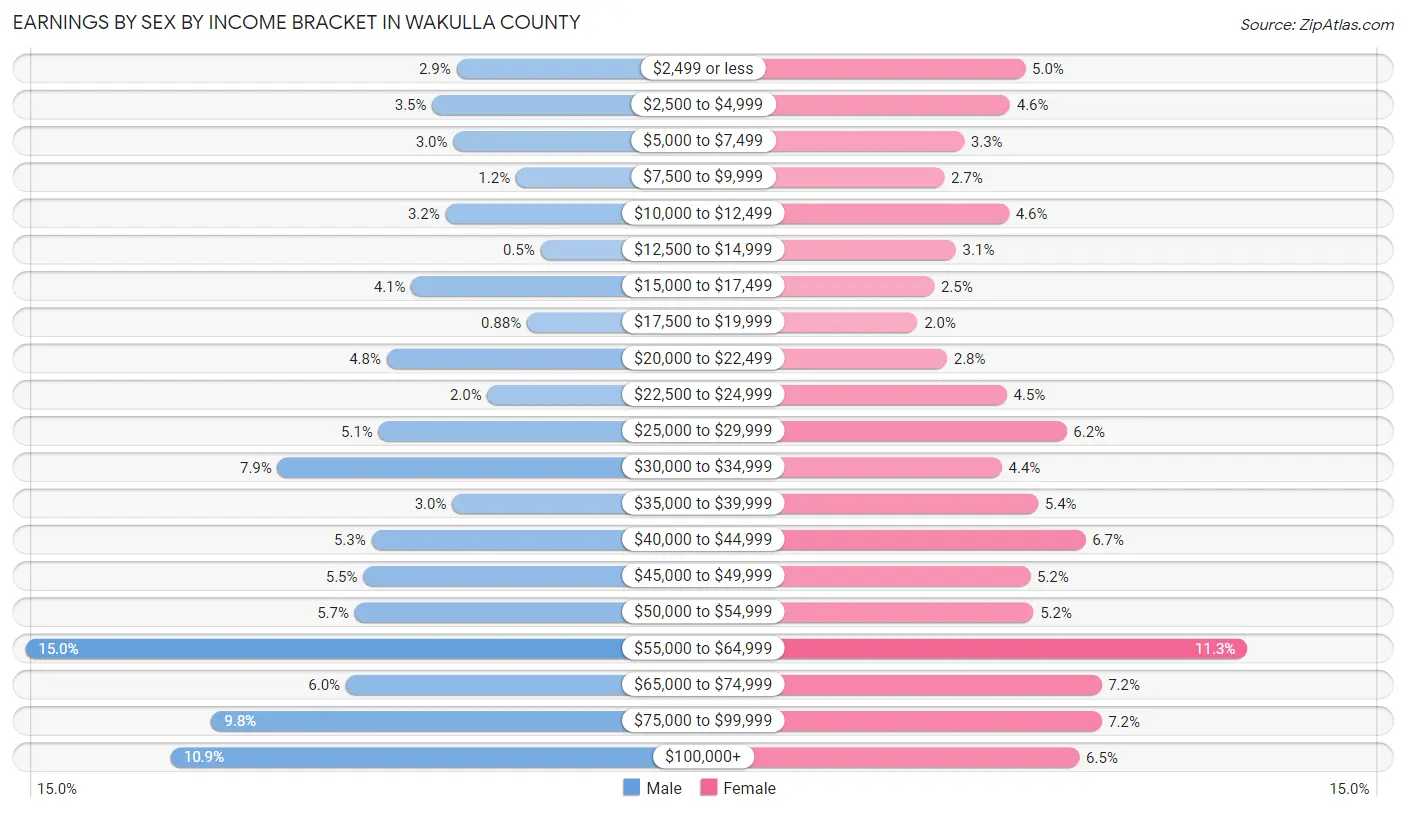
Earnings by Sex by Income Bracket in Wakulla County
The most common earnings brackets in Wakulla County are $55,000 to $64,999 for men (1,346 | 15.0%) and $55,000 to $64,999 for women (837 | 11.3%).
| Income | Male | Female |
| $2,499 or less | 257 (2.9%) | 373 (5.0%) |
| $2,500 to $4,999 | 318 (3.5%) | 341 (4.6%) |
| $5,000 to $7,499 | 265 (2.9%) | 245 (3.3%) |
| $7,500 to $9,999 | 107 (1.2%) | 203 (2.7%) |
| $10,000 to $12,499 | 285 (3.2%) | 339 (4.5%) |
| $12,500 to $14,999 | 45 (0.5%) | 228 (3.1%) |
| $15,000 to $17,499 | 371 (4.1%) | 182 (2.5%) |
| $17,500 to $19,999 | 79 (0.9%) | 147 (2.0%) |
| $20,000 to $22,499 | 433 (4.8%) | 209 (2.8%) |
| $22,500 to $24,999 | 179 (2.0%) | 334 (4.5%) |
| $25,000 to $29,999 | 454 (5.1%) | 459 (6.2%) |
| $30,000 to $34,999 | 709 (7.9%) | 324 (4.3%) |
| $35,000 to $39,999 | 268 (3.0%) | 400 (5.4%) |
| $40,000 to $44,999 | 472 (5.2%) | 499 (6.7%) |
| $45,000 to $49,999 | 492 (5.5%) | 383 (5.1%) |
| $50,000 to $54,999 | 514 (5.7%) | 390 (5.2%) |
| $55,000 to $64,999 | 1,346 (15.0%) | 837 (11.3%) |
| $65,000 to $74,999 | 536 (6.0%) | 532 (7.1%) |
| $75,000 to $99,999 | 876 (9.8%) | 532 (7.1%) |
| $100,000+ | 978 (10.9%) | 486 (6.5%) |
| Total | 8,984 (100.0%) | 7,443 (100.0%) |
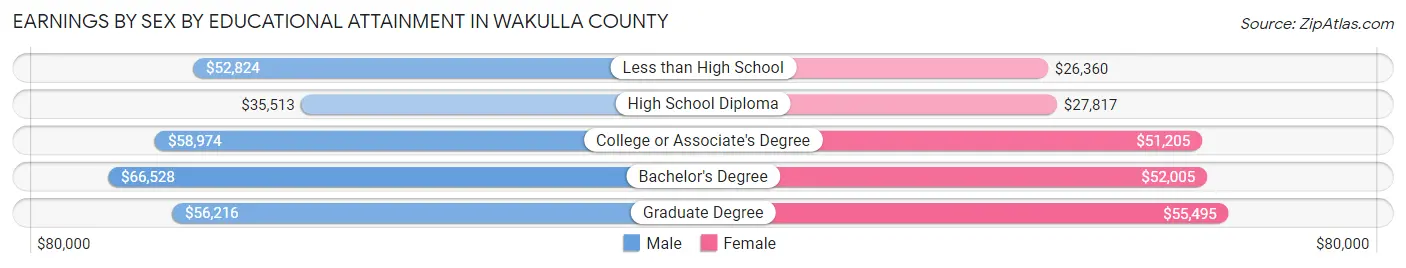
Earnings by Sex by Educational Attainment in Wakulla County
Average earnings in Wakulla County are $53,438 for men and $43,745 for women, a difference of 18.1%. Men with an educational attainment of bachelor's degree enjoy the highest average annual earnings of $66,528, while those with high school diploma education earn the least with $35,513. Women with an educational attainment of graduate degree earn the most with the average annual earnings of $55,495, while those with less than high school education have the smallest earnings of $26,360.
| Educational Attainment | Male Income | Female Income |
| Less than High School | $52,824 | $26,360 |
| High School Diploma | $35,513 | $27,817 |
| College or Associate's Degree | $58,974 | $51,205 |
| Bachelor's Degree | $66,528 | $52,005 |
| Graduate Degree | $56,216 | $55,495 |
| Total | $53,438 | $43,745 |
Family Income in Wakulla County
Family Income Brackets in Wakulla County
According to the Wakulla County family income data, there are 2,014 families falling into the $100,000 to $149,999 income range, which is the most common income bracket and makes up 24.7% of all families. Conversely, the $10,000 to $14,999 income bracket is the least frequent group with only 33 families (0.4%) belonging to this category.
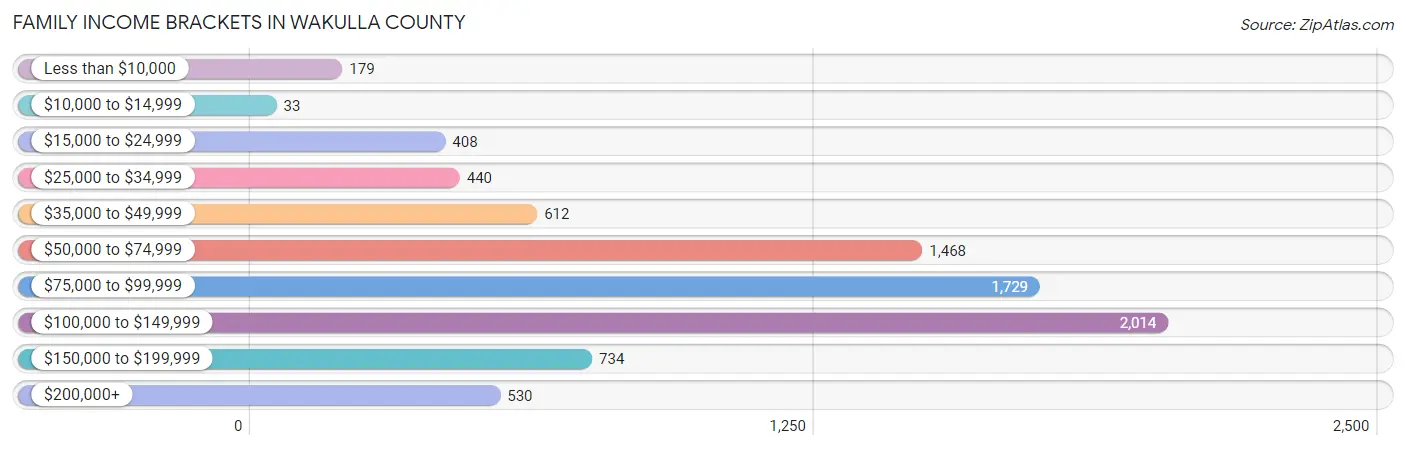
| Income Bracket | # Families | % Families |
| Less than $10,000 | 179 | 2.2% |
| $10,000 to $14,999 | 33 | 0.4% |
| $15,000 to $24,999 | 408 | 5.0% |
| $25,000 to $34,999 | 440 | 5.4% |
| $35,000 to $49,999 | 612 | 7.5% |
| $50,000 to $74,999 | 1,468 | 18.0% |
| $75,000 to $99,999 | 1,729 | 21.2% |
| $100,000 to $149,999 | 2,014 | 24.7% |
| $150,000 to $199,999 | 734 | 9.0% |
| $200,000+ | 530 | 6.5% |
Family Income by Famaliy Size in Wakulla County
7+ person families (96 | 1.2%) account for the highest median family income in Wakulla County with $125,000 per family, while 2-person families (3,799 | 46.6%) have the highest median income of $41,940 per family member.
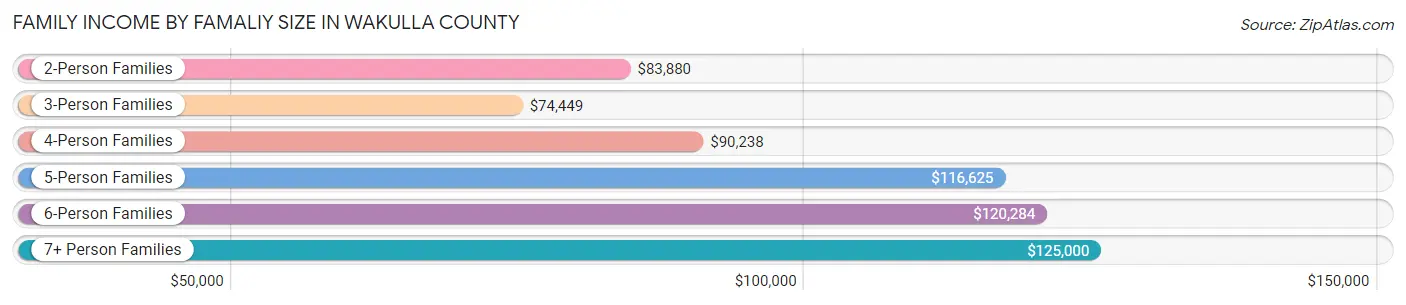
| Income Bracket | # Families | Median Income |
| 2-Person Families | 3,799 (46.6%) | $83,880 |
| 3-Person Families | 2,022 (24.8%) | $74,449 |
| 4-Person Families | 1,806 (22.2%) | $90,238 |
| 5-Person Families | 256 (3.1%) | $116,625 |
| 6-Person Families | 175 (2.1%) | $120,284 |
| 7+ Person Families | 96 (1.2%) | $125,000 |
| Total | 8,154 (100.0%) | $84,357 |
Family Income by Number of Earners in Wakulla County
The median family income in Wakulla County is $84,357, with families comprising 3+ earners (794) having the highest median family income of $117,500, while families with 1 earner (2,436) have the lowest median family income of $59,383, accounting for 9.7% and 29.9% of families, respectively.
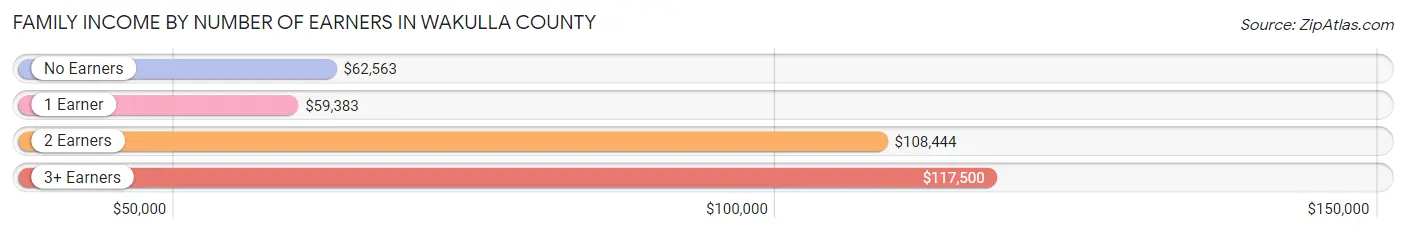
| Number of Earners | # Families | Median Income |
| No Earners | 1,217 (14.9%) | $62,563 |
| 1 Earner | 2,436 (29.9%) | $59,383 |
| 2 Earners | 3,707 (45.5%) | $108,444 |
| 3+ Earners | 794 (9.7%) | $117,500 |
| Total | 8,154 (100.0%) | $84,357 |
Household Income in Wakulla County
Household Income Brackets in Wakulla County
With 2,339 households falling in the category, the $100,000 to $149,999 income range is the most frequent in Wakulla County, accounting for 19.6% of all households. In contrast, only 227 households (1.9%) fall into the $10,000 to $14,999 income bracket, making it the least populous group.
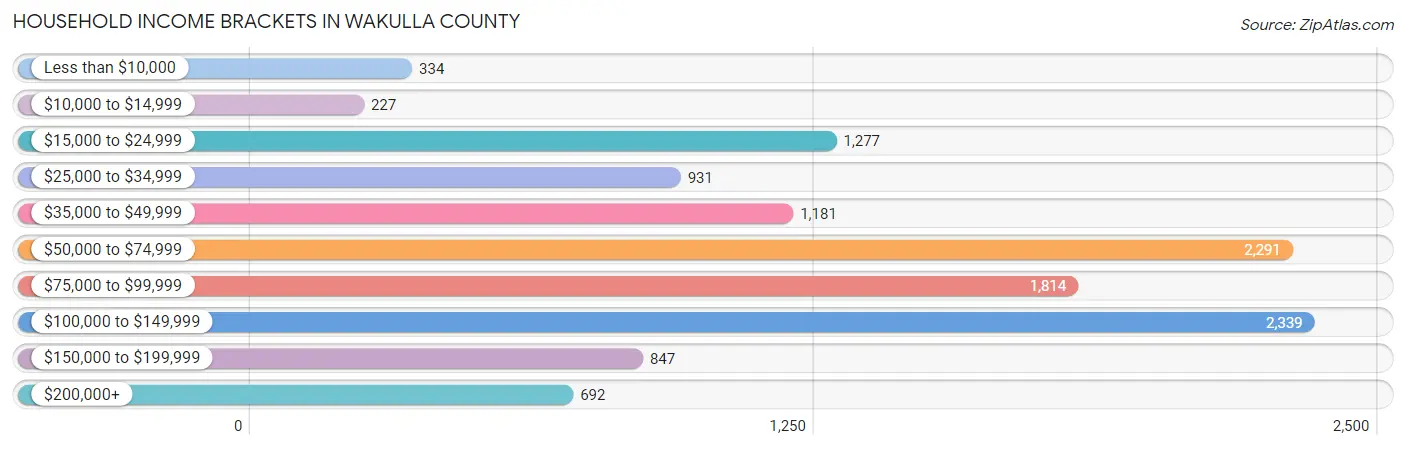
| Income Bracket | # Households | % Households |
| Less than $10,000 | 334 | 2.8% |
| $10,000 to $14,999 | 227 | 1.9% |
| $15,000 to $24,999 | 1,277 | 10.7% |
| $25,000 to $34,999 | 931 | 7.8% |
| $35,000 to $49,999 | 1,181 | 9.9% |
| $50,000 to $74,999 | 2,291 | 19.2% |
| $75,000 to $99,999 | 1,814 | 15.2% |
| $100,000 to $149,999 | 2,339 | 19.6% |
| $150,000 to $199,999 | 847 | 7.1% |
| $200,000+ | 692 | 5.8% |
Household Income by Householder Age in Wakulla County
The median household income in Wakulla County is $72,035, with the highest median household income of $90,208 found in the 45 to 64 years age bracket for the primary householder. A total of 4,546 households (38.1%) fall into this category. Meanwhile, the 15 to 24 years age bracket for the primary householder has the lowest median household income of $0, with 464 households (3.9%) in this group.
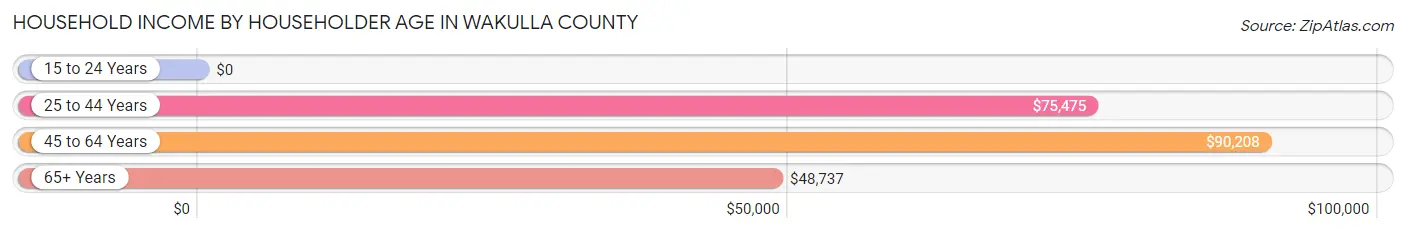
| Income Bracket | # Households | Median Income |
| 15 to 24 Years | 464 (3.9%) | $0 |
| 25 to 44 Years | 3,500 (29.3%) | $75,475 |
| 45 to 64 Years | 4,546 (38.1%) | $90,208 |
| 65+ Years | 3,422 (28.7%) | $48,737 |
| Total | 11,932 (100.0%) | $72,035 |
Poverty in Wakulla County
Income Below Poverty by Sex and Age in Wakulla County
With 6.4% poverty level for males and 5.9% for females among the residents of Wakulla County, under 5 year old males and under 5 year old females are the most vulnerable to poverty, with 155 males (16.8%) and 104 females (15.3%) in their respective age groups living below the poverty level.
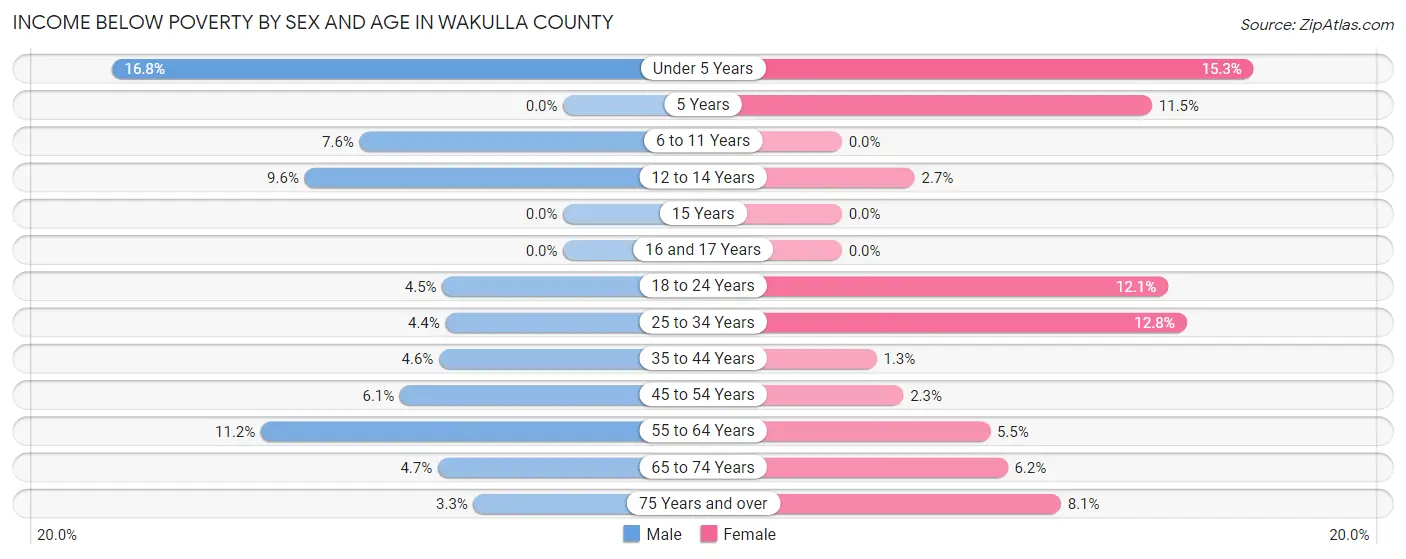
| Age Bracket | Male | Female |
| Under 5 Years | 155 (16.8%) | 104 (15.3%) |
| 5 Years | 0 (0.0%) | 35 (11.5%) |
| 6 to 11 Years | 79 (7.6%) | 0 (0.0%) |
| 12 to 14 Years | 70 (9.6%) | 20 (2.7%) |
| 15 Years | 0 (0.0%) | 0 (0.0%) |
| 16 and 17 Years | 0 (0.0%) | 0 (0.0%) |
| 18 to 24 Years | 62 (4.5%) | 125 (12.1%) |
| 25 to 34 Years | 71 (4.4%) | 210 (12.8%) |
| 35 to 44 Years | 109 (4.6%) | 27 (1.3%) |
| 45 to 54 Years | 143 (6.1%) | 46 (2.3%) |
| 55 to 64 Years | 215 (11.2%) | 127 (5.5%) |
| 65 to 74 Years | 75 (4.6%) | 105 (6.1%) |
| 75 Years and over | 27 (3.3%) | 83 (8.1%) |
| Total | 1,006 (6.4%) | 882 (5.9%) |
Income Above Poverty by Sex and Age in Wakulla County
According to the poverty statistics in Wakulla County, males aged 5 years and females aged 6 to 11 years are the age groups that are most secure financially, with 100.0% of males and 100.0% of females in these age groups living above the poverty line.
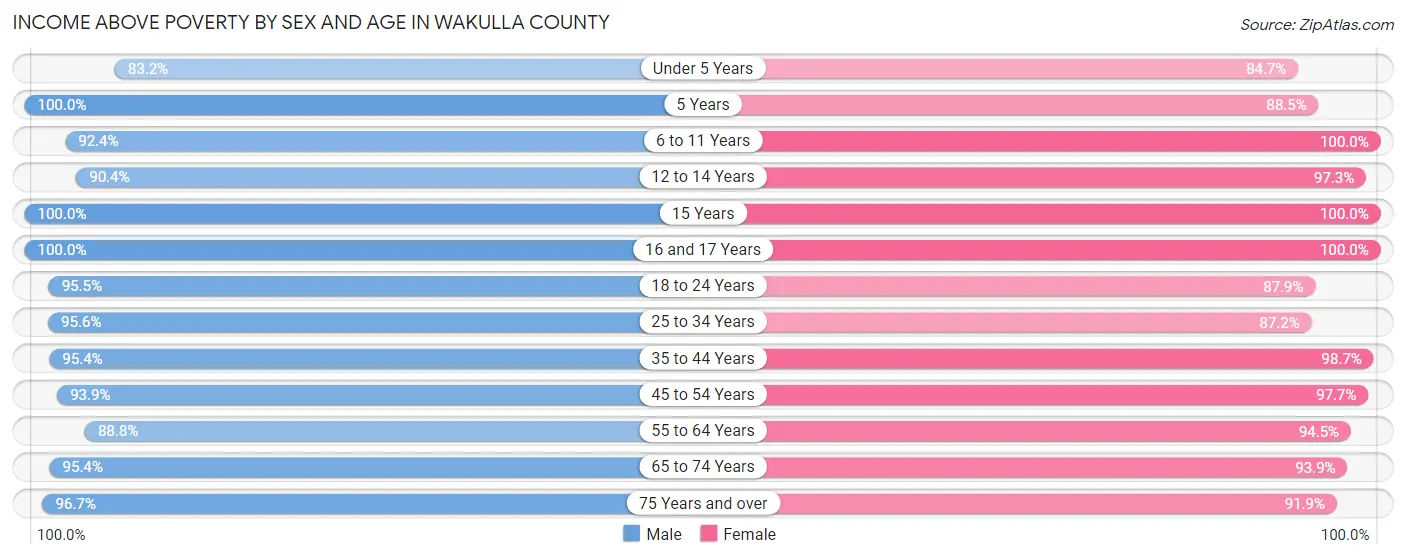
| Age Bracket | Male | Female |
| Under 5 Years | 769 (83.2%) | 576 (84.7%) |
| 5 Years | 187 (100.0%) | 269 (88.5%) |
| 6 to 11 Years | 966 (92.4%) | 896 (100.0%) |
| 12 to 14 Years | 659 (90.4%) | 720 (97.3%) |
| 15 Years | 140 (100.0%) | 224 (100.0%) |
| 16 and 17 Years | 579 (100.0%) | 362 (100.0%) |
| 18 to 24 Years | 1,318 (95.5%) | 907 (87.9%) |
| 25 to 34 Years | 1,554 (95.6%) | 1,431 (87.2%) |
| 35 to 44 Years | 2,255 (95.4%) | 2,071 (98.7%) |
| 45 to 54 Years | 2,215 (93.9%) | 1,974 (97.7%) |
| 55 to 64 Years | 1,701 (88.8%) | 2,183 (94.5%) |
| 65 to 74 Years | 1,539 (95.4%) | 1,601 (93.9%) |
| 75 Years and over | 785 (96.7%) | 938 (91.9%) |
| Total | 14,667 (93.6%) | 14,152 (94.1%) |
Income Below Poverty Among Married-Couple Families in Wakulla County
The poverty statistics for married-couple families in Wakulla County show that 2.1% or 137 of the total 6,368 families live below the poverty line. Families with 1 or 2 children have the highest poverty rate of 4.2%, comprising of 102 families. On the other hand, families with 3 or 4 children have the lowest poverty rate of 0.0%, which includes 0 families.
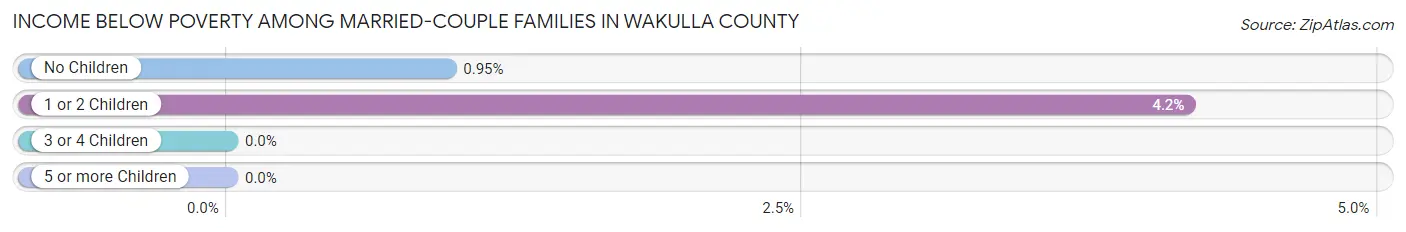
| Children | Above Poverty | Below Poverty |
| No Children | 3,643 (99.1%) | 35 (0.9%) |
| 1 or 2 Children | 2,346 (95.8%) | 102 (4.2%) |
| 3 or 4 Children | 242 (100.0%) | 0 (0.0%) |
| 5 or more Children | 0 (0.0%) | 0 (0.0%) |
| Total | 6,231 (97.9%) | 137 (2.1%) |
Income Below Poverty Among Single-Parent Households in Wakulla County
According to the poverty data in Wakulla County, 16.2% or 77 single-father households and 16.8% or 220 single-mother households are living below the poverty line. Among single-father households, those with 1 or 2 children have the highest poverty rate, with 62 households (33.3%) experiencing poverty. Likewise, among single-mother households, those with 1 or 2 children have the highest poverty rate, with 218 households (26.7%) falling below the poverty line.
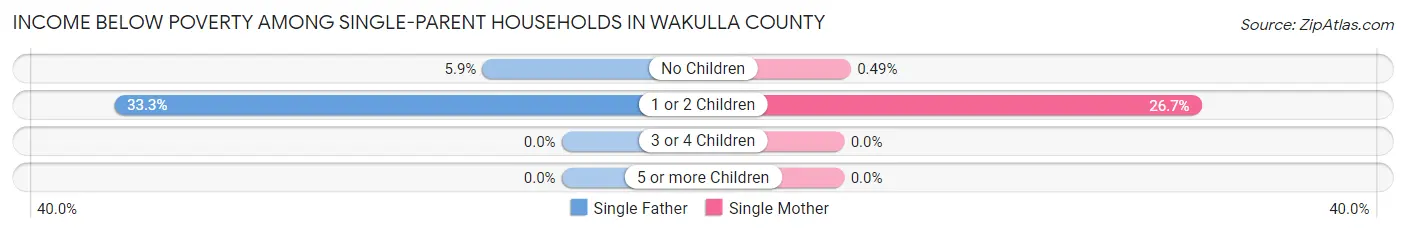
| Children | Single Father | Single Mother |
| No Children | 15 (5.9%) | 2 (0.5%) |
| 1 or 2 Children | 62 (33.3%) | 218 (26.7%) |
| 3 or 4 Children | 0 (0.0%) | 0 (0.0%) |
| 5 or more Children | 0 (0.0%) | 0 (0.0%) |
| Total | 77 (16.2%) | 220 (16.8%) |
Income Below Poverty Among Married-Couple vs Single-Parent Households in Wakulla County
The poverty data for Wakulla County shows that 137 of the married-couple family households (2.1%) and 297 of the single-parent households (16.6%) are living below the poverty level. Within the married-couple family households, those with 1 or 2 children have the highest poverty rate, with 102 households (4.2%) falling below the poverty line. Among the single-parent households, those with 1 or 2 children have the highest poverty rate, with 280 household (27.9%) living below poverty.
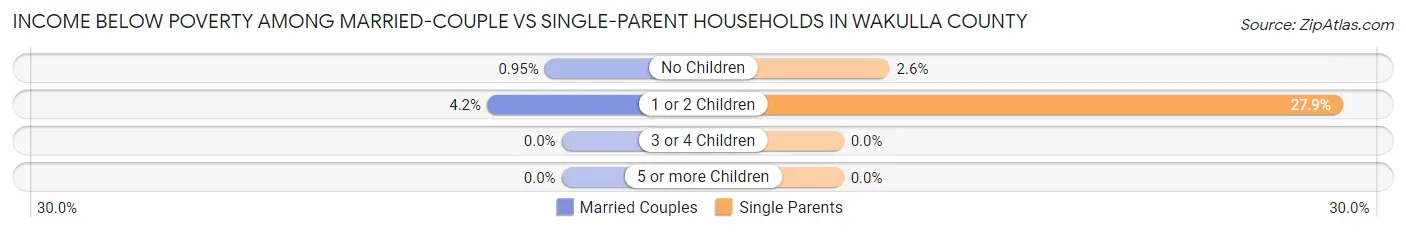
| Children | Married-Couple Families | Single-Parent Households |
| No Children | 35 (0.9%) | 17 (2.6%) |
| 1 or 2 Children | 102 (4.2%) | 280 (27.9%) |
| 3 or 4 Children | 0 (0.0%) | 0 (0.0%) |
| 5 or more Children | 0 (0.0%) | 0 (0.0%) |
| Total | 137 (2.1%) | 297 (16.6%) |
Race in Wakulla County
The most populous races in Wakulla County are White / Caucasian (26,690 | 79.1%), Black / African American (4,908 | 14.5%), and Two or more Races (1,468 | 4.3%).
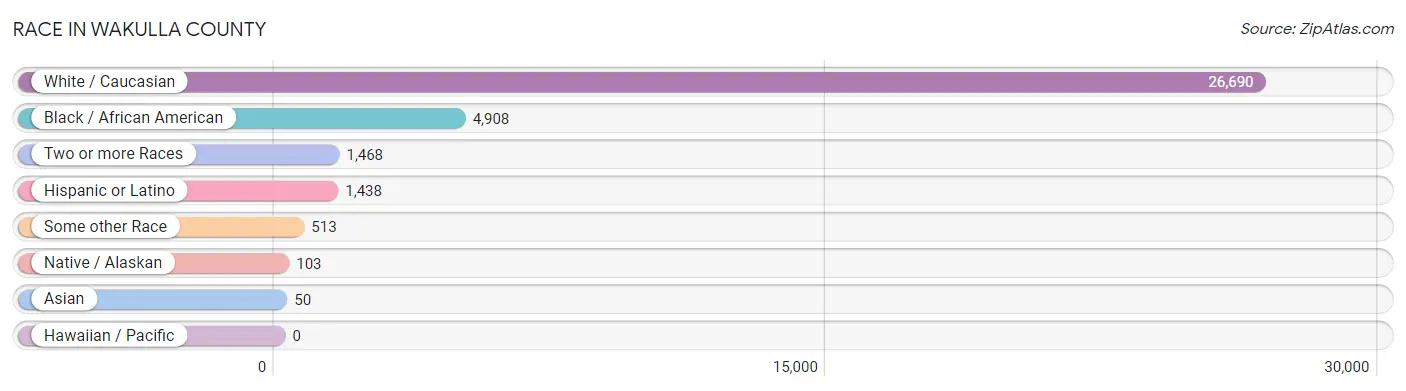
| Race | # Population | % Population |
| Asian | 50 | 0.2% |
| Black / African American | 4,908 | 14.5% |
| Hawaiian / Pacific | 0 | 0.0% |
| Hispanic or Latino | 1,438 | 4.3% |
| Native / Alaskan | 103 | 0.3% |
| White / Caucasian | 26,690 | 79.1% |
| Two or more Races | 1,468 | 4.3% |
| Some other Race | 513 | 1.5% |
| Total | 33,732 | 100.0% |
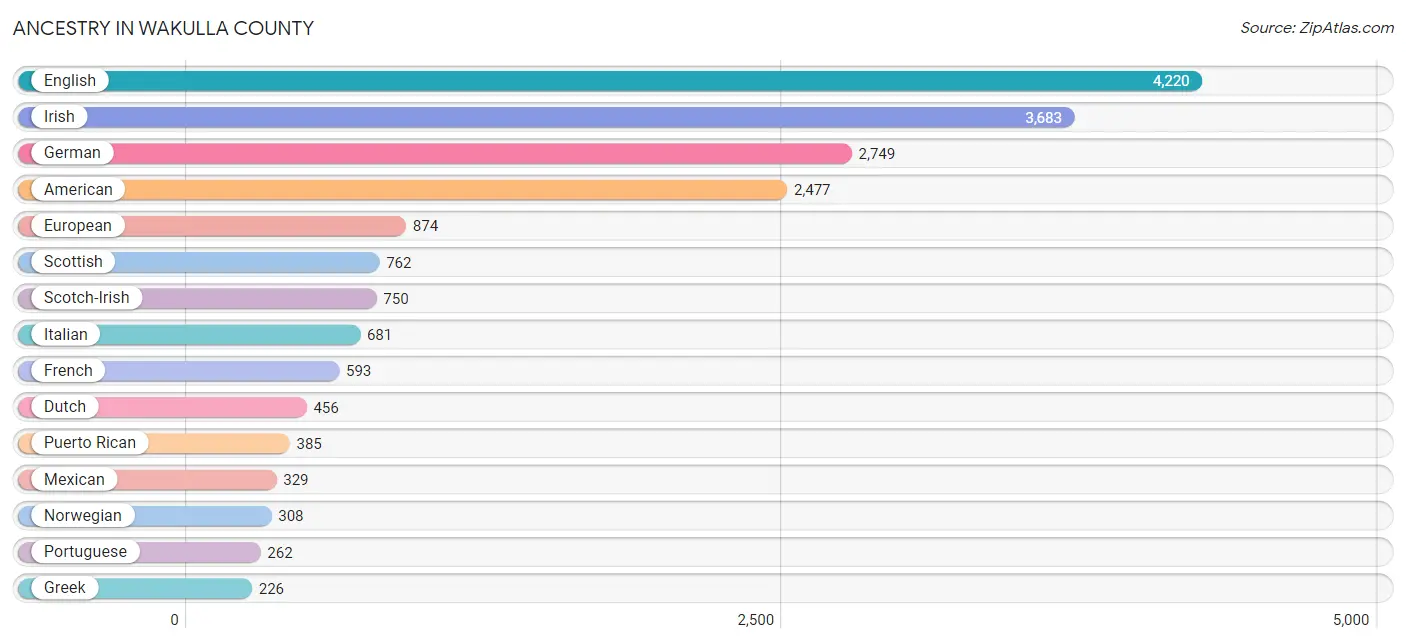
Ancestry in Wakulla County
The most populous ancestries reported in Wakulla County are English (4,220 | 12.5%), Irish (3,683 | 10.9%), German (2,749 | 8.2%), American (2,477 | 7.3%), and European (874 | 2.6%), together accounting for 41.5% of all Wakulla County residents.
| Ancestry | # Population | % Population |
| African | 75 | 0.2% |
| American | 2,477 | 7.3% |
| Arab | 20 | 0.1% |
| Armenian | 16 | 0.1% |
| Bahamian | 8 | 0.0% |
| Belgian | 13 | 0.0% |
| Bhutanese | 67 | 0.2% |
| Blackfeet | 8 | 0.0% |
| Brazilian | 2 | 0.0% |
| British | 33 | 0.1% |
| Cajun | 48 | 0.1% |
| Canadian | 48 | 0.1% |
| Central American | 162 | 0.5% |
| Central American Indian | 9 | 0.0% |
| Cherokee | 196 | 0.6% |
| Colombian | 101 | 0.3% |
| Creek | 31 | 0.1% |
| Cuban | 64 | 0.2% |
| Czech | 29 | 0.1% |
| Danish | 100 | 0.3% |
| Dominican | 41 | 0.1% |
| Dutch | 456 | 1.3% |
| Eastern European | 182 | 0.5% |
| English | 4,220 | 12.5% |
| European | 874 | 2.6% |
| Finnish | 37 | 0.1% |
| French | 593 | 1.8% |
| French Canadian | 96 | 0.3% |
| German | 2,749 | 8.2% |
| Greek | 226 | 0.7% |
| Guatemalan | 9 | 0.0% |
| Haitian | 116 | 0.3% |
| Honduran | 91 | 0.3% |
| Hungarian | 19 | 0.1% |
| Indian (Asian) | 24 | 0.1% |
| Inupiat | 12 | 0.0% |
| Irish | 3,683 | 10.9% |
| Iroquois | 8 | 0.0% |
| Israeli | 16 | 0.1% |
| Italian | 681 | 2.0% |
| Jamaican | 22 | 0.1% |
| Korean | 114 | 0.3% |
| Lebanese | 20 | 0.1% |
| Lithuanian | 35 | 0.1% |
| Mexican | 329 | 1.0% |
| Nicaraguan | 25 | 0.1% |
| Northern European | 16 | 0.1% |
| Norwegian | 308 | 0.9% |
| Pakistani | 2 | 0.0% |
| Panamanian | 10 | 0.0% |
| Peruvian | 10 | 0.0% |
| Polish | 176 | 0.5% |
| Portuguese | 262 | 0.8% |
| Puerto Rican | 385 | 1.1% |
| Romanian | 61 | 0.2% |
| Russian | 61 | 0.2% |
| Salvadoran | 27 | 0.1% |
| Scandinavian | 44 | 0.1% |
| Scotch-Irish | 750 | 2.2% |
| Scottish | 762 | 2.3% |
| Seminole | 21 | 0.1% |
| Senegalese | 2 | 0.0% |
| South American | 133 | 0.4% |
| Spaniard | 164 | 0.5% |
| Subsaharan African | 90 | 0.3% |
| Swedish | 98 | 0.3% |
| Swiss | 10 | 0.0% |
| Syrian | 12 | 0.0% |
| Venezuelan | 22 | 0.1% |
| Welsh | 212 | 0.6% | View All 70 Rows |
Immigrants in Wakulla County
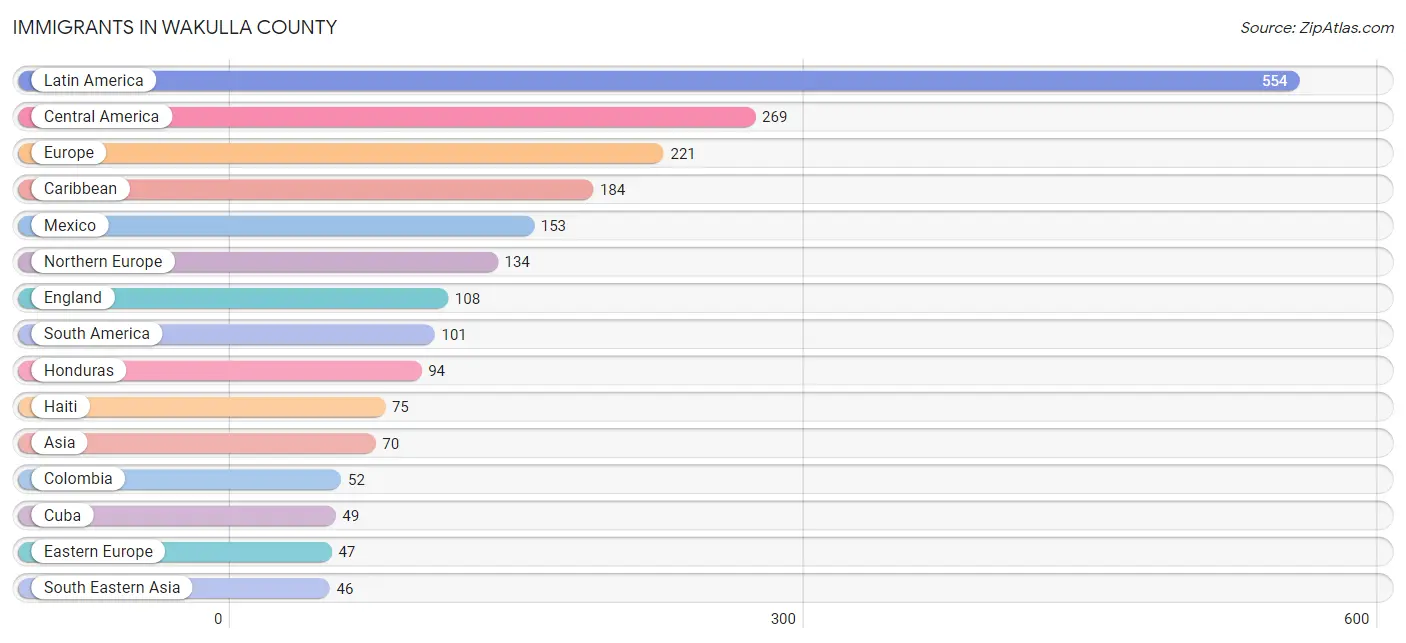
The most numerous immigrant groups reported in Wakulla County came from Latin America (554 | 1.6%), Central America (269 | 0.8%), Europe (221 | 0.7%), Caribbean (184 | 0.5%), and Mexico (153 | 0.4%), together accounting for 4.1% of all Wakulla County residents.
| Immigration Origin | # Population | % Population |
| Africa | 15 | 0.0% |
| Asia | 70 | 0.2% |
| Bahamas | 8 | 0.0% |
| Brazil | 9 | 0.0% |
| Canada | 38 | 0.1% |
| Caribbean | 184 | 0.5% |
| Central America | 269 | 0.8% |
| Colombia | 52 | 0.2% |
| Cuba | 49 | 0.2% |
| Dominican Republic | 16 | 0.1% |
| Eastern Asia | 24 | 0.1% |
| Eastern Europe | 47 | 0.1% |
| El Salvador | 22 | 0.1% |
| England | 108 | 0.3% |
| Europe | 221 | 0.7% |
| France | 15 | 0.0% |
| Germany | 11 | 0.0% |
| Guyana | 23 | 0.1% |
| Haiti | 75 | 0.2% |
| Honduras | 94 | 0.3% |
| Ireland | 12 | 0.0% |
| Italy | 14 | 0.0% |
| Jamaica | 18 | 0.1% |
| Japan | 24 | 0.1% |
| Latin America | 554 | 1.6% |
| Mexico | 153 | 0.4% |
| Northern Europe | 134 | 0.4% |
| Philippines | 44 | 0.1% |
| Romania | 37 | 0.1% |
| Serbia | 10 | 0.0% |
| South America | 101 | 0.3% |
| South Eastern Asia | 46 | 0.1% |
| Southern Europe | 14 | 0.0% |
| Thailand | 2 | 0.0% |
| Venezuela | 17 | 0.1% |
| West Indies | 18 | 0.1% |
| Western Europe | 26 | 0.1% | View All 37 Rows |
Sex and Age in Wakulla County
Sex and Age in Wakulla County
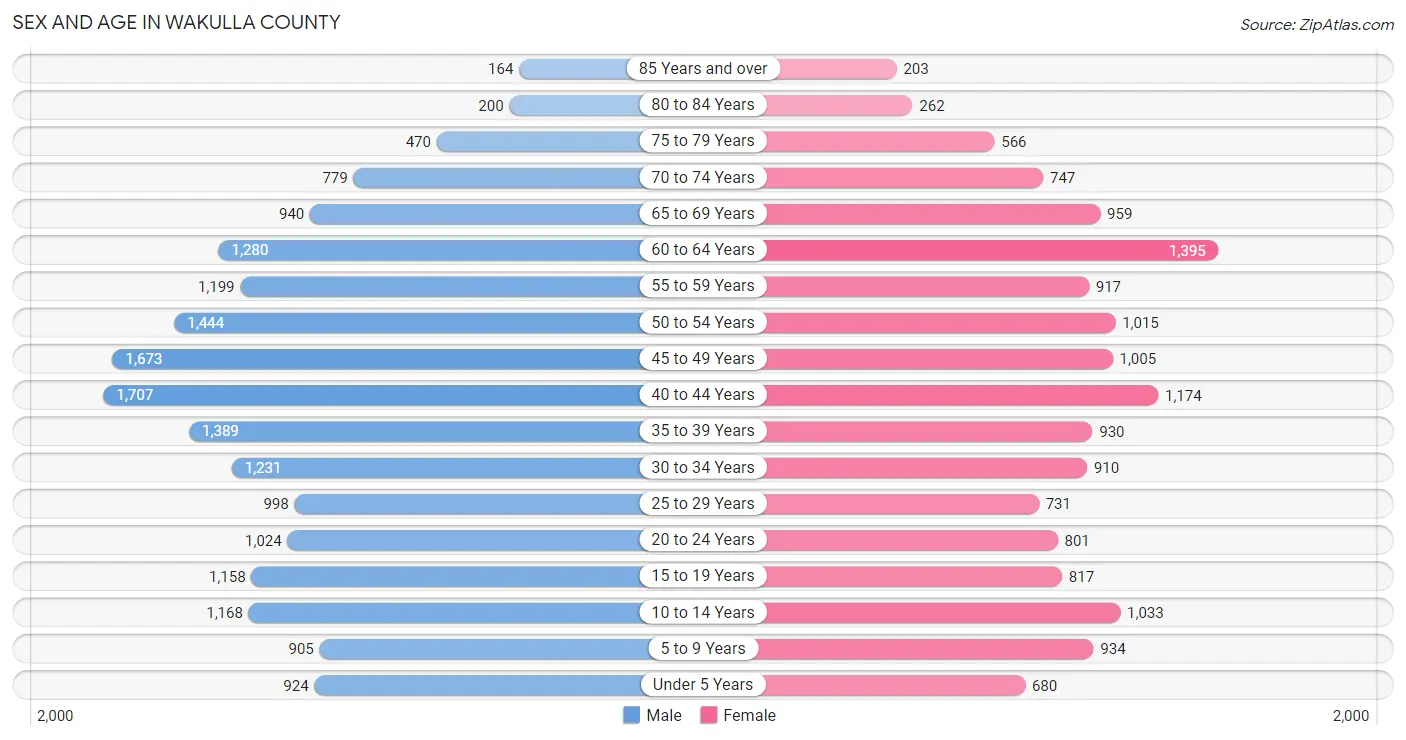
The most populous age groups in Wakulla County are 40 to 44 Years (1,707 | 9.1%) for men and 60 to 64 Years (1,395 | 9.2%) for women.
| Age Bracket | Male | Female |
| Under 5 Years | 924 (5.0%) | 680 (4.5%) |
| 5 to 9 Years | 905 (4.9%) | 934 (6.2%) |
| 10 to 14 Years | 1,168 (6.3%) | 1,033 (6.9%) |
| 15 to 19 Years | 1,158 (6.2%) | 817 (5.4%) |
| 20 to 24 Years | 1,024 (5.5%) | 801 (5.3%) |
| 25 to 29 Years | 998 (5.3%) | 731 (4.9%) |
| 30 to 34 Years | 1,231 (6.6%) | 910 (6.0%) |
| 35 to 39 Years | 1,389 (7.4%) | 930 (6.2%) |
| 40 to 44 Years | 1,707 (9.1%) | 1,174 (7.8%) |
| 45 to 49 Years | 1,673 (9.0%) | 1,005 (6.7%) |
| 50 to 54 Years | 1,444 (7.7%) | 1,015 (6.7%) |
| 55 to 59 Years | 1,199 (6.4%) | 917 (6.1%) |
| 60 to 64 Years | 1,280 (6.9%) | 1,395 (9.2%) |
| 65 to 69 Years | 940 (5.0%) | 959 (6.4%) |
| 70 to 74 Years | 779 (4.2%) | 747 (5.0%) |
| 75 to 79 Years | 470 (2.5%) | 566 (3.7%) |
| 80 to 84 Years | 200 (1.1%) | 262 (1.7%) |
| 85 Years and over | 164 (0.9%) | 203 (1.3%) |
| Total | 18,653 (100.0%) | 15,079 (100.0%) |
Families and Households in Wakulla County
Median Family Size in Wakulla County
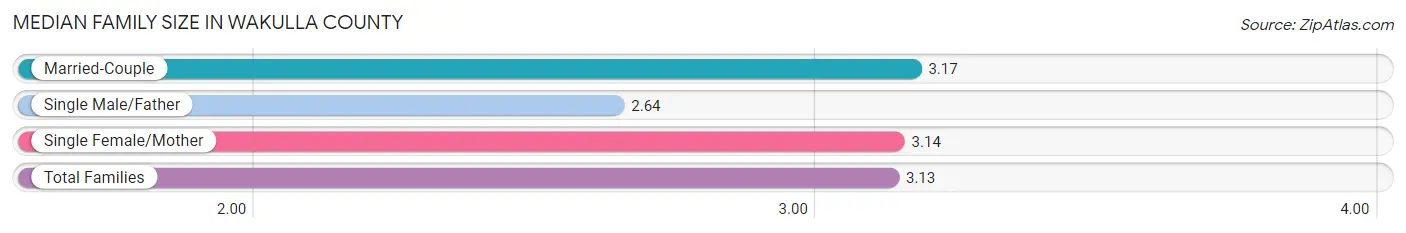
The median family size in Wakulla County is 3.13 persons per family, with married-couple families (6,368 | 78.1%) accounting for the largest median family size of 3.17 persons per family. On the other hand, single male/father families (474 | 5.8%) represent the smallest median family size with 2.64 persons per family.
| Family Type | # Families | Family Size |
| Married-Couple | 6,368 (78.1%) | 3.17 |
| Single Male/Father | 474 (5.8%) | 2.64 |
| Single Female/Mother | 1,312 (16.1%) | 3.14 |
| Total Families | 8,154 (100.0%) | 3.13 |
Median Household Size in Wakulla County
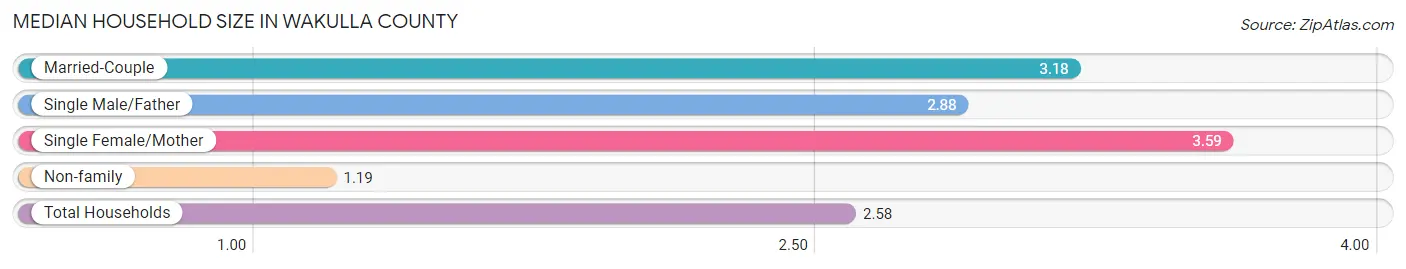
The median household size in Wakulla County is 2.58 persons per household, with single female/mother households (1,312 | 11.0%) accounting for the largest median household size of 3.59 persons per household. non-family households (3,778 | 31.7%) represent the smallest median household size with 1.19 persons per household.
| Household Type | # Households | Household Size |
| Married-Couple | 6,368 (53.4%) | 3.18 |
| Single Male/Father | 474 (4.0%) | 2.88 |
| Single Female/Mother | 1,312 (11.0%) | 3.59 |
| Non-family | 3,778 (31.7%) | 1.19 |
| Total Households | 11,932 (100.0%) | 2.58 |
Household Size by Marriage Status in Wakulla County
Out of a total of 11,932 households in Wakulla County, 8,154 (68.3%) are family households, while 3,778 (31.7%) are nonfamily households. The most numerous type of family households are 2-person households, comprising 3,582, and the most common type of nonfamily households are 1-person households, comprising 3,081.
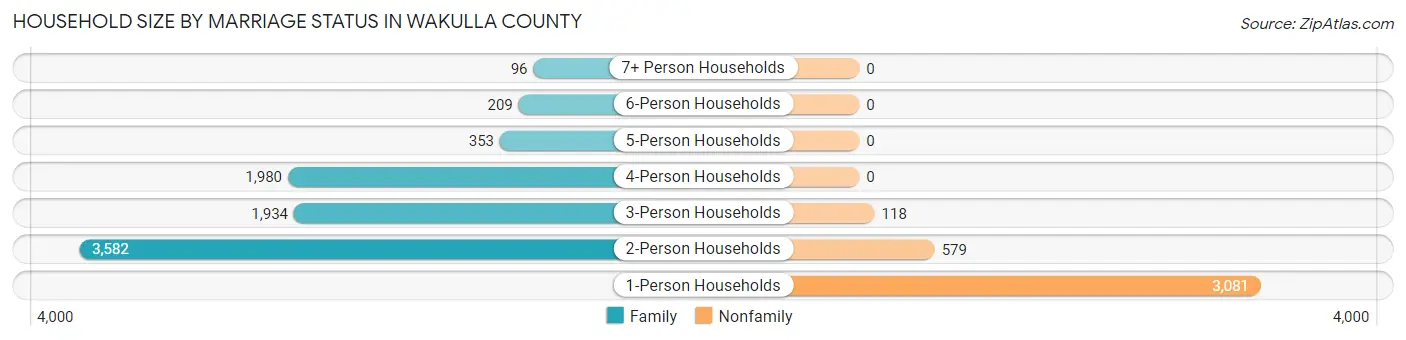
| Household Size | Family Households | Nonfamily Households |
| 1-Person Households | - | 3,081 (25.8%) |
| 2-Person Households | 3,582 (30.0%) | 579 (4.9%) |
| 3-Person Households | 1,934 (16.2%) | 118 (1.0%) |
| 4-Person Households | 1,980 (16.6%) | 0 (0.0%) |
| 5-Person Households | 353 (3.0%) | 0 (0.0%) |
| 6-Person Households | 209 (1.8%) | 0 (0.0%) |
| 7+ Person Households | 96 (0.8%) | 0 (0.0%) |
| Total | 8,154 (68.3%) | 3,778 (31.7%) |
Female Fertility in Wakulla County
Fertility by Age in Wakulla County
Average fertility rate in Wakulla County is 39.0 births per 1,000 women. Women in the age bracket of 20 to 34 years have the highest fertility rate with 78.0 births per 1,000 women. Women in the age bracket of 20 to 34 years acount for 74.5% of all women with births.
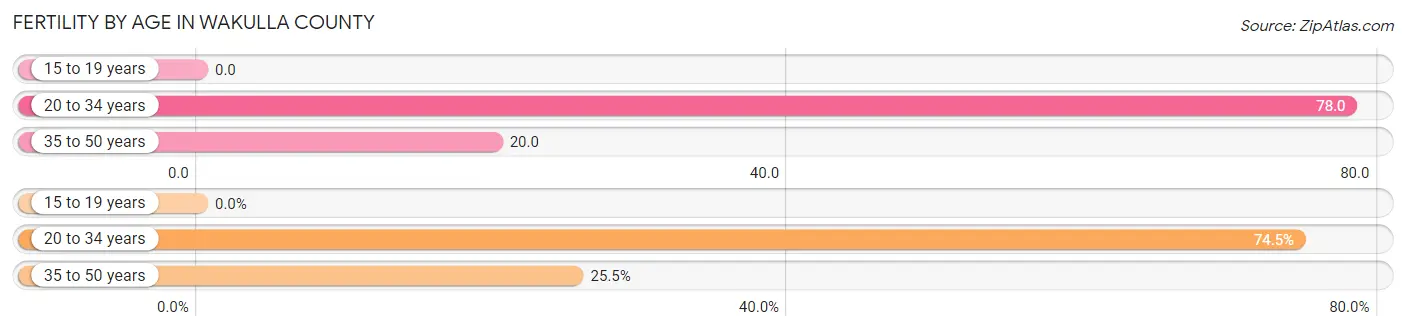
| Age Bracket | Women with Births | Births / 1,000 Women |
| 15 to 19 years | 0 (0.0%) | 0.0 |
| 20 to 34 years | 190 (74.5%) | 78.0 |
| 35 to 50 years | 65 (25.5%) | 20.0 |
| Total | 255 (100.0%) | 39.0 |
Fertility by Age by Marriage Status in Wakulla County
83.1% of women with births (255) in Wakulla County are married. The highest percentage of unmarried women with births falls into 20 to 34 years age bracket with 22.6% of them unmarried at the time of birth, while the lowest percentage of unmarried women with births belong to 35 to 50 years age bracket with 0.0% of them unmarried.
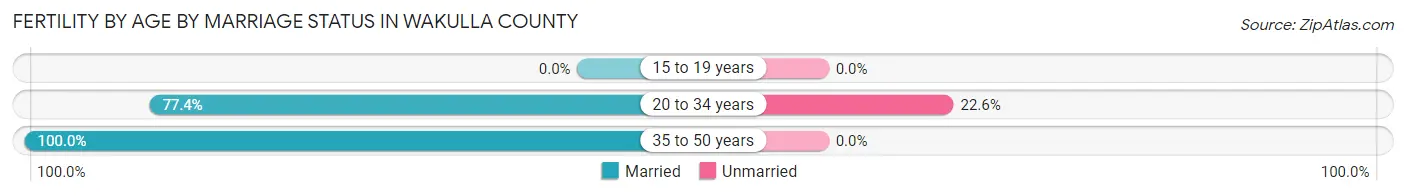
| Age Bracket | Married | Unmarried |
| 15 to 19 years | 0 (0.0%) | 0 (0.0%) |
| 20 to 34 years | 147 (77.4%) | 43 (22.6%) |
| 35 to 50 years | 65 (100.0%) | 0 (0.0%) |
| Total | 212 (83.1%) | 43 (16.9%) |
Fertility by Education in Wakulla County
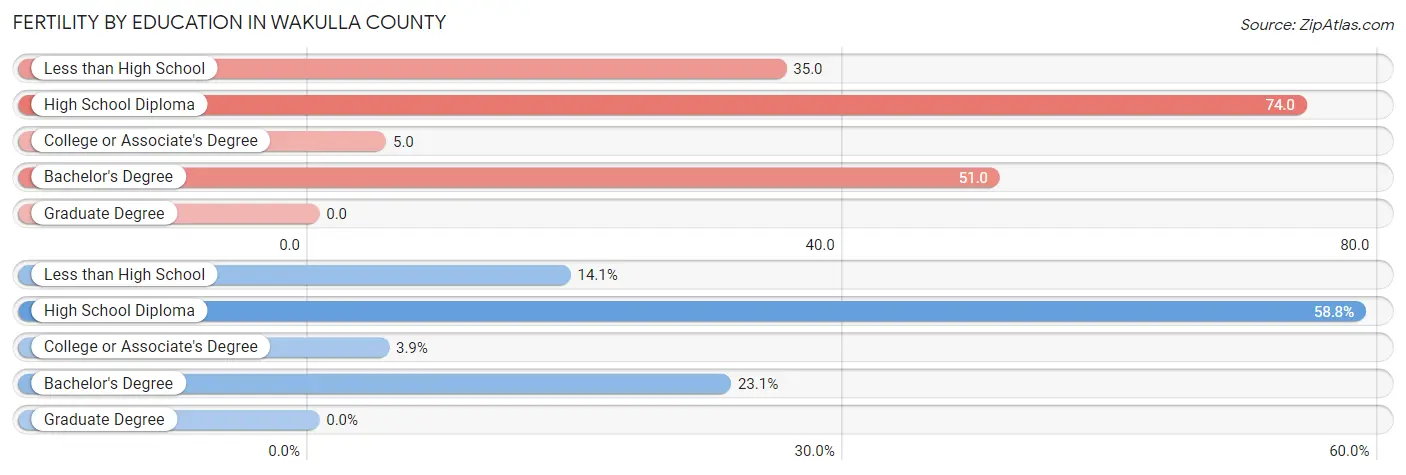
| Educational Attainment | Women with Births | Births / 1,000 Women |
| Less than High School | 36 (14.1%) | 35.0 |
| High School Diploma | 150 (58.8%) | 74.0 |
| College or Associate's Degree | 10 (3.9%) | 5.0 |
| Bachelor's Degree | 59 (23.1%) | 51.0 |
| Graduate Degree | 0 (0.0%) | 0.0 |
| Total | 255 (100.0%) | 39.0 |
Fertility by Education by Marriage Status in Wakulla County
16.9% of women with births in Wakulla County are unmarried. Women with the educational attainment of college or associate's degree are most likely to be married with 100.0% of them married at childbirth, while women with the educational attainment of less than high school are least likely to be married with 75.0% of them unmarried at childbirth.
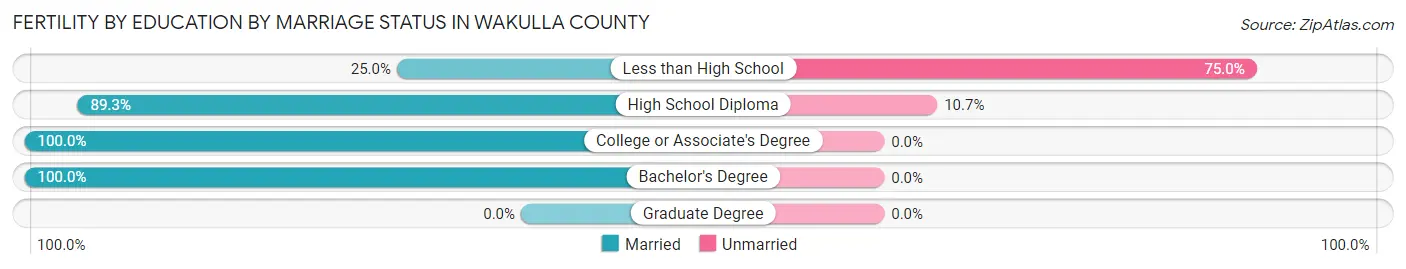
| Educational Attainment | Married | Unmarried |
| Less than High School | 9 (25.0%) | 27 (75.0%) |
| High School Diploma | 134 (89.3%) | 16 (10.7%) |
| College or Associate's Degree | 10 (100.0%) | 0 (0.0%) |
| Bachelor's Degree | 59 (100.0%) | 0 (0.0%) |
| Graduate Degree | 0 (0.0%) | 0 (0.0%) |
| Total | 212 (83.1%) | 43 (16.9%) |
Employment Characteristics in Wakulla County
Employment by Class of Employer in Wakulla County
Among the 15,067 employed individuals in Wakulla County, private company employees (7,053 | 46.8%), state government employees (2,892 | 19.2%), and local government employees (2,152 | 14.3%) make up the most common classes of employment.
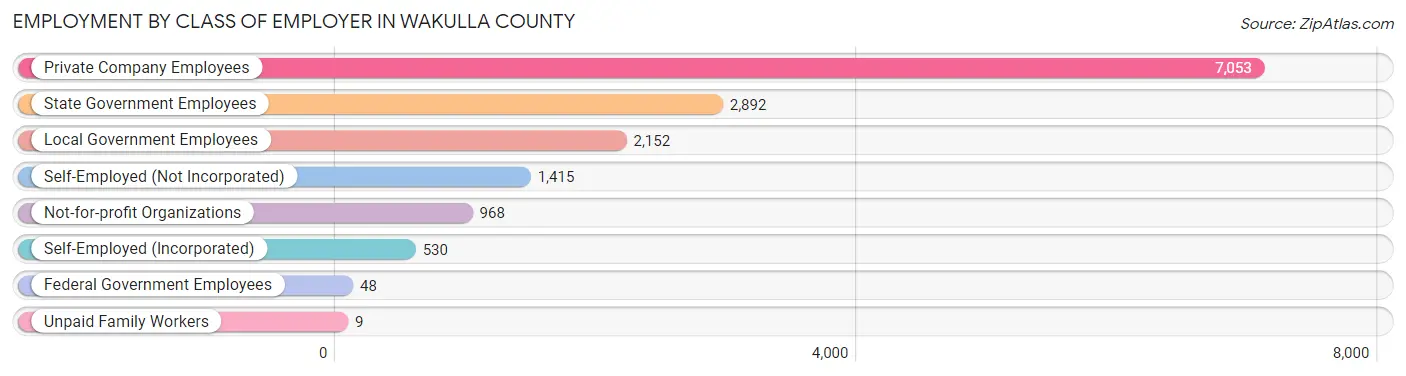
| Employer Class | # Employees | % Employees |
| Private Company Employees | 7,053 | 46.8% |
| Self-Employed (Incorporated) | 530 | 3.5% |
| Self-Employed (Not Incorporated) | 1,415 | 9.4% |
| Not-for-profit Organizations | 968 | 6.4% |
| Local Government Employees | 2,152 | 14.3% |
| State Government Employees | 2,892 | 19.2% |
| Federal Government Employees | 48 | 0.3% |
| Unpaid Family Workers | 9 | 0.1% |
| Total | 15,067 | 100.0% |
Employment Status by Age in Wakulla County
According to the labor force statistics for Wakulla County, out of the total population over 16 years of age (27,724), 57.5% or 15,941 individuals are in the labor force, with 3.6% or 574 of them unemployed. The age group with the highest labor force participation rate is 25 to 29 years, with 79.8% or 1,380 individuals in the labor force. Within the labor force, the 16 to 19 years age range has the highest percentage of unemployed individuals, with 19.6% or 140 of them being unemployed.
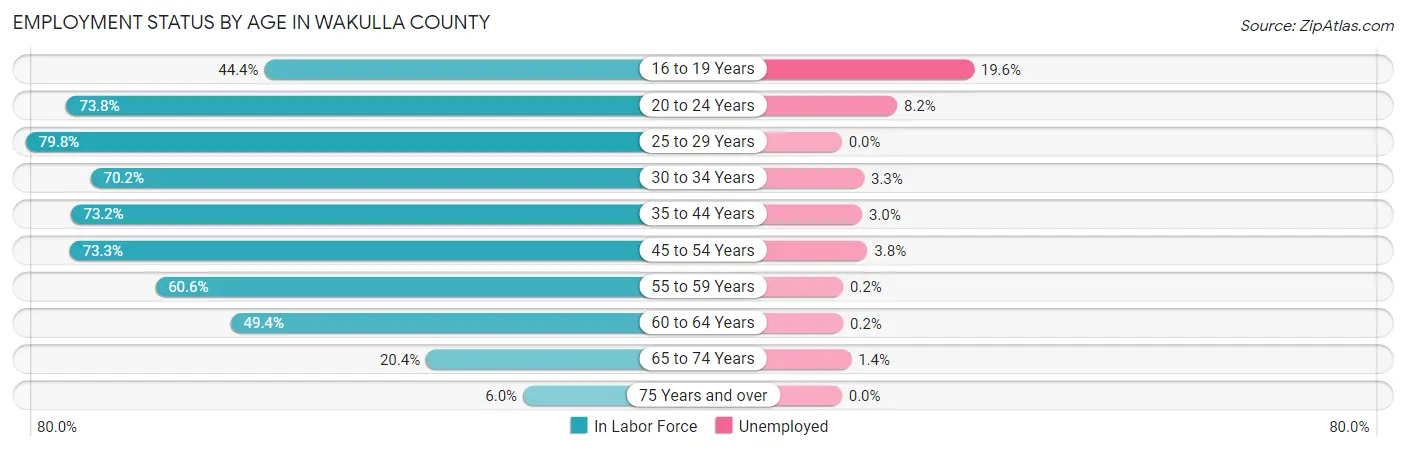
| Age Bracket | In Labor Force | Unemployed |
| 16 to 19 Years | 715 (44.4%) | 140 (19.6%) |
| 20 to 24 Years | 1,347 (73.8%) | 110 (8.2%) |
| 25 to 29 Years | 1,380 (79.8%) | 0 (0.0%) |
| 30 to 34 Years | 1,503 (70.2%) | 50 (3.3%) |
| 35 to 44 Years | 3,806 (73.2%) | 114 (3.0%) |
| 45 to 54 Years | 3,765 (73.3%) | 143 (3.8%) |
| 55 to 59 Years | 1,282 (60.6%) | 3 (0.2%) |
| 60 to 64 Years | 1,321 (49.4%) | 3 (0.2%) |
| 65 to 74 Years | 699 (20.4%) | 10 (1.4%) |
| 75 Years and over | 112 (6.0%) | 0 (0.0%) |
| Total | 15,941 (57.5%) | 574 (3.6%) |
Employment Status by Educational Attainment in Wakulla County
According to labor force statistics for Wakulla County, 68.7% of individuals (13,052) out of the total population between 25 and 64 years of age (18,998) are in the labor force, with 2.4% or 313 of them being unemployed. The group with the highest labor force participation rate are those with the educational attainment of bachelor's degree or higher, with 87.0% or 3,211 individuals in the labor force. Within the labor force, individuals with less than high school education have the highest percentage of unemployment, with 9.2% or 74 of them being unemployed.
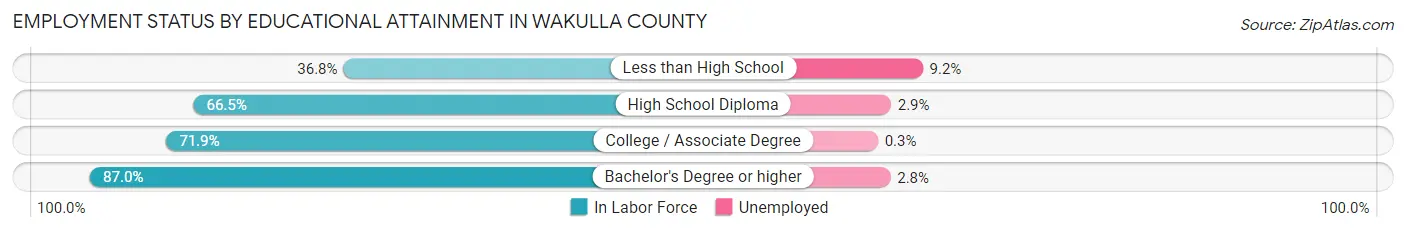
| Educational Attainment | In Labor Force | Unemployed |
| Less than High School | 808 (36.8%) | 202 (9.2%) |
| High School Diploma | 4,722 (66.5%) | 206 (2.9%) |
| College / Associate Degree | 4,321 (71.9%) | 18 (0.3%) |
| Bachelor's Degree or higher | 3,211 (87.0%) | 103 (2.8%) |
| Total | 13,052 (68.7%) | 456 (2.4%) |
Employment Occupations by Sex in Wakulla County
Management, Business, Science and Arts Occupations
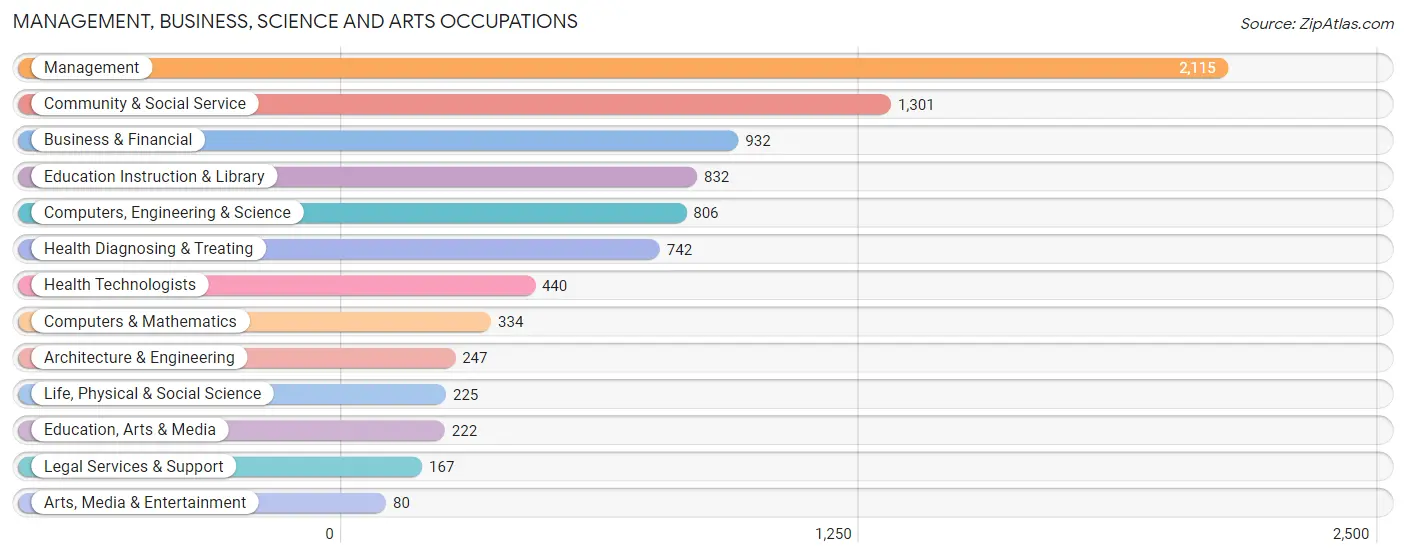
The most common Management, Business, Science and Arts occupations in Wakulla County are Management (2,115 | 13.8%), Community & Social Service (1,301 | 8.5%), Business & Financial (932 | 6.1%), Education Instruction & Library (832 | 5.4%), and Computers, Engineering & Science (806 | 5.2%).
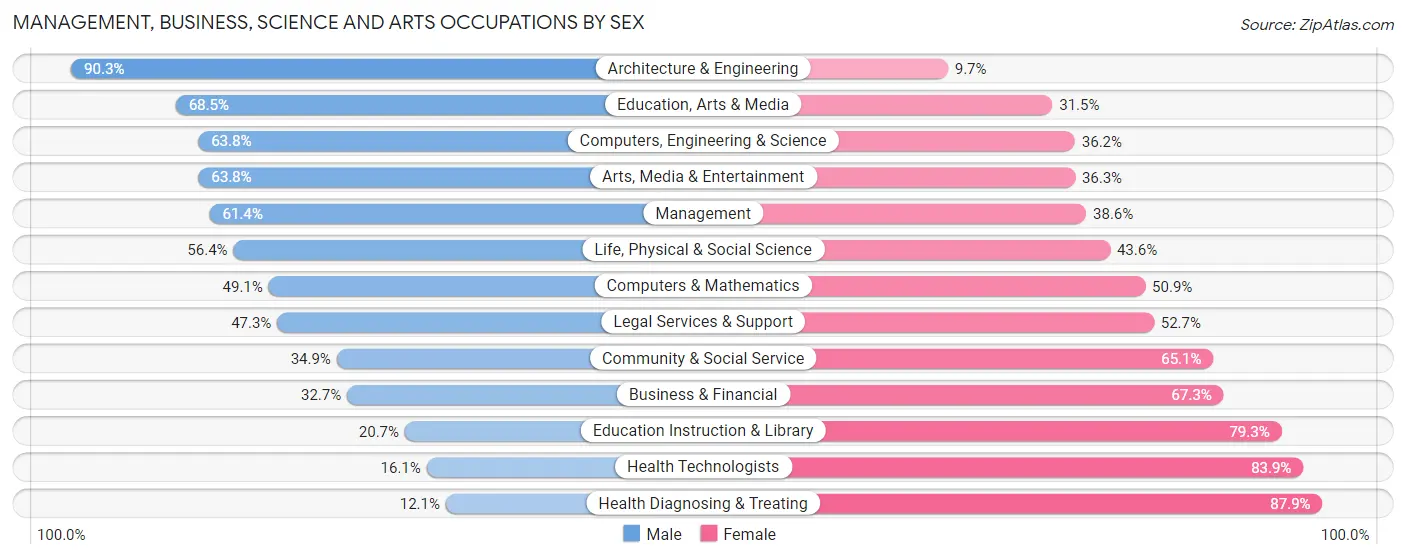
Management, Business, Science and Arts Occupations by Sex
Within the Management, Business, Science and Arts occupations in Wakulla County, the most male-oriented occupations are Architecture & Engineering (90.3%), Education, Arts & Media (68.5%), and Computers, Engineering & Science (63.8%), while the most female-oriented occupations are Health Diagnosing & Treating (87.9%), Health Technologists (83.9%), and Education Instruction & Library (79.3%).
| Occupation | Male | Female |
| Management | 1,299 (61.4%) | 816 (38.6%) |
| Business & Financial | 305 (32.7%) | 627 (67.3%) |
| Computers, Engineering & Science | 514 (63.8%) | 292 (36.2%) |
| Computers & Mathematics | 164 (49.1%) | 170 (50.9%) |
| Architecture & Engineering | 223 (90.3%) | 24 (9.7%) |
| Life, Physical & Social Science | 127 (56.4%) | 98 (43.6%) |
| Community & Social Service | 454 (34.9%) | 847 (65.1%) |
| Education, Arts & Media | 152 (68.5%) | 70 (31.5%) |
| Legal Services & Support | 79 (47.3%) | 88 (52.7%) |
| Education Instruction & Library | 172 (20.7%) | 660 (79.3%) |
| Arts, Media & Entertainment | 51 (63.7%) | 29 (36.2%) |
| Health Diagnosing & Treating | 90 (12.1%) | 652 (87.9%) |
| Health Technologists | 71 (16.1%) | 369 (83.9%) |
| Total (Category) | 2,662 (45.2%) | 3,234 (54.8%) |
| Total (Overall) | 8,576 (55.8%) | 6,779 (44.2%) |
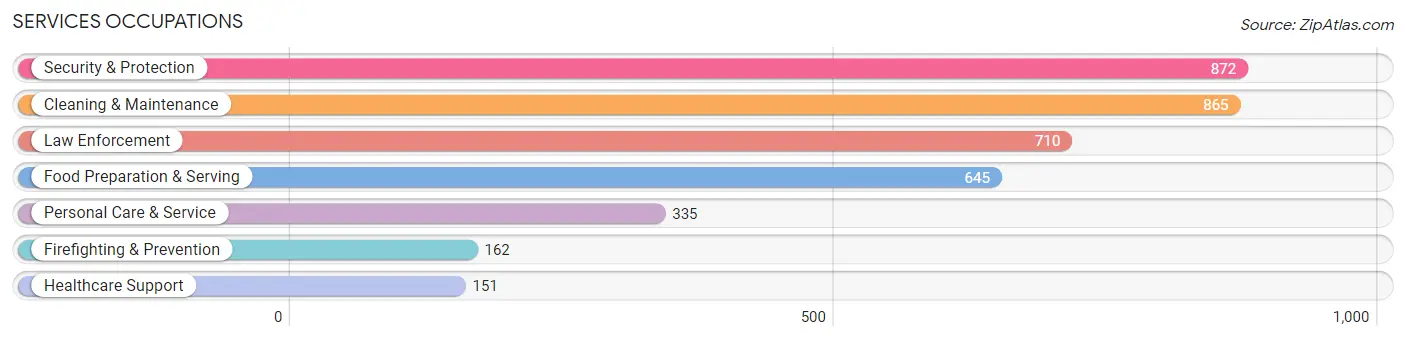
Services Occupations
The most common Services occupations in Wakulla County are Security & Protection (872 | 5.7%), Cleaning & Maintenance (865 | 5.6%), Law Enforcement (710 | 4.6%), Food Preparation & Serving (645 | 4.2%), and Personal Care & Service (335 | 2.2%).
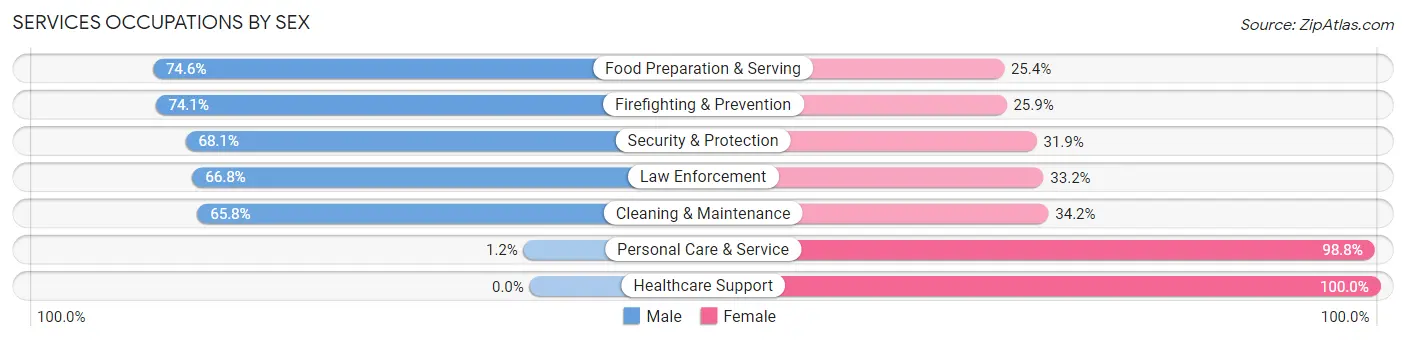
Services Occupations by Sex
Within the Services occupations in Wakulla County, the most male-oriented occupations are Food Preparation & Serving (74.6%), Firefighting & Prevention (74.1%), and Security & Protection (68.1%), while the most female-oriented occupations are Healthcare Support (100.0%), Personal Care & Service (98.8%), and Cleaning & Maintenance (34.2%).
| Occupation | Male | Female |
| Healthcare Support | 0 (0.0%) | 151 (100.0%) |
| Security & Protection | 594 (68.1%) | 278 (31.9%) |
| Firefighting & Prevention | 120 (74.1%) | 42 (25.9%) |
| Law Enforcement | 474 (66.8%) | 236 (33.2%) |
| Food Preparation & Serving | 481 (74.6%) | 164 (25.4%) |
| Cleaning & Maintenance | 569 (65.8%) | 296 (34.2%) |
| Personal Care & Service | 4 (1.2%) | 331 (98.8%) |
| Total (Category) | 1,648 (57.5%) | 1,220 (42.5%) |
| Total (Overall) | 8,576 (55.8%) | 6,779 (44.2%) |
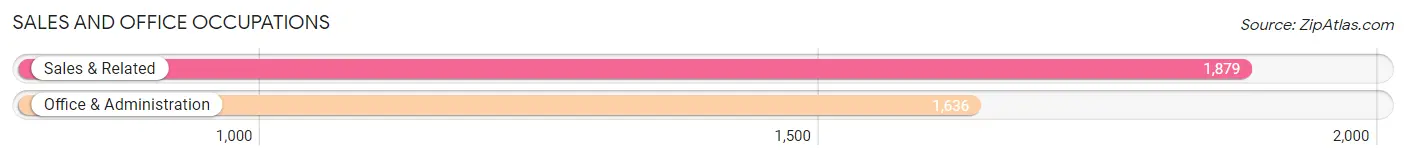
Sales and Office Occupations
The most common Sales and Office occupations in Wakulla County are Sales & Related (1,879 | 12.2%), and Office & Administration (1,636 | 10.6%).
Sales and Office Occupations by Sex
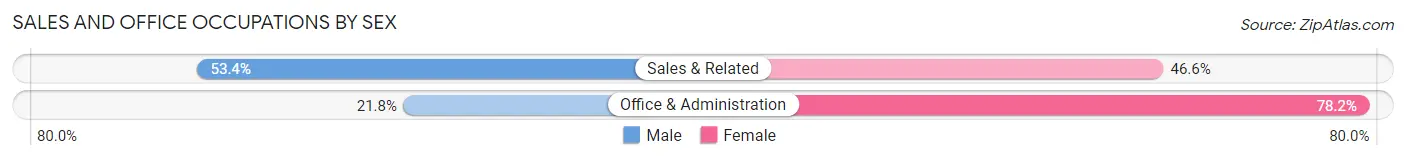
| Occupation | Male | Female |
| Sales & Related | 1,003 (53.4%) | 876 (46.6%) |
| Office & Administration | 357 (21.8%) | 1,279 (78.2%) |
| Total (Category) | 1,360 (38.7%) | 2,155 (61.3%) |
| Total (Overall) | 8,576 (55.8%) | 6,779 (44.2%) |
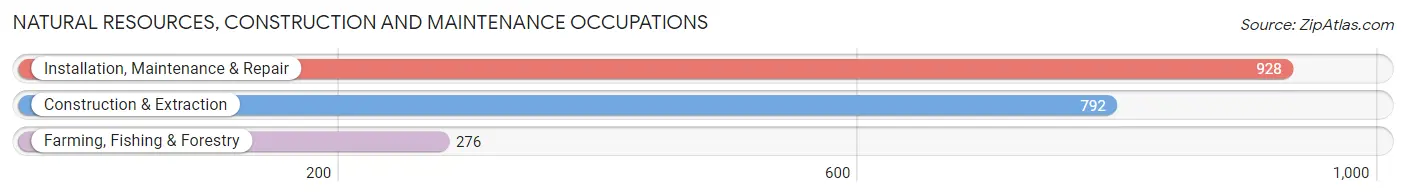
Natural Resources, Construction and Maintenance Occupations
The most common Natural Resources, Construction and Maintenance occupations in Wakulla County are Installation, Maintenance & Repair (928 | 6.0%), Construction & Extraction (792 | 5.2%), and Farming, Fishing & Forestry (276 | 1.8%).
Natural Resources, Construction and Maintenance Occupations by Sex
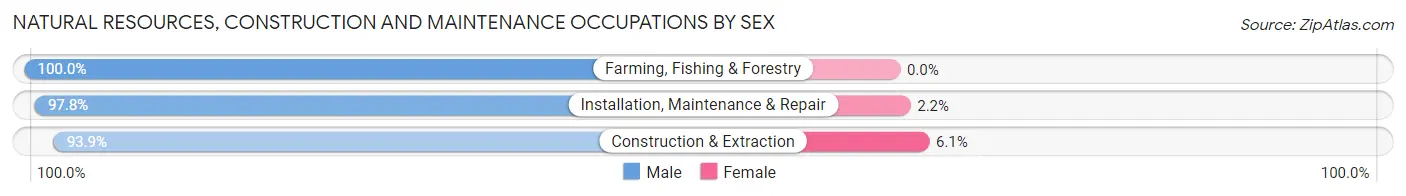
| Occupation | Male | Female |
| Farming, Fishing & Forestry | 276 (100.0%) | 0 (0.0%) |
| Construction & Extraction | 744 (93.9%) | 48 (6.1%) |
| Installation, Maintenance & Repair | 908 (97.8%) | 20 (2.2%) |
| Total (Category) | 1,928 (96.6%) | 68 (3.4%) |
| Total (Overall) | 8,576 (55.8%) | 6,779 (44.2%) |
Production, Transportation and Moving Occupations
The most common Production, Transportation and Moving occupations in Wakulla County are Transportation (525 | 3.4%), Material Moving (326 | 2.1%), and Production (229 | 1.5%).
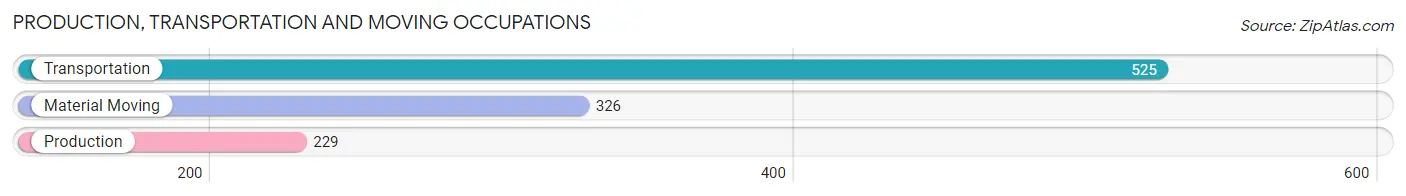
Production, Transportation and Moving Occupations by Sex
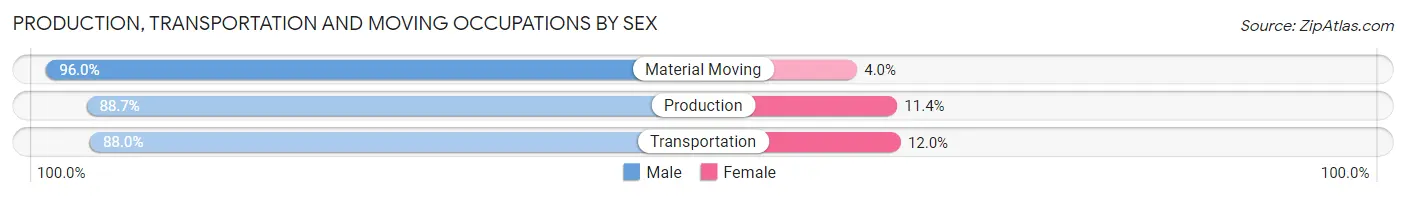
| Occupation | Male | Female |
| Production | 203 (88.6%) | 26 (11.4%) |
| Transportation | 462 (88.0%) | 63 (12.0%) |
| Material Moving | 313 (96.0%) | 13 (4.0%) |
| Total (Category) | 978 (90.6%) | 102 (9.4%) |
| Total (Overall) | 8,576 (55.8%) | 6,779 (44.2%) |
Employment Industries by Sex in Wakulla County
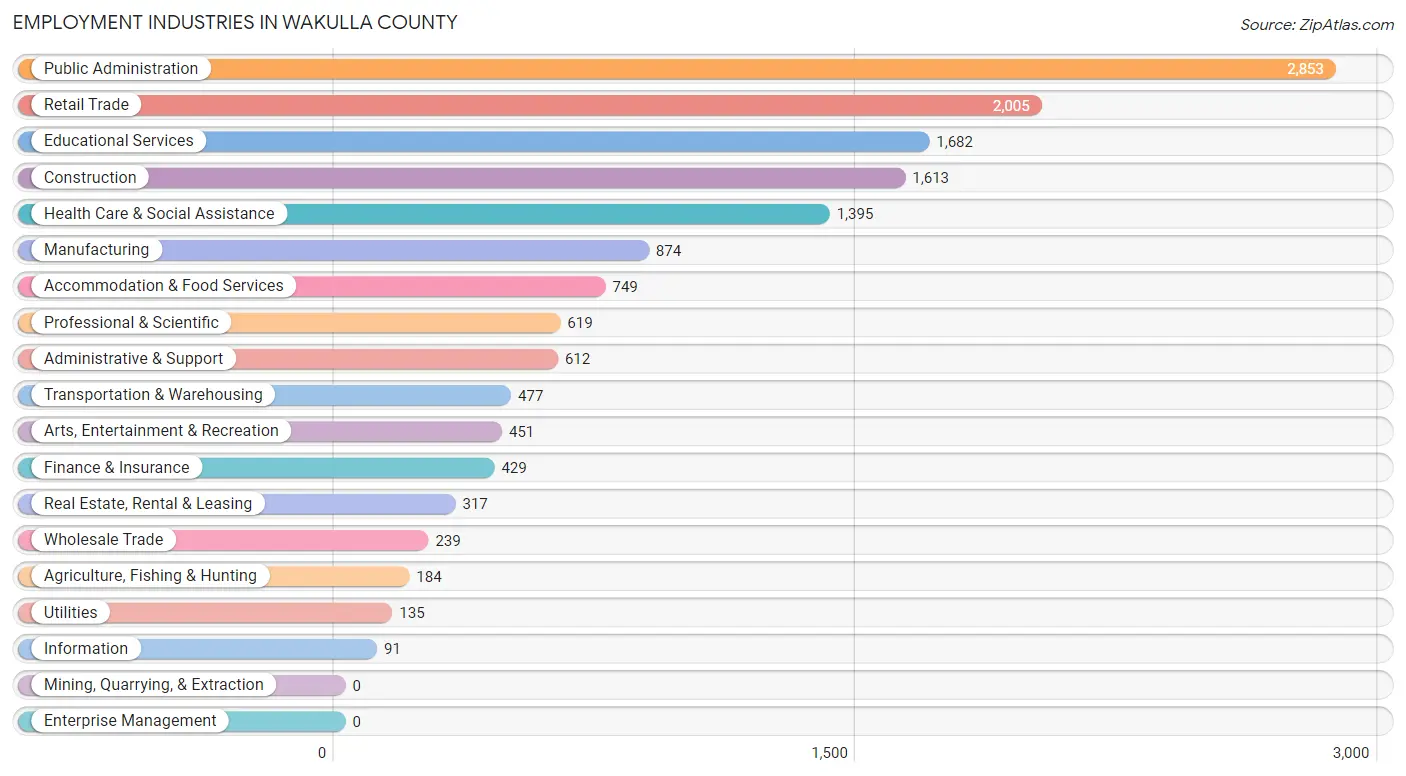
Employment Industries in Wakulla County
The major employment industries in Wakulla County include Public Administration (2,853 | 18.6%), Retail Trade (2,005 | 13.1%), Educational Services (1,682 | 11.0%), Construction (1,613 | 10.5%), and Health Care & Social Assistance (1,395 | 9.1%).
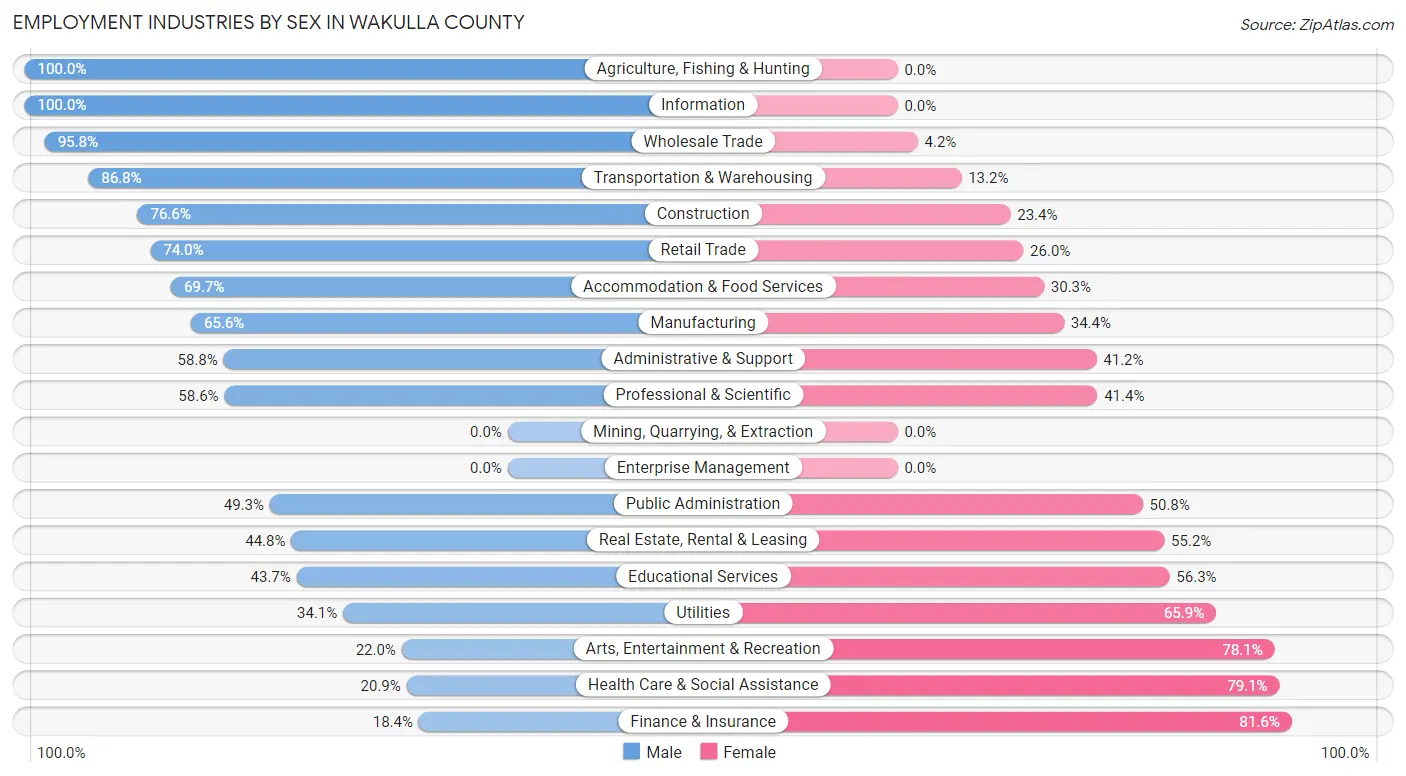
Employment Industries by Sex in Wakulla County
The Wakulla County industries that see more men than women are Agriculture, Fishing & Hunting (100.0%), Information (100.0%), and Wholesale Trade (95.8%), whereas the industries that tend to have a higher number of women are Finance & Insurance (81.6%), Health Care & Social Assistance (79.1%), and Arts, Entertainment & Recreation (78.0%).
| Industry | Male | Female |
| Agriculture, Fishing & Hunting | 184 (100.0%) | 0 (0.0%) |
| Mining, Quarrying, & Extraction | 0 (0.0%) | 0 (0.0%) |
| Construction | 1,236 (76.6%) | 377 (23.4%) |
| Manufacturing | 573 (65.6%) | 301 (34.4%) |
| Wholesale Trade | 229 (95.8%) | 10 (4.2%) |
| Retail Trade | 1,483 (74.0%) | 522 (26.0%) |
| Transportation & Warehousing | 414 (86.8%) | 63 (13.2%) |
| Utilities | 46 (34.1%) | 89 (65.9%) |
| Information | 91 (100.0%) | 0 (0.0%) |
| Finance & Insurance | 79 (18.4%) | 350 (81.6%) |
| Real Estate, Rental & Leasing | 142 (44.8%) | 175 (55.2%) |
| Professional & Scientific | 363 (58.6%) | 256 (41.4%) |
| Enterprise Management | 0 (0.0%) | 0 (0.0%) |
| Administrative & Support | 360 (58.8%) | 252 (41.2%) |
| Educational Services | 735 (43.7%) | 947 (56.3%) |
| Health Care & Social Assistance | 292 (20.9%) | 1,103 (79.1%) |
| Arts, Entertainment & Recreation | 99 (22.0%) | 352 (78.0%) |
| Accommodation & Food Services | 522 (69.7%) | 227 (30.3%) |
| Public Administration | 1,405 (49.2%) | 1,448 (50.7%) |
| Total | 8,576 (55.8%) | 6,779 (44.2%) |
Education in Wakulla County
School Enrollment in Wakulla County
The most common levels of schooling among the 7,382 students in Wakulla County are high school (1,737 | 23.5%), middle school (1,686 | 22.8%), and elementary school (1,487 | 20.1%).
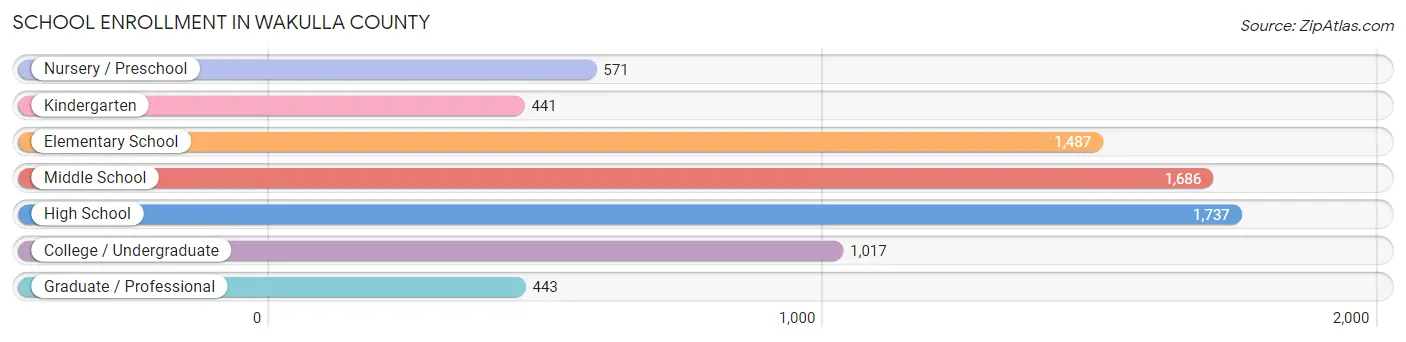
| School Level | # Students | % Students |
| Nursery / Preschool | 571 | 7.7% |
| Kindergarten | 441 | 6.0% |
| Elementary School | 1,487 | 20.1% |
| Middle School | 1,686 | 22.8% |
| High School | 1,737 | 23.5% |
| College / Undergraduate | 1,017 | 13.8% |
| Graduate / Professional | 443 | 6.0% |
| Total | 7,382 | 100.0% |
School Enrollment by Age by Funding Source in Wakulla County
Out of a total of 7,382 students who are enrolled in schools in Wakulla County, 1,240 (16.8%) attend a private institution, while the remaining 6,142 (83.2%) are enrolled in public schools. The age group of 35 years and over has the highest likelihood of being enrolled in private schools, with 232 (49.1% in the age bracket) enrolled. Conversely, the age group of 5 to 9 year old has the lowest likelihood of being enrolled in a private school, with 1,513 (88.6% in the age bracket) attending a public institution.
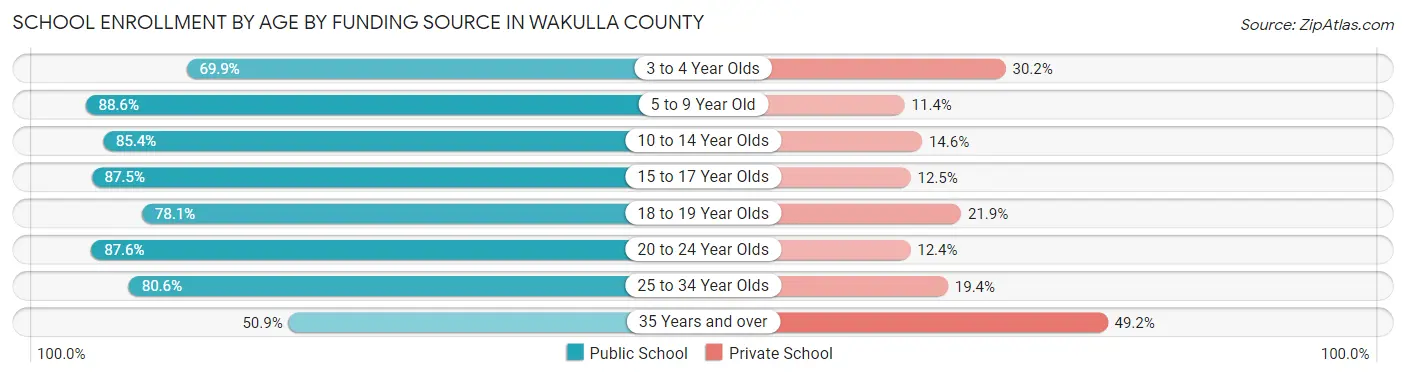
| Age Bracket | Public School | Private School |
| 3 to 4 Year Olds | 278 (69.9%) | 120 (30.1%) |
| 5 to 9 Year Old | 1,513 (88.6%) | 194 (11.4%) |
| 10 to 14 Year Olds | 1,850 (85.4%) | 316 (14.6%) |
| 15 to 17 Year Olds | 1,123 (87.5%) | 160 (12.5%) |
| 18 to 19 Year Olds | 218 (78.1%) | 61 (21.9%) |
| 20 to 24 Year Olds | 614 (87.6%) | 87 (12.4%) |
| 25 to 34 Year Olds | 303 (80.6%) | 73 (19.4%) |
| 35 Years and over | 240 (50.8%) | 232 (49.1%) |
| Total | 6,142 (83.2%) | 1,240 (16.8%) |
Educational Attainment by Field of Study in Wakulla County
Business (870 | 17.3%), science & technology (855 | 17.0%), social sciences (832 | 16.6%), education (512 | 10.2%), and arts & humanities (362 | 7.2%) are the most common fields of study among 5,027 individuals in Wakulla County who have obtained a bachelor's degree or higher.
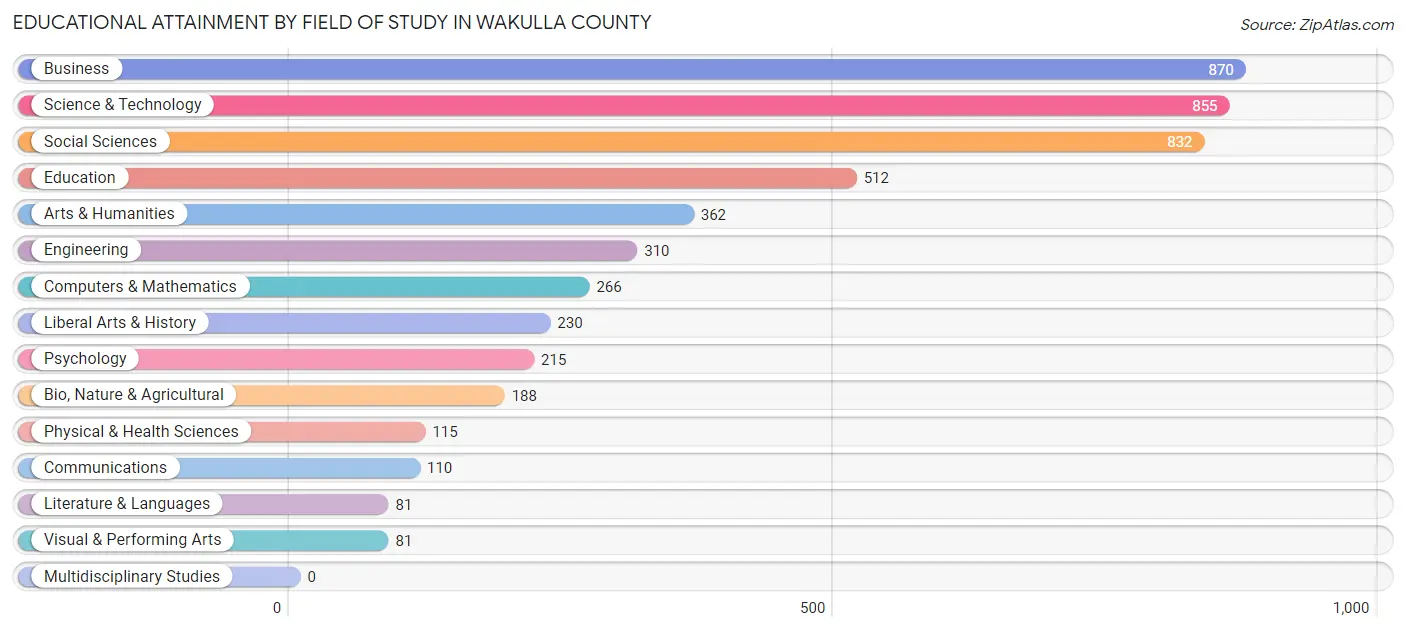
| Field of Study | # Graduates | % Graduates |
| Computers & Mathematics | 266 | 5.3% |
| Bio, Nature & Agricultural | 188 | 3.7% |
| Physical & Health Sciences | 115 | 2.3% |
| Psychology | 215 | 4.3% |
| Social Sciences | 832 | 16.6% |
| Engineering | 310 | 6.2% |
| Multidisciplinary Studies | 0 | 0.0% |
| Science & Technology | 855 | 17.0% |
| Business | 870 | 17.3% |
| Education | 512 | 10.2% |
| Literature & Languages | 81 | 1.6% |
| Liberal Arts & History | 230 | 4.6% |
| Visual & Performing Arts | 81 | 1.6% |
| Communications | 110 | 2.2% |
| Arts & Humanities | 362 | 7.2% |
| Total | 5,027 | 100.0% |
Transportation & Commute in Wakulla County
Vehicle Availability by Sex in Wakulla County
The most prevalent vehicle ownership categories in Wakulla County are males with 2 vehicles (3,535, accounting for 42.2%) and females with 2 vehicles (2,993, making up 52.9%).
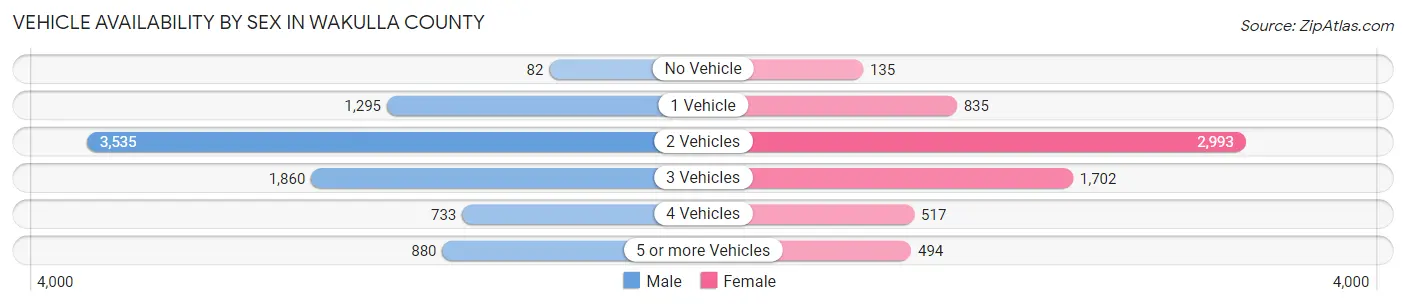
| Vehicles Available | Male | Female |
| No Vehicle | 82 (1.0%) | 135 (2.0%) |
| 1 Vehicle | 1,295 (15.4%) | 835 (12.5%) |
| 2 Vehicles | 3,535 (42.2%) | 2,993 (44.8%) |
| 3 Vehicles | 1,860 (22.2%) | 1,702 (25.5%) |
| 4 Vehicles | 733 (8.7%) | 517 (7.7%) |
| 5 or more Vehicles | 880 (10.5%) | 494 (7.4%) |
| Total | 8,385 (100.0%) | 6,676 (100.0%) |
Commute Time in Wakulla County
The most frequently occuring commute durations in Wakulla County are 30 to 34 minutes (3,002 commuters, 21.2%), 45 to 59 minutes (2,266 commuters, 16.0%), and 15 to 19 minutes (1,685 commuters, 11.9%).
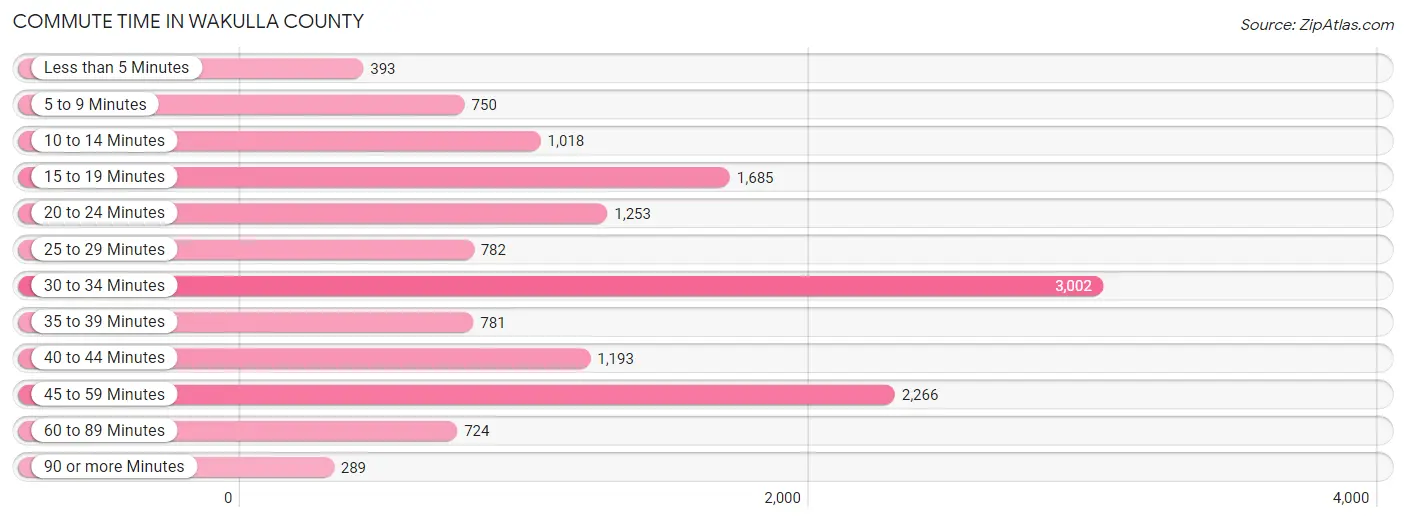
| Commute Time | # Commuters | % Commuters |
| Less than 5 Minutes | 393 | 2.8% |
| 5 to 9 Minutes | 750 | 5.3% |
| 10 to 14 Minutes | 1,018 | 7.2% |
| 15 to 19 Minutes | 1,685 | 11.9% |
| 20 to 24 Minutes | 1,253 | 8.9% |
| 25 to 29 Minutes | 782 | 5.5% |
| 30 to 34 Minutes | 3,002 | 21.2% |
| 35 to 39 Minutes | 781 | 5.5% |
| 40 to 44 Minutes | 1,193 | 8.4% |
| 45 to 59 Minutes | 2,266 | 16.0% |
| 60 to 89 Minutes | 724 | 5.1% |
| 90 or more Minutes | 289 | 2.0% |
Commute Time by Sex in Wakulla County
The most common commute times in Wakulla County are 30 to 34 minutes (1,712 commuters, 21.4%) for males and 30 to 34 minutes (1,290 commuters, 21.0%) for females.
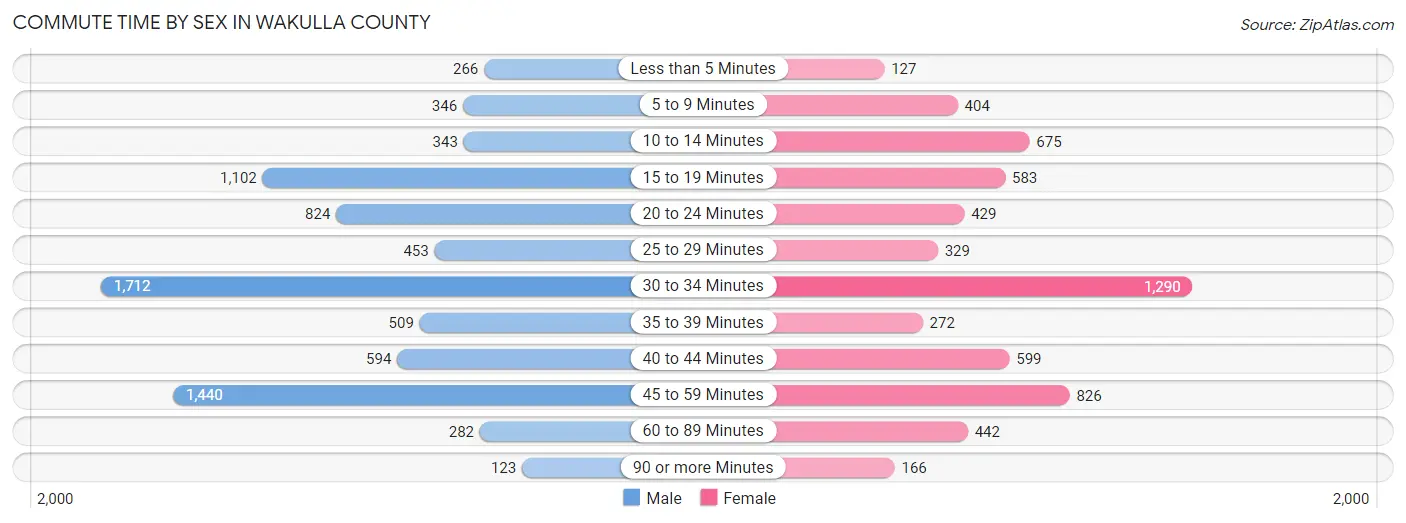
| Commute Time | Male | Female |
| Less than 5 Minutes | 266 (3.3%) | 127 (2.1%) |
| 5 to 9 Minutes | 346 (4.3%) | 404 (6.6%) |
| 10 to 14 Minutes | 343 (4.3%) | 675 (11.0%) |
| 15 to 19 Minutes | 1,102 (13.8%) | 583 (9.5%) |
| 20 to 24 Minutes | 824 (10.3%) | 429 (7.0%) |
| 25 to 29 Minutes | 453 (5.7%) | 329 (5.4%) |
| 30 to 34 Minutes | 1,712 (21.4%) | 1,290 (21.0%) |
| 35 to 39 Minutes | 509 (6.4%) | 272 (4.4%) |
| 40 to 44 Minutes | 594 (7.4%) | 599 (9.8%) |
| 45 to 59 Minutes | 1,440 (18.0%) | 826 (13.5%) |
| 60 to 89 Minutes | 282 (3.5%) | 442 (7.2%) |
| 90 or more Minutes | 123 (1.5%) | 166 (2.7%) |
Time of Departure to Work by Sex in Wakulla County
The most frequent times of departure to work in Wakulla County are 7:00 AM to 7:29 AM (1,567, 19.6%) for males and 7:00 AM to 7:29 AM (1,372, 22.3%) for females.
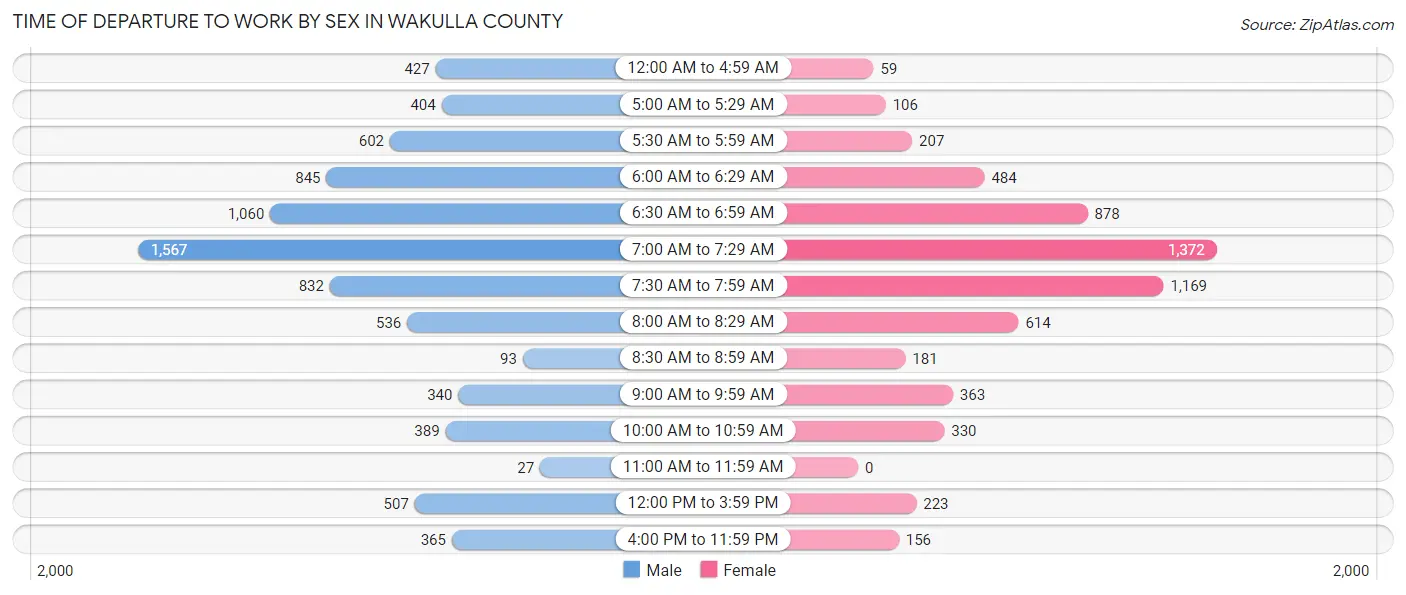
| Time of Departure | Male | Female |
| 12:00 AM to 4:59 AM | 427 (5.3%) | 59 (1.0%) |
| 5:00 AM to 5:29 AM | 404 (5.1%) | 106 (1.7%) |
| 5:30 AM to 5:59 AM | 602 (7.5%) | 207 (3.4%) |
| 6:00 AM to 6:29 AM | 845 (10.6%) | 484 (7.9%) |
| 6:30 AM to 6:59 AM | 1,060 (13.3%) | 878 (14.3%) |
| 7:00 AM to 7:29 AM | 1,567 (19.6%) | 1,372 (22.3%) |
| 7:30 AM to 7:59 AM | 832 (10.4%) | 1,169 (19.0%) |
| 8:00 AM to 8:29 AM | 536 (6.7%) | 614 (10.0%) |
| 8:30 AM to 8:59 AM | 93 (1.2%) | 181 (2.9%) |
| 9:00 AM to 9:59 AM | 340 (4.3%) | 363 (5.9%) |
| 10:00 AM to 10:59 AM | 389 (4.9%) | 330 (5.4%) |
| 11:00 AM to 11:59 AM | 27 (0.3%) | 0 (0.0%) |
| 12:00 PM to 3:59 PM | 507 (6.3%) | 223 (3.6%) |
| 4:00 PM to 11:59 PM | 365 (4.6%) | 156 (2.5%) |
| Total | 7,994 (100.0%) | 6,142 (100.0%) |
Housing Occupancy in Wakulla County
Occupancy by Ownership in Wakulla County
Of the total 11,932 dwellings in Wakulla County, owner-occupied units account for 9,687 (81.2%), while renter-occupied units make up 2,245 (18.8%).
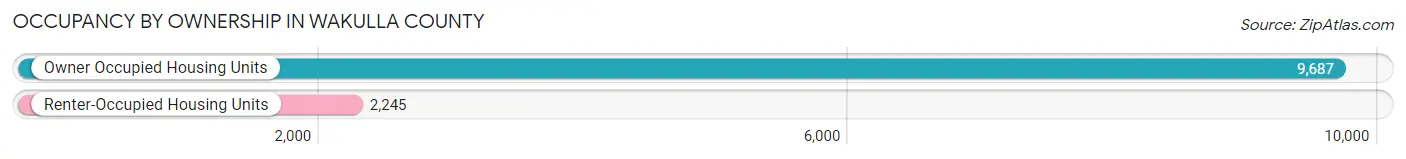
| Occupancy | # Housing Units | % Housing Units |
| Owner Occupied Housing Units | 9,687 | 81.2% |
| Renter-Occupied Housing Units | 2,245 | 18.8% |
| Total Occupied Housing Units | 11,932 | 100.0% |
Occupancy by Household Size in Wakulla County
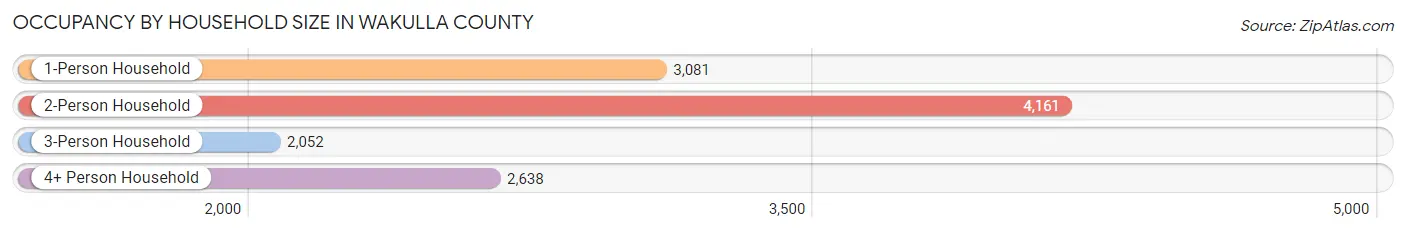
| Household Size | # Housing Units | % Housing Units |
| 1-Person Household | 3,081 | 25.8% |
| 2-Person Household | 4,161 | 34.9% |
| 3-Person Household | 2,052 | 17.2% |
| 4+ Person Household | 2,638 | 22.1% |
| Total Housing Units | 11,932 | 100.0% |
Occupancy by Ownership by Household Size in Wakulla County
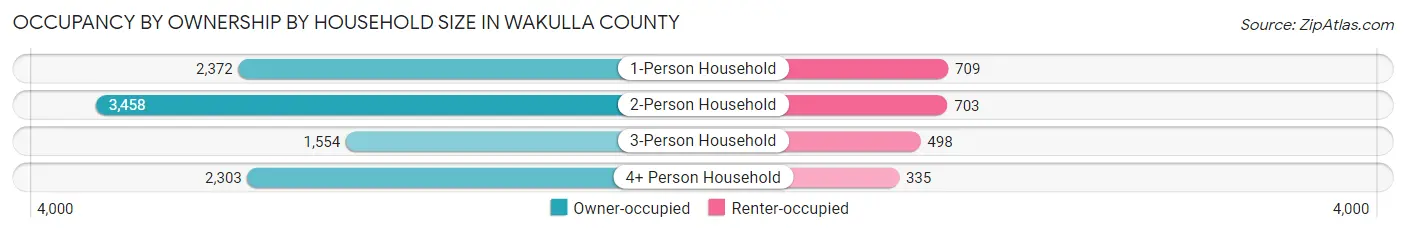
| Household Size | Owner-occupied | Renter-occupied |
| 1-Person Household | 2,372 (77.0%) | 709 (23.0%) |
| 2-Person Household | 3,458 (83.1%) | 703 (16.9%) |
| 3-Person Household | 1,554 (75.7%) | 498 (24.3%) |
| 4+ Person Household | 2,303 (87.3%) | 335 (12.7%) |
| Total Housing Units | 9,687 (81.2%) | 2,245 (18.8%) |
Occupancy by Educational Attainment in Wakulla County
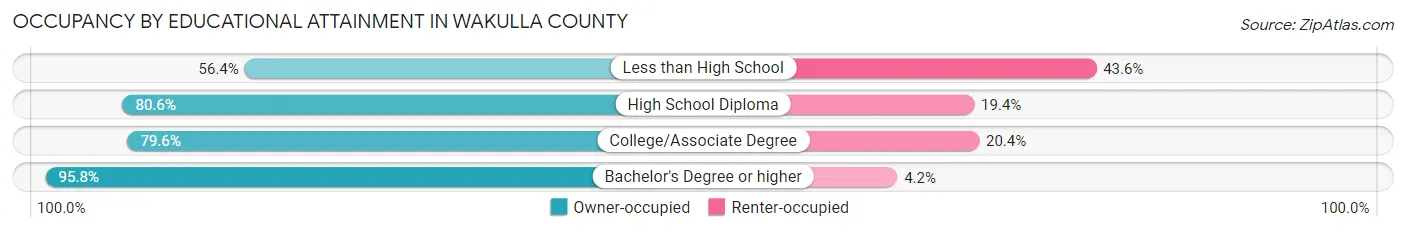
| Household Size | Owner-occupied | Renter-occupied |
| Less than High School | 548 (56.4%) | 424 (43.6%) |
| High School Diploma | 3,201 (80.6%) | 772 (19.4%) |
| College/Associate Degree | 3,714 (79.6%) | 952 (20.4%) |
| Bachelor's Degree or higher | 2,224 (95.8%) | 97 (4.2%) |
Occupancy by Age of Householder in Wakulla County
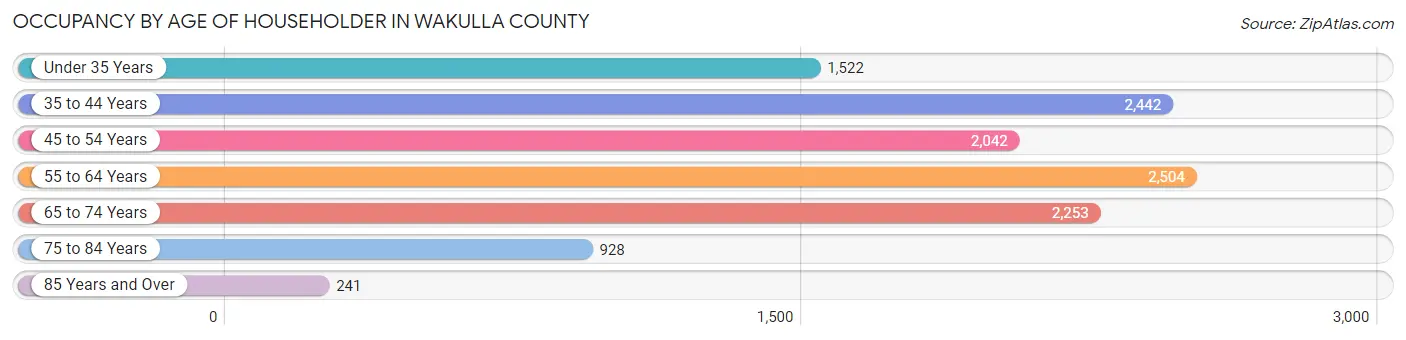
| Age Bracket | # Households | % Households |
| Under 35 Years | 1,522 | 12.8% |
| 35 to 44 Years | 2,442 | 20.5% |
| 45 to 54 Years | 2,042 | 17.1% |
| 55 to 64 Years | 2,504 | 21.0% |
| 65 to 74 Years | 2,253 | 18.9% |
| 75 to 84 Years | 928 | 7.8% |
| 85 Years and Over | 241 | 2.0% |
| Total | 11,932 | 100.0% |
Housing Finances in Wakulla County
Median Income by Occupancy in Wakulla County
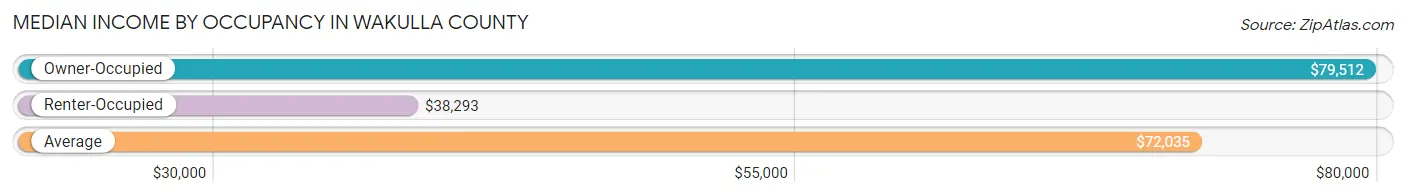
| Occupancy Type | # Households | Median Income |
| Owner-Occupied | 9,687 (81.2%) | $79,512 |
| Renter-Occupied | 2,245 (18.8%) | $38,293 |
| Average | 11,932 (100.0%) | $72,035 |
Occupancy by Householder Income Bracket in Wakulla County
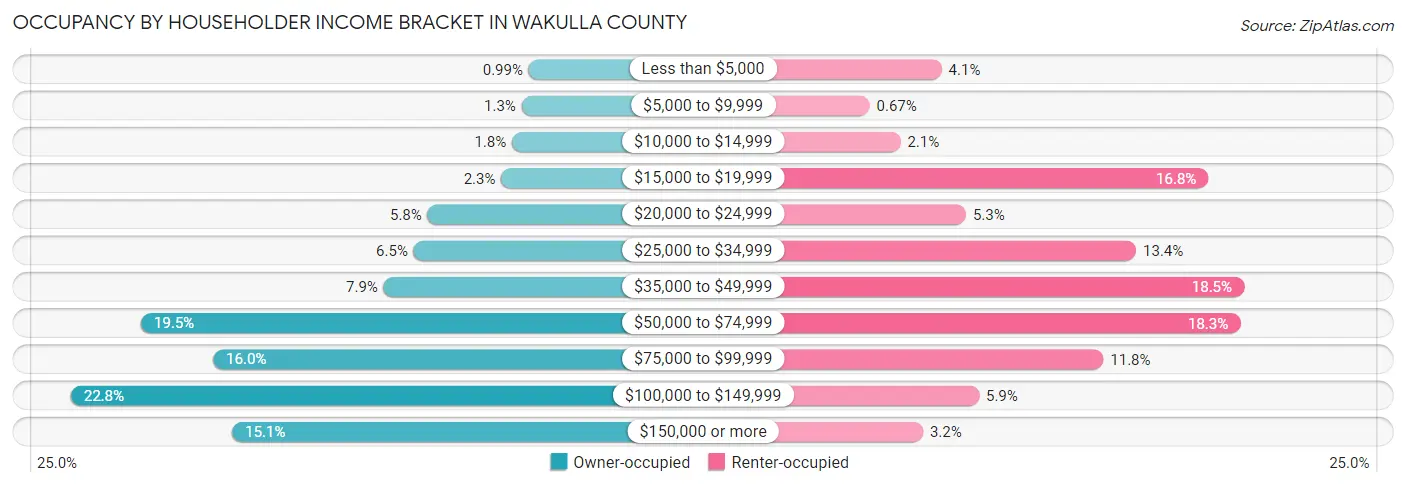
| Income Bracket | Owner-occupied | Renter-occupied |
| Less than $5,000 | 96 (1.0%) | 92 (4.1%) |
| $5,000 to $9,999 | 129 (1.3%) | 15 (0.7%) |
| $10,000 to $14,999 | 173 (1.8%) | 48 (2.1%) |
| $15,000 to $19,999 | 223 (2.3%) | 377 (16.8%) |
| $20,000 to $24,999 | 563 (5.8%) | 118 (5.3%) |
| $25,000 to $34,999 | 627 (6.5%) | 300 (13.4%) |
| $35,000 to $49,999 | 765 (7.9%) | 415 (18.5%) |
| $50,000 to $74,999 | 1,885 (19.5%) | 411 (18.3%) |
| $75,000 to $99,999 | 1,552 (16.0%) | 265 (11.8%) |
| $100,000 to $149,999 | 2,209 (22.8%) | 132 (5.9%) |
| $150,000 or more | 1,465 (15.1%) | 72 (3.2%) |
| Total | 9,687 (100.0%) | 2,245 (100.0%) |
Monthly Housing Cost Tiers in Wakulla County
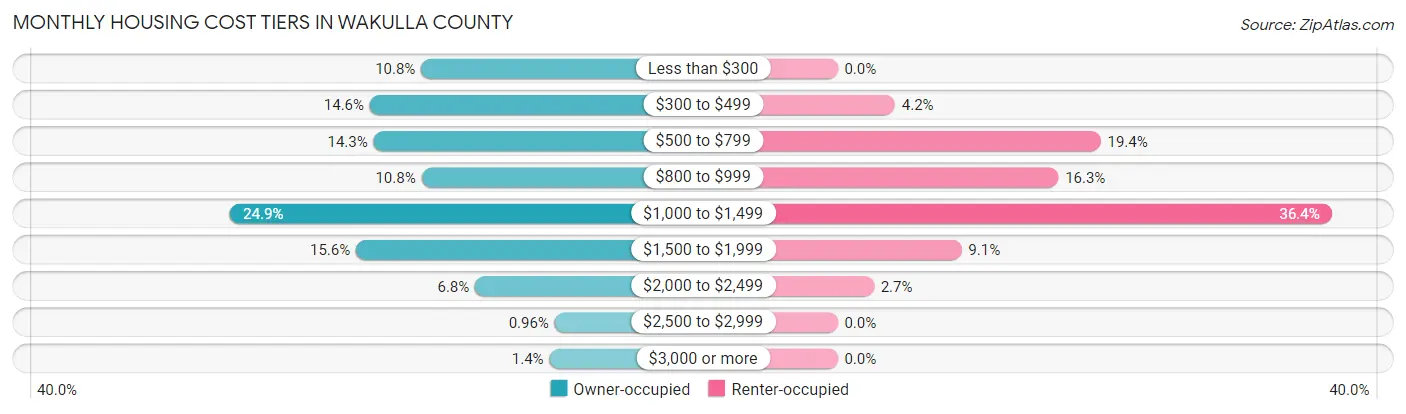
| Monthly Cost | Owner-occupied | Renter-occupied |
| Less than $300 | 1,045 (10.8%) | 0 (0.0%) |
| $300 to $499 | 1,411 (14.6%) | 95 (4.2%) |
| $500 to $799 | 1,385 (14.3%) | 435 (19.4%) |
| $800 to $999 | 1,043 (10.8%) | 365 (16.3%) |
| $1,000 to $1,499 | 2,408 (24.9%) | 817 (36.4%) |
| $1,500 to $1,999 | 1,510 (15.6%) | 205 (9.1%) |
| $2,000 to $2,499 | 661 (6.8%) | 60 (2.7%) |
| $2,500 to $2,999 | 93 (1.0%) | 0 (0.0%) |
| $3,000 or more | 131 (1.3%) | 0 (0.0%) |
| Total | 9,687 (100.0%) | 2,245 (100.0%) |
Physical Housing Characteristics in Wakulla County
Housing Structures in Wakulla County
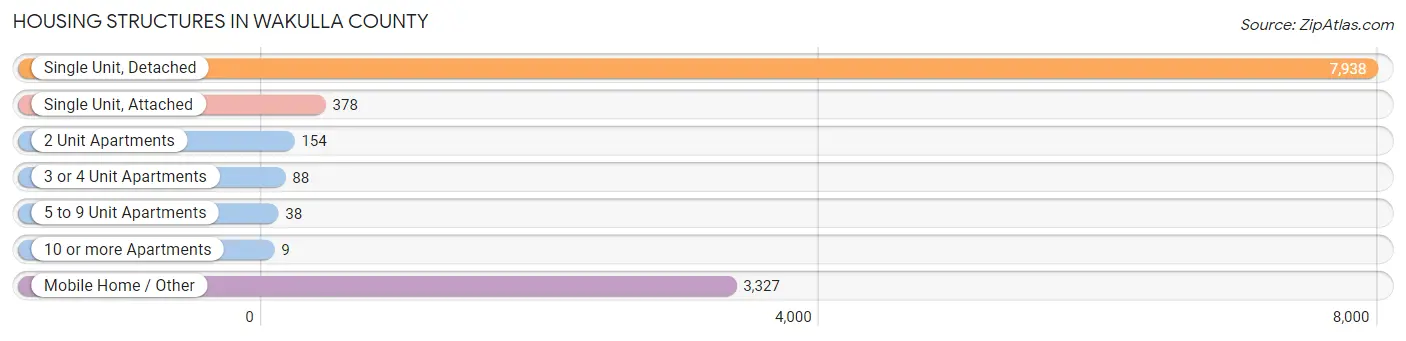
| Structure Type | # Housing Units | % Housing Units |
| Single Unit, Detached | 7,938 | 66.5% |
| Single Unit, Attached | 378 | 3.2% |
| 2 Unit Apartments | 154 | 1.3% |
| 3 or 4 Unit Apartments | 88 | 0.7% |
| 5 to 9 Unit Apartments | 38 | 0.3% |
| 10 or more Apartments | 9 | 0.1% |
| Mobile Home / Other | 3,327 | 27.9% |
| Total | 11,932 | 100.0% |
Housing Structures by Occupancy in Wakulla County
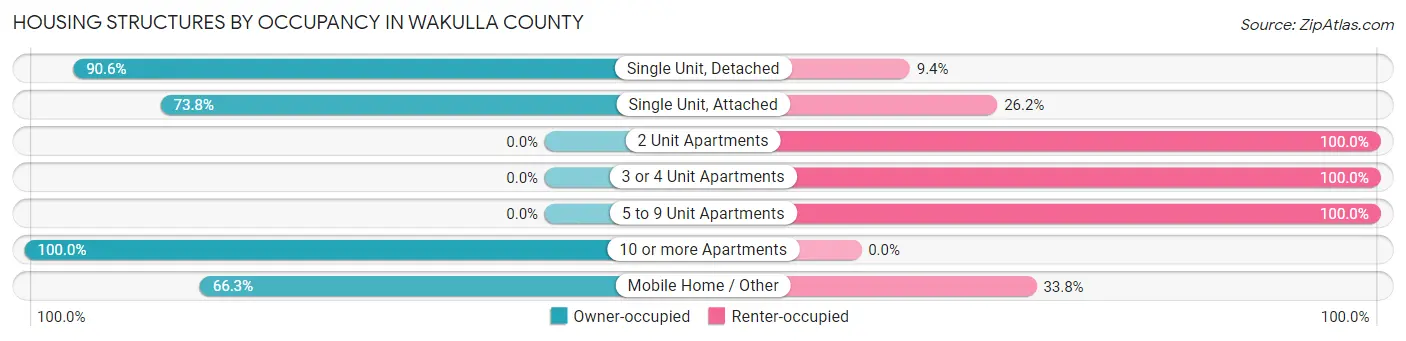
| Structure Type | Owner-occupied | Renter-occupied |
| Single Unit, Detached | 7,195 (90.6%) | 743 (9.4%) |
| Single Unit, Attached | 279 (73.8%) | 99 (26.2%) |
| 2 Unit Apartments | 0 (0.0%) | 154 (100.0%) |
| 3 or 4 Unit Apartments | 0 (0.0%) | 88 (100.0%) |
| 5 to 9 Unit Apartments | 0 (0.0%) | 38 (100.0%) |
| 10 or more Apartments | 9 (100.0%) | 0 (0.0%) |
| Mobile Home / Other | 2,204 (66.2%) | 1,123 (33.8%) |
| Total | 9,687 (81.2%) | 2,245 (18.8%) |
Housing Structures by Number of Rooms in Wakulla County
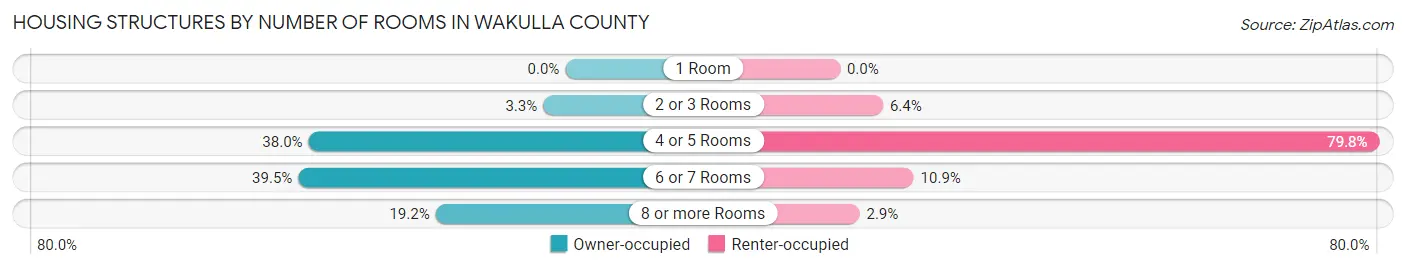
| Number of Rooms | Owner-occupied | Renter-occupied |
| 1 Room | 0 (0.0%) | 0 (0.0%) |
| 2 or 3 Rooms | 318 (3.3%) | 143 (6.4%) |
| 4 or 5 Rooms | 3,681 (38.0%) | 1,792 (79.8%) |
| 6 or 7 Rooms | 3,828 (39.5%) | 245 (10.9%) |
| 8 or more Rooms | 1,860 (19.2%) | 65 (2.9%) |
| Total | 9,687 (100.0%) | 2,245 (100.0%) |
Housing Structure by Heating Type in Wakulla County
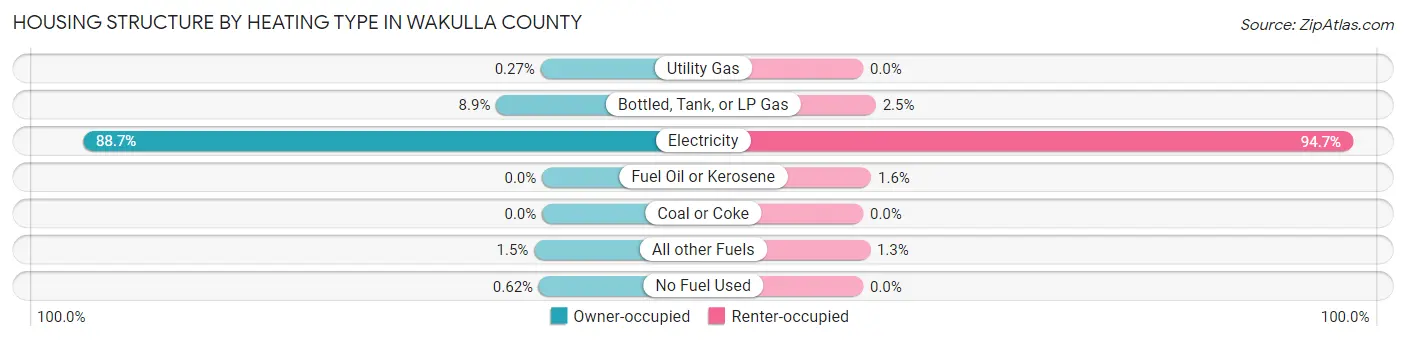
| Heating Type | Owner-occupied | Renter-occupied |
| Utility Gas | 26 (0.3%) | 0 (0.0%) |
| Bottled, Tank, or LP Gas | 858 (8.9%) | 55 (2.5%) |
| Electricity | 8,595 (88.7%) | 2,125 (94.7%) |
| Fuel Oil or Kerosene | 0 (0.0%) | 35 (1.6%) |
| Coal or Coke | 0 (0.0%) | 0 (0.0%) |
| All other Fuels | 148 (1.5%) | 30 (1.3%) |
| No Fuel Used | 60 (0.6%) | 0 (0.0%) |
| Total | 9,687 (100.0%) | 2,245 (100.0%) |
Household Vehicle Usage in Wakulla County
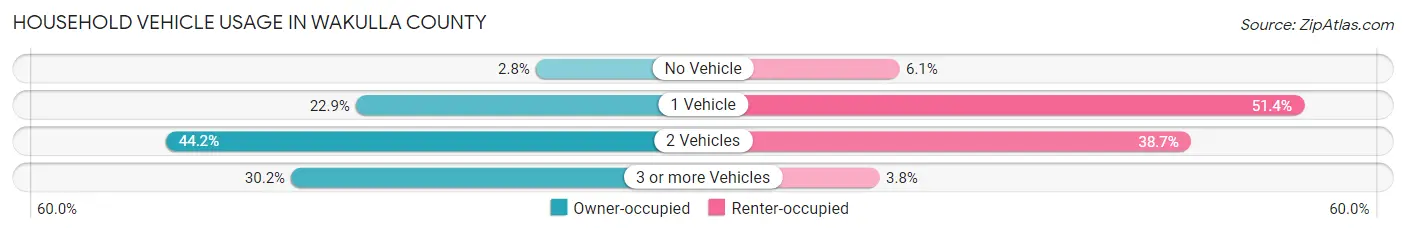
| Vehicles per Household | Owner-occupied | Renter-occupied |
| No Vehicle | 266 (2.8%) | 136 (6.1%) |
| 1 Vehicle | 2,219 (22.9%) | 1,154 (51.4%) |
| 2 Vehicles | 4,279 (44.2%) | 869 (38.7%) |
| 3 or more Vehicles | 2,923 (30.2%) | 86 (3.8%) |
| Total | 9,687 (100.0%) | 2,245 (100.0%) |
Real Estate & Mortgages in Wakulla County
Real Estate and Mortgage Overview in Wakulla County
| Characteristic | Without Mortgage | With Mortgage |
| Housing Units | 3,887 | 5,800 |
| Median Property Value | $167,700 | $213,800 |
| Median Household Income | $67,409 | $1,016 |
| Monthly Housing Costs | $409 | $131 |
| Real Estate Taxes | $1,177 | $205 |
Property Value by Mortgage Status in Wakulla County
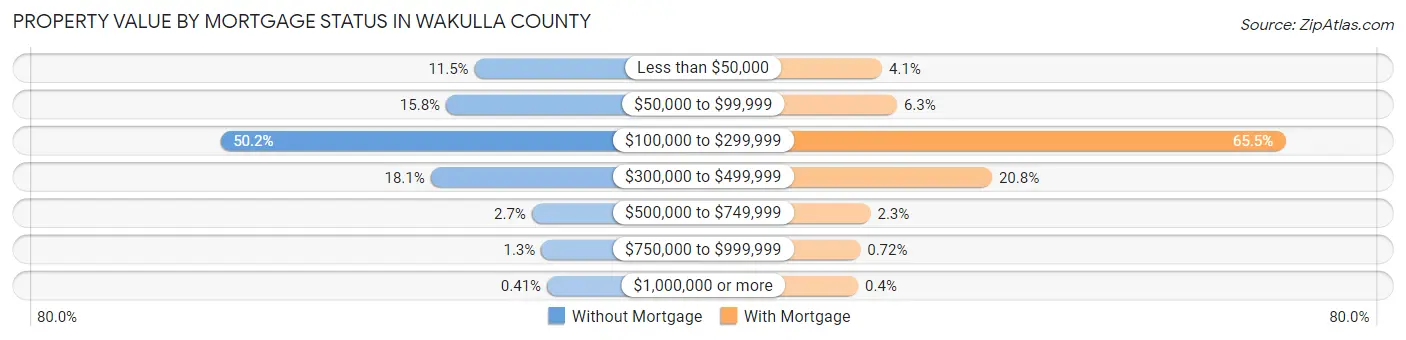
| Property Value | Without Mortgage | With Mortgage |
| Less than $50,000 | 445 (11.5%) | 235 (4.1%) |
| $50,000 to $99,999 | 614 (15.8%) | 366 (6.3%) |
| $100,000 to $299,999 | 1,951 (50.2%) | 3,796 (65.4%) |
| $300,000 to $499,999 | 705 (18.1%) | 1,206 (20.8%) |
| $500,000 to $749,999 | 106 (2.7%) | 132 (2.3%) |
| $750,000 to $999,999 | 50 (1.3%) | 42 (0.7%) |
| $1,000,000 or more | 16 (0.4%) | 23 (0.4%) |
| Total | 3,887 (100.0%) | 5,800 (100.0%) |
Household Income by Mortgage Status in Wakulla County
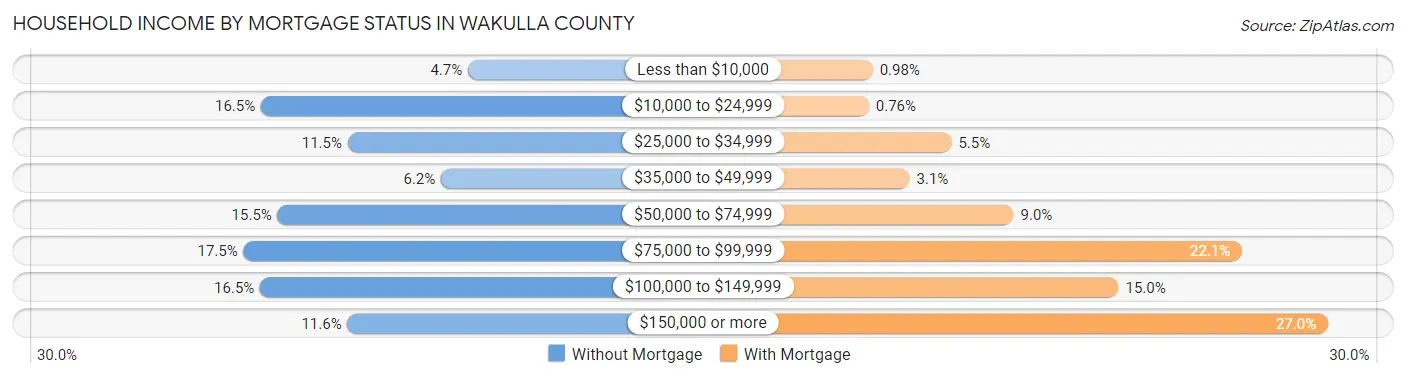
| Household Income | Without Mortgage | With Mortgage |
| Less than $10,000 | 181 (4.7%) | 57 (1.0%) |
| $10,000 to $24,999 | 641 (16.5%) | 44 (0.8%) |
| $25,000 to $34,999 | 448 (11.5%) | 318 (5.5%) |
| $35,000 to $49,999 | 241 (6.2%) | 179 (3.1%) |
| $50,000 to $74,999 | 604 (15.5%) | 524 (9.0%) |
| $75,000 to $99,999 | 680 (17.5%) | 1,281 (22.1%) |
| $100,000 to $149,999 | 643 (16.5%) | 872 (15.0%) |
| $150,000 or more | 449 (11.6%) | 1,566 (27.0%) |
| Total | 3,887 (100.0%) | 5,800 (100.0%) |
Property Value to Household Income Ratio in Wakulla County
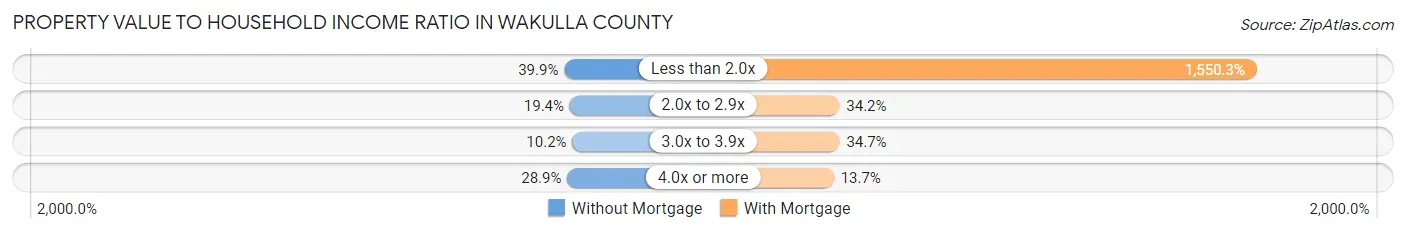
| Value-to-Income Ratio | Without Mortgage | With Mortgage |
| Less than 2.0x | 1,552 (39.9%) | 89,918 (1,550.3%) |
| 2.0x to 2.9x | 753 (19.4%) | 1,985 (34.2%) |
| 3.0x to 3.9x | 396 (10.2%) | 2,010 (34.7%) |
| 4.0x or more | 1,123 (28.9%) | 795 (13.7%) |
| Total | 3,887 (100.0%) | 5,800 (100.0%) |
Real Estate Taxes by Mortgage Status in Wakulla County
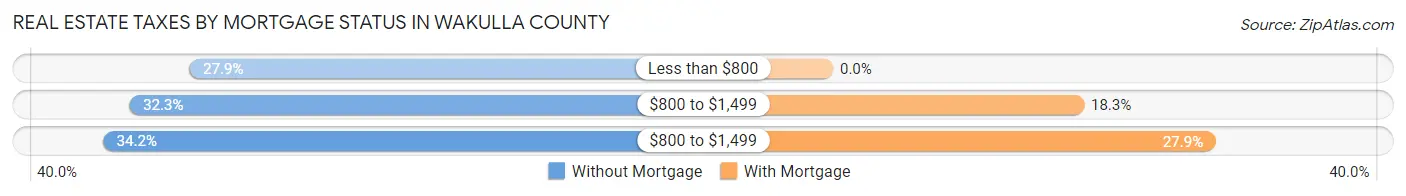
| Property Taxes | Without Mortgage | With Mortgage |
| Less than $800 | 1,085 (27.9%) | 0 (0.0%) |
| $800 to $1,499 | 1,255 (32.3%) | 1,064 (18.3%) |
| $800 to $1,499 | 1,330 (34.2%) | 1,618 (27.9%) |
| Total | 3,887 (100.0%) | 5,800 (100.0%) |
Health & Disability in Wakulla County
Health Insurance Coverage by Age in Wakulla County
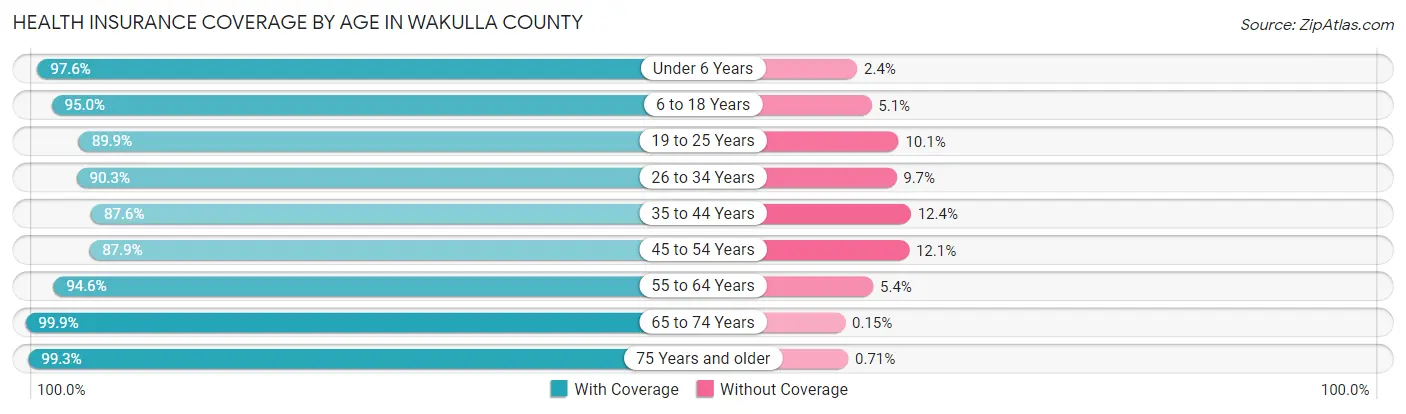
| Age Bracket | With Coverage | Without Coverage |
| Under 6 Years | 2,045 (97.6%) | 50 (2.4%) |
| 6 to 18 Years | 4,927 (95.0%) | 262 (5.1%) |
| 19 to 25 Years | 2,001 (89.9%) | 225 (10.1%) |
| 26 to 34 Years | 2,815 (90.3%) | 302 (9.7%) |
| 35 to 44 Years | 3,909 (87.6%) | 553 (12.4%) |
| 45 to 54 Years | 3,850 (87.9%) | 528 (12.1%) |
| 55 to 64 Years | 3,999 (94.6%) | 227 (5.4%) |
| 65 to 74 Years | 3,315 (99.9%) | 5 (0.2%) |
| 75 Years and older | 1,820 (99.3%) | 13 (0.7%) |
| Total | 28,681 (93.0%) | 2,165 (7.0%) |
Health Insurance Coverage by Citizenship Status in Wakulla County
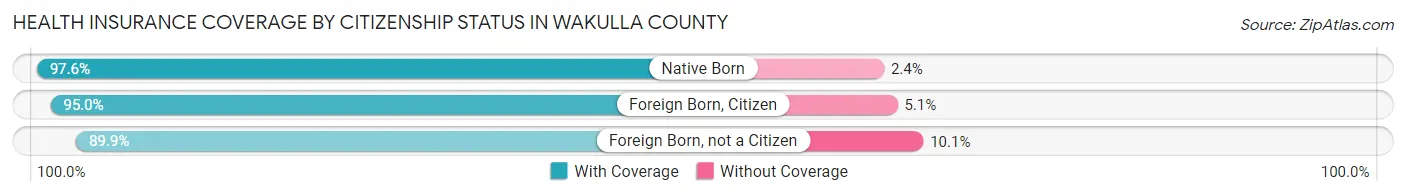
| Citizenship Status | With Coverage | Without Coverage |
| Native Born | 2,045 (97.6%) | 50 (2.4%) |
| Foreign Born, Citizen | 4,927 (95.0%) | 262 (5.1%) |
| Foreign Born, not a Citizen | 2,001 (89.9%) | 225 (10.1%) |
Health Insurance Coverage by Household Income in Wakulla County
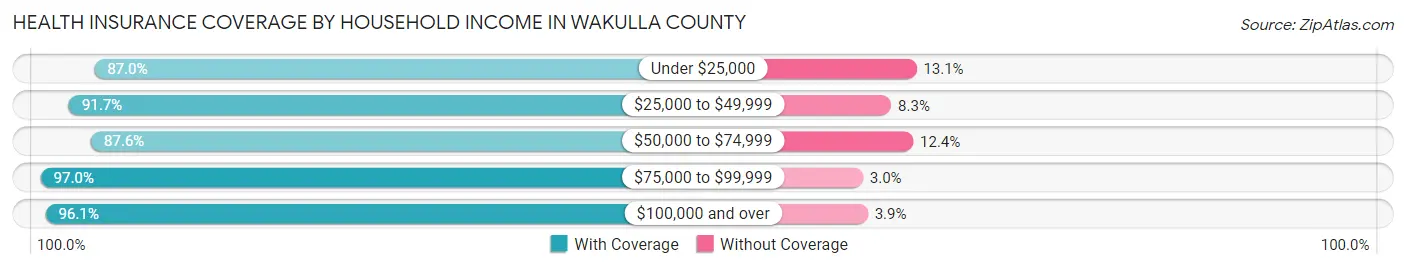
| Household Income | With Coverage | Without Coverage |
| Under $25,000 | 2,491 (87.0%) | 374 (13.1%) |
| $25,000 to $49,999 | 4,094 (91.7%) | 371 (8.3%) |
| $50,000 to $74,999 | 5,462 (87.6%) | 775 (12.4%) |
| $75,000 to $99,999 | 4,666 (97.0%) | 145 (3.0%) |
| $100,000 and over | 11,951 (96.1%) | 487 (3.9%) |
Public vs Private Health Insurance Coverage by Age in Wakulla County
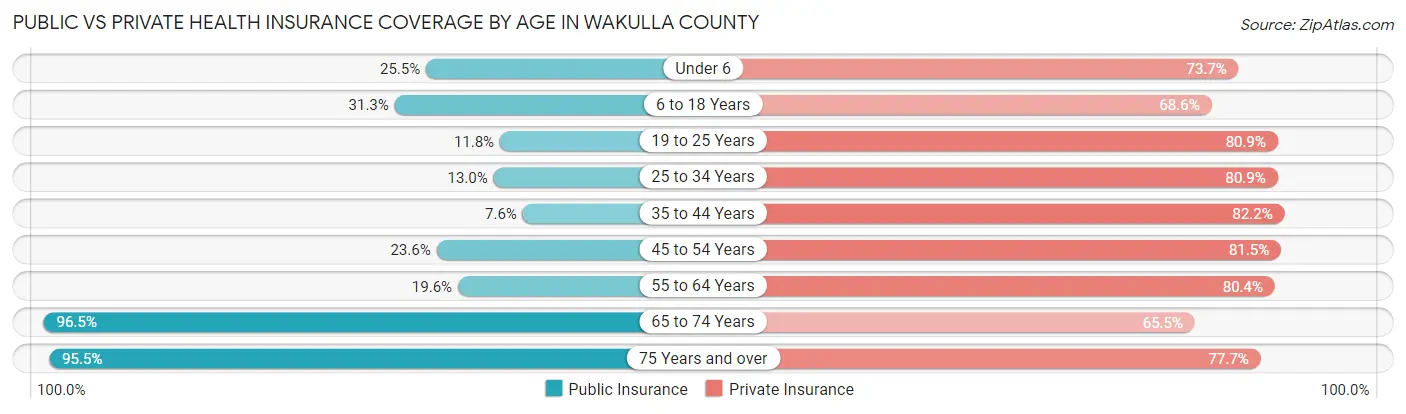
| Age Bracket | Public Insurance | Private Insurance |
| Under 6 | 534 (25.5%) | 1,543 (73.7%) |
| 6 to 18 Years | 1,625 (31.3%) | 3,560 (68.6%) |
| 19 to 25 Years | 262 (11.8%) | 1,801 (80.9%) |
| 25 to 34 Years | 404 (13.0%) | 2,521 (80.9%) |
| 35 to 44 Years | 337 (7.5%) | 3,667 (82.2%) |
| 45 to 54 Years | 1,031 (23.5%) | 3,569 (81.5%) |
| 55 to 64 Years | 827 (19.6%) | 3,396 (80.4%) |
| 65 to 74 Years | 3,203 (96.5%) | 2,175 (65.5%) |
| 75 Years and over | 1,750 (95.5%) | 1,425 (77.7%) |
| Total | 9,973 (32.3%) | 23,657 (76.7%) |
Disability Status by Sex by Age in Wakulla County
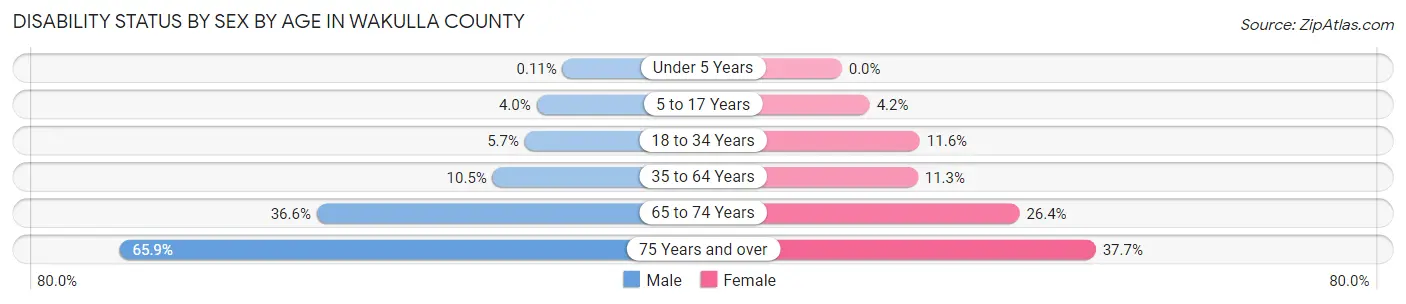
| Age Bracket | Male | Female |
| Under 5 Years | 1 (0.1%) | 0 (0.0%) |
| 5 to 17 Years | 111 (4.0%) | 106 (4.2%) |
| 18 to 34 Years | 172 (5.7%) | 310 (11.6%) |
| 35 to 64 Years | 697 (10.5%) | 725 (11.3%) |
| 65 to 74 Years | 591 (36.6%) | 450 (26.4%) |
| 75 Years and over | 535 (65.9%) | 385 (37.7%) |
Disability Class by Sex by Age in Wakulla County
Disability Class: Hearing Difficulty
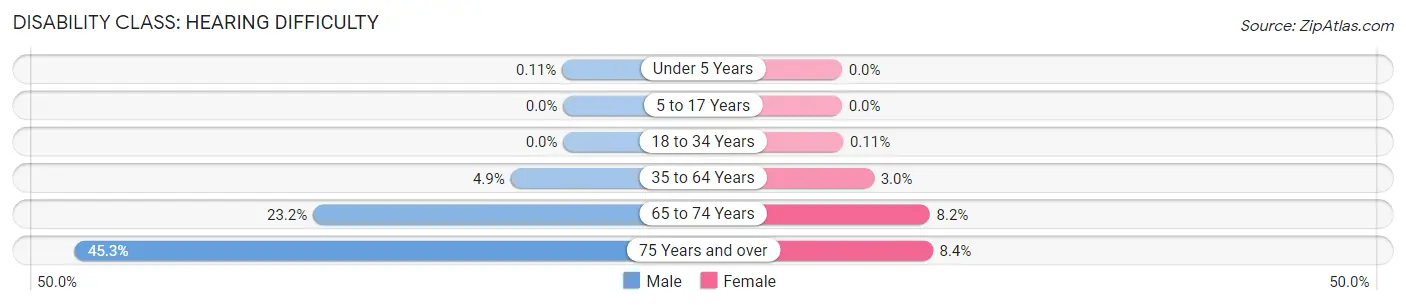
| Age Bracket | Male | Female |
| Under 5 Years | 1 (0.1%) | 0 (0.0%) |
| 5 to 17 Years | 0 (0.0%) | 0 (0.0%) |
| 18 to 34 Years | 0 (0.0%) | 3 (0.1%) |
| 35 to 64 Years | 325 (4.9%) | 190 (3.0%) |
| 65 to 74 Years | 375 (23.2%) | 139 (8.2%) |
| 75 Years and over | 368 (45.3%) | 86 (8.4%) |
Disability Class: Vision Difficulty
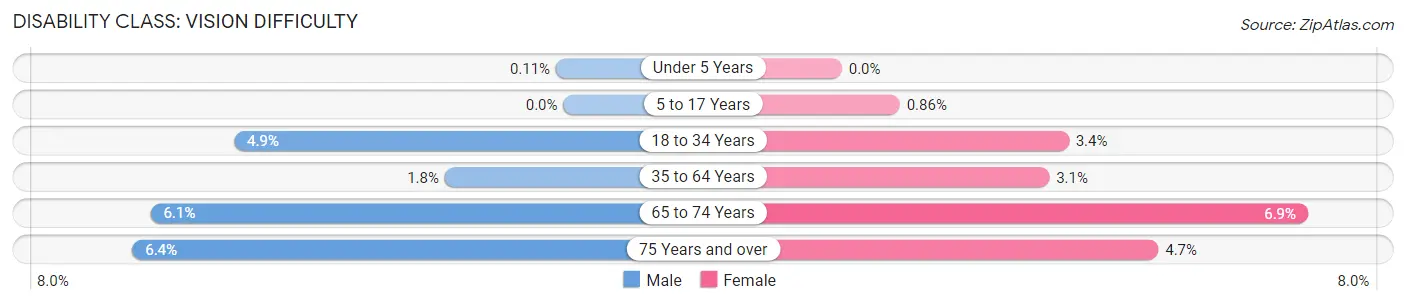
| Age Bracket | Male | Female |
| Under 5 Years | 1 (0.1%) | 0 (0.0%) |
| 5 to 17 Years | 0 (0.0%) | 22 (0.9%) |
| 18 to 34 Years | 147 (4.9%) | 90 (3.4%) |
| 35 to 64 Years | 117 (1.8%) | 198 (3.1%) |
| 65 to 74 Years | 99 (6.1%) | 118 (6.9%) |
| 75 Years and over | 52 (6.4%) | 48 (4.7%) |
Disability Class: Cognitive Difficulty
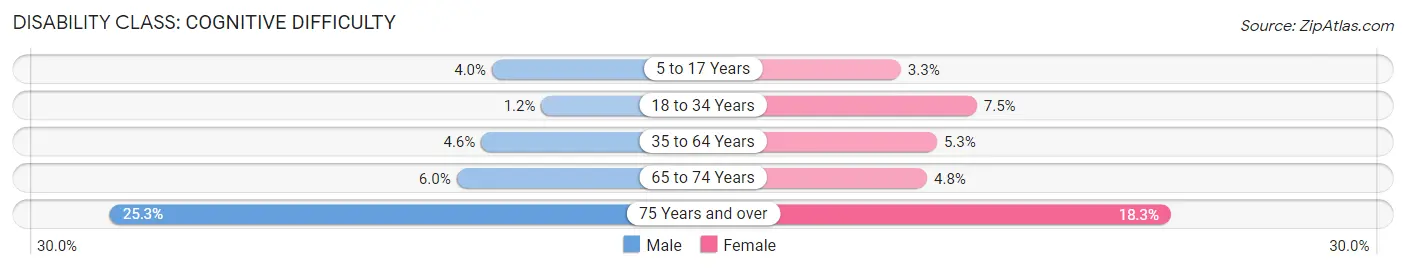
| Age Bracket | Male | Female |
| 5 to 17 Years | 111 (4.0%) | 84 (3.3%) |
| 18 to 34 Years | 37 (1.2%) | 201 (7.5%) |
| 35 to 64 Years | 304 (4.6%) | 341 (5.3%) |
| 65 to 74 Years | 96 (5.9%) | 81 (4.8%) |
| 75 Years and over | 205 (25.3%) | 187 (18.3%) |
Disability Class: Ambulatory Difficulty
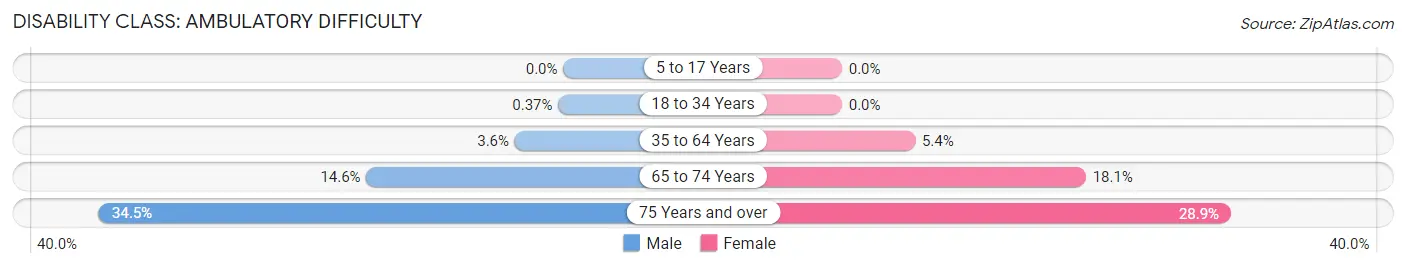
| Age Bracket | Male | Female |
| 5 to 17 Years | 0 (0.0%) | 0 (0.0%) |
| 18 to 34 Years | 11 (0.4%) | 0 (0.0%) |
| 35 to 64 Years | 239 (3.6%) | 349 (5.4%) |
| 65 to 74 Years | 236 (14.6%) | 309 (18.1%) |
| 75 Years and over | 280 (34.5%) | 295 (28.9%) |
Disability Class: Self-Care Difficulty
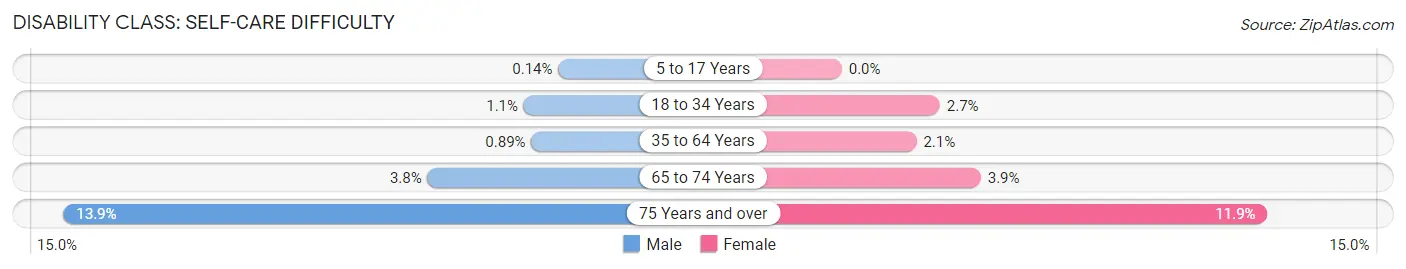
| Age Bracket | Male | Female |
| 5 to 17 Years | 4 (0.1%) | 0 (0.0%) |
| 18 to 34 Years | 33 (1.1%) | 73 (2.7%) |
| 35 to 64 Years | 59 (0.9%) | 134 (2.1%) |
| 65 to 74 Years | 61 (3.8%) | 66 (3.9%) |
| 75 Years and over | 113 (13.9%) | 121 (11.8%) |
Technology Access in Wakulla County
Computing Device Access in Wakulla County
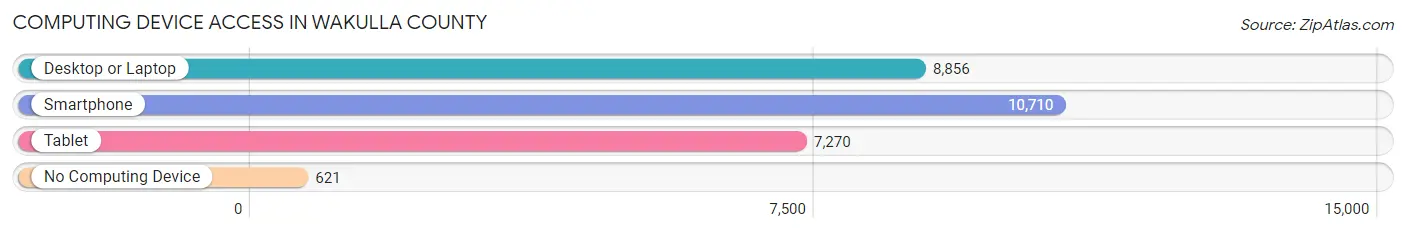
| Device Type | # Households | % Households |
| Desktop or Laptop | 8,856 | 74.2% |
| Smartphone | 10,710 | 89.8% |
| Tablet | 7,270 | 60.9% |
| No Computing Device | 621 | 5.2% |
| Total | 11,932 | 100.0% |
Internet Access in Wakulla County
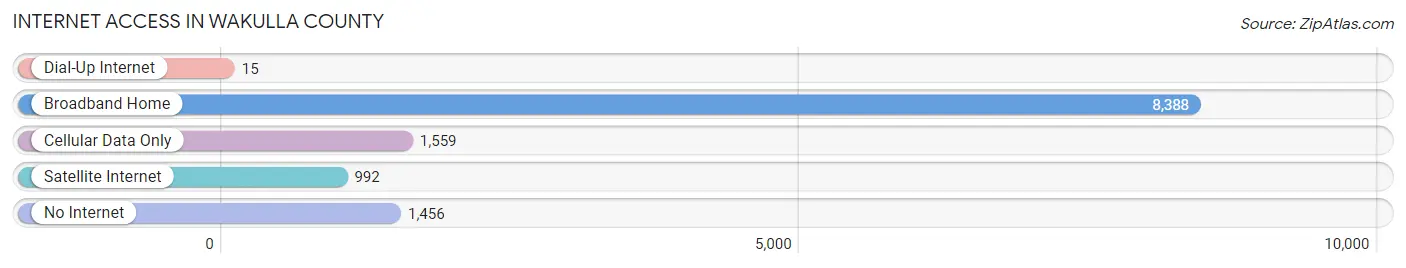
| Internet Type | # Households | % Households |
| Dial-Up Internet | 15 | 0.1% |
| Broadband Home | 8,388 | 70.3% |
| Cellular Data Only | 1,559 | 13.1% |
| Satellite Internet | 992 | 8.3% |
| No Internet | 1,456 | 12.2% |
| Total | 11,932 | 100.0% |
Wakulla County Summary
Wakulla County is located in the panhandle of Florida, and is bordered by Franklin, Liberty, Leon, and Jefferson counties. It is part of the Tallahassee Metropolitan Statistical Area. The county seat is Crawfordville, and the county has a total area of 626 square miles, of which 590 square miles is land and 36 square miles is water. The population of Wakulla County was 30,776 in the 2010 census, and the population density was 52 people per square mile.
History
The area that is now Wakulla County was inhabited by Native Americans for thousands of years before the arrival of Europeans. The Apalachee people were the dominant tribe in the area, and they were known for their advanced agricultural techniques. The first Europeans to explore the area were Spanish explorers in the 16th century. The area was part of the Spanish colony of Florida until 1821, when it became part of the United States.
In 1843, Wakulla County was created from parts of Leon and Franklin counties. It was named after the Wakulla River, which was named after the Timucuan Indian word for “spring of water”. The county seat was established in Crawfordville in 1845.
Geography
Wakulla County is located in the panhandle of Florida, and is bordered by Franklin, Liberty, Leon, and Jefferson counties. It is part of the Tallahassee Metropolitan Statistical Area. The county has a total area of 626 square miles, of which 590 square miles is land and 36 square miles is water. The county is mostly flat, with some rolling hills in the northern part. The highest point in the county is the summit of Bald Point, which is 98 feet above sea level.
The county is home to several rivers, including the Wakulla, St. Marks, Ochlockonee, and Sopchoppy. The Wakulla River is the longest river in the county, and is known for its crystal-clear waters and abundant wildlife. The St. Marks River is the second-longest river in the county, and is a popular destination for fishing and boating.
Economy
The economy of Wakulla County is largely based on agriculture and tourism. The county is home to several large farms, which produce a variety of crops, including corn, soybeans, cotton, and peanuts. The county is also home to several large timber companies, which harvest pine and cypress trees for lumber.
Tourism is also an important part of the county’s economy. The county is home to several state parks, including St. Marks National Wildlife Refuge, Wakulla Springs State Park, and Apalachicola National Forest. These parks attract visitors from all over the world, and provide a boost to the local economy.
Demographics
As of the 2010 census, the population of Wakulla County was 30,776. The population density was 52 people per square mile. The racial makeup of the county was 79.3% White, 15.7% African American, 0.4% Native American, 0.7% Asian, 0.1% Pacific Islander, 2.2% from other races, and 1.6% from two or more races. Hispanic or Latino of any race were 4.7% of the population.
The median income for a household in the county was $41,945, and the median income for a family was $50,945. The per capita income for the county was $20,945. About 13.2% of families and 17.2% of the population were below the poverty line, including 25.2% of those under age 18 and 11.2% of those age 65 or over.
Common Questions
What is Per Capita Income in Wakulla County?
Per Capita income in Wakulla County is $31,683.
What is the Median Family Income in Wakulla County?
Median Family Income in Wakulla County is $84,357.
What is the Median Household income in Wakulla County?
Median Household Income in Wakulla County is $72,035.
What is Income or Wage Gap in Wakulla County?
Income or Wage Gap in Wakulla County is 16.7%.
Women in Wakulla County earn 83.3 cents for every dollar earned by a man.
What is Family Income Deficit in Wakulla County?
Family Income Deficit in Wakulla County is $10,874.
Families that are below poverty line in Wakulla County earn $10,874 less on average than the poverty threshold level.
What is Inequality or Gini Index in Wakulla County?
Inequality or Gini Index in Wakulla County is 0.41.
What is the Total Population of Wakulla County?
Total Population of Wakulla County is 33,732.
What is the Total Male Population of Wakulla County?
Total Male Population of Wakulla County is 18,653.
What is the Total Female Population of Wakulla County?
Total Female Population of Wakulla County is 15,079.
What is the Ratio of Males per 100 Females in Wakulla County?
There are 123.70 Males per 100 Females in Wakulla County.
What is the Ratio of Females per 100 Males in Wakulla County?
There are 80.84 Females per 100 Males in Wakulla County.
What is the Median Population Age in Wakulla County?
Median Population Age in Wakulla County is 42.3 Years.
What is the Average Family Size in Wakulla County
Average Family Size in Wakulla County is 3.1 People.
What is the Average Household Size in Wakulla County
Average Household Size in Wakulla County is 2.6 People.
How Large is the Labor Force in Wakulla County?
There are 15,941 People in the Labor Forcein in Wakulla County.
What is the Percentage of People in the Labor Force in Wakulla County?
57.5% of People are in the Labor Force in Wakulla County.
What is the Unemployment Rate in Wakulla County?
Unemployment Rate in Wakulla County is 3.6%.