Union County, FL Map & Demographics
Union County Map
Union County Overview
$24,293
PER CAPITA INCOME
$73,474
AVG FAMILY INCOME
$64,043
AVG HOUSEHOLD INCOME
12.5%
WAGE / INCOME GAP [ % ]
87.5¢/ $1
WAGE / INCOME GAP [ $ ]
$17,390
FAMILY INCOME DEFICIT
0.51
INEQUALITY / GINI INDEX
15,524
TOTAL POPULATION
10,059
MALE POPULATION
5,465
FEMALE POPULATION
184.06
MALES / 100 FEMALES
54.33
FEMALES / 100 MALES
39.7
MEDIAN AGE
3.0
AVG FAMILY SIZE
2.6
AVG HOUSEHOLD SIZE
4,446
LABOR FORCE [ PEOPLE ]
35.3%
PERCENT IN LABOR FORCE
3.6%
UNEMPLOYMENT RATE
Income in Union County
Income Overview in Union County
Per Capita Income in Union County is $24,293, while median incomes of families and households are $73,474 and $64,043 respectively.
| Characteristic | Number | Measure |
| Per Capita Income | 15,524 | $24,293 |
| Median Family Income | 2,959 | $73,474 |
| Mean Family Income | 2,959 | $107,886 |
| Median Household Income | 4,094 | $64,043 |
| Mean Household Income | 4,094 | $94,886 |
| Income Deficit | 2,959 | $17,390 |
| Wage / Income Gap (%) | 15,524 | 12.48% |
| Wage / Income Gap ($) | 15,524 | 87.52¢ per $1 |
| Gini / Inequality Index | 15,524 | 0.51 |
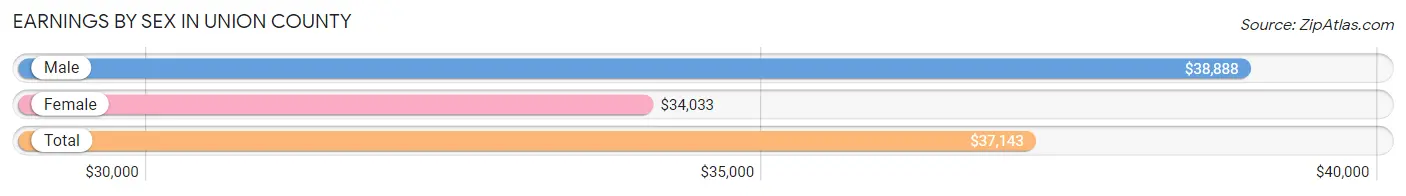
Earnings by Sex in Union County
Average Earnings in Union County are $37,143, $38,888 for men and $34,033 for women, a difference of 12.5%.
| Sex | Number | Average Earnings |
| Male | 3,375 (62.3%) | $38,888 |
| Female | 2,043 (37.7%) | $34,033 |
| Total | 5,418 (100.0%) | $37,143 |
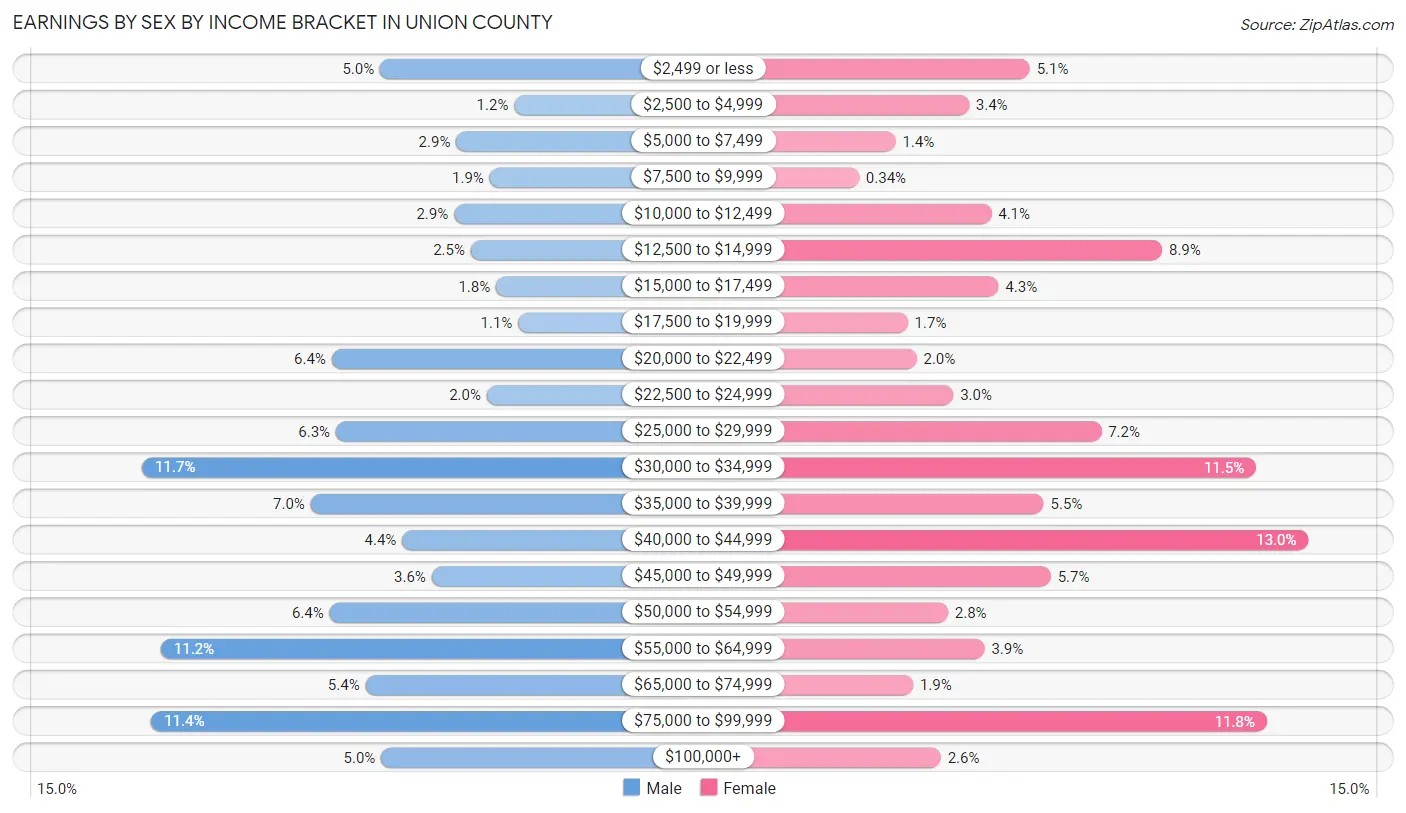
Earnings by Sex by Income Bracket in Union County
The most common earnings brackets in Union County are $30,000 to $34,999 for men (395 | 11.7%) and $40,000 to $44,999 for women (265 | 13.0%).
| Income | Male | Female |
| $2,499 or less | 169 (5.0%) | 105 (5.1%) |
| $2,500 to $4,999 | 42 (1.2%) | 70 (3.4%) |
| $5,000 to $7,499 | 97 (2.9%) | 28 (1.4%) |
| $7,500 to $9,999 | 65 (1.9%) | 7 (0.3%) |
| $10,000 to $12,499 | 99 (2.9%) | 83 (4.1%) |
| $12,500 to $14,999 | 83 (2.5%) | 181 (8.9%) |
| $15,000 to $17,499 | 59 (1.8%) | 87 (4.3%) |
| $17,500 to $19,999 | 38 (1.1%) | 35 (1.7%) |
| $20,000 to $22,499 | 215 (6.4%) | 40 (2.0%) |
| $22,500 to $24,999 | 68 (2.0%) | 61 (3.0%) |
| $25,000 to $29,999 | 211 (6.2%) | 146 (7.1%) |
| $30,000 to $34,999 | 395 (11.7%) | 235 (11.5%) |
| $35,000 to $39,999 | 235 (7.0%) | 113 (5.5%) |
| $40,000 to $44,999 | 148 (4.4%) | 265 (13.0%) |
| $45,000 to $49,999 | 120 (3.6%) | 117 (5.7%) |
| $50,000 to $54,999 | 217 (6.4%) | 58 (2.8%) |
| $55,000 to $64,999 | 377 (11.2%) | 79 (3.9%) |
| $65,000 to $74,999 | 183 (5.4%) | 38 (1.9%) |
| $75,000 to $99,999 | 386 (11.4%) | 241 (11.8%) |
| $100,000+ | 168 (5.0%) | 54 (2.6%) |
| Total | 3,375 (100.0%) | 2,043 (100.0%) |
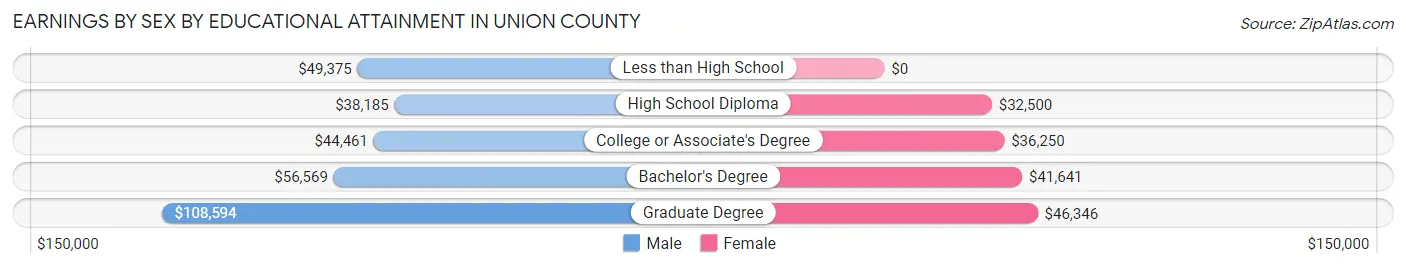
Earnings by Sex by Educational Attainment in Union County
Average earnings in Union County are $45,738 for men and $34,453 for women, a difference of 24.7%. Men with an educational attainment of graduate degree enjoy the highest average annual earnings of $108,594, while those with high school diploma education earn the least with $38,185. Women with an educational attainment of graduate degree earn the most with the average annual earnings of $46,346, while those with high school diploma education have the smallest earnings of $32,500.
| Educational Attainment | Male Income | Female Income |
| Less than High School | $49,375 | $0 |
| High School Diploma | $38,185 | $32,500 |
| College or Associate's Degree | $44,461 | $36,250 |
| Bachelor's Degree | $56,569 | $41,641 |
| Graduate Degree | $108,594 | $46,346 |
| Total | $45,738 | $34,453 |
Family Income in Union County
Family Income Brackets in Union County
According to the Union County family income data, there are 562 families falling into the $50,000 to $74,999 income range, which is the most common income bracket and makes up 19.0% of all families. Conversely, the $10,000 to $14,999 income bracket is the least frequent group with only 59 families (2.0%) belonging to this category.
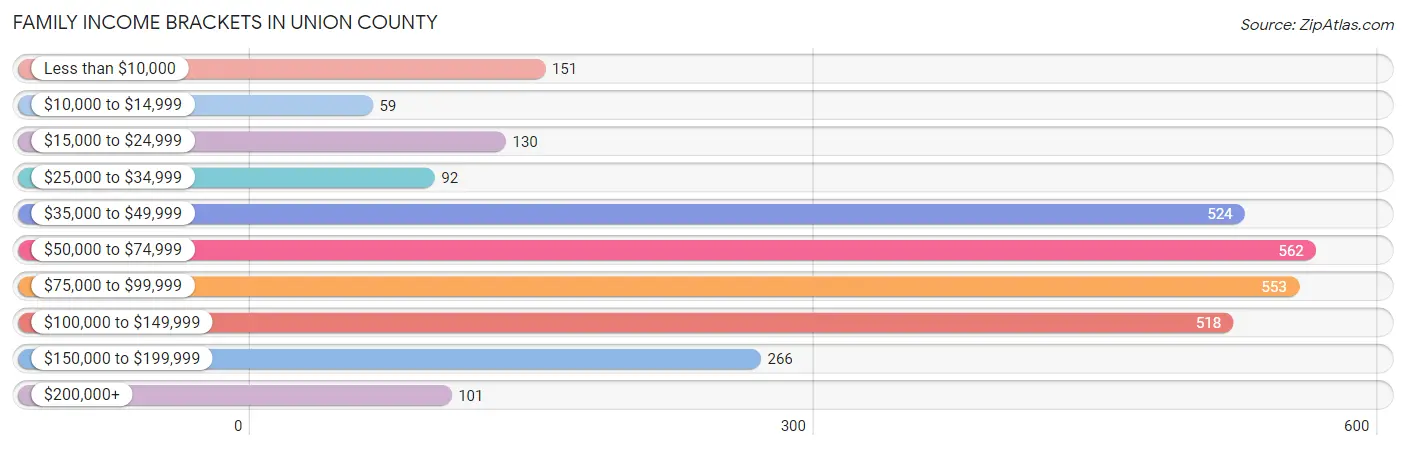
| Income Bracket | # Families | % Families |
| Less than $10,000 | 151 | 5.1% |
| $10,000 to $14,999 | 59 | 2.0% |
| $15,000 to $24,999 | 130 | 4.4% |
| $25,000 to $34,999 | 92 | 3.1% |
| $35,000 to $49,999 | 524 | 17.7% |
| $50,000 to $74,999 | 562 | 19.0% |
| $75,000 to $99,999 | 553 | 18.7% |
| $100,000 to $149,999 | 518 | 17.5% |
| $150,000 to $199,999 | 266 | 9.0% |
| $200,000+ | 101 | 3.4% |
Family Income by Famaliy Size in Union County
6-person families (131 | 4.4%) account for the highest median family income in Union County with $110,260 per family, while 2-person families (1,238 | 41.8%) have the highest median income of $34,638 per family member.
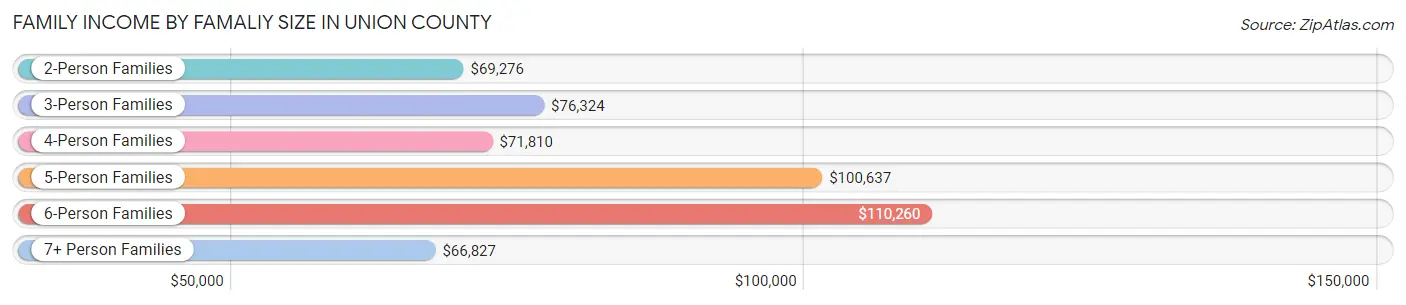
| Income Bracket | # Families | Median Income |
| 2-Person Families | 1,238 (41.8%) | $69,276 |
| 3-Person Families | 570 (19.3%) | $76,324 |
| 4-Person Families | 543 (18.3%) | $71,810 |
| 5-Person Families | 351 (11.9%) | $100,637 |
| 6-Person Families | 131 (4.4%) | $110,260 |
| 7+ Person Families | 126 (4.3%) | $66,827 |
| Total | 2,959 (100.0%) | $73,474 |
Family Income by Number of Earners in Union County
The median family income in Union County is $73,474, with families comprising 3+ earners (302) having the highest median family income of $111,500, while families with 1 earner (1,018) have the lowest median family income of $47,182, accounting for 10.2% and 34.4% of families, respectively.
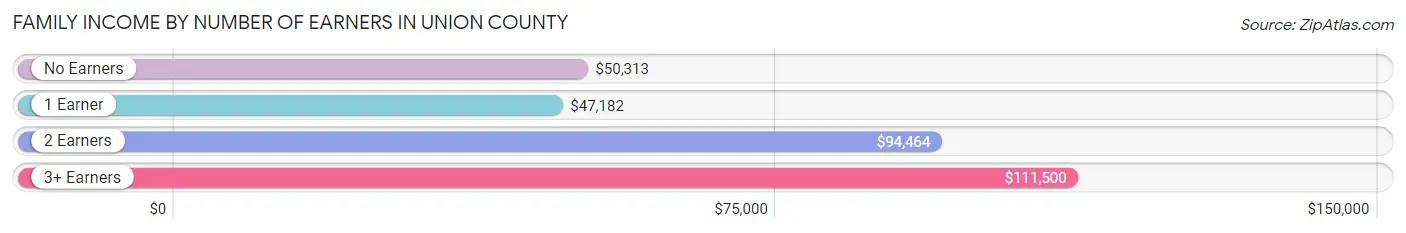
| Number of Earners | # Families | Median Income |
| No Earners | 538 (18.2%) | $50,313 |
| 1 Earner | 1,018 (34.4%) | $47,182 |
| 2 Earners | 1,101 (37.2%) | $94,464 |
| 3+ Earners | 302 (10.2%) | $111,500 |
| Total | 2,959 (100.0%) | $73,474 |
Household Income in Union County
Household Income Brackets in Union County
With 737 households falling in the category, the $35,000 to $49,999 income range is the most frequent in Union County, accounting for 18.0% of all households. In contrast, only 98 households (2.4%) fall into the $10,000 to $14,999 income bracket, making it the least populous group.
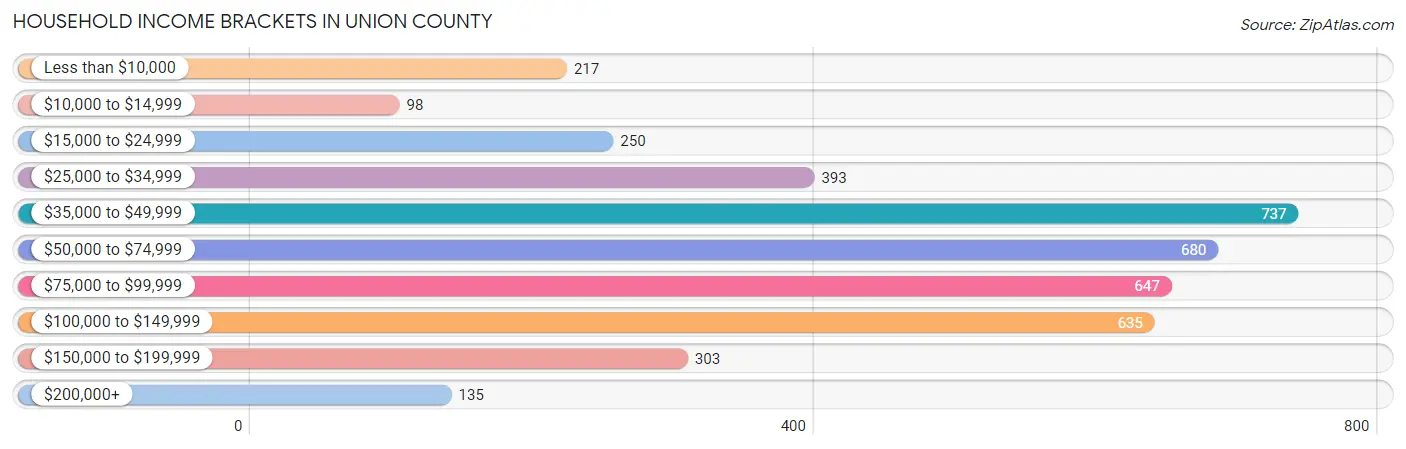
| Income Bracket | # Households | % Households |
| Less than $10,000 | 217 | 5.3% |
| $10,000 to $14,999 | 98 | 2.4% |
| $15,000 to $24,999 | 250 | 6.1% |
| $25,000 to $34,999 | 393 | 9.6% |
| $35,000 to $49,999 | 737 | 18.0% |
| $50,000 to $74,999 | 680 | 16.6% |
| $75,000 to $99,999 | 647 | 15.8% |
| $100,000 to $149,999 | 635 | 15.5% |
| $150,000 to $199,999 | 303 | 7.4% |
| $200,000+ | 135 | 3.3% |
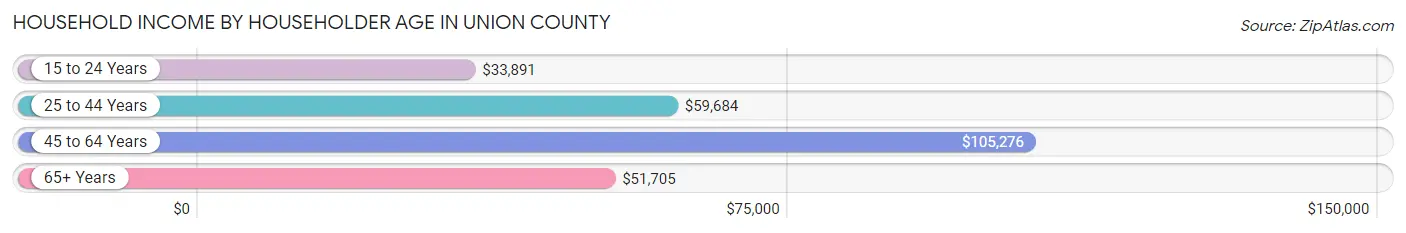
Household Income by Householder Age in Union County
The median household income in Union County is $64,043, with the highest median household income of $105,276 found in the 45 to 64 years age bracket for the primary householder. A total of 1,351 households (33.0%) fall into this category. Meanwhile, the 15 to 24 years age bracket for the primary householder has the lowest median household income of $33,891, with 328 households (8.0%) in this group.
| Income Bracket | # Households | Median Income |
| 15 to 24 Years | 328 (8.0%) | $33,891 |
| 25 to 44 Years | 1,411 (34.5%) | $59,684 |
| 45 to 64 Years | 1,351 (33.0%) | $105,276 |
| 65+ Years | 1,004 (24.5%) | $51,705 |
| Total | 4,094 (100.0%) | $64,043 |
Poverty in Union County
Income Below Poverty by Sex and Age in Union County
With 13.8% poverty level for males and 17.8% for females among the residents of Union County, 15 year old males and 5 year old females are the most vulnerable to poverty, with 67 males (71.3%) and 21 females (38.9%) in their respective age groups living below the poverty level.
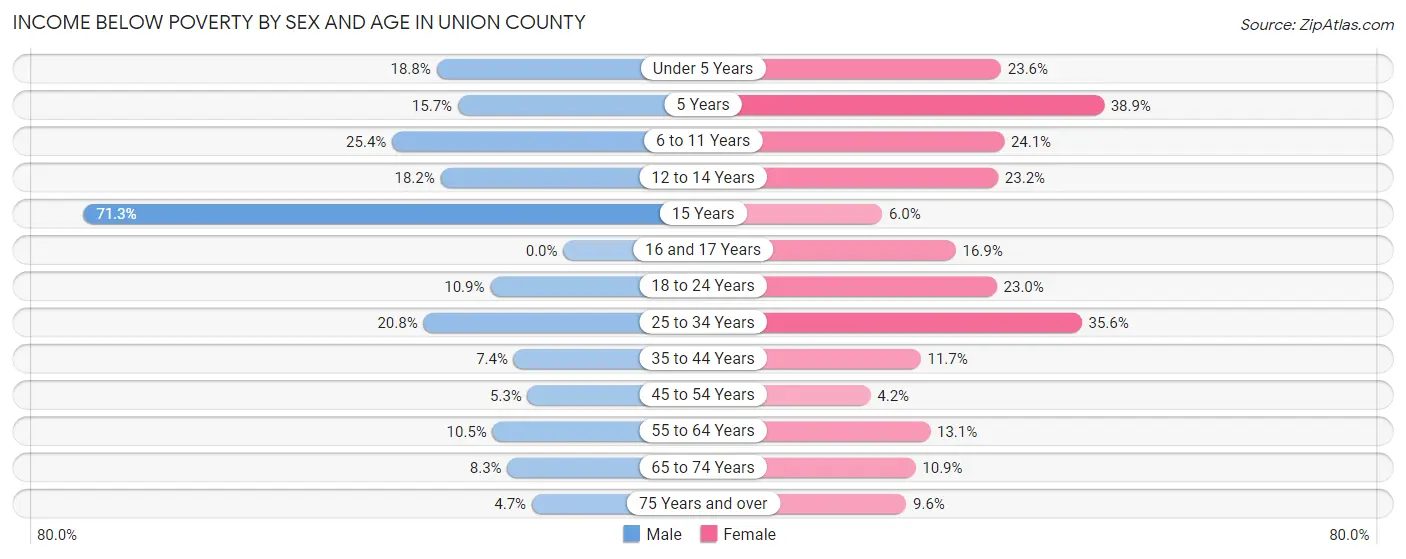
| Age Bracket | Male | Female |
| Under 5 Years | 87 (18.8%) | 90 (23.6%) |
| 5 Years | 31 (15.7%) | 21 (38.9%) |
| 6 to 11 Years | 135 (25.4%) | 151 (24.1%) |
| 12 to 14 Years | 31 (18.2%) | 51 (23.2%) |
| 15 Years | 67 (71.3%) | 4 (6.0%) |
| 16 and 17 Years | 0 (0.0%) | 38 (16.9%) |
| 18 to 24 Years | 50 (10.8%) | 83 (23.0%) |
| 25 to 34 Years | 129 (20.8%) | 246 (35.6%) |
| 35 to 44 Years | 31 (7.4%) | 70 (11.7%) |
| 45 to 54 Years | 42 (5.3%) | 22 (4.2%) |
| 55 to 64 Years | 55 (10.5%) | 77 (13.1%) |
| 65 to 74 Years | 19 (8.3%) | 63 (10.9%) |
| 75 Years and over | 14 (4.7%) | 49 (9.6%) |
| Total | 691 (13.8%) | 965 (17.8%) |
Income Above Poverty by Sex and Age in Union County
According to the poverty statistics in Union County, males aged 16 and 17 years and females aged 45 to 54 years are the age groups that are most secure financially, with 100.0% of males and 95.8% of females in these age groups living above the poverty line.
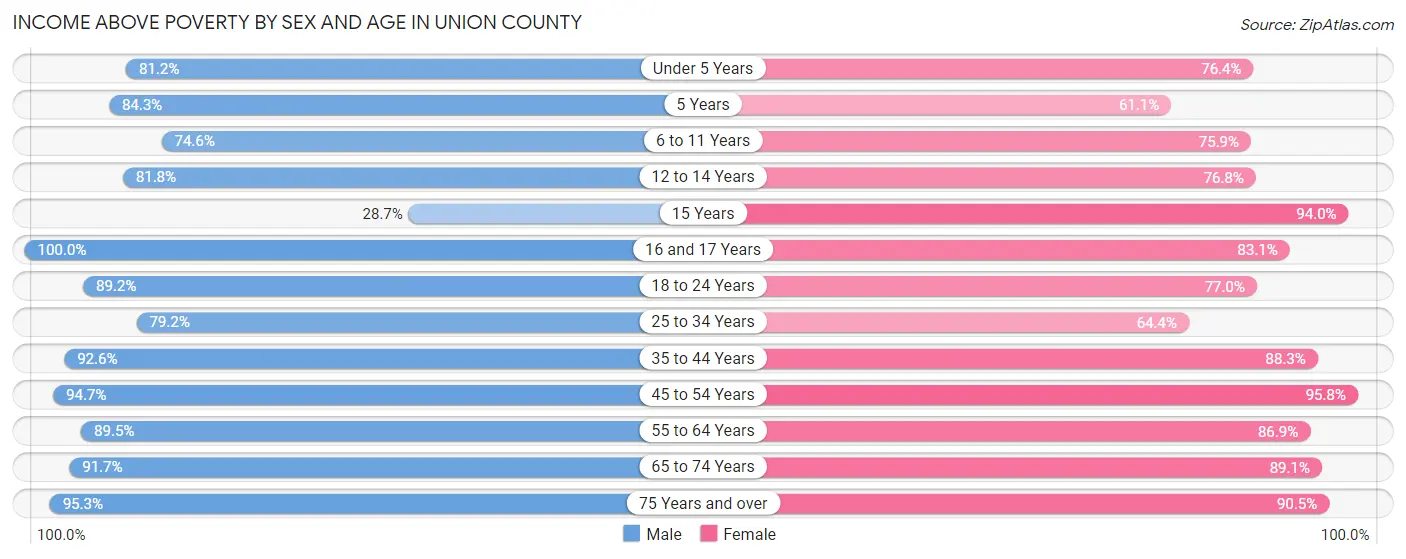
| Age Bracket | Male | Female |
| Under 5 Years | 375 (81.2%) | 291 (76.4%) |
| 5 Years | 167 (84.3%) | 33 (61.1%) |
| 6 to 11 Years | 396 (74.6%) | 476 (75.9%) |
| 12 to 14 Years | 139 (81.8%) | 169 (76.8%) |
| 15 Years | 27 (28.7%) | 63 (94.0%) |
| 16 and 17 Years | 190 (100.0%) | 187 (83.1%) |
| 18 to 24 Years | 411 (89.1%) | 278 (77.0%) |
| 25 to 34 Years | 492 (79.2%) | 445 (64.4%) |
| 35 to 44 Years | 390 (92.6%) | 529 (88.3%) |
| 45 to 54 Years | 750 (94.7%) | 497 (95.8%) |
| 55 to 64 Years | 469 (89.5%) | 511 (86.9%) |
| 65 to 74 Years | 210 (91.7%) | 514 (89.1%) |
| 75 Years and over | 286 (95.3%) | 464 (90.4%) |
| Total | 4,302 (86.2%) | 4,457 (82.2%) |
Income Below Poverty Among Married-Couple Families in Union County
The poverty statistics for married-couple families in Union County show that 5.0% or 109 of the total 2,170 families live below the poverty line. Families with 3 or 4 children have the highest poverty rate of 15.9%, comprising of 51 families. On the other hand, families with 5 or more children have the lowest poverty rate of 0.0%, which includes 0 families.
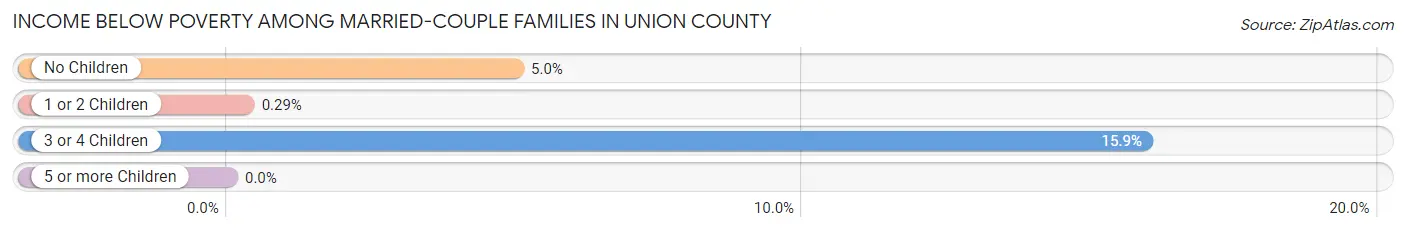
| Children | Above Poverty | Below Poverty |
| No Children | 1,069 (95.0%) | 56 (5.0%) |
| 1 or 2 Children | 676 (99.7%) | 2 (0.3%) |
| 3 or 4 Children | 269 (84.1%) | 51 (15.9%) |
| 5 or more Children | 47 (100.0%) | 0 (0.0%) |
| Total | 2,061 (95.0%) | 109 (5.0%) |
Income Below Poverty Among Single-Parent Households in Union County
According to the poverty data in Union County, 43.4% or 62 single-father households and 21.5% or 139 single-mother households are living below the poverty line. Among single-father households, those with 3 or 4 children have the highest poverty rate, with 37 households (94.9%) experiencing poverty. Likewise, among single-mother households, those with 5 or more children have the highest poverty rate, with 43 households (100.0%) falling below the poverty line.
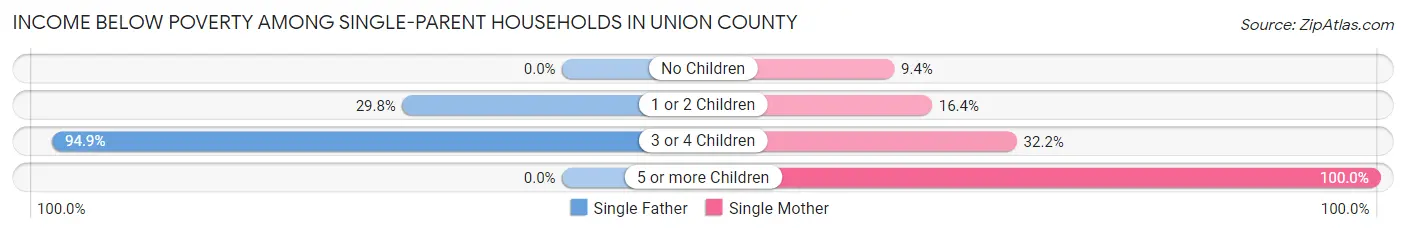
| Children | Single Father | Single Mother |
| No Children | 0 (0.0%) | 23 (9.4%) |
| 1 or 2 Children | 25 (29.8%) | 44 (16.4%) |
| 3 or 4 Children | 37 (94.9%) | 29 (32.2%) |
| 5 or more Children | 0 (0.0%) | 43 (100.0%) |
| Total | 62 (43.4%) | 139 (21.5%) |
Income Below Poverty Among Married-Couple vs Single-Parent Households in Union County
The poverty data for Union County shows that 109 of the married-couple family households (5.0%) and 201 of the single-parent households (25.5%) are living below the poverty level. Within the married-couple family households, those with 3 or 4 children have the highest poverty rate, with 51 households (15.9%) falling below the poverty line. Among the single-parent households, those with 5 or more children have the highest poverty rate, with 43 household (100.0%) living below poverty.
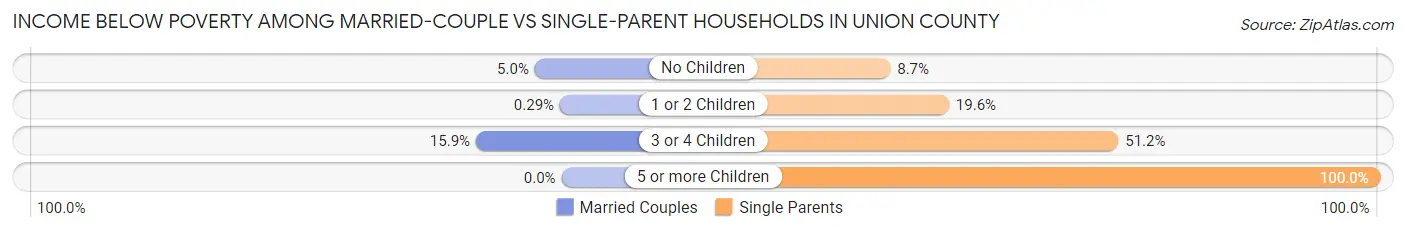
| Children | Married-Couple Families | Single-Parent Households |
| No Children | 56 (5.0%) | 23 (8.7%) |
| 1 or 2 Children | 2 (0.3%) | 69 (19.6%) |
| 3 or 4 Children | 51 (15.9%) | 66 (51.2%) |
| 5 or more Children | 0 (0.0%) | 43 (100.0%) |
| Total | 109 (5.0%) | 201 (25.5%) |
Race in Union County
The most populous races in Union County are White / Caucasian (11,408 | 73.5%), Black / African American (2,596 | 16.7%), and Two or more Races (1,328 | 8.6%).
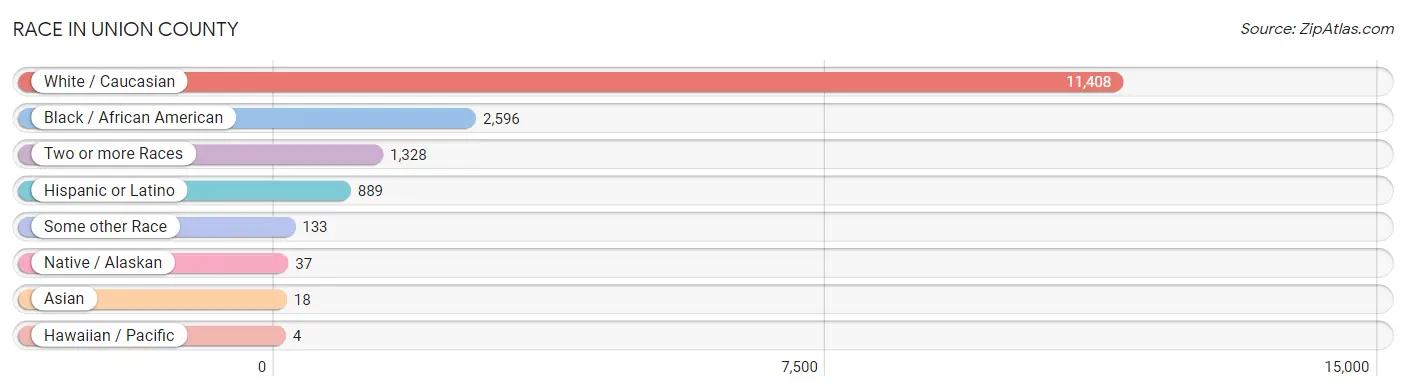
| Race | # Population | % Population |
| Asian | 18 | 0.1% |
| Black / African American | 2,596 | 16.7% |
| Hawaiian / Pacific | 4 | 0.0% |
| Hispanic or Latino | 889 | 5.7% |
| Native / Alaskan | 37 | 0.2% |
| White / Caucasian | 11,408 | 73.5% |
| Two or more Races | 1,328 | 8.6% |
| Some other Race | 133 | 0.9% |
| Total | 15,524 | 100.0% |
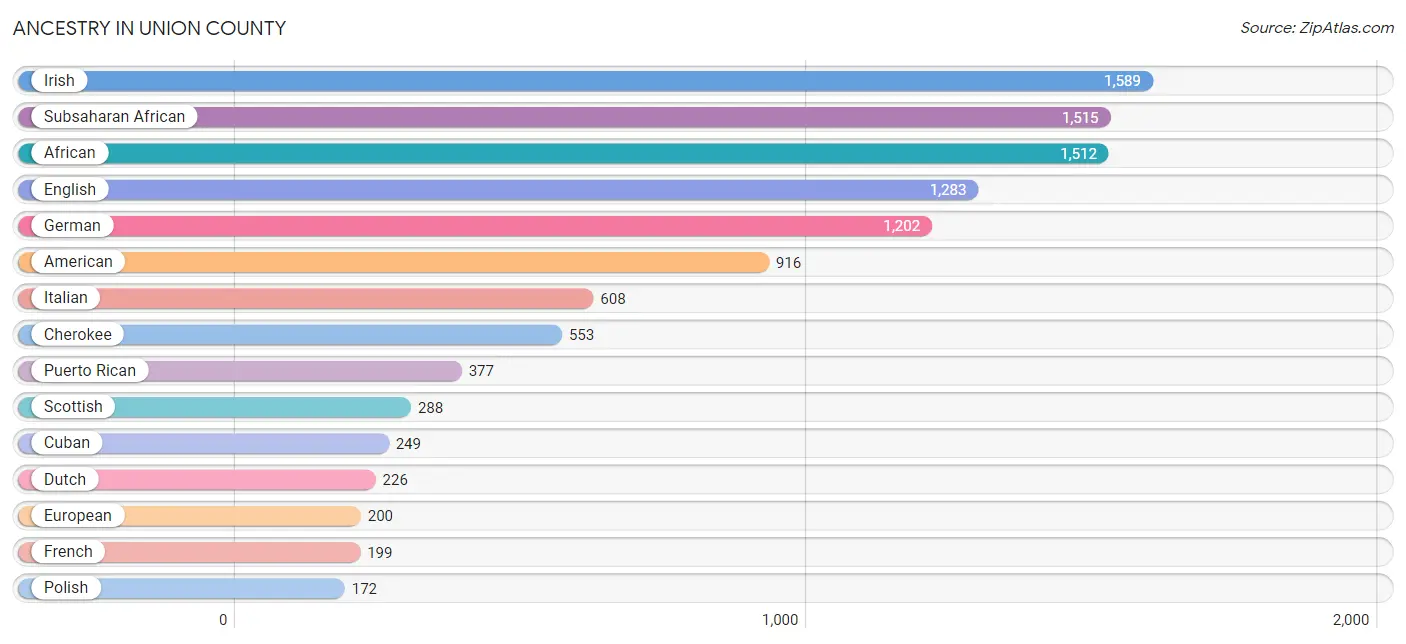
Ancestry in Union County
The most populous ancestries reported in Union County are Irish (1,589 | 10.2%), Subsaharan African (1,515 | 9.8%), African (1,512 | 9.7%), English (1,283 | 8.3%), and German (1,202 | 7.7%), together accounting for 45.7% of all Union County residents.
| Ancestry | # Population | % Population |
| African | 1,512 | 9.7% |
| American | 916 | 5.9% |
| Arab | 19 | 0.1% |
| Austrian | 5 | 0.0% |
| Bahamian | 3 | 0.0% |
| Blackfeet | 67 | 0.4% |
| British | 80 | 0.5% |
| Burmese | 11 | 0.1% |
| Canadian | 3 | 0.0% |
| Cape Verdean | 3 | 0.0% |
| Central American | 80 | 0.5% |
| Central American Indian | 14 | 0.1% |
| Cherokee | 553 | 3.6% |
| Cheyenne | 42 | 0.3% |
| Choctaw | 49 | 0.3% |
| Colombian | 3 | 0.0% |
| Creek | 2 | 0.0% |
| Croatian | 11 | 0.1% |
| Cuban | 249 | 1.6% |
| Czech | 159 | 1.0% |
| Danish | 2 | 0.0% |
| Dutch | 226 | 1.5% |
| Eastern European | 35 | 0.2% |
| English | 1,283 | 8.3% |
| European | 200 | 1.3% |
| Finnish | 17 | 0.1% |
| French | 199 | 1.3% |
| French Canadian | 37 | 0.2% |
| German | 1,202 | 7.7% |
| Greek | 93 | 0.6% |
| Guatemalan | 19 | 0.1% |
| Haitian | 16 | 0.1% |
| Honduran | 21 | 0.1% |
| Hungarian | 92 | 0.6% |
| Indian (Asian) | 4 | 0.0% |
| Irish | 1,589 | 10.2% |
| Israeli | 17 | 0.1% |
| Italian | 608 | 3.9% |
| Jamaican | 55 | 0.4% |
| Korean | 54 | 0.4% |
| Lebanese | 2 | 0.0% |
| Malaysian | 11 | 0.1% |
| Mexican | 112 | 0.7% |
| Native Hawaiian | 4 | 0.0% |
| Navajo | 5 | 0.0% |
| Nicaraguan | 37 | 0.2% |
| Northern European | 10 | 0.1% |
| Norwegian | 143 | 0.9% |
| Panamanian | 3 | 0.0% |
| Pennsylvania German | 13 | 0.1% |
| Peruvian | 10 | 0.1% |
| Polish | 172 | 1.1% |
| Puerto Rican | 377 | 2.4% |
| Russian | 9 | 0.1% |
| Scandinavian | 26 | 0.2% |
| Scotch-Irish | 85 | 0.5% |
| Scottish | 288 | 1.9% |
| Seminole | 4 | 0.0% |
| Sioux | 62 | 0.4% |
| South American | 13 | 0.1% |
| Spaniard | 8 | 0.1% |
| Spanish | 21 | 0.1% |
| Spanish American | 6 | 0.0% |
| Sri Lankan | 3 | 0.0% |
| Subsaharan African | 1,515 | 9.8% |
| Swedish | 55 | 0.4% |
| Swiss | 2 | 0.0% |
| Thai | 3 | 0.0% |
| Ukrainian | 60 | 0.4% |
| Welsh | 69 | 0.4% |
| West Indian | 44 | 0.3% | View All 71 Rows |
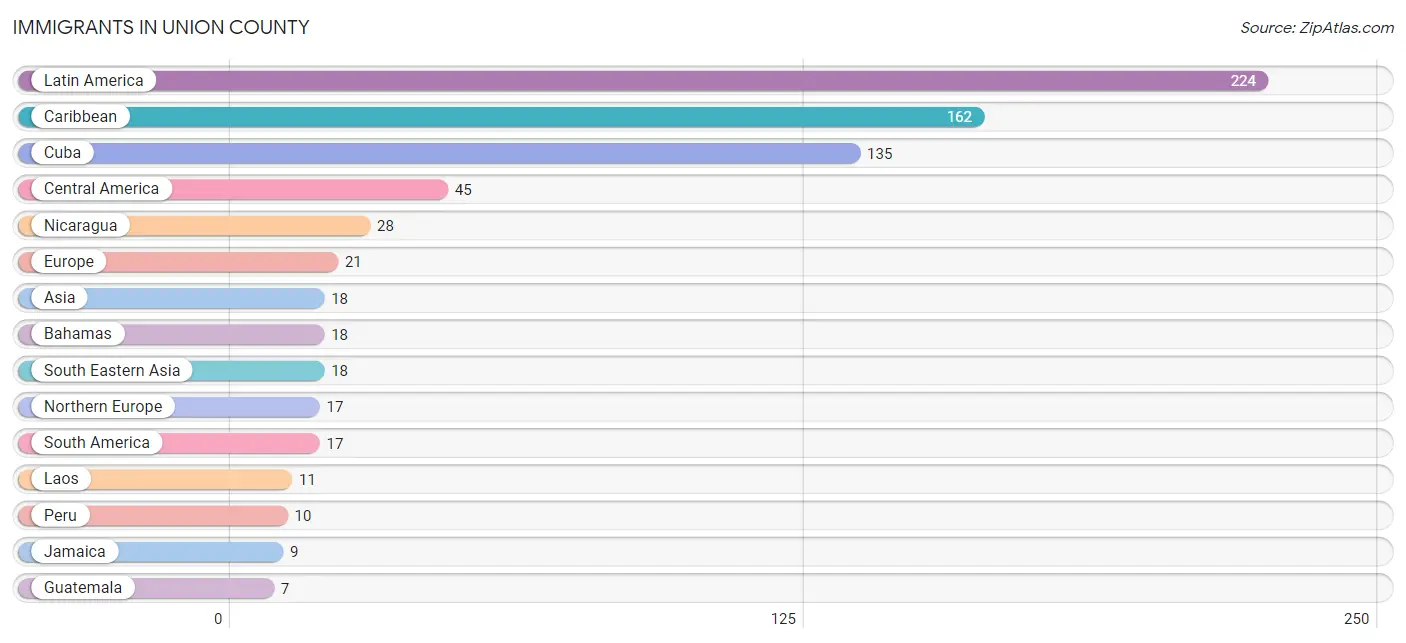
Immigrants in Union County
The most numerous immigrant groups reported in Union County came from Latin America (224 | 1.4%), Caribbean (162 | 1.0%), Cuba (135 | 0.9%), Central America (45 | 0.3%), and Nicaragua (28 | 0.2%), together accounting for 3.8% of all Union County residents.
| Immigration Origin | # Population | % Population |
| Asia | 18 | 0.1% |
| Bahamas | 18 | 0.1% |
| Caribbean | 162 | 1.0% |
| Central America | 45 | 0.3% |
| Colombia | 3 | 0.0% |
| Cuba | 135 | 0.9% |
| Europe | 21 | 0.1% |
| Germany | 4 | 0.0% |
| Guatemala | 7 | 0.1% |
| Honduras | 3 | 0.0% |
| Jamaica | 9 | 0.1% |
| Laos | 11 | 0.1% |
| Latin America | 224 | 1.4% |
| Mexico | 7 | 0.1% |
| Nicaragua | 28 | 0.2% |
| Northern Europe | 17 | 0.1% |
| Peru | 10 | 0.1% |
| Philippines | 4 | 0.0% |
| South America | 17 | 0.1% |
| South Eastern Asia | 18 | 0.1% |
| Vietnam | 3 | 0.0% |
| Western Europe | 4 | 0.0% | View All 22 Rows |
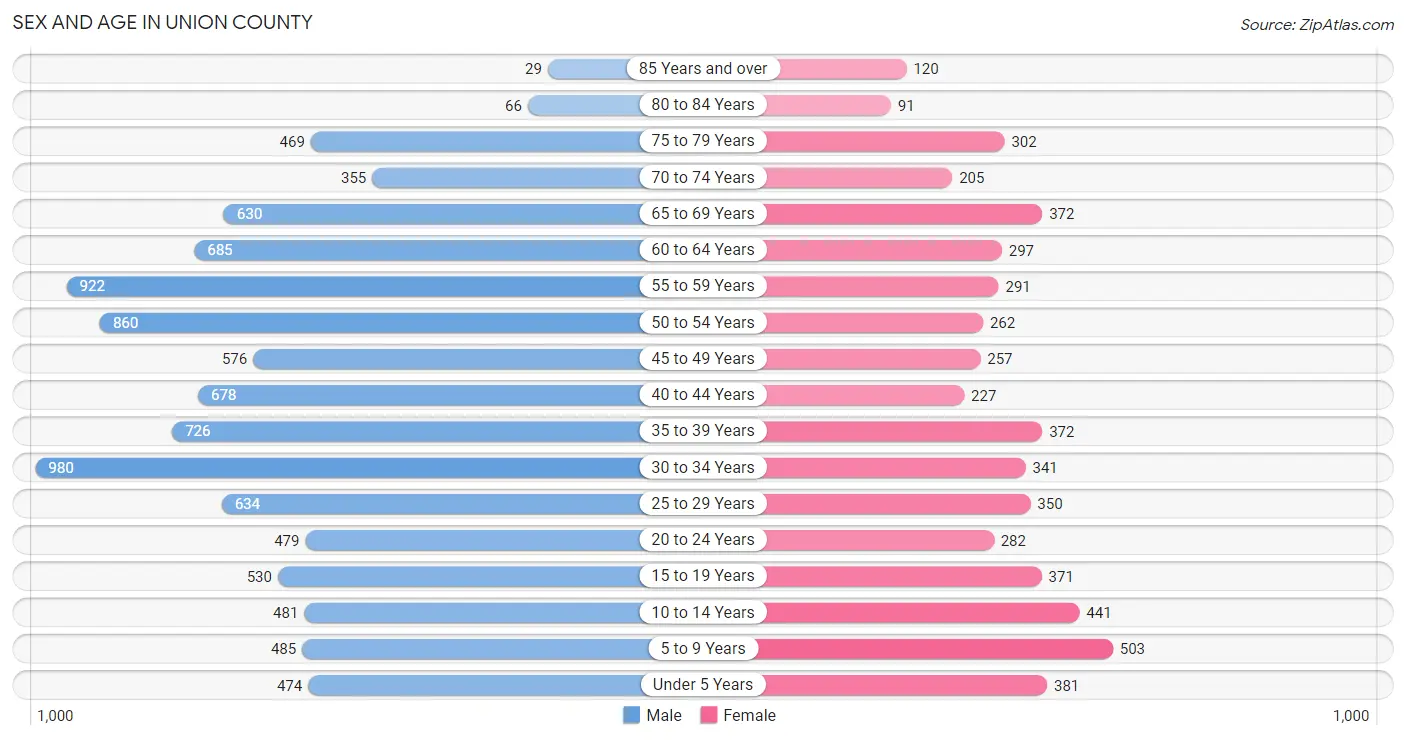
Sex and Age in Union County
Sex and Age in Union County
The most populous age groups in Union County are 30 to 34 Years (980 | 9.7%) for men and 5 to 9 Years (503 | 9.2%) for women.
| Age Bracket | Male | Female |
| Under 5 Years | 474 (4.7%) | 381 (7.0%) |
| 5 to 9 Years | 485 (4.8%) | 503 (9.2%) |
| 10 to 14 Years | 481 (4.8%) | 441 (8.1%) |
| 15 to 19 Years | 530 (5.3%) | 371 (6.8%) |
| 20 to 24 Years | 479 (4.8%) | 282 (5.2%) |
| 25 to 29 Years | 634 (6.3%) | 350 (6.4%) |
| 30 to 34 Years | 980 (9.7%) | 341 (6.2%) |
| 35 to 39 Years | 726 (7.2%) | 372 (6.8%) |
| 40 to 44 Years | 678 (6.7%) | 227 (4.2%) |
| 45 to 49 Years | 576 (5.7%) | 257 (4.7%) |
| 50 to 54 Years | 860 (8.6%) | 262 (4.8%) |
| 55 to 59 Years | 922 (9.2%) | 291 (5.3%) |
| 60 to 64 Years | 685 (6.8%) | 297 (5.4%) |
| 65 to 69 Years | 630 (6.3%) | 372 (6.8%) |
| 70 to 74 Years | 355 (3.5%) | 205 (3.7%) |
| 75 to 79 Years | 469 (4.7%) | 302 (5.5%) |
| 80 to 84 Years | 66 (0.7%) | 91 (1.7%) |
| 85 Years and over | 29 (0.3%) | 120 (2.2%) |
| Total | 10,059 (100.0%) | 5,465 (100.0%) |
Families and Households in Union County
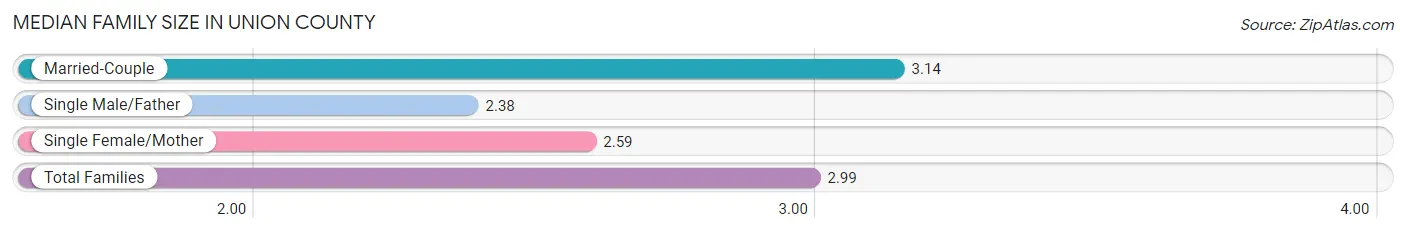
Median Family Size in Union County
The median family size in Union County is 2.99 persons per family, with married-couple families (2,170 | 73.3%) accounting for the largest median family size of 3.14 persons per family. On the other hand, single male/father families (143 | 4.8%) represent the smallest median family size with 2.38 persons per family.
| Family Type | # Families | Family Size |
| Married-Couple | 2,170 (73.3%) | 3.14 |
| Single Male/Father | 143 (4.8%) | 2.38 |
| Single Female/Mother | 646 (21.8%) | 2.59 |
| Total Families | 2,959 (100.0%) | 2.99 |
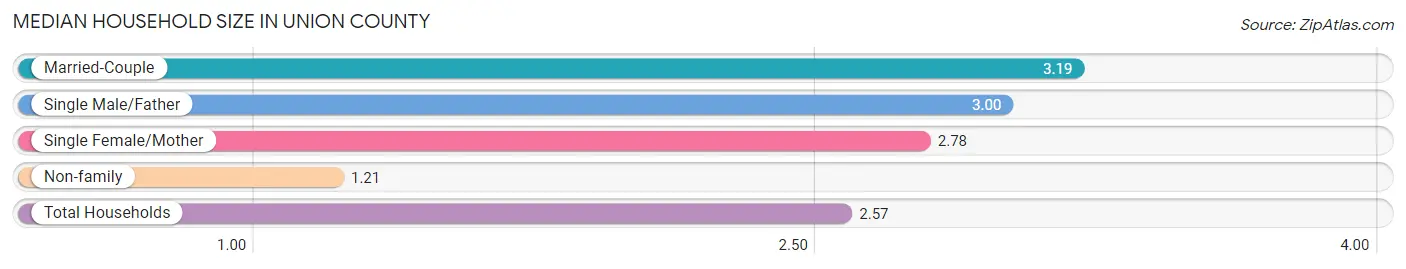
Median Household Size in Union County
The median household size in Union County is 2.57 persons per household, with married-couple households (2,170 | 53.0%) accounting for the largest median household size of 3.19 persons per household. non-family households (1,135 | 27.7%) represent the smallest median household size with 1.21 persons per household.
| Household Type | # Households | Household Size |
| Married-Couple | 2,170 (53.0%) | 3.19 |
| Single Male/Father | 143 (3.5%) | 3.00 |
| Single Female/Mother | 646 (15.8%) | 2.78 |
| Non-family | 1,135 (27.7%) | 1.21 |
| Total Households | 4,094 (100.0%) | 2.57 |
Household Size by Marriage Status in Union County
Out of a total of 4,094 households in Union County, 2,959 (72.3%) are family households, while 1,135 (27.7%) are nonfamily households. The most numerous type of family households are 2-person households, comprising 1,130, and the most common type of nonfamily households are 1-person households, comprising 874.
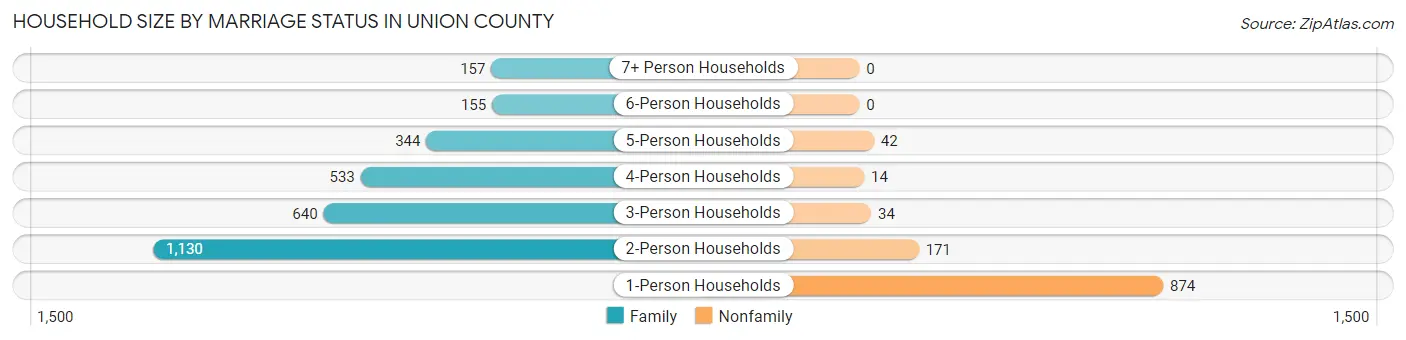
| Household Size | Family Households | Nonfamily Households |
| 1-Person Households | - | 874 (21.3%) |
| 2-Person Households | 1,130 (27.6%) | 171 (4.2%) |
| 3-Person Households | 640 (15.6%) | 34 (0.8%) |
| 4-Person Households | 533 (13.0%) | 14 (0.3%) |
| 5-Person Households | 344 (8.4%) | 42 (1.0%) |
| 6-Person Households | 155 (3.8%) | 0 (0.0%) |
| 7+ Person Households | 157 (3.8%) | 0 (0.0%) |
| Total | 2,959 (72.3%) | 1,135 (27.7%) |
Female Fertility in Union County
Fertility by Age in Union County
Average fertility rate in Union County is 70.0 births per 1,000 women. Women in the age bracket of 20 to 34 years have the highest fertility rate with 157.0 births per 1,000 women. Women in the age bracket of 20 to 34 years acount for 97.5% of all women with births.
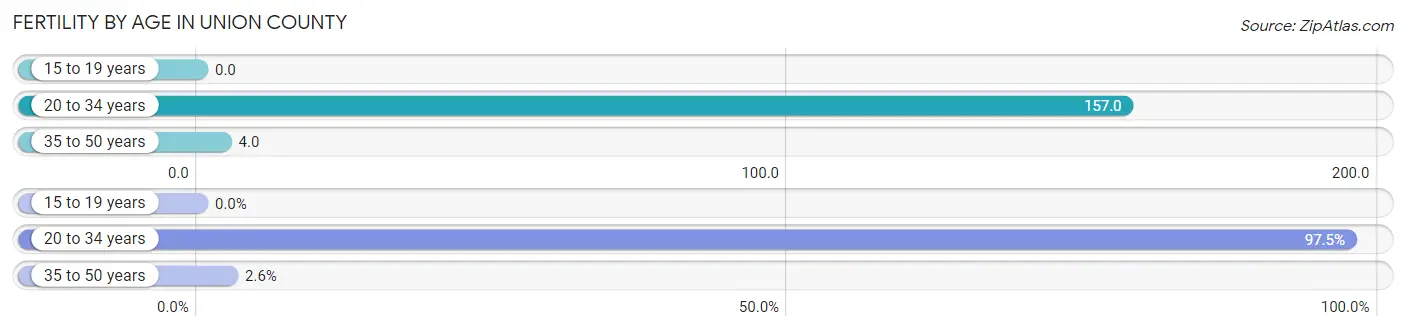
| Age Bracket | Women with Births | Births / 1,000 Women |
| 15 to 19 years | 0 (0.0%) | 0.0 |
| 20 to 34 years | 153 (97.5%) | 157.0 |
| 35 to 50 years | 4 (2.5%) | 4.0 |
| Total | 157 (100.0%) | 70.0 |
Fertility by Age by Marriage Status in Union County
44.6% of women with births (157) in Union County are married. The highest percentage of unmarried women with births falls into 35 to 50 years age bracket with 100.0% of them unmarried at the time of birth, while the lowest percentage of unmarried women with births belong to 20 to 34 years age bracket with 54.2% of them unmarried.
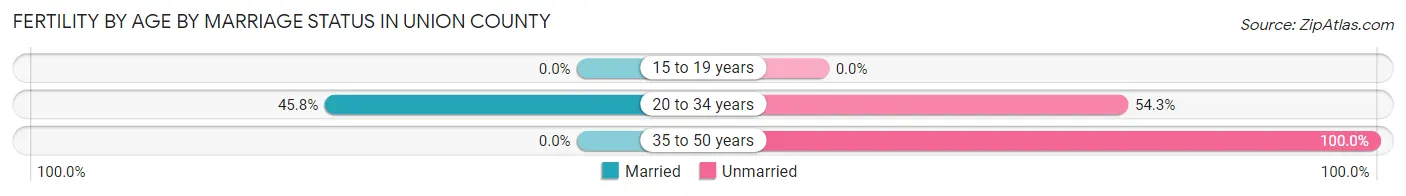
| Age Bracket | Married | Unmarried |
| 15 to 19 years | 0 (0.0%) | 0 (0.0%) |
| 20 to 34 years | 70 (45.8%) | 83 (54.2%) |
| 35 to 50 years | 0 (0.0%) | 4 (100.0%) |
| Total | 70 (44.6%) | 87 (55.4%) |
Fertility by Education in Union County
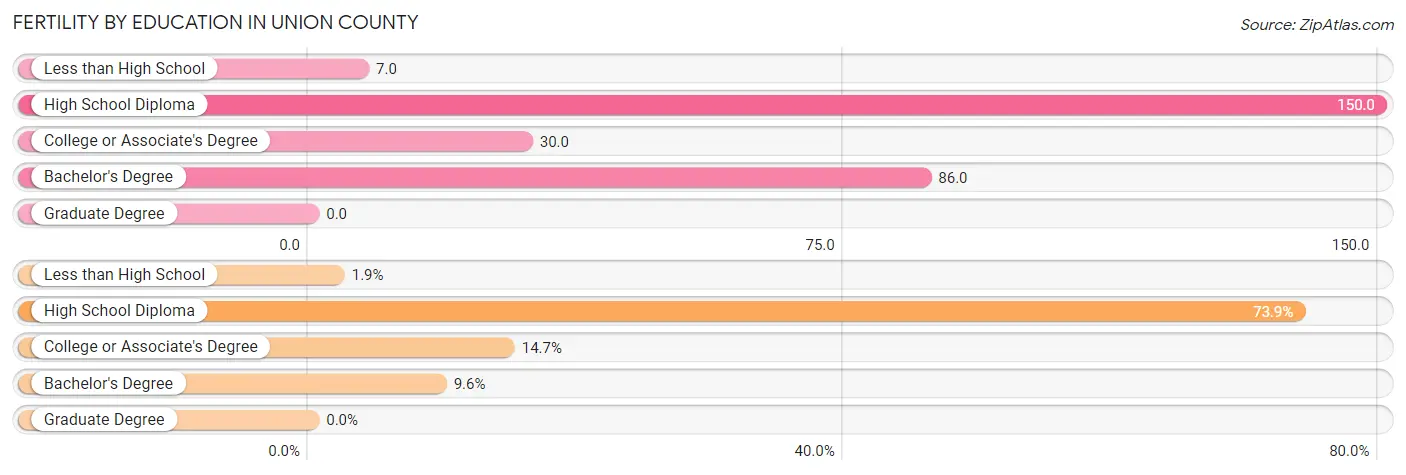
| Educational Attainment | Women with Births | Births / 1,000 Women |
| Less than High School | 3 (1.9%) | 7.0 |
| High School Diploma | 116 (73.9%) | 150.0 |
| College or Associate's Degree | 23 (14.6%) | 30.0 |
| Bachelor's Degree | 15 (9.6%) | 86.0 |
| Graduate Degree | 0 (0.0%) | 0.0 |
| Total | 157 (100.0%) | 70.0 |
Fertility by Education by Marriage Status in Union County
55.4% of women with births in Union County are unmarried. Women with the educational attainment of bachelor's degree are most likely to be married with 100.0% of them married at childbirth, while women with the educational attainment of college or associate's degree are least likely to be married with 95.7% of them unmarried at childbirth.
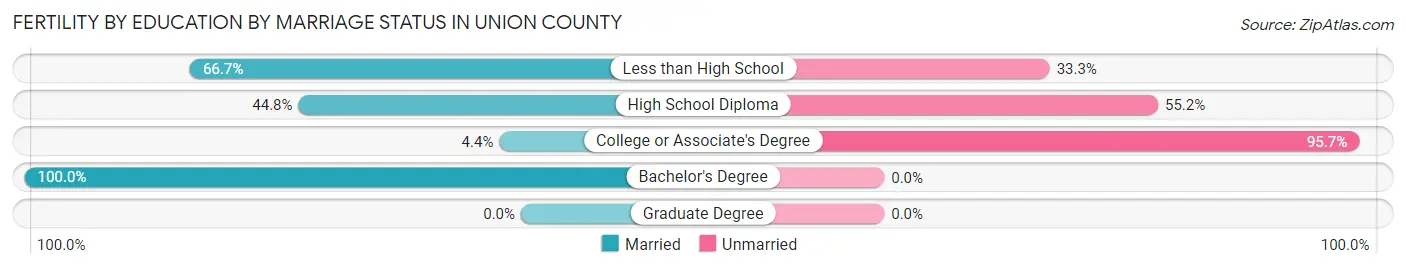
| Educational Attainment | Married | Unmarried |
| Less than High School | 2 (66.7%) | 1 (33.3%) |
| High School Diploma | 52 (44.8%) | 64 (55.2%) |
| College or Associate's Degree | 1 (4.3%) | 22 (95.7%) |
| Bachelor's Degree | 15 (100.0%) | 0 (0.0%) |
| Graduate Degree | 0 (0.0%) | 0 (0.0%) |
| Total | 70 (44.6%) | 87 (55.4%) |
Employment Characteristics in Union County
Employment by Class of Employer in Union County
Among the 4,225 employed individuals in Union County, private company employees (2,447 | 57.9%), state government employees (652 | 15.4%), and local government employees (360 | 8.5%) make up the most common classes of employment.
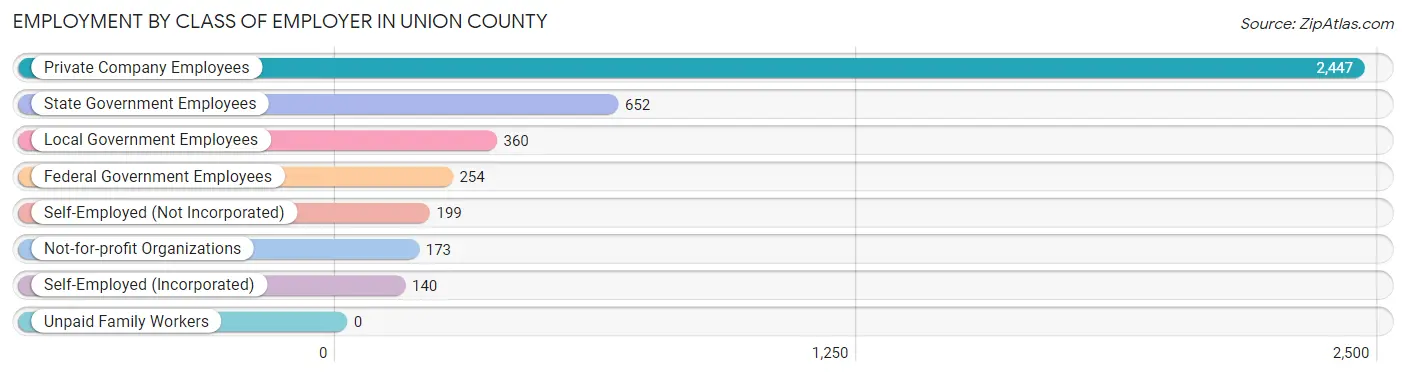
| Employer Class | # Employees | % Employees |
| Private Company Employees | 2,447 | 57.9% |
| Self-Employed (Incorporated) | 140 | 3.3% |
| Self-Employed (Not Incorporated) | 199 | 4.7% |
| Not-for-profit Organizations | 173 | 4.1% |
| Local Government Employees | 360 | 8.5% |
| State Government Employees | 652 | 15.4% |
| Federal Government Employees | 254 | 6.0% |
| Unpaid Family Workers | 0 | 0.0% |
| Total | 4,225 | 100.0% |
Employment Status by Age in Union County
According to the labor force statistics for Union County, out of the total population over 16 years of age (12,596), 35.3% or 4,446 individuals are in the labor force, with 3.6% or 160 of them unemployed. The age group with the highest labor force participation rate is 20 to 24 years, with 55.8% or 425 individuals in the labor force. Within the labor force, the 25 to 29 years age range has the highest percentage of unemployed individuals, with 9.7% or 47 of them being unemployed.
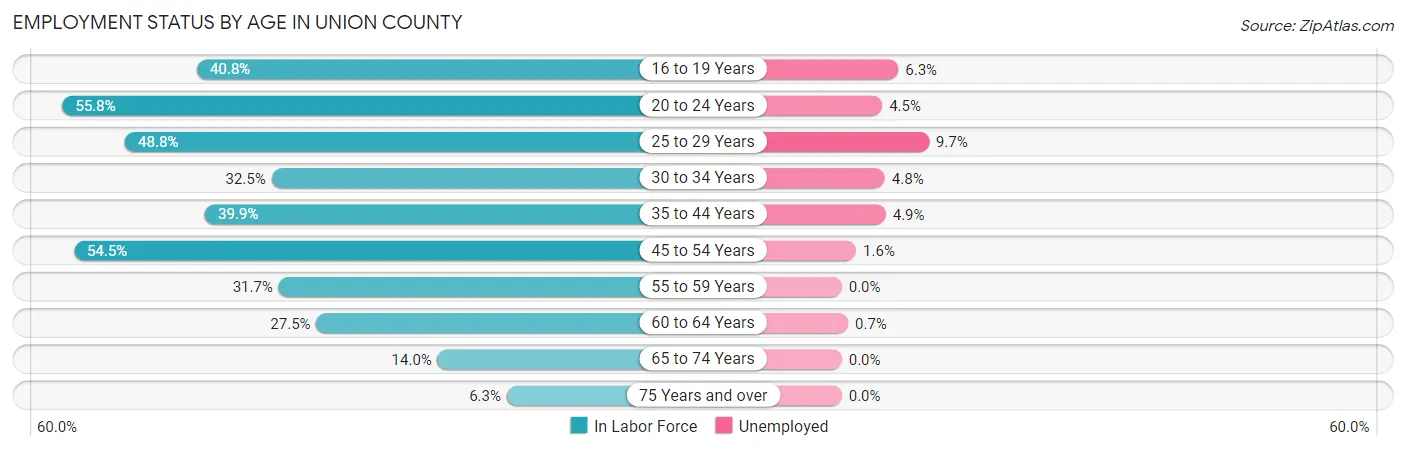
| Age Bracket | In Labor Force | Unemployed |
| 16 to 19 Years | 301 (40.8%) | 19 (6.3%) |
| 20 to 24 Years | 425 (55.8%) | 19 (4.5%) |
| 25 to 29 Years | 480 (48.8%) | 47 (9.7%) |
| 30 to 34 Years | 429 (32.5%) | 21 (4.8%) |
| 35 to 44 Years | 799 (39.9%) | 39 (4.9%) |
| 45 to 54 Years | 1,065 (54.5%) | 17 (1.6%) |
| 55 to 59 Years | 385 (31.7%) | 0 (0.0%) |
| 60 to 64 Years | 270 (27.5%) | 2 (0.7%) |
| 65 to 74 Years | 219 (14.0%) | 0 (0.0%) |
| 75 Years and over | 68 (6.3%) | 0 (0.0%) |
| Total | 4,446 (35.3%) | 160 (3.6%) |
Employment Status by Educational Attainment in Union County
According to labor force statistics for Union County, 40.5% of individuals (3,425) out of the total population between 25 and 64 years of age (8,458) are in the labor force, with 3.6% or 123 of them being unemployed. The group with the highest labor force participation rate are those with the educational attainment of bachelor's degree or higher, with 71.5% or 606 individuals in the labor force. Within the labor force, individuals with less than high school education have the highest percentage of unemployment, with 13.9% or 41 of them being unemployed.
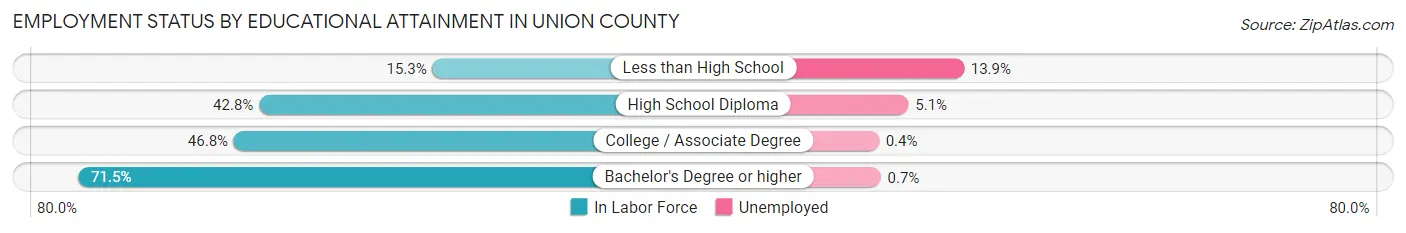
| Educational Attainment | In Labor Force | Unemployed |
| Less than High School | 294 (15.3%) | 267 (13.9%) |
| High School Diploma | 1,442 (42.8%) | 172 (5.1%) |
| College / Associate Degree | 1,086 (46.8%) | 9 (0.4%) |
| Bachelor's Degree or higher | 606 (71.5%) | 6 (0.7%) |
| Total | 3,425 (40.5%) | 304 (3.6%) |
Employment Occupations by Sex in Union County
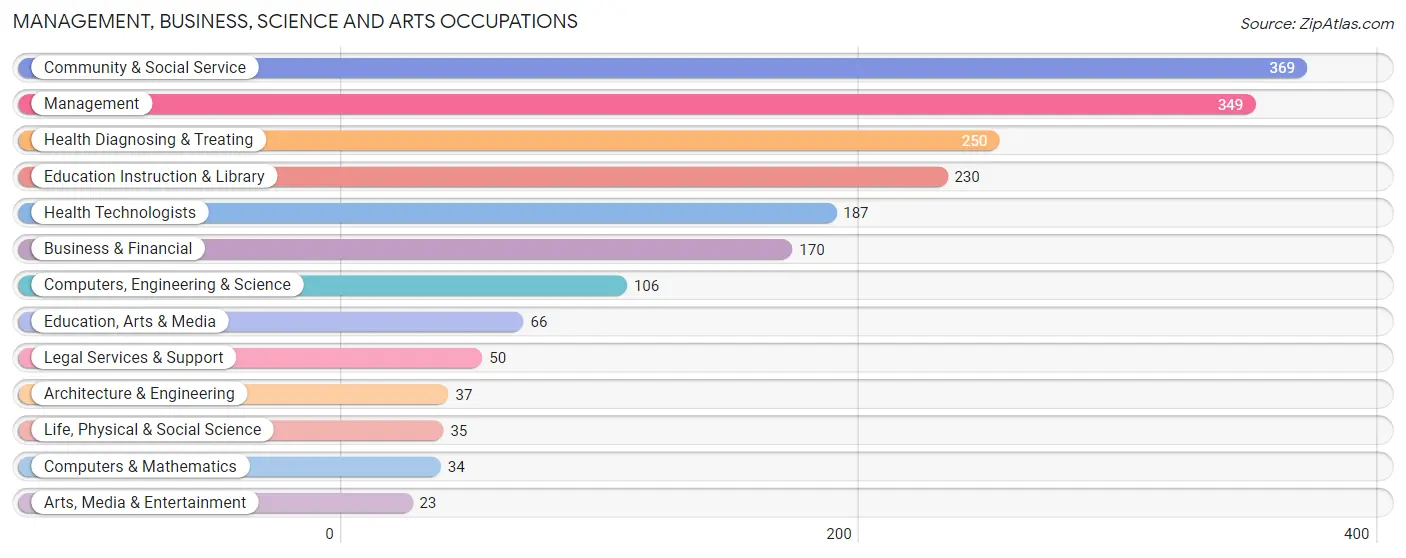
Management, Business, Science and Arts Occupations
The most common Management, Business, Science and Arts occupations in Union County are Community & Social Service (369 | 8.7%), Management (349 | 8.3%), Health Diagnosing & Treating (250 | 5.9%), Education Instruction & Library (230 | 5.4%), and Health Technologists (187 | 4.4%).
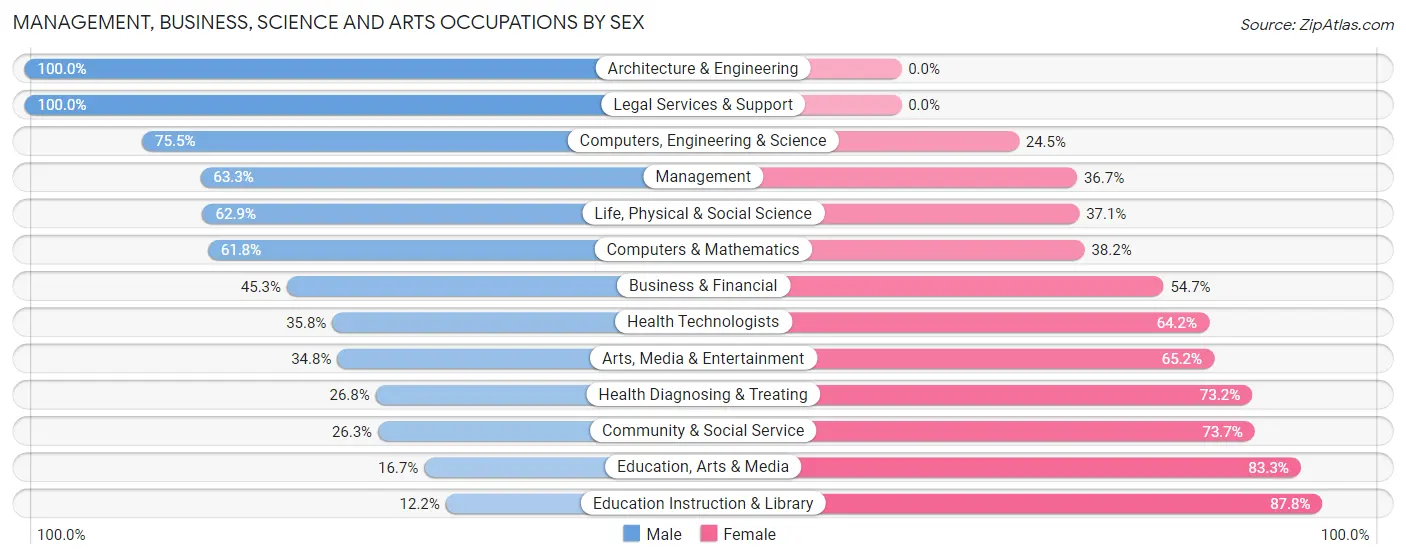
Management, Business, Science and Arts Occupations by Sex
Within the Management, Business, Science and Arts occupations in Union County, the most male-oriented occupations are Architecture & Engineering (100.0%), Legal Services & Support (100.0%), and Computers, Engineering & Science (75.5%), while the most female-oriented occupations are Education Instruction & Library (87.8%), Education, Arts & Media (83.3%), and Community & Social Service (73.7%).
| Occupation | Male | Female |
| Management | 221 (63.3%) | 128 (36.7%) |
| Business & Financial | 77 (45.3%) | 93 (54.7%) |
| Computers, Engineering & Science | 80 (75.5%) | 26 (24.5%) |
| Computers & Mathematics | 21 (61.8%) | 13 (38.2%) |
| Architecture & Engineering | 37 (100.0%) | 0 (0.0%) |
| Life, Physical & Social Science | 22 (62.9%) | 13 (37.1%) |
| Community & Social Service | 97 (26.3%) | 272 (73.7%) |
| Education, Arts & Media | 11 (16.7%) | 55 (83.3%) |
| Legal Services & Support | 50 (100.0%) | 0 (0.0%) |
| Education Instruction & Library | 28 (12.2%) | 202 (87.8%) |
| Arts, Media & Entertainment | 8 (34.8%) | 15 (65.2%) |
| Health Diagnosing & Treating | 67 (26.8%) | 183 (73.2%) |
| Health Technologists | 67 (35.8%) | 120 (64.2%) |
| Total (Category) | 542 (43.6%) | 702 (56.4%) |
| Total (Overall) | 2,375 (56.2%) | 1,854 (43.8%) |
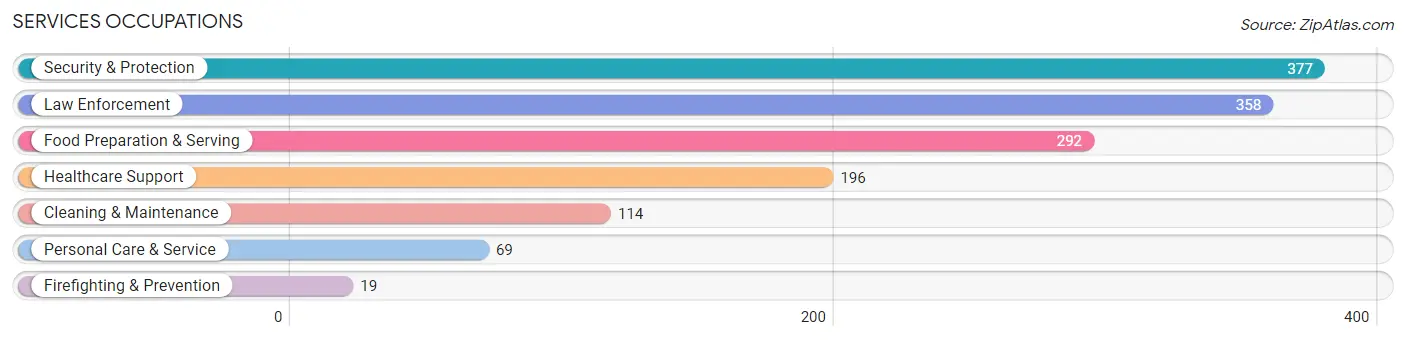
Services Occupations
The most common Services occupations in Union County are Security & Protection (377 | 8.9%), Law Enforcement (358 | 8.5%), Food Preparation & Serving (292 | 6.9%), Healthcare Support (196 | 4.6%), and Cleaning & Maintenance (114 | 2.7%).
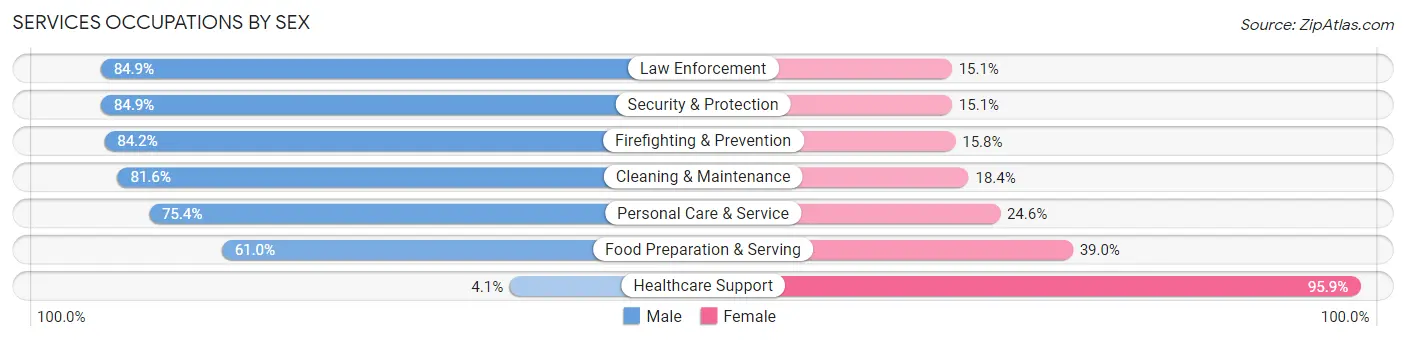
Services Occupations by Sex
Within the Services occupations in Union County, the most male-oriented occupations are Law Enforcement (84.9%), Security & Protection (84.9%), and Firefighting & Prevention (84.2%), while the most female-oriented occupations are Healthcare Support (95.9%), Food Preparation & Serving (39.0%), and Personal Care & Service (24.6%).
| Occupation | Male | Female |
| Healthcare Support | 8 (4.1%) | 188 (95.9%) |
| Security & Protection | 320 (84.9%) | 57 (15.1%) |
| Firefighting & Prevention | 16 (84.2%) | 3 (15.8%) |
| Law Enforcement | 304 (84.9%) | 54 (15.1%) |
| Food Preparation & Serving | 178 (61.0%) | 114 (39.0%) |
| Cleaning & Maintenance | 93 (81.6%) | 21 (18.4%) |
| Personal Care & Service | 52 (75.4%) | 17 (24.6%) |
| Total (Category) | 651 (62.1%) | 397 (37.9%) |
| Total (Overall) | 2,375 (56.2%) | 1,854 (43.8%) |
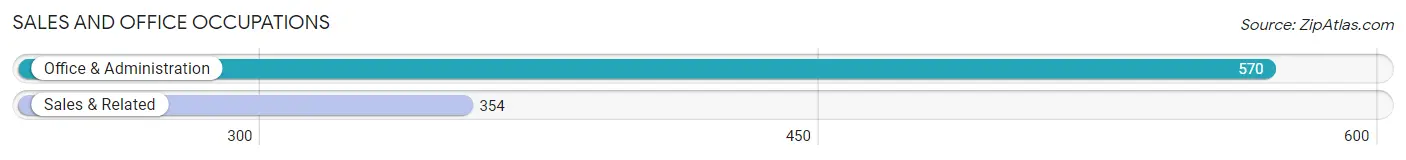
Sales and Office Occupations
The most common Sales and Office occupations in Union County are Office & Administration (570 | 13.5%), and Sales & Related (354 | 8.4%).
Sales and Office Occupations by Sex
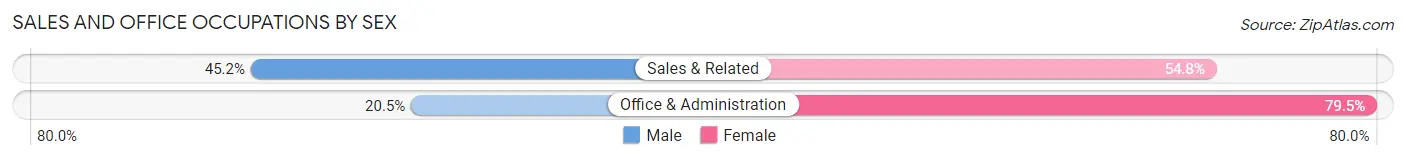
| Occupation | Male | Female |
| Sales & Related | 160 (45.2%) | 194 (54.8%) |
| Office & Administration | 117 (20.5%) | 453 (79.5%) |
| Total (Category) | 277 (30.0%) | 647 (70.0%) |
| Total (Overall) | 2,375 (56.2%) | 1,854 (43.8%) |
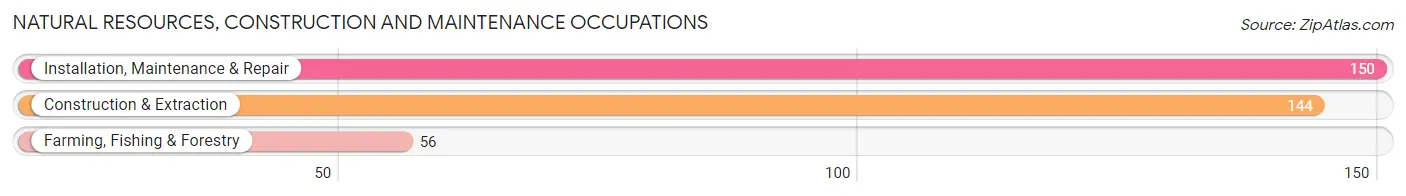
Natural Resources, Construction and Maintenance Occupations
The most common Natural Resources, Construction and Maintenance occupations in Union County are Installation, Maintenance & Repair (150 | 3.5%), Construction & Extraction (144 | 3.4%), and Farming, Fishing & Forestry (56 | 1.3%).
Natural Resources, Construction and Maintenance Occupations by Sex
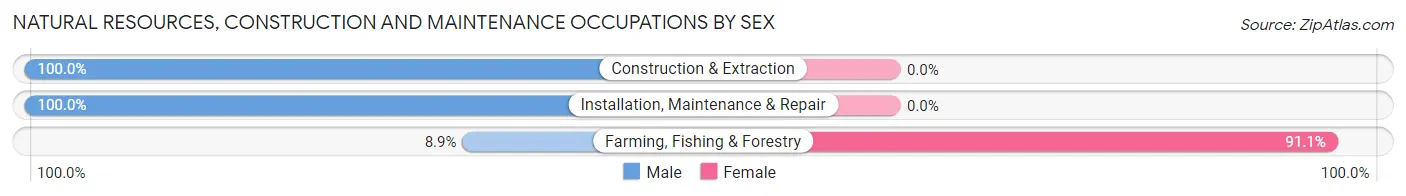
| Occupation | Male | Female |
| Farming, Fishing & Forestry | 5 (8.9%) | 51 (91.1%) |
| Construction & Extraction | 144 (100.0%) | 0 (0.0%) |
| Installation, Maintenance & Repair | 150 (100.0%) | 0 (0.0%) |
| Total (Category) | 299 (85.4%) | 51 (14.6%) |
| Total (Overall) | 2,375 (56.2%) | 1,854 (43.8%) |
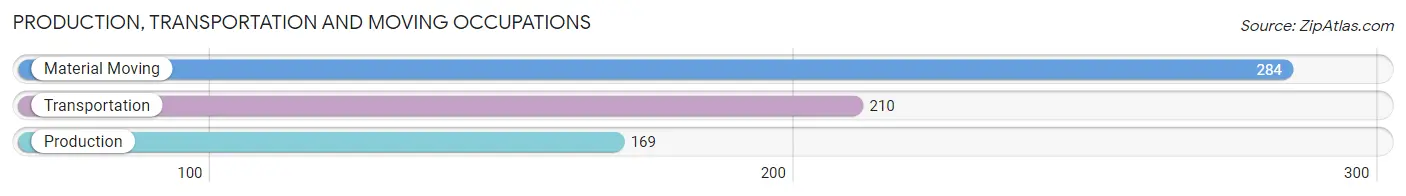
Production, Transportation and Moving Occupations
The most common Production, Transportation and Moving occupations in Union County are Material Moving (284 | 6.7%), Transportation (210 | 5.0%), and Production (169 | 4.0%).
Production, Transportation and Moving Occupations by Sex
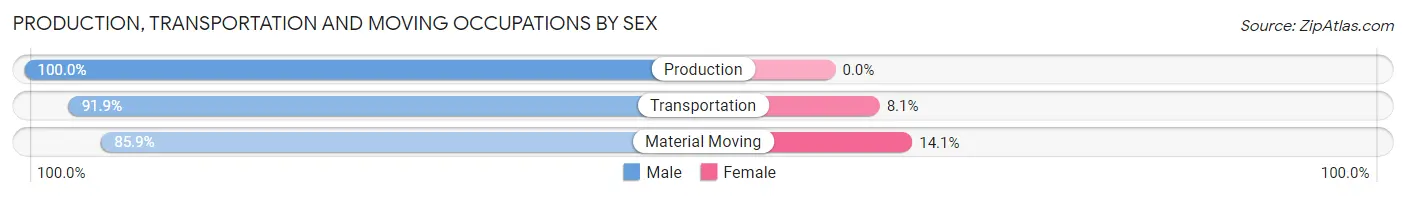
| Occupation | Male | Female |
| Production | 169 (100.0%) | 0 (0.0%) |
| Transportation | 193 (91.9%) | 17 (8.1%) |
| Material Moving | 244 (85.9%) | 40 (14.1%) |
| Total (Category) | 606 (91.4%) | 57 (8.6%) |
| Total (Overall) | 2,375 (56.2%) | 1,854 (43.8%) |
Employment Industries by Sex in Union County
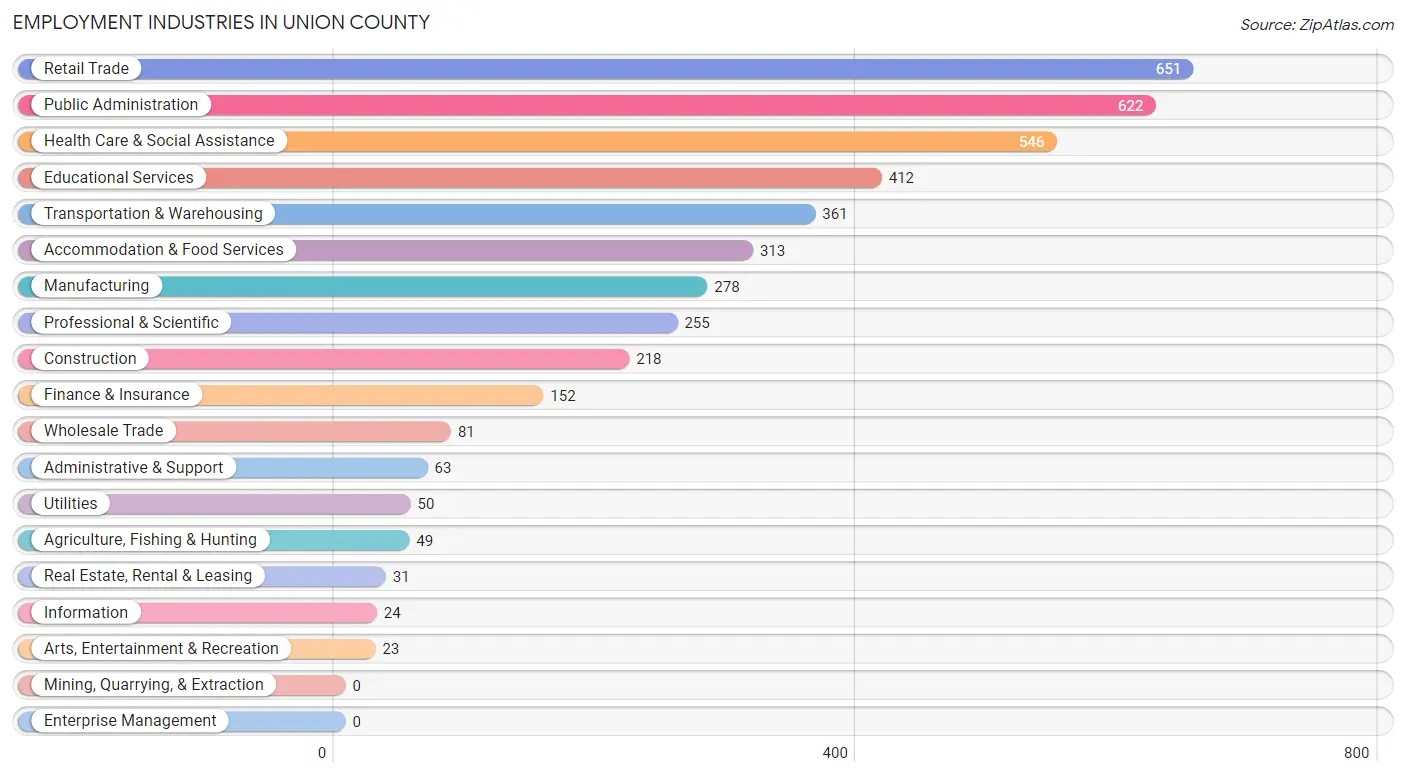
Employment Industries in Union County
The major employment industries in Union County include Retail Trade (651 | 15.4%), Public Administration (622 | 14.7%), Health Care & Social Assistance (546 | 12.9%), Educational Services (412 | 9.7%), and Transportation & Warehousing (361 | 8.5%).
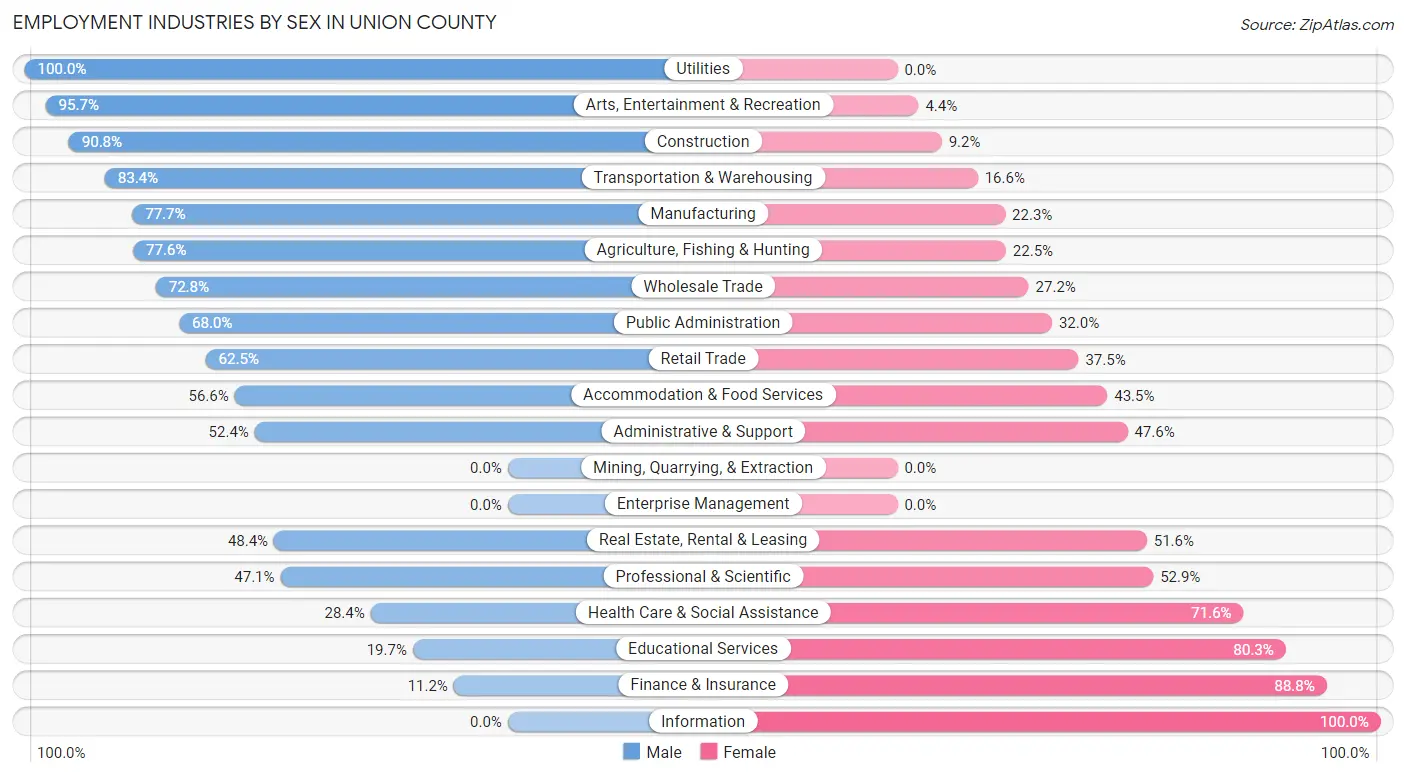
Employment Industries by Sex in Union County
The Union County industries that see more men than women are Utilities (100.0%), Arts, Entertainment & Recreation (95.7%), and Construction (90.8%), whereas the industries that tend to have a higher number of women are Information (100.0%), Finance & Insurance (88.8%), and Educational Services (80.3%).
| Industry | Male | Female |
| Agriculture, Fishing & Hunting | 38 (77.5%) | 11 (22.5%) |
| Mining, Quarrying, & Extraction | 0 (0.0%) | 0 (0.0%) |
| Construction | 198 (90.8%) | 20 (9.2%) |
| Manufacturing | 216 (77.7%) | 62 (22.3%) |
| Wholesale Trade | 59 (72.8%) | 22 (27.2%) |
| Retail Trade | 407 (62.5%) | 244 (37.5%) |
| Transportation & Warehousing | 301 (83.4%) | 60 (16.6%) |
| Utilities | 50 (100.0%) | 0 (0.0%) |
| Information | 0 (0.0%) | 24 (100.0%) |
| Finance & Insurance | 17 (11.2%) | 135 (88.8%) |
| Real Estate, Rental & Leasing | 15 (48.4%) | 16 (51.6%) |
| Professional & Scientific | 120 (47.1%) | 135 (52.9%) |
| Enterprise Management | 0 (0.0%) | 0 (0.0%) |
| Administrative & Support | 33 (52.4%) | 30 (47.6%) |
| Educational Services | 81 (19.7%) | 331 (80.3%) |
| Health Care & Social Assistance | 155 (28.4%) | 391 (71.6%) |
| Arts, Entertainment & Recreation | 22 (95.7%) | 1 (4.3%) |
| Accommodation & Food Services | 177 (56.6%) | 136 (43.4%) |
| Public Administration | 423 (68.0%) | 199 (32.0%) |
| Total | 2,375 (56.2%) | 1,854 (43.8%) |
Education in Union County
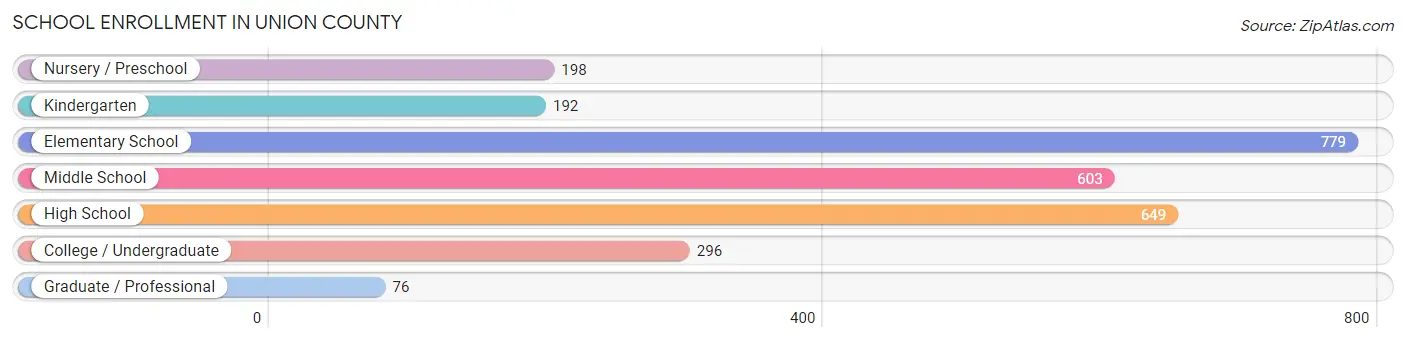
School Enrollment in Union County
The most common levels of schooling among the 2,793 students in Union County are elementary school (779 | 27.9%), high school (649 | 23.2%), and middle school (603 | 21.6%).
| School Level | # Students | % Students |
| Nursery / Preschool | 198 | 7.1% |
| Kindergarten | 192 | 6.9% |
| Elementary School | 779 | 27.9% |
| Middle School | 603 | 21.6% |
| High School | 649 | 23.2% |
| College / Undergraduate | 296 | 10.6% |
| Graduate / Professional | 76 | 2.7% |
| Total | 2,793 | 100.0% |
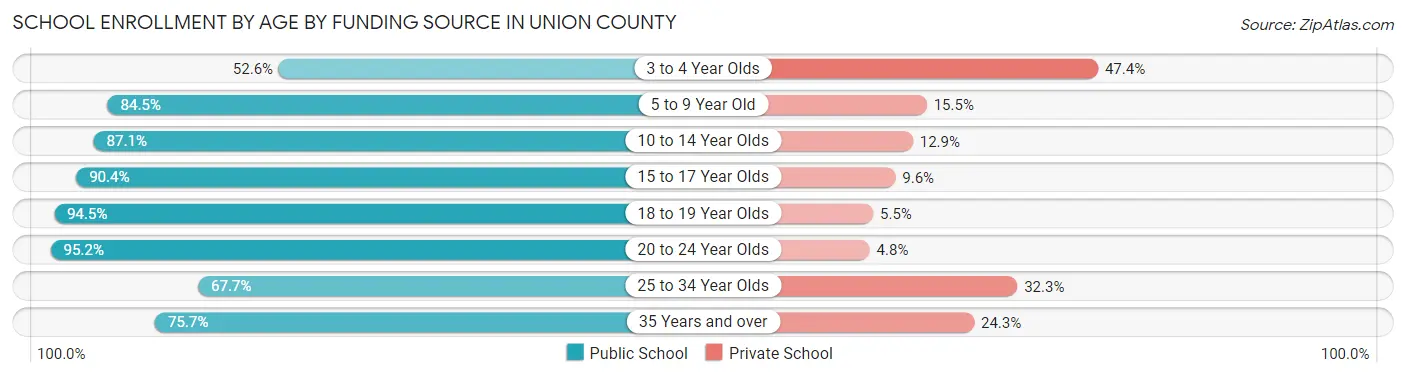
School Enrollment by Age by Funding Source in Union County
Out of a total of 2,793 students who are enrolled in schools in Union County, 439 (15.7%) attend a private institution, while the remaining 2,354 (84.3%) are enrolled in public schools. The age group of 3 to 4 year olds has the highest likelihood of being enrolled in private schools, with 45 (47.4% in the age bracket) enrolled. Conversely, the age group of 20 to 24 year olds has the lowest likelihood of being enrolled in a private school, with 59 (95.2% in the age bracket) attending a public institution.
| Age Bracket | Public School | Private School |
| 3 to 4 Year Olds | 50 (52.6%) | 45 (47.4%) |
| 5 to 9 Year Old | 732 (84.5%) | 134 (15.5%) |
| 10 to 14 Year Olds | 745 (87.1%) | 110 (12.9%) |
| 15 to 17 Year Olds | 451 (90.4%) | 48 (9.6%) |
| 18 to 19 Year Olds | 69 (94.5%) | 4 (5.5%) |
| 20 to 24 Year Olds | 59 (95.2%) | 3 (4.8%) |
| 25 to 34 Year Olds | 90 (67.7%) | 43 (32.3%) |
| 35 Years and over | 159 (75.7%) | 51 (24.3%) |
| Total | 2,354 (84.3%) | 439 (15.7%) |
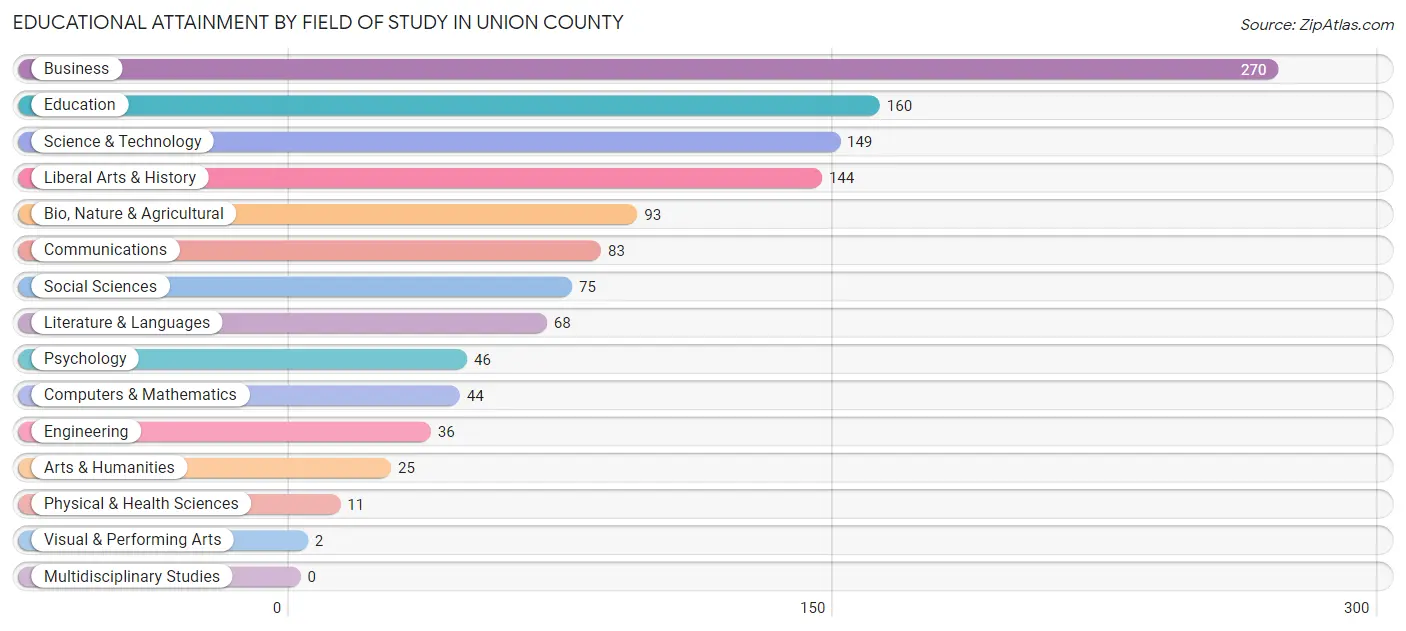
Educational Attainment by Field of Study in Union County
Business (270 | 22.4%), education (160 | 13.3%), science & technology (149 | 12.3%), liberal arts & history (144 | 11.9%), and bio, nature & agricultural (93 | 7.7%) are the most common fields of study among 1,206 individuals in Union County who have obtained a bachelor's degree or higher.
| Field of Study | # Graduates | % Graduates |
| Computers & Mathematics | 44 | 3.6% |
| Bio, Nature & Agricultural | 93 | 7.7% |
| Physical & Health Sciences | 11 | 0.9% |
| Psychology | 46 | 3.8% |
| Social Sciences | 75 | 6.2% |
| Engineering | 36 | 3.0% |
| Multidisciplinary Studies | 0 | 0.0% |
| Science & Technology | 149 | 12.3% |
| Business | 270 | 22.4% |
| Education | 160 | 13.3% |
| Literature & Languages | 68 | 5.6% |
| Liberal Arts & History | 144 | 11.9% |
| Visual & Performing Arts | 2 | 0.2% |
| Communications | 83 | 6.9% |
| Arts & Humanities | 25 | 2.1% |
| Total | 1,206 | 100.0% |
Transportation & Commute in Union County
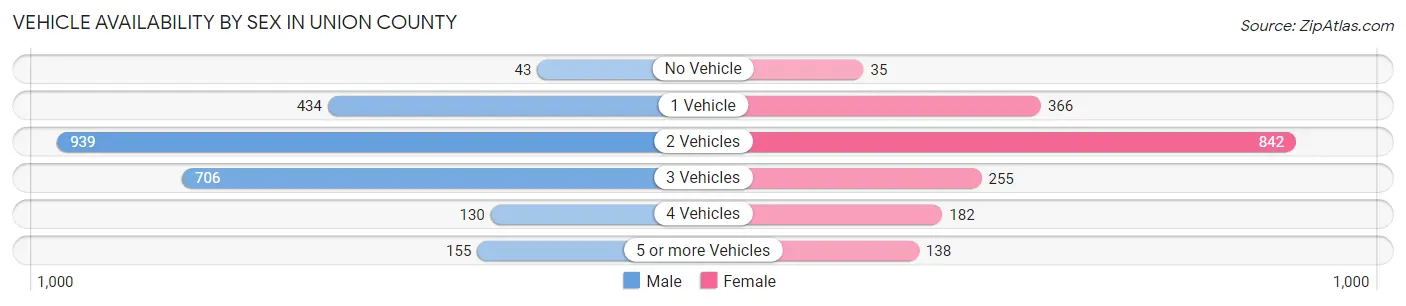
Vehicle Availability by Sex in Union County
The most prevalent vehicle ownership categories in Union County are males with 2 vehicles (939, accounting for 39.0%) and females with 2 vehicles (842, making up 51.6%).
| Vehicles Available | Male | Female |
| No Vehicle | 43 (1.8%) | 35 (1.9%) |
| 1 Vehicle | 434 (18.0%) | 366 (20.1%) |
| 2 Vehicles | 939 (39.0%) | 842 (46.3%) |
| 3 Vehicles | 706 (29.3%) | 255 (14.0%) |
| 4 Vehicles | 130 (5.4%) | 182 (10.0%) |
| 5 or more Vehicles | 155 (6.4%) | 138 (7.6%) |
| Total | 2,407 (100.0%) | 1,818 (100.0%) |
Commute Time in Union County
The most frequently occuring commute durations in Union County are 45 to 59 minutes (779 commuters, 19.7%), 15 to 19 minutes (448 commuters, 11.3%), and 60 to 89 minutes (426 commuters, 10.8%).
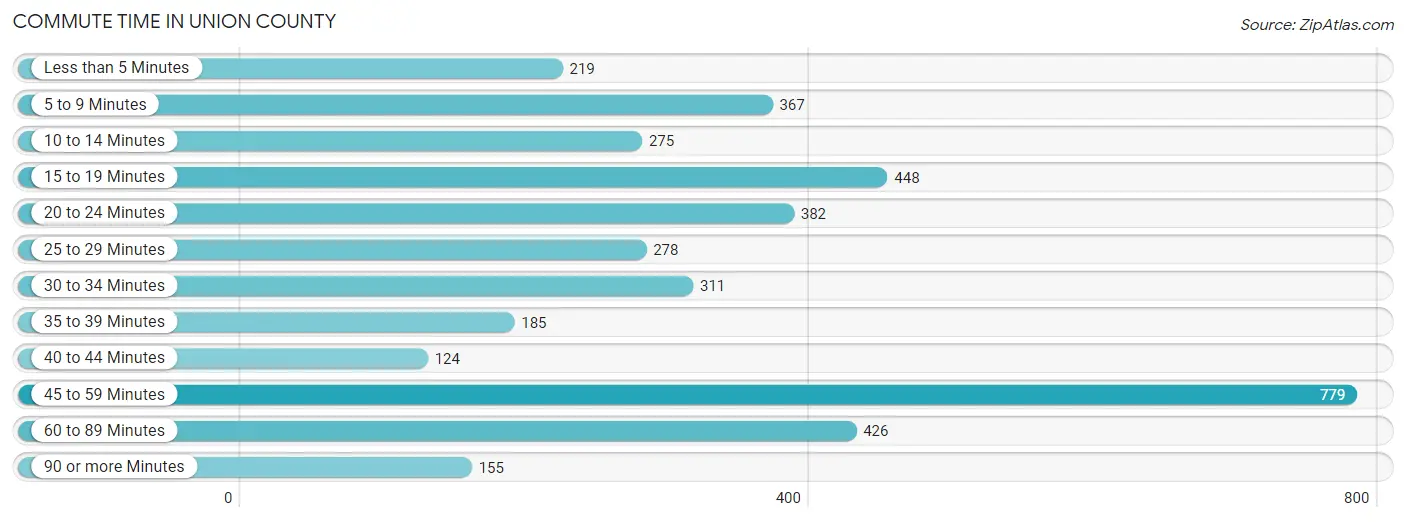
| Commute Time | # Commuters | % Commuters |
| Less than 5 Minutes | 219 | 5.6% |
| 5 to 9 Minutes | 367 | 9.3% |
| 10 to 14 Minutes | 275 | 7.0% |
| 15 to 19 Minutes | 448 | 11.3% |
| 20 to 24 Minutes | 382 | 9.7% |
| 25 to 29 Minutes | 278 | 7.0% |
| 30 to 34 Minutes | 311 | 7.9% |
| 35 to 39 Minutes | 185 | 4.7% |
| 40 to 44 Minutes | 124 | 3.1% |
| 45 to 59 Minutes | 779 | 19.7% |
| 60 to 89 Minutes | 426 | 10.8% |
| 90 or more Minutes | 155 | 3.9% |
Commute Time by Sex in Union County
The most common commute times in Union County are 45 to 59 minutes (467 commuters, 20.6%) for males and 45 to 59 minutes (312 commuters, 18.5%) for females.
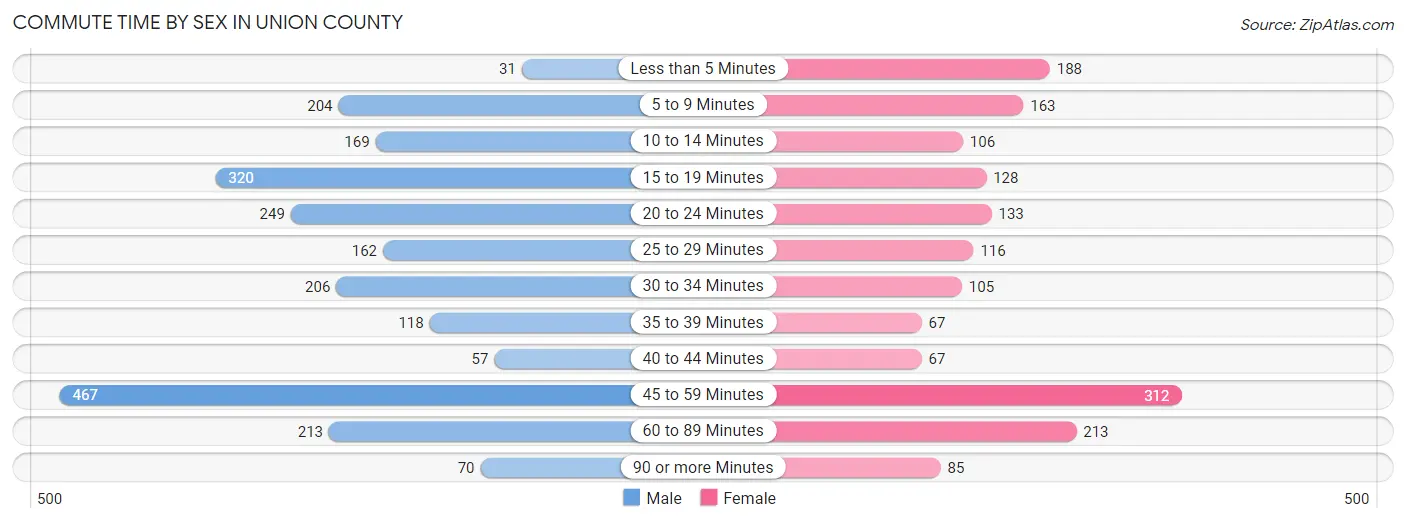
| Commute Time | Male | Female |
| Less than 5 Minutes | 31 (1.4%) | 188 (11.2%) |
| 5 to 9 Minutes | 204 (9.0%) | 163 (9.7%) |
| 10 to 14 Minutes | 169 (7.5%) | 106 (6.3%) |
| 15 to 19 Minutes | 320 (14.1%) | 128 (7.6%) |
| 20 to 24 Minutes | 249 (11.0%) | 133 (7.9%) |
| 25 to 29 Minutes | 162 (7.1%) | 116 (6.9%) |
| 30 to 34 Minutes | 206 (9.1%) | 105 (6.2%) |
| 35 to 39 Minutes | 118 (5.2%) | 67 (4.0%) |
| 40 to 44 Minutes | 57 (2.5%) | 67 (4.0%) |
| 45 to 59 Minutes | 467 (20.6%) | 312 (18.5%) |
| 60 to 89 Minutes | 213 (9.4%) | 213 (12.7%) |
| 90 or more Minutes | 70 (3.1%) | 85 (5.1%) |
Time of Departure to Work by Sex in Union County
The most frequent times of departure to work in Union County are 6:00 AM to 6:29 AM (369, 16.3%) for males and 7:00 AM to 7:29 AM (468, 27.8%) for females.
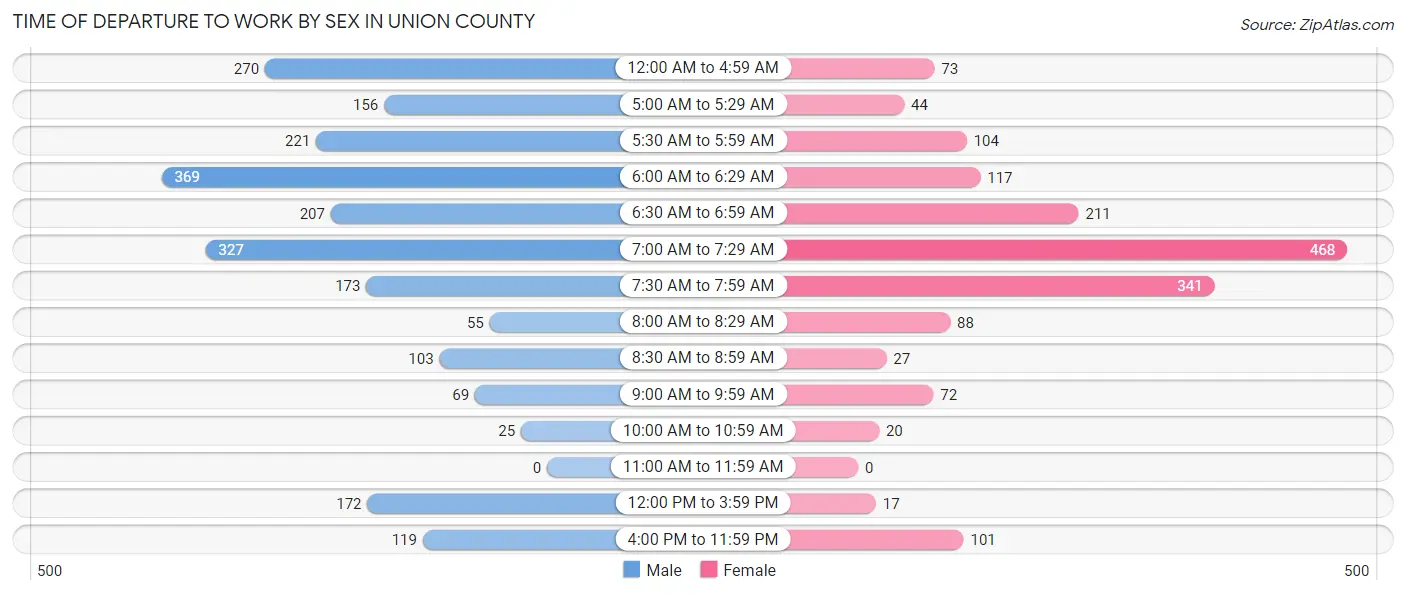
| Time of Departure | Male | Female |
| 12:00 AM to 4:59 AM | 270 (11.9%) | 73 (4.3%) |
| 5:00 AM to 5:29 AM | 156 (6.9%) | 44 (2.6%) |
| 5:30 AM to 5:59 AM | 221 (9.8%) | 104 (6.2%) |
| 6:00 AM to 6:29 AM | 369 (16.3%) | 117 (7.0%) |
| 6:30 AM to 6:59 AM | 207 (9.1%) | 211 (12.5%) |
| 7:00 AM to 7:29 AM | 327 (14.4%) | 468 (27.8%) |
| 7:30 AM to 7:59 AM | 173 (7.6%) | 341 (20.3%) |
| 8:00 AM to 8:29 AM | 55 (2.4%) | 88 (5.2%) |
| 8:30 AM to 8:59 AM | 103 (4.5%) | 27 (1.6%) |
| 9:00 AM to 9:59 AM | 69 (3.0%) | 72 (4.3%) |
| 10:00 AM to 10:59 AM | 25 (1.1%) | 20 (1.2%) |
| 11:00 AM to 11:59 AM | 0 (0.0%) | 0 (0.0%) |
| 12:00 PM to 3:59 PM | 172 (7.6%) | 17 (1.0%) |
| 4:00 PM to 11:59 PM | 119 (5.2%) | 101 (6.0%) |
| Total | 2,266 (100.0%) | 1,683 (100.0%) |
Housing Occupancy in Union County
Occupancy by Ownership in Union County
Of the total 4,094 dwellings in Union County, owner-occupied units account for 2,855 (69.7%), while renter-occupied units make up 1,239 (30.3%).
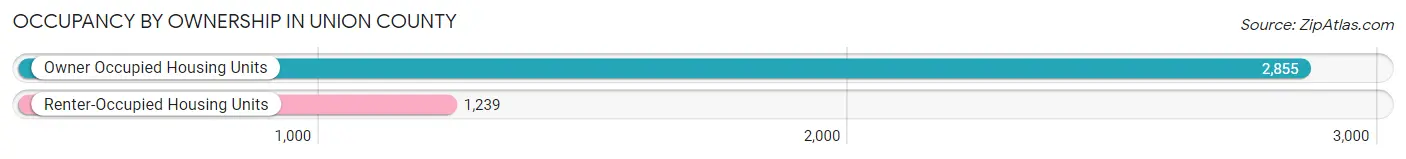
| Occupancy | # Housing Units | % Housing Units |
| Owner Occupied Housing Units | 2,855 | 69.7% |
| Renter-Occupied Housing Units | 1,239 | 30.3% |
| Total Occupied Housing Units | 4,094 | 100.0% |
Occupancy by Household Size in Union County
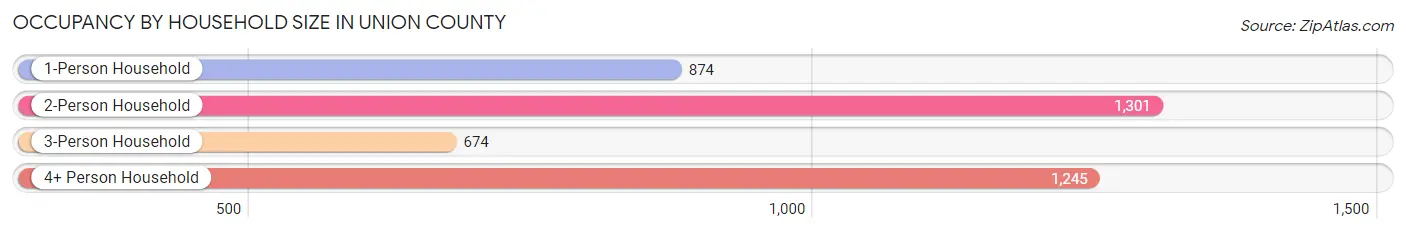
| Household Size | # Housing Units | % Housing Units |
| 1-Person Household | 874 | 21.3% |
| 2-Person Household | 1,301 | 31.8% |
| 3-Person Household | 674 | 16.5% |
| 4+ Person Household | 1,245 | 30.4% |
| Total Housing Units | 4,094 | 100.0% |
Occupancy by Ownership by Household Size in Union County
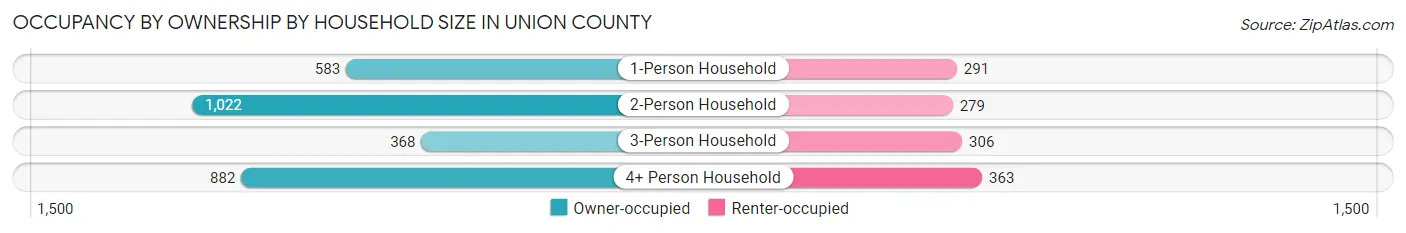
| Household Size | Owner-occupied | Renter-occupied |
| 1-Person Household | 583 (66.7%) | 291 (33.3%) |
| 2-Person Household | 1,022 (78.5%) | 279 (21.4%) |
| 3-Person Household | 368 (54.6%) | 306 (45.4%) |
| 4+ Person Household | 882 (70.8%) | 363 (29.2%) |
| Total Housing Units | 2,855 (69.7%) | 1,239 (30.3%) |
Occupancy by Educational Attainment in Union County
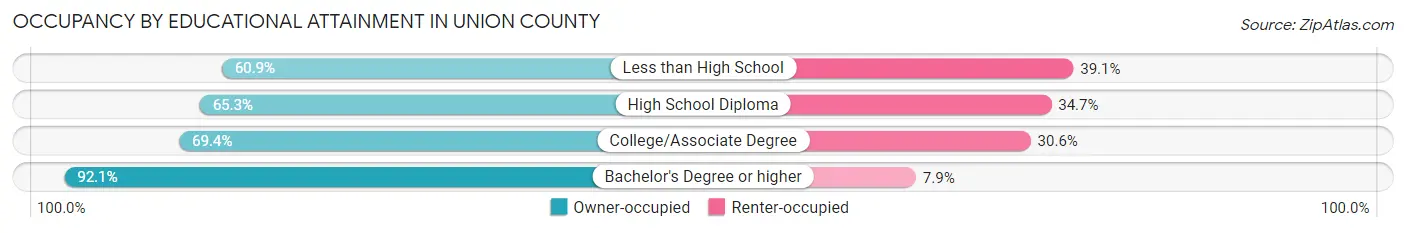
| Household Size | Owner-occupied | Renter-occupied |
| Less than High School | 226 (60.9%) | 145 (39.1%) |
| High School Diploma | 1,149 (65.3%) | 611 (34.7%) |
| College/Associate Degree | 1,001 (69.4%) | 442 (30.6%) |
| Bachelor's Degree or higher | 479 (92.1%) | 41 (7.9%) |
Occupancy by Age of Householder in Union County
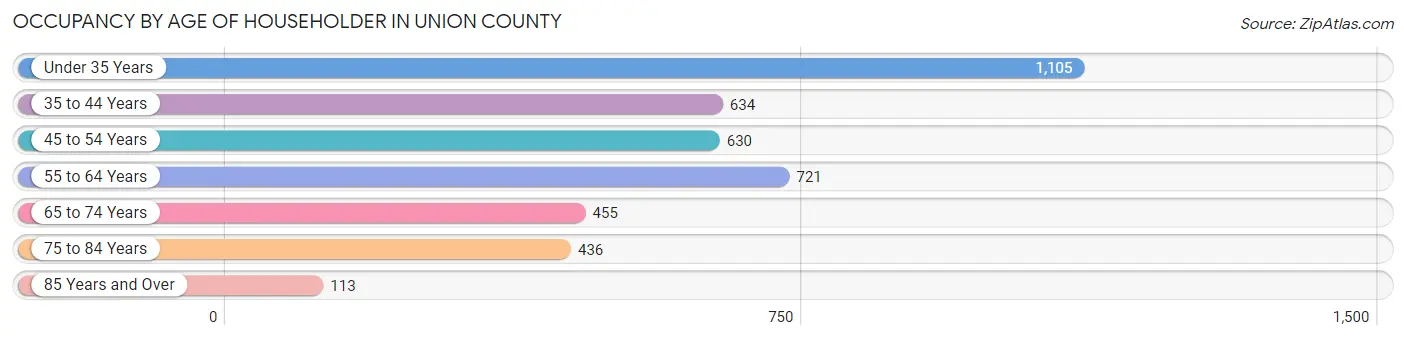
| Age Bracket | # Households | % Households |
| Under 35 Years | 1,105 | 27.0% |
| 35 to 44 Years | 634 | 15.5% |
| 45 to 54 Years | 630 | 15.4% |
| 55 to 64 Years | 721 | 17.6% |
| 65 to 74 Years | 455 | 11.1% |
| 75 to 84 Years | 436 | 10.6% |
| 85 Years and Over | 113 | 2.8% |
| Total | 4,094 | 100.0% |
Housing Finances in Union County
Median Income by Occupancy in Union County
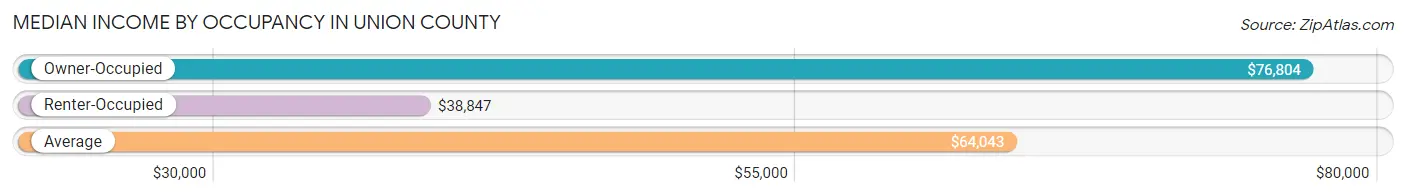
| Occupancy Type | # Households | Median Income |
| Owner-Occupied | 2,855 (69.7%) | $76,804 |
| Renter-Occupied | 1,239 (30.3%) | $38,847 |
| Average | 4,094 (100.0%) | $64,043 |
Occupancy by Householder Income Bracket in Union County
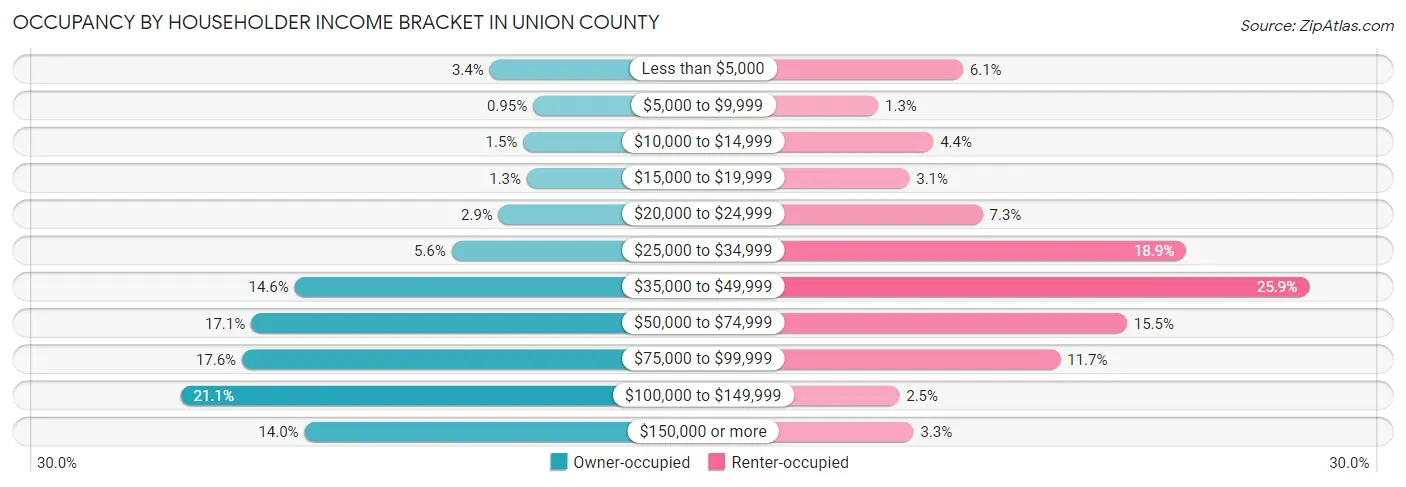
| Income Bracket | Owner-occupied | Renter-occupied |
| Less than $5,000 | 98 (3.4%) | 76 (6.1%) |
| $5,000 to $9,999 | 27 (0.9%) | 16 (1.3%) |
| $10,000 to $14,999 | 43 (1.5%) | 55 (4.4%) |
| $15,000 to $19,999 | 37 (1.3%) | 38 (3.1%) |
| $20,000 to $24,999 | 83 (2.9%) | 90 (7.3%) |
| $25,000 to $34,999 | 160 (5.6%) | 234 (18.9%) |
| $35,000 to $49,999 | 416 (14.6%) | 321 (25.9%) |
| $50,000 to $74,999 | 487 (17.1%) | 192 (15.5%) |
| $75,000 to $99,999 | 502 (17.6%) | 145 (11.7%) |
| $100,000 to $149,999 | 602 (21.1%) | 31 (2.5%) |
| $150,000 or more | 400 (14.0%) | 41 (3.3%) |
| Total | 2,855 (100.0%) | 1,239 (100.0%) |
Monthly Housing Cost Tiers in Union County
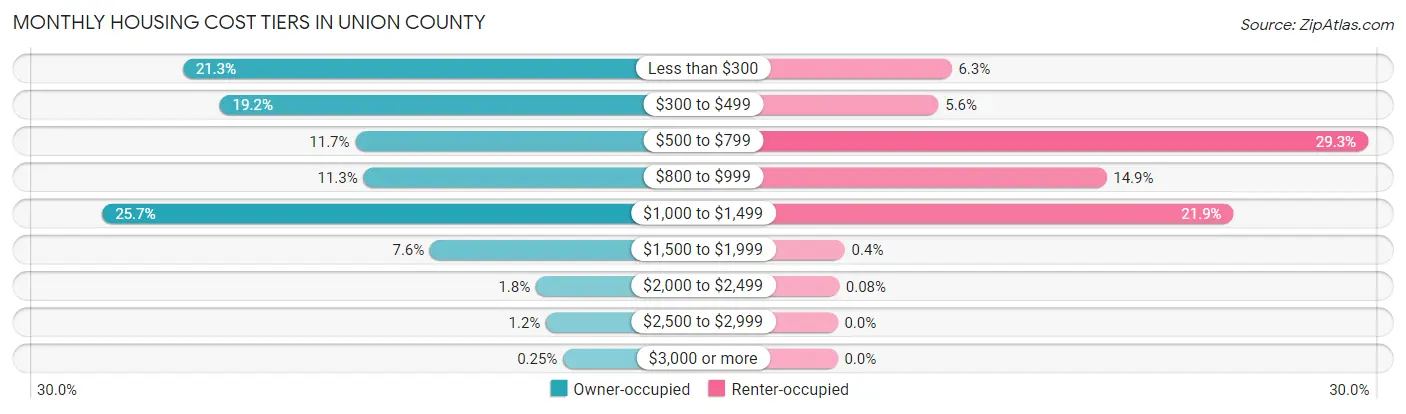
| Monthly Cost | Owner-occupied | Renter-occupied |
| Less than $300 | 607 (21.3%) | 78 (6.3%) |
| $300 to $499 | 549 (19.2%) | 69 (5.6%) |
| $500 to $799 | 335 (11.7%) | 363 (29.3%) |
| $800 to $999 | 322 (11.3%) | 184 (14.8%) |
| $1,000 to $1,499 | 734 (25.7%) | 271 (21.9%) |
| $1,500 to $1,999 | 217 (7.6%) | 5 (0.4%) |
| $2,000 to $2,499 | 50 (1.8%) | 1 (0.1%) |
| $2,500 to $2,999 | 34 (1.2%) | 0 (0.0%) |
| $3,000 or more | 7 (0.3%) | 0 (0.0%) |
| Total | 2,855 (100.0%) | 1,239 (100.0%) |
Physical Housing Characteristics in Union County
Housing Structures in Union County
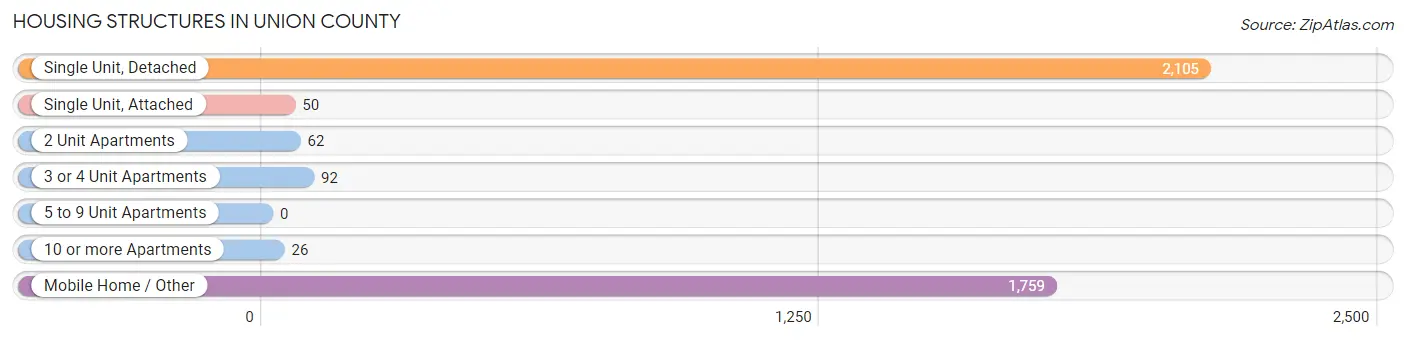
| Structure Type | # Housing Units | % Housing Units |
| Single Unit, Detached | 2,105 | 51.4% |
| Single Unit, Attached | 50 | 1.2% |
| 2 Unit Apartments | 62 | 1.5% |
| 3 or 4 Unit Apartments | 92 | 2.2% |
| 5 to 9 Unit Apartments | 0 | 0.0% |
| 10 or more Apartments | 26 | 0.6% |
| Mobile Home / Other | 1,759 | 43.0% |
| Total | 4,094 | 100.0% |
Housing Structures by Occupancy in Union County
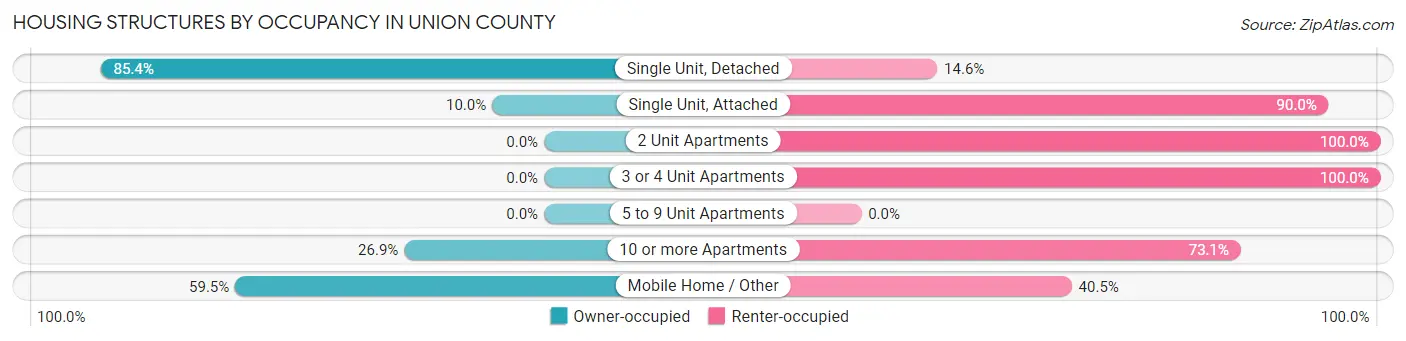
| Structure Type | Owner-occupied | Renter-occupied |
| Single Unit, Detached | 1,797 (85.4%) | 308 (14.6%) |
| Single Unit, Attached | 5 (10.0%) | 45 (90.0%) |
| 2 Unit Apartments | 0 (0.0%) | 62 (100.0%) |
| 3 or 4 Unit Apartments | 0 (0.0%) | 92 (100.0%) |
| 5 to 9 Unit Apartments | 0 (0.0%) | 0 (0.0%) |
| 10 or more Apartments | 7 (26.9%) | 19 (73.1%) |
| Mobile Home / Other | 1,046 (59.5%) | 713 (40.5%) |
| Total | 2,855 (69.7%) | 1,239 (30.3%) |
Housing Structures by Number of Rooms in Union County
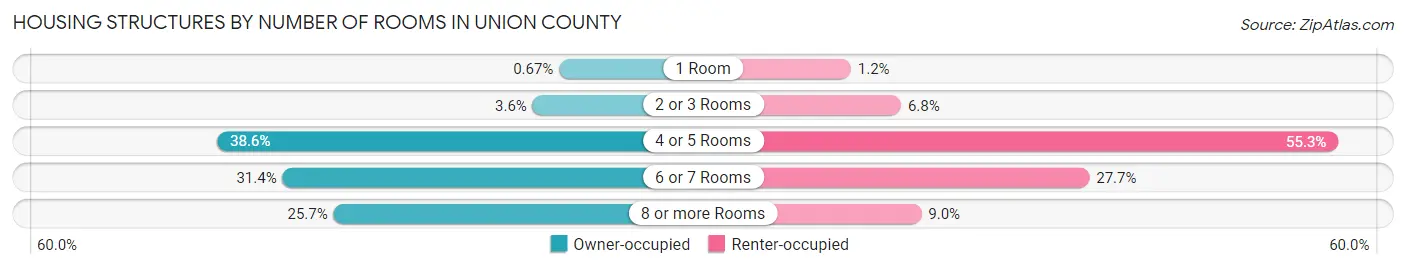
| Number of Rooms | Owner-occupied | Renter-occupied |
| 1 Room | 19 (0.7%) | 15 (1.2%) |
| 2 or 3 Rooms | 103 (3.6%) | 84 (6.8%) |
| 4 or 5 Rooms | 1,103 (38.6%) | 685 (55.3%) |
| 6 or 7 Rooms | 896 (31.4%) | 343 (27.7%) |
| 8 or more Rooms | 734 (25.7%) | 112 (9.0%) |
| Total | 2,855 (100.0%) | 1,239 (100.0%) |
Housing Structure by Heating Type in Union County
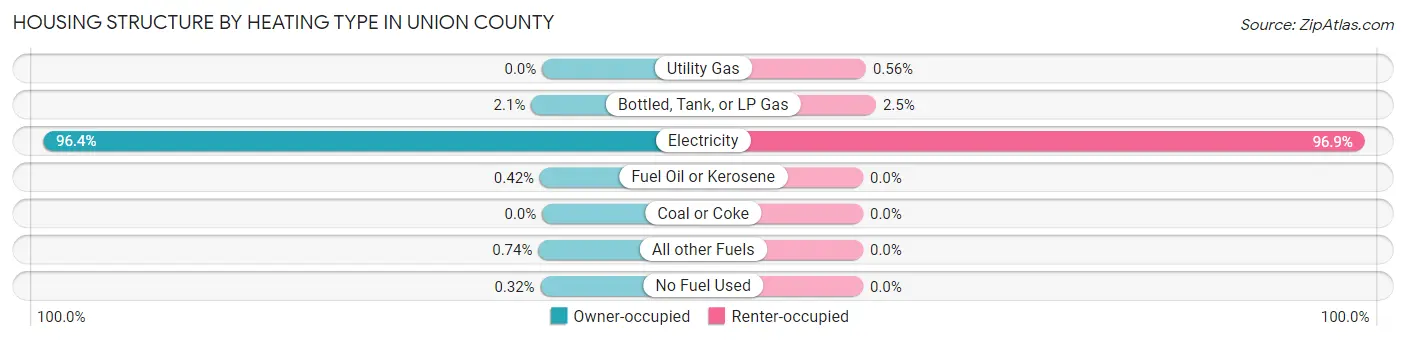
| Heating Type | Owner-occupied | Renter-occupied |
| Utility Gas | 0 (0.0%) | 7 (0.6%) |
| Bottled, Tank, or LP Gas | 60 (2.1%) | 31 (2.5%) |
| Electricity | 2,753 (96.4%) | 1,201 (96.9%) |
| Fuel Oil or Kerosene | 12 (0.4%) | 0 (0.0%) |
| Coal or Coke | 0 (0.0%) | 0 (0.0%) |
| All other Fuels | 21 (0.7%) | 0 (0.0%) |
| No Fuel Used | 9 (0.3%) | 0 (0.0%) |
| Total | 2,855 (100.0%) | 1,239 (100.0%) |
Household Vehicle Usage in Union County
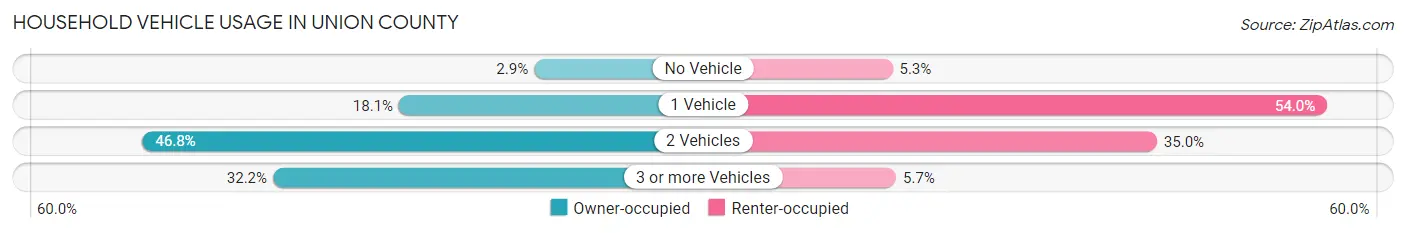
| Vehicles per Household | Owner-occupied | Renter-occupied |
| No Vehicle | 84 (2.9%) | 66 (5.3%) |
| 1 Vehicle | 516 (18.1%) | 669 (54.0%) |
| 2 Vehicles | 1,336 (46.8%) | 433 (34.9%) |
| 3 or more Vehicles | 919 (32.2%) | 71 (5.7%) |
| Total | 2,855 (100.0%) | 1,239 (100.0%) |
Real Estate & Mortgages in Union County
Real Estate and Mortgage Overview in Union County
| Characteristic | Without Mortgage | With Mortgage |
| Housing Units | 1,325 | 1,530 |
| Median Property Value | $115,200 | $175,600 |
| Median Household Income | $66,099 | $264 |
| Monthly Housing Costs | $316 | $7 |
| Real Estate Taxes | $715 | $185 |
Property Value by Mortgage Status in Union County
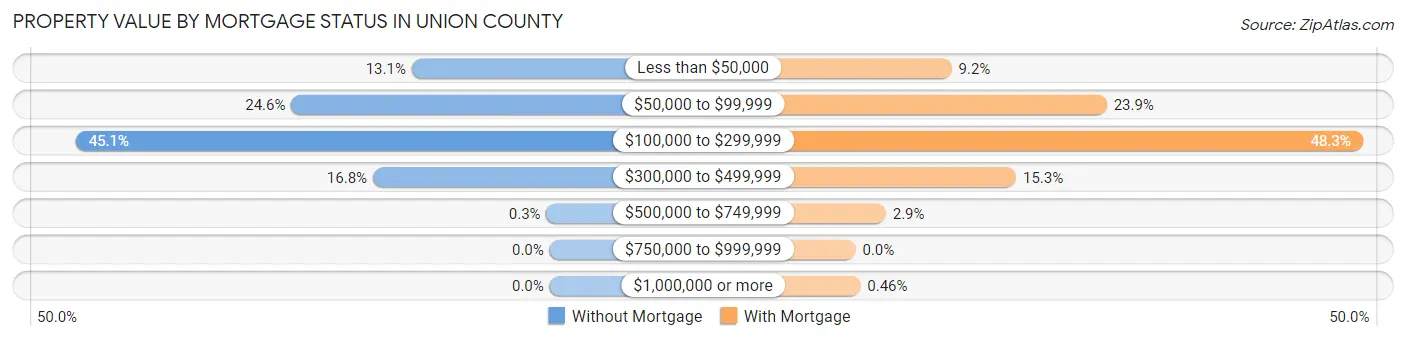
| Property Value | Without Mortgage | With Mortgage |
| Less than $50,000 | 174 (13.1%) | 140 (9.1%) |
| $50,000 to $99,999 | 326 (24.6%) | 366 (23.9%) |
| $100,000 to $299,999 | 598 (45.1%) | 739 (48.3%) |
| $300,000 to $499,999 | 223 (16.8%) | 234 (15.3%) |
| $500,000 to $749,999 | 4 (0.3%) | 44 (2.9%) |
| $750,000 to $999,999 | 0 (0.0%) | 0 (0.0%) |
| $1,000,000 or more | 0 (0.0%) | 7 (0.5%) |
| Total | 1,325 (100.0%) | 1,530 (100.0%) |
Household Income by Mortgage Status in Union County
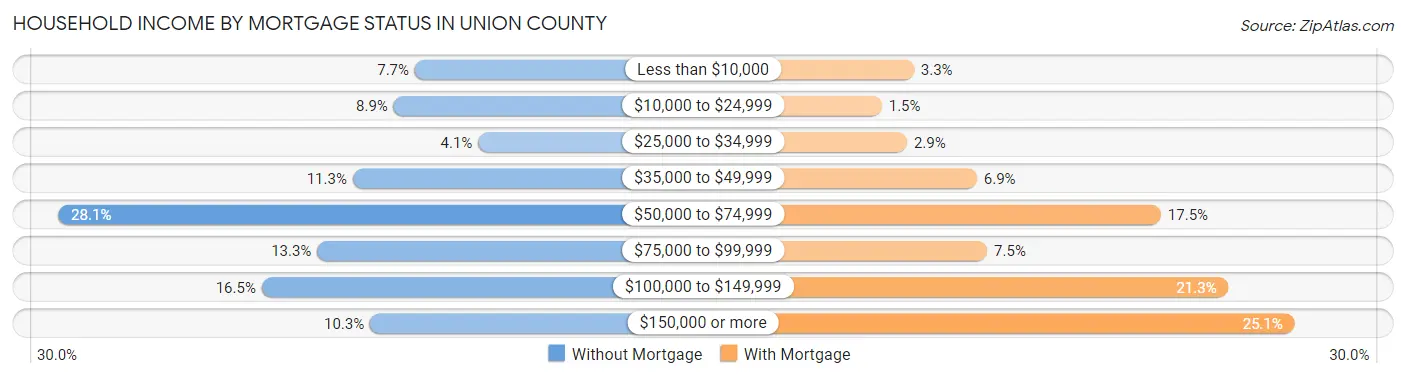
| Household Income | Without Mortgage | With Mortgage |
| Less than $10,000 | 102 (7.7%) | 51 (3.3%) |
| $10,000 to $24,999 | 118 (8.9%) | 23 (1.5%) |
| $25,000 to $34,999 | 54 (4.1%) | 45 (2.9%) |
| $35,000 to $49,999 | 149 (11.3%) | 106 (6.9%) |
| $50,000 to $74,999 | 372 (28.1%) | 267 (17.4%) |
| $75,000 to $99,999 | 176 (13.3%) | 115 (7.5%) |
| $100,000 to $149,999 | 218 (16.5%) | 326 (21.3%) |
| $150,000 or more | 136 (10.3%) | 384 (25.1%) |
| Total | 1,325 (100.0%) | 1,530 (100.0%) |
Property Value to Household Income Ratio in Union County
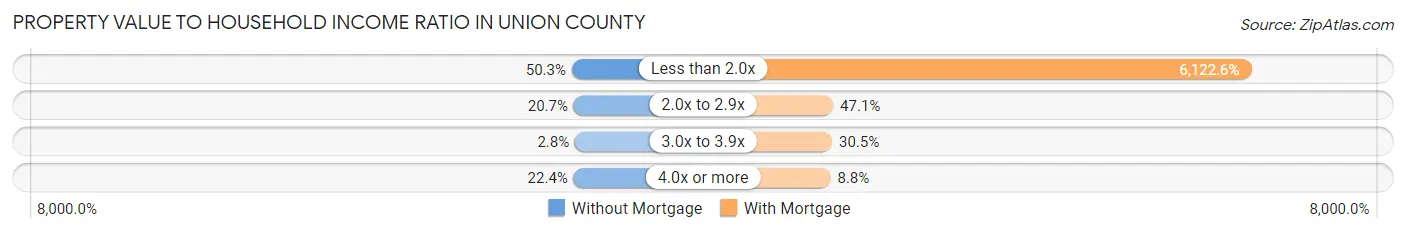
| Value-to-Income Ratio | Without Mortgage | With Mortgage |
| Less than 2.0x | 666 (50.3%) | 93,676 (6,122.6%) |
| 2.0x to 2.9x | 274 (20.7%) | 720 (47.1%) |
| 3.0x to 3.9x | 37 (2.8%) | 467 (30.5%) |
| 4.0x or more | 297 (22.4%) | 134 (8.8%) |
| Total | 1,325 (100.0%) | 1,530 (100.0%) |
Real Estate Taxes by Mortgage Status in Union County
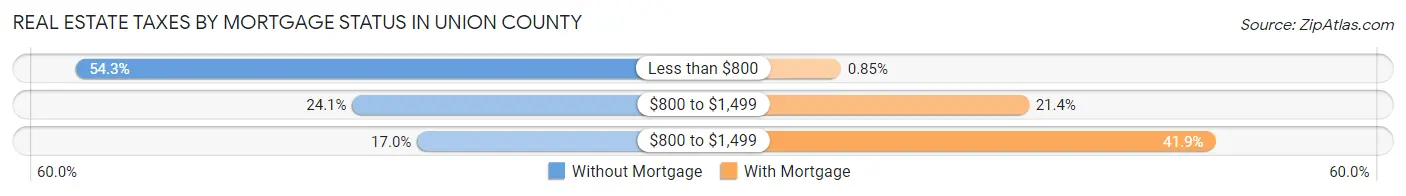
| Property Taxes | Without Mortgage | With Mortgage |
| Less than $800 | 720 (54.3%) | 13 (0.9%) |
| $800 to $1,499 | 319 (24.1%) | 328 (21.4%) |
| $800 to $1,499 | 225 (17.0%) | 641 (41.9%) |
| Total | 1,325 (100.0%) | 1,530 (100.0%) |
Health & Disability in Union County
Health Insurance Coverage by Age in Union County
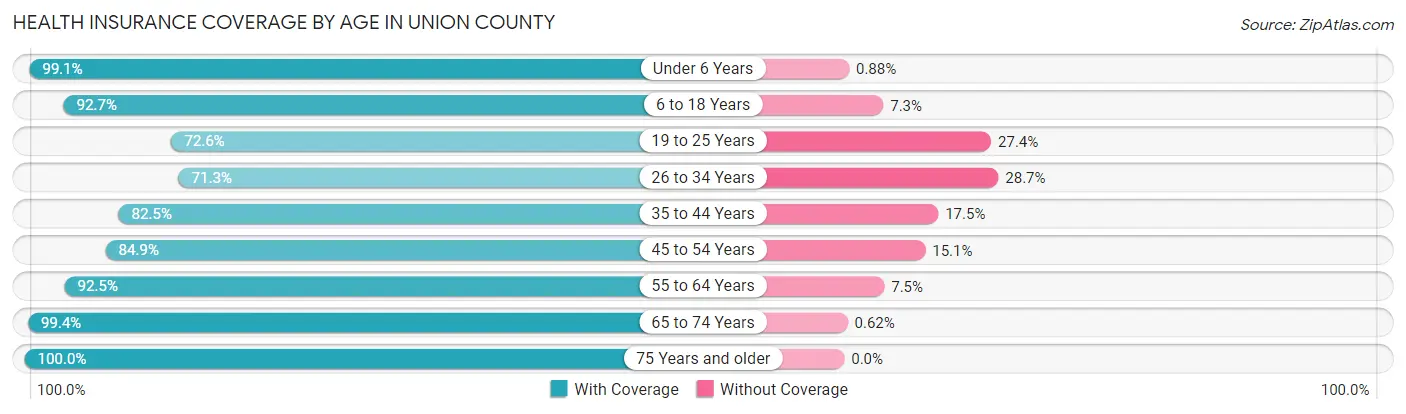
| Age Bracket | With Coverage | Without Coverage |
| Under 6 Years | 1,127 (99.1%) | 10 (0.9%) |
| 6 to 18 Years | 2,168 (92.7%) | 170 (7.3%) |
| 19 to 25 Years | 634 (72.6%) | 239 (27.4%) |
| 26 to 34 Years | 779 (71.3%) | 314 (28.7%) |
| 35 to 44 Years | 824 (82.5%) | 175 (17.5%) |
| 45 to 54 Years | 1,113 (84.9%) | 198 (15.1%) |
| 55 to 64 Years | 1,029 (92.5%) | 83 (7.5%) |
| 65 to 74 Years | 801 (99.4%) | 5 (0.6%) |
| 75 Years and older | 813 (100.0%) | 0 (0.0%) |
| Total | 9,288 (88.6%) | 1,194 (11.4%) |
Health Insurance Coverage by Citizenship Status in Union County
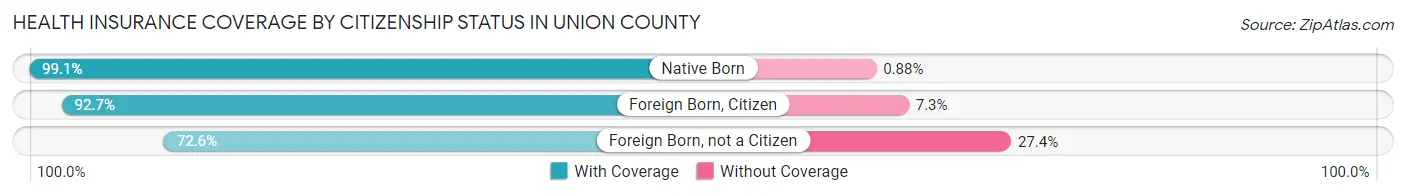
| Citizenship Status | With Coverage | Without Coverage |
| Native Born | 1,127 (99.1%) | 10 (0.9%) |
| Foreign Born, Citizen | 2,168 (92.7%) | 170 (7.3%) |
| Foreign Born, not a Citizen | 634 (72.6%) | 239 (27.4%) |
Health Insurance Coverage by Household Income in Union County
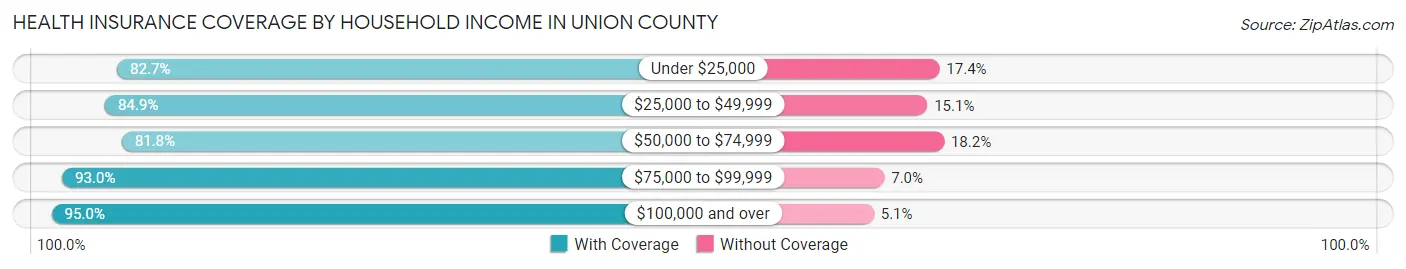
| Household Income | With Coverage | Without Coverage |
| Under $25,000 | 1,081 (82.7%) | 227 (17.3%) |
| $25,000 to $49,999 | 1,803 (84.9%) | 320 (15.1%) |
| $50,000 to $74,999 | 1,595 (81.8%) | 355 (18.2%) |
| $75,000 to $99,999 | 1,615 (93.0%) | 122 (7.0%) |
| $100,000 and over | 3,194 (95.0%) | 170 (5.1%) |
Public vs Private Health Insurance Coverage by Age in Union County
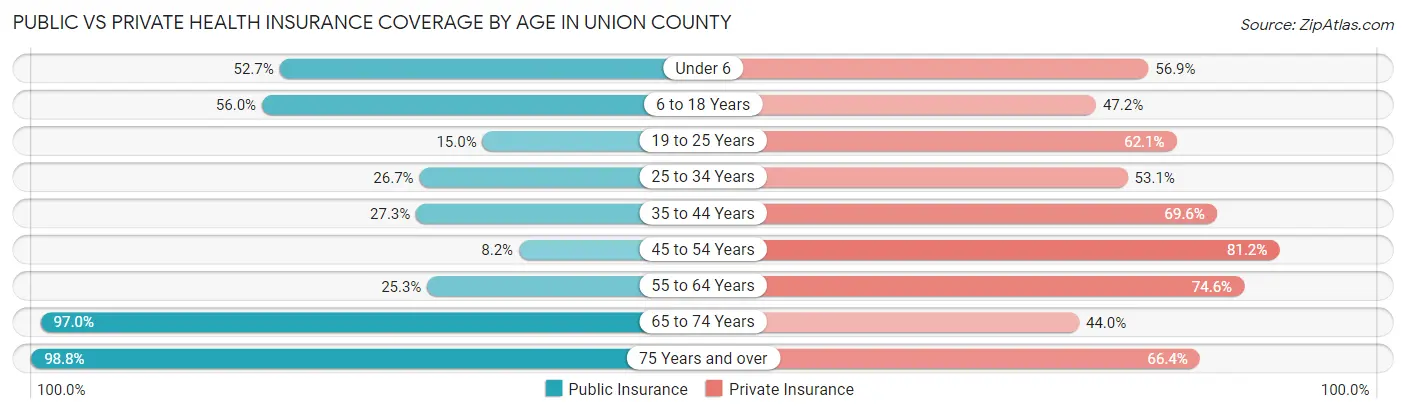
| Age Bracket | Public Insurance | Private Insurance |
| Under 6 | 599 (52.7%) | 647 (56.9%) |
| 6 to 18 Years | 1,308 (55.9%) | 1,103 (47.2%) |
| 19 to 25 Years | 131 (15.0%) | 542 (62.1%) |
| 25 to 34 Years | 292 (26.7%) | 580 (53.1%) |
| 35 to 44 Years | 273 (27.3%) | 695 (69.6%) |
| 45 to 54 Years | 108 (8.2%) | 1,064 (81.2%) |
| 55 to 64 Years | 281 (25.3%) | 830 (74.6%) |
| 65 to 74 Years | 782 (97.0%) | 355 (44.0%) |
| 75 Years and over | 803 (98.8%) | 540 (66.4%) |
| Total | 4,577 (43.7%) | 6,356 (60.6%) |
Disability Status by Sex by Age in Union County
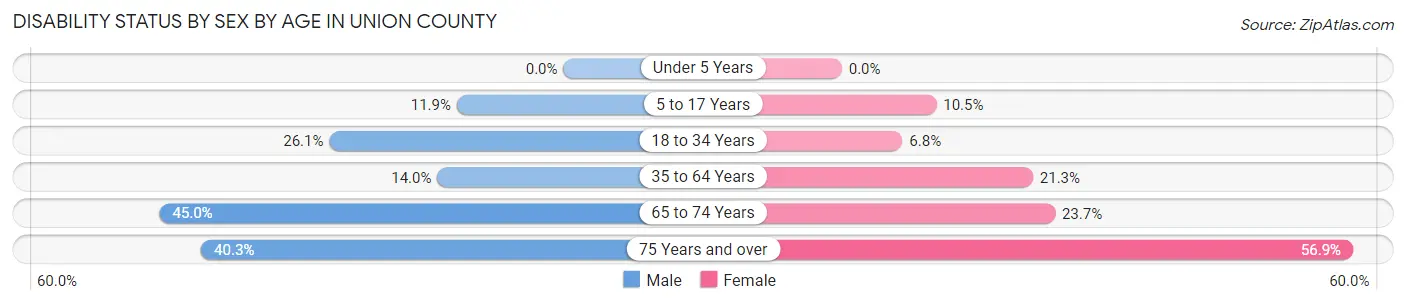
| Age Bracket | Male | Female |
| Under 5 Years | 0 (0.0%) | 0 (0.0%) |
| 5 to 17 Years | 148 (11.9%) | 130 (10.5%) |
| 18 to 34 Years | 274 (26.1%) | 71 (6.8%) |
| 35 to 64 Years | 241 (14.0%) | 363 (21.3%) |
| 65 to 74 Years | 103 (45.0%) | 137 (23.7%) |
| 75 Years and over | 121 (40.3%) | 292 (56.9%) |
Disability Class by Sex by Age in Union County
Disability Class: Hearing Difficulty
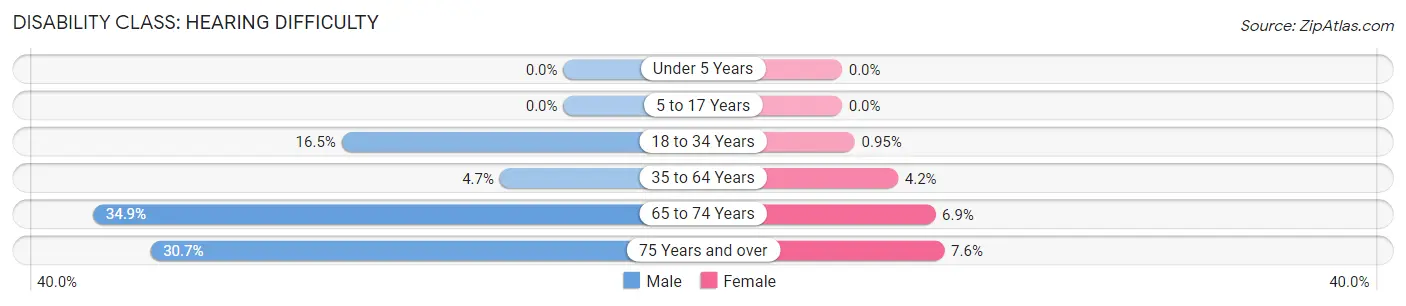
| Age Bracket | Male | Female |
| Under 5 Years | 0 (0.0%) | 0 (0.0%) |
| 5 to 17 Years | 0 (0.0%) | 0 (0.0%) |
| 18 to 34 Years | 173 (16.5%) | 10 (0.9%) |
| 35 to 64 Years | 81 (4.7%) | 71 (4.2%) |
| 65 to 74 Years | 80 (34.9%) | 40 (6.9%) |
| 75 Years and over | 92 (30.7%) | 39 (7.6%) |
Disability Class: Vision Difficulty
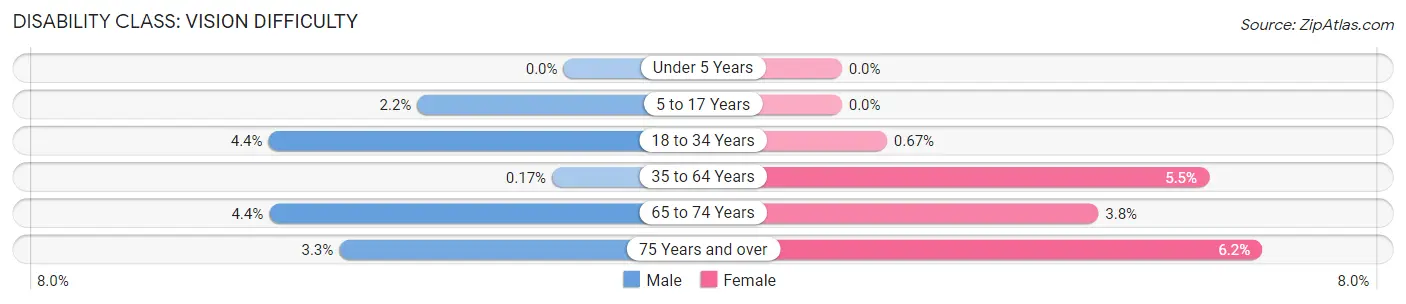
| Age Bracket | Male | Female |
| Under 5 Years | 0 (0.0%) | 0 (0.0%) |
| 5 to 17 Years | 27 (2.2%) | 0 (0.0%) |
| 18 to 34 Years | 46 (4.4%) | 7 (0.7%) |
| 35 to 64 Years | 3 (0.2%) | 93 (5.4%) |
| 65 to 74 Years | 10 (4.4%) | 22 (3.8%) |
| 75 Years and over | 10 (3.3%) | 32 (6.2%) |
Disability Class: Cognitive Difficulty
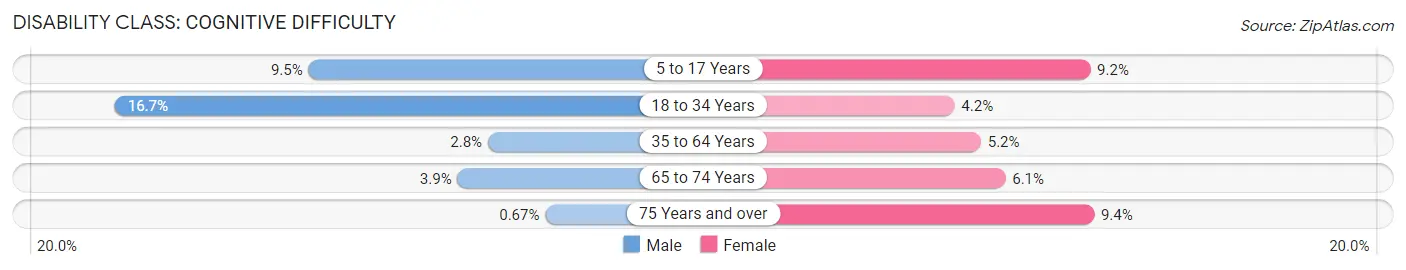
| Age Bracket | Male | Female |
| 5 to 17 Years | 118 (9.5%) | 114 (9.2%) |
| 18 to 34 Years | 175 (16.7%) | 44 (4.2%) |
| 35 to 64 Years | 48 (2.8%) | 88 (5.2%) |
| 65 to 74 Years | 9 (3.9%) | 35 (6.1%) |
| 75 Years and over | 2 (0.7%) | 48 (9.4%) |
Disability Class: Ambulatory Difficulty
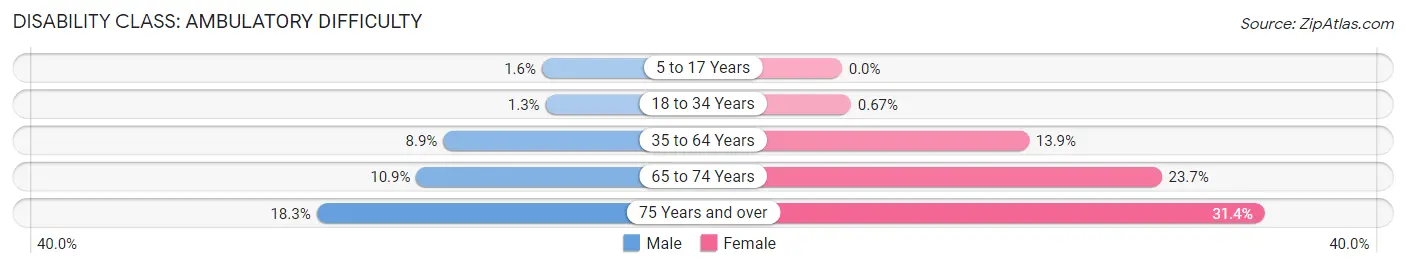
| Age Bracket | Male | Female |
| 5 to 17 Years | 20 (1.6%) | 0 (0.0%) |
| 18 to 34 Years | 14 (1.3%) | 7 (0.7%) |
| 35 to 64 Years | 153 (8.9%) | 237 (13.9%) |
| 65 to 74 Years | 25 (10.9%) | 137 (23.7%) |
| 75 Years and over | 55 (18.3%) | 161 (31.4%) |
Disability Class: Self-Care Difficulty
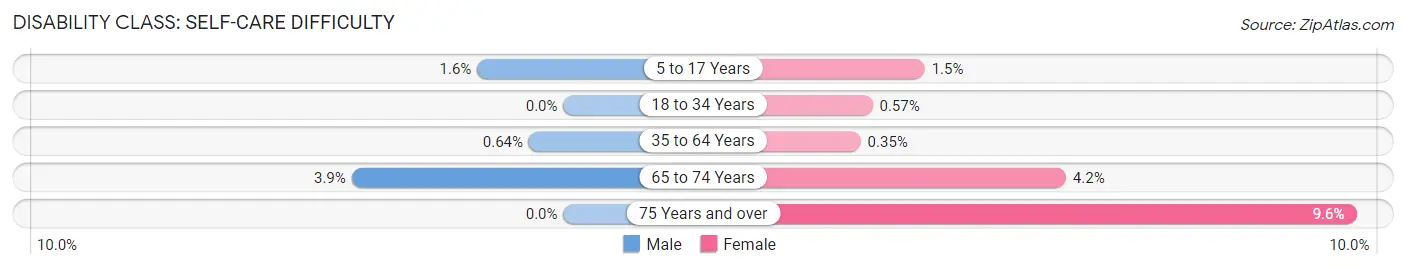
| Age Bracket | Male | Female |
| 5 to 17 Years | 20 (1.6%) | 19 (1.5%) |
| 18 to 34 Years | 0 (0.0%) | 6 (0.6%) |
| 35 to 64 Years | 11 (0.6%) | 6 (0.4%) |
| 65 to 74 Years | 9 (3.9%) | 24 (4.2%) |
| 75 Years and over | 0 (0.0%) | 49 (9.6%) |
Technology Access in Union County
Computing Device Access in Union County
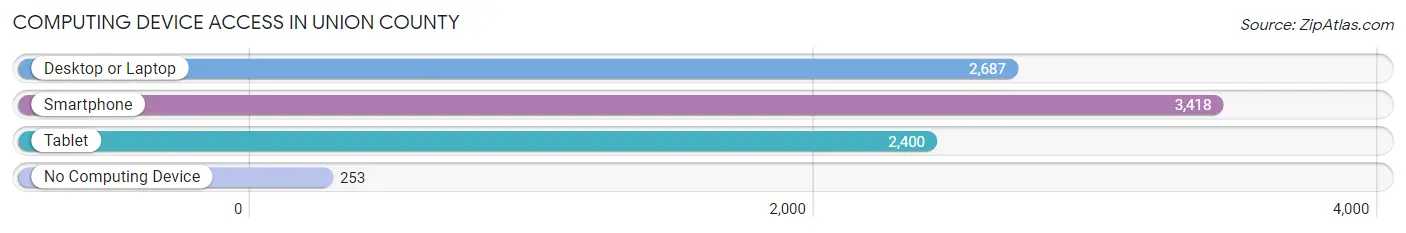
| Device Type | # Households | % Households |
| Desktop or Laptop | 2,687 | 65.6% |
| Smartphone | 3,418 | 83.5% |
| Tablet | 2,400 | 58.6% |
| No Computing Device | 253 | 6.2% |
| Total | 4,094 | 100.0% |
Internet Access in Union County
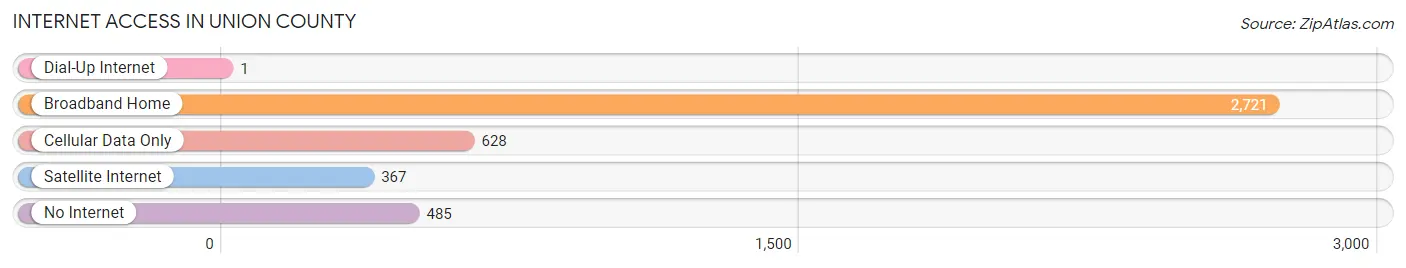
| Internet Type | # Households | % Households |
| Dial-Up Internet | 1 | 0.0% |
| Broadband Home | 2,721 | 66.5% |
| Cellular Data Only | 628 | 15.3% |
| Satellite Internet | 367 | 9.0% |
| No Internet | 485 | 11.8% |
| Total | 4,094 | 100.0% |
Union County Summary
Introduction
Union County is located in the north-central part of the state of Florida. It is bordered by Bradford County to the east, Alachua County to the south, Columbia County to the west, and Baker County to the north. The county seat is Lake Butler, and the largest city is Lake City. The county was established in 1921 and is named for the union of Bradford and Columbia counties.
History
Union County was created in 1921 from parts of Bradford and Columbia counties. The county was named for the union of the two counties. The county seat is Lake Butler, which was established in 1859. The county was originally a farming community, but in the late 19th century, the timber industry began to take off. The county was also home to several phosphate mines, which provided jobs for many of the residents.
In the early 20th century, the county began to experience a population boom as people moved to the area for the timber and phosphate industries. The county also experienced a surge in tourism, as people began to visit the area for its natural beauty.
Geography
Union County is located in the north-central part of the state of Florida. It is bordered by Bradford County to the east, Alachua County to the south, Columbia County to the west, and Baker County to the north. The county has a total area of 545 square miles, of which 543 square miles is land and 2 square miles is water. The county is mostly flat, with some rolling hills in the northern part of the county. The county is home to several rivers, including the Santa Fe River, the Suwannee River, and the Withlacoochee River.
Economy
Union County’s economy is largely based on agriculture and timber. The county is home to several large farms, which produce a variety of crops, including corn, soybeans, cotton, and peanuts. The timber industry is also a major part of the county’s economy, with several large timber companies operating in the area.
The county is also home to several phosphate mines, which provide jobs for many of the residents. The county is also home to several manufacturing companies, including a paper mill and a plastics plant.
Demographics
As of the 2010 census, the population of Union County was 15,535. The population is mostly white (83.3%), with African Americans making up 11.3% of the population, Hispanics making up 3.3%, and Asians making up 1.2%. The median household income is $37,845, and the median home value is $117,400.
Conclusion
Union County is a rural county located in the north-central part of the state of Florida. The county was established in 1921 and is named for the union of Bradford and Columbia counties. The county’s economy is largely based on agriculture and timber, and the county is also home to several phosphate mines. The population of Union County is mostly white, with African Americans, Hispanics, and Asians making up the remainder of the population.
Common Questions
What is Per Capita Income in Union County?
Per Capita income in Union County is $24,293.
What is the Median Family Income in Union County?
Median Family Income in Union County is $73,474.
What is the Median Household income in Union County?
Median Household Income in Union County is $64,043.
What is Income or Wage Gap in Union County?
Income or Wage Gap in Union County is 12.5%.
Women in Union County earn 87.5 cents for every dollar earned by a man.
What is Family Income Deficit in Union County?
Family Income Deficit in Union County is $17,390.
Families that are below poverty line in Union County earn $17,390 less on average than the poverty threshold level.
What is Inequality or Gini Index in Union County?
Inequality or Gini Index in Union County is 0.51.
What is the Total Population of Union County?
Total Population of Union County is 15,524.
What is the Total Male Population of Union County?
Total Male Population of Union County is 10,059.
What is the Total Female Population of Union County?
Total Female Population of Union County is 5,465.
What is the Ratio of Males per 100 Females in Union County?
There are 184.06 Males per 100 Females in Union County.
What is the Ratio of Females per 100 Males in Union County?
There are 54.33 Females per 100 Males in Union County.
What is the Median Population Age in Union County?
Median Population Age in Union County is 39.7 Years.
What is the Average Family Size in Union County
Average Family Size in Union County is 3.0 People.
What is the Average Household Size in Union County
Average Household Size in Union County is 2.6 People.
How Large is the Labor Force in Union County?
There are 4,446 People in the Labor Forcein in Union County.
What is the Percentage of People in the Labor Force in Union County?
35.3% of People are in the Labor Force in Union County.
What is the Unemployment Rate in Union County?
Unemployment Rate in Union County is 3.6%.