Taylor County, FL Map & Demographics
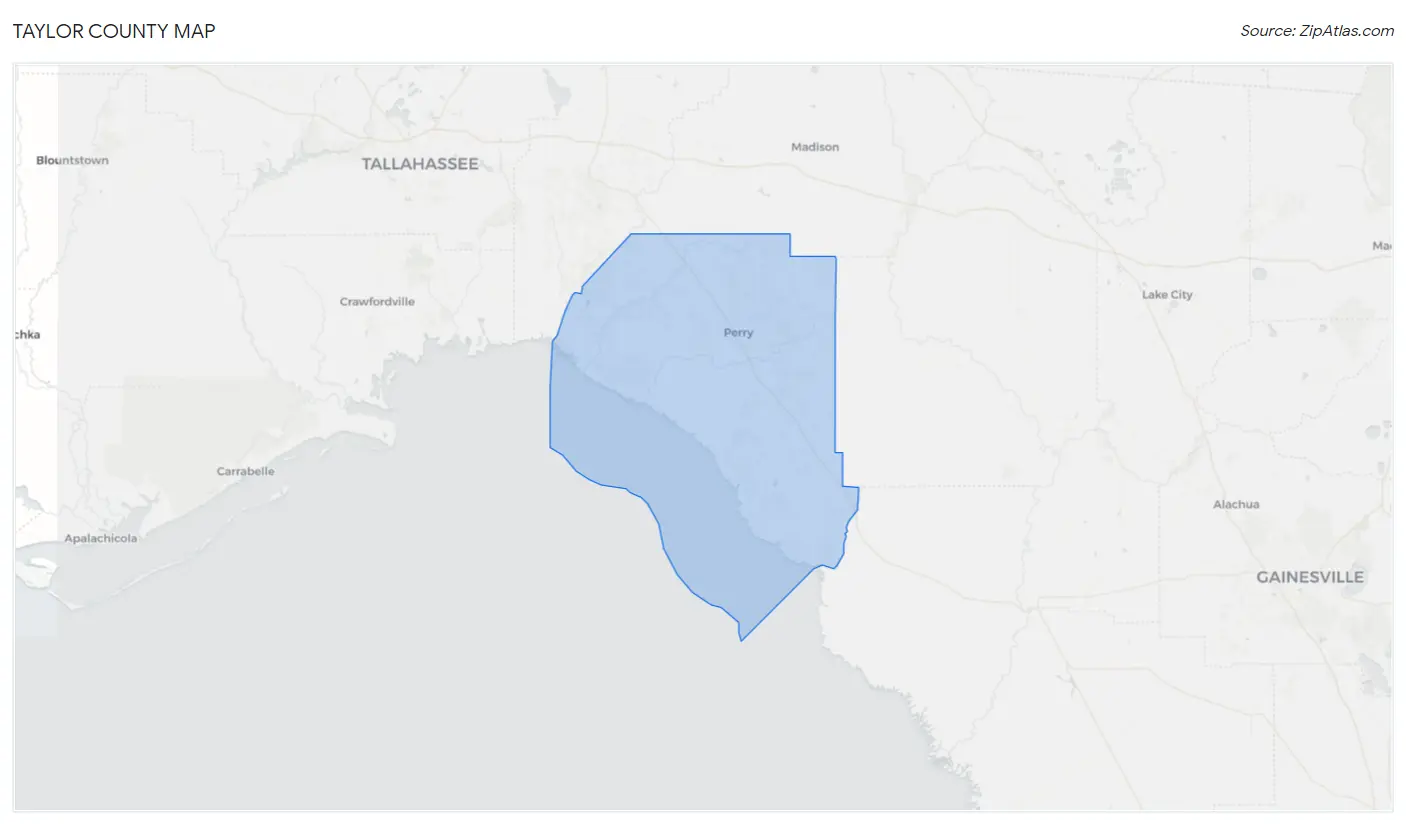
Taylor County Map
Taylor County Overview
$26,859
PER CAPITA INCOME
$54,890
AVG FAMILY INCOME
$46,239
AVG HOUSEHOLD INCOME
23.9%
WAGE / INCOME GAP [ % ]
76.1¢/ $1
WAGE / INCOME GAP [ $ ]
$8,528
FAMILY INCOME DEFICIT
0.53
INEQUALITY / GINI INDEX
21,421
TOTAL POPULATION
12,051
MALE POPULATION
9,370
FEMALE POPULATION
128.61
MALES / 100 FEMALES
77.75
FEMALES / 100 MALES
44.3
MEDIAN AGE
3.0
AVG FAMILY SIZE
2.5
AVG HOUSEHOLD SIZE
7,171
LABOR FORCE [ PEOPLE ]
40.1%
PERCENT IN LABOR FORCE
5.8%
UNEMPLOYMENT RATE
Income in Taylor County
Income Overview in Taylor County
Per Capita Income in Taylor County is $26,859, while median incomes of families and households are $54,890 and $46,239 respectively.
| Characteristic | Number | Measure |
| Per Capita Income | 21,421 | $26,859 |
| Median Family Income | 4,920 | $54,890 |
| Mean Family Income | 4,920 | $96,826 |
| Median Household Income | 7,465 | $46,239 |
| Mean Household Income | 7,465 | $77,277 |
| Income Deficit | 4,920 | $8,528 |
| Wage / Income Gap (%) | 21,421 | 23.93% |
| Wage / Income Gap ($) | 21,421 | 76.07¢ per $1 |
| Gini / Inequality Index | 21,421 | 0.53 |
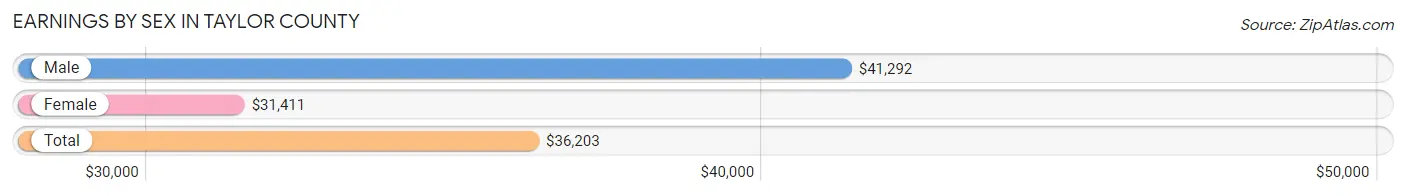
Earnings by Sex in Taylor County
Average Earnings in Taylor County are $36,203, $41,292 for men and $31,411 for women, a difference of 23.9%.
| Sex | Number | Average Earnings |
| Male | 3,506 (47.3%) | $41,292 |
| Female | 3,900 (52.7%) | $31,411 |
| Total | 7,406 (100.0%) | $36,203 |
Earnings by Sex by Income Bracket in Taylor County
The most common earnings brackets in Taylor County are $100,000+ for men (523 | 14.9%) and $25,000 to $29,999 for women (455 | 11.7%).
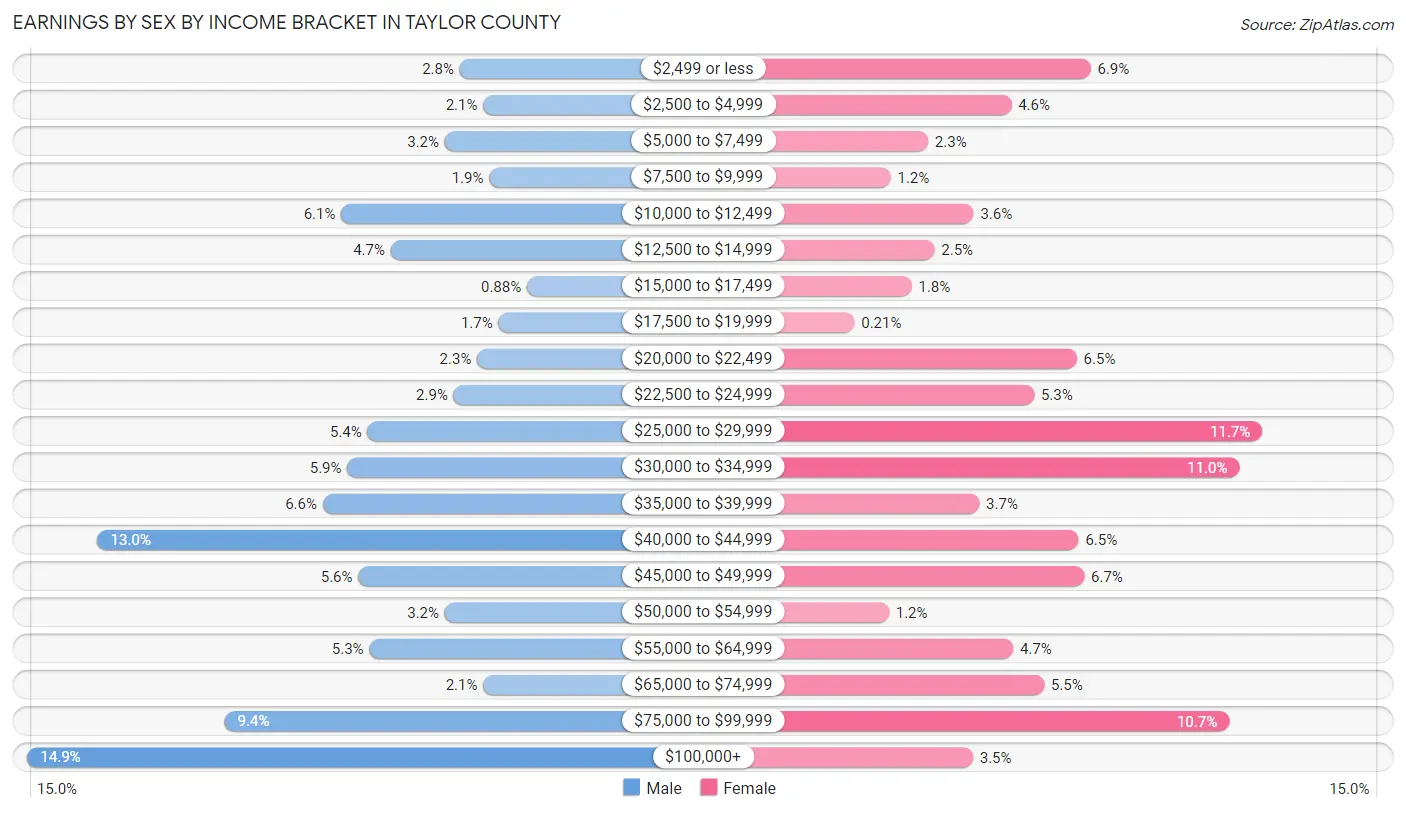
| Income | Male | Female |
| $2,499 or less | 97 (2.8%) | 267 (6.9%) |
| $2,500 to $4,999 | 74 (2.1%) | 180 (4.6%) |
| $5,000 to $7,499 | 112 (3.2%) | 89 (2.3%) |
| $7,500 to $9,999 | 68 (1.9%) | 48 (1.2%) |
| $10,000 to $12,499 | 214 (6.1%) | 139 (3.6%) |
| $12,500 to $14,999 | 165 (4.7%) | 96 (2.5%) |
| $15,000 to $17,499 | 31 (0.9%) | 71 (1.8%) |
| $17,500 to $19,999 | 59 (1.7%) | 8 (0.2%) |
| $20,000 to $22,499 | 80 (2.3%) | 252 (6.5%) |
| $22,500 to $24,999 | 103 (2.9%) | 205 (5.3%) |
| $25,000 to $29,999 | 188 (5.4%) | 455 (11.7%) |
| $30,000 to $34,999 | 208 (5.9%) | 430 (11.0%) |
| $35,000 to $39,999 | 232 (6.6%) | 145 (3.7%) |
| $40,000 to $44,999 | 454 (13.0%) | 254 (6.5%) |
| $45,000 to $49,999 | 197 (5.6%) | 260 (6.7%) |
| $50,000 to $54,999 | 112 (3.2%) | 46 (1.2%) |
| $55,000 to $64,999 | 186 (5.3%) | 182 (4.7%) |
| $65,000 to $74,999 | 74 (2.1%) | 216 (5.5%) |
| $75,000 to $99,999 | 329 (9.4%) | 419 (10.7%) |
| $100,000+ | 523 (14.9%) | 138 (3.5%) |
| Total | 3,506 (100.0%) | 3,900 (100.0%) |
Earnings by Sex by Educational Attainment in Taylor County
Average earnings in Taylor County are $44,192 for men and $32,408 for women, a difference of 26.7%. Men with an educational attainment of graduate degree enjoy the highest average annual earnings of $102,957, while those with less than high school education earn the least with $24,936. Women with an educational attainment of graduate degree earn the most with the average annual earnings of $49,796, while those with high school diploma education have the smallest earnings of $26,875.
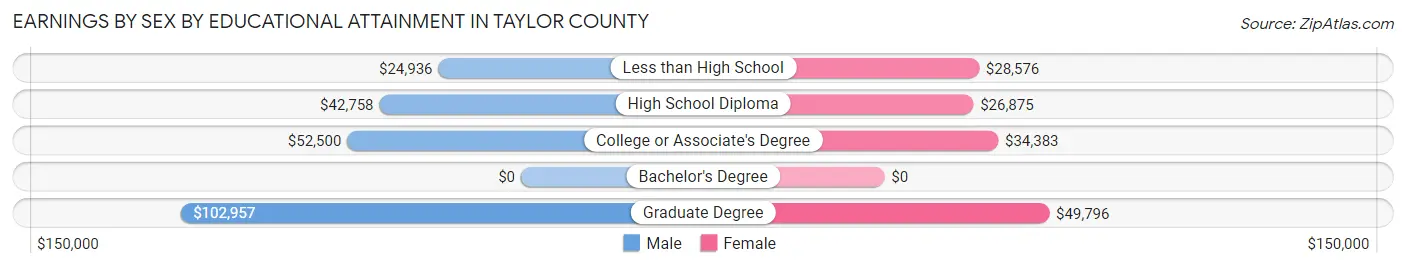
| Educational Attainment | Male Income | Female Income |
| Less than High School | $24,936 | $28,576 |
| High School Diploma | $42,758 | $26,875 |
| College or Associate's Degree | $52,500 | $34,383 |
| Bachelor's Degree | - | - |
| Graduate Degree | $102,957 | $49,796 |
| Total | $44,192 | $32,408 |
Family Income in Taylor County
Family Income Brackets in Taylor County
According to the Taylor County family income data, there are 989 families falling into the $35,000 to $49,999 income range, which is the most common income bracket and makes up 20.1% of all families. Conversely, the less than $10,000 income bracket is the least frequent group with only 108 families (2.2%) belonging to this category.
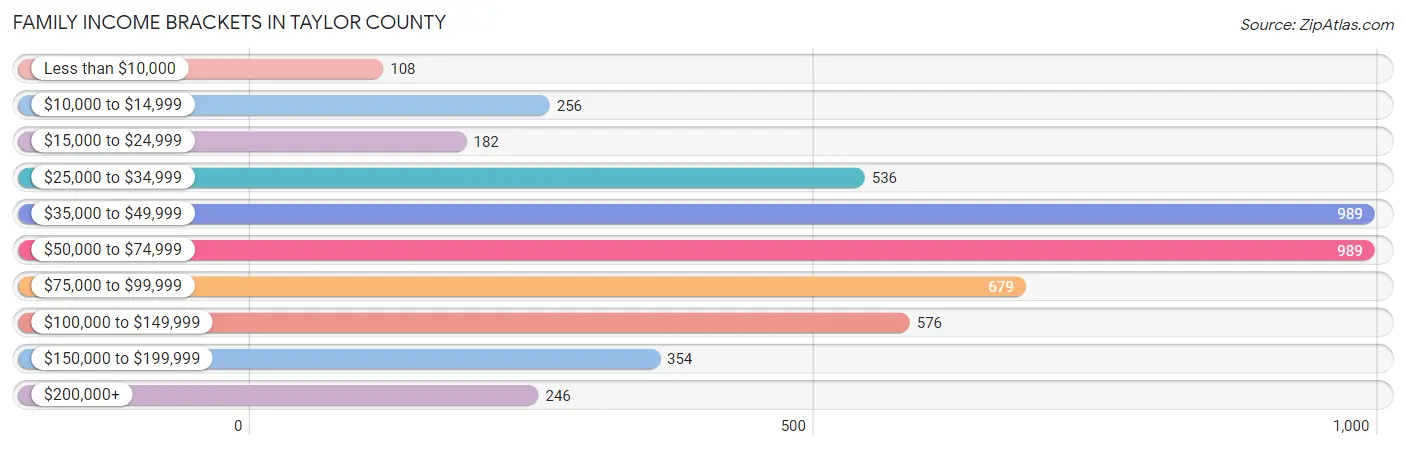
| Income Bracket | # Families | % Families |
| Less than $10,000 | 108 | 2.2% |
| $10,000 to $14,999 | 256 | 5.2% |
| $15,000 to $24,999 | 182 | 3.7% |
| $25,000 to $34,999 | 536 | 10.9% |
| $35,000 to $49,999 | 989 | 20.1% |
| $50,000 to $74,999 | 989 | 20.1% |
| $75,000 to $99,999 | 679 | 13.8% |
| $100,000 to $149,999 | 576 | 11.7% |
| $150,000 to $199,999 | 354 | 7.2% |
| $200,000+ | 246 | 5.0% |
Family Income by Famaliy Size in Taylor County
5-person families (178 | 3.6%) account for the highest median family income in Taylor County with $147,927 per family, while 5-person families (178 | 3.6%) have the highest median income of $29,585 per family member.
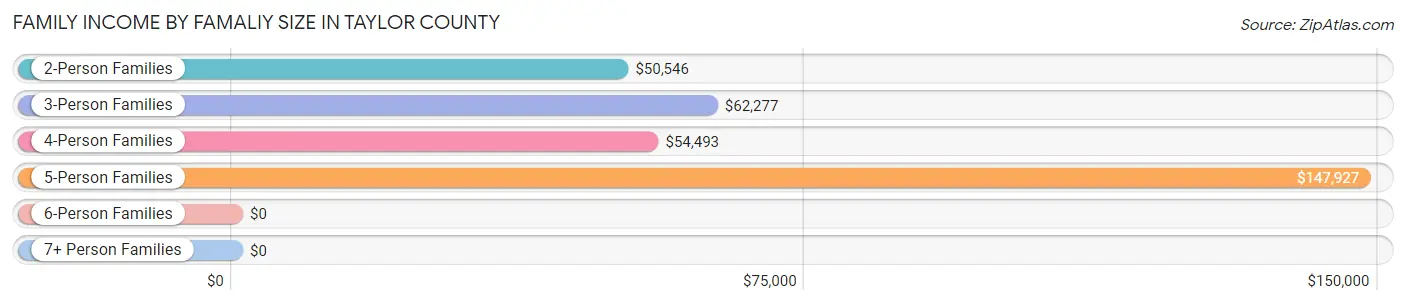
| Income Bracket | # Families | Median Income |
| 2-Person Families | 3,032 (61.6%) | $50,546 |
| 3-Person Families | 746 (15.2%) | $62,277 |
| 4-Person Families | 853 (17.3%) | $54,493 |
| 5-Person Families | 178 (3.6%) | $147,927 |
| 6-Person Families | 22 (0.4%) | $0 |
| 7+ Person Families | 89 (1.8%) | $0 |
| Total | 4,920 (100.0%) | $54,890 |
Family Income by Number of Earners in Taylor County
The median family income in Taylor County is $54,890, with families comprising 3+ earners (380) having the highest median family income of $123,563, while families with no earners (1,561) have the lowest median family income of $41,854, accounting for 7.7% and 31.7% of families, respectively.
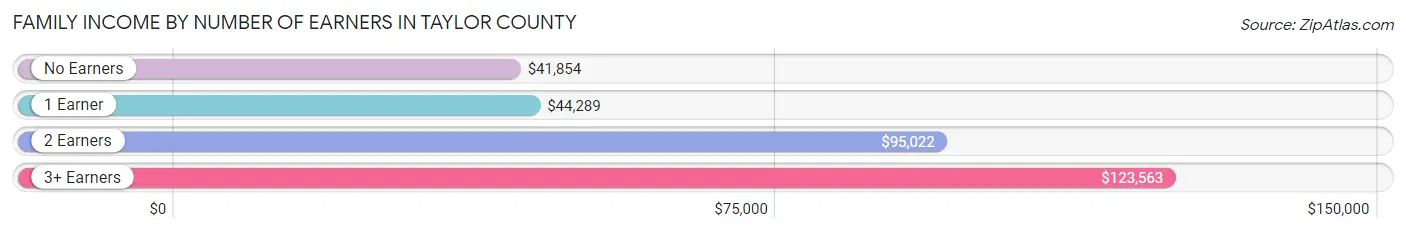
| Number of Earners | # Families | Median Income |
| No Earners | 1,561 (31.7%) | $41,854 |
| 1 Earner | 1,492 (30.3%) | $44,289 |
| 2 Earners | 1,487 (30.2%) | $95,022 |
| 3+ Earners | 380 (7.7%) | $123,563 |
| Total | 4,920 (100.0%) | $54,890 |
Household Income in Taylor County
Household Income Brackets in Taylor County
With 1,239 households falling in the category, the $35,000 to $49,999 income range is the most frequent in Taylor County, accounting for 16.6% of all households. In contrast, only 246 households (3.3%) fall into the $200,000+ income bracket, making it the least populous group.
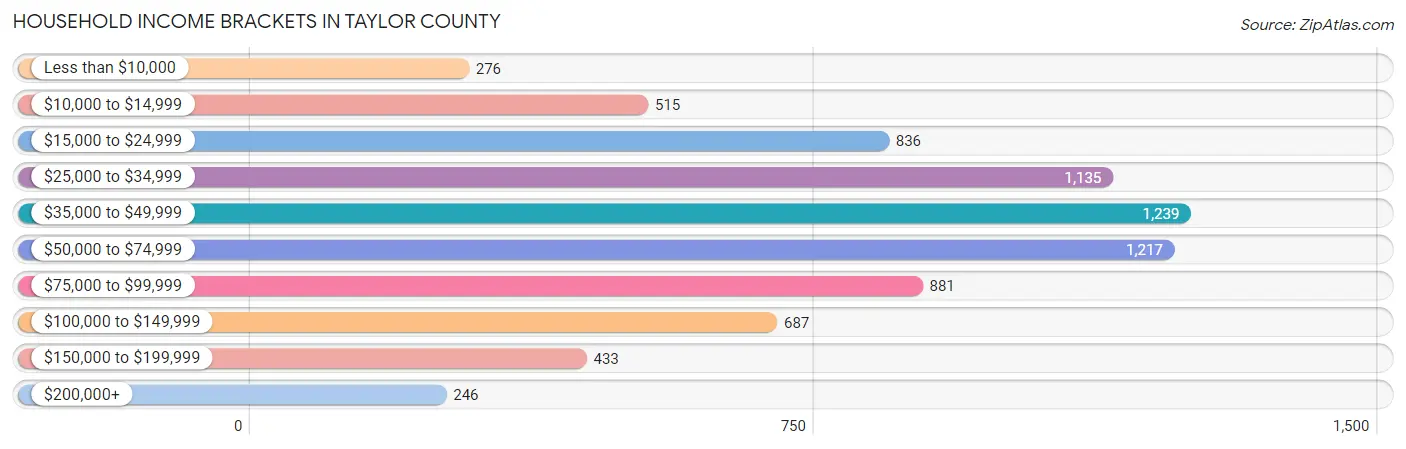
| Income Bracket | # Households | % Households |
| Less than $10,000 | 276 | 3.7% |
| $10,000 to $14,999 | 515 | 6.9% |
| $15,000 to $24,999 | 836 | 11.2% |
| $25,000 to $34,999 | 1,135 | 15.2% |
| $35,000 to $49,999 | 1,239 | 16.6% |
| $50,000 to $74,999 | 1,217 | 16.3% |
| $75,000 to $99,999 | 881 | 11.8% |
| $100,000 to $149,999 | 687 | 9.2% |
| $150,000 to $199,999 | 433 | 5.8% |
| $200,000+ | 246 | 3.3% |
Household Income by Householder Age in Taylor County
The median household income in Taylor County is $46,239, with the highest median household income of $54,542 found in the 25 to 44 years age bracket for the primary householder. A total of 1,489 households (20.0%) fall into this category. Meanwhile, the 65+ years age bracket for the primary householder has the lowest median household income of $39,099, with 2,883 households (38.6%) in this group.
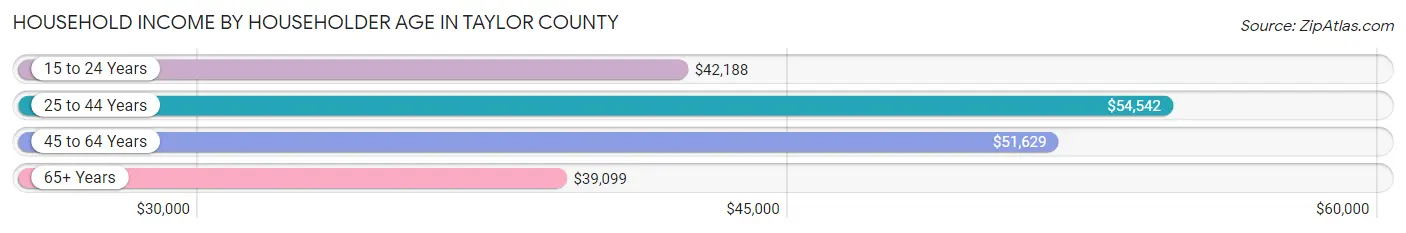
| Income Bracket | # Households | Median Income |
| 15 to 24 Years | 170 (2.3%) | $42,188 |
| 25 to 44 Years | 1,489 (20.0%) | $54,542 |
| 45 to 64 Years | 2,923 (39.2%) | $51,629 |
| 65+ Years | 2,883 (38.6%) | $39,099 |
| Total | 7,465 (100.0%) | $46,239 |
Poverty in Taylor County
Income Below Poverty by Sex and Age in Taylor County
With 17.0% poverty level for males and 13.3% for females among the residents of Taylor County, 6 to 11 year old males and under 5 year old females are the most vulnerable to poverty, with 450 males (48.7%) and 61 females (28.1%) in their respective age groups living below the poverty level.
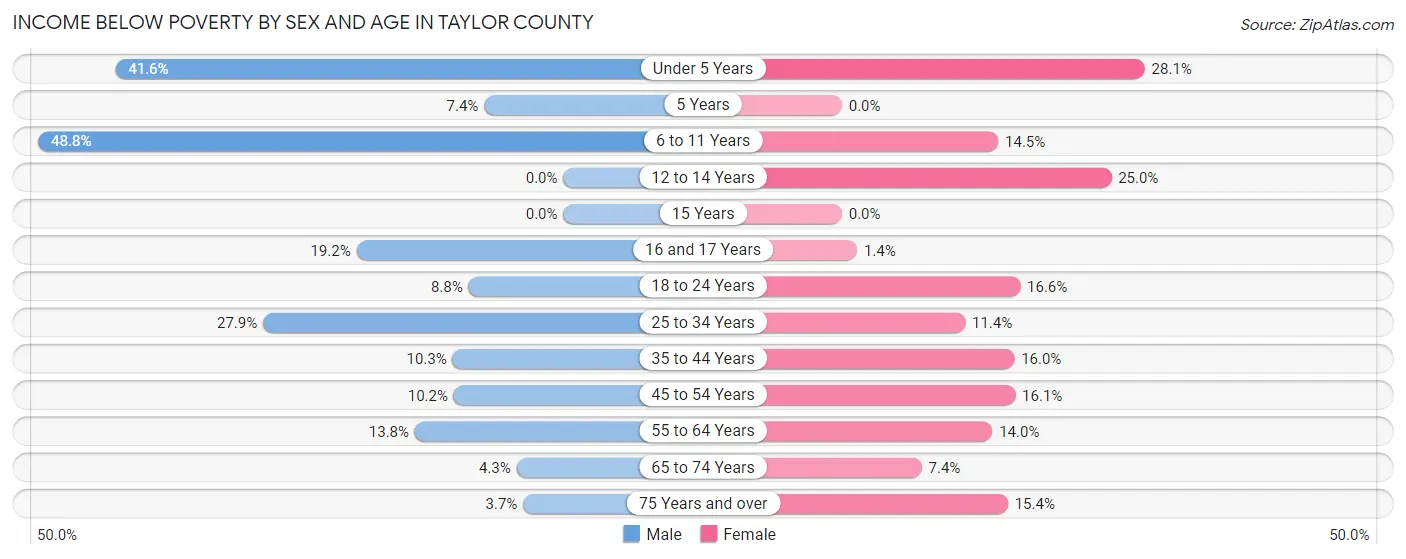
| Age Bracket | Male | Female |
| Under 5 Years | 289 (41.6%) | 61 (28.1%) |
| 5 Years | 5 (7.3%) | 0 (0.0%) |
| 6 to 11 Years | 450 (48.7%) | 100 (14.5%) |
| 12 to 14 Years | 0 (0.0%) | 63 (25.0%) |
| 15 Years | 0 (0.0%) | 0 (0.0%) |
| 16 and 17 Years | 43 (19.2%) | 6 (1.4%) |
| 18 to 24 Years | 60 (8.8%) | 92 (16.6%) |
| 25 to 34 Years | 238 (27.9%) | 111 (11.4%) |
| 35 to 44 Years | 82 (10.3%) | 148 (16.0%) |
| 45 to 54 Years | 140 (10.2%) | 201 (16.1%) |
| 55 to 64 Years | 164 (13.8%) | 204 (14.0%) |
| 65 to 74 Years | 49 (4.3%) | 98 (7.4%) |
| 75 Years and over | 29 (3.7%) | 144 (15.4%) |
| Total | 1,549 (17.0%) | 1,228 (13.3%) |
Income Above Poverty by Sex and Age in Taylor County
According to the poverty statistics in Taylor County, males aged 12 to 14 years and females aged 5 years are the age groups that are most secure financially, with 100.0% of males and 100.0% of females in these age groups living above the poverty line.
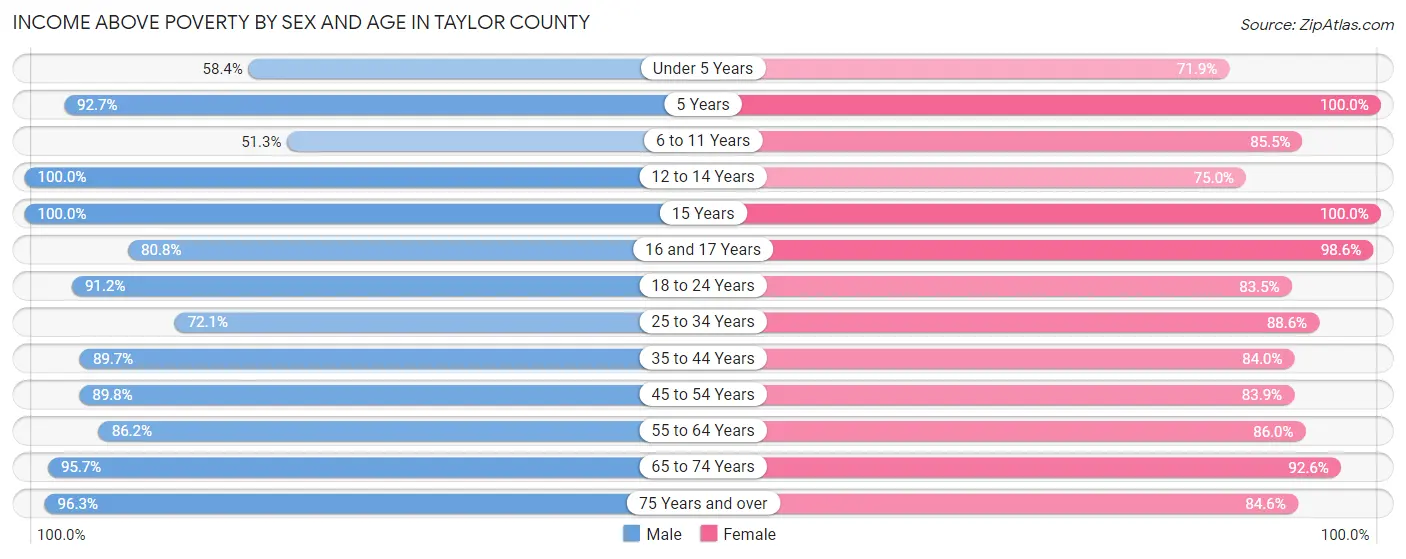
| Age Bracket | Male | Female |
| Under 5 Years | 406 (58.4%) | 156 (71.9%) |
| 5 Years | 63 (92.6%) | 154 (100.0%) |
| 6 to 11 Years | 473 (51.2%) | 589 (85.5%) |
| 12 to 14 Years | 389 (100.0%) | 189 (75.0%) |
| 15 Years | 13 (100.0%) | 89 (100.0%) |
| 16 and 17 Years | 181 (80.8%) | 419 (98.6%) |
| 18 to 24 Years | 622 (91.2%) | 464 (83.5%) |
| 25 to 34 Years | 616 (72.1%) | 859 (88.6%) |
| 35 to 44 Years | 716 (89.7%) | 777 (84.0%) |
| 45 to 54 Years | 1,237 (89.8%) | 1,048 (83.9%) |
| 55 to 64 Years | 1,026 (86.2%) | 1,257 (86.0%) |
| 65 to 74 Years | 1,080 (95.7%) | 1,224 (92.6%) |
| 75 Years and over | 749 (96.3%) | 791 (84.6%) |
| Total | 7,571 (83.0%) | 8,016 (86.7%) |
Income Below Poverty Among Married-Couple Families in Taylor County
The poverty statistics for married-couple families in Taylor County show that 5.4% or 192 of the total 3,571 families live below the poverty line. Families with 5 or more children have the highest poverty rate of 100.0%, comprising of 48 families. On the other hand, families with 3 or 4 children have the lowest poverty rate of 0.0%, which includes 0 families.
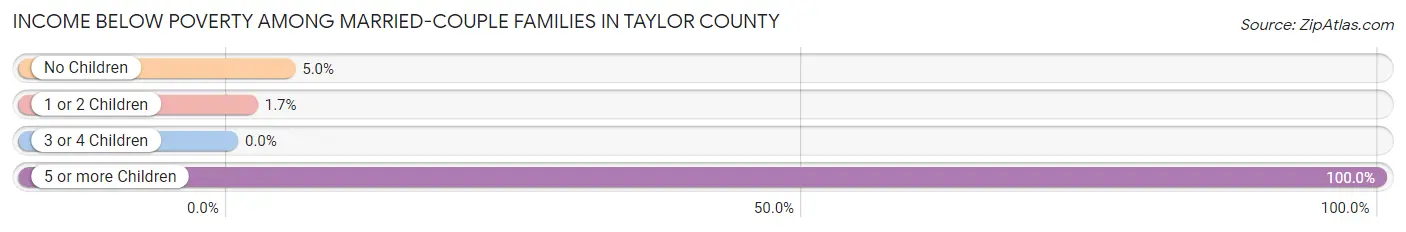
| Children | Above Poverty | Below Poverty |
| No Children | 2,479 (95.0%) | 130 (5.0%) |
| 1 or 2 Children | 801 (98.3%) | 14 (1.7%) |
| 3 or 4 Children | 99 (100.0%) | 0 (0.0%) |
| 5 or more Children | 0 (0.0%) | 48 (100.0%) |
| Total | 3,379 (94.6%) | 192 (5.4%) |
Income Below Poverty Among Single-Parent Households in Taylor County
According to the poverty data in Taylor County, 24.7% or 71 single-father households and 26.9% or 286 single-mother households are living below the poverty line. Among single-father households, those with 1 or 2 children have the highest poverty rate, with 71 households (31.3%) experiencing poverty. Likewise, among single-mother households, those with 3 or 4 children have the highest poverty rate, with 95 households (68.3%) falling below the poverty line.
| Children | Single Father | Single Mother |
| No Children | 0 (0.0%) | 65 (16.7%) |
| 1 or 2 Children | 71 (31.3%) | 126 (23.6%) |
| 3 or 4 Children | 0 (0.0%) | 95 (68.3%) |
| 5 or more Children | 0 (0.0%) | 0 (0.0%) |
| Total | 71 (24.7%) | 286 (26.9%) |
Income Below Poverty Among Married-Couple vs Single-Parent Households in Taylor County
The poverty data for Taylor County shows that 192 of the married-couple family households (5.4%) and 357 of the single-parent households (26.5%) are living below the poverty level. Within the married-couple family households, those with 5 or more children have the highest poverty rate, with 48 households (100.0%) falling below the poverty line. Among the single-parent households, those with 3 or 4 children have the highest poverty rate, with 95 household (60.5%) living below poverty.
| Children | Married-Couple Families | Single-Parent Households |
| No Children | 130 (5.0%) | 65 (15.1%) |
| 1 or 2 Children | 14 (1.7%) | 197 (25.9%) |
| 3 or 4 Children | 0 (0.0%) | 95 (60.5%) |
| 5 or more Children | 48 (100.0%) | 0 (0.0%) |
| Total | 192 (5.4%) | 357 (26.5%) |
Race in Taylor County
The most populous races in Taylor County are White / Caucasian (15,733 | 73.5%), Black / African American (4,373 | 20.4%), and Hispanic or Latino (888 | 4.2%).
| Race | # Population | % Population |
| Asian | 52 | 0.2% |
| Black / African American | 4,373 | 20.4% |
| Hawaiian / Pacific | 71 | 0.3% |
| Hispanic or Latino | 888 | 4.2% |
| Native / Alaskan | 94 | 0.4% |
| White / Caucasian | 15,733 | 73.5% |
| Two or more Races | 726 | 3.4% |
| Some other Race | 372 | 1.7% |
| Total | 21,421 | 100.0% |
Ancestry in Taylor County
The most populous ancestries reported in Taylor County are American (2,049 | 9.6%), English (1,662 | 7.8%), Irish (1,373 | 6.4%), German (960 | 4.5%), and Italian (580 | 2.7%), together accounting for 30.9% of all Taylor County residents.
| Ancestry | # Population | % Population |
| African | 218 | 1.0% |
| American | 2,049 | 9.6% |
| Arab | 138 | 0.6% |
| Argentinean | 5 | 0.0% |
| Bahamian | 19 | 0.1% |
| Bhutanese | 10 | 0.1% |
| Blackfeet | 47 | 0.2% |
| British | 145 | 0.7% |
| Burmese | 89 | 0.4% |
| Canadian | 15 | 0.1% |
| Cape Verdean | 23 | 0.1% |
| Celtic | 21 | 0.1% |
| Central American | 144 | 0.7% |
| Central American Indian | 4 | 0.0% |
| Cherokee | 38 | 0.2% |
| Costa Rican | 36 | 0.2% |
| Creek | 72 | 0.3% |
| Cuban | 226 | 1.1% |
| Czechoslovakian | 30 | 0.1% |
| Danish | 7 | 0.0% |
| Dominican | 13 | 0.1% |
| Dutch | 120 | 0.6% |
| Eastern European | 13 | 0.1% |
| Ecuadorian | 4 | 0.0% |
| English | 1,662 | 7.8% |
| European | 332 | 1.5% |
| French | 187 | 0.9% |
| German | 960 | 4.5% |
| Guatemalan | 16 | 0.1% |
| Haitian | 118 | 0.5% |
| Honduran | 33 | 0.2% |
| Hungarian | 7 | 0.0% |
| Irish | 1,373 | 6.4% |
| Italian | 580 | 2.7% |
| Jamaican | 306 | 1.4% |
| Korean | 9 | 0.0% |
| Lebanese | 138 | 0.6% |
| Lithuanian | 61 | 0.3% |
| Menominee | 13 | 0.1% |
| Mexican | 195 | 0.9% |
| Native Hawaiian | 6 | 0.0% |
| Nicaraguan | 16 | 0.1% |
| Northern European | 74 | 0.4% |
| Norwegian | 52 | 0.2% |
| Panamanian | 12 | 0.1% |
| Peruvian | 45 | 0.2% |
| Polish | 259 | 1.2% |
| Portuguese | 8 | 0.0% |
| Puerto Rican | 195 | 0.9% |
| Romanian | 6 | 0.0% |
| Russian | 13 | 0.1% |
| Salvadoran | 31 | 0.1% |
| Scandinavian | 16 | 0.1% |
| Scotch-Irish | 369 | 1.7% |
| Scottish | 158 | 0.7% |
| Slovak | 12 | 0.1% |
| South American | 54 | 0.3% |
| South American Indian | 45 | 0.2% |
| Spaniard | 5 | 0.0% |
| Spanish | 8 | 0.0% |
| Subsaharan African | 241 | 1.1% |
| Swedish | 9 | 0.0% |
| Swiss | 30 | 0.1% |
| Thai | 26 | 0.1% |
| Trinidadian and Tobagonian | 13 | 0.1% |
| Welsh | 13 | 0.1% | View All 66 Rows |
Immigrants in Taylor County
The most numerous immigrant groups reported in Taylor County came from Latin America (772 | 3.6%), Caribbean (514 | 2.4%), Jamaica (306 | 1.4%), Central America (197 | 0.9%), and Europe (133 | 0.6%), together accounting for 9.0% of all Taylor County residents.
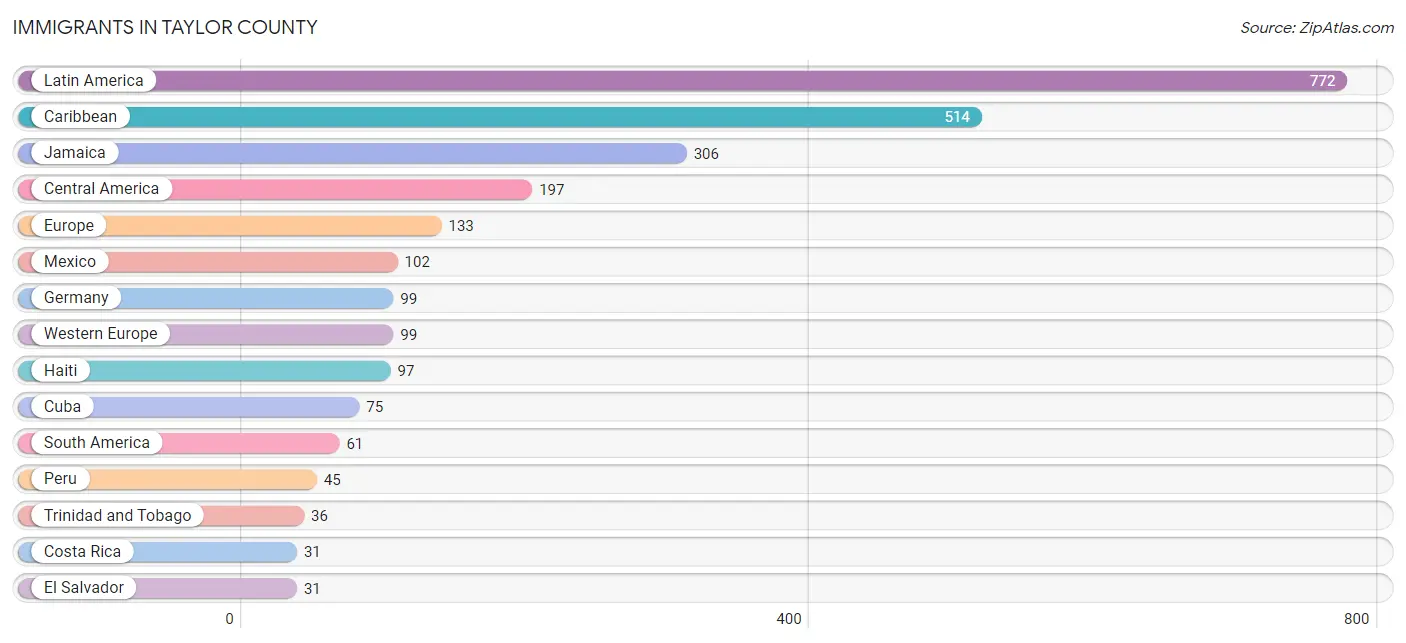
| Immigration Origin | # Population | % Population |
| Argentina | 5 | 0.0% |
| Asia | 22 | 0.1% |
| Brazil | 11 | 0.1% |
| Canada | 15 | 0.1% |
| Caribbean | 514 | 2.4% |
| Central America | 197 | 0.9% |
| Costa Rica | 31 | 0.1% |
| Cuba | 75 | 0.4% |
| Eastern Asia | 17 | 0.1% |
| Eastern Europe | 2 | 0.0% |
| El Salvador | 31 | 0.1% |
| England | 15 | 0.1% |
| Europe | 133 | 0.6% |
| Germany | 99 | 0.5% |
| Guatemala | 14 | 0.1% |
| Haiti | 97 | 0.4% |
| Italy | 2 | 0.0% |
| Jamaica | 306 | 1.4% |
| Korea | 17 | 0.1% |
| Latin America | 772 | 3.6% |
| Mexico | 102 | 0.5% |
| Nicaragua | 19 | 0.1% |
| Northern Europe | 30 | 0.1% |
| Peru | 45 | 0.2% |
| Philippines | 5 | 0.0% |
| South America | 61 | 0.3% |
| South Eastern Asia | 5 | 0.0% |
| Southern Europe | 2 | 0.0% |
| Trinidad and Tobago | 36 | 0.2% |
| Western Europe | 99 | 0.5% | View All 30 Rows |
Sex and Age in Taylor County
Sex and Age in Taylor County
The most populous age groups in Taylor County are 40 to 44 Years (1,015 | 8.4%) for men and 60 to 64 Years (951 | 10.2%) for women.
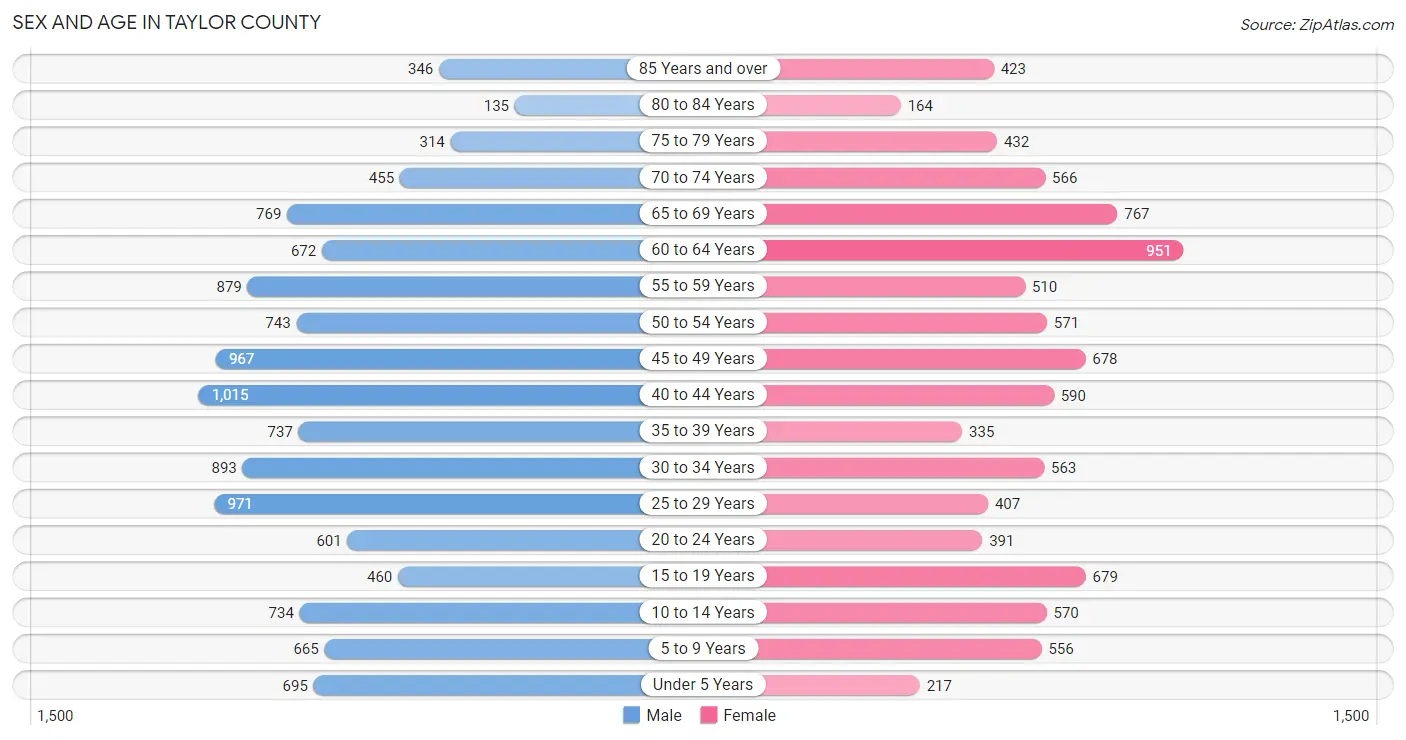
| Age Bracket | Male | Female |
| Under 5 Years | 695 (5.8%) | 217 (2.3%) |
| 5 to 9 Years | 665 (5.5%) | 556 (5.9%) |
| 10 to 14 Years | 734 (6.1%) | 570 (6.1%) |
| 15 to 19 Years | 460 (3.8%) | 679 (7.2%) |
| 20 to 24 Years | 601 (5.0%) | 391 (4.2%) |
| 25 to 29 Years | 971 (8.1%) | 407 (4.3%) |
| 30 to 34 Years | 893 (7.4%) | 563 (6.0%) |
| 35 to 39 Years | 737 (6.1%) | 335 (3.6%) |
| 40 to 44 Years | 1,015 (8.4%) | 590 (6.3%) |
| 45 to 49 Years | 967 (8.0%) | 678 (7.2%) |
| 50 to 54 Years | 743 (6.2%) | 571 (6.1%) |
| 55 to 59 Years | 879 (7.3%) | 510 (5.4%) |
| 60 to 64 Years | 672 (5.6%) | 951 (10.2%) |
| 65 to 69 Years | 769 (6.4%) | 767 (8.2%) |
| 70 to 74 Years | 455 (3.8%) | 566 (6.0%) |
| 75 to 79 Years | 314 (2.6%) | 432 (4.6%) |
| 80 to 84 Years | 135 (1.1%) | 164 (1.8%) |
| 85 Years and over | 346 (2.9%) | 423 (4.5%) |
| Total | 12,051 (100.0%) | 9,370 (100.0%) |
Families and Households in Taylor County
Median Family Size in Taylor County
The median family size in Taylor County is 3.05 persons per family, with single male/father families (287 | 5.8%) accounting for the largest median family size of 3.64 persons per family. On the other hand, married-couple families (3,571 | 72.6%) represent the smallest median family size with 2.93 persons per family.
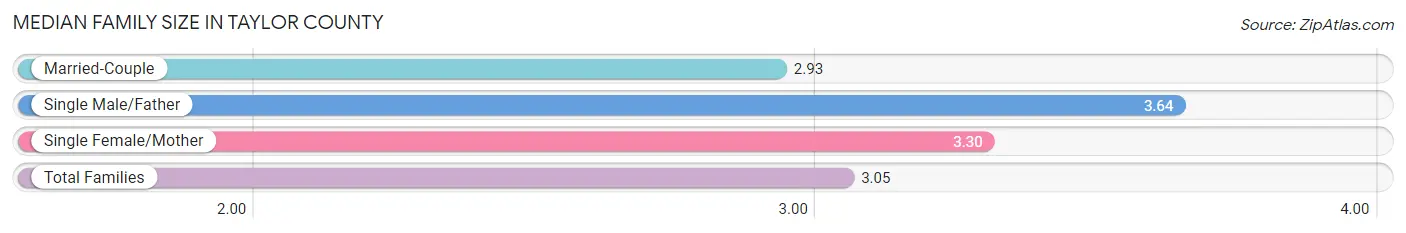
| Family Type | # Families | Family Size |
| Married-Couple | 3,571 (72.6%) | 2.93 |
| Single Male/Father | 287 (5.8%) | 3.64 |
| Single Female/Mother | 1,062 (21.6%) | 3.30 |
| Total Families | 4,920 (100.0%) | 3.05 |
Median Household Size in Taylor County
The median household size in Taylor County is 2.46 persons per household, with single male/father households (287 | 3.8%) accounting for the largest median household size of 3.95 persons per household. non-family households (2,545 | 34.1%) represent the smallest median household size with 1.13 persons per household.
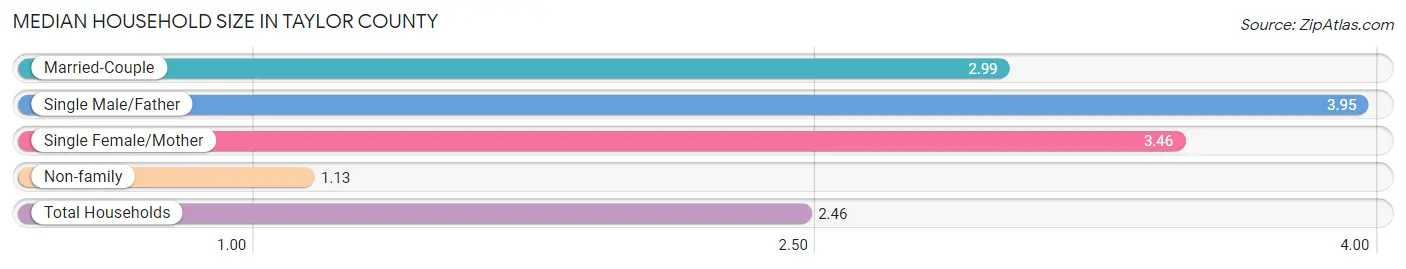
| Household Type | # Households | Household Size |
| Married-Couple | 3,571 (47.8%) | 2.99 |
| Single Male/Father | 287 (3.8%) | 3.95 |
| Single Female/Mother | 1,062 (14.2%) | 3.46 |
| Non-family | 2,545 (34.1%) | 1.13 |
| Total Households | 7,465 (100.0%) | 2.46 |
Household Size by Marriage Status in Taylor County
Out of a total of 7,465 households in Taylor County, 4,920 (65.9%) are family households, while 2,545 (34.1%) are nonfamily households. The most numerous type of family households are 2-person households, comprising 2,904, and the most common type of nonfamily households are 1-person households, comprising 2,275.
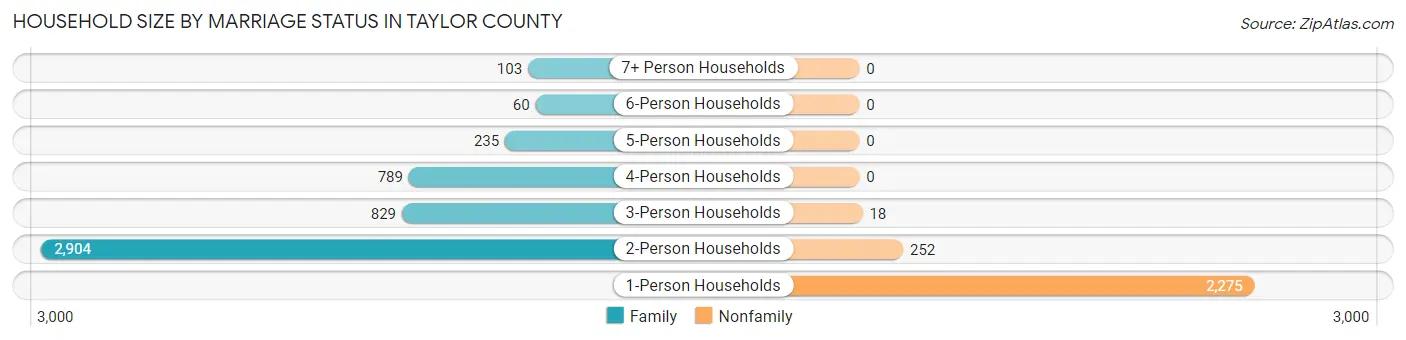
| Household Size | Family Households | Nonfamily Households |
| 1-Person Households | - | 2,275 (30.5%) |
| 2-Person Households | 2,904 (38.9%) | 252 (3.4%) |
| 3-Person Households | 829 (11.1%) | 18 (0.2%) |
| 4-Person Households | 789 (10.6%) | 0 (0.0%) |
| 5-Person Households | 235 (3.2%) | 0 (0.0%) |
| 6-Person Households | 60 (0.8%) | 0 (0.0%) |
| 7+ Person Households | 103 (1.4%) | 0 (0.0%) |
| Total | 4,920 (65.9%) | 2,545 (34.1%) |
Female Fertility in Taylor County
Fertility by Age in Taylor County
Average fertility rate in Taylor County is 134.0 births per 1,000 women. Women in the age bracket of 20 to 34 years have the highest fertility rate with 217.0 births per 1,000 women. Women in the age bracket of 20 to 34 years acount for 57.3% of all women with births.
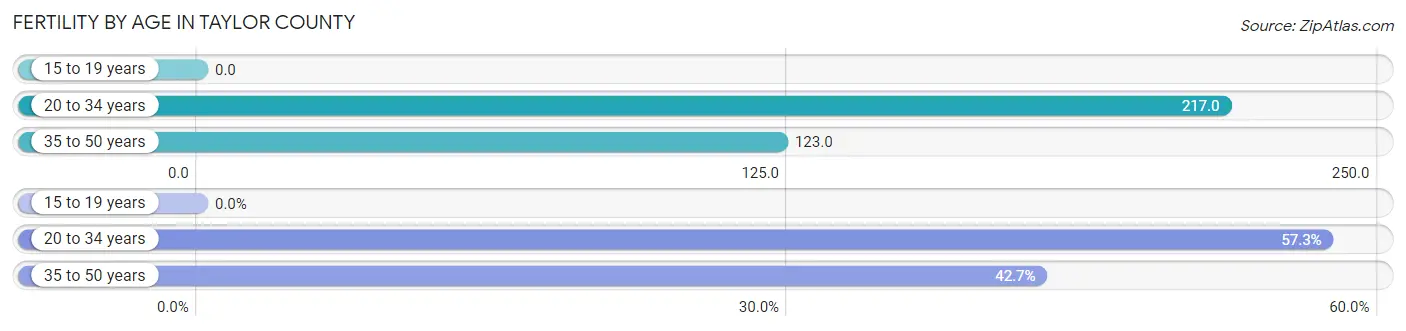
| Age Bracket | Women with Births | Births / 1,000 Women |
| 15 to 19 years | 0 (0.0%) | 0.0 |
| 20 to 34 years | 295 (57.3%) | 217.0 |
| 35 to 50 years | 220 (42.7%) | 123.0 |
| Total | 515 (100.0%) | 134.0 |
Fertility by Age by Marriage Status in Taylor County
31.3% of women with births (515) in Taylor County are married. The highest percentage of unmarried women with births falls into 35 to 50 years age bracket with 75.9% of them unmarried at the time of birth, while the lowest percentage of unmarried women with births belong to 20 to 34 years age bracket with 63.4% of them unmarried.
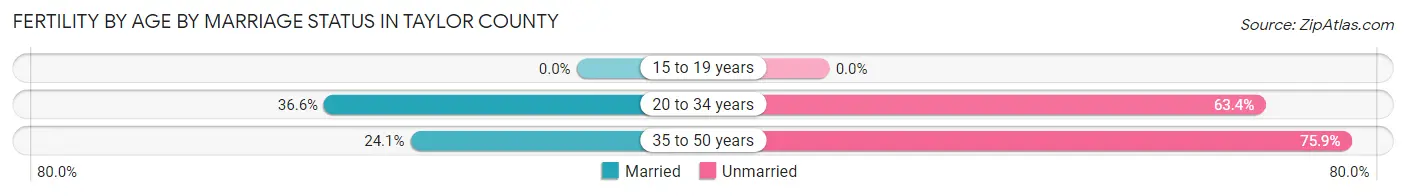
| Age Bracket | Married | Unmarried |
| 15 to 19 years | 0 (0.0%) | 0 (0.0%) |
| 20 to 34 years | 108 (36.6%) | 187 (63.4%) |
| 35 to 50 years | 53 (24.1%) | 167 (75.9%) |
| Total | 161 (31.3%) | 354 (68.7%) |
Fertility by Education in Taylor County
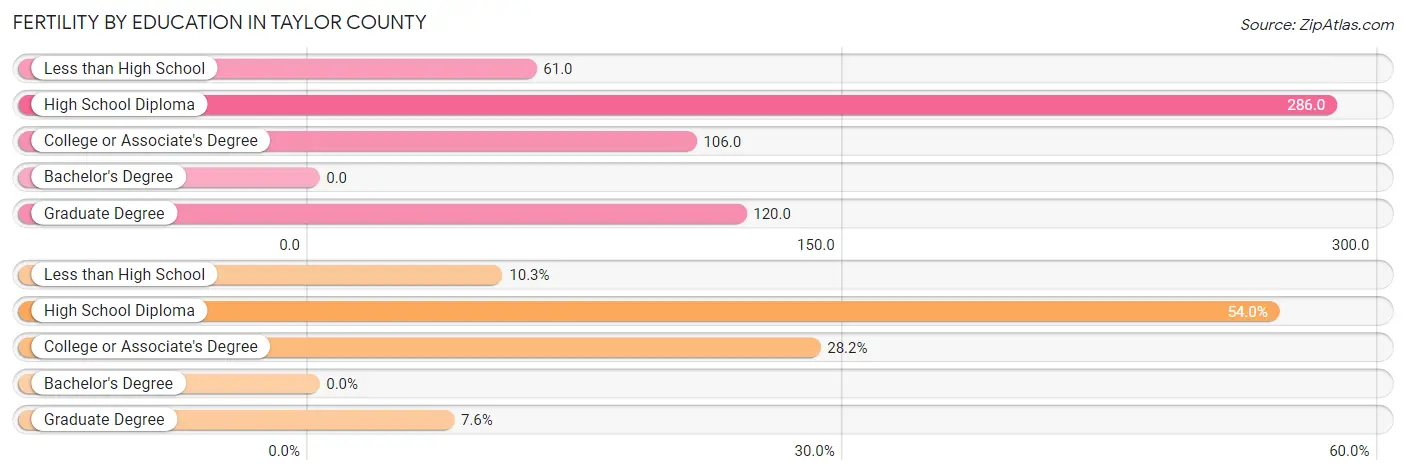
| Educational Attainment | Women with Births | Births / 1,000 Women |
| Less than High School | 53 (10.3%) | 61.0 |
| High School Diploma | 278 (54.0%) | 286.0 |
| College or Associate's Degree | 145 (28.2%) | 106.0 |
| Bachelor's Degree | 0 (0.0%) | 0.0 |
| Graduate Degree | 39 (7.6%) | 120.0 |
| Total | 515 (100.0%) | 134.0 |
Fertility by Education by Marriage Status in Taylor County
68.7% of women with births in Taylor County are unmarried. Women with the educational attainment of less than high school are most likely to be married with 58.5% of them married at childbirth, while women with the educational attainment of graduate degree are least likely to be married with 100.0% of them unmarried at childbirth.
| Educational Attainment | Married | Unmarried |
| Less than High School | 31 (58.5%) | 22 (41.5%) |
| High School Diploma | 56 (20.1%) | 222 (79.9%) |
| College or Associate's Degree | 74 (51.0%) | 71 (49.0%) |
| Bachelor's Degree | 0 (0.0%) | 0 (0.0%) |
| Graduate Degree | 0 (0.0%) | 39 (100.0%) |
| Total | 161 (31.3%) | 354 (68.7%) |
Employment Characteristics in Taylor County
Employment by Class of Employer in Taylor County
Among the 6,593 employed individuals in Taylor County, private company employees (3,982 | 60.4%), local government employees (727 | 11.0%), and not-for-profit organizations (484 | 7.3%) make up the most common classes of employment.
| Employer Class | # Employees | % Employees |
| Private Company Employees | 3,982 | 60.4% |
| Self-Employed (Incorporated) | 296 | 4.5% |
| Self-Employed (Not Incorporated) | 406 | 6.2% |
| Not-for-profit Organizations | 484 | 7.3% |
| Local Government Employees | 727 | 11.0% |
| State Government Employees | 441 | 6.7% |
| Federal Government Employees | 257 | 3.9% |
| Unpaid Family Workers | 0 | 0.0% |
| Total | 6,593 | 100.0% |
Employment Status by Age in Taylor County
According to the labor force statistics for Taylor County, out of the total population over 16 years of age (17,882), 40.1% or 7,171 individuals are in the labor force, with 5.8% or 416 of them unemployed. The age group with the highest labor force participation rate is 20 to 24 years, with 80.4% or 798 individuals in the labor force. Within the labor force, the 16 to 19 years age range has the highest percentage of unemployed individuals, with 21.9% or 60 of them being unemployed.
| Age Bracket | In Labor Force | Unemployed |
| 16 to 19 Years | 274 (26.4%) | 60 (21.9%) |
| 20 to 24 Years | 798 (80.4%) | 57 (7.1%) |
| 25 to 29 Years | 587 (42.6%) | 107 (18.2%) |
| 30 to 34 Years | 668 (45.9%) | 18 (2.7%) |
| 35 to 44 Years | 1,355 (50.6%) | 0 (0.0%) |
| 45 to 54 Years | 1,660 (56.1%) | 113 (6.8%) |
| 55 to 59 Years | 614 (44.2%) | 0 (0.0%) |
| 60 to 64 Years | 787 (48.5%) | 49 (6.2%) |
| 65 to 74 Years | 371 (14.5%) | 13 (3.5%) |
| 75 Years and over | 62 (3.4%) | 0 (0.0%) |
| Total | 7,171 (40.1%) | 416 (5.8%) |
Employment Status by Educational Attainment in Taylor County
According to labor force statistics for Taylor County, 49.4% of individuals (5,672) out of the total population between 25 and 64 years of age (11,482) are in the labor force, with 5.1% or 289 of them being unemployed. The group with the highest labor force participation rate are those with the educational attainment of bachelor's degree or higher, with 83.3% or 1,277 individuals in the labor force. Within the labor force, individuals with less than high school education have the highest percentage of unemployment, with 10.1% or 51 of them being unemployed.
| Educational Attainment | In Labor Force | Unemployed |
| Less than High School | 504 (24.9%) | 204 (10.1%) |
| High School Diploma | 2,017 (41.3%) | 220 (4.5%) |
| College / Associate Degree | 1,873 (61.6%) | 149 (4.9%) |
| Bachelor's Degree or higher | 1,277 (83.3%) | 64 (4.2%) |
| Total | 5,672 (49.4%) | 586 (5.1%) |
Employment Occupations by Sex in Taylor County
Management, Business, Science and Arts Occupations
The most common Management, Business, Science and Arts occupations in Taylor County are Management (953 | 14.1%), Community & Social Service (605 | 9.0%), Education Instruction & Library (432 | 6.4%), Health Diagnosing & Treating (404 | 6.0%), and Business & Financial (235 | 3.5%).
Management, Business, Science and Arts Occupations by Sex
Within the Management, Business, Science and Arts occupations in Taylor County, the most male-oriented occupations are Computers & Mathematics (77.8%), Computers, Engineering & Science (56.1%), and Architecture & Engineering (48.1%), while the most female-oriented occupations are Life, Physical & Social Science (100.0%), Arts, Media & Entertainment (91.3%), and Health Diagnosing & Treating (90.8%).
| Occupation | Male | Female |
| Management | 391 (41.0%) | 562 (59.0%) |
| Business & Financial | 48 (20.4%) | 187 (79.6%) |
| Computers, Engineering & Science | 73 (56.1%) | 57 (43.9%) |
| Computers & Mathematics | 35 (77.8%) | 10 (22.2%) |
| Architecture & Engineering | 38 (48.1%) | 41 (51.9%) |
| Life, Physical & Social Science | 0 (0.0%) | 6 (100.0%) |
| Community & Social Service | 136 (22.5%) | 469 (77.5%) |
| Education, Arts & Media | 14 (14.6%) | 82 (85.4%) |
| Legal Services & Support | 6 (19.4%) | 25 (80.6%) |
| Education Instruction & Library | 112 (25.9%) | 320 (74.1%) |
| Arts, Media & Entertainment | 4 (8.7%) | 42 (91.3%) |
| Health Diagnosing & Treating | 37 (9.2%) | 367 (90.8%) |
| Health Technologists | 25 (10.9%) | 204 (89.1%) |
| Total (Category) | 685 (29.4%) | 1,642 (70.6%) |
| Total (Overall) | 3,124 (46.3%) | 3,623 (53.7%) |
Services Occupations
The most common Services occupations in Taylor County are Food Preparation & Serving (497 | 7.4%), Security & Protection (362 | 5.4%), Law Enforcement (323 | 4.8%), Healthcare Support (322 | 4.8%), and Personal Care & Service (205 | 3.0%).
Services Occupations by Sex
Within the Services occupations in Taylor County, the most male-oriented occupations are Firefighting & Prevention (100.0%), Cleaning & Maintenance (52.9%), and Security & Protection (51.7%), while the most female-oriented occupations are Healthcare Support (87.3%), Food Preparation & Serving (71.6%), and Personal Care & Service (57.1%).
| Occupation | Male | Female |
| Healthcare Support | 41 (12.7%) | 281 (87.3%) |
| Security & Protection | 187 (51.7%) | 175 (48.3%) |
| Firefighting & Prevention | 39 (100.0%) | 0 (0.0%) |
| Law Enforcement | 148 (45.8%) | 175 (54.2%) |
| Food Preparation & Serving | 141 (28.4%) | 356 (71.6%) |
| Cleaning & Maintenance | 54 (52.9%) | 48 (47.1%) |
| Personal Care & Service | 88 (42.9%) | 117 (57.1%) |
| Total (Category) | 511 (34.3%) | 977 (65.7%) |
| Total (Overall) | 3,124 (46.3%) | 3,623 (53.7%) |
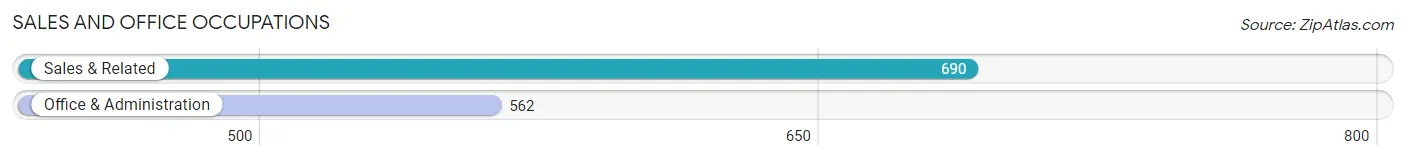
Sales and Office Occupations
The most common Sales and Office occupations in Taylor County are Sales & Related (690 | 10.2%), and Office & Administration (562 | 8.3%).
Sales and Office Occupations by Sex
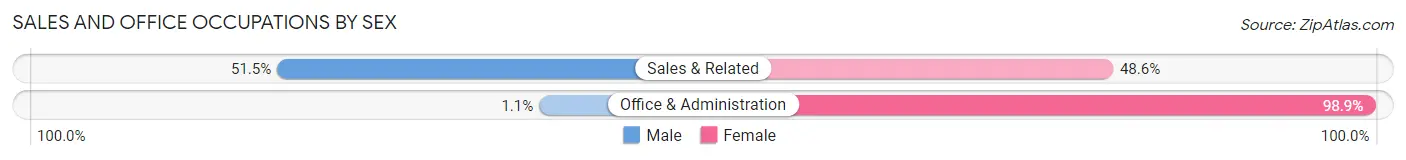
| Occupation | Male | Female |
| Sales & Related | 355 (51.4%) | 335 (48.5%) |
| Office & Administration | 6 (1.1%) | 556 (98.9%) |
| Total (Category) | 361 (28.8%) | 891 (71.2%) |
| Total (Overall) | 3,124 (46.3%) | 3,623 (53.7%) |
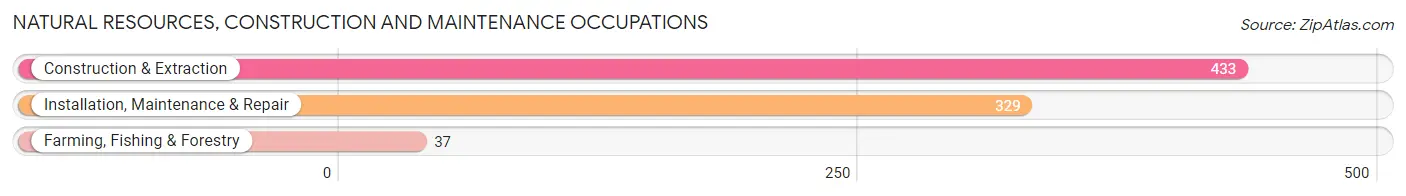
Natural Resources, Construction and Maintenance Occupations
The most common Natural Resources, Construction and Maintenance occupations in Taylor County are Construction & Extraction (433 | 6.4%), Installation, Maintenance & Repair (329 | 4.9%), and Farming, Fishing & Forestry (37 | 0.5%).
Natural Resources, Construction and Maintenance Occupations by Sex
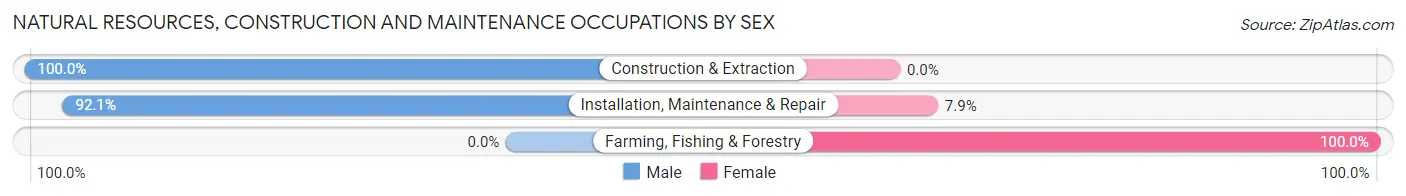
| Occupation | Male | Female |
| Farming, Fishing & Forestry | 0 (0.0%) | 37 (100.0%) |
| Construction & Extraction | 433 (100.0%) | 0 (0.0%) |
| Installation, Maintenance & Repair | 303 (92.1%) | 26 (7.9%) |
| Total (Category) | 736 (92.1%) | 63 (7.9%) |
| Total (Overall) | 3,124 (46.3%) | 3,623 (53.7%) |
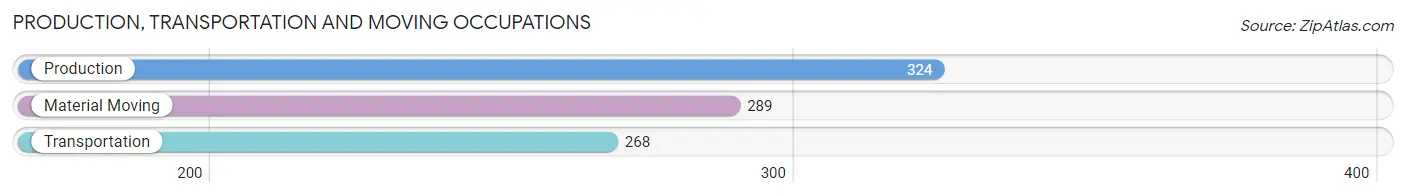
Production, Transportation and Moving Occupations
The most common Production, Transportation and Moving occupations in Taylor County are Production (324 | 4.8%), Material Moving (289 | 4.3%), and Transportation (268 | 4.0%).
Production, Transportation and Moving Occupations by Sex
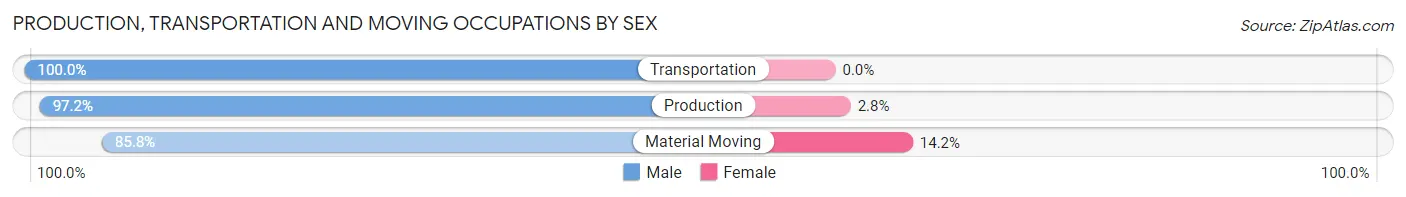
| Occupation | Male | Female |
| Production | 315 (97.2%) | 9 (2.8%) |
| Transportation | 268 (100.0%) | 0 (0.0%) |
| Material Moving | 248 (85.8%) | 41 (14.2%) |
| Total (Category) | 831 (94.3%) | 50 (5.7%) |
| Total (Overall) | 3,124 (46.3%) | 3,623 (53.7%) |
Employment Industries by Sex in Taylor County
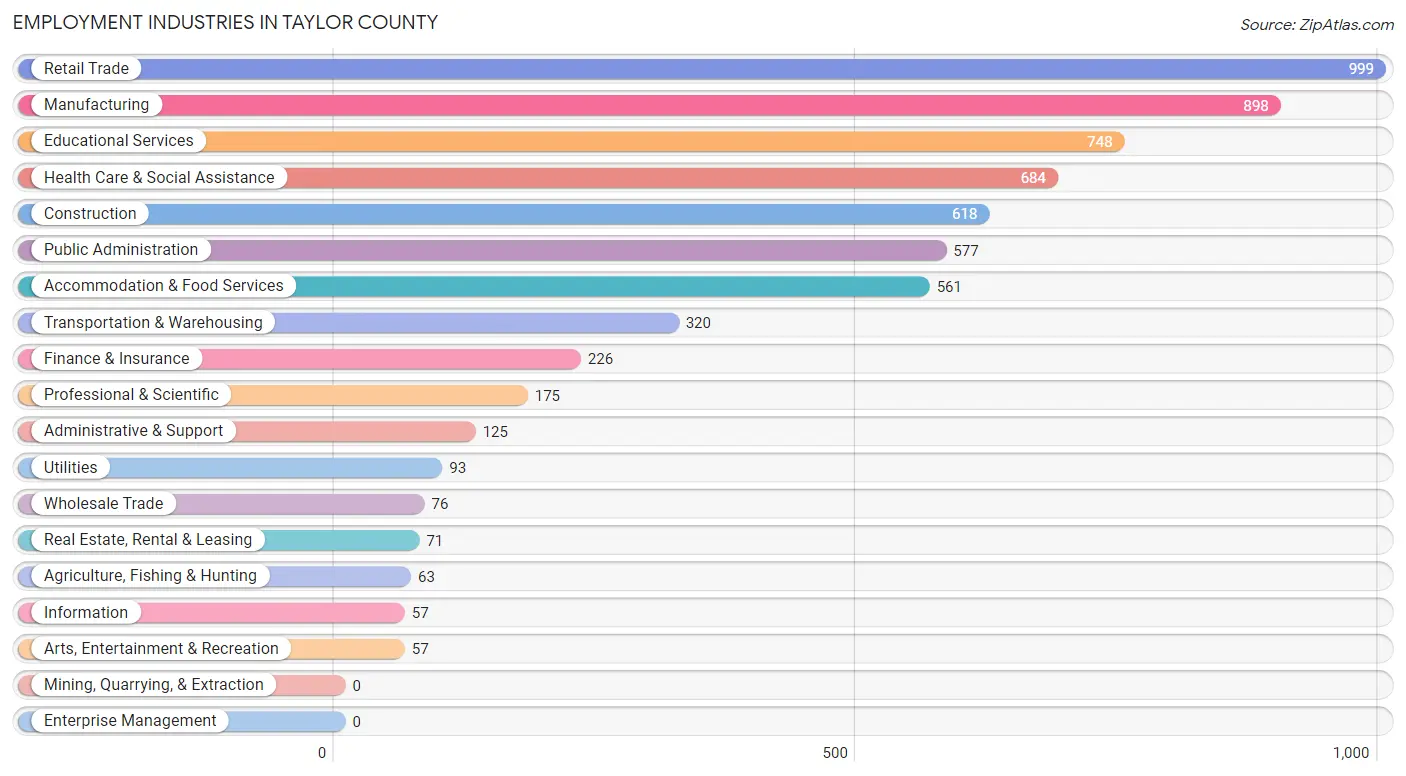
Employment Industries in Taylor County
The major employment industries in Taylor County include Retail Trade (999 | 14.8%), Manufacturing (898 | 13.3%), Educational Services (748 | 11.1%), Health Care & Social Assistance (684 | 10.1%), and Construction (618 | 9.2%).
Employment Industries by Sex in Taylor County
The Taylor County industries that see more men than women are Arts, Entertainment & Recreation (96.5%), Construction (94.7%), and Utilities (91.4%), whereas the industries that tend to have a higher number of women are Agriculture, Fishing & Hunting (100.0%), Real Estate, Rental & Leasing (100.0%), and Finance & Insurance (91.6%).
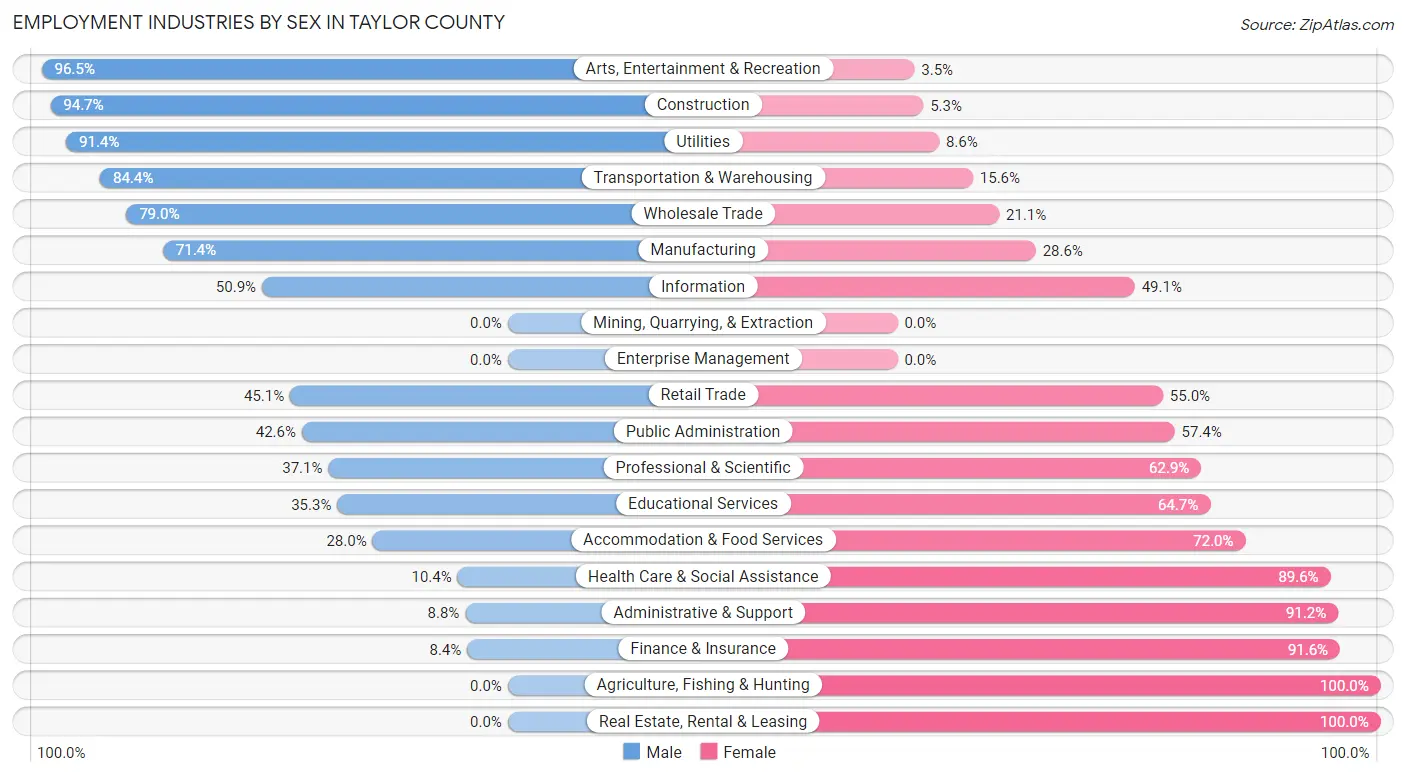
| Industry | Male | Female |
| Agriculture, Fishing & Hunting | 0 (0.0%) | 63 (100.0%) |
| Mining, Quarrying, & Extraction | 0 (0.0%) | 0 (0.0%) |
| Construction | 585 (94.7%) | 33 (5.3%) |
| Manufacturing | 641 (71.4%) | 257 (28.6%) |
| Wholesale Trade | 60 (78.9%) | 16 (21.0%) |
| Retail Trade | 450 (45.1%) | 549 (54.9%) |
| Transportation & Warehousing | 270 (84.4%) | 50 (15.6%) |
| Utilities | 85 (91.4%) | 8 (8.6%) |
| Information | 29 (50.9%) | 28 (49.1%) |
| Finance & Insurance | 19 (8.4%) | 207 (91.6%) |
| Real Estate, Rental & Leasing | 0 (0.0%) | 71 (100.0%) |
| Professional & Scientific | 65 (37.1%) | 110 (62.9%) |
| Enterprise Management | 0 (0.0%) | 0 (0.0%) |
| Administrative & Support | 11 (8.8%) | 114 (91.2%) |
| Educational Services | 264 (35.3%) | 484 (64.7%) |
| Health Care & Social Assistance | 71 (10.4%) | 613 (89.6%) |
| Arts, Entertainment & Recreation | 55 (96.5%) | 2 (3.5%) |
| Accommodation & Food Services | 157 (28.0%) | 404 (72.0%) |
| Public Administration | 246 (42.6%) | 331 (57.4%) |
| Total | 3,124 (46.3%) | 3,623 (53.7%) |
Education in Taylor County
School Enrollment in Taylor County
The most common levels of schooling among the 4,270 students in Taylor County are high school (1,147 | 26.9%), middle school (1,138 | 26.7%), and elementary school (944 | 22.1%).
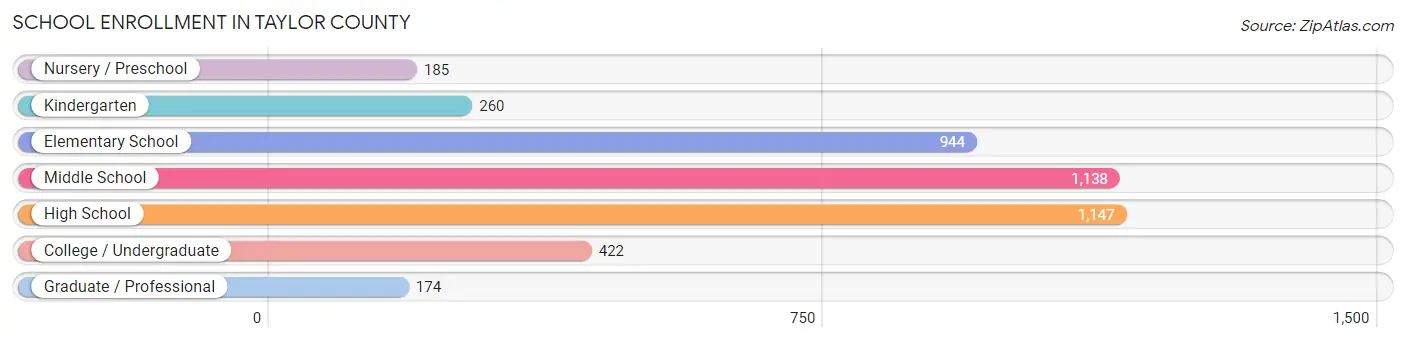
| School Level | # Students | % Students |
| Nursery / Preschool | 185 | 4.3% |
| Kindergarten | 260 | 6.1% |
| Elementary School | 944 | 22.1% |
| Middle School | 1,138 | 26.7% |
| High School | 1,147 | 26.9% |
| College / Undergraduate | 422 | 9.9% |
| Graduate / Professional | 174 | 4.1% |
| Total | 4,270 | 100.0% |
School Enrollment by Age by Funding Source in Taylor County
Out of a total of 4,270 students who are enrolled in schools in Taylor County, 1,238 (29.0%) attend a private institution, while the remaining 3,032 (71.0%) are enrolled in public schools. The age group of 3 to 4 year olds has the highest likelihood of being enrolled in private schools, with 106 (92.2% in the age bracket) enrolled. Conversely, the age group of 20 to 24 year olds has the lowest likelihood of being enrolled in a private school, with 87 (100.0% in the age bracket) attending a public institution.
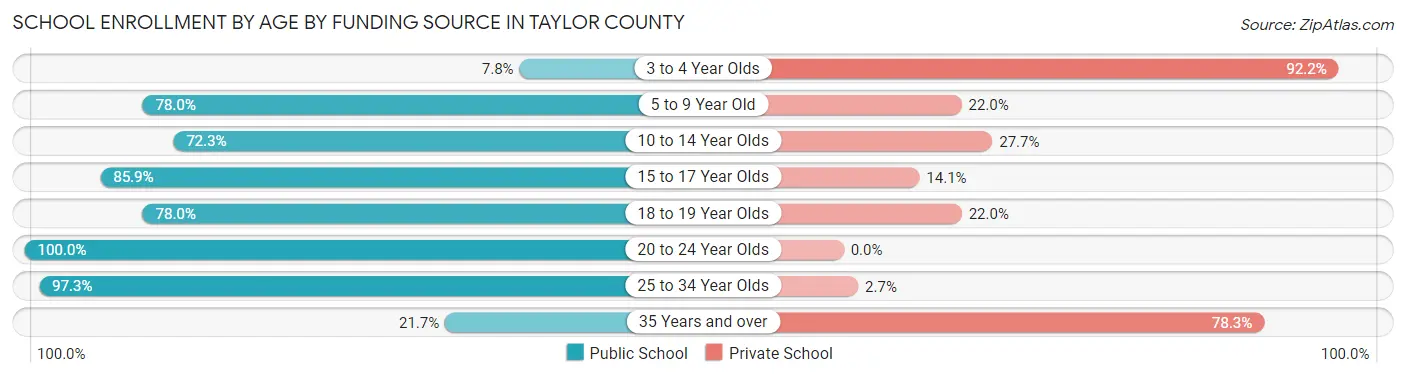
| Age Bracket | Public School | Private School |
| 3 to 4 Year Olds | 9 (7.8%) | 106 (92.2%) |
| 5 to 9 Year Old | 938 (78.0%) | 264 (22.0%) |
| 10 to 14 Year Olds | 922 (72.3%) | 353 (27.7%) |
| 15 to 17 Year Olds | 645 (85.9%) | 106 (14.1%) |
| 18 to 19 Year Olds | 227 (78.0%) | 64 (22.0%) |
| 20 to 24 Year Olds | 87 (100.0%) | 0 (0.0%) |
| 25 to 34 Year Olds | 108 (97.3%) | 3 (2.7%) |
| 35 Years and over | 95 (21.7%) | 343 (78.3%) |
| Total | 3,032 (71.0%) | 1,238 (29.0%) |
Educational Attainment by Field of Study in Taylor County
Education (492 | 21.4%), business (366 | 16.0%), arts & humanities (243 | 10.6%), engineering (242 | 10.5%), and science & technology (180 | 7.8%) are the most common fields of study among 2,295 individuals in Taylor County who have obtained a bachelor's degree or higher.
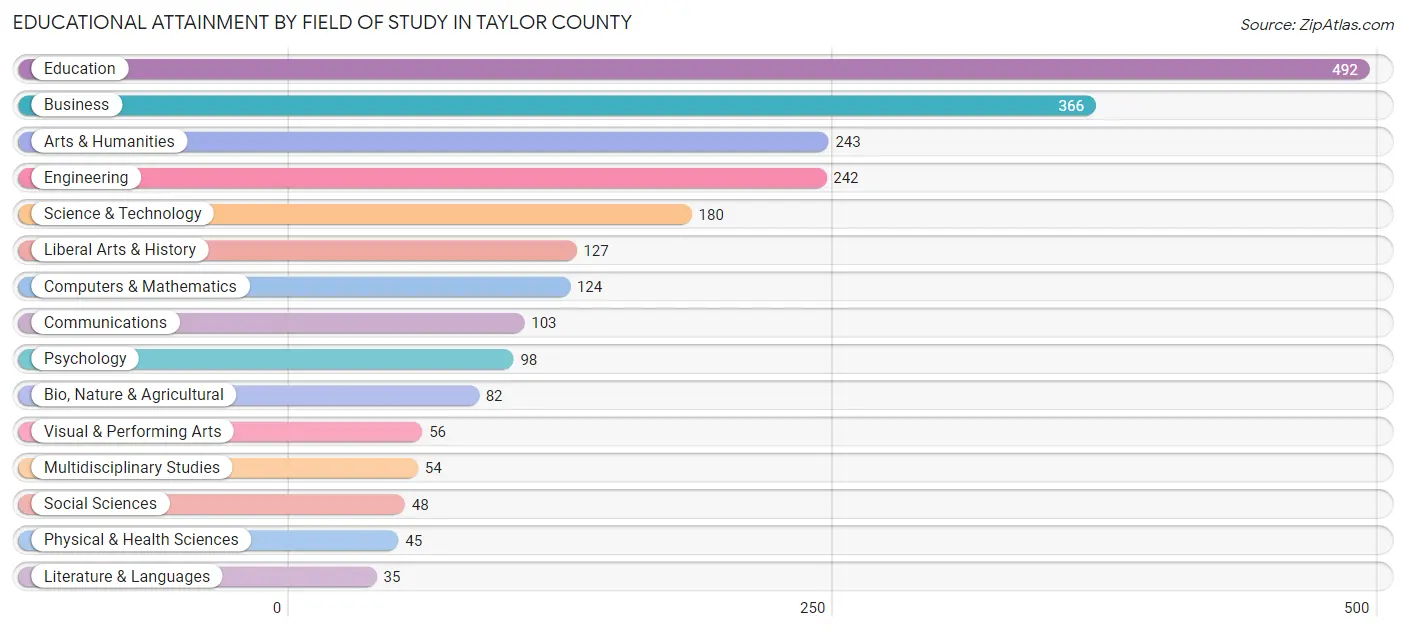
| Field of Study | # Graduates | % Graduates |
| Computers & Mathematics | 124 | 5.4% |
| Bio, Nature & Agricultural | 82 | 3.6% |
| Physical & Health Sciences | 45 | 2.0% |
| Psychology | 98 | 4.3% |
| Social Sciences | 48 | 2.1% |
| Engineering | 242 | 10.5% |
| Multidisciplinary Studies | 54 | 2.4% |
| Science & Technology | 180 | 7.8% |
| Business | 366 | 16.0% |
| Education | 492 | 21.4% |
| Literature & Languages | 35 | 1.5% |
| Liberal Arts & History | 127 | 5.5% |
| Visual & Performing Arts | 56 | 2.4% |
| Communications | 103 | 4.5% |
| Arts & Humanities | 243 | 10.6% |
| Total | 2,295 | 100.0% |
Transportation & Commute in Taylor County
Vehicle Availability by Sex in Taylor County
The most prevalent vehicle ownership categories in Taylor County are males with 2 vehicles (1,535, accounting for 49.7%) and females with 2 vehicles (1,442, making up 43.9%).
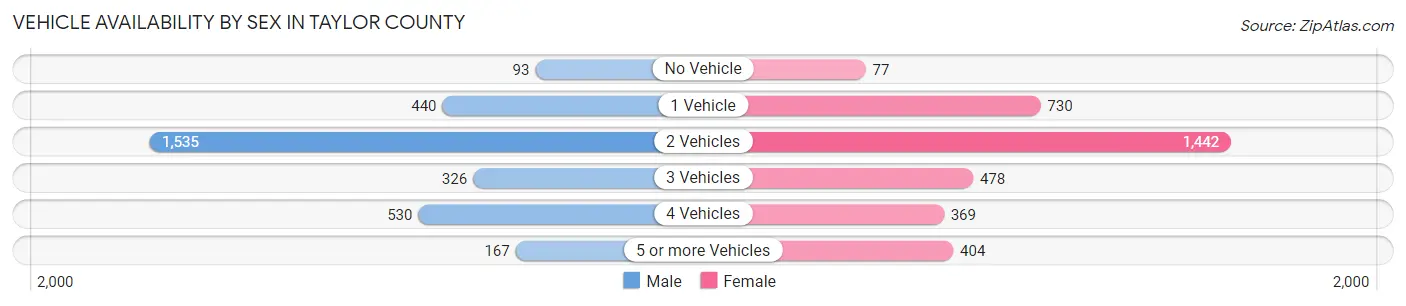
| Vehicles Available | Male | Female |
| No Vehicle | 93 (3.0%) | 77 (2.2%) |
| 1 Vehicle | 440 (14.2%) | 730 (20.9%) |
| 2 Vehicles | 1,535 (49.7%) | 1,442 (41.2%) |
| 3 Vehicles | 326 (10.5%) | 478 (13.7%) |
| 4 Vehicles | 530 (17.2%) | 369 (10.5%) |
| 5 or more Vehicles | 167 (5.4%) | 404 (11.5%) |
| Total | 3,091 (100.0%) | 3,500 (100.0%) |
Commute Time in Taylor County
The most frequently occuring commute durations in Taylor County are 5 to 9 minutes (1,621 commuters, 26.0%), 15 to 19 minutes (1,135 commuters, 18.2%), and 10 to 14 minutes (995 commuters, 16.0%).
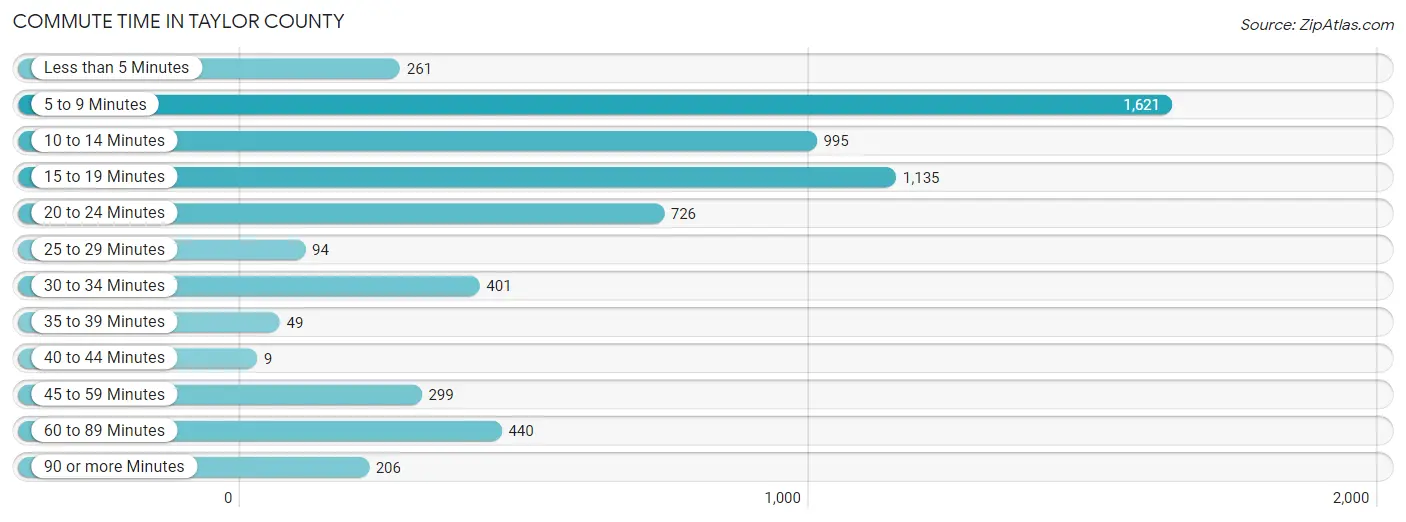
| Commute Time | # Commuters | % Commuters |
| Less than 5 Minutes | 261 | 4.2% |
| 5 to 9 Minutes | 1,621 | 26.0% |
| 10 to 14 Minutes | 995 | 16.0% |
| 15 to 19 Minutes | 1,135 | 18.2% |
| 20 to 24 Minutes | 726 | 11.6% |
| 25 to 29 Minutes | 94 | 1.5% |
| 30 to 34 Minutes | 401 | 6.4% |
| 35 to 39 Minutes | 49 | 0.8% |
| 40 to 44 Minutes | 9 | 0.1% |
| 45 to 59 Minutes | 299 | 4.8% |
| 60 to 89 Minutes | 440 | 7.1% |
| 90 or more Minutes | 206 | 3.3% |
Commute Time by Sex in Taylor County
The most common commute times in Taylor County are 5 to 9 minutes (1,070 commuters, 35.0%) for males and 15 to 19 minutes (773 commuters, 24.3%) for females.
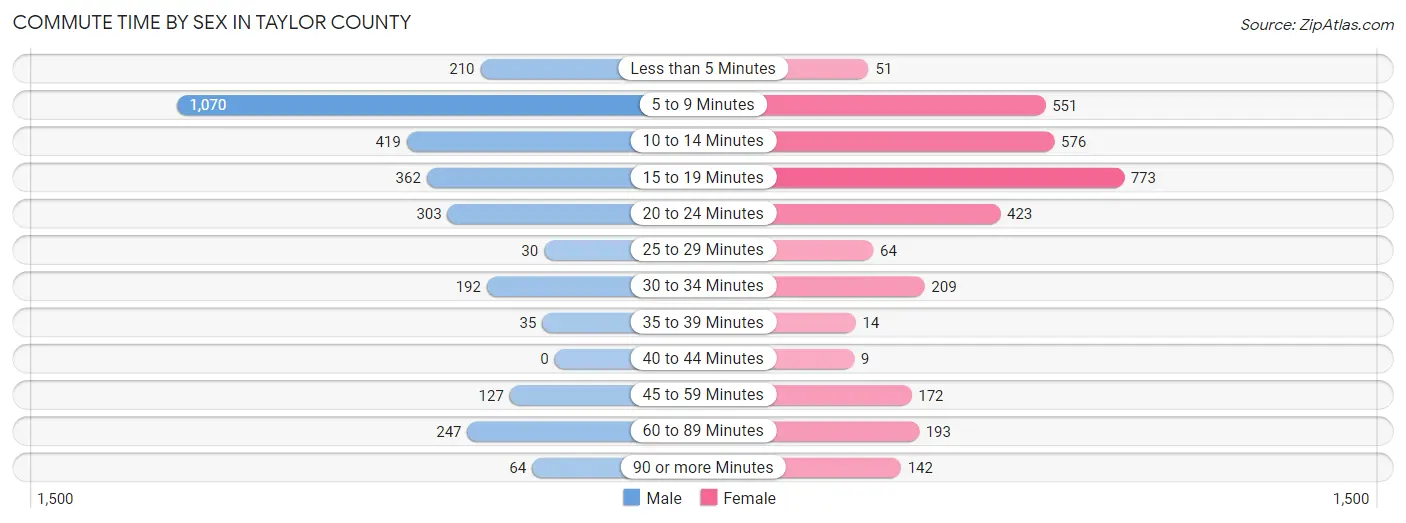
| Commute Time | Male | Female |
| Less than 5 Minutes | 210 (6.9%) | 51 (1.6%) |
| 5 to 9 Minutes | 1,070 (35.0%) | 551 (17.3%) |
| 10 to 14 Minutes | 419 (13.7%) | 576 (18.1%) |
| 15 to 19 Minutes | 362 (11.8%) | 773 (24.3%) |
| 20 to 24 Minutes | 303 (9.9%) | 423 (13.3%) |
| 25 to 29 Minutes | 30 (1.0%) | 64 (2.0%) |
| 30 to 34 Minutes | 192 (6.3%) | 209 (6.6%) |
| 35 to 39 Minutes | 35 (1.1%) | 14 (0.4%) |
| 40 to 44 Minutes | 0 (0.0%) | 9 (0.3%) |
| 45 to 59 Minutes | 127 (4.2%) | 172 (5.4%) |
| 60 to 89 Minutes | 247 (8.1%) | 193 (6.1%) |
| 90 or more Minutes | 64 (2.1%) | 142 (4.5%) |
Time of Departure to Work by Sex in Taylor County
The most frequent times of departure to work in Taylor County are 7:00 AM to 7:29 AM (518, 16.9%) for males and 7:30 AM to 7:59 AM (704, 22.2%) for females.
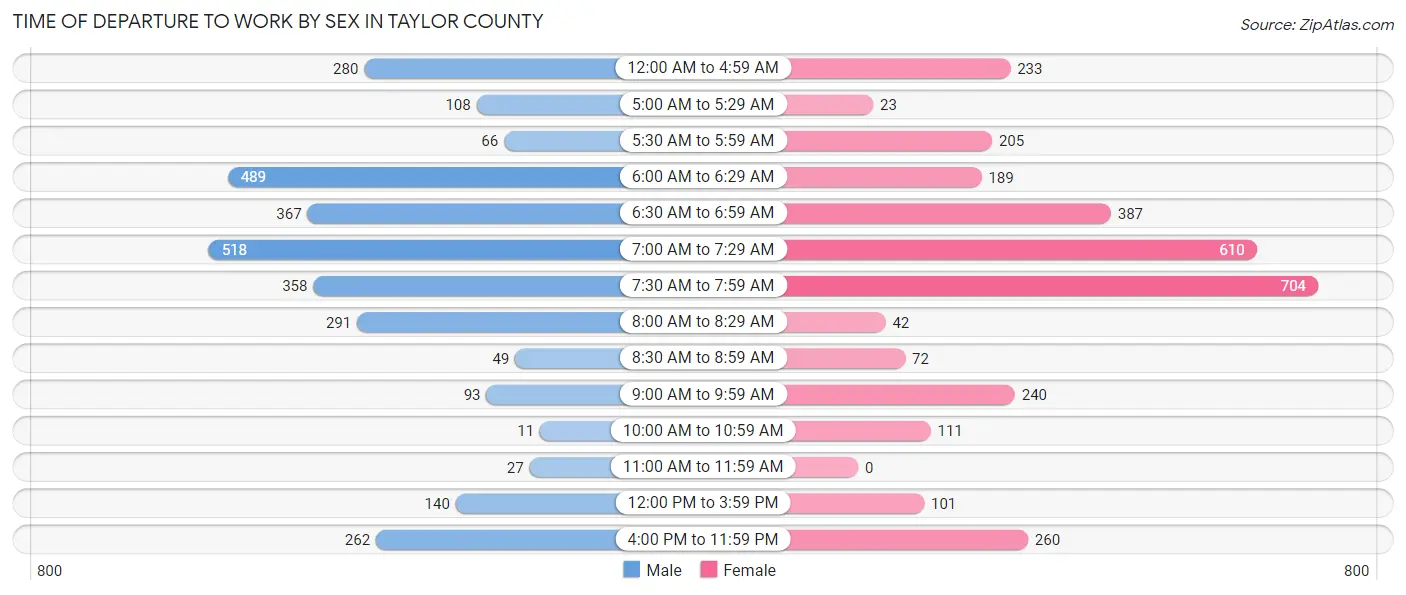
| Time of Departure | Male | Female |
| 12:00 AM to 4:59 AM | 280 (9.1%) | 233 (7.3%) |
| 5:00 AM to 5:29 AM | 108 (3.5%) | 23 (0.7%) |
| 5:30 AM to 5:59 AM | 66 (2.2%) | 205 (6.5%) |
| 6:00 AM to 6:29 AM | 489 (16.0%) | 189 (5.9%) |
| 6:30 AM to 6:59 AM | 367 (12.0%) | 387 (12.2%) |
| 7:00 AM to 7:29 AM | 518 (16.9%) | 610 (19.2%) |
| 7:30 AM to 7:59 AM | 358 (11.7%) | 704 (22.2%) |
| 8:00 AM to 8:29 AM | 291 (9.5%) | 42 (1.3%) |
| 8:30 AM to 8:59 AM | 49 (1.6%) | 72 (2.3%) |
| 9:00 AM to 9:59 AM | 93 (3.0%) | 240 (7.5%) |
| 10:00 AM to 10:59 AM | 11 (0.4%) | 111 (3.5%) |
| 11:00 AM to 11:59 AM | 27 (0.9%) | 0 (0.0%) |
| 12:00 PM to 3:59 PM | 140 (4.6%) | 101 (3.2%) |
| 4:00 PM to 11:59 PM | 262 (8.6%) | 260 (8.2%) |
| Total | 3,059 (100.0%) | 3,177 (100.0%) |
Housing Occupancy in Taylor County
Occupancy by Ownership in Taylor County
Of the total 7,465 dwellings in Taylor County, owner-occupied units account for 5,779 (77.4%), while renter-occupied units make up 1,686 (22.6%).
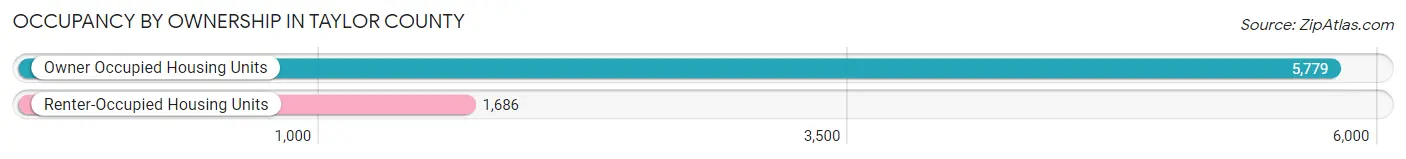
| Occupancy | # Housing Units | % Housing Units |
| Owner Occupied Housing Units | 5,779 | 77.4% |
| Renter-Occupied Housing Units | 1,686 | 22.6% |
| Total Occupied Housing Units | 7,465 | 100.0% |
Occupancy by Household Size in Taylor County
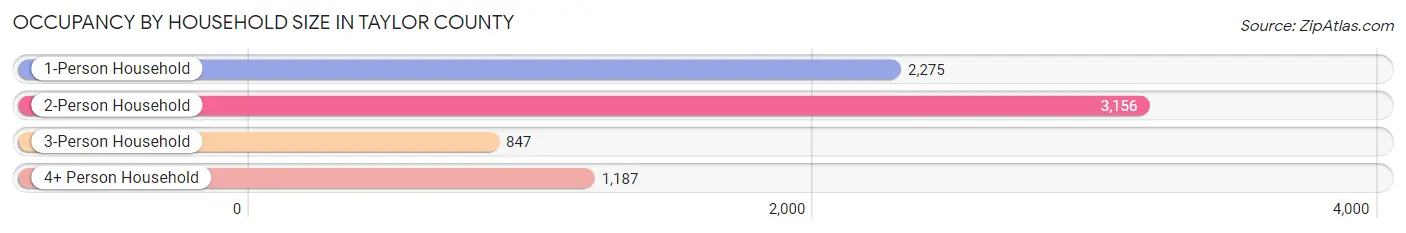
| Household Size | # Housing Units | % Housing Units |
| 1-Person Household | 2,275 | 30.5% |
| 2-Person Household | 3,156 | 42.3% |
| 3-Person Household | 847 | 11.4% |
| 4+ Person Household | 1,187 | 15.9% |
| Total Housing Units | 7,465 | 100.0% |
Occupancy by Ownership by Household Size in Taylor County
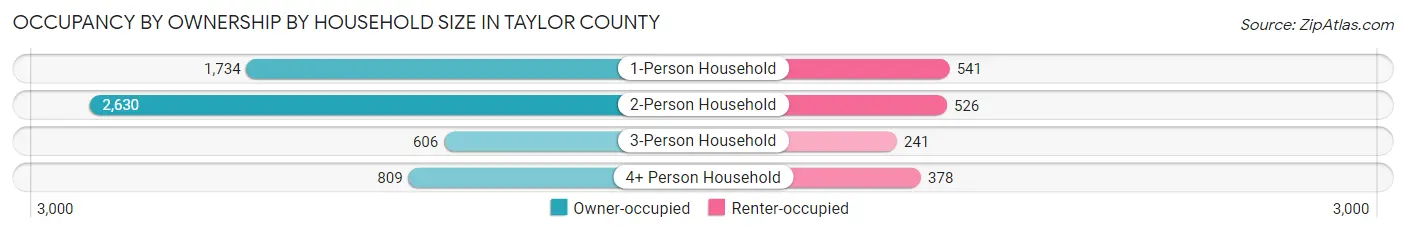
| Household Size | Owner-occupied | Renter-occupied |
| 1-Person Household | 1,734 (76.2%) | 541 (23.8%) |
| 2-Person Household | 2,630 (83.3%) | 526 (16.7%) |
| 3-Person Household | 606 (71.6%) | 241 (28.4%) |
| 4+ Person Household | 809 (68.2%) | 378 (31.8%) |
| Total Housing Units | 5,779 (77.4%) | 1,686 (22.6%) |
Occupancy by Educational Attainment in Taylor County
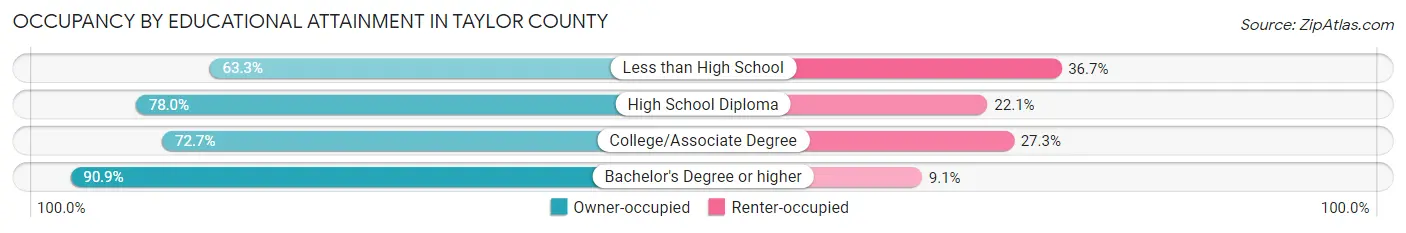
| Household Size | Owner-occupied | Renter-occupied |
| Less than High School | 421 (63.3%) | 244 (36.7%) |
| High School Diploma | 2,619 (77.9%) | 741 (22.1%) |
| College/Associate Degree | 1,555 (72.7%) | 583 (27.3%) |
| Bachelor's Degree or higher | 1,184 (90.9%) | 118 (9.1%) |
Occupancy by Age of Householder in Taylor County
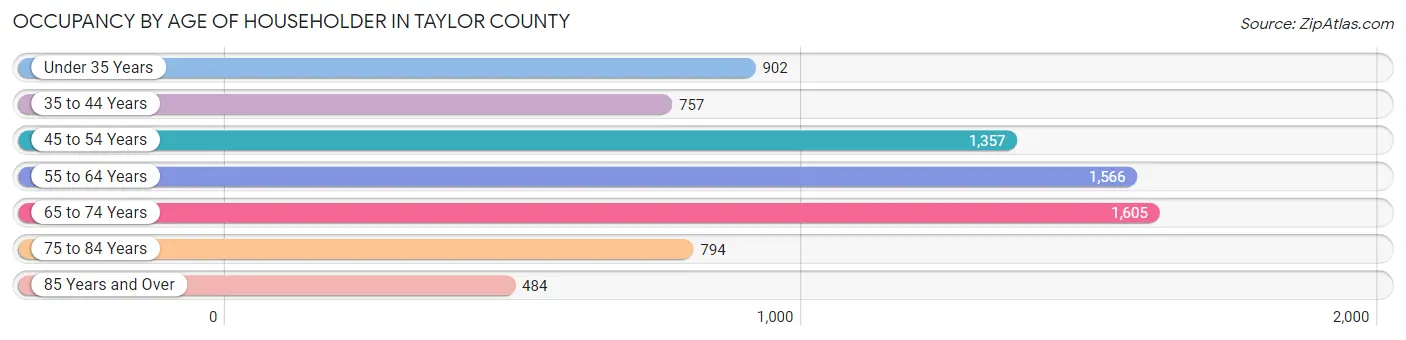
| Age Bracket | # Households | % Households |
| Under 35 Years | 902 | 12.1% |
| 35 to 44 Years | 757 | 10.1% |
| 45 to 54 Years | 1,357 | 18.2% |
| 55 to 64 Years | 1,566 | 21.0% |
| 65 to 74 Years | 1,605 | 21.5% |
| 75 to 84 Years | 794 | 10.6% |
| 85 Years and Over | 484 | 6.5% |
| Total | 7,465 | 100.0% |
Housing Finances in Taylor County
Median Income by Occupancy in Taylor County
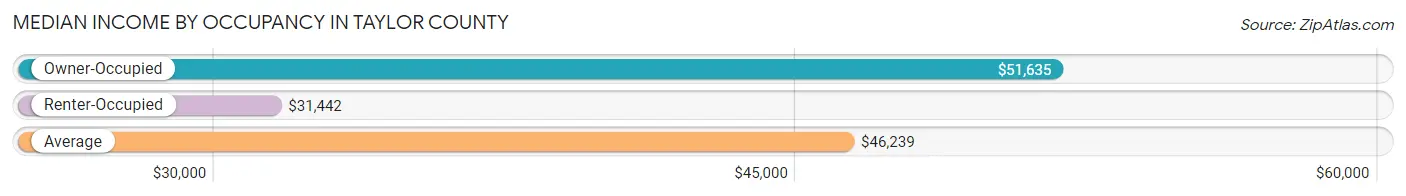
| Occupancy Type | # Households | Median Income |
| Owner-Occupied | 5,779 (77.4%) | $51,635 |
| Renter-Occupied | 1,686 (22.6%) | $31,442 |
| Average | 7,465 (100.0%) | $46,239 |
Occupancy by Householder Income Bracket in Taylor County
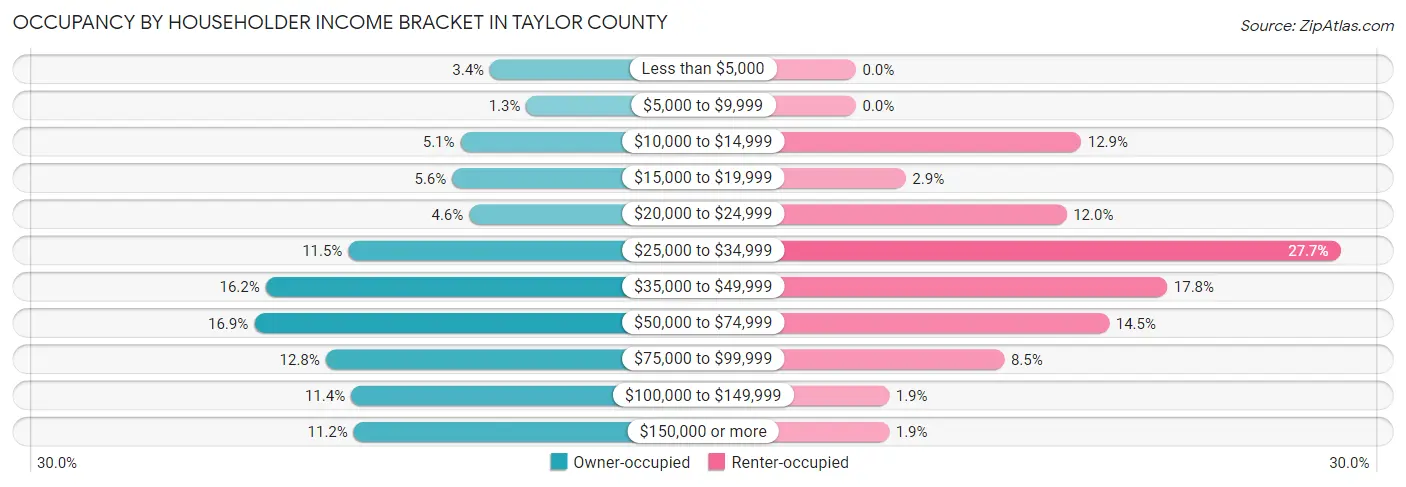
| Income Bracket | Owner-occupied | Renter-occupied |
| Less than $5,000 | 197 (3.4%) | 0 (0.0%) |
| $5,000 to $9,999 | 77 (1.3%) | 0 (0.0%) |
| $10,000 to $14,999 | 295 (5.1%) | 217 (12.9%) |
| $15,000 to $19,999 | 322 (5.6%) | 48 (2.9%) |
| $20,000 to $24,999 | 266 (4.6%) | 203 (12.0%) |
| $25,000 to $34,999 | 665 (11.5%) | 467 (27.7%) |
| $35,000 to $49,999 | 938 (16.2%) | 300 (17.8%) |
| $50,000 to $74,999 | 976 (16.9%) | 244 (14.5%) |
| $75,000 to $99,999 | 740 (12.8%) | 143 (8.5%) |
| $100,000 to $149,999 | 656 (11.4%) | 32 (1.9%) |
| $150,000 or more | 647 (11.2%) | 32 (1.9%) |
| Total | 5,779 (100.0%) | 1,686 (100.0%) |
Monthly Housing Cost Tiers in Taylor County
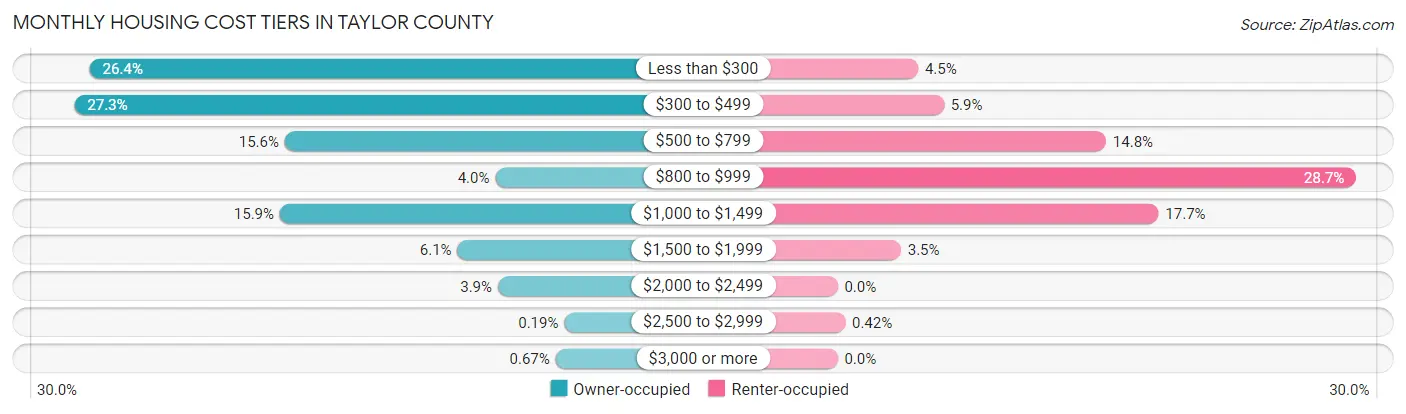
| Monthly Cost | Owner-occupied | Renter-occupied |
| Less than $300 | 1,526 (26.4%) | 75 (4.4%) |
| $300 to $499 | 1,575 (27.3%) | 99 (5.9%) |
| $500 to $799 | 903 (15.6%) | 250 (14.8%) |
| $800 to $999 | 231 (4.0%) | 483 (28.6%) |
| $1,000 to $1,499 | 919 (15.9%) | 299 (17.7%) |
| $1,500 to $1,999 | 352 (6.1%) | 59 (3.5%) |
| $2,000 to $2,499 | 223 (3.9%) | 0 (0.0%) |
| $2,500 to $2,999 | 11 (0.2%) | 7 (0.4%) |
| $3,000 or more | 39 (0.7%) | 0 (0.0%) |
| Total | 5,779 (100.0%) | 1,686 (100.0%) |
Physical Housing Characteristics in Taylor County
Housing Structures in Taylor County
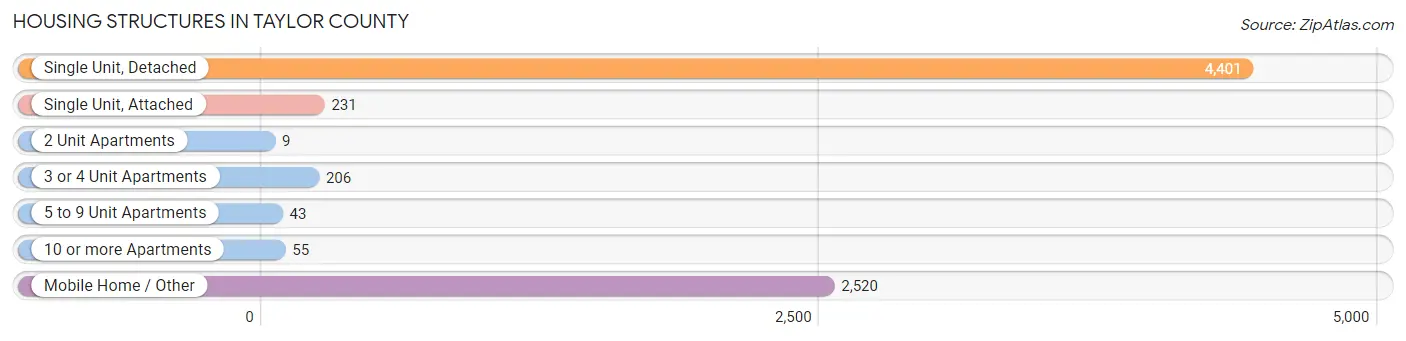
| Structure Type | # Housing Units | % Housing Units |
| Single Unit, Detached | 4,401 | 59.0% |
| Single Unit, Attached | 231 | 3.1% |
| 2 Unit Apartments | 9 | 0.1% |
| 3 or 4 Unit Apartments | 206 | 2.8% |
| 5 to 9 Unit Apartments | 43 | 0.6% |
| 10 or more Apartments | 55 | 0.7% |
| Mobile Home / Other | 2,520 | 33.8% |
| Total | 7,465 | 100.0% |
Housing Structures by Occupancy in Taylor County
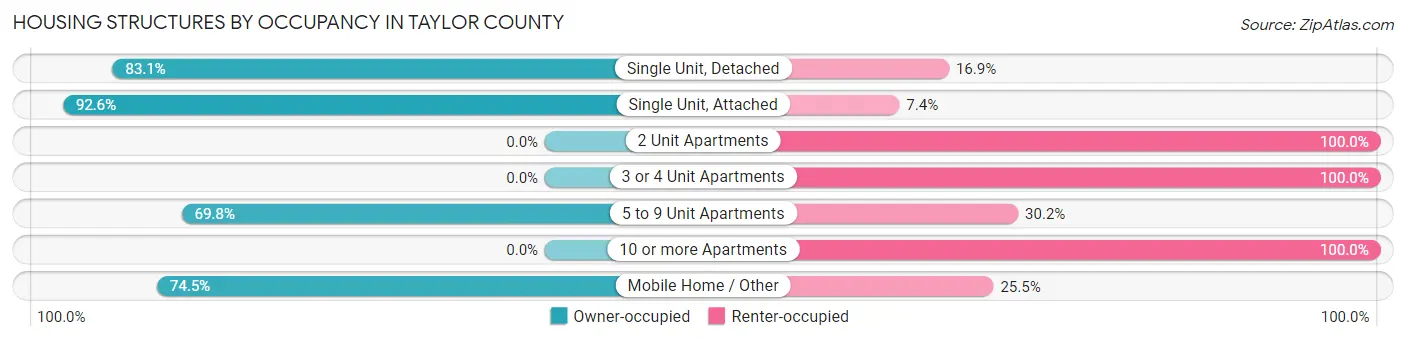
| Structure Type | Owner-occupied | Renter-occupied |
| Single Unit, Detached | 3,657 (83.1%) | 744 (16.9%) |
| Single Unit, Attached | 214 (92.6%) | 17 (7.4%) |
| 2 Unit Apartments | 0 (0.0%) | 9 (100.0%) |
| 3 or 4 Unit Apartments | 0 (0.0%) | 206 (100.0%) |
| 5 to 9 Unit Apartments | 30 (69.8%) | 13 (30.2%) |
| 10 or more Apartments | 0 (0.0%) | 55 (100.0%) |
| Mobile Home / Other | 1,878 (74.5%) | 642 (25.5%) |
| Total | 5,779 (77.4%) | 1,686 (22.6%) |
Housing Structures by Number of Rooms in Taylor County
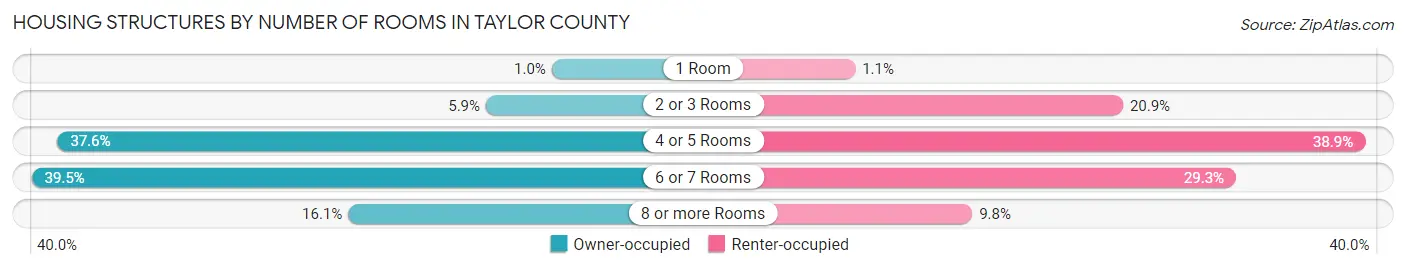
| Number of Rooms | Owner-occupied | Renter-occupied |
| 1 Room | 58 (1.0%) | 19 (1.1%) |
| 2 or 3 Rooms | 339 (5.9%) | 353 (20.9%) |
| 4 or 5 Rooms | 2,172 (37.6%) | 655 (38.9%) |
| 6 or 7 Rooms | 2,282 (39.5%) | 494 (29.3%) |
| 8 or more Rooms | 928 (16.1%) | 165 (9.8%) |
| Total | 5,779 (100.0%) | 1,686 (100.0%) |
Housing Structure by Heating Type in Taylor County
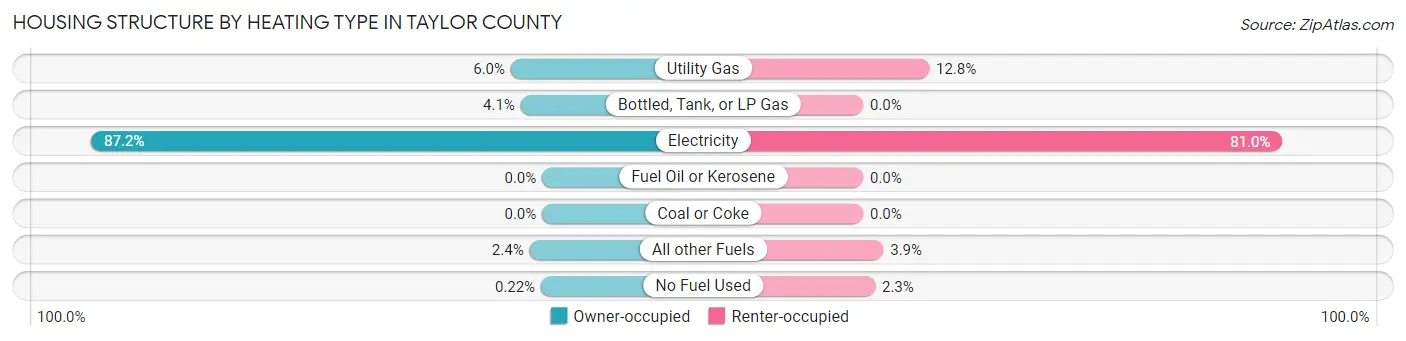
| Heating Type | Owner-occupied | Renter-occupied |
| Utility Gas | 349 (6.0%) | 215 (12.8%) |
| Bottled, Tank, or LP Gas | 239 (4.1%) | 0 (0.0%) |
| Electricity | 5,037 (87.2%) | 1,366 (81.0%) |
| Fuel Oil or Kerosene | 0 (0.0%) | 0 (0.0%) |
| Coal or Coke | 0 (0.0%) | 0 (0.0%) |
| All other Fuels | 141 (2.4%) | 66 (3.9%) |
| No Fuel Used | 13 (0.2%) | 39 (2.3%) |
| Total | 5,779 (100.0%) | 1,686 (100.0%) |
Household Vehicle Usage in Taylor County
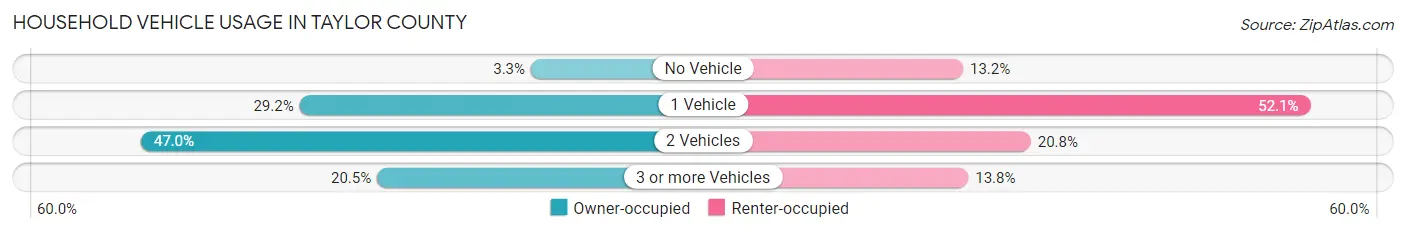
| Vehicles per Household | Owner-occupied | Renter-occupied |
| No Vehicle | 190 (3.3%) | 223 (13.2%) |
| 1 Vehicle | 1,688 (29.2%) | 879 (52.1%) |
| 2 Vehicles | 2,715 (47.0%) | 351 (20.8%) |
| 3 or more Vehicles | 1,186 (20.5%) | 233 (13.8%) |
| Total | 5,779 (100.0%) | 1,686 (100.0%) |
Real Estate & Mortgages in Taylor County
Real Estate and Mortgage Overview in Taylor County
| Characteristic | Without Mortgage | With Mortgage |
| Housing Units | 3,937 | 1,842 |
| Median Property Value | $76,800 | $184,300 |
| Median Household Income | $42,176 | $285 |
| Monthly Housing Costs | $349 | $24 |
| Real Estate Taxes | $531 | $274 |
Property Value by Mortgage Status in Taylor County
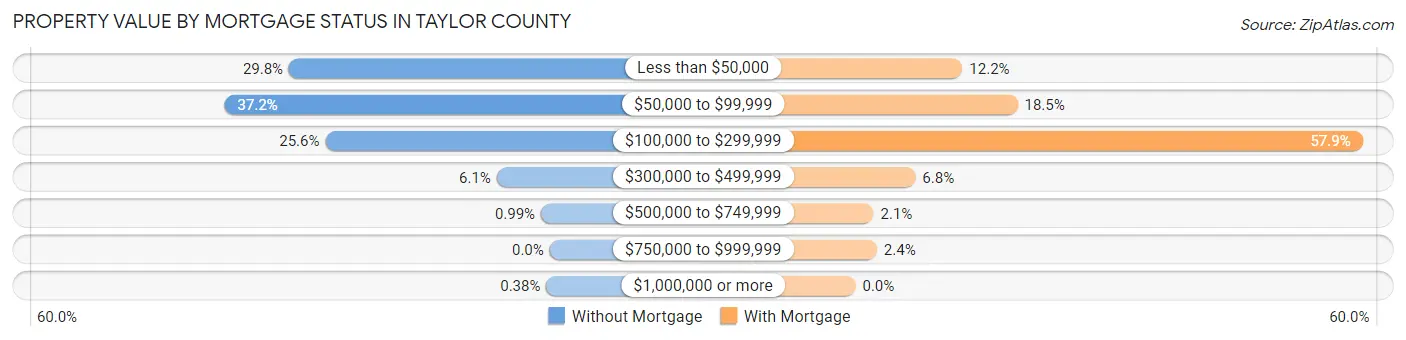
| Property Value | Without Mortgage | With Mortgage |
| Less than $50,000 | 1,173 (29.8%) | 225 (12.2%) |
| $50,000 to $99,999 | 1,463 (37.2%) | 341 (18.5%) |
| $100,000 to $299,999 | 1,009 (25.6%) | 1,067 (57.9%) |
| $300,000 to $499,999 | 238 (6.0%) | 126 (6.8%) |
| $500,000 to $749,999 | 39 (1.0%) | 38 (2.1%) |
| $750,000 to $999,999 | 0 (0.0%) | 45 (2.4%) |
| $1,000,000 or more | 15 (0.4%) | 0 (0.0%) |
| Total | 3,937 (100.0%) | 1,842 (100.0%) |
Household Income by Mortgage Status in Taylor County
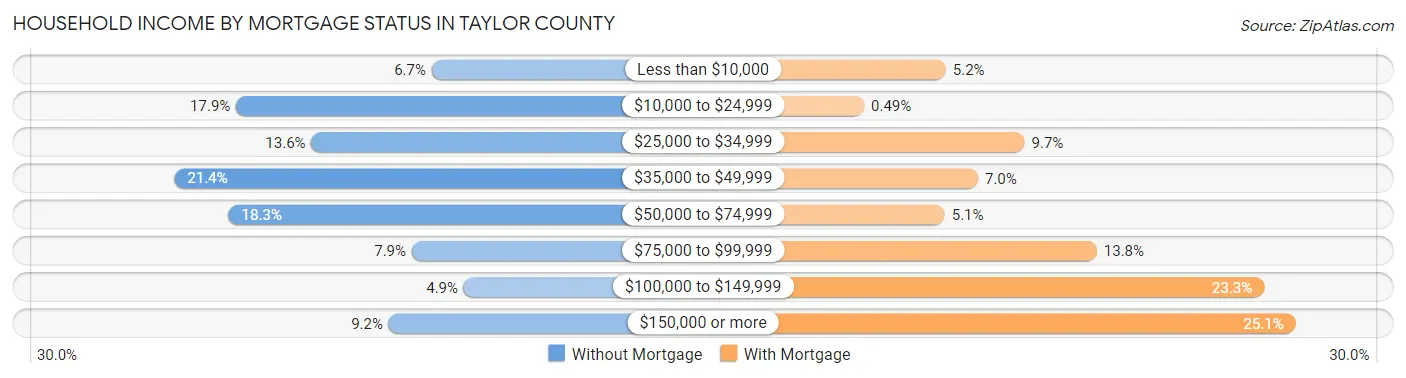
| Household Income | Without Mortgage | With Mortgage |
| Less than $10,000 | 265 (6.7%) | 95 (5.2%) |
| $10,000 to $24,999 | 705 (17.9%) | 9 (0.5%) |
| $25,000 to $34,999 | 536 (13.6%) | 178 (9.7%) |
| $35,000 to $49,999 | 844 (21.4%) | 129 (7.0%) |
| $50,000 to $74,999 | 722 (18.3%) | 94 (5.1%) |
| $75,000 to $99,999 | 310 (7.9%) | 254 (13.8%) |
| $100,000 to $149,999 | 193 (4.9%) | 430 (23.3%) |
| $150,000 or more | 362 (9.2%) | 463 (25.1%) |
| Total | 3,937 (100.0%) | 1,842 (100.0%) |
Property Value to Household Income Ratio in Taylor County
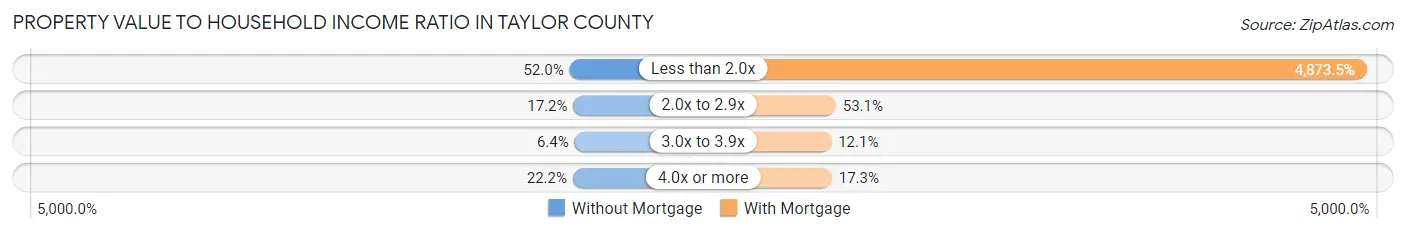
| Value-to-Income Ratio | Without Mortgage | With Mortgage |
| Less than 2.0x | 2,046 (52.0%) | 89,769 (4,873.4%) |
| 2.0x to 2.9x | 676 (17.2%) | 978 (53.1%) |
| 3.0x to 3.9x | 252 (6.4%) | 222 (12.0%) |
| 4.0x or more | 872 (22.2%) | 319 (17.3%) |
| Total | 3,937 (100.0%) | 1,842 (100.0%) |
Real Estate Taxes by Mortgage Status in Taylor County
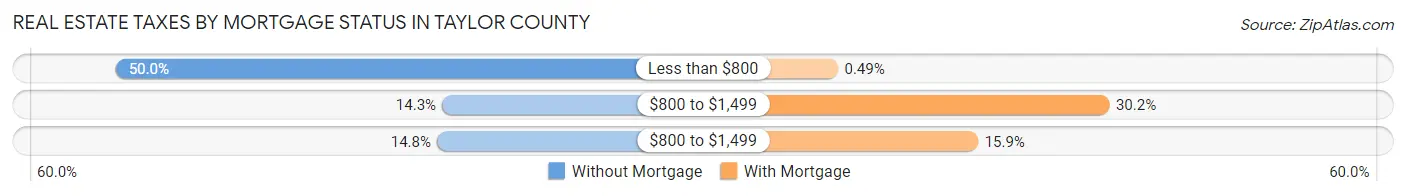
| Property Taxes | Without Mortgage | With Mortgage |
| Less than $800 | 1,969 (50.0%) | 9 (0.5%) |
| $800 to $1,499 | 562 (14.3%) | 557 (30.2%) |
| $800 to $1,499 | 584 (14.8%) | 292 (15.9%) |
| Total | 3,937 (100.0%) | 1,842 (100.0%) |
Health & Disability in Taylor County
Health Insurance Coverage by Age in Taylor County
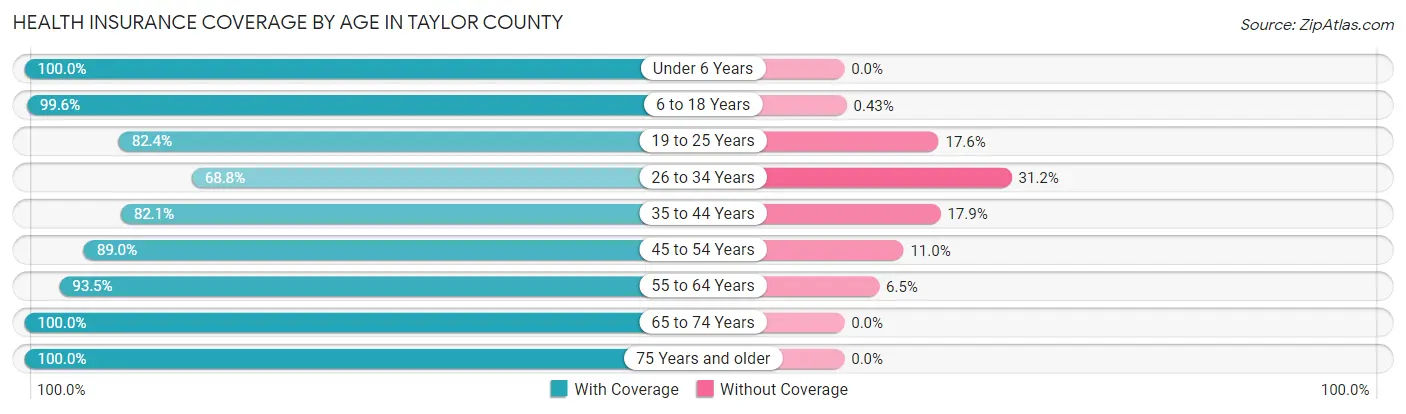
| Age Bracket | With Coverage | Without Coverage |
| Under 6 Years | 1,134 (100.0%) | 0 (0.0%) |
| 6 to 18 Years | 3,272 (99.6%) | 14 (0.4%) |
| 19 to 25 Years | 1,004 (82.4%) | 214 (17.6%) |
| 26 to 34 Years | 1,109 (68.8%) | 503 (31.2%) |
| 35 to 44 Years | 1,404 (82.1%) | 307 (17.9%) |
| 45 to 54 Years | 2,336 (89.0%) | 290 (11.0%) |
| 55 to 64 Years | 2,479 (93.5%) | 172 (6.5%) |
| 65 to 74 Years | 2,451 (100.0%) | 0 (0.0%) |
| 75 Years and older | 1,713 (100.0%) | 0 (0.0%) |
| Total | 16,902 (91.8%) | 1,500 (8.2%) |
Health Insurance Coverage by Citizenship Status in Taylor County
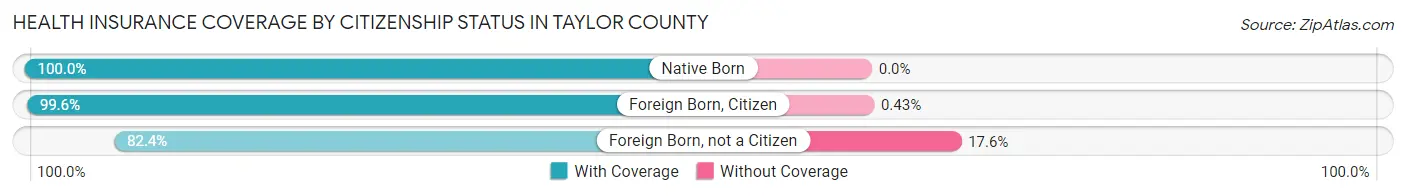
| Citizenship Status | With Coverage | Without Coverage |
| Native Born | 1,134 (100.0%) | 0 (0.0%) |
| Foreign Born, Citizen | 3,272 (99.6%) | 14 (0.4%) |
| Foreign Born, not a Citizen | 1,004 (82.4%) | 214 (17.6%) |
Health Insurance Coverage by Household Income in Taylor County
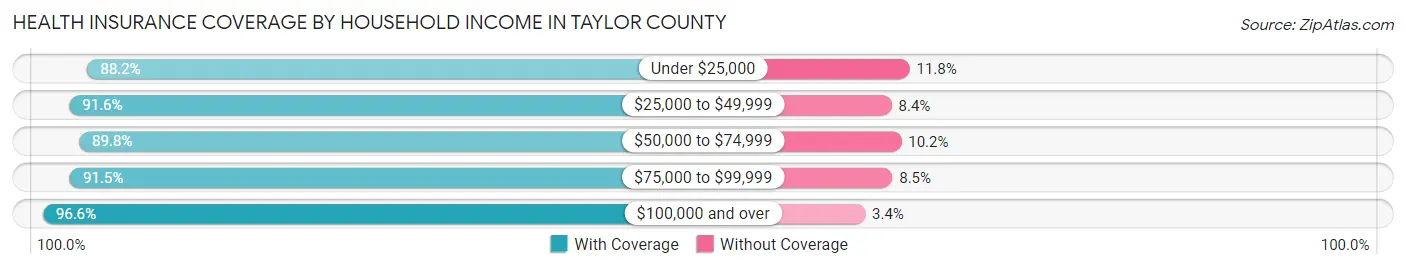
| Household Income | With Coverage | Without Coverage |
| Under $25,000 | 2,385 (88.2%) | 318 (11.8%) |
| $25,000 to $49,999 | 4,619 (91.6%) | 423 (8.4%) |
| $50,000 to $74,999 | 3,194 (89.8%) | 363 (10.2%) |
| $75,000 to $99,999 | 2,533 (91.5%) | 236 (8.5%) |
| $100,000 and over | 4,137 (96.6%) | 147 (3.4%) |
Public vs Private Health Insurance Coverage by Age in Taylor County
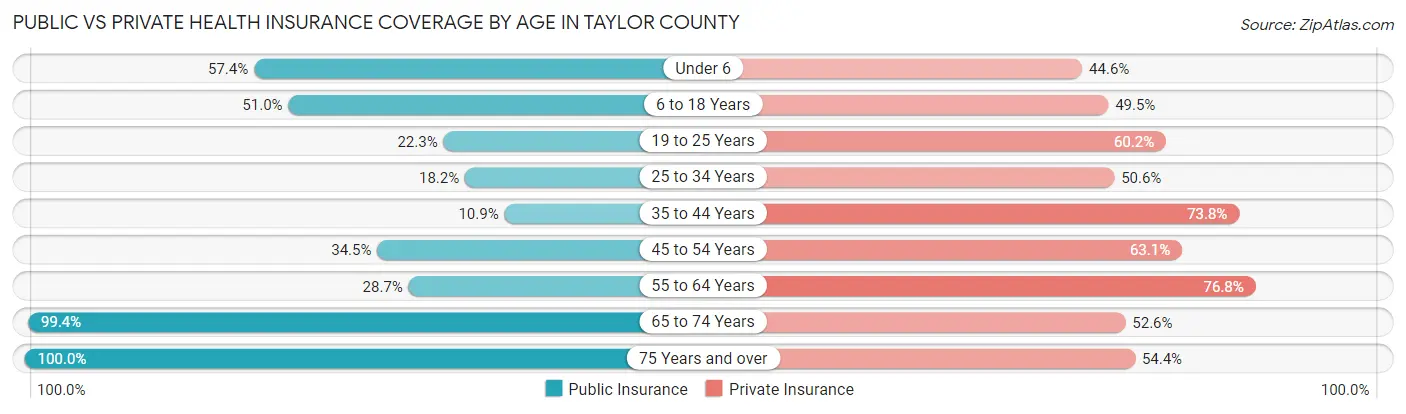
| Age Bracket | Public Insurance | Private Insurance |
| Under 6 | 651 (57.4%) | 506 (44.6%) |
| 6 to 18 Years | 1,677 (51.0%) | 1,625 (49.4%) |
| 19 to 25 Years | 271 (22.3%) | 733 (60.2%) |
| 25 to 34 Years | 294 (18.2%) | 815 (50.6%) |
| 35 to 44 Years | 187 (10.9%) | 1,262 (73.8%) |
| 45 to 54 Years | 907 (34.5%) | 1,658 (63.1%) |
| 55 to 64 Years | 761 (28.7%) | 2,036 (76.8%) |
| 65 to 74 Years | 2,436 (99.4%) | 1,290 (52.6%) |
| 75 Years and over | 1,713 (100.0%) | 932 (54.4%) |
| Total | 8,897 (48.3%) | 10,857 (59.0%) |
Disability Status by Sex by Age in Taylor County
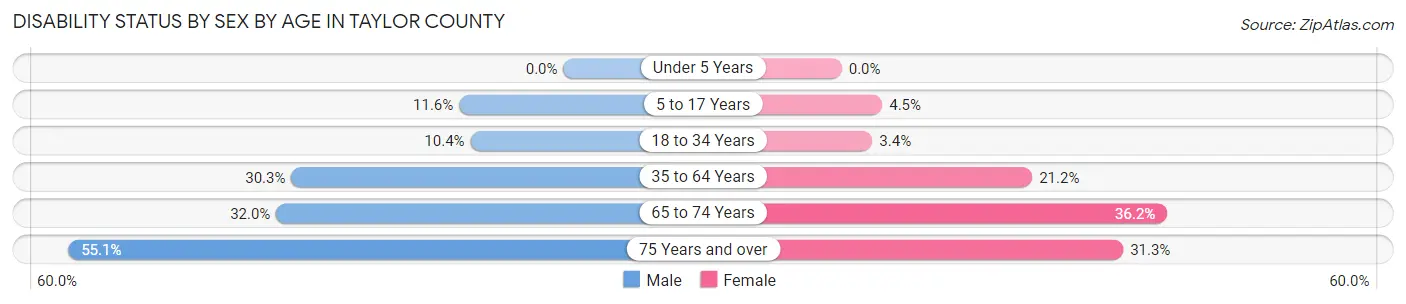
| Age Bracket | Male | Female |
| Under 5 Years | 0 (0.0%) | 0 (0.0%) |
| 5 to 17 Years | 190 (11.6%) | 74 (4.5%) |
| 18 to 34 Years | 159 (10.3%) | 52 (3.4%) |
| 35 to 64 Years | 1,016 (30.3%) | 771 (21.2%) |
| 65 to 74 Years | 361 (32.0%) | 479 (36.2%) |
| 75 Years and over | 429 (55.1%) | 293 (31.3%) |
Disability Class by Sex by Age in Taylor County
Disability Class: Hearing Difficulty
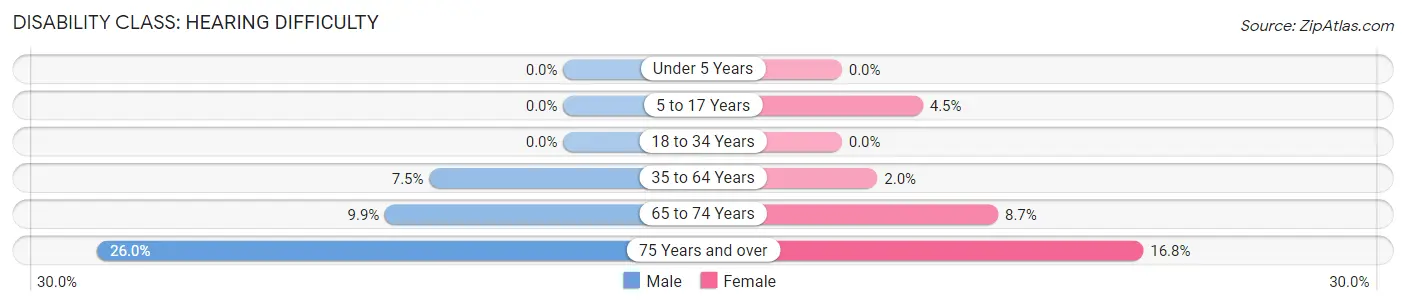
| Age Bracket | Male | Female |
| Under 5 Years | 0 (0.0%) | 0 (0.0%) |
| 5 to 17 Years | 0 (0.0%) | 74 (4.5%) |
| 18 to 34 Years | 0 (0.0%) | 0 (0.0%) |
| 35 to 64 Years | 250 (7.5%) | 72 (2.0%) |
| 65 to 74 Years | 112 (9.9%) | 115 (8.7%) |
| 75 Years and over | 202 (26.0%) | 157 (16.8%) |
Disability Class: Vision Difficulty
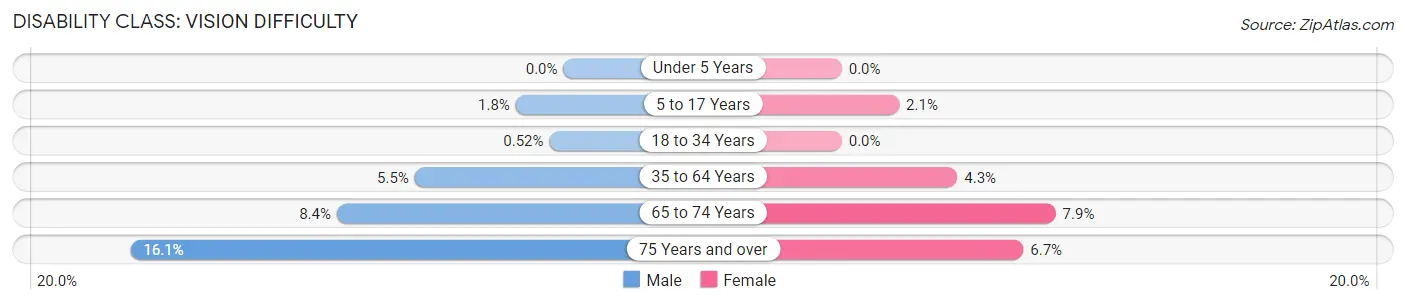
| Age Bracket | Male | Female |
| Under 5 Years | 0 (0.0%) | 0 (0.0%) |
| 5 to 17 Years | 29 (1.8%) | 35 (2.1%) |
| 18 to 34 Years | 8 (0.5%) | 0 (0.0%) |
| 35 to 64 Years | 185 (5.5%) | 156 (4.3%) |
| 65 to 74 Years | 95 (8.4%) | 105 (7.9%) |
| 75 Years and over | 125 (16.1%) | 63 (6.7%) |
Disability Class: Cognitive Difficulty
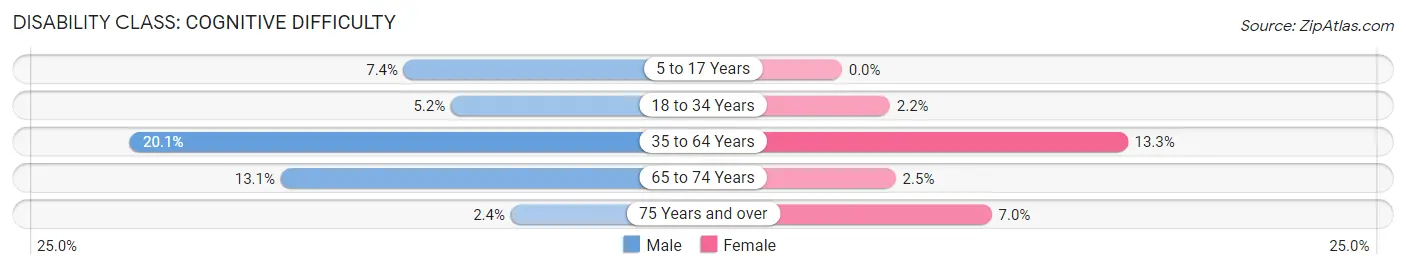
| Age Bracket | Male | Female |
| 5 to 17 Years | 121 (7.4%) | 0 (0.0%) |
| 18 to 34 Years | 80 (5.2%) | 34 (2.2%) |
| 35 to 64 Years | 674 (20.1%) | 482 (13.3%) |
| 65 to 74 Years | 148 (13.1%) | 33 (2.5%) |
| 75 Years and over | 19 (2.4%) | 65 (7.0%) |
Disability Class: Ambulatory Difficulty
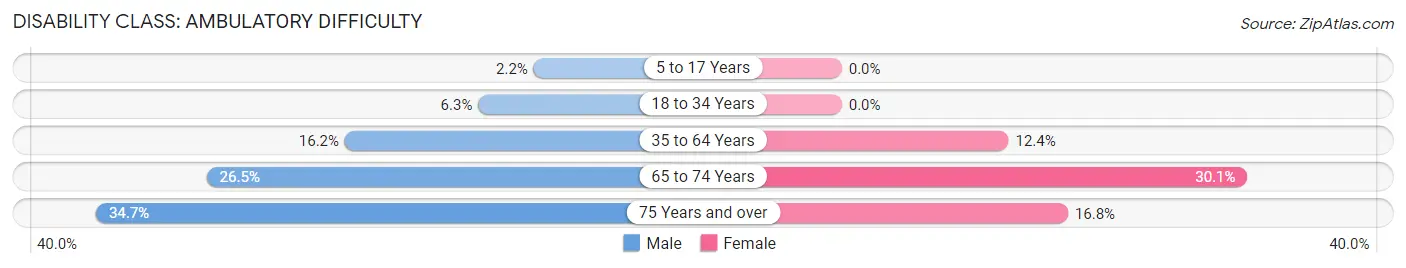
| Age Bracket | Male | Female |
| 5 to 17 Years | 36 (2.2%) | 0 (0.0%) |
| 18 to 34 Years | 97 (6.3%) | 0 (0.0%) |
| 35 to 64 Years | 544 (16.2%) | 450 (12.4%) |
| 65 to 74 Years | 299 (26.5%) | 398 (30.1%) |
| 75 Years and over | 270 (34.7%) | 157 (16.8%) |
Disability Class: Self-Care Difficulty
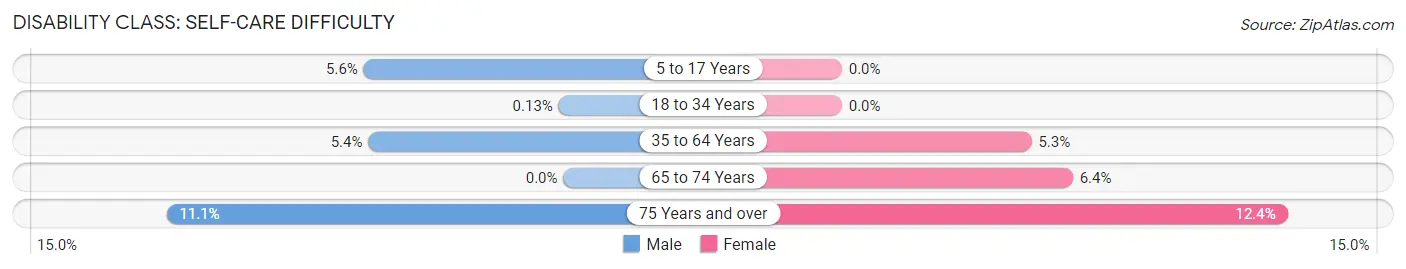
| Age Bracket | Male | Female |
| 5 to 17 Years | 91 (5.6%) | 0 (0.0%) |
| 18 to 34 Years | 2 (0.1%) | 0 (0.0%) |
| 35 to 64 Years | 182 (5.4%) | 192 (5.3%) |
| 65 to 74 Years | 0 (0.0%) | 85 (6.4%) |
| 75 Years and over | 86 (11.1%) | 116 (12.4%) |
Technology Access in Taylor County
Computing Device Access in Taylor County
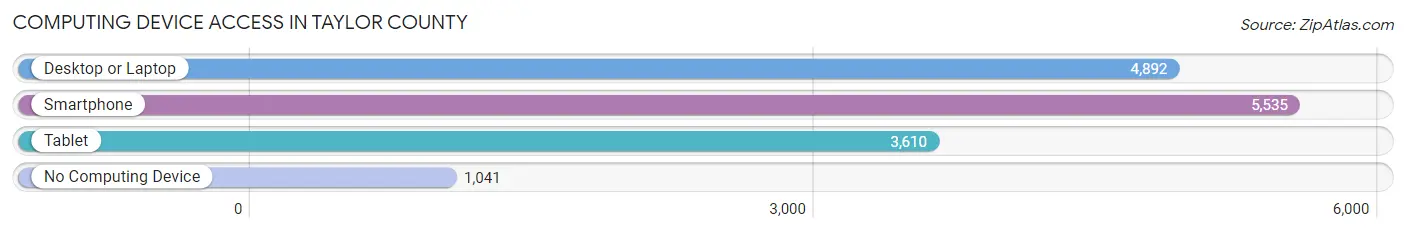
| Device Type | # Households | % Households |
| Desktop or Laptop | 4,892 | 65.5% |
| Smartphone | 5,535 | 74.2% |
| Tablet | 3,610 | 48.4% |
| No Computing Device | 1,041 | 14.0% |
| Total | 7,465 | 100.0% |
Internet Access in Taylor County
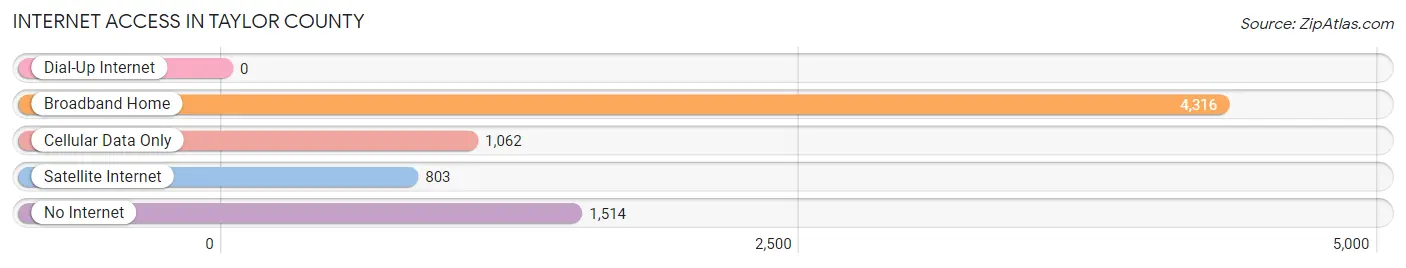
| Internet Type | # Households | % Households |
| Dial-Up Internet | 0 | 0.0% |
| Broadband Home | 4,316 | 57.8% |
| Cellular Data Only | 1,062 | 14.2% |
| Satellite Internet | 803 | 10.8% |
| No Internet | 1,514 | 20.3% |
| Total | 7,465 | 100.0% |
Taylor County Summary
Taylor County is a county located in the state of Florida in the United States. It is part of the Big Bend region of the state and is bordered by Jefferson County to the north, Madison County to the east, Lafayette County to the south, and Dixie County to the west. As of the 2010 census, the population was 22,570. The county seat is Perry.
History
The area that is now Taylor County was originally inhabited by the Apalachee and Timucua Native American tribes. The first European settlers arrived in the area in the early 19th century, and the county was created in 1856 from parts of Madison and Lafayette counties. It was named for Zachary Taylor, the 12th President of the United States.
During the Civil War, Taylor County was a Confederate stronghold. The county was the site of the Battle of Olustee in 1864, which was the largest battle ever fought in Florida. After the war, the county's economy was based on timber and turpentine production.
In the early 20th century, the county's economy shifted to agriculture, with the production of cotton, peanuts, and tobacco. In the 1950s, the county began to develop its tourism industry, and today it is a popular destination for fishing, hunting, and other outdoor activities.
Geography
Taylor County is located in the Big Bend region of Florida, in the panhandle of the state. It is bordered by Jefferson County to the north, Madison County to the east, Lafayette County to the south, and Dixie County to the west. The county covers an area of 876 square miles, of which 845 square miles is land and 31 square miles is water.
The county is mostly flat, with some rolling hills in the northern part of the county. The Aucilla River runs through the county, and there are several lakes, including Lake Bird, Lake Miccosukee, and Lake Talquin.
Economy
The economy of Taylor County is largely based on agriculture, forestry, and tourism. The county is home to several large timber companies, and the timber industry is a major employer in the county. Agriculture is also important, with the production of cotton, peanuts, and tobacco.
The county is also a popular destination for fishing, hunting, and other outdoor activities. There are several state parks in the county, including the Econfina River State Park, the Steinhatchee River State Park, and the Taylor County Wildlife Management Area.
Demographics
As of the 2010 census, there were 22,570 people, 8,845 households, and 6,093 families living in the county. The population density was 26.5 people per square mile. There were 10,093 housing units, with an average density of 11.9 per square mile.
The racial makeup of the county was 79.2% White, 16.2% African American, 0.5% Native American, 0.7% Asian, 0.1% Pacific Islander, 1.7% from other races, and 1.7% from two or more races. Hispanic or Latino of any race were 4.3% of the population.
The median income for a household in the county was $30,945, and the median income for a family was $37,945. The per capita income for the county was $17,845. About 17.2% of families and 21.3% of the population were below the poverty line, including 28.2% of those under age 18 and 16.2% of those age 65 or over.
Common Questions
What is Per Capita Income in Taylor County?
Per Capita income in Taylor County is $26,859.
What is the Median Family Income in Taylor County?
Median Family Income in Taylor County is $54,890.
What is the Median Household income in Taylor County?
Median Household Income in Taylor County is $46,239.
What is Income or Wage Gap in Taylor County?
Income or Wage Gap in Taylor County is 23.9%.
Women in Taylor County earn 76.1 cents for every dollar earned by a man.
What is Family Income Deficit in Taylor County?
Family Income Deficit in Taylor County is $8,528.
Families that are below poverty line in Taylor County earn $8,528 less on average than the poverty threshold level.
What is Inequality or Gini Index in Taylor County?
Inequality or Gini Index in Taylor County is 0.53.
What is the Total Population of Taylor County?
Total Population of Taylor County is 21,421.
What is the Total Male Population of Taylor County?
Total Male Population of Taylor County is 12,051.
What is the Total Female Population of Taylor County?
Total Female Population of Taylor County is 9,370.
What is the Ratio of Males per 100 Females in Taylor County?
There are 128.61 Males per 100 Females in Taylor County.
What is the Ratio of Females per 100 Males in Taylor County?
There are 77.75 Females per 100 Males in Taylor County.
What is the Median Population Age in Taylor County?
Median Population Age in Taylor County is 44.3 Years.
What is the Average Family Size in Taylor County
Average Family Size in Taylor County is 3.0 People.
What is the Average Household Size in Taylor County
Average Household Size in Taylor County is 2.5 People.
How Large is the Labor Force in Taylor County?
There are 7,171 People in the Labor Forcein in Taylor County.
What is the Percentage of People in the Labor Force in Taylor County?
40.1% of People are in the Labor Force in Taylor County.
What is the Unemployment Rate in Taylor County?
Unemployment Rate in Taylor County is 5.8%.