Suwannee County, FL Map & Demographics
Suwannee County Map
Suwannee County Overview
$24,991
PER CAPITA INCOME
$58,070
AVG FAMILY INCOME
$49,729
AVG HOUSEHOLD INCOME
19.6%
WAGE / INCOME GAP [ % ]
80.4¢/ $1
WAGE / INCOME GAP [ $ ]
$12,770
FAMILY INCOME DEFICIT
0.44
INEQUALITY / GINI INDEX
43,881
TOTAL POPULATION
22,980
MALE POPULATION
20,901
FEMALE POPULATION
109.95
MALES / 100 FEMALES
90.95
FEMALES / 100 MALES
42.8
MEDIAN AGE
3.2
AVG FAMILY SIZE
2.7
AVG HOUSEHOLD SIZE
18,209
LABOR FORCE [ PEOPLE ]
50.5%
PERCENT IN LABOR FORCE
5.5%
UNEMPLOYMENT RATE
Suwannee County Area Codes
Income in Suwannee County
Income Overview in Suwannee County
Per Capita Income in Suwannee County is $24,991, while median incomes of families and households are $58,070 and $49,729 respectively.
| Characteristic | Number | Measure |
| Per Capita Income | 43,881 | $24,991 |
| Median Family Income | 10,856 | $58,070 |
| Mean Family Income | 10,856 | $72,604 |
| Median Household Income | 15,453 | $49,729 |
| Mean Household Income | 15,453 | $64,635 |
| Income Deficit | 10,856 | $12,770 |
| Wage / Income Gap (%) | 43,881 | 19.59% |
| Wage / Income Gap ($) | 43,881 | 80.41¢ per $1 |
| Gini / Inequality Index | 43,881 | 0.44 |
Earnings by Sex in Suwannee County
Average Earnings in Suwannee County are $30,938, $35,137 for men and $28,252 for women, a difference of 19.6%.
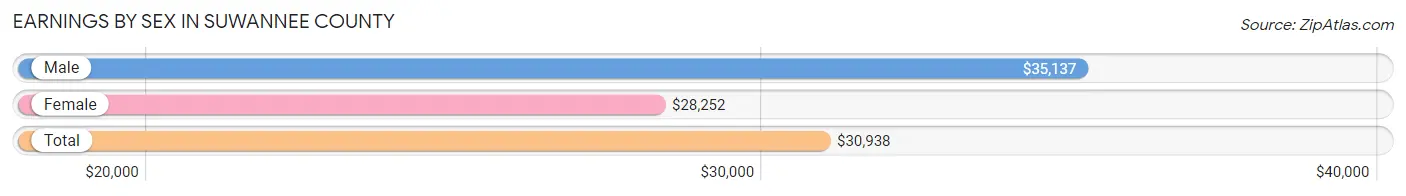
| Sex | Number | Average Earnings |
| Male | 9,899 (52.5%) | $35,137 |
| Female | 8,957 (47.5%) | $28,252 |
| Total | 18,856 (100.0%) | $30,938 |
Earnings by Sex by Income Bracket in Suwannee County
The most common earnings brackets in Suwannee County are $35,000 to $39,999 for men (911 | 9.2%) and $25,000 to $29,999 for women (1,346 | 15.0%).
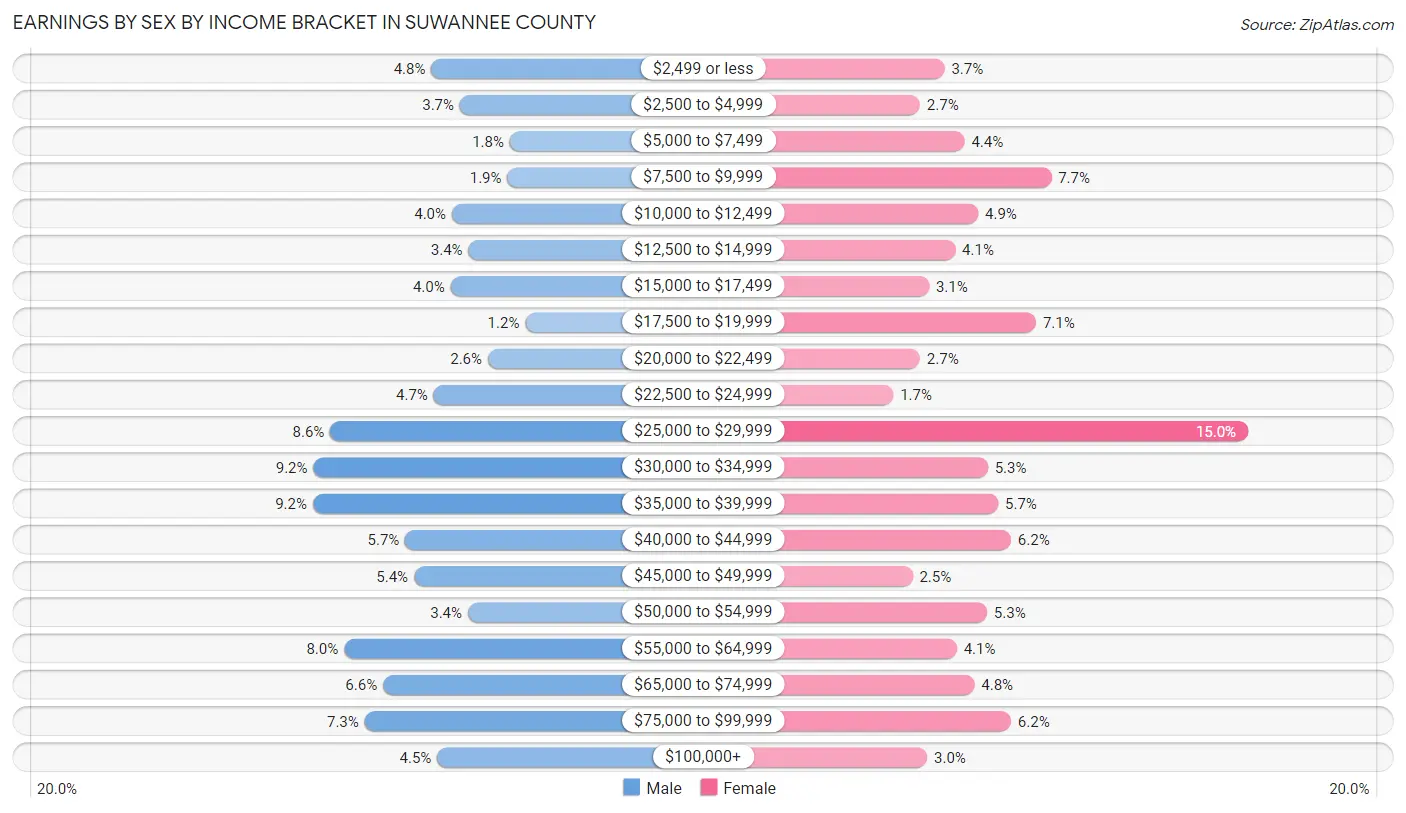
| Income | Male | Female |
| $2,499 or less | 471 (4.8%) | 328 (3.7%) |
| $2,500 to $4,999 | 365 (3.7%) | 245 (2.7%) |
| $5,000 to $7,499 | 180 (1.8%) | 395 (4.4%) |
| $7,500 to $9,999 | 189 (1.9%) | 686 (7.7%) |
| $10,000 to $12,499 | 395 (4.0%) | 441 (4.9%) |
| $12,500 to $14,999 | 334 (3.4%) | 364 (4.1%) |
| $15,000 to $17,499 | 400 (4.0%) | 276 (3.1%) |
| $17,500 to $19,999 | 123 (1.2%) | 635 (7.1%) |
| $20,000 to $22,499 | 261 (2.6%) | 245 (2.7%) |
| $22,500 to $24,999 | 462 (4.7%) | 156 (1.7%) |
| $25,000 to $29,999 | 846 (8.6%) | 1,346 (15.0%) |
| $30,000 to $34,999 | 909 (9.2%) | 473 (5.3%) |
| $35,000 to $39,999 | 911 (9.2%) | 508 (5.7%) |
| $40,000 to $44,999 | 568 (5.7%) | 551 (6.1%) |
| $45,000 to $49,999 | 536 (5.4%) | 220 (2.5%) |
| $50,000 to $54,999 | 336 (3.4%) | 470 (5.2%) |
| $55,000 to $64,999 | 795 (8.0%) | 369 (4.1%) |
| $65,000 to $74,999 | 650 (6.6%) | 428 (4.8%) |
| $75,000 to $99,999 | 719 (7.3%) | 551 (6.1%) |
| $100,000+ | 449 (4.5%) | 270 (3.0%) |
| Total | 9,899 (100.0%) | 8,957 (100.0%) |
Earnings by Sex by Educational Attainment in Suwannee County
Average earnings in Suwannee County are $38,502 for men and $29,779 for women, a difference of 22.7%. Men with an educational attainment of graduate degree enjoy the highest average annual earnings of $58,598, while those with less than high school education earn the least with $31,463. Women with an educational attainment of graduate degree earn the most with the average annual earnings of $73,726, while those with high school diploma education have the smallest earnings of $27,591.
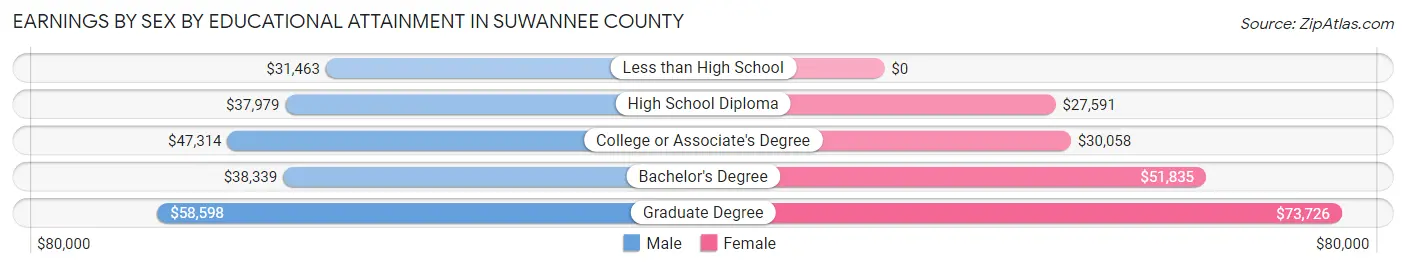
| Educational Attainment | Male Income | Female Income |
| Less than High School | $31,463 | $0 |
| High School Diploma | $37,979 | $27,591 |
| College or Associate's Degree | $47,314 | $30,058 |
| Bachelor's Degree | $38,339 | $51,835 |
| Graduate Degree | $58,598 | $73,726 |
| Total | $38,502 | $29,779 |
Family Income in Suwannee County
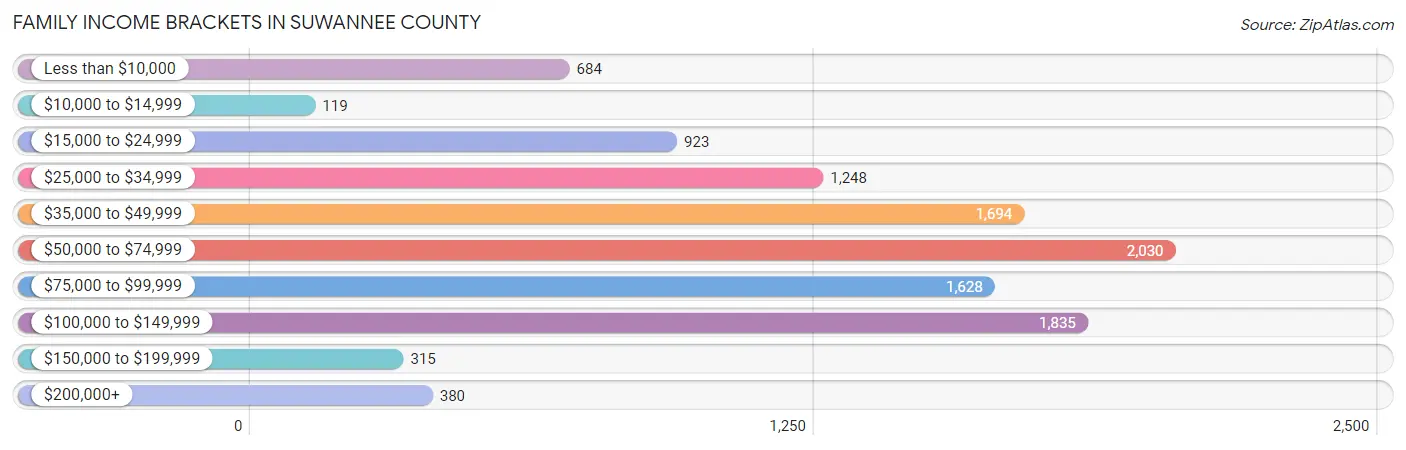
Family Income Brackets in Suwannee County
According to the Suwannee County family income data, there are 2,030 families falling into the $50,000 to $74,999 income range, which is the most common income bracket and makes up 18.7% of all families. Conversely, the $10,000 to $14,999 income bracket is the least frequent group with only 119 families (1.1%) belonging to this category.
| Income Bracket | # Families | % Families |
| Less than $10,000 | 684 | 6.3% |
| $10,000 to $14,999 | 119 | 1.1% |
| $15,000 to $24,999 | 923 | 8.5% |
| $25,000 to $34,999 | 1,248 | 11.5% |
| $35,000 to $49,999 | 1,694 | 15.6% |
| $50,000 to $74,999 | 2,030 | 18.7% |
| $75,000 to $99,999 | 1,628 | 15.0% |
| $100,000 to $149,999 | 1,835 | 16.9% |
| $150,000 to $199,999 | 315 | 2.9% |
| $200,000+ | 380 | 3.5% |
Family Income by Famaliy Size in Suwannee County
6-person families (169 | 1.6%) account for the highest median family income in Suwannee County with $116,484 per family, while 2-person families (6,527 | 60.1%) have the highest median income of $26,450 per family member.
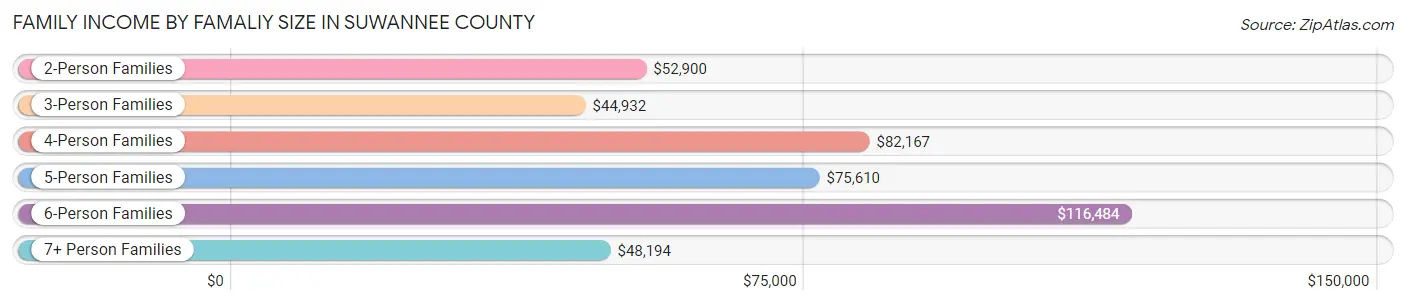
| Income Bracket | # Families | Median Income |
| 2-Person Families | 6,527 (60.1%) | $52,900 |
| 3-Person Families | 1,840 (17.0%) | $44,932 |
| 4-Person Families | 1,516 (14.0%) | $82,167 |
| 5-Person Families | 791 (7.3%) | $75,610 |
| 6-Person Families | 169 (1.6%) | $116,484 |
| 7+ Person Families | 13 (0.1%) | $48,194 |
| Total | 10,856 (100.0%) | $58,070 |
Family Income by Number of Earners in Suwannee County
The median family income in Suwannee County is $58,070, with families comprising 3+ earners (851) having the highest median family income of $107,721, while families with no earners (3,143) have the lowest median family income of $31,390, accounting for 7.8% and 28.9% of families, respectively.
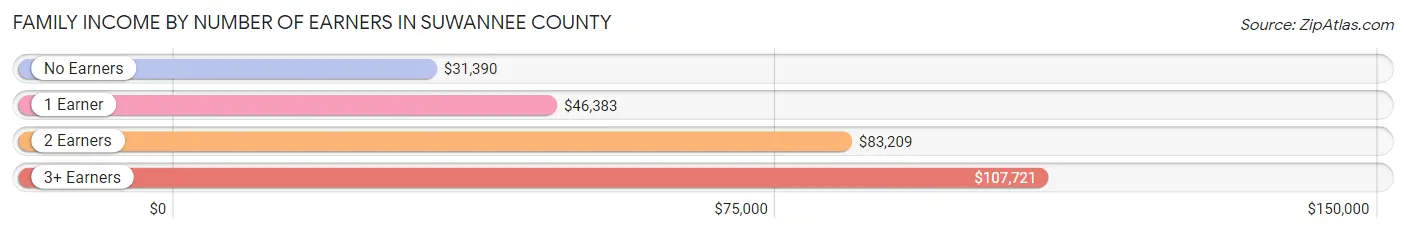
| Number of Earners | # Families | Median Income |
| No Earners | 3,143 (28.9%) | $31,390 |
| 1 Earner | 3,551 (32.7%) | $46,383 |
| 2 Earners | 3,311 (30.5%) | $83,209 |
| 3+ Earners | 851 (7.8%) | $107,721 |
| Total | 10,856 (100.0%) | $58,070 |
Household Income in Suwannee County
Household Income Brackets in Suwannee County
With 2,828 households falling in the category, the $50,000 to $74,999 income range is the most frequent in Suwannee County, accounting for 18.3% of all households. In contrast, only 325 households (2.1%) fall into the $150,000 to $199,999 income bracket, making it the least populous group.
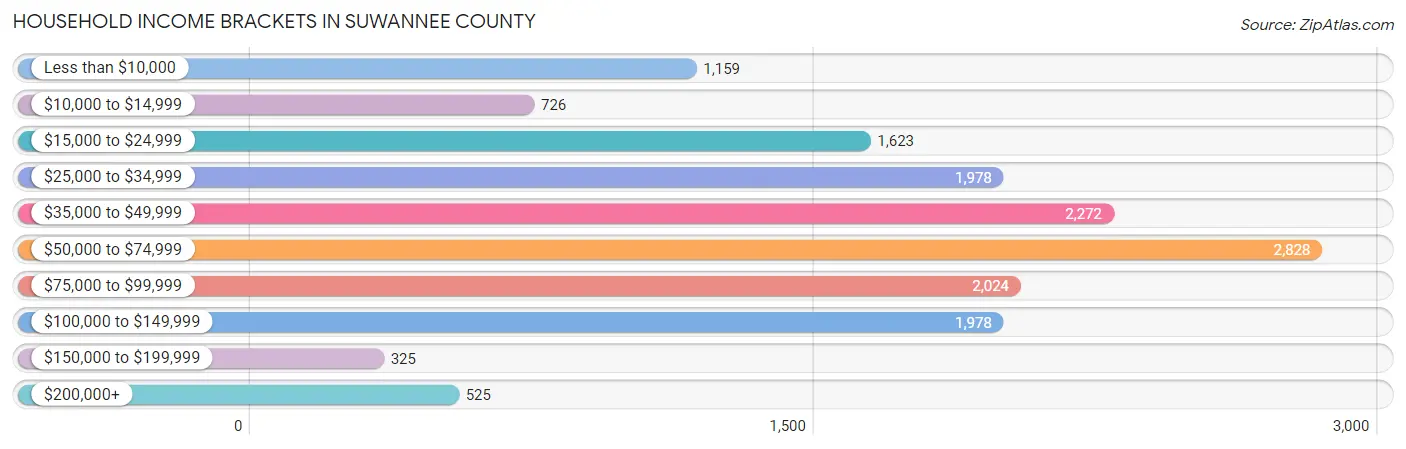
| Income Bracket | # Households | % Households |
| Less than $10,000 | 1,159 | 7.5% |
| $10,000 to $14,999 | 726 | 4.7% |
| $15,000 to $24,999 | 1,623 | 10.5% |
| $25,000 to $34,999 | 1,978 | 12.8% |
| $35,000 to $49,999 | 2,272 | 14.7% |
| $50,000 to $74,999 | 2,828 | 18.3% |
| $75,000 to $99,999 | 2,024 | 13.1% |
| $100,000 to $149,999 | 1,978 | 12.8% |
| $150,000 to $199,999 | 325 | 2.1% |
| $200,000+ | 525 | 3.4% |
Household Income by Householder Age in Suwannee County
The median household income in Suwannee County is $49,729, with the highest median household income of $61,196 found in the 15 to 24 years age bracket for the primary householder. A total of 437 households (2.8%) fall into this category. Meanwhile, the 65+ years age bracket for the primary householder has the lowest median household income of $38,673, with 5,516 households (35.7%) in this group.
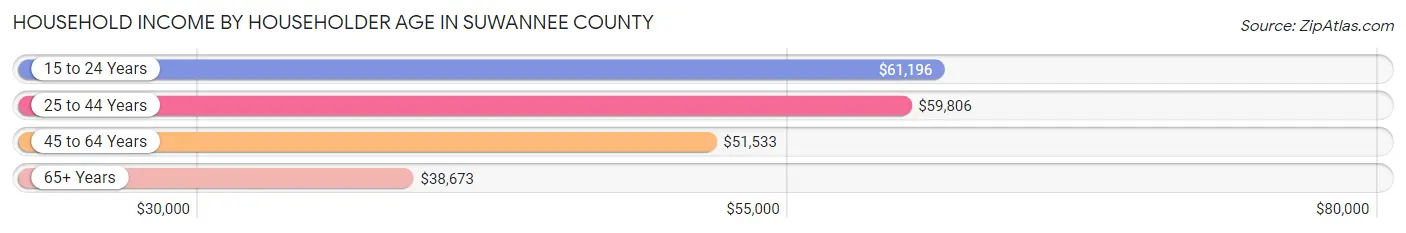
| Income Bracket | # Households | Median Income |
| 15 to 24 Years | 437 (2.8%) | $61,196 |
| 25 to 44 Years | 3,447 (22.3%) | $59,806 |
| 45 to 64 Years | 6,053 (39.2%) | $51,533 |
| 65+ Years | 5,516 (35.7%) | $38,673 |
| Total | 15,453 (100.0%) | $49,729 |
Poverty in Suwannee County
Income Below Poverty by Sex and Age in Suwannee County
With 13.5% poverty level for males and 15.3% for females among the residents of Suwannee County, 15 year old males and 15 year old females are the most vulnerable to poverty, with 113 males (41.1%) and 56 females (50.0%) in their respective age groups living below the poverty level.
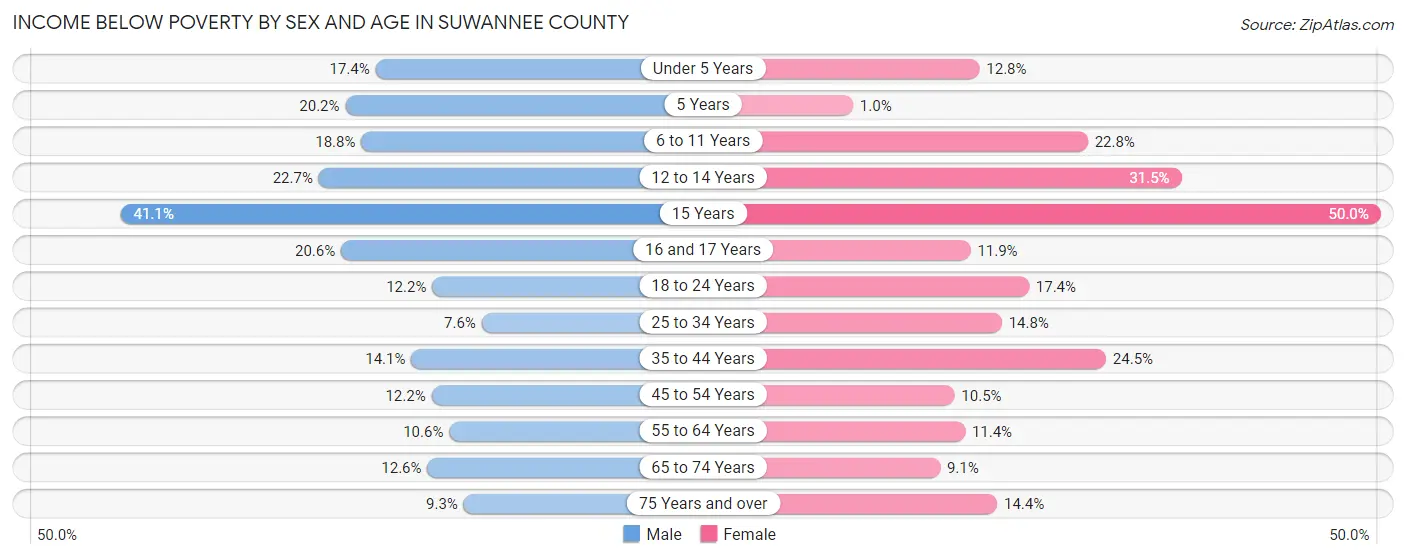
| Age Bracket | Male | Female |
| Under 5 Years | 205 (17.4%) | 132 (12.8%) |
| 5 Years | 35 (20.2%) | 1 (1.0%) |
| 6 to 11 Years | 270 (18.8%) | 283 (22.8%) |
| 12 to 14 Years | 222 (22.7%) | 214 (31.5%) |
| 15 Years | 113 (41.1%) | 56 (50.0%) |
| 16 and 17 Years | 151 (20.6%) | 91 (11.9%) |
| 18 to 24 Years | 205 (12.2%) | 288 (17.4%) |
| 25 to 34 Years | 166 (7.6%) | 271 (14.8%) |
| 35 to 44 Years | 446 (14.1%) | 622 (24.5%) |
| 45 to 54 Years | 295 (12.2%) | 252 (10.4%) |
| 55 to 64 Years | 313 (10.6%) | 373 (11.4%) |
| 65 to 74 Years | 318 (12.6%) | 251 (9.1%) |
| 75 Years and over | 154 (9.2%) | 272 (14.4%) |
| Total | 2,893 (13.5%) | 3,106 (15.3%) |
Income Above Poverty by Sex and Age in Suwannee County
According to the poverty statistics in Suwannee County, males aged 25 to 34 years and females aged 5 years are the age groups that are most secure financially, with 92.4% of males and 99.0% of females in these age groups living above the poverty line.
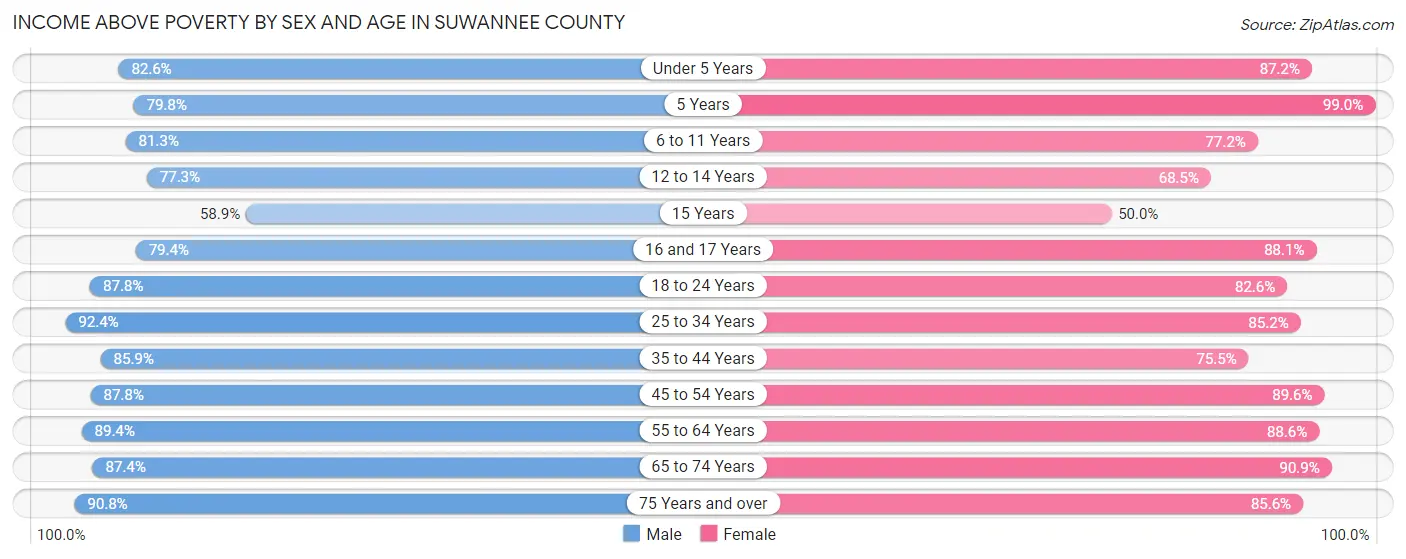
| Age Bracket | Male | Female |
| Under 5 Years | 971 (82.6%) | 902 (87.2%) |
| 5 Years | 138 (79.8%) | 96 (99.0%) |
| 6 to 11 Years | 1,170 (81.2%) | 957 (77.2%) |
| 12 to 14 Years | 756 (77.3%) | 465 (68.5%) |
| 15 Years | 162 (58.9%) | 56 (50.0%) |
| 16 and 17 Years | 581 (79.4%) | 671 (88.1%) |
| 18 to 24 Years | 1,479 (87.8%) | 1,371 (82.6%) |
| 25 to 34 Years | 2,025 (92.4%) | 1,555 (85.2%) |
| 35 to 44 Years | 2,715 (85.9%) | 1,916 (75.5%) |
| 45 to 54 Years | 2,115 (87.8%) | 2,160 (89.5%) |
| 55 to 64 Years | 2,644 (89.4%) | 2,891 (88.6%) |
| 65 to 74 Years | 2,201 (87.4%) | 2,504 (90.9%) |
| 75 Years and over | 1,510 (90.7%) | 1,615 (85.6%) |
| Total | 18,467 (86.5%) | 17,159 (84.7%) |
Income Below Poverty Among Married-Couple Families in Suwannee County
The poverty statistics for married-couple families in Suwannee County show that 5.6% or 448 of the total 8,063 families live below the poverty line. Families with 5 or more children have the highest poverty rate of 100.0%, comprising of 11 families. On the other hand, families with no children have the lowest poverty rate of 4.2%, which includes 241 families.
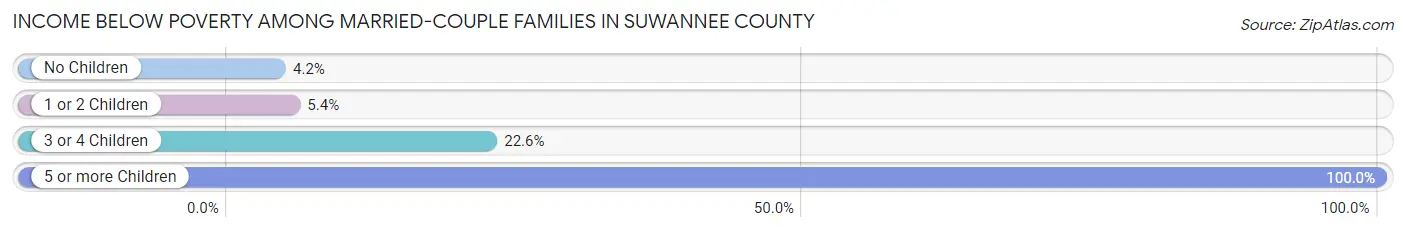
| Children | Above Poverty | Below Poverty |
| No Children | 5,530 (95.8%) | 241 (4.2%) |
| 1 or 2 Children | 1,759 (94.6%) | 101 (5.4%) |
| 3 or 4 Children | 326 (77.4%) | 95 (22.6%) |
| 5 or more Children | 0 (0.0%) | 11 (100.0%) |
| Total | 7,615 (94.4%) | 448 (5.6%) |
Income Below Poverty Among Single-Parent Households in Suwannee County
According to the poverty data in Suwannee County, 22.6% or 191 single-father households and 28.2% or 549 single-mother households are living below the poverty line. Among single-father households, those with no children have the highest poverty rate, with 120 households (28.6%) experiencing poverty. Likewise, among single-mother households, those with 5 or more children have the highest poverty rate, with 2 households (100.0%) falling below the poverty line.
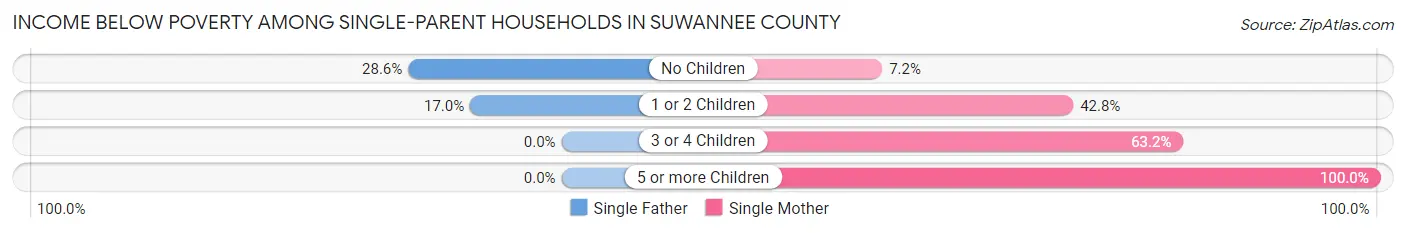
| Children | Single Father | Single Mother |
| No Children | 120 (28.6%) | 63 (7.2%) |
| 1 or 2 Children | 71 (17.0%) | 398 (42.7%) |
| 3 or 4 Children | 0 (0.0%) | 86 (63.2%) |
| 5 or more Children | 0 (0.0%) | 2 (100.0%) |
| Total | 191 (22.6%) | 549 (28.2%) |
Income Below Poverty Among Married-Couple vs Single-Parent Households in Suwannee County
The poverty data for Suwannee County shows that 448 of the married-couple family households (5.6%) and 740 of the single-parent households (26.5%) are living below the poverty level. Within the married-couple family households, those with 5 or more children have the highest poverty rate, with 11 households (100.0%) falling below the poverty line. Among the single-parent households, those with 5 or more children have the highest poverty rate, with 2 household (100.0%) living below poverty.
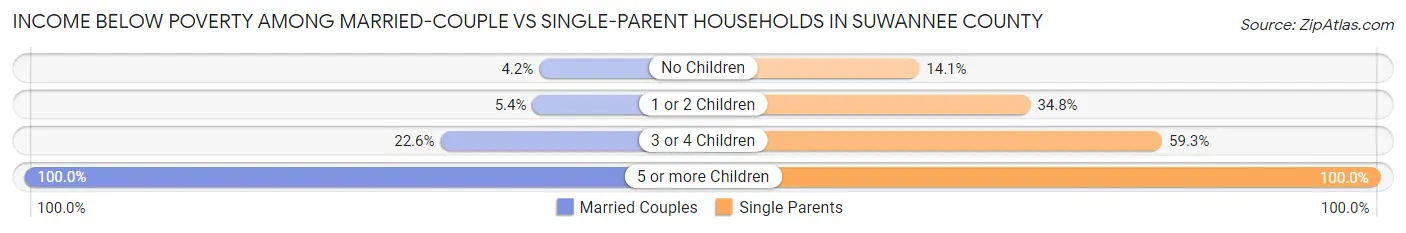
| Children | Married-Couple Families | Single-Parent Households |
| No Children | 241 (4.2%) | 183 (14.1%) |
| 1 or 2 Children | 101 (5.4%) | 469 (34.8%) |
| 3 or 4 Children | 95 (22.6%) | 86 (59.3%) |
| 5 or more Children | 11 (100.0%) | 2 (100.0%) |
| Total | 448 (5.6%) | 740 (26.5%) |
Race in Suwannee County
The most populous races in Suwannee County are White / Caucasian (34,243 | 78.0%), Black / African American (4,966 | 11.3%), and Hispanic or Latino (4,547 | 10.4%).
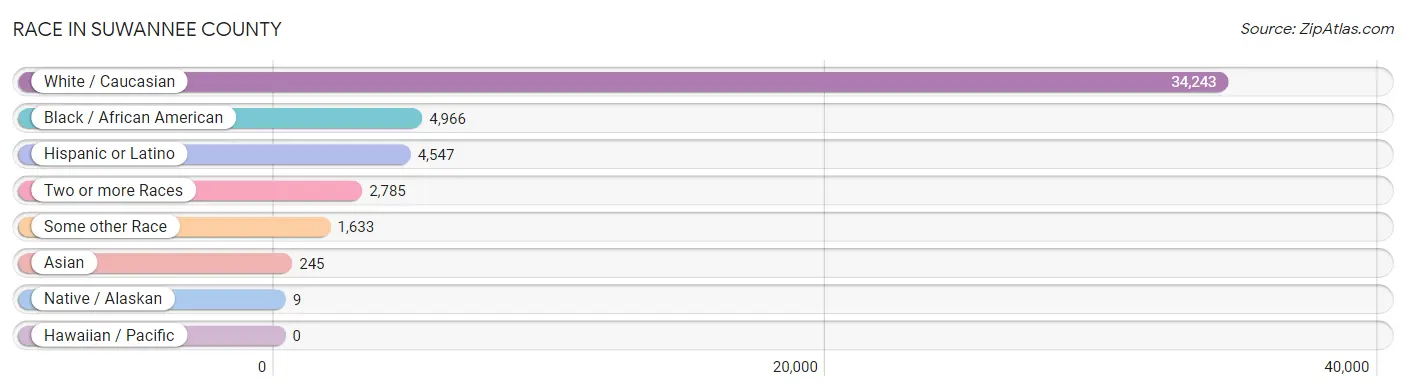
| Race | # Population | % Population |
| Asian | 245 | 0.6% |
| Black / African American | 4,966 | 11.3% |
| Hawaiian / Pacific | 0 | 0.0% |
| Hispanic or Latino | 4,547 | 10.4% |
| Native / Alaskan | 9 | 0.0% |
| White / Caucasian | 34,243 | 78.0% |
| Two or more Races | 2,785 | 6.4% |
| Some other Race | 1,633 | 3.7% |
| Total | 43,881 | 100.0% |
Ancestry in Suwannee County
The most populous ancestries reported in Suwannee County are American (4,606 | 10.5%), English (4,350 | 9.9%), Irish (3,262 | 7.4%), German (3,069 | 7.0%), and Italian (1,800 | 4.1%), together accounting for 38.9% of all Suwannee County residents.
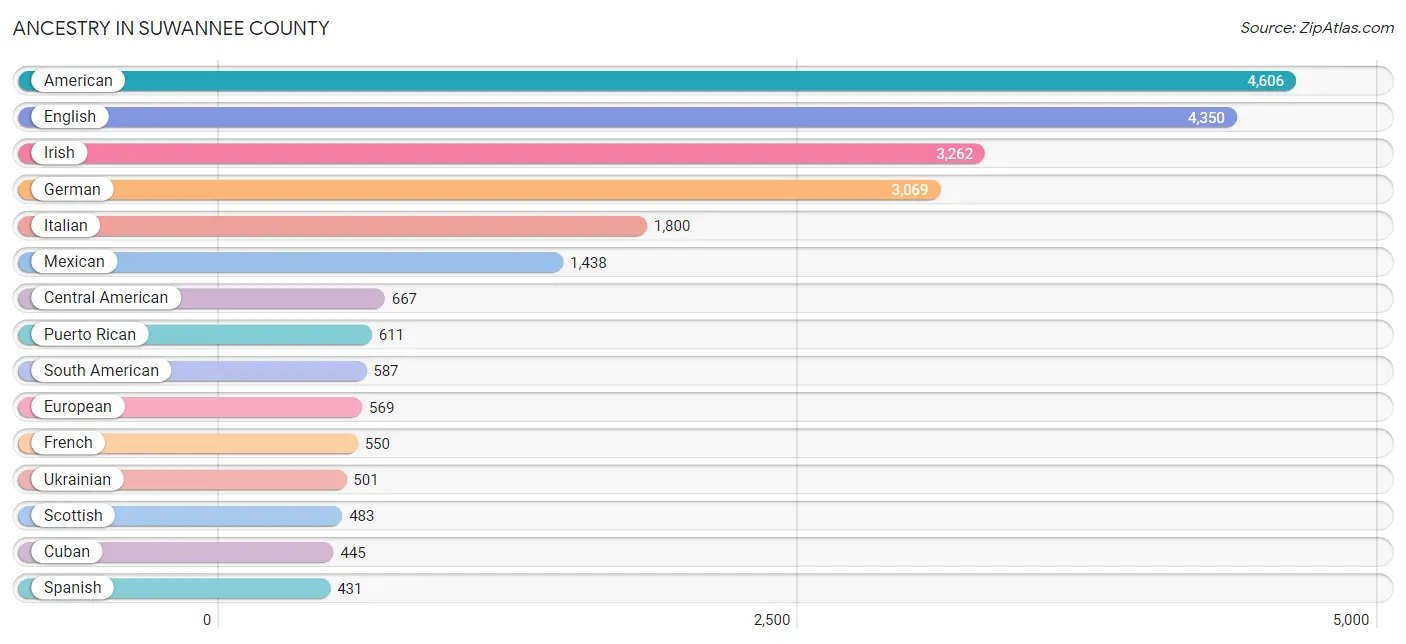
| Ancestry | # Population | % Population |
| African | 80 | 0.2% |
| American | 4,606 | 10.5% |
| Armenian | 4 | 0.0% |
| Austrian | 170 | 0.4% |
| Belgian | 26 | 0.1% |
| Brazilian | 45 | 0.1% |
| British | 89 | 0.2% |
| Canadian | 12 | 0.0% |
| Central American | 667 | 1.5% |
| Central American Indian | 5 | 0.0% |
| Cherokee | 161 | 0.4% |
| Chilean | 1 | 0.0% |
| Chinese | 197 | 0.4% |
| Colombian | 294 | 0.7% |
| Costa Rican | 25 | 0.1% |
| Croatian | 40 | 0.1% |
| Cuban | 445 | 1.0% |
| Czech | 83 | 0.2% |
| Czechoslovakian | 20 | 0.1% |
| Danish | 34 | 0.1% |
| Dominican | 73 | 0.2% |
| Dutch | 99 | 0.2% |
| Eastern European | 74 | 0.2% |
| Ecuadorian | 63 | 0.1% |
| English | 4,350 | 9.9% |
| European | 569 | 1.3% |
| Finnish | 37 | 0.1% |
| French | 550 | 1.3% |
| French Canadian | 137 | 0.3% |
| German | 3,069 | 7.0% |
| Greek | 78 | 0.2% |
| Guatemalan | 279 | 0.6% |
| Honduran | 310 | 0.7% |
| Hungarian | 390 | 0.9% |
| Indian (Asian) | 96 | 0.2% |
| Irish | 3,262 | 7.4% |
| Italian | 1,800 | 4.1% |
| Jamaican | 20 | 0.1% |
| Korean | 123 | 0.3% |
| Lithuanian | 217 | 0.5% |
| Mexican | 1,438 | 3.3% |
| Mexican American Indian | 44 | 0.1% |
| Nicaraguan | 48 | 0.1% |
| Norwegian | 403 | 0.9% |
| Peruvian | 38 | 0.1% |
| Polish | 331 | 0.7% |
| Portuguese | 234 | 0.5% |
| Puerto Rican | 611 | 1.4% |
| Russian | 116 | 0.3% |
| Salvadoran | 5 | 0.0% |
| Scandinavian | 44 | 0.1% |
| Scotch-Irish | 368 | 0.8% |
| Scottish | 483 | 1.1% |
| Sioux | 7 | 0.0% |
| South African | 68 | 0.2% |
| South American | 587 | 1.3% |
| Spaniard | 62 | 0.1% |
| Spanish | 431 | 1.0% |
| Subsaharan African | 148 | 0.3% |
| Swedish | 43 | 0.1% |
| Swiss | 41 | 0.1% |
| Thai | 119 | 0.3% |
| Ukrainian | 501 | 1.1% |
| Uruguayan | 169 | 0.4% |
| Venezuelan | 22 | 0.1% |
| Welsh | 325 | 0.7% | View All 66 Rows |
Immigrants in Suwannee County
The most numerous immigrant groups reported in Suwannee County came from Latin America (1,572 | 3.6%), Central America (1,018 | 2.3%), Mexico (439 | 1.0%), South America (284 | 0.6%), and Caribbean (270 | 0.6%), together accounting for 8.2% of all Suwannee County residents.
| Immigration Origin | # Population | % Population |
| Asia | 149 | 0.3% |
| Bosnia and Herzegovina | 23 | 0.1% |
| Brazil | 62 | 0.1% |
| Canada | 27 | 0.1% |
| Caribbean | 270 | 0.6% |
| Central America | 1,018 | 2.3% |
| Chile | 1 | 0.0% |
| China | 79 | 0.2% |
| Colombia | 74 | 0.2% |
| Cuba | 178 | 0.4% |
| Dominican Republic | 90 | 0.2% |
| Eastern Asia | 79 | 0.2% |
| Eastern Europe | 50 | 0.1% |
| Ecuador | 50 | 0.1% |
| Europe | 154 | 0.4% |
| Germany | 17 | 0.0% |
| Guatemala | 112 | 0.3% |
| Honduras | 270 | 0.6% |
| India | 25 | 0.1% |
| Italy | 16 | 0.0% |
| Jamaica | 2 | 0.0% |
| Latin America | 1,572 | 3.6% |
| Lithuania | 23 | 0.1% |
| Mexico | 439 | 1.0% |
| Nicaragua | 192 | 0.4% |
| Northern Europe | 25 | 0.1% |
| Norway | 9 | 0.0% |
| Peru | 38 | 0.1% |
| Philippines | 45 | 0.1% |
| Portugal | 46 | 0.1% |
| Russia | 4 | 0.0% |
| Scotland | 16 | 0.0% |
| South America | 284 | 0.6% |
| South Central Asia | 25 | 0.1% |
| South Eastern Asia | 45 | 0.1% |
| Southern Europe | 62 | 0.1% |
| Venezuela | 54 | 0.1% |
| Western Europe | 17 | 0.0% | View All 38 Rows |
Sex and Age in Suwannee County
Sex and Age in Suwannee County
The most populous age groups in Suwannee County are 35 to 39 Years (1,729 | 7.5%) for men and 55 to 59 Years (1,636 | 7.8%) for women.
| Age Bracket | Male | Female |
| Under 5 Years | 1,218 (5.3%) | 1,037 (5.0%) |
| 5 to 9 Years | 1,163 (5.1%) | 913 (4.4%) |
| 10 to 14 Years | 1,666 (7.2%) | 1,439 (6.9%) |
| 15 to 19 Years | 1,622 (7.1%) | 1,409 (6.7%) |
| 20 to 24 Years | 1,168 (5.1%) | 1,124 (5.4%) |
| 25 to 29 Years | 1,381 (6.0%) | 818 (3.9%) |
| 30 to 34 Years | 1,246 (5.4%) | 1,008 (4.8%) |
| 35 to 39 Years | 1,729 (7.5%) | 1,184 (5.7%) |
| 40 to 44 Years | 1,670 (7.3%) | 1,372 (6.6%) |
| 45 to 49 Years | 1,344 (5.9%) | 1,165 (5.6%) |
| 50 to 54 Years | 1,279 (5.6%) | 1,247 (6.0%) |
| 55 to 59 Years | 1,641 (7.1%) | 1,636 (7.8%) |
| 60 to 64 Years | 1,488 (6.5%) | 1,633 (7.8%) |
| 65 to 69 Years | 1,515 (6.6%) | 1,287 (6.2%) |
| 70 to 74 Years | 1,072 (4.7%) | 1,513 (7.2%) |
| 75 to 79 Years | 700 (3.0%) | 749 (3.6%) |
| 80 to 84 Years | 754 (3.3%) | 596 (2.9%) |
| 85 Years and over | 324 (1.4%) | 771 (3.7%) |
| Total | 22,980 (100.0%) | 20,901 (100.0%) |
Families and Households in Suwannee County
Median Family Size in Suwannee County
The median family size in Suwannee County is 3.21 persons per family, with single male/father families (846 | 7.8%) accounting for the largest median family size of 3.84 persons per family. On the other hand, married-couple families (8,063 | 74.3%) represent the smallest median family size with 3.00 persons per family.
| Family Type | # Families | Family Size |
| Married-Couple | 8,063 (74.3%) | 3.00 |
| Single Male/Father | 846 (7.8%) | 3.84 |
| Single Female/Mother | 1,947 (17.9%) | 3.83 |
| Total Families | 10,856 (100.0%) | 3.21 |
Median Household Size in Suwannee County
The median household size in Suwannee County is 2.73 persons per household, with single male/father households (846 | 5.5%) accounting for the largest median household size of 4.39 persons per household. non-family households (4,597 | 29.7%) represent the smallest median household size with 1.28 persons per household.
| Household Type | # Households | Household Size |
| Married-Couple | 8,063 (52.2%) | 3.05 |
| Single Male/Father | 846 (5.5%) | 4.39 |
| Single Female/Mother | 1,947 (12.6%) | 4.11 |
| Non-family | 4,597 (29.7%) | 1.28 |
| Total Households | 15,453 (100.0%) | 2.73 |
Household Size by Marriage Status in Suwannee County
Out of a total of 15,453 households in Suwannee County, 10,856 (70.3%) are family households, while 4,597 (29.7%) are nonfamily households. The most numerous type of family households are 2-person households, comprising 6,224, and the most common type of nonfamily households are 1-person households, comprising 3,822.
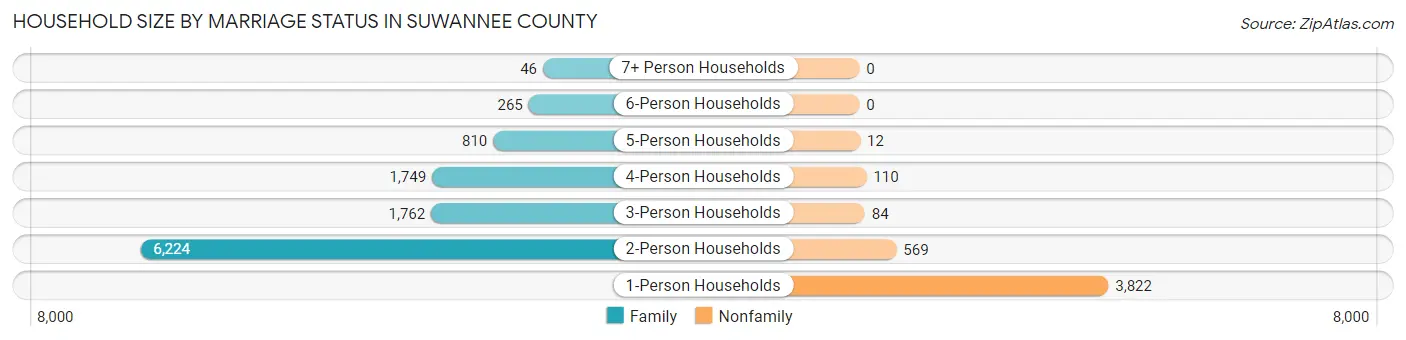
| Household Size | Family Households | Nonfamily Households |
| 1-Person Households | - | 3,822 (24.7%) |
| 2-Person Households | 6,224 (40.3%) | 569 (3.7%) |
| 3-Person Households | 1,762 (11.4%) | 84 (0.5%) |
| 4-Person Households | 1,749 (11.3%) | 110 (0.7%) |
| 5-Person Households | 810 (5.2%) | 12 (0.1%) |
| 6-Person Households | 265 (1.7%) | 0 (0.0%) |
| 7+ Person Households | 46 (0.3%) | 0 (0.0%) |
| Total | 10,856 (70.3%) | 4,597 (29.7%) |
Female Fertility in Suwannee County
Fertility by Age in Suwannee County
Average fertility rate in Suwannee County is 106.0 births per 1,000 women. Women in the age bracket of 35 to 50 years have the highest fertility rate with 133.0 births per 1,000 women. Women in the age bracket of 35 to 50 years acount for 60.6% of all women with births.
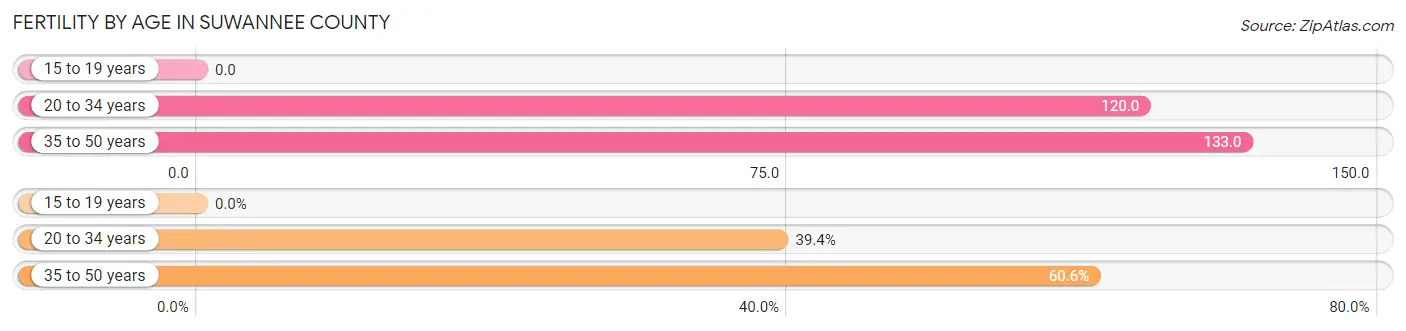
| Age Bracket | Women with Births | Births / 1,000 Women |
| 15 to 19 years | 0 (0.0%) | 0.0 |
| 20 to 34 years | 353 (39.4%) | 120.0 |
| 35 to 50 years | 543 (60.6%) | 133.0 |
| Total | 896 (100.0%) | 106.0 |
Fertility by Age by Marriage Status in Suwannee County
33.4% of women with births (896) in Suwannee County are married. The highest percentage of unmarried women with births falls into 35 to 50 years age bracket with 76.4% of them unmarried at the time of birth, while the lowest percentage of unmarried women with births belong to 20 to 34 years age bracket with 51.6% of them unmarried.
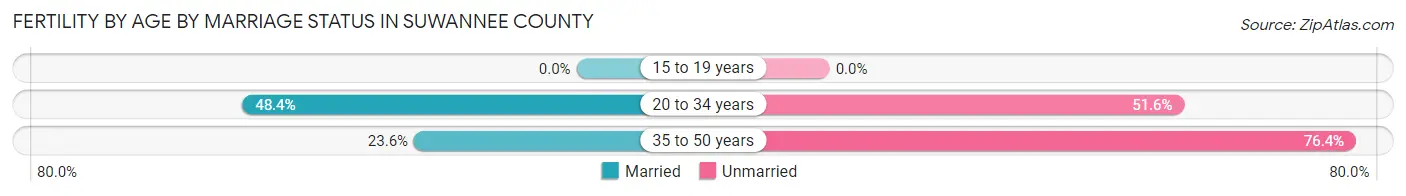
| Age Bracket | Married | Unmarried |
| 15 to 19 years | 0 (0.0%) | 0 (0.0%) |
| 20 to 34 years | 171 (48.4%) | 182 (51.6%) |
| 35 to 50 years | 128 (23.6%) | 415 (76.4%) |
| Total | 299 (33.4%) | 597 (66.6%) |
Fertility by Education in Suwannee County
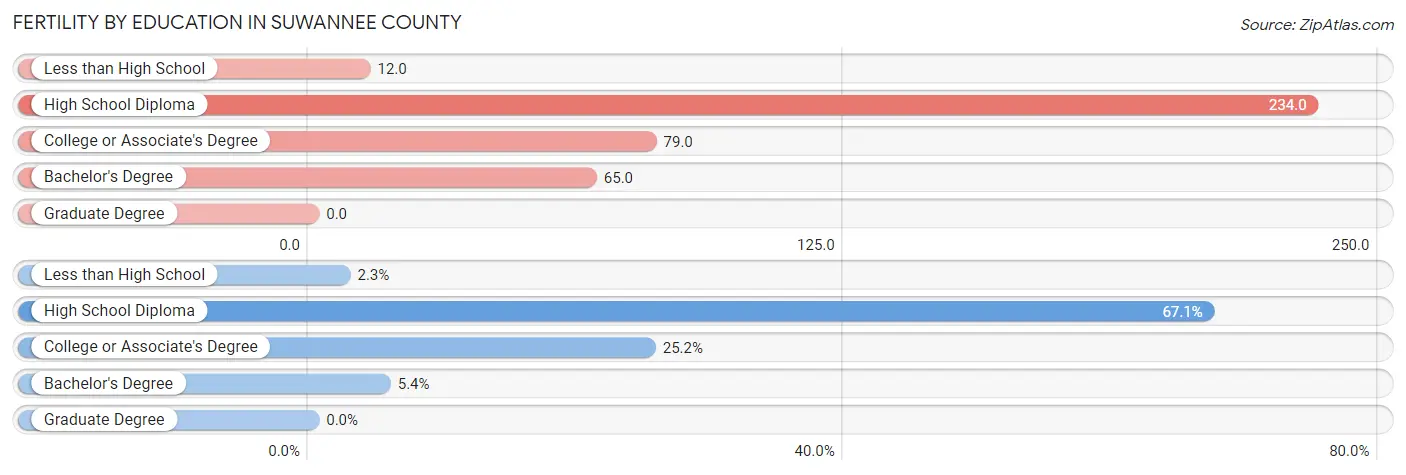
| Educational Attainment | Women with Births | Births / 1,000 Women |
| Less than High School | 21 (2.3%) | 12.0 |
| High School Diploma | 601 (67.1%) | 234.0 |
| College or Associate's Degree | 226 (25.2%) | 79.0 |
| Bachelor's Degree | 48 (5.4%) | 65.0 |
| Graduate Degree | 0 (0.0%) | 0.0 |
| Total | 896 (100.0%) | 106.0 |
Fertility by Education by Marriage Status in Suwannee County
66.6% of women with births in Suwannee County are unmarried. Women with the educational attainment of bachelor's degree are most likely to be married with 58.3% of them married at childbirth, while women with the educational attainment of less than high school are least likely to be married with 100.0% of them unmarried at childbirth.
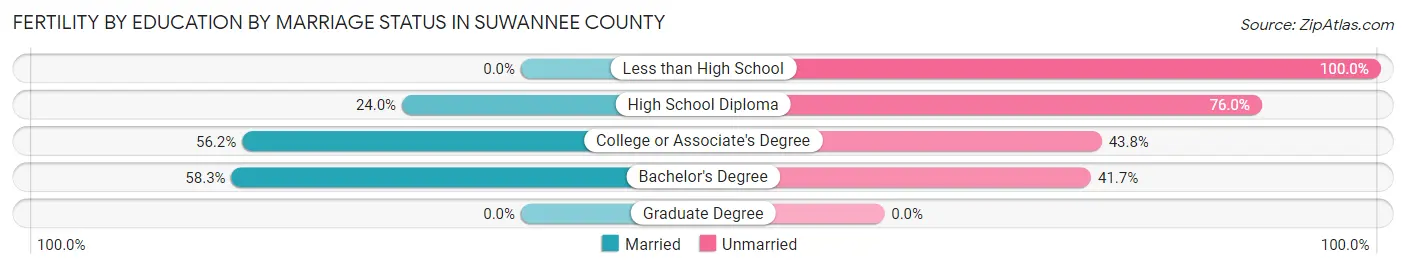
| Educational Attainment | Married | Unmarried |
| Less than High School | 0 (0.0%) | 21 (100.0%) |
| High School Diploma | 144 (24.0%) | 457 (76.0%) |
| College or Associate's Degree | 127 (56.2%) | 99 (43.8%) |
| Bachelor's Degree | 28 (58.3%) | 20 (41.7%) |
| Graduate Degree | 0 (0.0%) | 0 (0.0%) |
| Total | 299 (33.4%) | 597 (66.6%) |
Employment Characteristics in Suwannee County
Employment by Class of Employer in Suwannee County
Among the 16,938 employed individuals in Suwannee County, private company employees (10,575 | 62.4%), local government employees (1,686 | 10.0%), and state government employees (1,315 | 7.8%) make up the most common classes of employment.
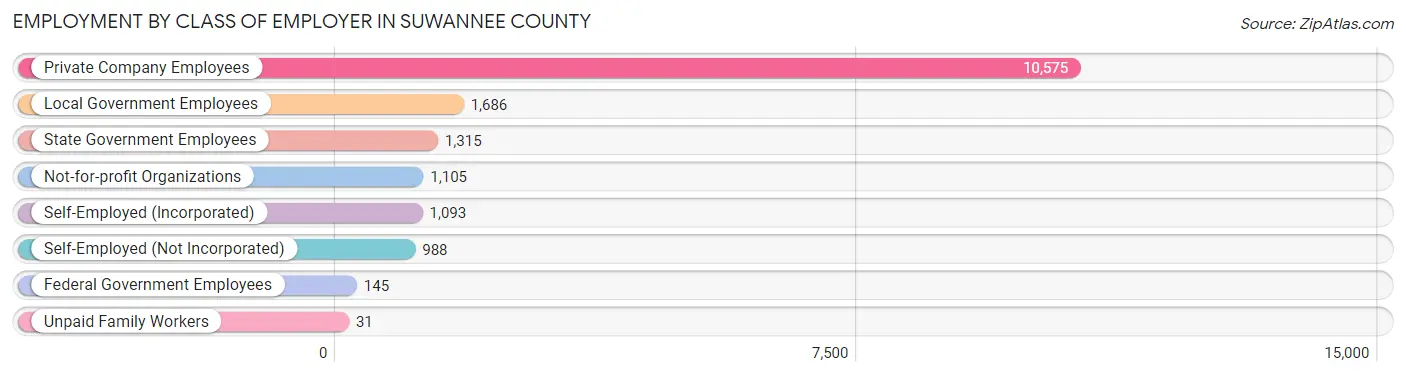
| Employer Class | # Employees | % Employees |
| Private Company Employees | 10,575 | 62.4% |
| Self-Employed (Incorporated) | 1,093 | 6.5% |
| Self-Employed (Not Incorporated) | 988 | 5.8% |
| Not-for-profit Organizations | 1,105 | 6.5% |
| Local Government Employees | 1,686 | 10.0% |
| State Government Employees | 1,315 | 7.8% |
| Federal Government Employees | 145 | 0.9% |
| Unpaid Family Workers | 31 | 0.2% |
| Total | 16,938 | 100.0% |
Employment Status by Age in Suwannee County
According to the labor force statistics for Suwannee County, out of the total population over 16 years of age (36,058), 50.5% or 18,209 individuals are in the labor force, with 5.5% or 1,001 of them unemployed. The age group with the highest labor force participation rate is 35 to 44 years, with 76.8% or 4,573 individuals in the labor force. Within the labor force, the 16 to 19 years age range has the highest percentage of unemployed individuals, with 20.9% or 219 of them being unemployed.
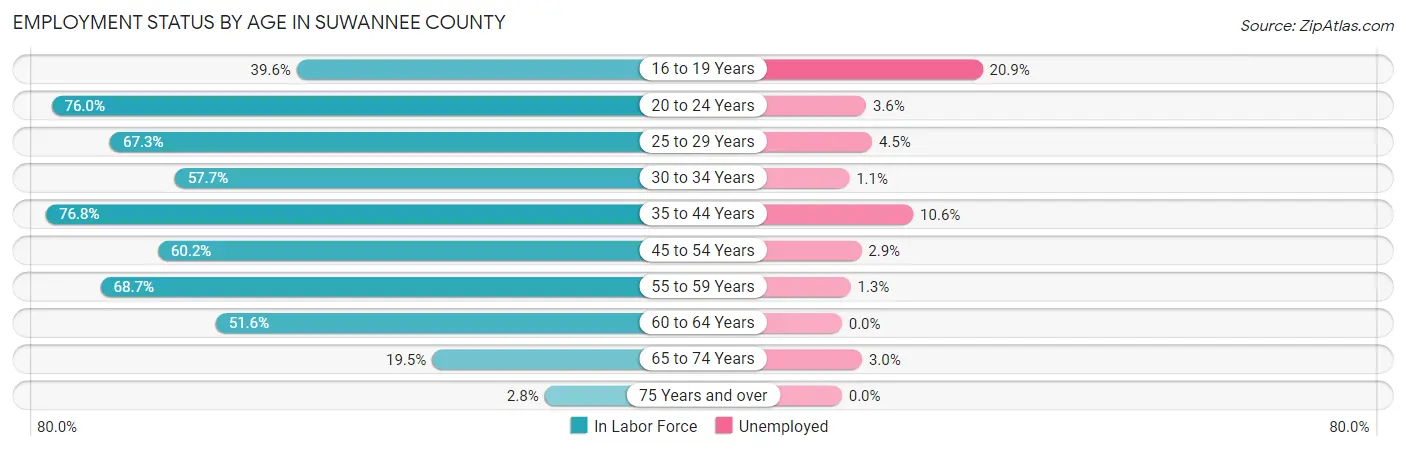
| Age Bracket | In Labor Force | Unemployed |
| 16 to 19 Years | 1,047 (39.6%) | 219 (20.9%) |
| 20 to 24 Years | 1,742 (76.0%) | 63 (3.6%) |
| 25 to 29 Years | 1,480 (67.3%) | 67 (4.5%) |
| 30 to 34 Years | 1,301 (57.7%) | 14 (1.1%) |
| 35 to 44 Years | 4,573 (76.8%) | 485 (10.6%) |
| 45 to 54 Years | 3,031 (60.2%) | 88 (2.9%) |
| 55 to 59 Years | 2,251 (68.7%) | 29 (1.3%) |
| 60 to 64 Years | 1,610 (51.6%) | 0 (0.0%) |
| 65 to 74 Years | 1,050 (19.5%) | 32 (3.0%) |
| 75 Years and over | 109 (2.8%) | 0 (0.0%) |
| Total | 18,209 (50.5%) | 1,001 (5.5%) |
Employment Status by Educational Attainment in Suwannee County
According to labor force statistics for Suwannee County, 65.2% of individuals (14,240) out of the total population between 25 and 64 years of age (21,841) are in the labor force, with 4.8% or 684 of them being unemployed. The group with the highest labor force participation rate are those with the educational attainment of bachelor's degree or higher, with 85.9% or 2,982 individuals in the labor force. Within the labor force, individuals with high school diploma education have the highest percentage of unemployment, with 8.2% or 403 of them being unemployed.
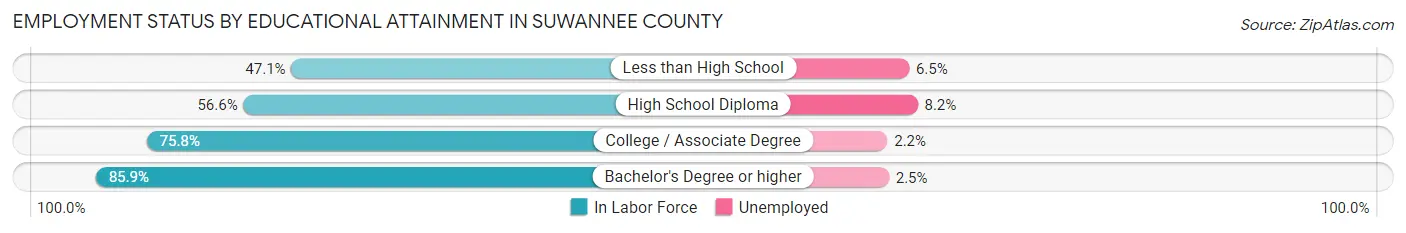
| Educational Attainment | In Labor Force | Unemployed |
| Less than High School | 1,625 (47.1%) | 224 (6.5%) |
| High School Diploma | 4,909 (56.6%) | 711 (8.2%) |
| College / Associate Degree | 4,734 (75.8%) | 137 (2.2%) |
| Bachelor's Degree or higher | 2,982 (85.9%) | 87 (2.5%) |
| Total | 14,240 (65.2%) | 1,048 (4.8%) |
Employment Occupations by Sex in Suwannee County
Management, Business, Science and Arts Occupations
The most common Management, Business, Science and Arts occupations in Suwannee County are Community & Social Service (1,368 | 8.0%), Management (1,217 | 7.1%), Health Diagnosing & Treating (1,161 | 6.8%), Education Instruction & Library (728 | 4.2%), and Computers, Engineering & Science (655 | 3.8%).
Management, Business, Science and Arts Occupations by Sex
Within the Management, Business, Science and Arts occupations in Suwannee County, the most male-oriented occupations are Architecture & Engineering (97.8%), Arts, Media & Entertainment (86.2%), and Computers & Mathematics (72.1%), while the most female-oriented occupations are Life, Physical & Social Science (100.0%), Health Technologists (88.3%), and Health Diagnosing & Treating (79.8%).
| Occupation | Male | Female |
| Management | 700 (57.5%) | 517 (42.5%) |
| Business & Financial | 170 (32.4%) | 354 (67.6%) |
| Computers, Engineering & Science | 257 (39.2%) | 398 (60.8%) |
| Computers & Mathematics | 80 (72.1%) | 31 (27.9%) |
| Architecture & Engineering | 177 (97.8%) | 4 (2.2%) |
| Life, Physical & Social Science | 0 (0.0%) | 363 (100.0%) |
| Community & Social Service | 376 (27.5%) | 992 (72.5%) |
| Education, Arts & Media | 143 (24.6%) | 439 (75.4%) |
| Legal Services & Support | 0 (0.0%) | 0 (0.0%) |
| Education Instruction & Library | 183 (25.1%) | 545 (74.9%) |
| Arts, Media & Entertainment | 50 (86.2%) | 8 (13.8%) |
| Health Diagnosing & Treating | 235 (20.2%) | 926 (79.8%) |
| Health Technologists | 62 (11.7%) | 467 (88.3%) |
| Total (Category) | 1,738 (35.3%) | 3,187 (64.7%) |
| Total (Overall) | 8,756 (50.9%) | 8,442 (49.1%) |
Services Occupations
The most common Services occupations in Suwannee County are Food Preparation & Serving (1,020 | 5.9%), Cleaning & Maintenance (987 | 5.7%), Security & Protection (662 | 3.8%), Healthcare Support (573 | 3.3%), and Law Enforcement (499 | 2.9%).
Services Occupations by Sex
Within the Services occupations in Suwannee County, the most male-oriented occupations are Law Enforcement (75.9%), Security & Protection (71.9%), and Firefighting & Prevention (59.5%), while the most female-oriented occupations are Healthcare Support (91.4%), Food Preparation & Serving (77.5%), and Personal Care & Service (64.8%).
| Occupation | Male | Female |
| Healthcare Support | 49 (8.6%) | 524 (91.4%) |
| Security & Protection | 476 (71.9%) | 186 (28.1%) |
| Firefighting & Prevention | 97 (59.5%) | 66 (40.5%) |
| Law Enforcement | 379 (75.9%) | 120 (24.0%) |
| Food Preparation & Serving | 229 (22.5%) | 791 (77.5%) |
| Cleaning & Maintenance | 434 (44.0%) | 553 (56.0%) |
| Personal Care & Service | 154 (35.2%) | 283 (64.8%) |
| Total (Category) | 1,342 (36.5%) | 2,337 (63.5%) |
| Total (Overall) | 8,756 (50.9%) | 8,442 (49.1%) |
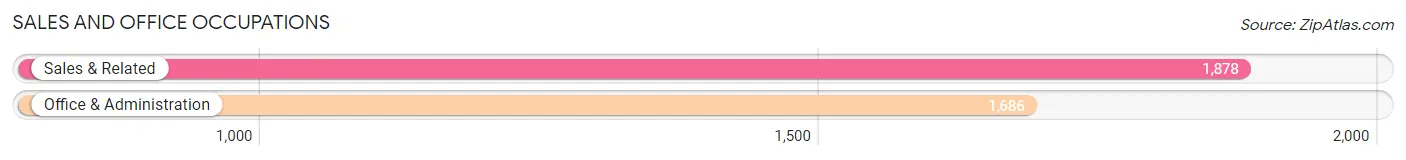
Sales and Office Occupations
The most common Sales and Office occupations in Suwannee County are Sales & Related (1,878 | 10.9%), and Office & Administration (1,686 | 9.8%).
Sales and Office Occupations by Sex
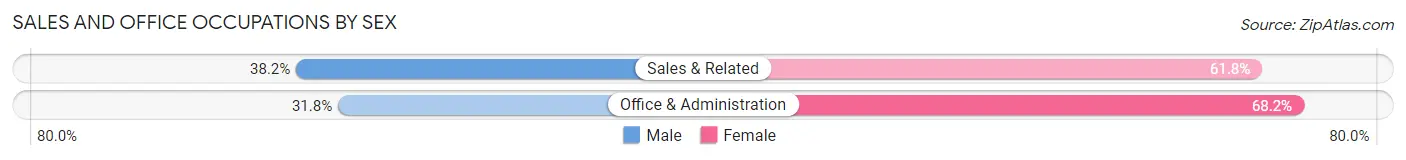
| Occupation | Male | Female |
| Sales & Related | 718 (38.2%) | 1,160 (61.8%) |
| Office & Administration | 536 (31.8%) | 1,150 (68.2%) |
| Total (Category) | 1,254 (35.2%) | 2,310 (64.8%) |
| Total (Overall) | 8,756 (50.9%) | 8,442 (49.1%) |
Natural Resources, Construction and Maintenance Occupations
The most common Natural Resources, Construction and Maintenance occupations in Suwannee County are Construction & Extraction (1,298 | 7.5%), Installation, Maintenance & Repair (732 | 4.3%), and Farming, Fishing & Forestry (187 | 1.1%).
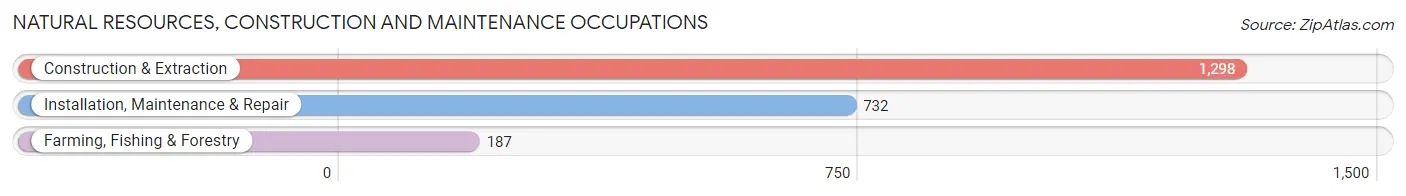
Natural Resources, Construction and Maintenance Occupations by Sex
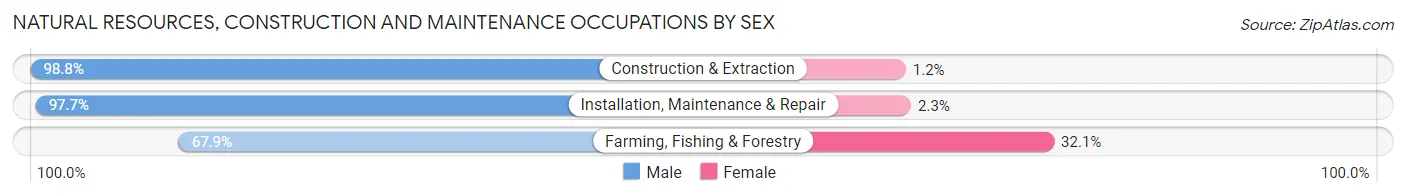
| Occupation | Male | Female |
| Farming, Fishing & Forestry | 127 (67.9%) | 60 (32.1%) |
| Construction & Extraction | 1,282 (98.8%) | 16 (1.2%) |
| Installation, Maintenance & Repair | 715 (97.7%) | 17 (2.3%) |
| Total (Category) | 2,124 (95.8%) | 93 (4.2%) |
| Total (Overall) | 8,756 (50.9%) | 8,442 (49.1%) |
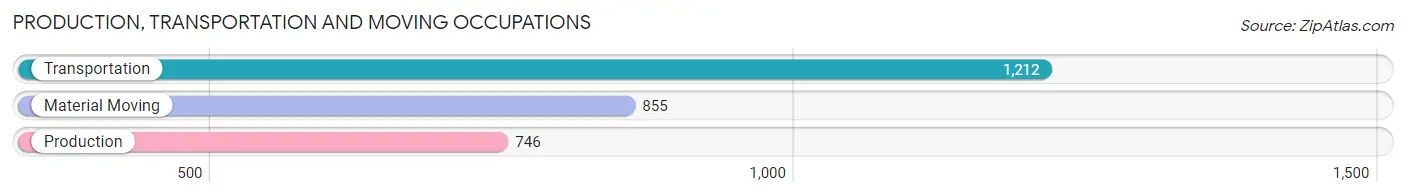
Production, Transportation and Moving Occupations
The most common Production, Transportation and Moving occupations in Suwannee County are Transportation (1,212 | 7.0%), Material Moving (855 | 5.0%), and Production (746 | 4.3%).
Production, Transportation and Moving Occupations by Sex
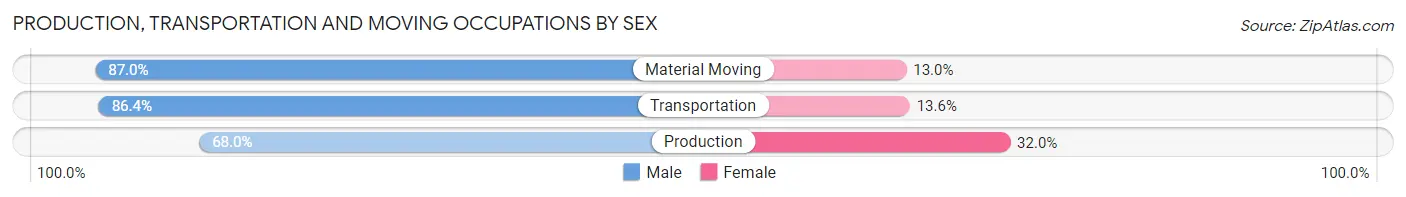
| Occupation | Male | Female |
| Production | 507 (68.0%) | 239 (32.0%) |
| Transportation | 1,047 (86.4%) | 165 (13.6%) |
| Material Moving | 744 (87.0%) | 111 (13.0%) |
| Total (Category) | 2,298 (81.7%) | 515 (18.3%) |
| Total (Overall) | 8,756 (50.9%) | 8,442 (49.1%) |
Employment Industries by Sex in Suwannee County
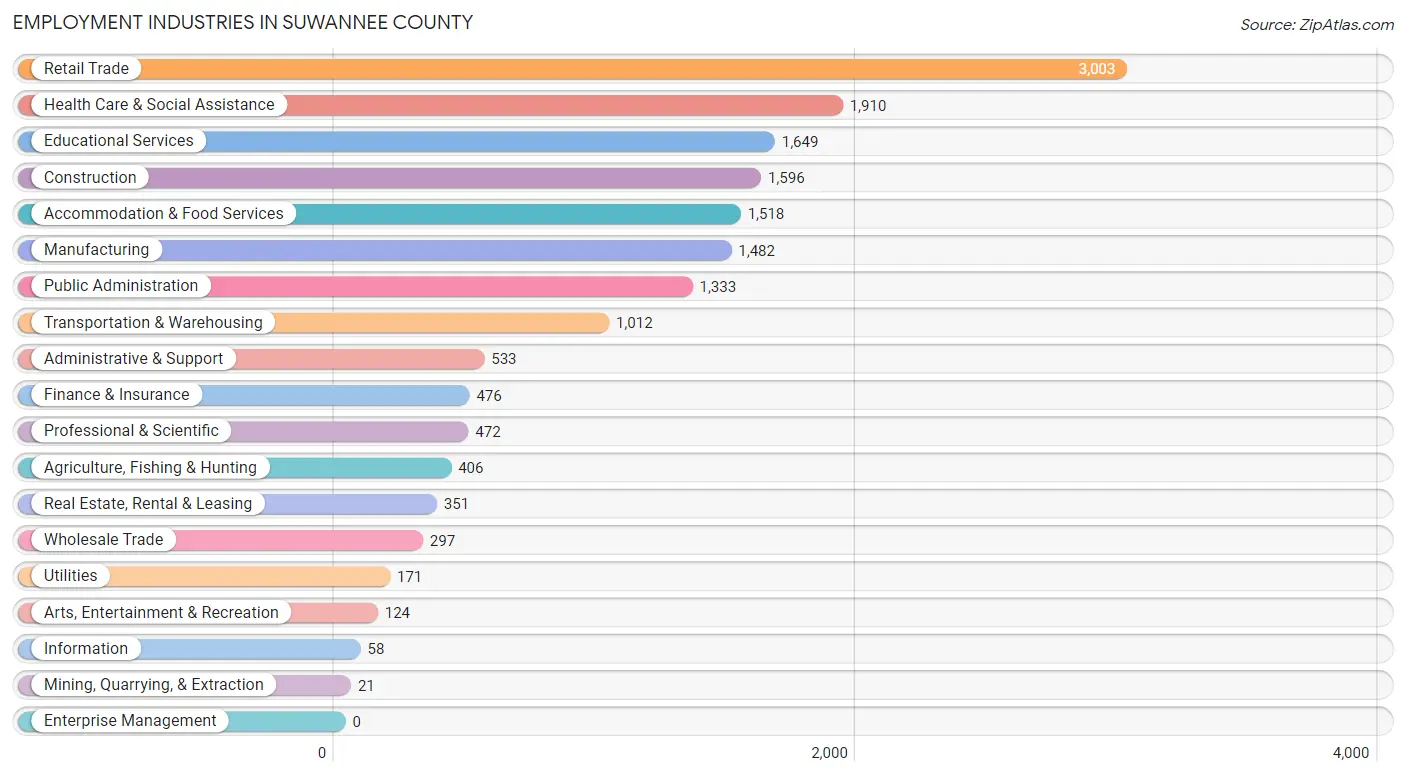
Employment Industries in Suwannee County
The major employment industries in Suwannee County include Retail Trade (3,003 | 17.5%), Health Care & Social Assistance (1,910 | 11.1%), Educational Services (1,649 | 9.6%), Construction (1,596 | 9.3%), and Accommodation & Food Services (1,518 | 8.8%).
Employment Industries by Sex in Suwannee County
The Suwannee County industries that see more men than women are Mining, Quarrying, & Extraction (100.0%), Utilities (97.1%), and Construction (93.8%), whereas the industries that tend to have a higher number of women are Finance & Insurance (85.9%), Educational Services (84.7%), and Health Care & Social Assistance (79.3%).
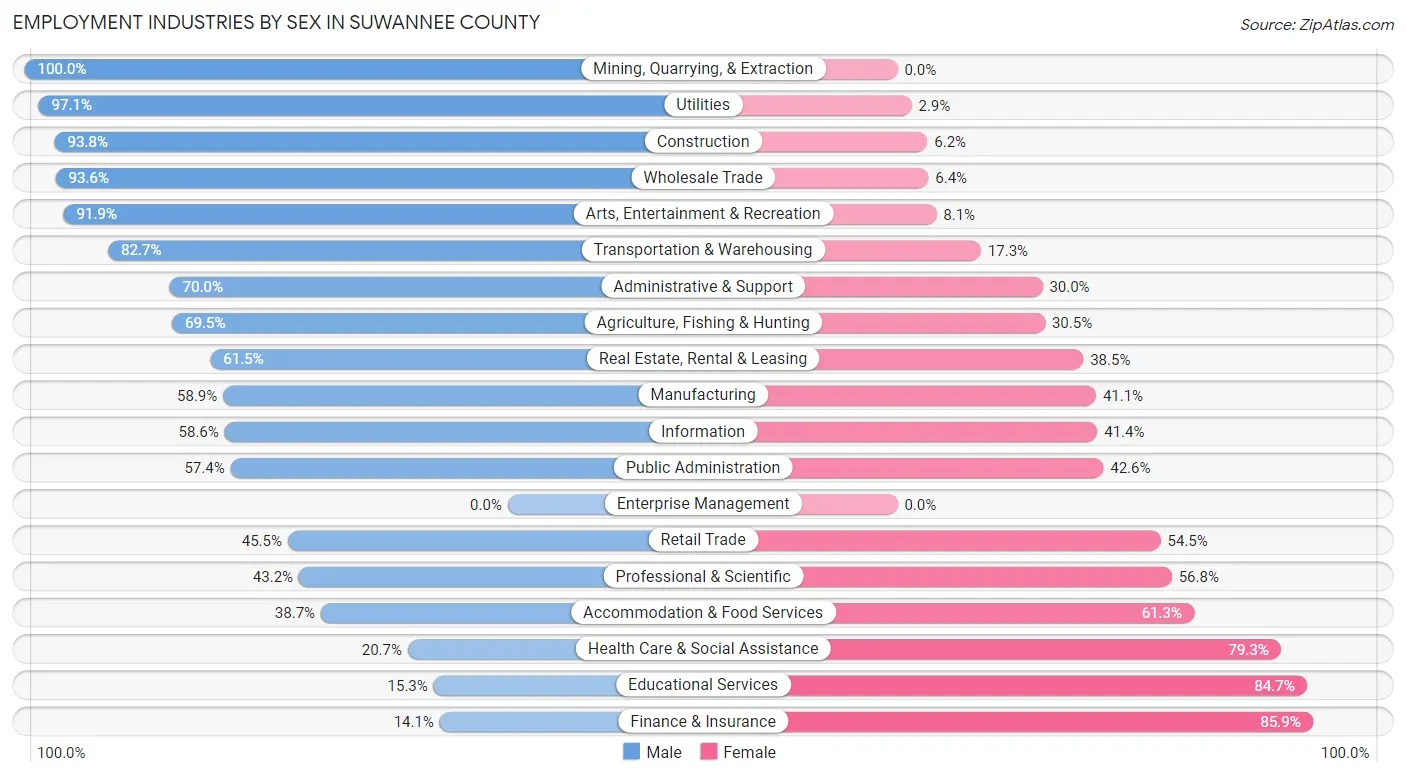
| Industry | Male | Female |
| Agriculture, Fishing & Hunting | 282 (69.5%) | 124 (30.5%) |
| Mining, Quarrying, & Extraction | 21 (100.0%) | 0 (0.0%) |
| Construction | 1,497 (93.8%) | 99 (6.2%) |
| Manufacturing | 873 (58.9%) | 609 (41.1%) |
| Wholesale Trade | 278 (93.6%) | 19 (6.4%) |
| Retail Trade | 1,367 (45.5%) | 1,636 (54.5%) |
| Transportation & Warehousing | 837 (82.7%) | 175 (17.3%) |
| Utilities | 166 (97.1%) | 5 (2.9%) |
| Information | 34 (58.6%) | 24 (41.4%) |
| Finance & Insurance | 67 (14.1%) | 409 (85.9%) |
| Real Estate, Rental & Leasing | 216 (61.5%) | 135 (38.5%) |
| Professional & Scientific | 204 (43.2%) | 268 (56.8%) |
| Enterprise Management | 0 (0.0%) | 0 (0.0%) |
| Administrative & Support | 373 (70.0%) | 160 (30.0%) |
| Educational Services | 253 (15.3%) | 1,396 (84.7%) |
| Health Care & Social Assistance | 395 (20.7%) | 1,515 (79.3%) |
| Arts, Entertainment & Recreation | 114 (91.9%) | 10 (8.1%) |
| Accommodation & Food Services | 587 (38.7%) | 931 (61.3%) |
| Public Administration | 765 (57.4%) | 568 (42.6%) |
| Total | 8,756 (50.9%) | 8,442 (49.1%) |
Education in Suwannee County
School Enrollment in Suwannee County
The most common levels of schooling among the 9,262 students in Suwannee County are high school (2,595 | 28.0%), middle school (2,486 | 26.8%), and elementary school (1,804 | 19.5%).
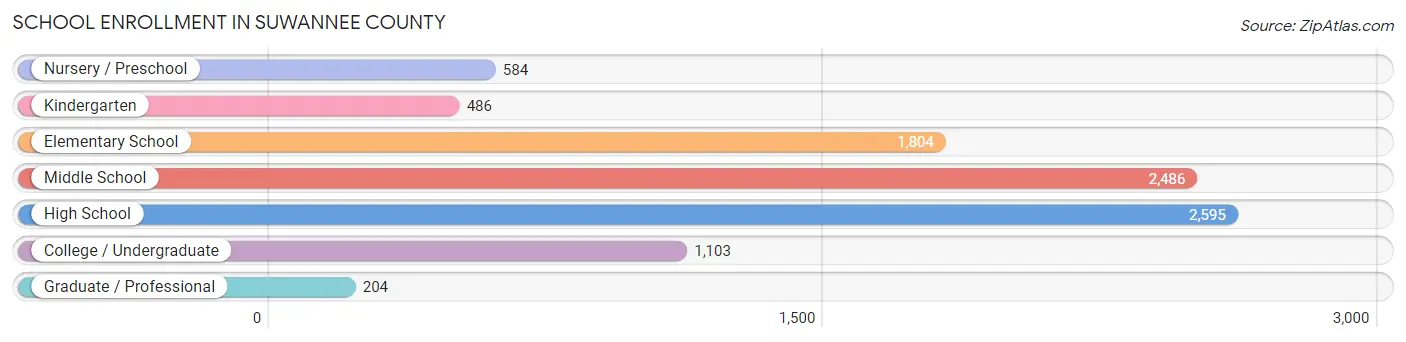
| School Level | # Students | % Students |
| Nursery / Preschool | 584 | 6.3% |
| Kindergarten | 486 | 5.2% |
| Elementary School | 1,804 | 19.5% |
| Middle School | 2,486 | 26.8% |
| High School | 2,595 | 28.0% |
| College / Undergraduate | 1,103 | 11.9% |
| Graduate / Professional | 204 | 2.2% |
| Total | 9,262 | 100.0% |
School Enrollment by Age by Funding Source in Suwannee County
Out of a total of 9,262 students who are enrolled in schools in Suwannee County, 1,676 (18.1%) attend a private institution, while the remaining 7,586 (81.9%) are enrolled in public schools. The age group of 35 years and over has the highest likelihood of being enrolled in private schools, with 99 (44.4% in the age bracket) enrolled. Conversely, the age group of 25 to 34 year olds has the lowest likelihood of being enrolled in a private school, with 262 (100.0% in the age bracket) attending a public institution.
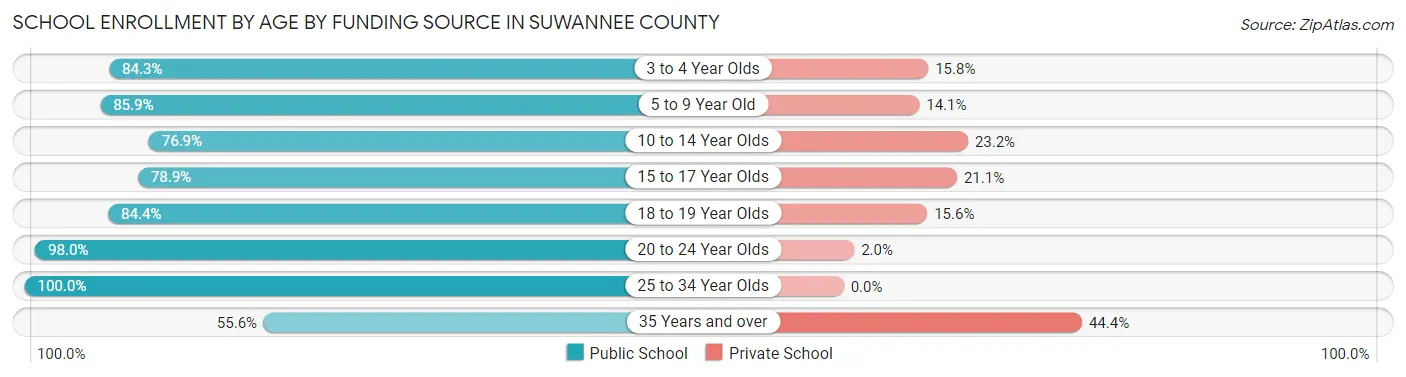
| Age Bracket | Public School | Private School |
| 3 to 4 Year Olds | 460 (84.3%) | 86 (15.8%) |
| 5 to 9 Year Old | 1,726 (85.9%) | 283 (14.1%) |
| 10 to 14 Year Olds | 2,353 (76.8%) | 709 (23.2%) |
| 15 to 17 Year Olds | 1,476 (78.9%) | 395 (21.1%) |
| 18 to 19 Year Olds | 488 (84.4%) | 90 (15.6%) |
| 20 to 24 Year Olds | 697 (98.0%) | 14 (2.0%) |
| 25 to 34 Year Olds | 262 (100.0%) | 0 (0.0%) |
| 35 Years and over | 124 (55.6%) | 99 (44.4%) |
| Total | 7,586 (81.9%) | 1,676 (18.1%) |
Educational Attainment by Field of Study in Suwannee County
Education (1,168 | 22.0%), business (988 | 18.6%), bio, nature & agricultural (625 | 11.8%), science & technology (573 | 10.8%), and arts & humanities (426 | 8.0%) are the most common fields of study among 5,316 individuals in Suwannee County who have obtained a bachelor's degree or higher.
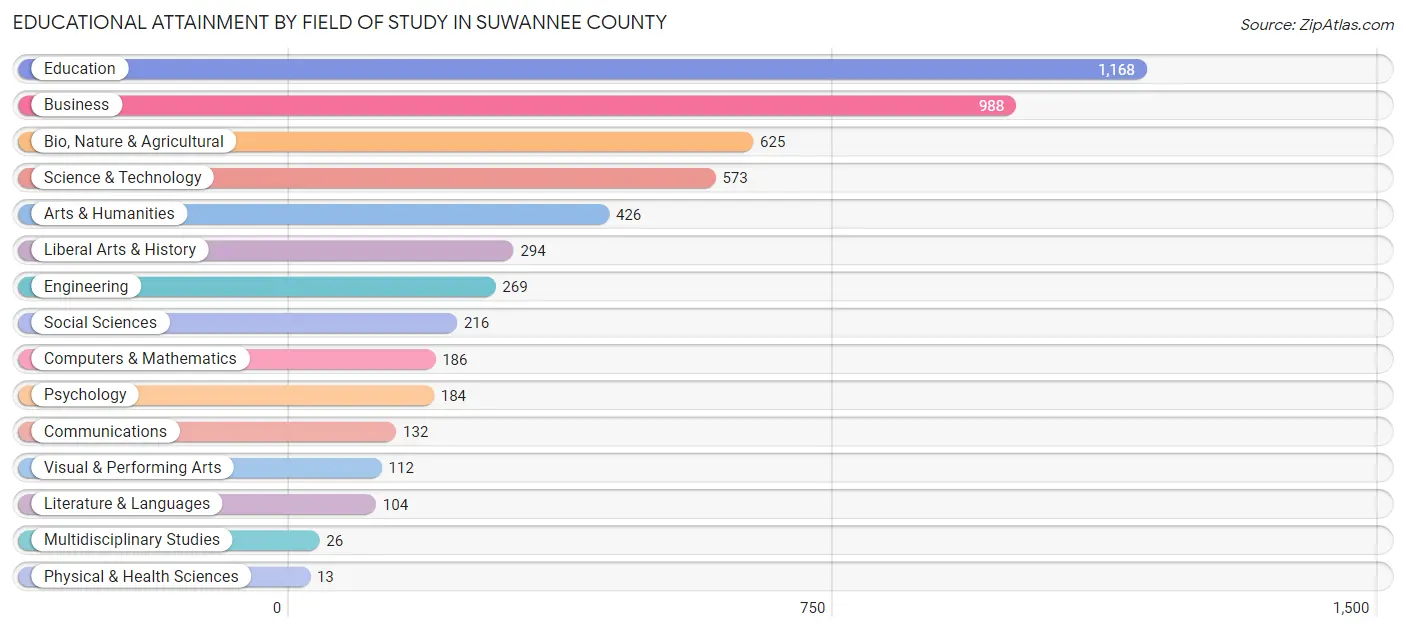
| Field of Study | # Graduates | % Graduates |
| Computers & Mathematics | 186 | 3.5% |
| Bio, Nature & Agricultural | 625 | 11.8% |
| Physical & Health Sciences | 13 | 0.2% |
| Psychology | 184 | 3.5% |
| Social Sciences | 216 | 4.1% |
| Engineering | 269 | 5.1% |
| Multidisciplinary Studies | 26 | 0.5% |
| Science & Technology | 573 | 10.8% |
| Business | 988 | 18.6% |
| Education | 1,168 | 22.0% |
| Literature & Languages | 104 | 2.0% |
| Liberal Arts & History | 294 | 5.5% |
| Visual & Performing Arts | 112 | 2.1% |
| Communications | 132 | 2.5% |
| Arts & Humanities | 426 | 8.0% |
| Total | 5,316 | 100.0% |
Transportation & Commute in Suwannee County
Vehicle Availability by Sex in Suwannee County
The most prevalent vehicle ownership categories in Suwannee County are males with 3 vehicles (2,929, accounting for 34.0%) and females with 3 vehicles (2,484, making up 35.2%).
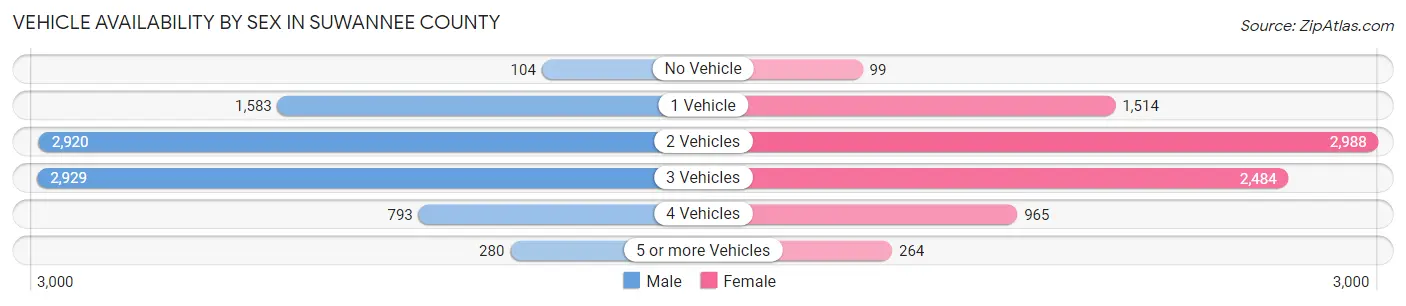
| Vehicles Available | Male | Female |
| No Vehicle | 104 (1.2%) | 99 (1.2%) |
| 1 Vehicle | 1,583 (18.4%) | 1,514 (18.2%) |
| 2 Vehicles | 2,920 (33.9%) | 2,988 (35.9%) |
| 3 Vehicles | 2,929 (34.0%) | 2,484 (29.9%) |
| 4 Vehicles | 793 (9.2%) | 965 (11.6%) |
| 5 or more Vehicles | 280 (3.3%) | 264 (3.2%) |
| Total | 8,609 (100.0%) | 8,314 (100.0%) |
Commute Time in Suwannee County
The most frequently occuring commute durations in Suwannee County are 15 to 19 minutes (2,491 commuters, 15.6%), 30 to 34 minutes (2,474 commuters, 15.5%), and 20 to 24 minutes (2,316 commuters, 14.5%).
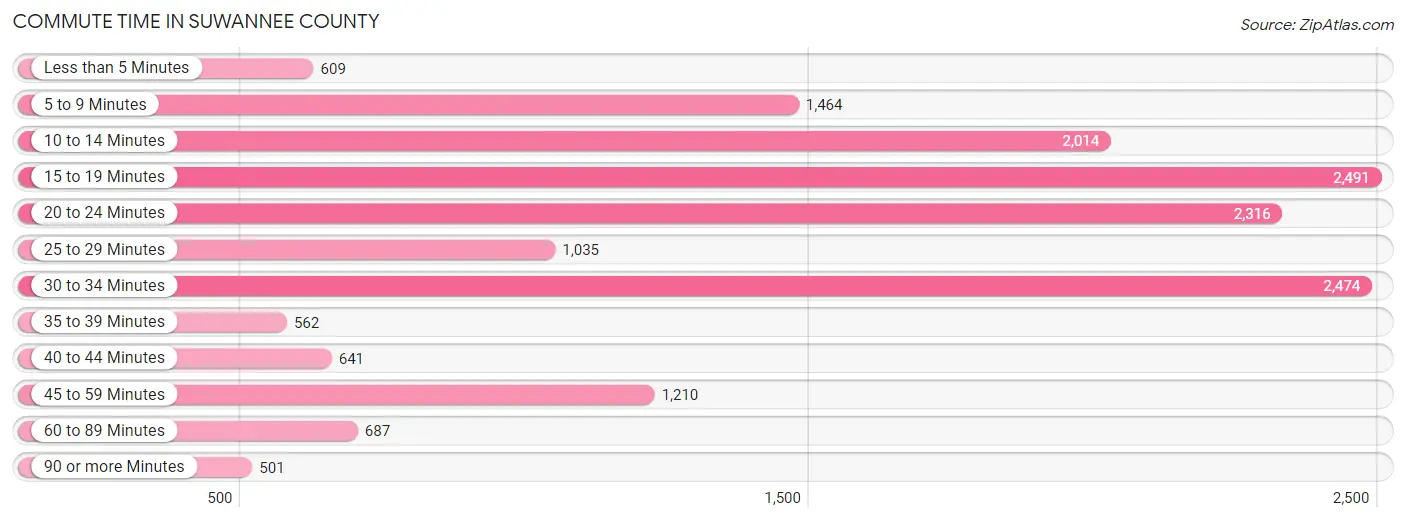
| Commute Time | # Commuters | % Commuters |
| Less than 5 Minutes | 609 | 3.8% |
| 5 to 9 Minutes | 1,464 | 9.1% |
| 10 to 14 Minutes | 2,014 | 12.6% |
| 15 to 19 Minutes | 2,491 | 15.6% |
| 20 to 24 Minutes | 2,316 | 14.5% |
| 25 to 29 Minutes | 1,035 | 6.5% |
| 30 to 34 Minutes | 2,474 | 15.5% |
| 35 to 39 Minutes | 562 | 3.5% |
| 40 to 44 Minutes | 641 | 4.0% |
| 45 to 59 Minutes | 1,210 | 7.6% |
| 60 to 89 Minutes | 687 | 4.3% |
| 90 or more Minutes | 501 | 3.1% |
Commute Time by Sex in Suwannee County
The most common commute times in Suwannee County are 30 to 34 minutes (1,320 commuters, 16.2%) for males and 15 to 19 minutes (1,547 commuters, 19.8%) for females.
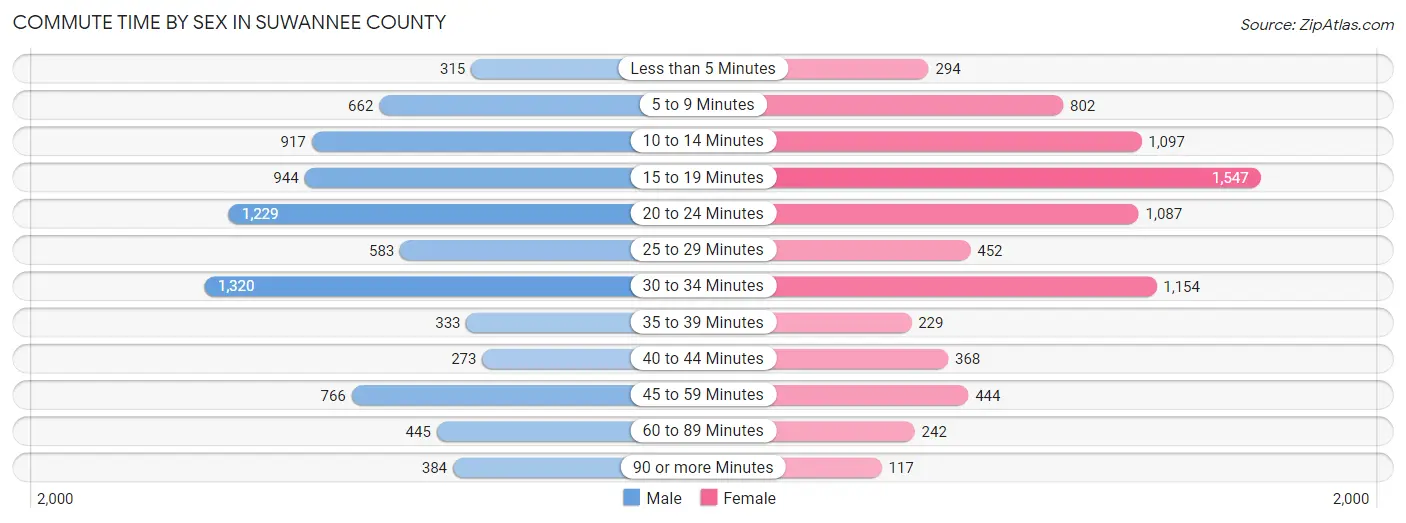
| Commute Time | Male | Female |
| Less than 5 Minutes | 315 (3.9%) | 294 (3.7%) |
| 5 to 9 Minutes | 662 (8.1%) | 802 (10.2%) |
| 10 to 14 Minutes | 917 (11.2%) | 1,097 (14.0%) |
| 15 to 19 Minutes | 944 (11.6%) | 1,547 (19.8%) |
| 20 to 24 Minutes | 1,229 (15.0%) | 1,087 (13.9%) |
| 25 to 29 Minutes | 583 (7.1%) | 452 (5.8%) |
| 30 to 34 Minutes | 1,320 (16.2%) | 1,154 (14.7%) |
| 35 to 39 Minutes | 333 (4.1%) | 229 (2.9%) |
| 40 to 44 Minutes | 273 (3.3%) | 368 (4.7%) |
| 45 to 59 Minutes | 766 (9.4%) | 444 (5.7%) |
| 60 to 89 Minutes | 445 (5.4%) | 242 (3.1%) |
| 90 or more Minutes | 384 (4.7%) | 117 (1.5%) |
Time of Departure to Work by Sex in Suwannee County
The most frequent times of departure to work in Suwannee County are 12:00 PM to 3:59 PM (997, 12.2%) for males and 7:00 AM to 7:29 AM (1,327, 16.9%) for females.
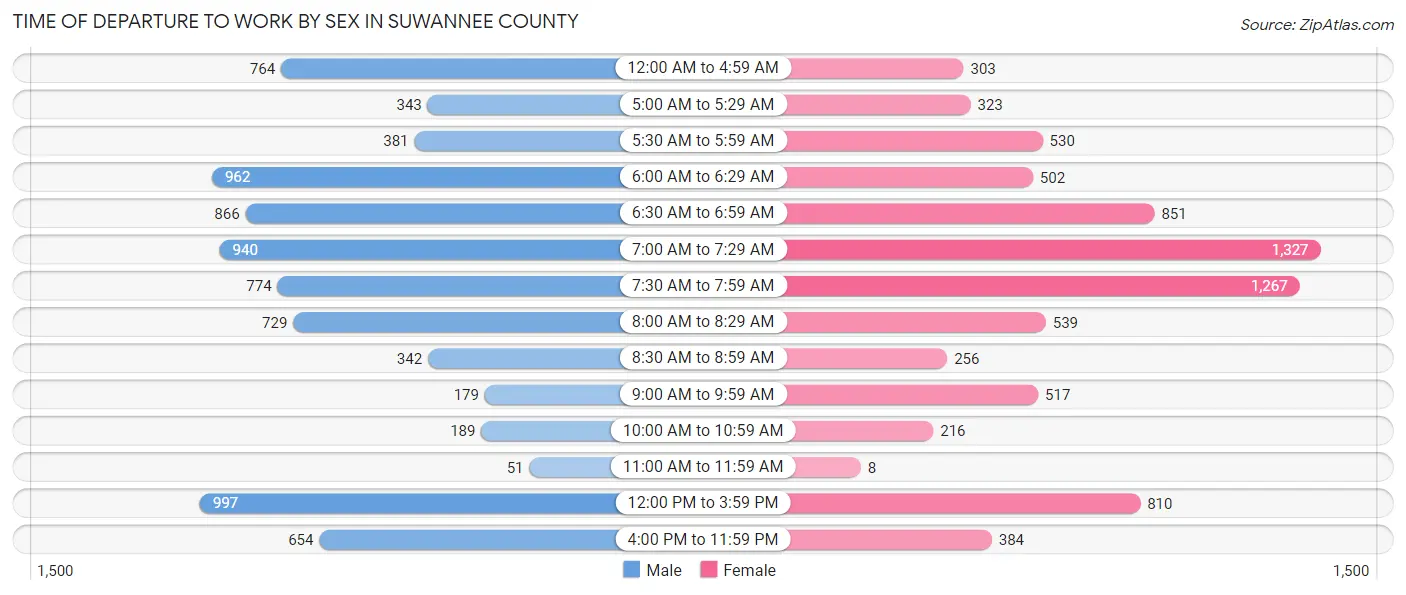
| Time of Departure | Male | Female |
| 12:00 AM to 4:59 AM | 764 (9.3%) | 303 (3.9%) |
| 5:00 AM to 5:29 AM | 343 (4.2%) | 323 (4.1%) |
| 5:30 AM to 5:59 AM | 381 (4.7%) | 530 (6.8%) |
| 6:00 AM to 6:29 AM | 962 (11.8%) | 502 (6.4%) |
| 6:30 AM to 6:59 AM | 866 (10.6%) | 851 (10.9%) |
| 7:00 AM to 7:29 AM | 940 (11.5%) | 1,327 (16.9%) |
| 7:30 AM to 7:59 AM | 774 (9.5%) | 1,267 (16.2%) |
| 8:00 AM to 8:29 AM | 729 (8.9%) | 539 (6.9%) |
| 8:30 AM to 8:59 AM | 342 (4.2%) | 256 (3.3%) |
| 9:00 AM to 9:59 AM | 179 (2.2%) | 517 (6.6%) |
| 10:00 AM to 10:59 AM | 189 (2.3%) | 216 (2.8%) |
| 11:00 AM to 11:59 AM | 51 (0.6%) | 8 (0.1%) |
| 12:00 PM to 3:59 PM | 997 (12.2%) | 810 (10.3%) |
| 4:00 PM to 11:59 PM | 654 (8.0%) | 384 (4.9%) |
| Total | 8,171 (100.0%) | 7,833 (100.0%) |
Housing Occupancy in Suwannee County
Occupancy by Ownership in Suwannee County
Of the total 15,453 dwellings in Suwannee County, owner-occupied units account for 11,626 (75.2%), while renter-occupied units make up 3,827 (24.8%).
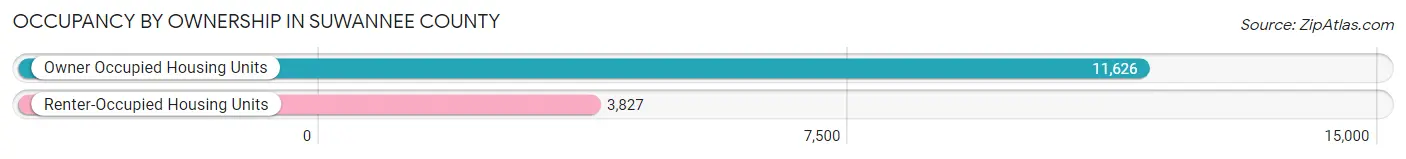
| Occupancy | # Housing Units | % Housing Units |
| Owner Occupied Housing Units | 11,626 | 75.2% |
| Renter-Occupied Housing Units | 3,827 | 24.8% |
| Total Occupied Housing Units | 15,453 | 100.0% |
Occupancy by Household Size in Suwannee County
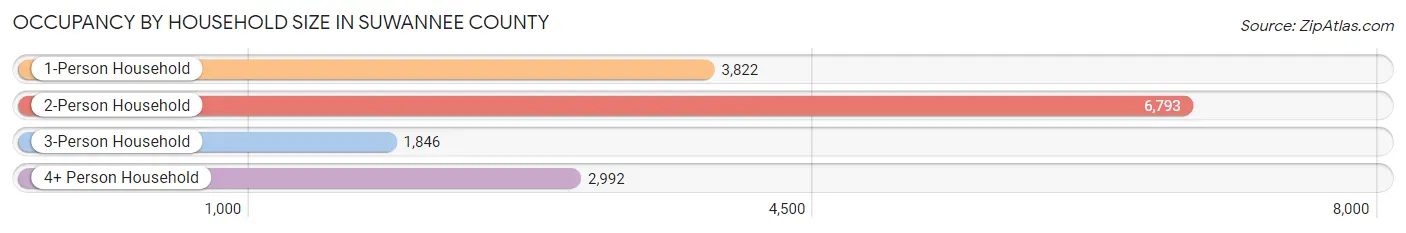
| Household Size | # Housing Units | % Housing Units |
| 1-Person Household | 3,822 | 24.7% |
| 2-Person Household | 6,793 | 44.0% |
| 3-Person Household | 1,846 | 11.9% |
| 4+ Person Household | 2,992 | 19.4% |
| Total Housing Units | 15,453 | 100.0% |
Occupancy by Ownership by Household Size in Suwannee County
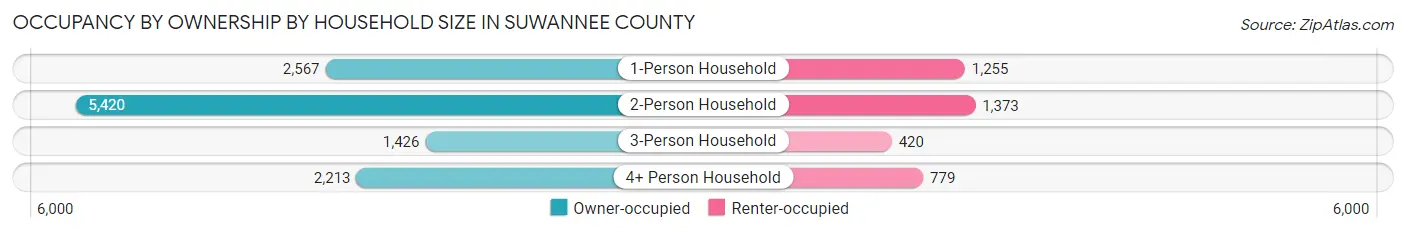
| Household Size | Owner-occupied | Renter-occupied |
| 1-Person Household | 2,567 (67.2%) | 1,255 (32.8%) |
| 2-Person Household | 5,420 (79.8%) | 1,373 (20.2%) |
| 3-Person Household | 1,426 (77.2%) | 420 (22.8%) |
| 4+ Person Household | 2,213 (74.0%) | 779 (26.0%) |
| Total Housing Units | 11,626 (75.2%) | 3,827 (24.8%) |
Occupancy by Educational Attainment in Suwannee County
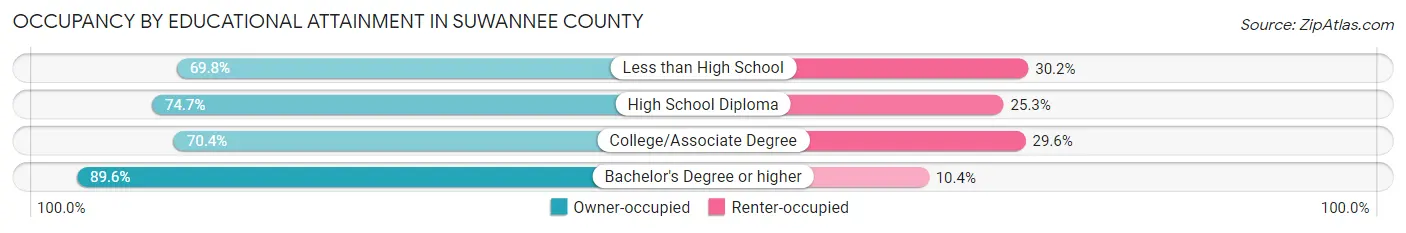
| Household Size | Owner-occupied | Renter-occupied |
| Less than High School | 1,482 (69.8%) | 640 (30.2%) |
| High School Diploma | 4,238 (74.7%) | 1,433 (25.3%) |
| College/Associate Degree | 3,507 (70.4%) | 1,475 (29.6%) |
| Bachelor's Degree or higher | 2,399 (89.6%) | 279 (10.4%) |
Occupancy by Age of Householder in Suwannee County
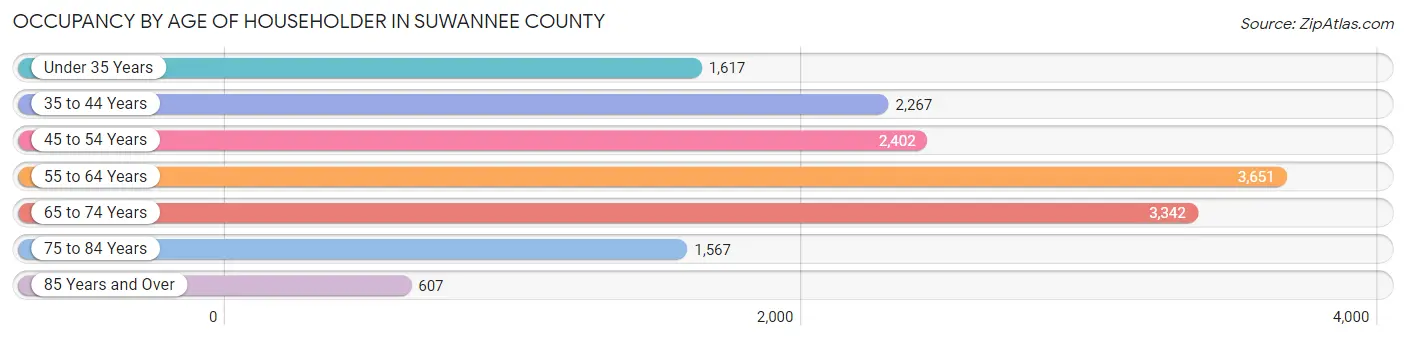
| Age Bracket | # Households | % Households |
| Under 35 Years | 1,617 | 10.5% |
| 35 to 44 Years | 2,267 | 14.7% |
| 45 to 54 Years | 2,402 | 15.5% |
| 55 to 64 Years | 3,651 | 23.6% |
| 65 to 74 Years | 3,342 | 21.6% |
| 75 to 84 Years | 1,567 | 10.1% |
| 85 Years and Over | 607 | 3.9% |
| Total | 15,453 | 100.0% |
Housing Finances in Suwannee County
Median Income by Occupancy in Suwannee County
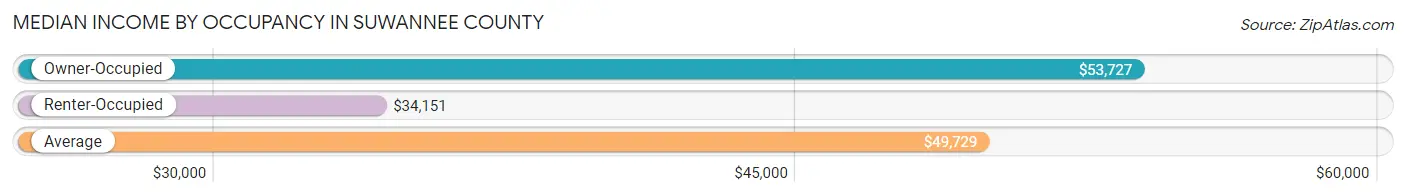
| Occupancy Type | # Households | Median Income |
| Owner-Occupied | 11,626 (75.2%) | $53,727 |
| Renter-Occupied | 3,827 (24.8%) | $34,151 |
| Average | 15,453 (100.0%) | $49,729 |
Occupancy by Householder Income Bracket in Suwannee County
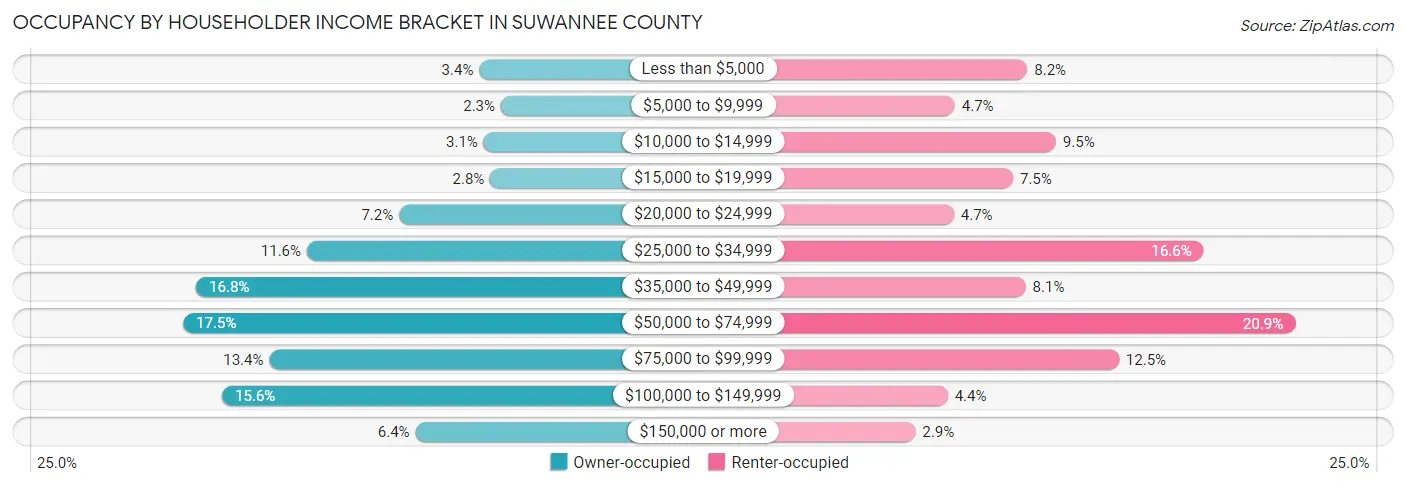
| Income Bracket | Owner-occupied | Renter-occupied |
| Less than $5,000 | 389 (3.4%) | 313 (8.2%) |
| $5,000 to $9,999 | 270 (2.3%) | 181 (4.7%) |
| $10,000 to $14,999 | 365 (3.1%) | 365 (9.5%) |
| $15,000 to $19,999 | 329 (2.8%) | 287 (7.5%) |
| $20,000 to $24,999 | 834 (7.2%) | 179 (4.7%) |
| $25,000 to $34,999 | 1,344 (11.6%) | 634 (16.6%) |
| $35,000 to $49,999 | 1,957 (16.8%) | 310 (8.1%) |
| $50,000 to $74,999 | 2,029 (17.4%) | 801 (20.9%) |
| $75,000 to $99,999 | 1,552 (13.4%) | 480 (12.5%) |
| $100,000 to $149,999 | 1,814 (15.6%) | 168 (4.4%) |
| $150,000 or more | 743 (6.4%) | 109 (2.9%) |
| Total | 11,626 (100.0%) | 3,827 (100.0%) |
Monthly Housing Cost Tiers in Suwannee County
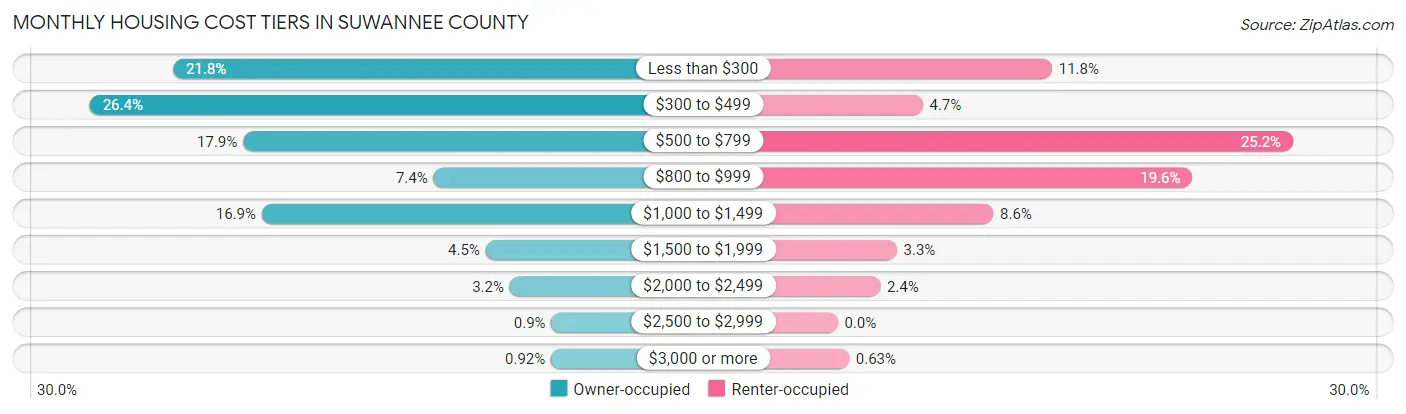
| Monthly Cost | Owner-occupied | Renter-occupied |
| Less than $300 | 2,535 (21.8%) | 453 (11.8%) |
| $300 to $499 | 3,069 (26.4%) | 180 (4.7%) |
| $500 to $799 | 2,084 (17.9%) | 963 (25.2%) |
| $800 to $999 | 862 (7.4%) | 750 (19.6%) |
| $1,000 to $1,499 | 1,965 (16.9%) | 329 (8.6%) |
| $1,500 to $1,999 | 527 (4.5%) | 125 (3.3%) |
| $2,000 to $2,499 | 372 (3.2%) | 90 (2.4%) |
| $2,500 to $2,999 | 105 (0.9%) | 0 (0.0%) |
| $3,000 or more | 107 (0.9%) | 24 (0.6%) |
| Total | 11,626 (100.0%) | 3,827 (100.0%) |
Physical Housing Characteristics in Suwannee County
Housing Structures in Suwannee County
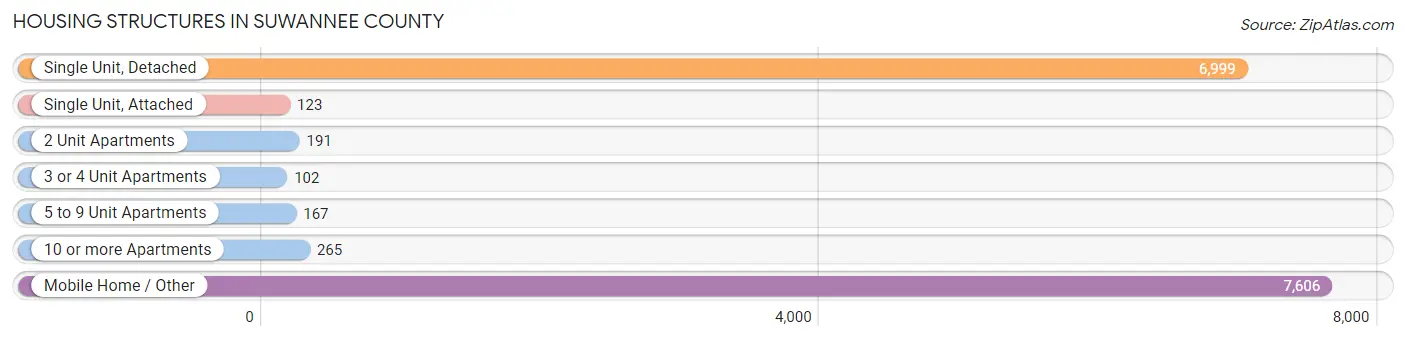
| Structure Type | # Housing Units | % Housing Units |
| Single Unit, Detached | 6,999 | 45.3% |
| Single Unit, Attached | 123 | 0.8% |
| 2 Unit Apartments | 191 | 1.2% |
| 3 or 4 Unit Apartments | 102 | 0.7% |
| 5 to 9 Unit Apartments | 167 | 1.1% |
| 10 or more Apartments | 265 | 1.7% |
| Mobile Home / Other | 7,606 | 49.2% |
| Total | 15,453 | 100.0% |
Housing Structures by Occupancy in Suwannee County
| Structure Type | Owner-occupied | Renter-occupied |
| Single Unit, Detached | 6,125 (87.5%) | 874 (12.5%) |
| Single Unit, Attached | 43 (35.0%) | 80 (65.0%) |
| 2 Unit Apartments | 8 (4.2%) | 183 (95.8%) |
| 3 or 4 Unit Apartments | 23 (22.6%) | 79 (77.4%) |
| 5 to 9 Unit Apartments | 0 (0.0%) | 167 (100.0%) |
| 10 or more Apartments | 10 (3.8%) | 255 (96.2%) |
| Mobile Home / Other | 5,417 (71.2%) | 2,189 (28.8%) |
| Total | 11,626 (75.2%) | 3,827 (24.8%) |
Housing Structures by Number of Rooms in Suwannee County
| Number of Rooms | Owner-occupied | Renter-occupied |
| 1 Room | 40 (0.3%) | 220 (5.8%) |
| 2 or 3 Rooms | 674 (5.8%) | 519 (13.6%) |
| 4 or 5 Rooms | 4,310 (37.1%) | 2,054 (53.7%) |
| 6 or 7 Rooms | 4,190 (36.0%) | 843 (22.0%) |
| 8 or more Rooms | 2,412 (20.7%) | 191 (5.0%) |
| Total | 11,626 (100.0%) | 3,827 (100.0%) |
Housing Structure by Heating Type in Suwannee County
| Heating Type | Owner-occupied | Renter-occupied |
| Utility Gas | 173 (1.5%) | 61 (1.6%) |
| Bottled, Tank, or LP Gas | 607 (5.2%) | 42 (1.1%) |
| Electricity | 10,496 (90.3%) | 3,638 (95.1%) |
| Fuel Oil or Kerosene | 0 (0.0%) | 3 (0.1%) |
| Coal or Coke | 0 (0.0%) | 0 (0.0%) |
| All other Fuels | 288 (2.5%) | 7 (0.2%) |
| No Fuel Used | 62 (0.5%) | 76 (2.0%) |
| Total | 11,626 (100.0%) | 3,827 (100.0%) |
Household Vehicle Usage in Suwannee County
| Vehicles per Household | Owner-occupied | Renter-occupied |
| No Vehicle | 270 (2.3%) | 649 (17.0%) |
| 1 Vehicle | 3,628 (31.2%) | 1,415 (37.0%) |
| 2 Vehicles | 4,247 (36.5%) | 1,198 (31.3%) |
| 3 or more Vehicles | 3,481 (29.9%) | 565 (14.8%) |
| Total | 11,626 (100.0%) | 3,827 (100.0%) |
Real Estate & Mortgages in Suwannee County
Real Estate and Mortgage Overview in Suwannee County
| Characteristic | Without Mortgage | With Mortgage |
| Housing Units | 6,886 | 4,740 |
| Median Property Value | $117,200 | $166,800 |
| Median Household Income | $43,792 | $278 |
| Monthly Housing Costs | $352 | $107 |
| Real Estate Taxes | $906 | $328 |
Property Value by Mortgage Status in Suwannee County
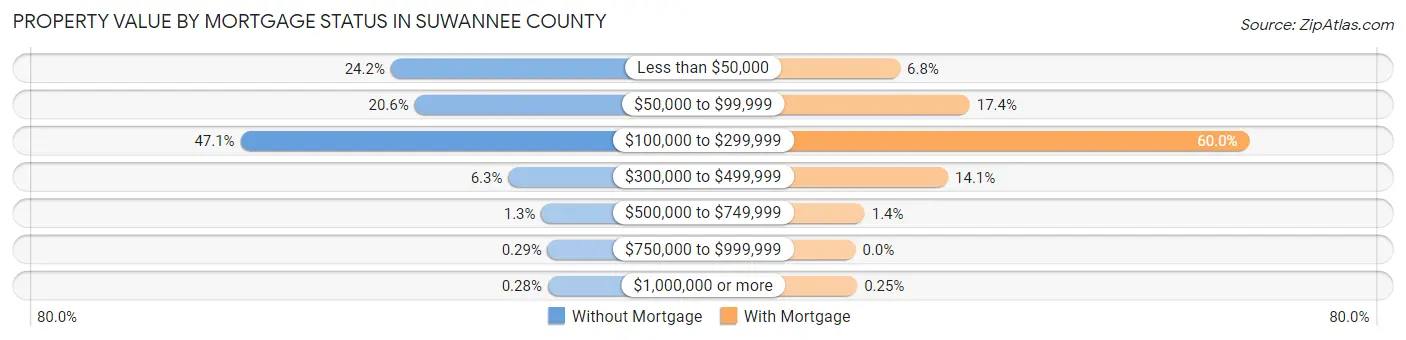
| Property Value | Without Mortgage | With Mortgage |
| Less than $50,000 | 1,667 (24.2%) | 322 (6.8%) |
| $50,000 to $99,999 | 1,417 (20.6%) | 825 (17.4%) |
| $100,000 to $299,999 | 3,244 (47.1%) | 2,845 (60.0%) |
| $300,000 to $499,999 | 433 (6.3%) | 669 (14.1%) |
| $500,000 to $749,999 | 86 (1.3%) | 67 (1.4%) |
| $750,000 to $999,999 | 20 (0.3%) | 0 (0.0%) |
| $1,000,000 or more | 19 (0.3%) | 12 (0.3%) |
| Total | 6,886 (100.0%) | 4,740 (100.0%) |
Household Income by Mortgage Status in Suwannee County
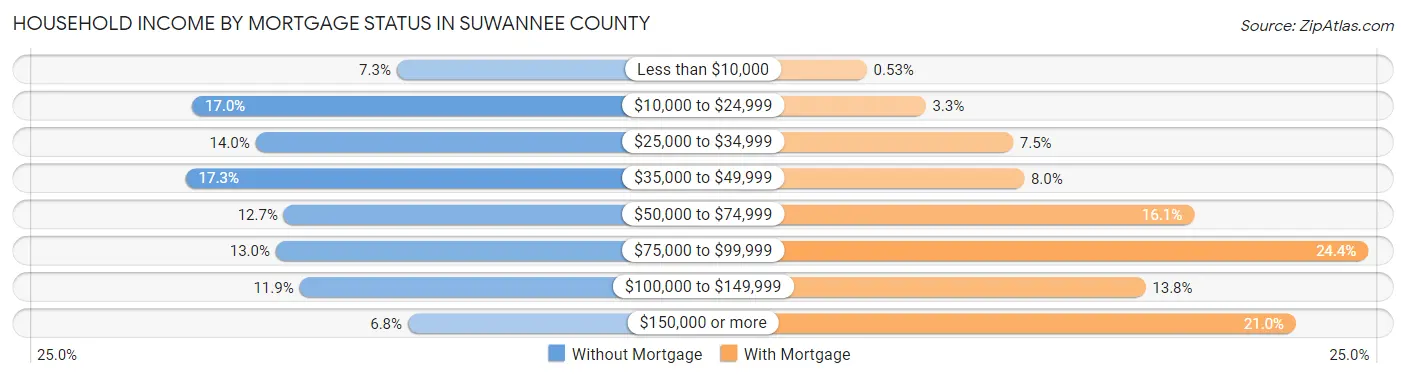
| Household Income | Without Mortgage | With Mortgage |
| Less than $10,000 | 501 (7.3%) | 25 (0.5%) |
| $10,000 to $24,999 | 1,173 (17.0%) | 158 (3.3%) |
| $25,000 to $34,999 | 964 (14.0%) | 355 (7.5%) |
| $35,000 to $49,999 | 1,193 (17.3%) | 380 (8.0%) |
| $50,000 to $74,999 | 872 (12.7%) | 764 (16.1%) |
| $75,000 to $99,999 | 898 (13.0%) | 1,157 (24.4%) |
| $100,000 to $149,999 | 820 (11.9%) | 654 (13.8%) |
| $150,000 or more | 465 (6.8%) | 994 (21.0%) |
| Total | 6,886 (100.0%) | 4,740 (100.0%) |
Property Value to Household Income Ratio in Suwannee County
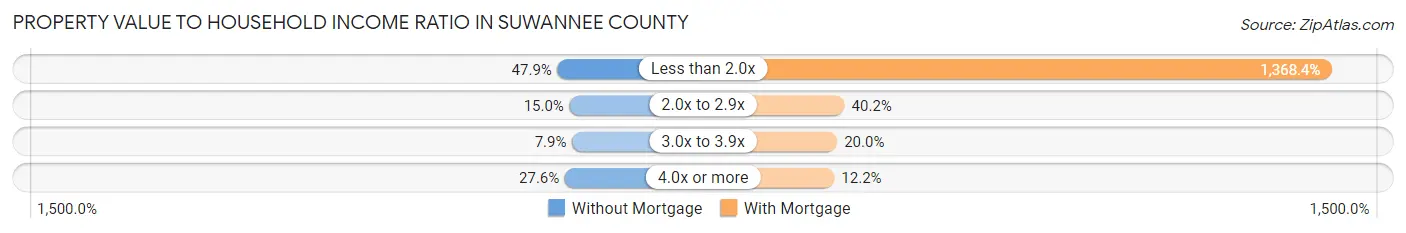
| Value-to-Income Ratio | Without Mortgage | With Mortgage |
| Less than 2.0x | 3,300 (47.9%) | 64,864 (1,368.4%) |
| 2.0x to 2.9x | 1,034 (15.0%) | 1,905 (40.2%) |
| 3.0x to 3.9x | 547 (7.9%) | 947 (20.0%) |
| 4.0x or more | 1,900 (27.6%) | 580 (12.2%) |
| Total | 6,886 (100.0%) | 4,740 (100.0%) |
Real Estate Taxes by Mortgage Status in Suwannee County
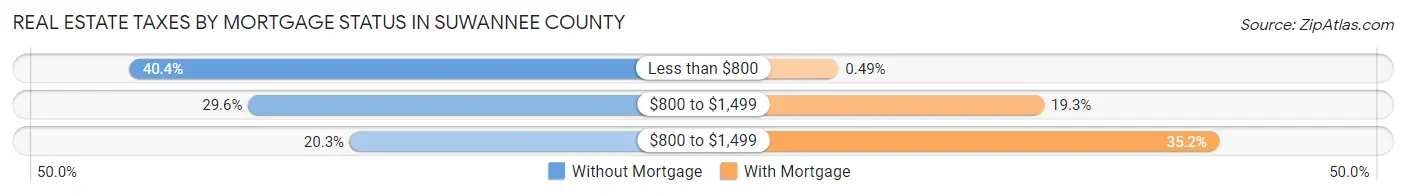
| Property Taxes | Without Mortgage | With Mortgage |
| Less than $800 | 2,781 (40.4%) | 23 (0.5%) |
| $800 to $1,499 | 2,036 (29.6%) | 914 (19.3%) |
| $800 to $1,499 | 1,397 (20.3%) | 1,670 (35.2%) |
| Total | 6,886 (100.0%) | 4,740 (100.0%) |
Health & Disability in Suwannee County
Health Insurance Coverage by Age in Suwannee County
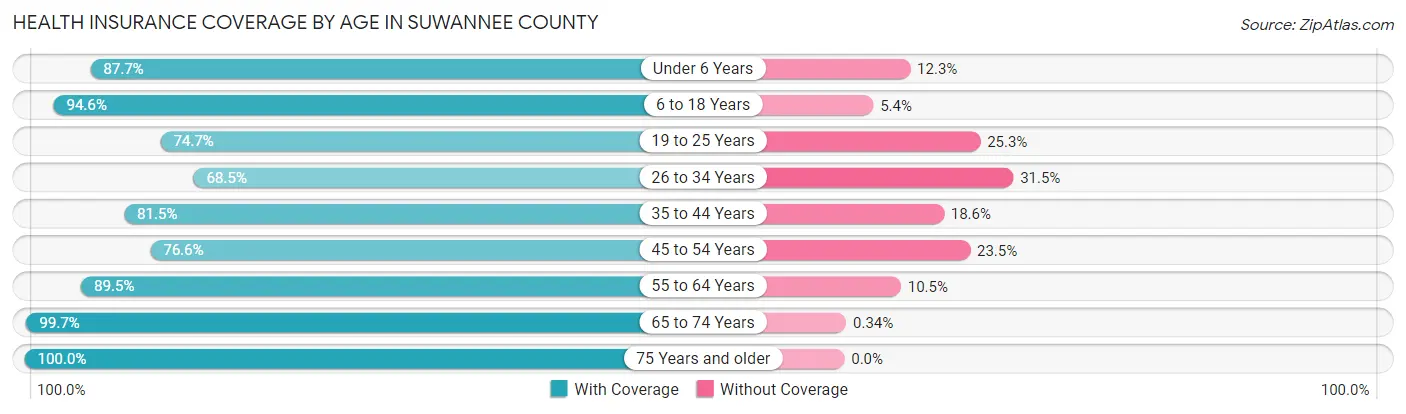
| Age Bracket | With Coverage | Without Coverage |
| Under 6 Years | 2,258 (87.7%) | 316 (12.3%) |
| 6 to 18 Years | 6,900 (94.6%) | 394 (5.4%) |
| 19 to 25 Years | 2,463 (74.7%) | 836 (25.3%) |
| 26 to 34 Years | 2,401 (68.5%) | 1,104 (31.5%) |
| 35 to 44 Years | 4,642 (81.5%) | 1,057 (18.5%) |
| 45 to 54 Years | 3,691 (76.5%) | 1,131 (23.4%) |
| 55 to 64 Years | 5,565 (89.5%) | 656 (10.5%) |
| 65 to 74 Years | 5,256 (99.7%) | 18 (0.3%) |
| 75 Years and older | 3,551 (100.0%) | 0 (0.0%) |
| Total | 36,727 (87.0%) | 5,512 (13.1%) |
Health Insurance Coverage by Citizenship Status in Suwannee County
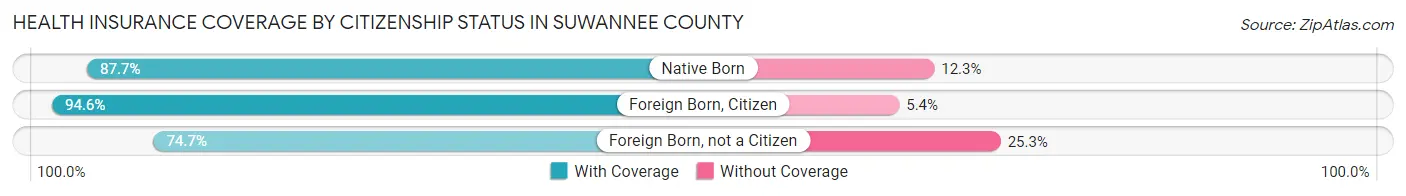
| Citizenship Status | With Coverage | Without Coverage |
| Native Born | 2,258 (87.7%) | 316 (12.3%) |
| Foreign Born, Citizen | 6,900 (94.6%) | 394 (5.4%) |
| Foreign Born, not a Citizen | 2,463 (74.7%) | 836 (25.3%) |
Health Insurance Coverage by Household Income in Suwannee County
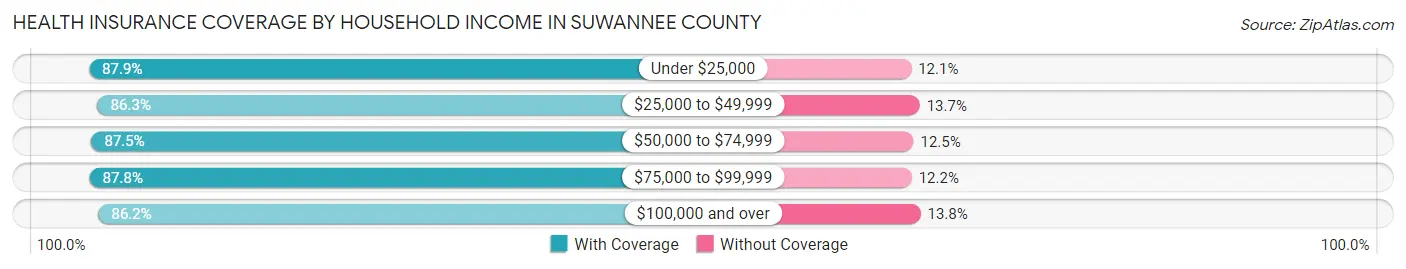
| Household Income | With Coverage | Without Coverage |
| Under $25,000 | 5,509 (87.9%) | 756 (12.1%) |
| $25,000 to $49,999 | 9,316 (86.3%) | 1,474 (13.7%) |
| $50,000 to $74,999 | 6,995 (87.5%) | 999 (12.5%) |
| $75,000 to $99,999 | 5,823 (87.8%) | 807 (12.2%) |
| $100,000 and over | 9,034 (86.2%) | 1,449 (13.8%) |
Public vs Private Health Insurance Coverage by Age in Suwannee County
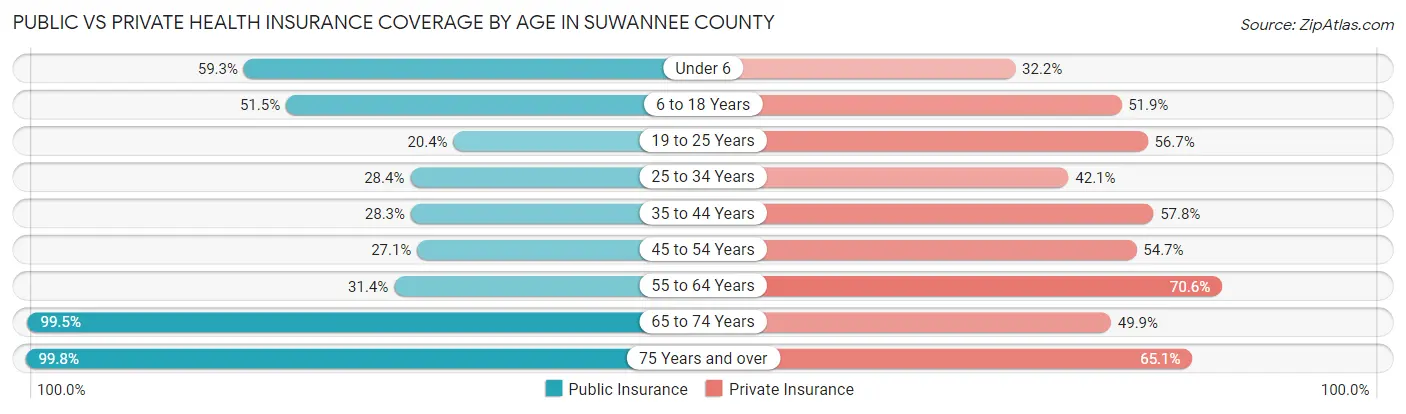
| Age Bracket | Public Insurance | Private Insurance |
| Under 6 | 1,527 (59.3%) | 828 (32.2%) |
| 6 to 18 Years | 3,755 (51.5%) | 3,783 (51.9%) |
| 19 to 25 Years | 673 (20.4%) | 1,872 (56.7%) |
| 25 to 34 Years | 996 (28.4%) | 1,474 (42.0%) |
| 35 to 44 Years | 1,613 (28.3%) | 3,294 (57.8%) |
| 45 to 54 Years | 1,308 (27.1%) | 2,636 (54.7%) |
| 55 to 64 Years | 1,954 (31.4%) | 4,391 (70.6%) |
| 65 to 74 Years | 5,245 (99.5%) | 2,634 (49.9%) |
| 75 Years and over | 3,545 (99.8%) | 2,310 (65.0%) |
| Total | 20,616 (48.8%) | 23,222 (55.0%) |
Disability Status by Sex by Age in Suwannee County
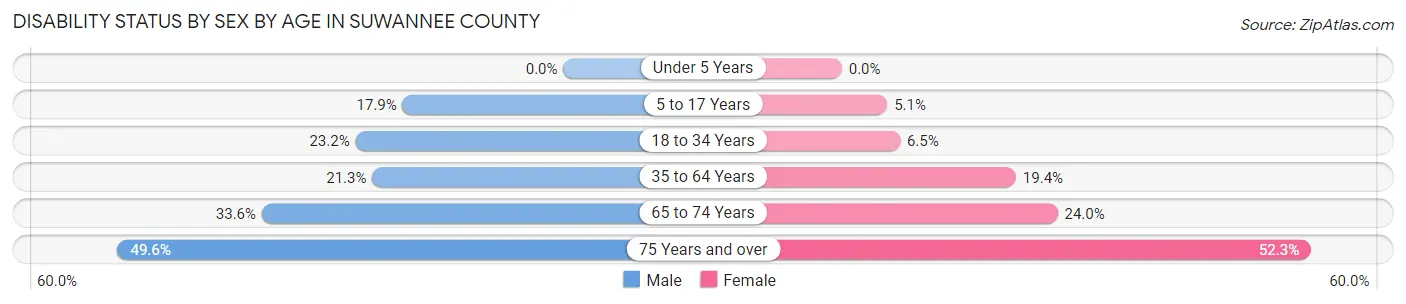
| Age Bracket | Male | Female |
| Under 5 Years | 0 (0.0%) | 0 (0.0%) |
| 5 to 17 Years | 687 (17.9%) | 163 (5.1%) |
| 18 to 34 Years | 897 (23.2%) | 226 (6.5%) |
| 35 to 64 Years | 1,815 (21.3%) | 1,593 (19.4%) |
| 65 to 74 Years | 846 (33.6%) | 662 (24.0%) |
| 75 Years and over | 826 (49.6%) | 986 (52.2%) |
Disability Class by Sex by Age in Suwannee County
Disability Class: Hearing Difficulty
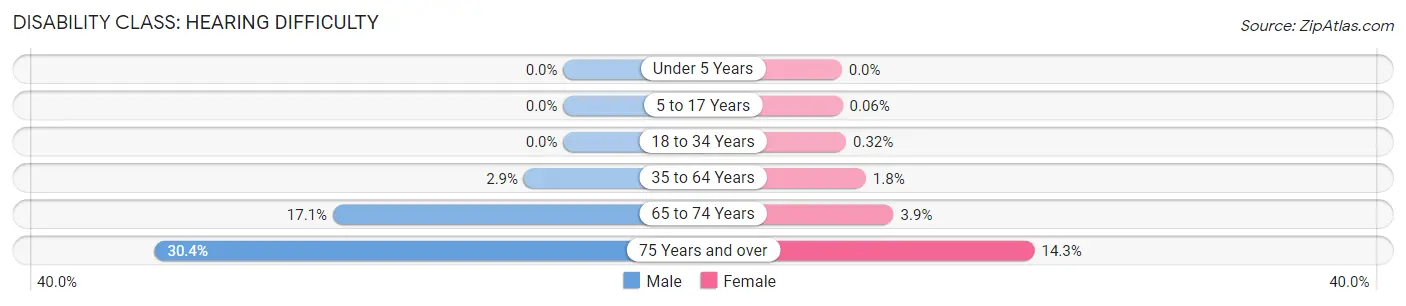
| Age Bracket | Male | Female |
| Under 5 Years | 0 (0.0%) | 0 (0.0%) |
| 5 to 17 Years | 0 (0.0%) | 2 (0.1%) |
| 18 to 34 Years | 0 (0.0%) | 11 (0.3%) |
| 35 to 64 Years | 250 (2.9%) | 147 (1.8%) |
| 65 to 74 Years | 431 (17.1%) | 106 (3.8%) |
| 75 Years and over | 505 (30.3%) | 270 (14.3%) |
Disability Class: Vision Difficulty
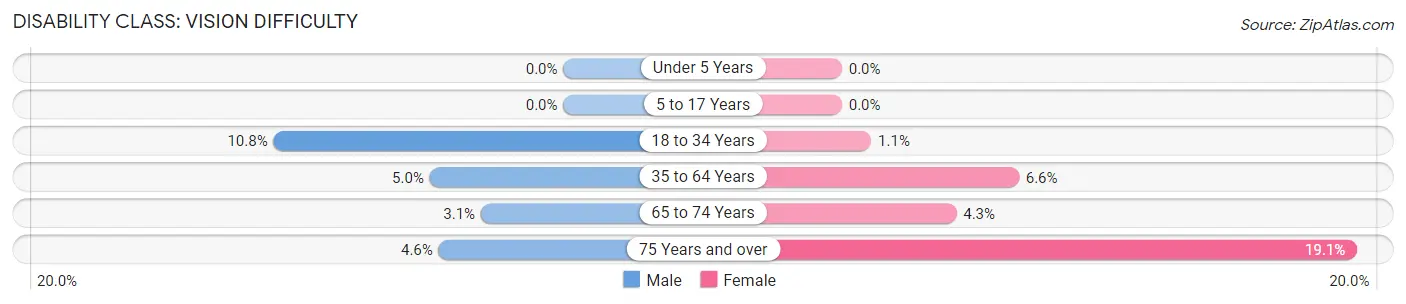
| Age Bracket | Male | Female |
| Under 5 Years | 0 (0.0%) | 0 (0.0%) |
| 5 to 17 Years | 0 (0.0%) | 0 (0.0%) |
| 18 to 34 Years | 417 (10.8%) | 38 (1.1%) |
| 35 to 64 Years | 423 (5.0%) | 540 (6.6%) |
| 65 to 74 Years | 77 (3.1%) | 117 (4.3%) |
| 75 Years and over | 77 (4.6%) | 361 (19.1%) |
Disability Class: Cognitive Difficulty
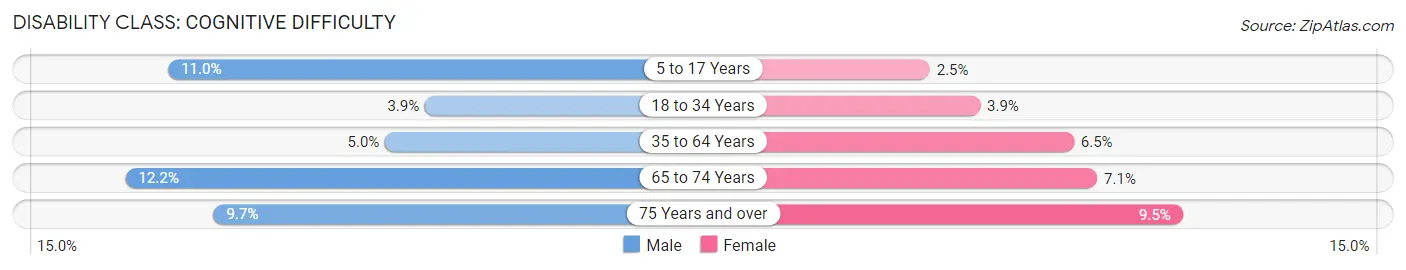
| Age Bracket | Male | Female |
| 5 to 17 Years | 422 (11.0%) | 79 (2.5%) |
| 18 to 34 Years | 149 (3.8%) | 134 (3.8%) |
| 35 to 64 Years | 423 (5.0%) | 531 (6.5%) |
| 65 to 74 Years | 307 (12.2%) | 196 (7.1%) |
| 75 Years and over | 162 (9.7%) | 179 (9.5%) |
Disability Class: Ambulatory Difficulty
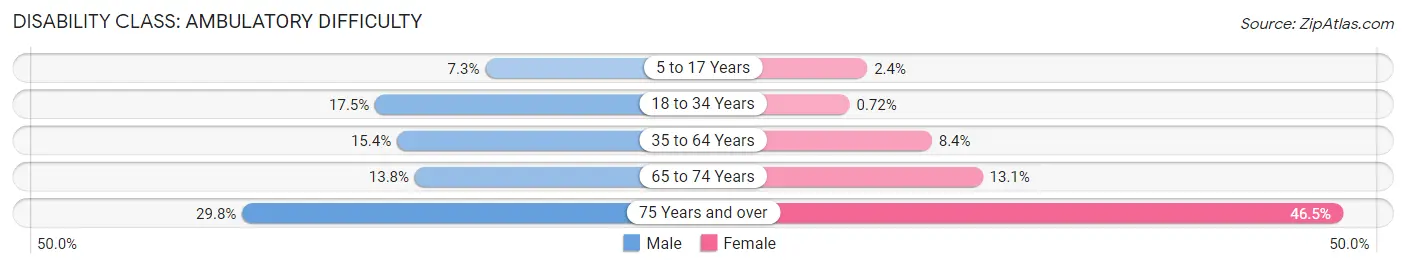
| Age Bracket | Male | Female |
| 5 to 17 Years | 278 (7.2%) | 76 (2.4%) |
| 18 to 34 Years | 677 (17.5%) | 25 (0.7%) |
| 35 to 64 Years | 1,317 (15.4%) | 686 (8.4%) |
| 65 to 74 Years | 347 (13.8%) | 360 (13.1%) |
| 75 Years and over | 496 (29.8%) | 877 (46.5%) |
Disability Class: Self-Care Difficulty
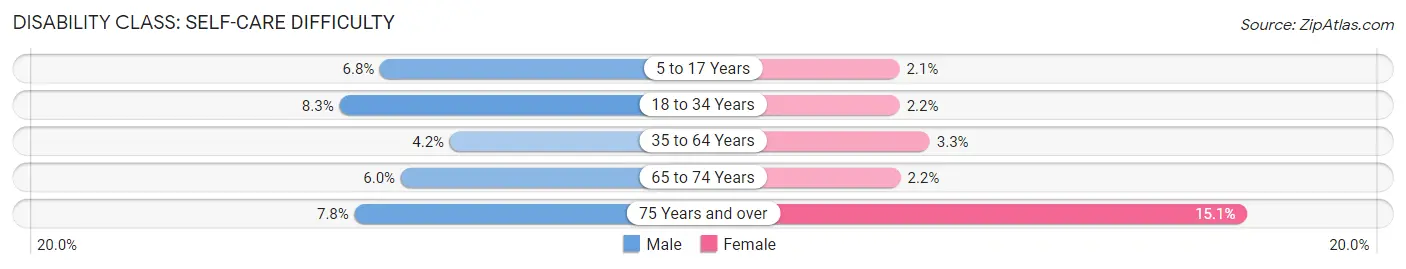
| Age Bracket | Male | Female |
| 5 to 17 Years | 261 (6.8%) | 69 (2.1%) |
| 18 to 34 Years | 322 (8.3%) | 75 (2.1%) |
| 35 to 64 Years | 359 (4.2%) | 269 (3.3%) |
| 65 to 74 Years | 152 (6.0%) | 60 (2.2%) |
| 75 Years and over | 129 (7.7%) | 284 (15.0%) |
Technology Access in Suwannee County
Computing Device Access in Suwannee County
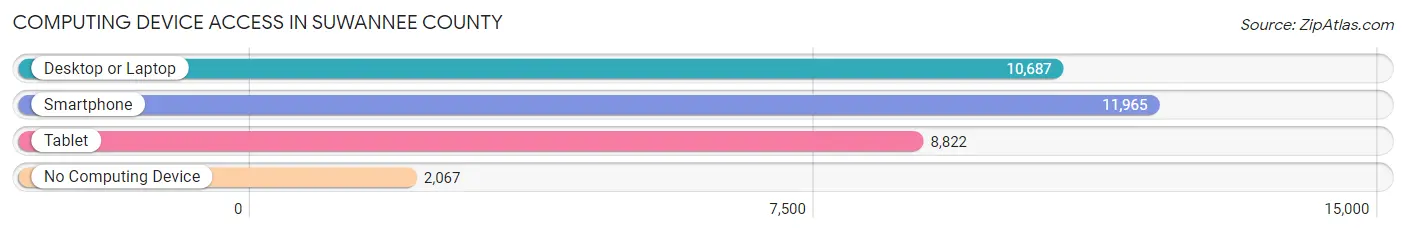
| Device Type | # Households | % Households |
| Desktop or Laptop | 10,687 | 69.2% |
| Smartphone | 11,965 | 77.4% |
| Tablet | 8,822 | 57.1% |
| No Computing Device | 2,067 | 13.4% |
| Total | 15,453 | 100.0% |
Internet Access in Suwannee County
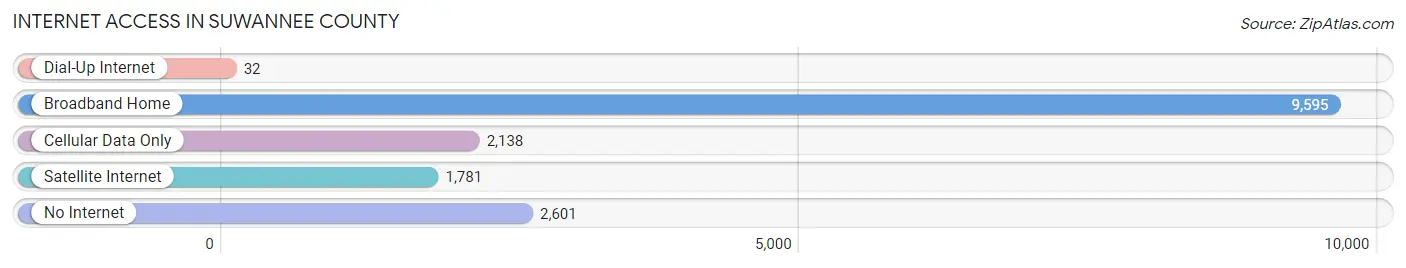
| Internet Type | # Households | % Households |
| Dial-Up Internet | 32 | 0.2% |
| Broadband Home | 9,595 | 62.1% |
| Cellular Data Only | 2,138 | 13.8% |
| Satellite Internet | 1,781 | 11.5% |
| No Internet | 2,601 | 16.8% |
| Total | 15,453 | 100.0% |
Suwannee County Summary
Suwannee County is located in the north-central region of Florida, and is part of the Big Bend region of the state. It is bordered by Hamilton County to the north, Lafayette County to the east, Columbia County to the south, and Madison County to the west. The county seat is Live Oak, and the county has a total area of 590 square miles, of which 587 square miles is land and 3 square miles is water.
The county was established in 1858 and named for the Suwannee River, which forms its western boundary. The river was named by the Spanish explorer Hernando de Soto in 1539, and is believed to be derived from the Hitchiti Indian word “sawani”, meaning “echo”.
The county has a population of 41,919, according to the 2010 census. The population is spread out with a median age of 41.7 years. The racial makeup of the county is 79.2% White, 16.3% African American, 0.5% Native American, 0.7% Asian, 0.1% Pacific Islander, 1.7% from other races, and 1.5% from two or more races. Hispanic or Latino of any race were 5.2% of the population.
The economy of Suwannee County is largely based on agriculture, forestry, and tourism. The county is home to several large timber companies, and is the leading producer of timber in the state. The county also has a large agricultural sector, with crops such as corn, cotton, peanuts, and soybeans being grown. The county is also home to several large poultry farms.
The county is also home to several tourist attractions, including the Suwannee River State Park, the Stephen Foster Folk Culture Center State Park, and the Suwannee Music Park. The county is also home to several festivals, including the Suwannee River Jam, the Suwannee Spring Reunion, and the Suwannee River Valley Bluegrass Festival.
The county is served by several major highways, including Interstate 10, U.S. Route 90, and U.S. Route 129. The county is also served by the Suwannee County Airport, which offers daily flights to several major cities.
Suwannee County is a great place to live, work, and play. With its rich history, diverse economy, and beautiful natural surroundings, it is a great place to call home.
Common Questions
What is Per Capita Income in Suwannee County?
Per Capita income in Suwannee County is $24,991.
What is the Median Family Income in Suwannee County?
Median Family Income in Suwannee County is $58,070.
What is the Median Household income in Suwannee County?
Median Household Income in Suwannee County is $49,729.
What is Income or Wage Gap in Suwannee County?
Income or Wage Gap in Suwannee County is 19.6%.
Women in Suwannee County earn 80.4 cents for every dollar earned by a man.
What is Family Income Deficit in Suwannee County?
Family Income Deficit in Suwannee County is $12,770.
Families that are below poverty line in Suwannee County earn $12,770 less on average than the poverty threshold level.
What is Inequality or Gini Index in Suwannee County?
Inequality or Gini Index in Suwannee County is 0.44.
What is the Total Population of Suwannee County?
Total Population of Suwannee County is 43,881.
What is the Total Male Population of Suwannee County?
Total Male Population of Suwannee County is 22,980.
What is the Total Female Population of Suwannee County?
Total Female Population of Suwannee County is 20,901.
What is the Ratio of Males per 100 Females in Suwannee County?
There are 109.95 Males per 100 Females in Suwannee County.
What is the Ratio of Females per 100 Males in Suwannee County?
There are 90.95 Females per 100 Males in Suwannee County.
What is the Median Population Age in Suwannee County?
Median Population Age in Suwannee County is 42.8 Years.
What is the Average Family Size in Suwannee County
Average Family Size in Suwannee County is 3.2 People.
What is the Average Household Size in Suwannee County
Average Household Size in Suwannee County is 2.7 People.
How Large is the Labor Force in Suwannee County?
There are 18,209 People in the Labor Forcein in Suwannee County.
What is the Percentage of People in the Labor Force in Suwannee County?
50.5% of People are in the Labor Force in Suwannee County.
What is the Unemployment Rate in Suwannee County?
Unemployment Rate in Suwannee County is 5.5%.