Sumter County, FL Map & Demographics
Sumter County Map
Sumter County Overview
$44,431
PER CAPITA INCOME
$82,977
AVG FAMILY INCOME
$70,105
AVG HOUSEHOLD INCOME
28.9%
WAGE / INCOME GAP [ % ]
71.1¢/ $1
WAGE / INCOME GAP [ $ ]
$11,505
FAMILY INCOME DEFICIT
0.42
INEQUALITY / GINI INDEX
131,832
TOTAL POPULATION
65,425
MALE POPULATION
66,407
FEMALE POPULATION
98.52
MALES / 100 FEMALES
101.50
FEMALES / 100 MALES
68.3
MEDIAN AGE
2.3
AVG FAMILY SIZE
1.9
AVG HOUSEHOLD SIZE
30,252
LABOR FORCE [ PEOPLE ]
24.5%
PERCENT IN LABOR FORCE
5.1%
UNEMPLOYMENT RATE
Sumter County Area Codes
Income in Sumter County
Income Overview in Sumter County
Per Capita Income in Sumter County is $44,431, while median incomes of families and households are $82,977 and $70,105 respectively.
| Characteristic | Number | Measure |
| Per Capita Income | 131,832 | $44,431 |
| Median Family Income | 41,647 | $82,977 |
| Mean Family Income | 41,647 | $101,700 |
| Median Household Income | 64,305 | $70,105 |
| Mean Household Income | 64,305 | $88,921 |
| Income Deficit | 41,647 | $11,505 |
| Wage / Income Gap (%) | 131,832 | 28.90% |
| Wage / Income Gap ($) | 131,832 | 71.10¢ per $1 |
| Gini / Inequality Index | 131,832 | 0.42 |
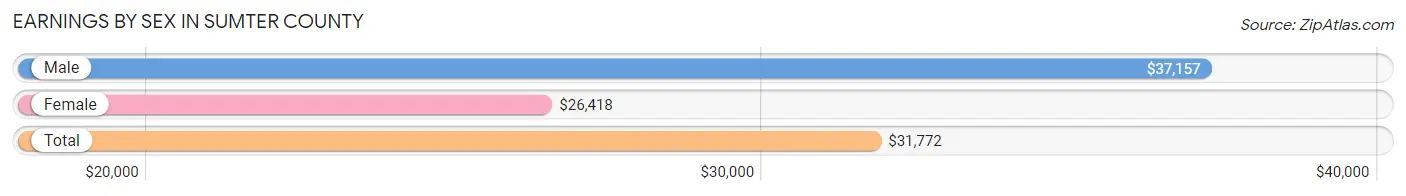
Earnings by Sex in Sumter County
Average Earnings in Sumter County are $31,772, $37,157 for men and $26,418 for women, a difference of 28.9%.
| Sex | Number | Average Earnings |
| Male | 17,565 (51.0%) | $37,157 |
| Female | 16,884 (49.0%) | $26,418 |
| Total | 34,449 (100.0%) | $31,772 |
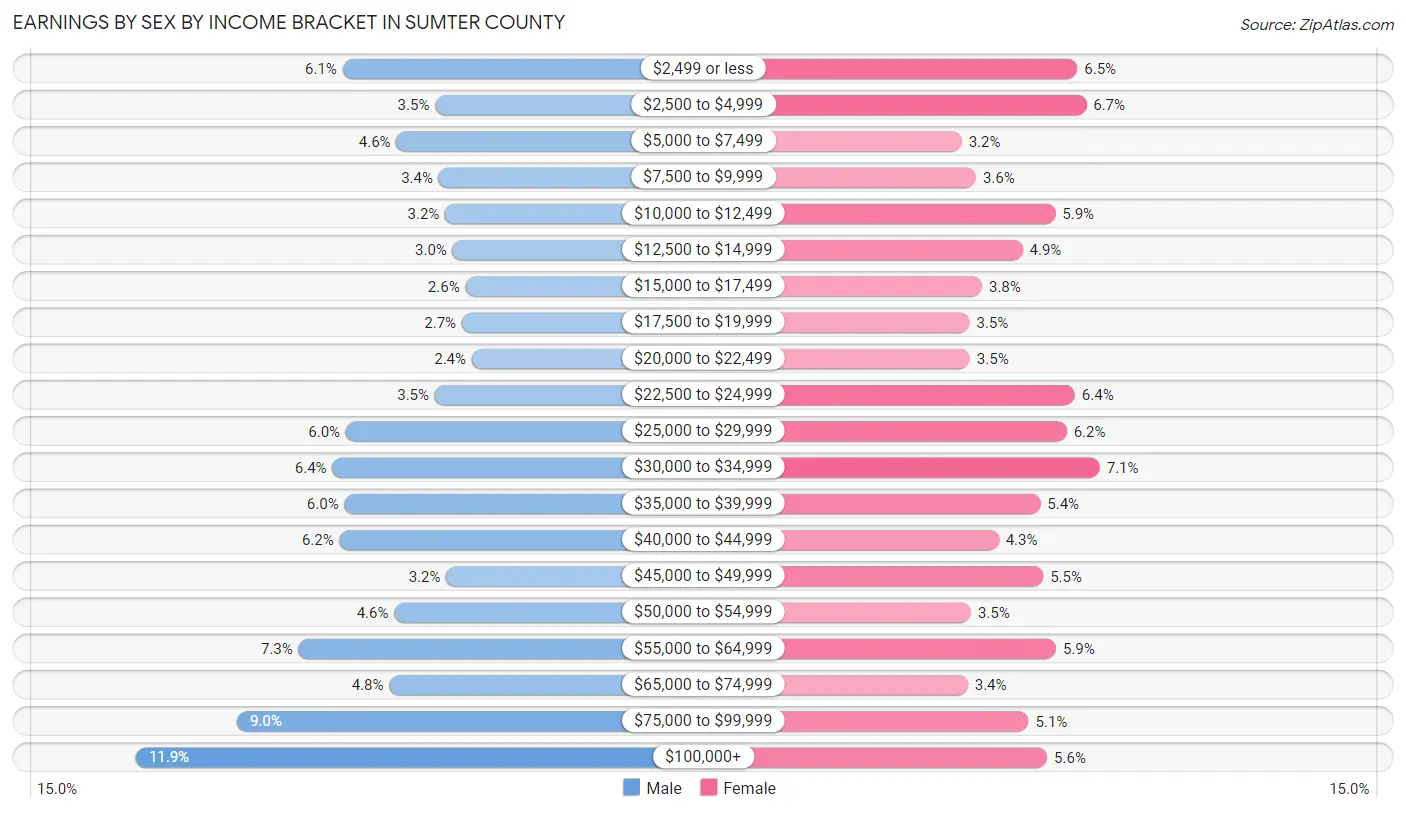
Earnings by Sex by Income Bracket in Sumter County
The most common earnings brackets in Sumter County are $100,000+ for men (2,085 | 11.9%) and $30,000 to $34,999 for women (1,201 | 7.1%).
| Income | Male | Female |
| $2,499 or less | 1,065 (6.1%) | 1,094 (6.5%) |
| $2,500 to $4,999 | 608 (3.5%) | 1,137 (6.7%) |
| $5,000 to $7,499 | 799 (4.5%) | 545 (3.2%) |
| $7,500 to $9,999 | 590 (3.4%) | 613 (3.6%) |
| $10,000 to $12,499 | 559 (3.2%) | 989 (5.9%) |
| $12,500 to $14,999 | 521 (3.0%) | 834 (4.9%) |
| $15,000 to $17,499 | 458 (2.6%) | 641 (3.8%) |
| $17,500 to $19,999 | 476 (2.7%) | 582 (3.5%) |
| $20,000 to $22,499 | 427 (2.4%) | 584 (3.5%) |
| $22,500 to $24,999 | 610 (3.5%) | 1,082 (6.4%) |
| $25,000 to $29,999 | 1,048 (6.0%) | 1,043 (6.2%) |
| $30,000 to $34,999 | 1,115 (6.4%) | 1,201 (7.1%) |
| $35,000 to $39,999 | 1,056 (6.0%) | 918 (5.4%) |
| $40,000 to $44,999 | 1,081 (6.1%) | 721 (4.3%) |
| $45,000 to $49,999 | 554 (3.2%) | 932 (5.5%) |
| $50,000 to $54,999 | 810 (4.6%) | 589 (3.5%) |
| $55,000 to $64,999 | 1,282 (7.3%) | 992 (5.9%) |
| $65,000 to $74,999 | 835 (4.8%) | 574 (3.4%) |
| $75,000 to $99,999 | 1,586 (9.0%) | 862 (5.1%) |
| $100,000+ | 2,085 (11.9%) | 951 (5.6%) |
| Total | 17,565 (100.0%) | 16,884 (100.0%) |
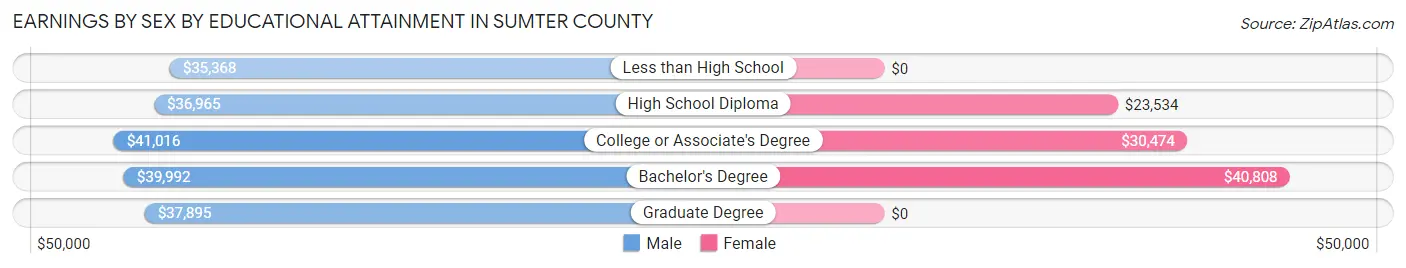
Earnings by Sex by Educational Attainment in Sumter County
Average earnings in Sumter County are $38,665 for men and $28,099 for women, a difference of 27.3%. Men with an educational attainment of college or associate's degree enjoy the highest average annual earnings of $41,016, while those with less than high school education earn the least with $35,368. Women with an educational attainment of bachelor's degree earn the most with the average annual earnings of $40,808, while those with high school diploma education have the smallest earnings of $23,534.
| Educational Attainment | Male Income | Female Income |
| Less than High School | $35,368 | $0 |
| High School Diploma | $36,965 | $23,534 |
| College or Associate's Degree | $41,016 | $30,474 |
| Bachelor's Degree | $39,992 | $40,808 |
| Graduate Degree | $37,895 | $0 |
| Total | $38,665 | $28,099 |
Family Income in Sumter County
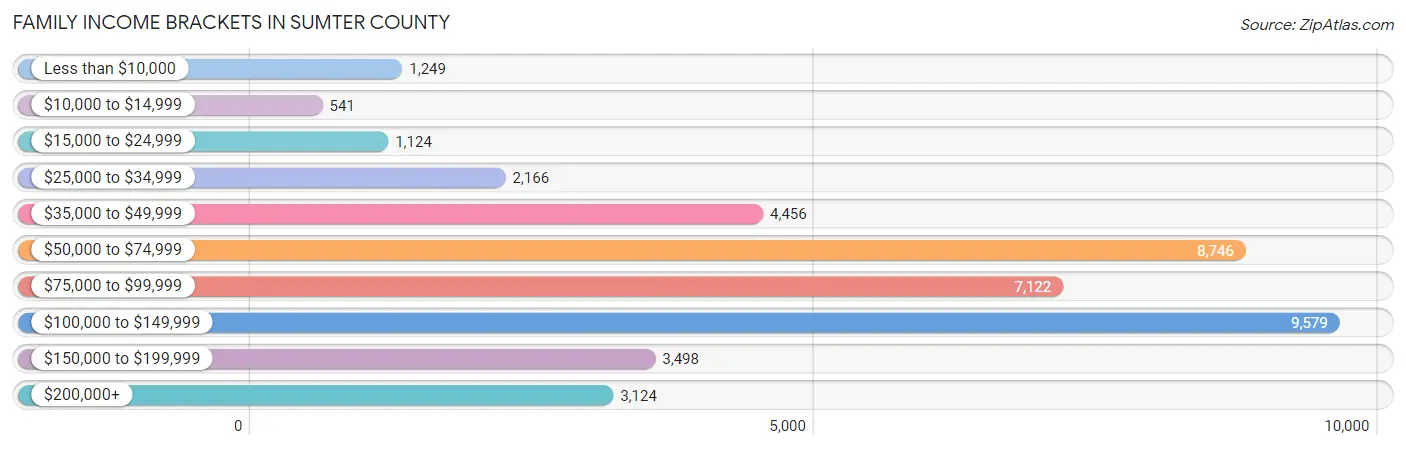
Family Income Brackets in Sumter County
According to the Sumter County family income data, there are 9,579 families falling into the $100,000 to $149,999 income range, which is the most common income bracket and makes up 23.0% of all families. Conversely, the $10,000 to $14,999 income bracket is the least frequent group with only 541 families (1.3%) belonging to this category.
| Income Bracket | # Families | % Families |
| Less than $10,000 | 1,249 | 3.0% |
| $10,000 to $14,999 | 541 | 1.3% |
| $15,000 to $24,999 | 1,124 | 2.7% |
| $25,000 to $34,999 | 2,166 | 5.2% |
| $35,000 to $49,999 | 4,456 | 10.7% |
| $50,000 to $74,999 | 8,746 | 21.0% |
| $75,000 to $99,999 | 7,122 | 17.1% |
| $100,000 to $149,999 | 9,579 | 23.0% |
| $150,000 to $199,999 | 3,498 | 8.4% |
| $200,000+ | 3,124 | 7.5% |
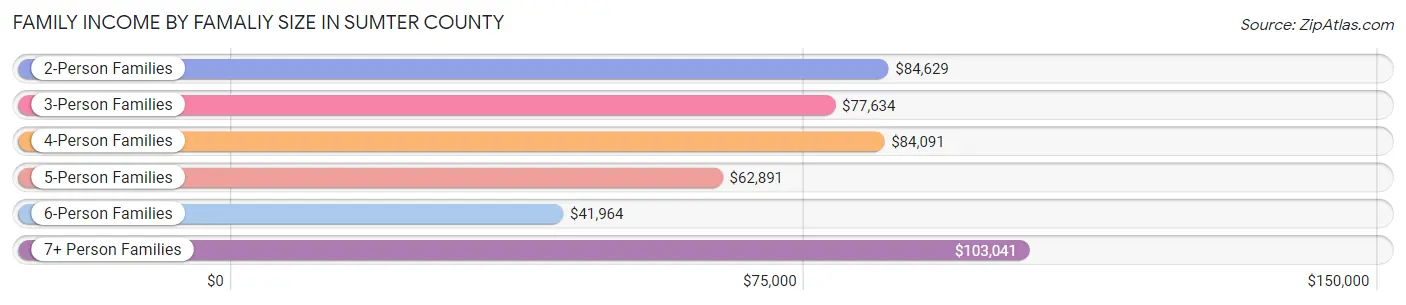
Family Income by Famaliy Size in Sumter County
7+ person families (166 | 0.4%) account for the highest median family income in Sumter County with $103,041 per family, while 2-person families (34,672 | 83.3%) have the highest median income of $42,314 per family member.
| Income Bracket | # Families | Median Income |
| 2-Person Families | 34,672 (83.3%) | $84,629 |
| 3-Person Families | 3,801 (9.1%) | $77,634 |
| 4-Person Families | 1,686 (4.1%) | $84,091 |
| 5-Person Families | 841 (2.0%) | $62,891 |
| 6-Person Families | 481 (1.1%) | $41,964 |
| 7+ Person Families | 166 (0.4%) | $103,041 |
| Total | 41,647 (100.0%) | $82,977 |
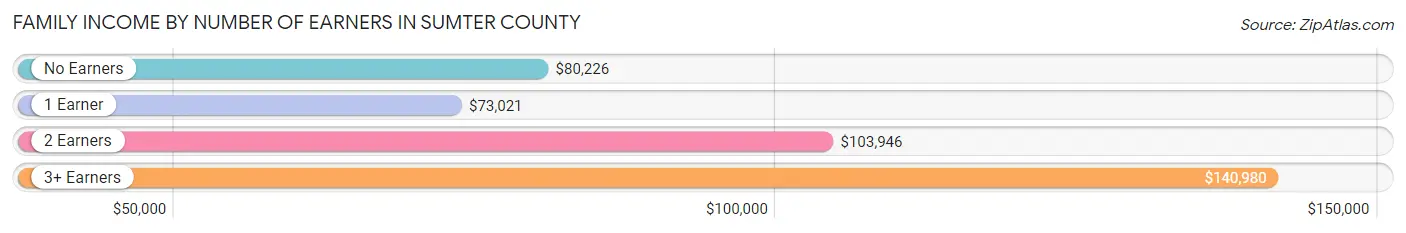
Family Income by Number of Earners in Sumter County
The median family income in Sumter County is $82,977, with families comprising 3+ earners (1,120) having the highest median family income of $140,980, while families with 1 earner (9,914) have the lowest median family income of $73,021, accounting for 2.7% and 23.8% of families, respectively.
| Number of Earners | # Families | Median Income |
| No Earners | 25,218 (60.6%) | $80,226 |
| 1 Earner | 9,914 (23.8%) | $73,021 |
| 2 Earners | 5,395 (13.0%) | $103,946 |
| 3+ Earners | 1,120 (2.7%) | $140,980 |
| Total | 41,647 (100.0%) | $82,977 |
Household Income in Sumter County
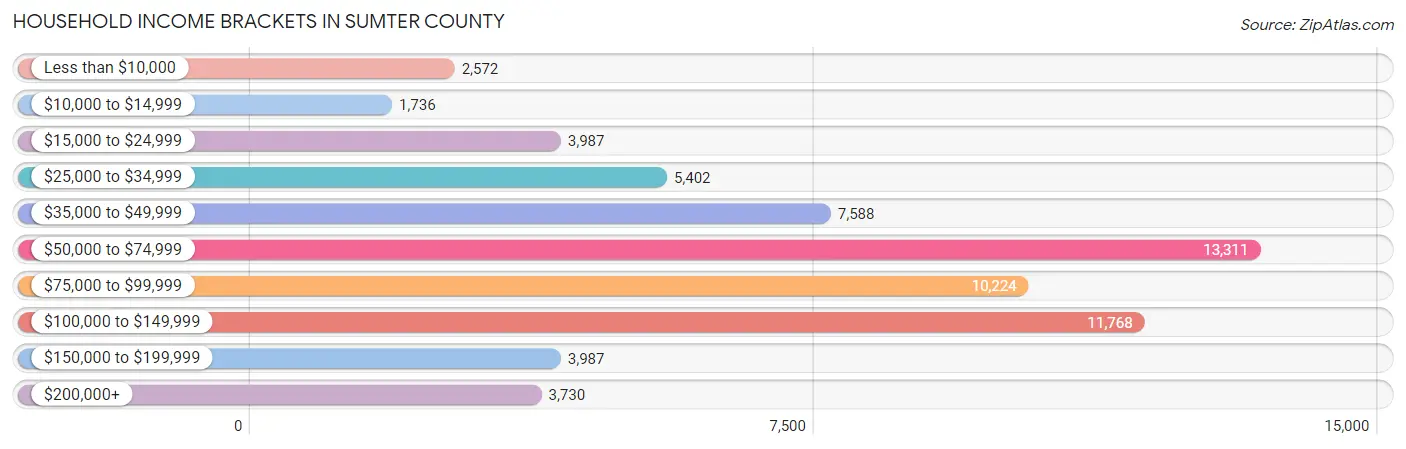
Household Income Brackets in Sumter County
With 13,311 households falling in the category, the $50,000 to $74,999 income range is the most frequent in Sumter County, accounting for 20.7% of all households. In contrast, only 1,736 households (2.7%) fall into the $10,000 to $14,999 income bracket, making it the least populous group.
| Income Bracket | # Households | % Households |
| Less than $10,000 | 2,572 | 4.0% |
| $10,000 to $14,999 | 1,736 | 2.7% |
| $15,000 to $24,999 | 3,987 | 6.2% |
| $25,000 to $34,999 | 5,402 | 8.4% |
| $35,000 to $49,999 | 7,588 | 11.8% |
| $50,000 to $74,999 | 13,311 | 20.7% |
| $75,000 to $99,999 | 10,224 | 15.9% |
| $100,000 to $149,999 | 11,768 | 18.3% |
| $150,000 to $199,999 | 3,987 | 6.2% |
| $200,000+ | 3,730 | 5.8% |
Household Income by Householder Age in Sumter County
The median household income in Sumter County is $70,105, with the highest median household income of $71,909 found in the 65+ years age bracket for the primary householder. A total of 45,927 households (71.4%) fall into this category. Meanwhile, the 15 to 24 years age bracket for the primary householder has the lowest median household income of $41,194, with 314 households (0.5%) in this group.
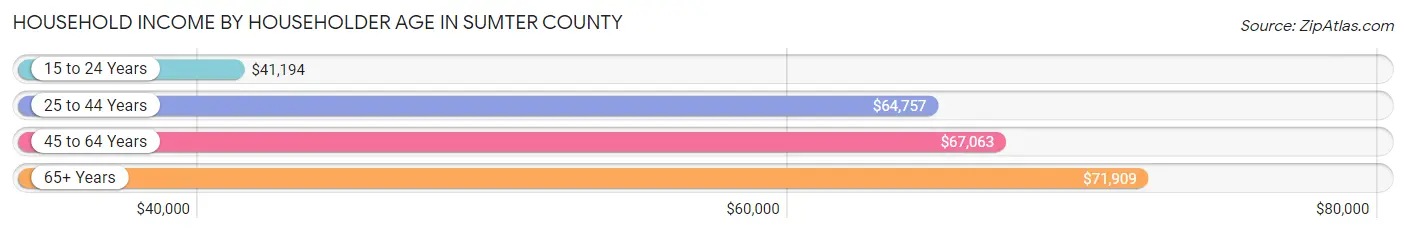
| Income Bracket | # Households | Median Income |
| 15 to 24 Years | 314 (0.5%) | $41,194 |
| 25 to 44 Years | 4,896 (7.6%) | $64,757 |
| 45 to 64 Years | 13,168 (20.5%) | $67,063 |
| 65+ Years | 45,927 (71.4%) | $71,909 |
| Total | 64,305 (100.0%) | $70,105 |
Poverty in Sumter County
Income Below Poverty by Sex and Age in Sumter County
With 7.4% poverty level for males and 10.9% for females among the residents of Sumter County, 5 year old males and under 5 year old females are the most vulnerable to poverty, with 111 males (46.6%) and 631 females (53.3%) in their respective age groups living below the poverty level.
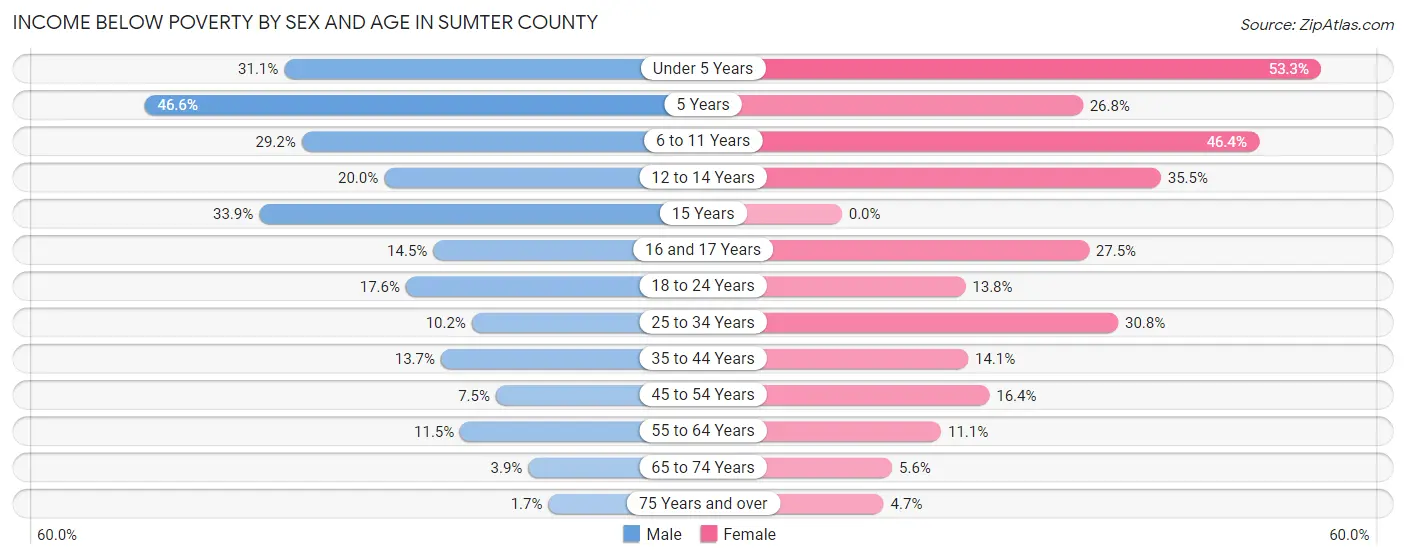
| Age Bracket | Male | Female |
| Under 5 Years | 329 (31.1%) | 631 (53.3%) |
| 5 Years | 111 (46.6%) | 55 (26.8%) |
| 6 to 11 Years | 452 (29.2%) | 833 (46.4%) |
| 12 to 14 Years | 156 (20.0%) | 291 (35.5%) |
| 15 Years | 101 (33.9%) | 0 (0.0%) |
| 16 and 17 Years | 78 (14.5%) | 139 (27.5%) |
| 18 to 24 Years | 280 (17.5%) | 233 (13.8%) |
| 25 to 34 Years | 300 (10.2%) | 801 (30.8%) |
| 35 to 44 Years | 407 (13.7%) | 403 (14.1%) |
| 45 to 54 Years | 243 (7.5%) | 577 (16.4%) |
| 55 to 64 Years | 815 (11.5%) | 1,118 (11.1%) |
| 65 to 74 Years | 721 (3.9%) | 1,282 (5.6%) |
| 75 Years and over | 291 (1.7%) | 796 (4.7%) |
| Total | 4,284 (7.4%) | 7,159 (10.9%) |
Income Above Poverty by Sex and Age in Sumter County
According to the poverty statistics in Sumter County, males aged 75 years and over and females aged 15 years are the age groups that are most secure financially, with 98.3% of males and 100.0% of females in these age groups living above the poverty line.
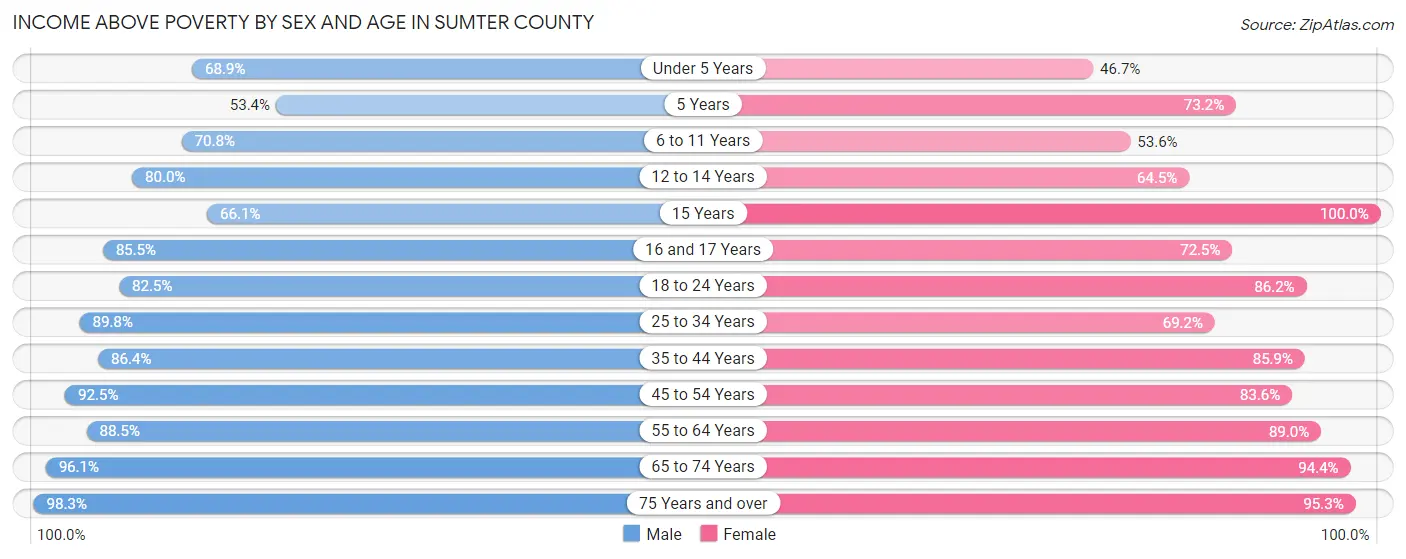
| Age Bracket | Male | Female |
| Under 5 Years | 729 (68.9%) | 552 (46.7%) |
| 5 Years | 127 (53.4%) | 150 (73.2%) |
| 6 to 11 Years | 1,098 (70.8%) | 961 (53.6%) |
| 12 to 14 Years | 625 (80.0%) | 528 (64.5%) |
| 15 Years | 197 (66.1%) | 229 (100.0%) |
| 16 and 17 Years | 460 (85.5%) | 366 (72.5%) |
| 18 to 24 Years | 1,315 (82.5%) | 1,460 (86.2%) |
| 25 to 34 Years | 2,639 (89.8%) | 1,802 (69.2%) |
| 35 to 44 Years | 2,575 (86.4%) | 2,464 (85.9%) |
| 45 to 54 Years | 2,989 (92.5%) | 2,934 (83.6%) |
| 55 to 64 Years | 6,269 (88.5%) | 9,004 (88.9%) |
| 65 to 74 Years | 17,677 (96.1%) | 21,597 (94.4%) |
| 75 Years and over | 17,058 (98.3%) | 16,297 (95.3%) |
| Total | 53,758 (92.6%) | 58,344 (89.1%) |
Income Below Poverty Among Married-Couple Families in Sumter County
The poverty statistics for married-couple families in Sumter County show that 3.5% or 1,286 of the total 37,061 families live below the poverty line. Families with 3 or 4 children have the highest poverty rate of 25.5%, comprising of 173 families. On the other hand, families with no children have the lowest poverty rate of 2.7%, which includes 938 families.
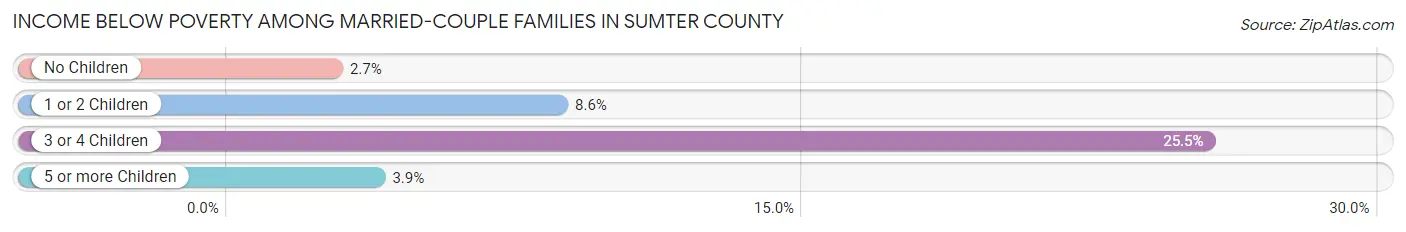
| Children | Above Poverty | Below Poverty |
| No Children | 33,343 (97.3%) | 938 (2.7%) |
| 1 or 2 Children | 1,802 (91.4%) | 170 (8.6%) |
| 3 or 4 Children | 505 (74.5%) | 173 (25.5%) |
| 5 or more Children | 125 (96.2%) | 5 (3.8%) |
| Total | 35,775 (96.5%) | 1,286 (3.5%) |
Income Below Poverty Among Single-Parent Households in Sumter County
According to the poverty data in Sumter County, 13.0% or 148 single-father households and 29.9% or 1,032 single-mother households are living below the poverty line. Among single-father households, those with 3 or 4 children have the highest poverty rate, with 35 households (45.5%) experiencing poverty. Likewise, among single-mother households, those with 5 or more children have the highest poverty rate, with 102 households (100.0%) falling below the poverty line.
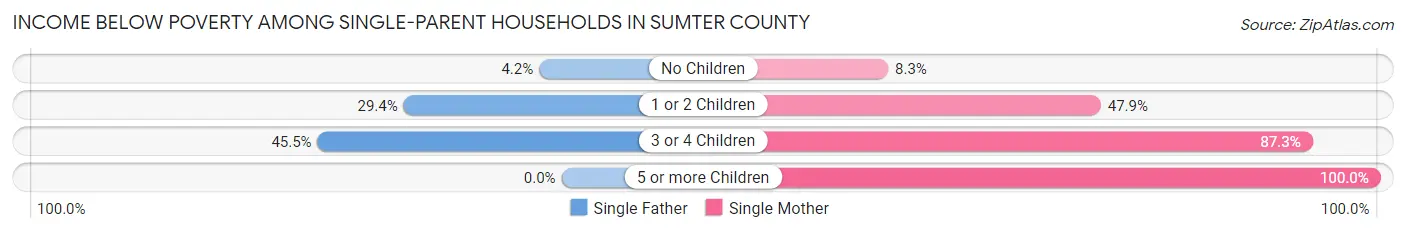
| Children | Single Father | Single Mother |
| No Children | 33 (4.2%) | 165 (8.3%) |
| 1 or 2 Children | 80 (29.4%) | 503 (47.9%) |
| 3 or 4 Children | 35 (45.5%) | 262 (87.3%) |
| 5 or more Children | 0 (0.0%) | 102 (100.0%) |
| Total | 148 (13.0%) | 1,032 (29.9%) |
Income Below Poverty Among Married-Couple vs Single-Parent Households in Sumter County
The poverty data for Sumter County shows that 1,286 of the married-couple family households (3.5%) and 1,180 of the single-parent households (25.7%) are living below the poverty level. Within the married-couple family households, those with 3 or 4 children have the highest poverty rate, with 173 households (25.5%) falling below the poverty line. Among the single-parent households, those with 5 or more children have the highest poverty rate, with 102 household (100.0%) living below poverty.
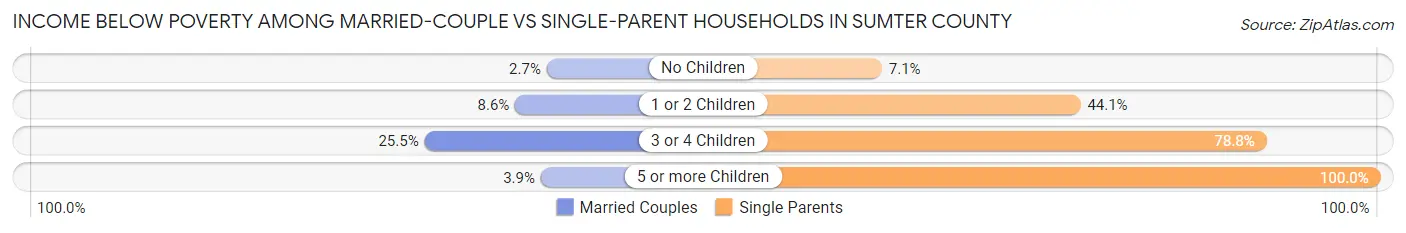
| Children | Married-Couple Families | Single-Parent Households |
| No Children | 938 (2.7%) | 198 (7.1%) |
| 1 or 2 Children | 170 (8.6%) | 583 (44.1%) |
| 3 or 4 Children | 173 (25.5%) | 297 (78.8%) |
| 5 or more Children | 5 (3.8%) | 102 (100.0%) |
| Total | 1,286 (3.5%) | 1,180 (25.7%) |
Race in Sumter County
The most populous races in Sumter County are White / Caucasian (114,749 | 87.0%), Black / African American (9,332 | 7.1%), and Hispanic or Latino (8,062 | 6.1%).
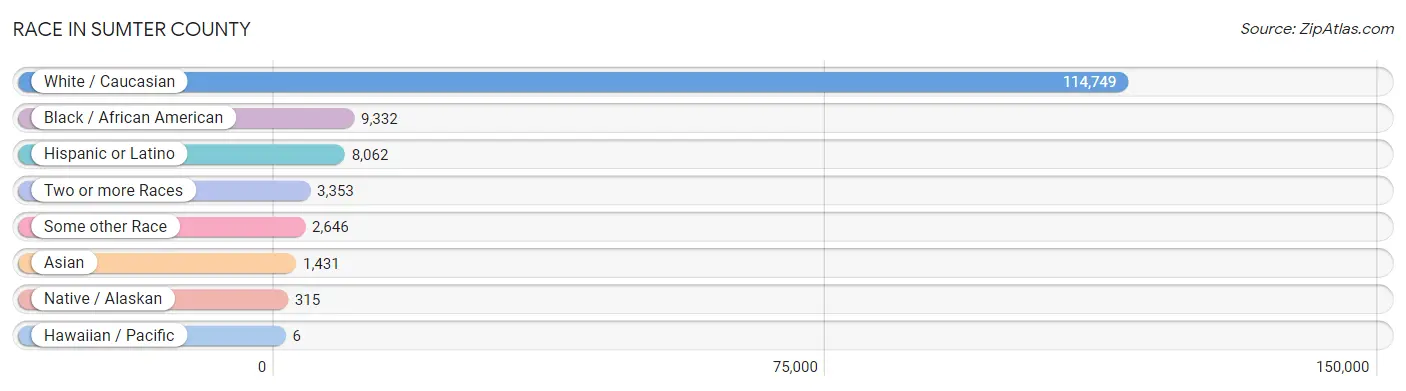
| Race | # Population | % Population |
| Asian | 1,431 | 1.1% |
| Black / African American | 9,332 | 7.1% |
| Hawaiian / Pacific | 6 | 0.0% |
| Hispanic or Latino | 8,062 | 6.1% |
| Native / Alaskan | 315 | 0.2% |
| White / Caucasian | 114,749 | 87.0% |
| Two or more Races | 3,353 | 2.5% |
| Some other Race | 2,646 | 2.0% |
| Total | 131,832 | 100.0% |
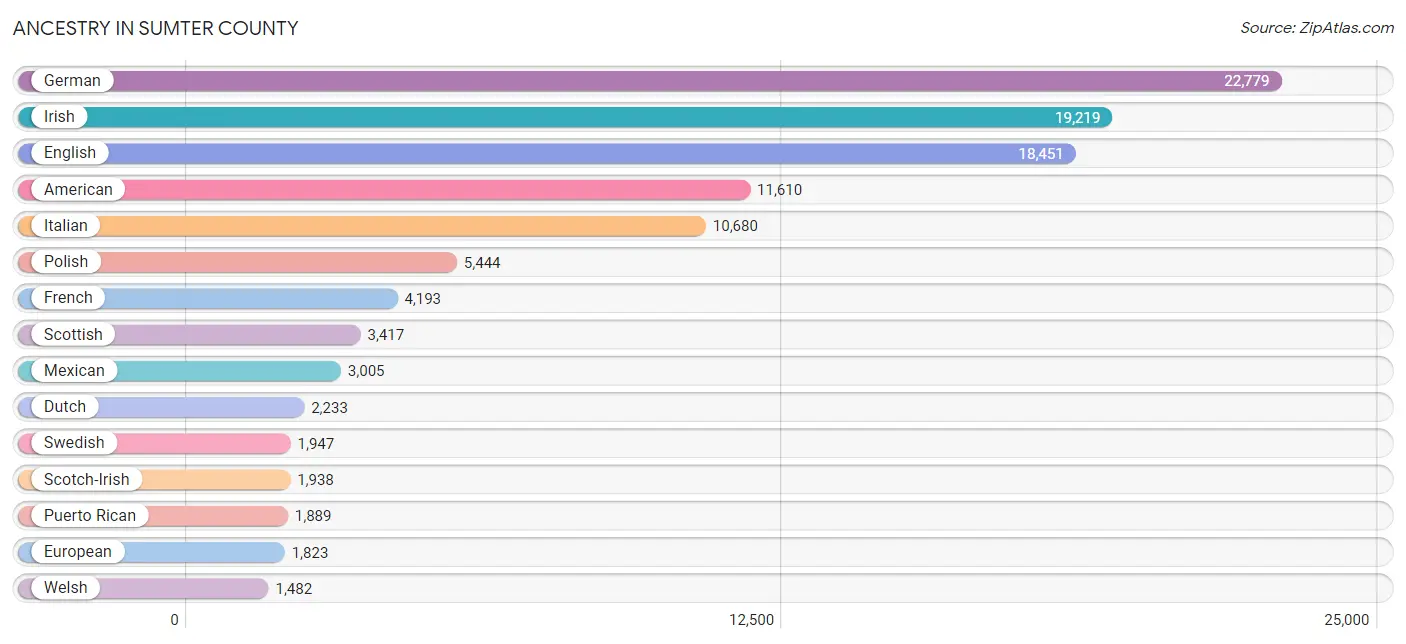
Ancestry in Sumter County
The most populous ancestries reported in Sumter County are German (22,779 | 17.3%), Irish (19,219 | 14.6%), English (18,451 | 14.0%), American (11,610 | 8.8%), and Italian (10,680 | 8.1%), together accounting for 62.8% of all Sumter County residents.
| Ancestry | # Population | % Population |
| African | 613 | 0.5% |
| Albanian | 37 | 0.0% |
| American | 11,610 | 8.8% |
| Apache | 48 | 0.0% |
| Arab | 110 | 0.1% |
| Argentinean | 10 | 0.0% |
| Armenian | 18 | 0.0% |
| Austrian | 443 | 0.3% |
| Bahamian | 705 | 0.5% |
| Belgian | 132 | 0.1% |
| Belizean | 17 | 0.0% |
| Bhutanese | 55 | 0.0% |
| Blackfeet | 104 | 0.1% |
| British | 1,083 | 0.8% |
| Bulgarian | 28 | 0.0% |
| Burmese | 130 | 0.1% |
| Cajun | 6 | 0.0% |
| Canadian | 676 | 0.5% |
| Celtic | 76 | 0.1% |
| Central American | 240 | 0.2% |
| Central American Indian | 8 | 0.0% |
| Cherokee | 249 | 0.2% |
| Choctaw | 8 | 0.0% |
| Colombian | 145 | 0.1% |
| Costa Rican | 15 | 0.0% |
| Creek | 3 | 0.0% |
| Croatian | 119 | 0.1% |
| Cuban | 919 | 0.7% |
| Czech | 203 | 0.2% |
| Czechoslovakian | 227 | 0.2% |
| Danish | 534 | 0.4% |
| Dominican | 62 | 0.1% |
| Dutch | 2,233 | 1.7% |
| Eastern European | 870 | 0.7% |
| Ecuadorian | 9 | 0.0% |
| English | 18,451 | 14.0% |
| European | 1,823 | 1.4% |
| Finnish | 285 | 0.2% |
| French | 4,193 | 3.2% |
| French Canadian | 806 | 0.6% |
| German | 22,779 | 17.3% |
| Greek | 510 | 0.4% |
| Guatemalan | 110 | 0.1% |
| Haitian | 79 | 0.1% |
| Honduran | 68 | 0.1% |
| Hungarian | 740 | 0.6% |
| Indian (Asian) | 649 | 0.5% |
| Indonesian | 44 | 0.0% |
| Iranian | 7 | 0.0% |
| Irish | 19,219 | 14.6% |
| Iroquois | 25 | 0.0% |
| Israeli | 23 | 0.0% |
| Italian | 10,680 | 8.1% |
| Jamaican | 187 | 0.1% |
| Korean | 483 | 0.4% |
| Latvian | 109 | 0.1% |
| Lebanese | 67 | 0.1% |
| Lithuanian | 342 | 0.3% |
| Lumbee | 3 | 0.0% |
| Luxembourger | 58 | 0.0% |
| Maltese | 54 | 0.0% |
| Mexican | 3,005 | 2.3% |
| Mexican American Indian | 21 | 0.0% |
| Moroccan | 8 | 0.0% |
| Nicaraguan | 12 | 0.0% |
| Nigerian | 52 | 0.0% |
| Northern European | 421 | 0.3% |
| Norwegian | 1,428 | 1.1% |
| Pakistani | 62 | 0.1% |
| Pennsylvania German | 106 | 0.1% |
| Peruvian | 313 | 0.2% |
| Polish | 5,444 | 4.1% |
| Portuguese | 403 | 0.3% |
| Potawatomi | 94 | 0.1% |
| Puerto Rican | 1,889 | 1.4% |
| Romanian | 30 | 0.0% |
| Russian | 1,114 | 0.9% |
| Salvadoran | 35 | 0.0% |
| Scandinavian | 465 | 0.4% |
| Scotch-Irish | 1,938 | 1.5% |
| Scottish | 3,417 | 2.6% |
| Serbian | 92 | 0.1% |
| Sioux | 3 | 0.0% |
| Slavic | 90 | 0.1% |
| Slovak | 482 | 0.4% |
| Slovene | 69 | 0.1% |
| South American | 611 | 0.5% |
| Spaniard | 60 | 0.1% |
| Spanish | 130 | 0.1% |
| Sri Lankan | 88 | 0.1% |
| Subsaharan African | 676 | 0.5% |
| Swedish | 1,947 | 1.5% |
| Swiss | 371 | 0.3% |
| Syrian | 35 | 0.0% |
| Thai | 28 | 0.0% |
| Trinidadian and Tobagonian | 70 | 0.1% |
| Ukrainian | 688 | 0.5% |
| Venezuelan | 134 | 0.1% |
| Welsh | 1,482 | 1.1% |
| West Indian | 8 | 0.0% |
| Yugoslavian | 31 | 0.0% | View All 101 Rows |
Immigrants in Sumter County
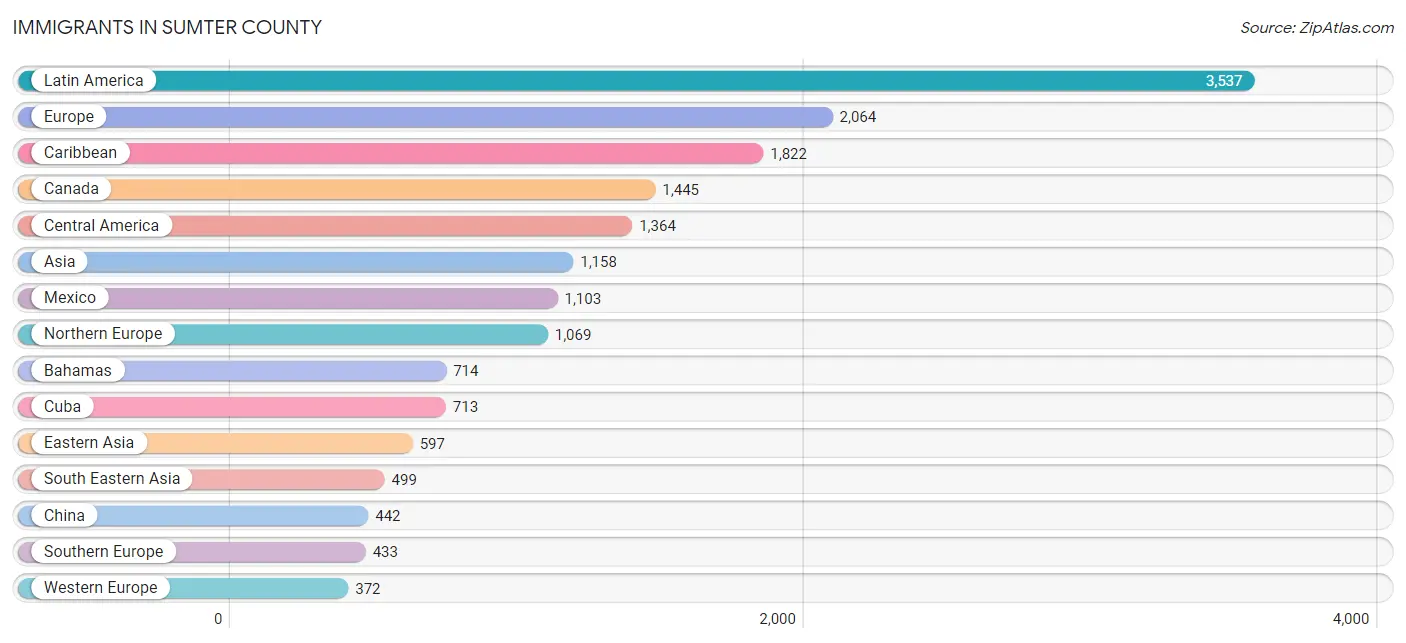
The most numerous immigrant groups reported in Sumter County came from Latin America (3,537 | 2.7%), Europe (2,064 | 1.6%), Caribbean (1,822 | 1.4%), Canada (1,445 | 1.1%), and Central America (1,364 | 1.0%), together accounting for 7.8% of all Sumter County residents.
| Immigration Origin | # Population | % Population |
| Africa | 22 | 0.0% |
| Argentina | 10 | 0.0% |
| Asia | 1,158 | 0.9% |
| Australia | 15 | 0.0% |
| Austria | 57 | 0.0% |
| Bahamas | 714 | 0.5% |
| Belize | 55 | 0.0% |
| Brazil | 17 | 0.0% |
| Canada | 1,445 | 1.1% |
| Caribbean | 1,822 | 1.4% |
| Central America | 1,364 | 1.0% |
| China | 442 | 0.3% |
| Colombia | 129 | 0.1% |
| Costa Rica | 22 | 0.0% |
| Cuba | 713 | 0.5% |
| Czechoslovakia | 53 | 0.0% |
| Denmark | 48 | 0.0% |
| Dominican Republic | 41 | 0.0% |
| Eastern Asia | 597 | 0.4% |
| Eastern Europe | 190 | 0.1% |
| Ecuador | 37 | 0.0% |
| El Salvador | 39 | 0.0% |
| England | 266 | 0.2% |
| Europe | 2,064 | 1.6% |
| Germany | 213 | 0.2% |
| Greece | 52 | 0.0% |
| Guatemala | 30 | 0.0% |
| Guyana | 18 | 0.0% |
| Haiti | 66 | 0.1% |
| Honduras | 93 | 0.1% |
| Hong Kong | 53 | 0.0% |
| Hungary | 4 | 0.0% |
| India | 28 | 0.0% |
| Ireland | 57 | 0.0% |
| Israel | 14 | 0.0% |
| Italy | 286 | 0.2% |
| Jamaica | 194 | 0.2% |
| Japan | 67 | 0.1% |
| Korea | 88 | 0.1% |
| Latin America | 3,537 | 2.7% |
| Lebanon | 12 | 0.0% |
| Lithuania | 34 | 0.0% |
| Mexico | 1,103 | 0.8% |
| Netherlands | 80 | 0.1% |
| Nicaragua | 12 | 0.0% |
| Northern Europe | 1,069 | 0.8% |
| Norway | 32 | 0.0% |
| Oceania | 24 | 0.0% |
| Pakistan | 8 | 0.0% |
| Panama | 10 | 0.0% |
| Peru | 137 | 0.1% |
| Philippines | 364 | 0.3% |
| Portugal | 41 | 0.0% |
| Romania | 15 | 0.0% |
| Russia | 38 | 0.0% |
| Scotland | 11 | 0.0% |
| Serbia | 17 | 0.0% |
| South Africa | 22 | 0.0% |
| South America | 351 | 0.3% |
| South Central Asia | 36 | 0.0% |
| South Eastern Asia | 499 | 0.4% |
| Southern Europe | 433 | 0.3% |
| St. Vincent and the Grenadines | 9 | 0.0% |
| Sweden | 47 | 0.0% |
| Switzerland | 22 | 0.0% |
| Taiwan | 99 | 0.1% |
| Thailand | 62 | 0.1% |
| Trinidad and Tobago | 85 | 0.1% |
| Ukraine | 29 | 0.0% |
| Venezuela | 3 | 0.0% |
| Vietnam | 49 | 0.0% |
| Western Asia | 26 | 0.0% |
| Western Europe | 372 | 0.3% | View All 73 Rows |
Sex and Age in Sumter County
Sex and Age in Sumter County
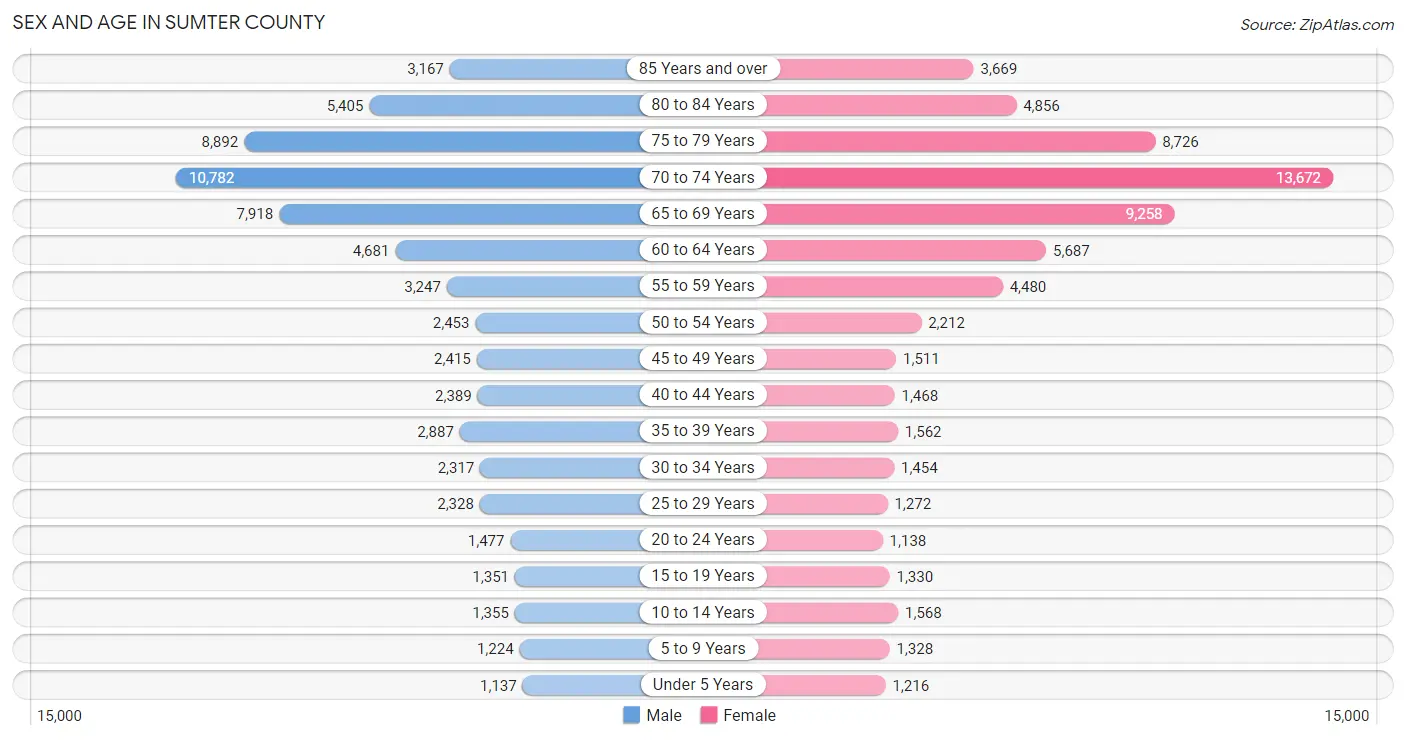
The most populous age groups in Sumter County are 70 to 74 Years (10,782 | 16.5%) for men and 70 to 74 Years (13,672 | 20.6%) for women.
| Age Bracket | Male | Female |
| Under 5 Years | 1,137 (1.7%) | 1,216 (1.8%) |
| 5 to 9 Years | 1,224 (1.9%) | 1,328 (2.0%) |
| 10 to 14 Years | 1,355 (2.1%) | 1,568 (2.4%) |
| 15 to 19 Years | 1,351 (2.1%) | 1,330 (2.0%) |
| 20 to 24 Years | 1,477 (2.3%) | 1,138 (1.7%) |
| 25 to 29 Years | 2,328 (3.6%) | 1,272 (1.9%) |
| 30 to 34 Years | 2,317 (3.5%) | 1,454 (2.2%) |
| 35 to 39 Years | 2,887 (4.4%) | 1,562 (2.4%) |
| 40 to 44 Years | 2,389 (3.6%) | 1,468 (2.2%) |
| 45 to 49 Years | 2,415 (3.7%) | 1,511 (2.3%) |
| 50 to 54 Years | 2,453 (3.7%) | 2,212 (3.3%) |
| 55 to 59 Years | 3,247 (5.0%) | 4,480 (6.8%) |
| 60 to 64 Years | 4,681 (7.1%) | 5,687 (8.6%) |
| 65 to 69 Years | 7,918 (12.1%) | 9,258 (13.9%) |
| 70 to 74 Years | 10,782 (16.5%) | 13,672 (20.6%) |
| 75 to 79 Years | 8,892 (13.6%) | 8,726 (13.1%) |
| 80 to 84 Years | 5,405 (8.3%) | 4,856 (7.3%) |
| 85 Years and over | 3,167 (4.8%) | 3,669 (5.5%) |
| Total | 65,425 (100.0%) | 66,407 (100.0%) |
Families and Households in Sumter County
Median Family Size in Sumter County
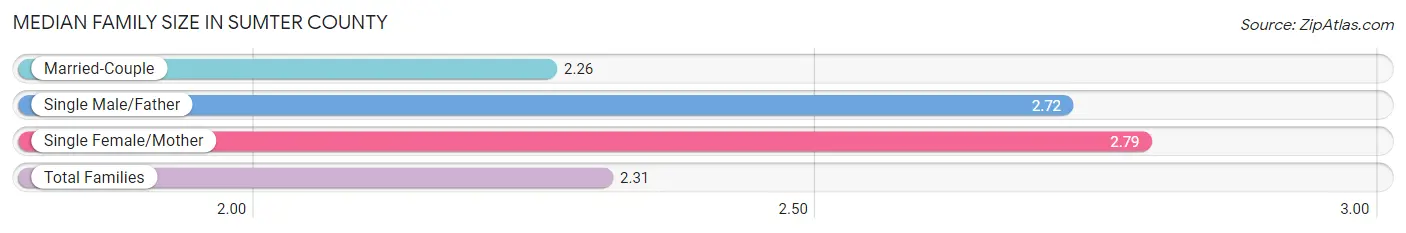
The median family size in Sumter County is 2.31 persons per family, with single female/mother families (3,446 | 8.3%) accounting for the largest median family size of 2.79 persons per family. On the other hand, married-couple families (37,061 | 89.0%) represent the smallest median family size with 2.26 persons per family.
| Family Type | # Families | Family Size |
| Married-Couple | 37,061 (89.0%) | 2.26 |
| Single Male/Father | 1,140 (2.7%) | 2.72 |
| Single Female/Mother | 3,446 (8.3%) | 2.79 |
| Total Families | 41,647 (100.0%) | 2.31 |
Median Household Size in Sumter County
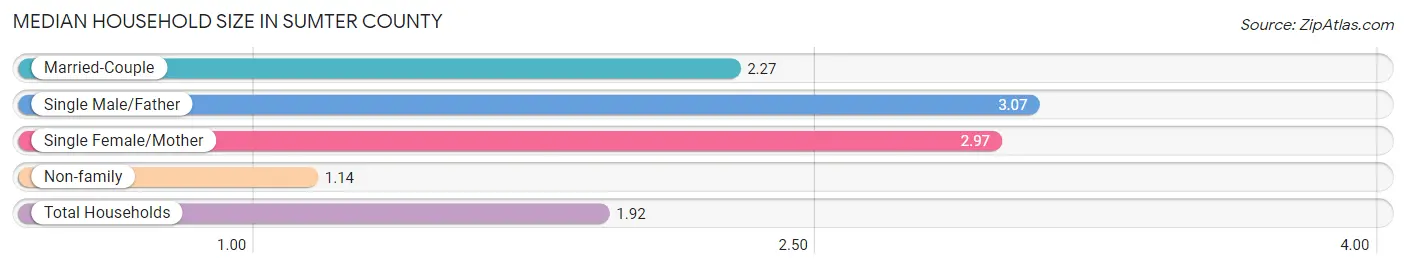
The median household size in Sumter County is 1.92 persons per household, with single male/father households (1,140 | 1.8%) accounting for the largest median household size of 3.07 persons per household. non-family households (22,658 | 35.2%) represent the smallest median household size with 1.14 persons per household.
| Household Type | # Households | Household Size |
| Married-Couple | 37,061 (57.6%) | 2.27 |
| Single Male/Father | 1,140 (1.8%) | 3.07 |
| Single Female/Mother | 3,446 (5.4%) | 2.97 |
| Non-family | 22,658 (35.2%) | 1.14 |
| Total Households | 64,305 (100.0%) | 1.92 |
Household Size by Marriage Status in Sumter County
Out of a total of 64,305 households in Sumter County, 41,647 (64.8%) are family households, while 22,658 (35.2%) are nonfamily households. The most numerous type of family households are 2-person households, comprising 34,173, and the most common type of nonfamily households are 1-person households, comprising 19,578.
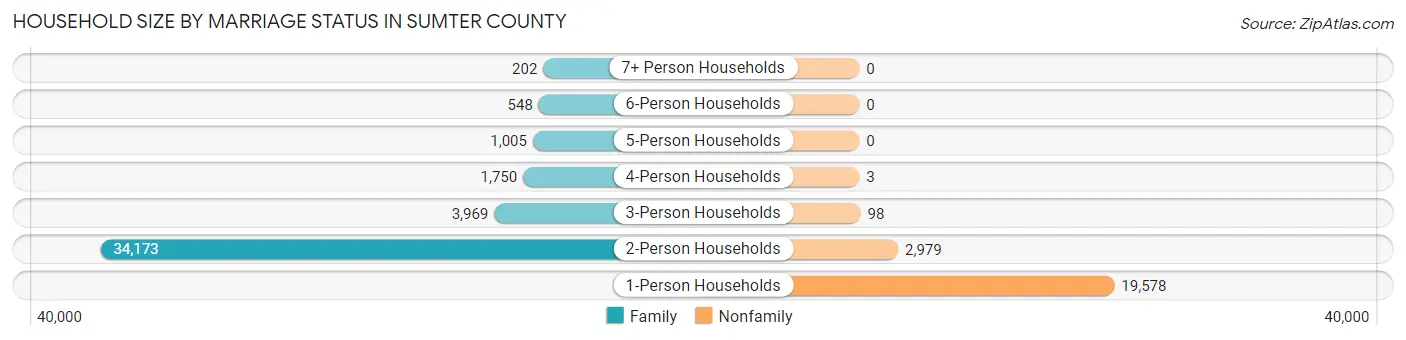
| Household Size | Family Households | Nonfamily Households |
| 1-Person Households | - | 19,578 (30.4%) |
| 2-Person Households | 34,173 (53.1%) | 2,979 (4.6%) |
| 3-Person Households | 3,969 (6.2%) | 98 (0.2%) |
| 4-Person Households | 1,750 (2.7%) | 3 (0.0%) |
| 5-Person Households | 1,005 (1.6%) | 0 (0.0%) |
| 6-Person Households | 548 (0.9%) | 0 (0.0%) |
| 7+ Person Households | 202 (0.3%) | 0 (0.0%) |
| Total | 41,647 (64.8%) | 22,658 (35.2%) |
Female Fertility in Sumter County
Fertility by Age in Sumter County
Average fertility rate in Sumter County is 64.0 births per 1,000 women. Women in the age bracket of 20 to 34 years have the highest fertility rate with 125.0 births per 1,000 women. Women in the age bracket of 20 to 34 years acount for 73.7% of all women with births.
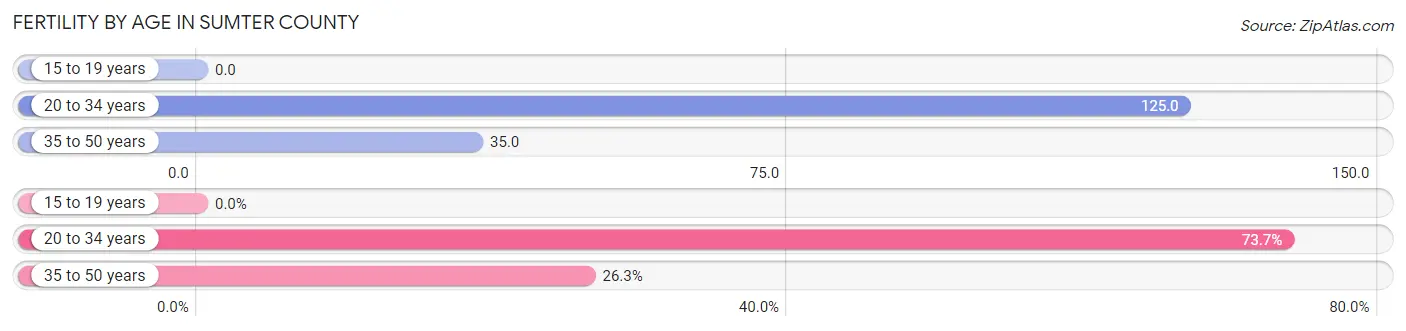
| Age Bracket | Women with Births | Births / 1,000 Women |
| 15 to 19 years | 0 (0.0%) | 0.0 |
| 20 to 34 years | 482 (73.7%) | 125.0 |
| 35 to 50 years | 172 (26.3%) | 35.0 |
| Total | 654 (100.0%) | 64.0 |
Fertility by Age by Marriage Status in Sumter County
71.1% of women with births (654) in Sumter County are married. The highest percentage of unmarried women with births falls into 20 to 34 years age bracket with 30.3% of them unmarried at the time of birth, while the lowest percentage of unmarried women with births belong to 35 to 50 years age bracket with 25.0% of them unmarried.
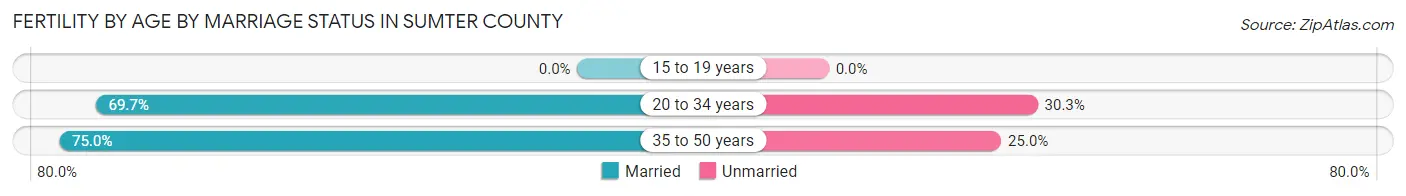
| Age Bracket | Married | Unmarried |
| 15 to 19 years | 0 (0.0%) | 0 (0.0%) |
| 20 to 34 years | 336 (69.7%) | 146 (30.3%) |
| 35 to 50 years | 129 (75.0%) | 43 (25.0%) |
| Total | 465 (71.1%) | 189 (28.9%) |
Fertility by Education in Sumter County
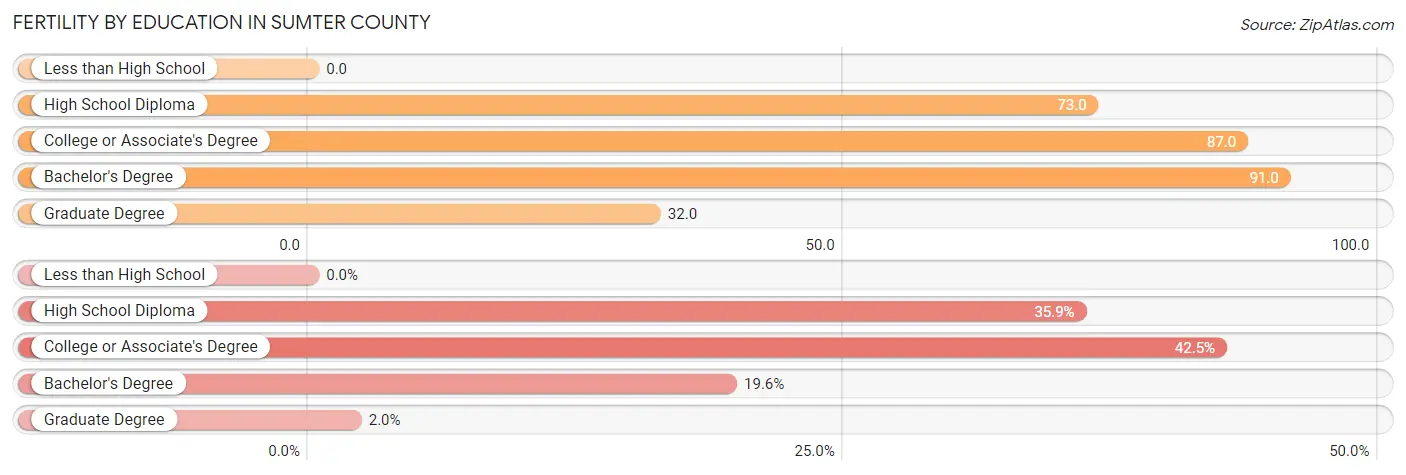
| Educational Attainment | Women with Births | Births / 1,000 Women |
| Less than High School | 0 (0.0%) | 0.0 |
| High School Diploma | 235 (35.9%) | 73.0 |
| College or Associate's Degree | 278 (42.5%) | 87.0 |
| Bachelor's Degree | 128 (19.6%) | 91.0 |
| Graduate Degree | 13 (2.0%) | 32.0 |
| Total | 654 (100.0%) | 64.0 |
Fertility by Education by Marriage Status in Sumter County
28.9% of women with births in Sumter County are unmarried. Women with the educational attainment of bachelor's degree are most likely to be married with 100.0% of them married at childbirth, while women with the educational attainment of graduate degree are least likely to be married with 100.0% of them unmarried at childbirth.
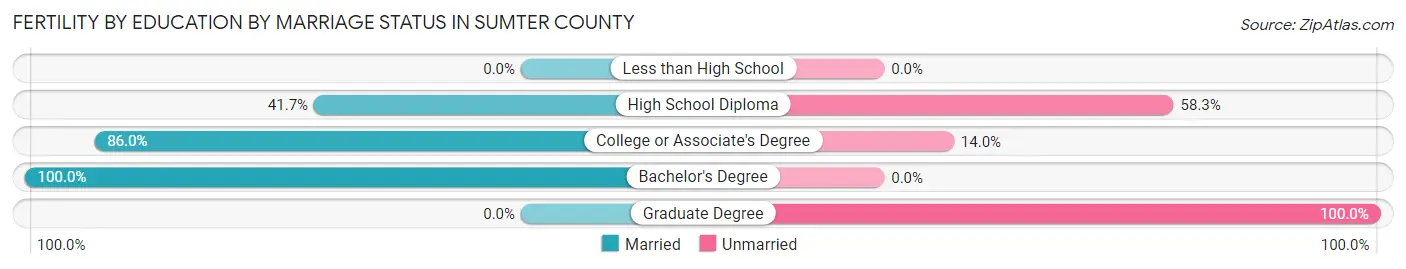
| Educational Attainment | Married | Unmarried |
| Less than High School | 0 (0.0%) | 0 (0.0%) |
| High School Diploma | 98 (41.7%) | 137 (58.3%) |
| College or Associate's Degree | 239 (86.0%) | 39 (14.0%) |
| Bachelor's Degree | 128 (100.0%) | 0 (0.0%) |
| Graduate Degree | 0 (0.0%) | 13 (100.0%) |
| Total | 465 (71.1%) | 189 (28.9%) |
Employment Characteristics in Sumter County
Employment by Class of Employer in Sumter County
Among the 27,879 employed individuals in Sumter County, private company employees (19,892 | 71.4%), not-for-profit organizations (1,892 | 6.8%), and local government employees (1,720 | 6.2%) make up the most common classes of employment.
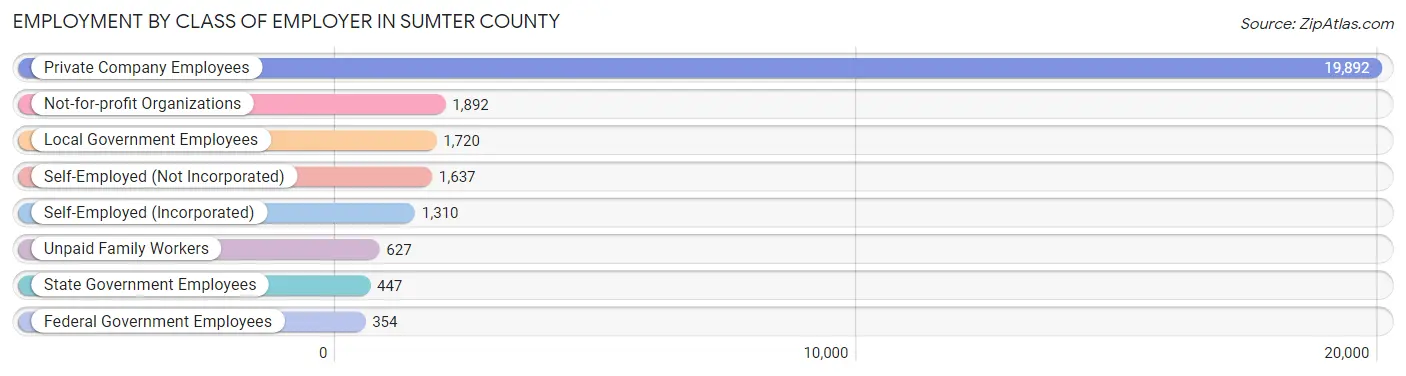
| Employer Class | # Employees | % Employees |
| Private Company Employees | 19,892 | 71.4% |
| Self-Employed (Incorporated) | 1,310 | 4.7% |
| Self-Employed (Not Incorporated) | 1,637 | 5.9% |
| Not-for-profit Organizations | 1,892 | 6.8% |
| Local Government Employees | 1,720 | 6.2% |
| State Government Employees | 447 | 1.6% |
| Federal Government Employees | 354 | 1.3% |
| Unpaid Family Workers | 627 | 2.2% |
| Total | 27,879 | 100.0% |
Employment Status by Age in Sumter County
According to the labor force statistics for Sumter County, out of the total population over 16 years of age (123,477), 24.5% or 30,252 individuals are in the labor force, with 5.1% or 1,543 of them unemployed. The age group with the highest labor force participation rate is 20 to 24 years, with 71.9% or 1,880 individuals in the labor force. Within the labor force, the 16 to 19 years age range has the highest percentage of unemployed individuals, with 12.7% or 103 of them being unemployed.
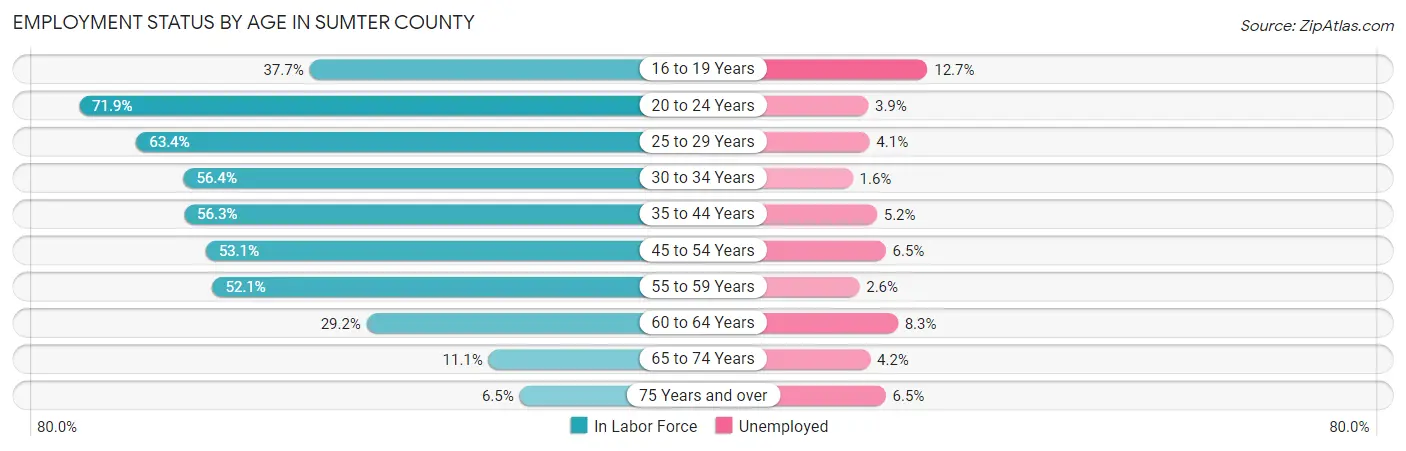
| Age Bracket | In Labor Force | Unemployed |
| 16 to 19 Years | 812 (37.7%) | 103 (12.7%) |
| 20 to 24 Years | 1,880 (71.9%) | 73 (3.9%) |
| 25 to 29 Years | 2,282 (63.4%) | 94 (4.1%) |
| 30 to 34 Years | 2,127 (56.4%) | 34 (1.6%) |
| 35 to 44 Years | 4,676 (56.3%) | 243 (5.2%) |
| 45 to 54 Years | 4,562 (53.1%) | 297 (6.5%) |
| 55 to 59 Years | 4,026 (52.1%) | 105 (2.6%) |
| 60 to 64 Years | 3,027 (29.2%) | 251 (8.3%) |
| 65 to 74 Years | 4,621 (11.1%) | 194 (4.2%) |
| 75 Years and over | 2,256 (6.5%) | 147 (6.5%) |
| Total | 30,252 (24.5%) | 1,543 (5.1%) |
Employment Status by Educational Attainment in Sumter County
According to labor force statistics for Sumter County, 48.9% of individuals (20,716) out of the total population between 25 and 64 years of age (42,363) are in the labor force, with 5.0% or 1,036 of them being unemployed. The group with the highest labor force participation rate are those with the educational attainment of bachelor's degree or higher, with 52.5% or 4,934 individuals in the labor force. Within the labor force, individuals with high school diploma education have the highest percentage of unemployment, with 6.8% or 499 of them being unemployed.
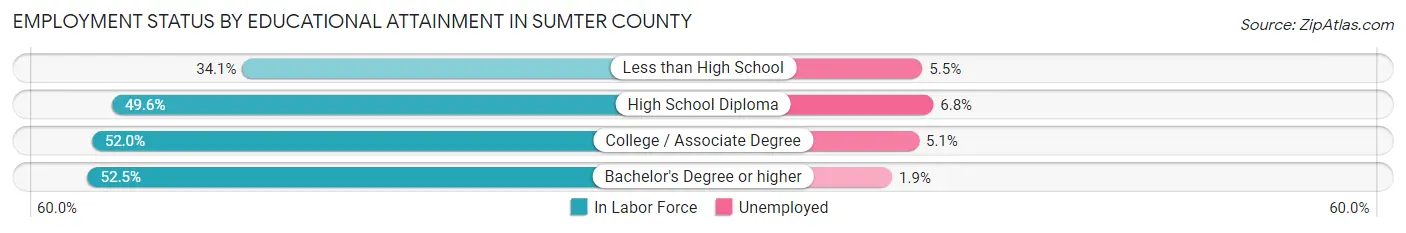
| Educational Attainment | In Labor Force | Unemployed |
| Less than High School | 1,937 (34.1%) | 312 (5.5%) |
| High School Diploma | 7,343 (49.6%) | 1,007 (6.8%) |
| College / Associate Degree | 6,490 (52.0%) | 636 (5.1%) |
| Bachelor's Degree or higher | 4,934 (52.5%) | 179 (1.9%) |
| Total | 20,716 (48.9%) | 2,118 (5.0%) |
Employment Occupations by Sex in Sumter County
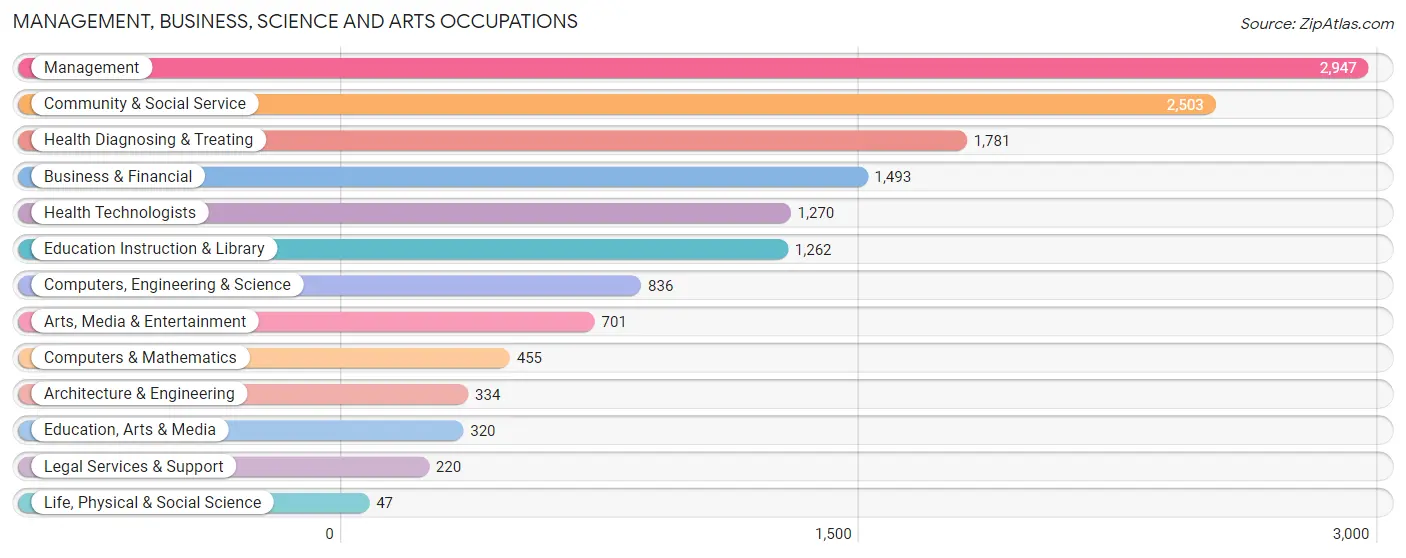
Management, Business, Science and Arts Occupations
The most common Management, Business, Science and Arts occupations in Sumter County are Management (2,947 | 10.3%), Community & Social Service (2,503 | 8.7%), Health Diagnosing & Treating (1,781 | 6.2%), Business & Financial (1,493 | 5.2%), and Health Technologists (1,270 | 4.4%).
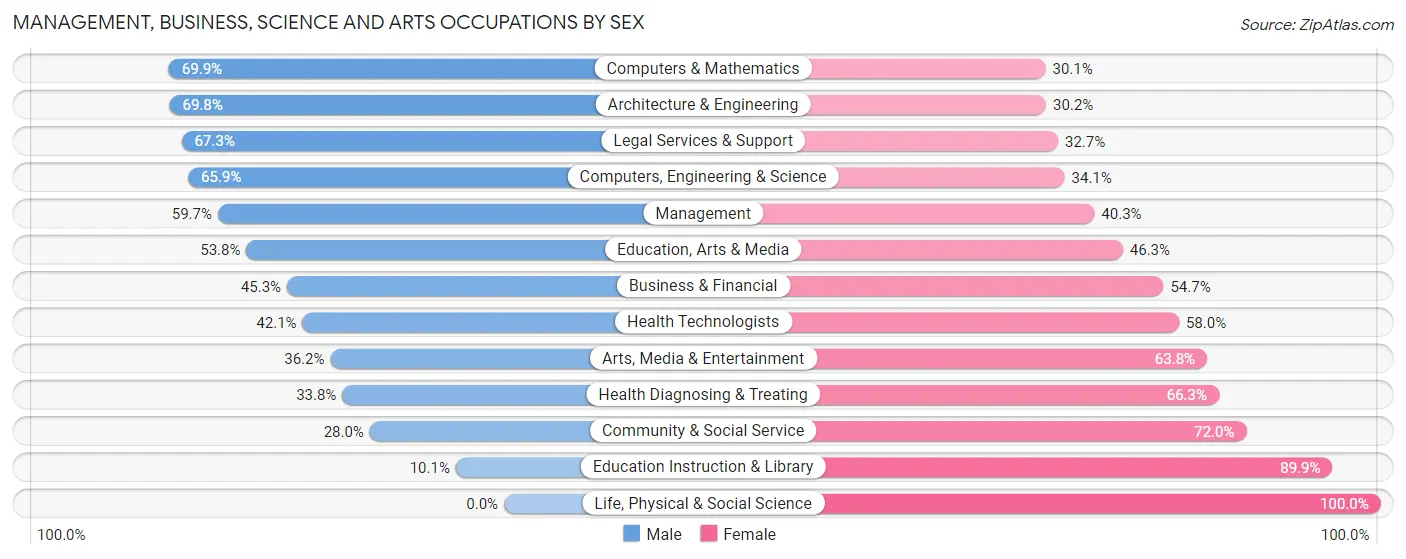
Management, Business, Science and Arts Occupations by Sex
Within the Management, Business, Science and Arts occupations in Sumter County, the most male-oriented occupations are Computers & Mathematics (69.9%), Architecture & Engineering (69.8%), and Legal Services & Support (67.3%), while the most female-oriented occupations are Life, Physical & Social Science (100.0%), Education Instruction & Library (89.9%), and Community & Social Service (72.0%).
| Occupation | Male | Female |
| Management | 1,759 (59.7%) | 1,188 (40.3%) |
| Business & Financial | 676 (45.3%) | 817 (54.7%) |
| Computers, Engineering & Science | 551 (65.9%) | 285 (34.1%) |
| Computers & Mathematics | 318 (69.9%) | 137 (30.1%) |
| Architecture & Engineering | 233 (69.8%) | 101 (30.2%) |
| Life, Physical & Social Science | 0 (0.0%) | 47 (100.0%) |
| Community & Social Service | 701 (28.0%) | 1,802 (72.0%) |
| Education, Arts & Media | 172 (53.7%) | 148 (46.3%) |
| Legal Services & Support | 148 (67.3%) | 72 (32.7%) |
| Education Instruction & Library | 127 (10.1%) | 1,135 (89.9%) |
| Arts, Media & Entertainment | 254 (36.2%) | 447 (63.8%) |
| Health Diagnosing & Treating | 601 (33.8%) | 1,180 (66.2%) |
| Health Technologists | 534 (42.0%) | 736 (58.0%) |
| Total (Category) | 4,288 (44.9%) | 5,272 (55.1%) |
| Total (Overall) | 14,568 (50.8%) | 14,090 (49.2%) |
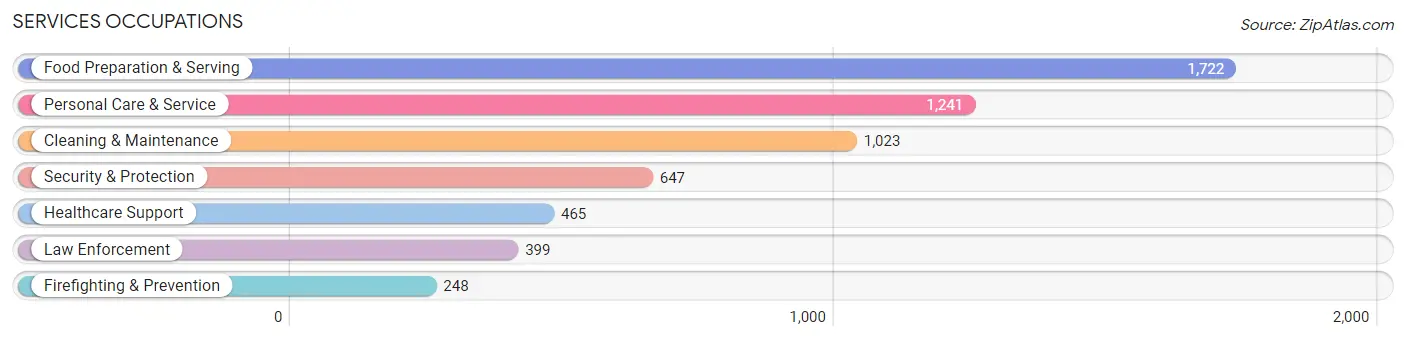
Services Occupations
The most common Services occupations in Sumter County are Food Preparation & Serving (1,722 | 6.0%), Personal Care & Service (1,241 | 4.3%), Cleaning & Maintenance (1,023 | 3.6%), Security & Protection (647 | 2.3%), and Healthcare Support (465 | 1.6%).
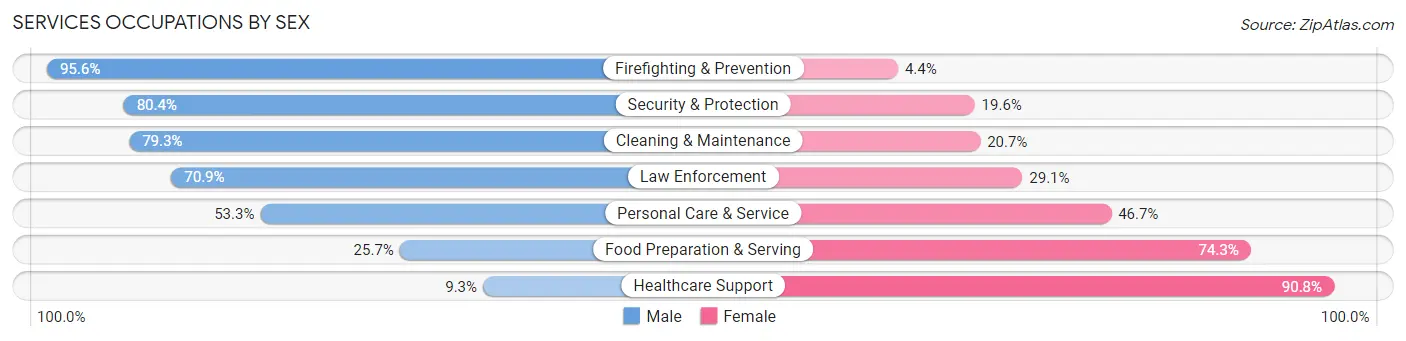
Services Occupations by Sex
Within the Services occupations in Sumter County, the most male-oriented occupations are Firefighting & Prevention (95.6%), Security & Protection (80.4%), and Cleaning & Maintenance (79.3%), while the most female-oriented occupations are Healthcare Support (90.7%), Food Preparation & Serving (74.3%), and Personal Care & Service (46.7%).
| Occupation | Male | Female |
| Healthcare Support | 43 (9.2%) | 422 (90.7%) |
| Security & Protection | 520 (80.4%) | 127 (19.6%) |
| Firefighting & Prevention | 237 (95.6%) | 11 (4.4%) |
| Law Enforcement | 283 (70.9%) | 116 (29.1%) |
| Food Preparation & Serving | 443 (25.7%) | 1,279 (74.3%) |
| Cleaning & Maintenance | 811 (79.3%) | 212 (20.7%) |
| Personal Care & Service | 662 (53.3%) | 579 (46.7%) |
| Total (Category) | 2,479 (48.6%) | 2,619 (51.4%) |
| Total (Overall) | 14,568 (50.8%) | 14,090 (49.2%) |
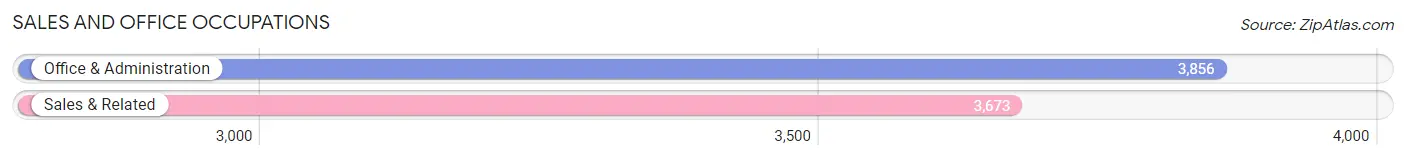
Sales and Office Occupations
The most common Sales and Office occupations in Sumter County are Office & Administration (3,856 | 13.5%), and Sales & Related (3,673 | 12.8%).
Sales and Office Occupations by Sex
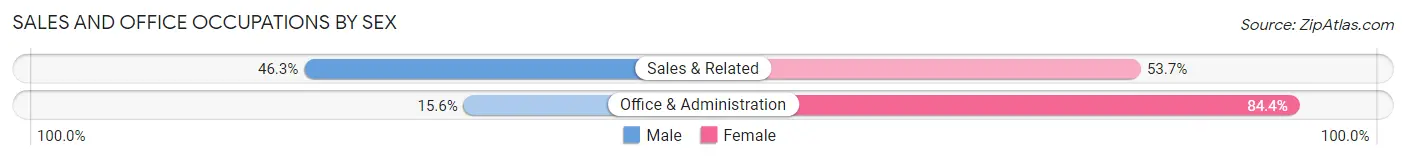
| Occupation | Male | Female |
| Sales & Related | 1,699 (46.3%) | 1,974 (53.7%) |
| Office & Administration | 601 (15.6%) | 3,255 (84.4%) |
| Total (Category) | 2,300 (30.5%) | 5,229 (69.5%) |
| Total (Overall) | 14,568 (50.8%) | 14,090 (49.2%) |
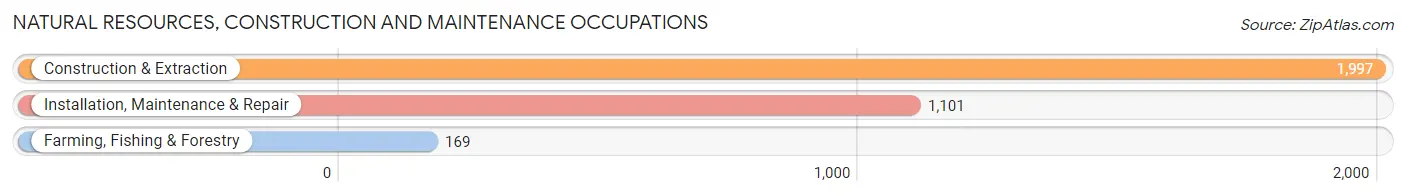
Natural Resources, Construction and Maintenance Occupations
The most common Natural Resources, Construction and Maintenance occupations in Sumter County are Construction & Extraction (1,997 | 7.0%), Installation, Maintenance & Repair (1,101 | 3.8%), and Farming, Fishing & Forestry (169 | 0.6%).
Natural Resources, Construction and Maintenance Occupations by Sex
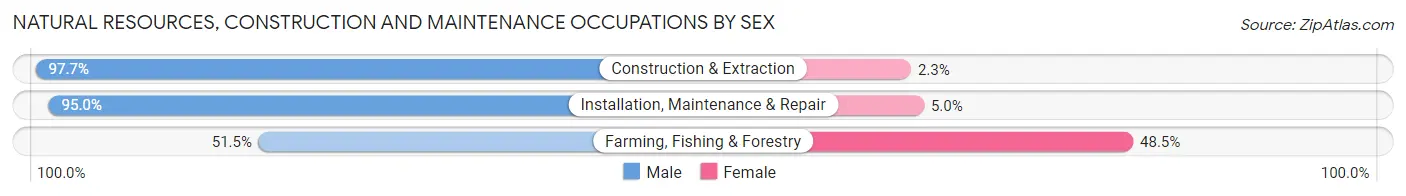
| Occupation | Male | Female |
| Farming, Fishing & Forestry | 87 (51.5%) | 82 (48.5%) |
| Construction & Extraction | 1,951 (97.7%) | 46 (2.3%) |
| Installation, Maintenance & Repair | 1,046 (95.0%) | 55 (5.0%) |
| Total (Category) | 3,084 (94.4%) | 183 (5.6%) |
| Total (Overall) | 14,568 (50.8%) | 14,090 (49.2%) |
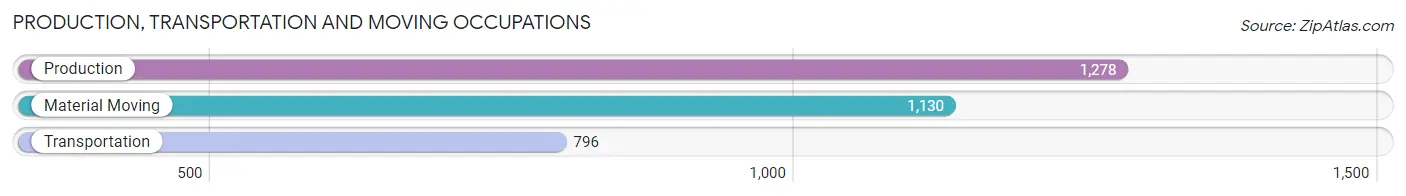
Production, Transportation and Moving Occupations
The most common Production, Transportation and Moving occupations in Sumter County are Production (1,278 | 4.5%), Material Moving (1,130 | 3.9%), and Transportation (796 | 2.8%).
Production, Transportation and Moving Occupations by Sex
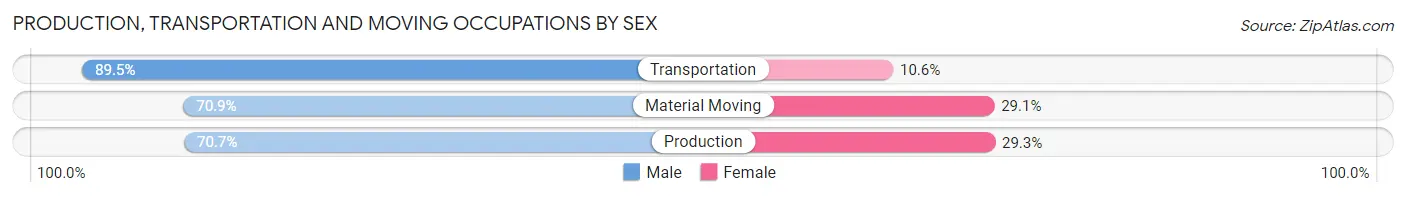
| Occupation | Male | Female |
| Production | 904 (70.7%) | 374 (29.3%) |
| Transportation | 712 (89.4%) | 84 (10.5%) |
| Material Moving | 801 (70.9%) | 329 (29.1%) |
| Total (Category) | 2,417 (75.4%) | 787 (24.6%) |
| Total (Overall) | 14,568 (50.8%) | 14,090 (49.2%) |
Employment Industries by Sex in Sumter County
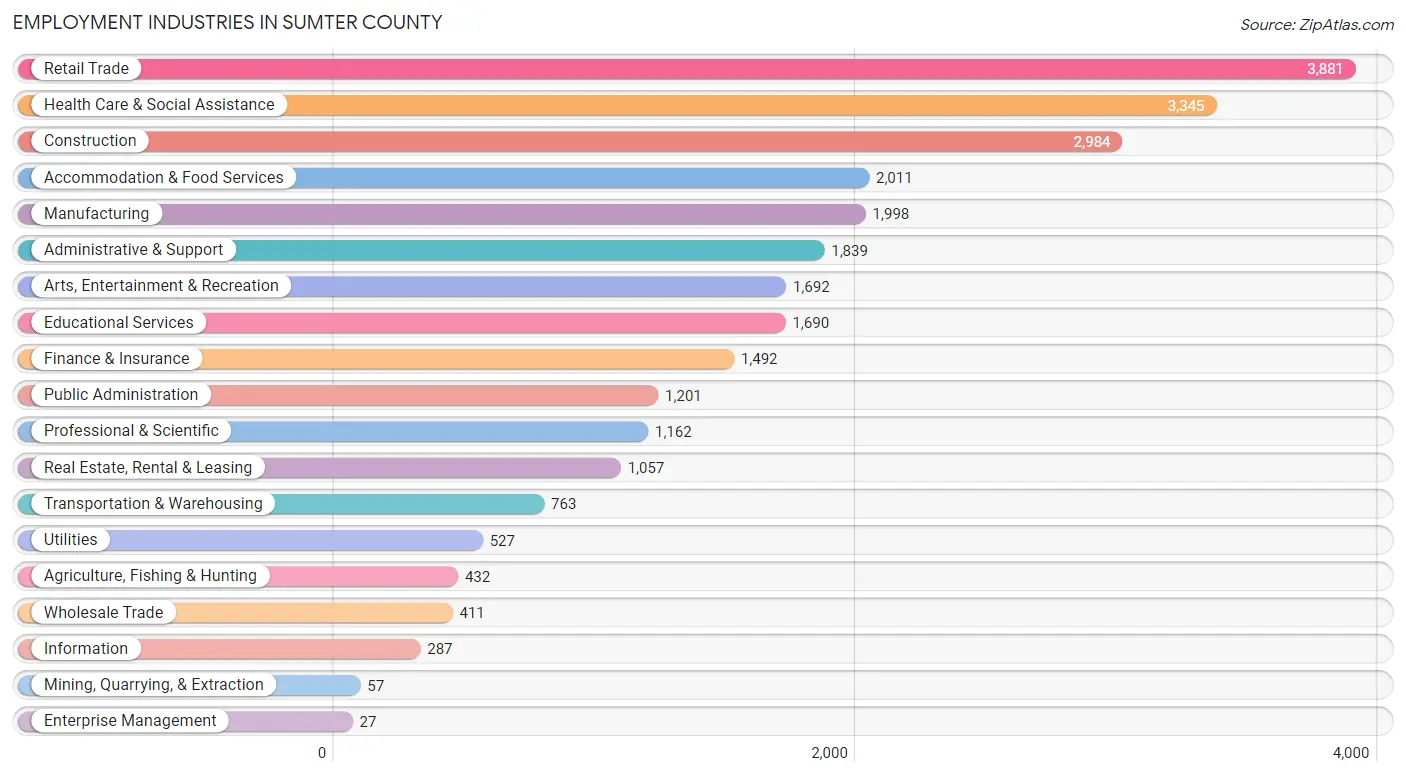
Employment Industries in Sumter County
The major employment industries in Sumter County include Retail Trade (3,881 | 13.5%), Health Care & Social Assistance (3,345 | 11.7%), Construction (2,984 | 10.4%), Accommodation & Food Services (2,011 | 7.0%), and Manufacturing (1,998 | 7.0%).
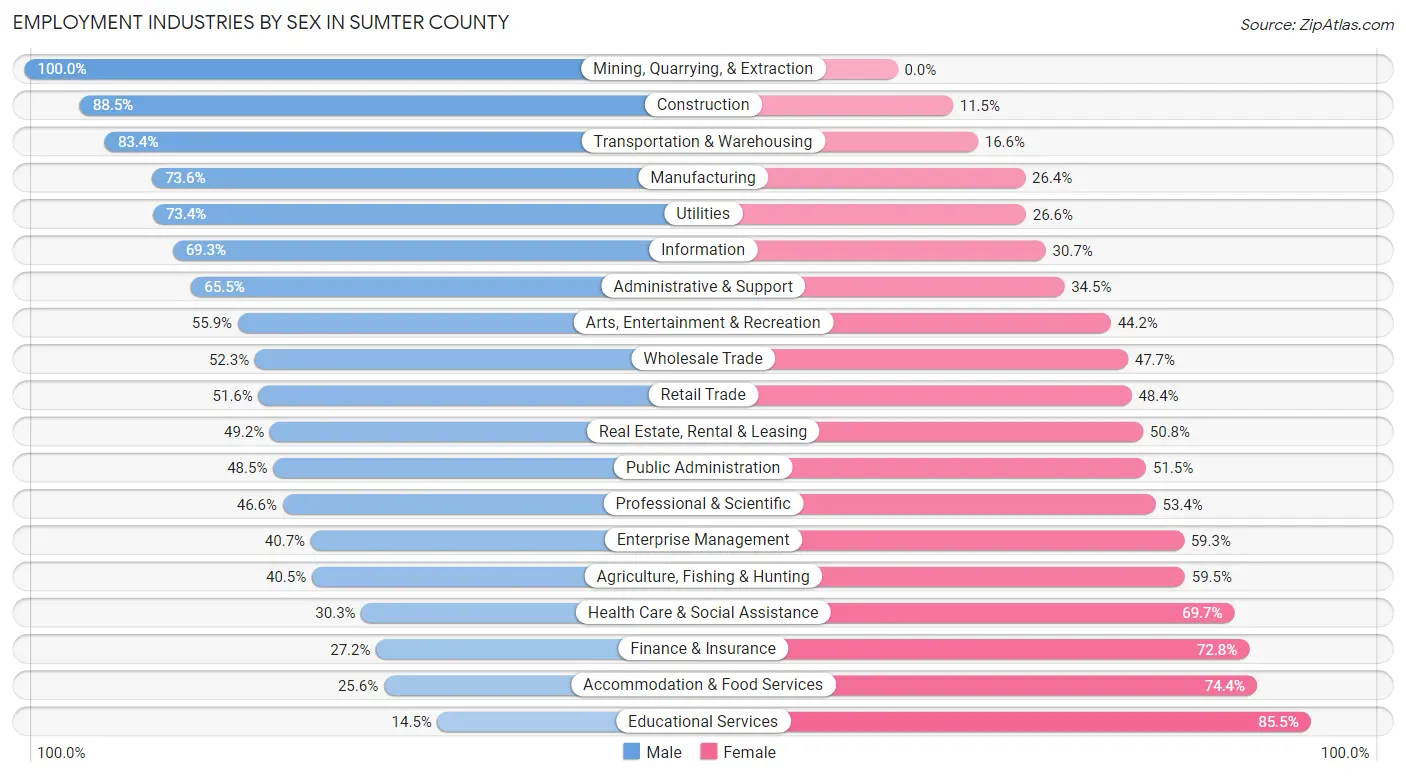
Employment Industries by Sex in Sumter County
The Sumter County industries that see more men than women are Mining, Quarrying, & Extraction (100.0%), Construction (88.5%), and Transportation & Warehousing (83.4%), whereas the industries that tend to have a higher number of women are Educational Services (85.5%), Accommodation & Food Services (74.4%), and Finance & Insurance (72.8%).
| Industry | Male | Female |
| Agriculture, Fishing & Hunting | 175 (40.5%) | 257 (59.5%) |
| Mining, Quarrying, & Extraction | 57 (100.0%) | 0 (0.0%) |
| Construction | 2,642 (88.5%) | 342 (11.5%) |
| Manufacturing | 1,470 (73.6%) | 528 (26.4%) |
| Wholesale Trade | 215 (52.3%) | 196 (47.7%) |
| Retail Trade | 2,001 (51.6%) | 1,880 (48.4%) |
| Transportation & Warehousing | 636 (83.4%) | 127 (16.6%) |
| Utilities | 387 (73.4%) | 140 (26.6%) |
| Information | 199 (69.3%) | 88 (30.7%) |
| Finance & Insurance | 406 (27.2%) | 1,086 (72.8%) |
| Real Estate, Rental & Leasing | 520 (49.2%) | 537 (50.8%) |
| Professional & Scientific | 541 (46.6%) | 621 (53.4%) |
| Enterprise Management | 11 (40.7%) | 16 (59.3%) |
| Administrative & Support | 1,204 (65.5%) | 635 (34.5%) |
| Educational Services | 245 (14.5%) | 1,445 (85.5%) |
| Health Care & Social Assistance | 1,013 (30.3%) | 2,332 (69.7%) |
| Arts, Entertainment & Recreation | 945 (55.8%) | 747 (44.2%) |
| Accommodation & Food Services | 515 (25.6%) | 1,496 (74.4%) |
| Public Administration | 583 (48.5%) | 618 (51.5%) |
| Total | 14,568 (50.8%) | 14,090 (49.2%) |
Education in Sumter County
School Enrollment in Sumter County
The most common levels of schooling among the 9,394 students in Sumter County are elementary school (2,295 | 24.4%), high school (2,286 | 24.3%), and middle school (2,070 | 22.0%).
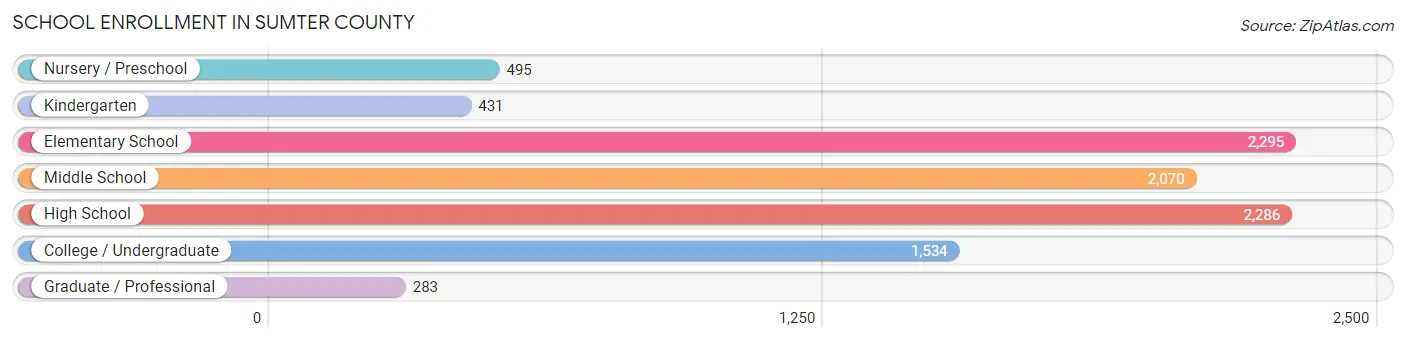
| School Level | # Students | % Students |
| Nursery / Preschool | 495 | 5.3% |
| Kindergarten | 431 | 4.6% |
| Elementary School | 2,295 | 24.4% |
| Middle School | 2,070 | 22.0% |
| High School | 2,286 | 24.3% |
| College / Undergraduate | 1,534 | 16.3% |
| Graduate / Professional | 283 | 3.0% |
| Total | 9,394 | 100.0% |
School Enrollment by Age by Funding Source in Sumter County
Out of a total of 9,394 students who are enrolled in schools in Sumter County, 1,916 (20.4%) attend a private institution, while the remaining 7,478 (79.6%) are enrolled in public schools. The age group of 35 years and over has the highest likelihood of being enrolled in private schools, with 386 (36.6% in the age bracket) enrolled. Conversely, the age group of 25 to 34 year olds has the lowest likelihood of being enrolled in a private school, with 319 (92.5% in the age bracket) attending a public institution.
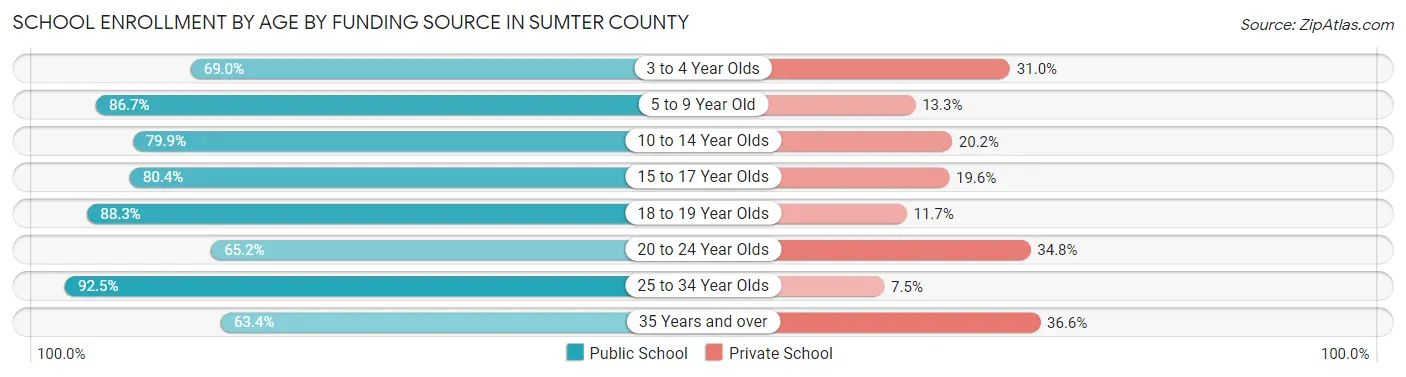
| Age Bracket | Public School | Private School |
| 3 to 4 Year Olds | 252 (69.0%) | 113 (31.0%) |
| 5 to 9 Year Old | 1,938 (86.7%) | 298 (13.3%) |
| 10 to 14 Year Olds | 2,306 (79.8%) | 582 (20.2%) |
| 15 to 17 Year Olds | 1,200 (80.4%) | 293 (19.6%) |
| 18 to 19 Year Olds | 505 (88.3%) | 67 (11.7%) |
| 20 to 24 Year Olds | 287 (65.2%) | 153 (34.8%) |
| 25 to 34 Year Olds | 319 (92.5%) | 26 (7.5%) |
| 35 Years and over | 669 (63.4%) | 386 (36.6%) |
| Total | 7,478 (79.6%) | 1,916 (20.4%) |
Educational Attainment by Field of Study in Sumter County
Business (9,958 | 23.3%), education (8,910 | 20.8%), science & technology (3,904 | 9.1%), engineering (3,221 | 7.5%), and social sciences (3,040 | 7.1%) are the most common fields of study among 42,784 individuals in Sumter County who have obtained a bachelor's degree or higher.
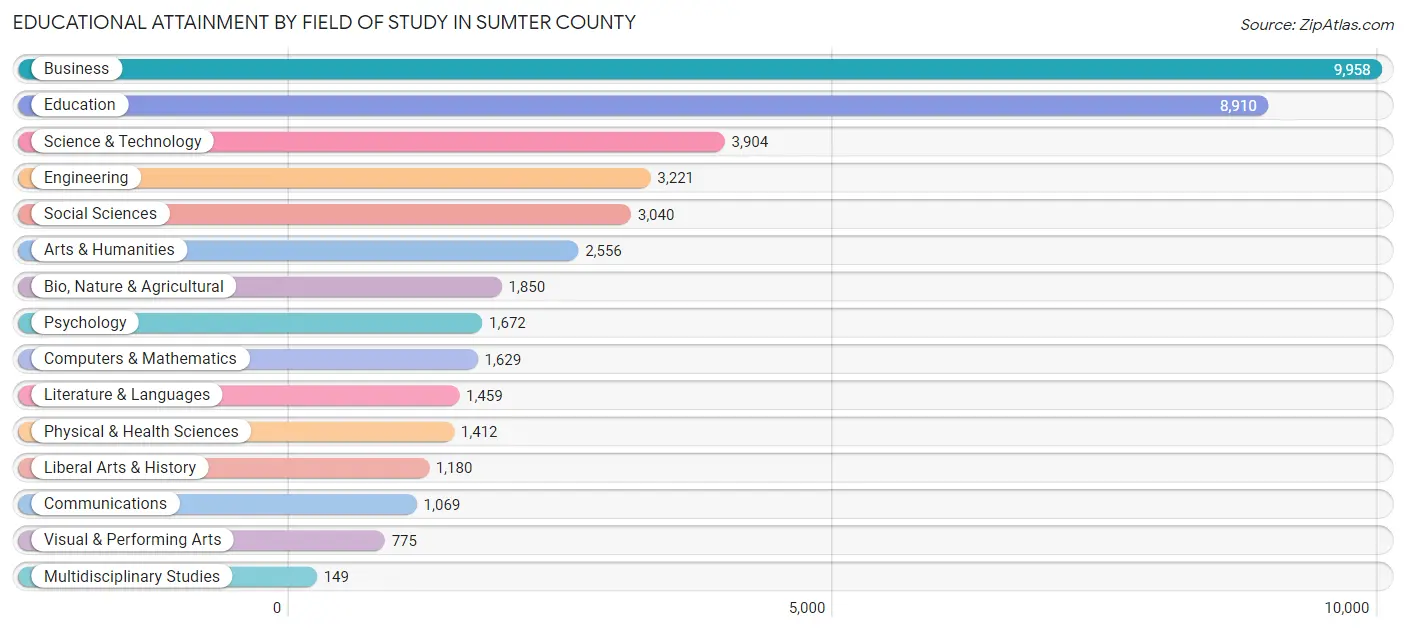
| Field of Study | # Graduates | % Graduates |
| Computers & Mathematics | 1,629 | 3.8% |
| Bio, Nature & Agricultural | 1,850 | 4.3% |
| Physical & Health Sciences | 1,412 | 3.3% |
| Psychology | 1,672 | 3.9% |
| Social Sciences | 3,040 | 7.1% |
| Engineering | 3,221 | 7.5% |
| Multidisciplinary Studies | 149 | 0.4% |
| Science & Technology | 3,904 | 9.1% |
| Business | 9,958 | 23.3% |
| Education | 8,910 | 20.8% |
| Literature & Languages | 1,459 | 3.4% |
| Liberal Arts & History | 1,180 | 2.8% |
| Visual & Performing Arts | 775 | 1.8% |
| Communications | 1,069 | 2.5% |
| Arts & Humanities | 2,556 | 6.0% |
| Total | 42,784 | 100.0% |
Transportation & Commute in Sumter County
Vehicle Availability by Sex in Sumter County
The most prevalent vehicle ownership categories in Sumter County are males with 2 vehicles (5,642, accounting for 39.7%) and females with 2 vehicles (5,595, making up 41.5%).
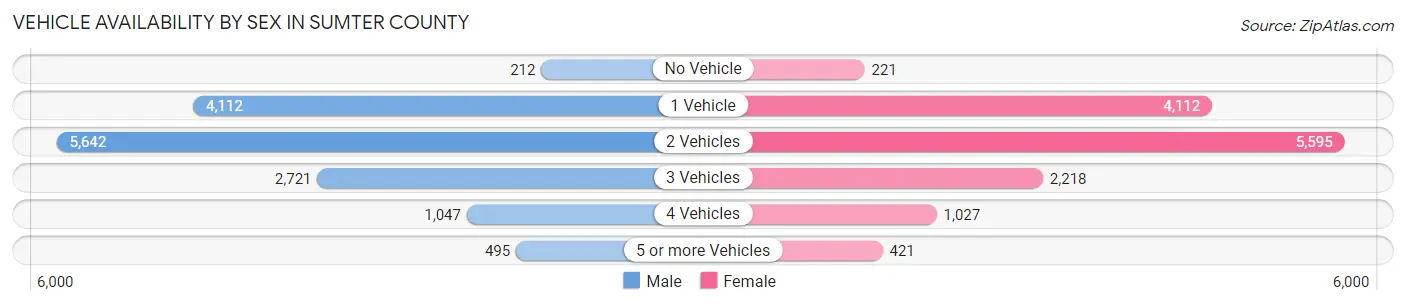
| Vehicles Available | Male | Female |
| No Vehicle | 212 (1.5%) | 221 (1.6%) |
| 1 Vehicle | 4,112 (28.9%) | 4,112 (30.2%) |
| 2 Vehicles | 5,642 (39.7%) | 5,595 (41.2%) |
| 3 Vehicles | 2,721 (19.1%) | 2,218 (16.3%) |
| 4 Vehicles | 1,047 (7.4%) | 1,027 (7.5%) |
| 5 or more Vehicles | 495 (3.5%) | 421 (3.1%) |
| Total | 14,229 (100.0%) | 13,594 (100.0%) |
Commute Time in Sumter County
The most frequently occuring commute durations in Sumter County are 15 to 19 minutes (3,750 commuters, 15.3%), 10 to 14 minutes (3,505 commuters, 14.3%), and 20 to 24 minutes (3,320 commuters, 13.6%).
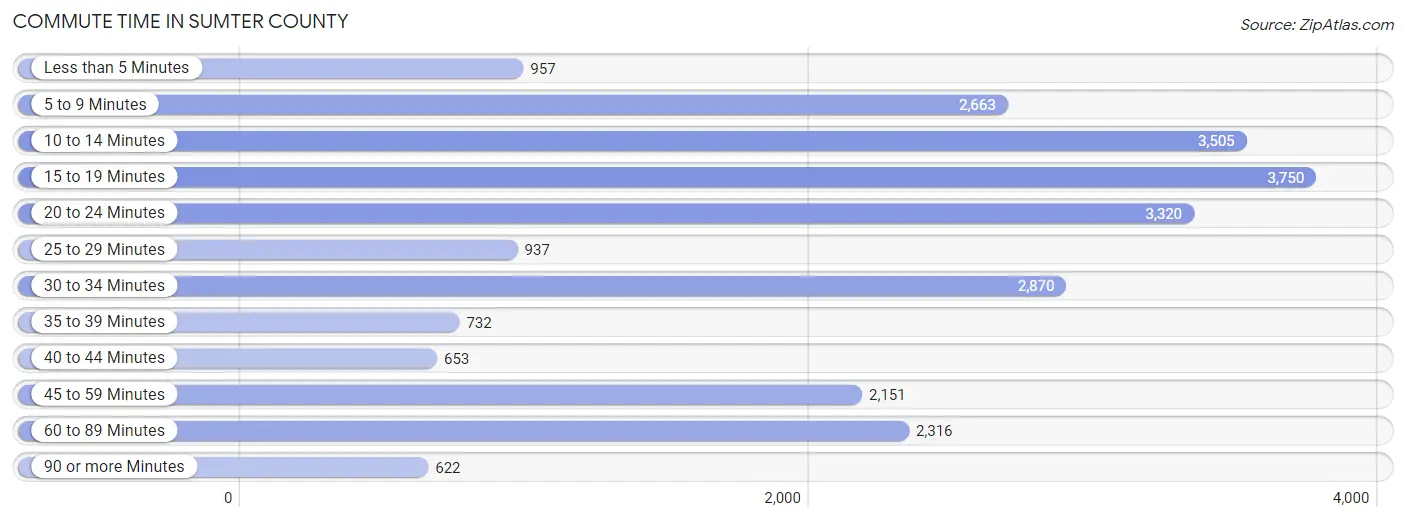
| Commute Time | # Commuters | % Commuters |
| Less than 5 Minutes | 957 | 3.9% |
| 5 to 9 Minutes | 2,663 | 10.9% |
| 10 to 14 Minutes | 3,505 | 14.3% |
| 15 to 19 Minutes | 3,750 | 15.3% |
| 20 to 24 Minutes | 3,320 | 13.6% |
| 25 to 29 Minutes | 937 | 3.8% |
| 30 to 34 Minutes | 2,870 | 11.7% |
| 35 to 39 Minutes | 732 | 3.0% |
| 40 to 44 Minutes | 653 | 2.7% |
| 45 to 59 Minutes | 2,151 | 8.8% |
| 60 to 89 Minutes | 2,316 | 9.5% |
| 90 or more Minutes | 622 | 2.5% |
Commute Time by Sex in Sumter County
The most common commute times in Sumter County are 15 to 19 minutes (2,009 commuters, 15.6%) for males and 20 to 24 minutes (2,260 commuters, 19.5%) for females.
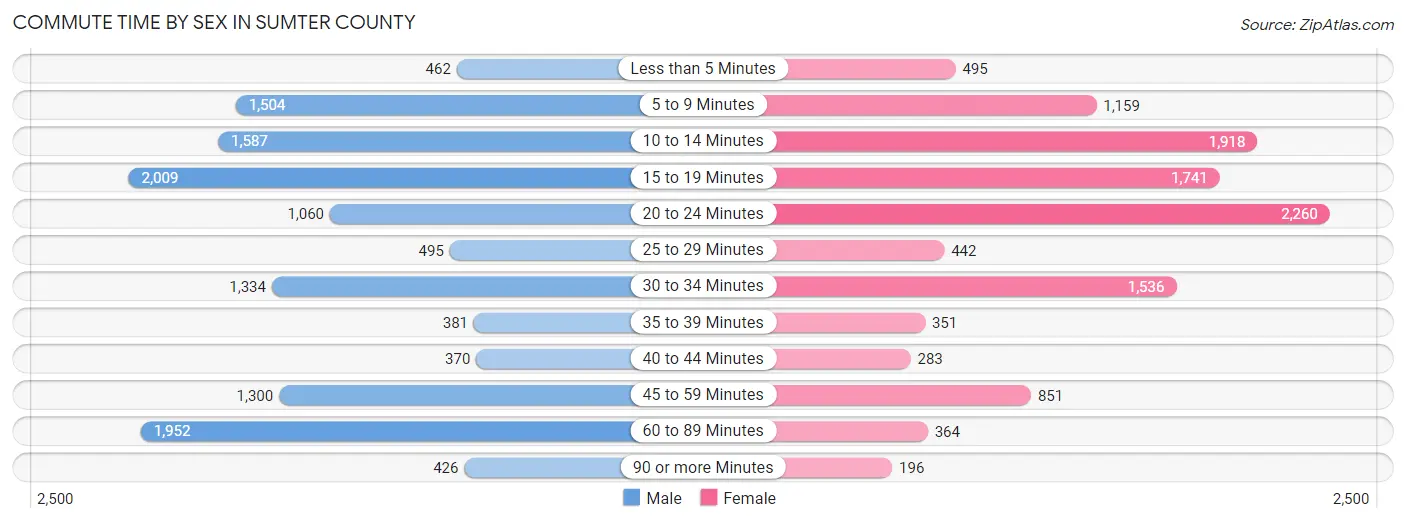
| Commute Time | Male | Female |
| Less than 5 Minutes | 462 (3.6%) | 495 (4.3%) |
| 5 to 9 Minutes | 1,504 (11.7%) | 1,159 (10.0%) |
| 10 to 14 Minutes | 1,587 (12.3%) | 1,918 (16.5%) |
| 15 to 19 Minutes | 2,009 (15.6%) | 1,741 (15.0%) |
| 20 to 24 Minutes | 1,060 (8.2%) | 2,260 (19.5%) |
| 25 to 29 Minutes | 495 (3.8%) | 442 (3.8%) |
| 30 to 34 Minutes | 1,334 (10.4%) | 1,536 (13.3%) |
| 35 to 39 Minutes | 381 (3.0%) | 351 (3.0%) |
| 40 to 44 Minutes | 370 (2.9%) | 283 (2.4%) |
| 45 to 59 Minutes | 1,300 (10.1%) | 851 (7.3%) |
| 60 to 89 Minutes | 1,952 (15.2%) | 364 (3.1%) |
| 90 or more Minutes | 426 (3.3%) | 196 (1.7%) |
Time of Departure to Work by Sex in Sumter County
The most frequent times of departure to work in Sumter County are 6:00 AM to 6:29 AM (1,829, 14.2%) for males and 7:00 AM to 7:29 AM (2,359, 20.3%) for females.
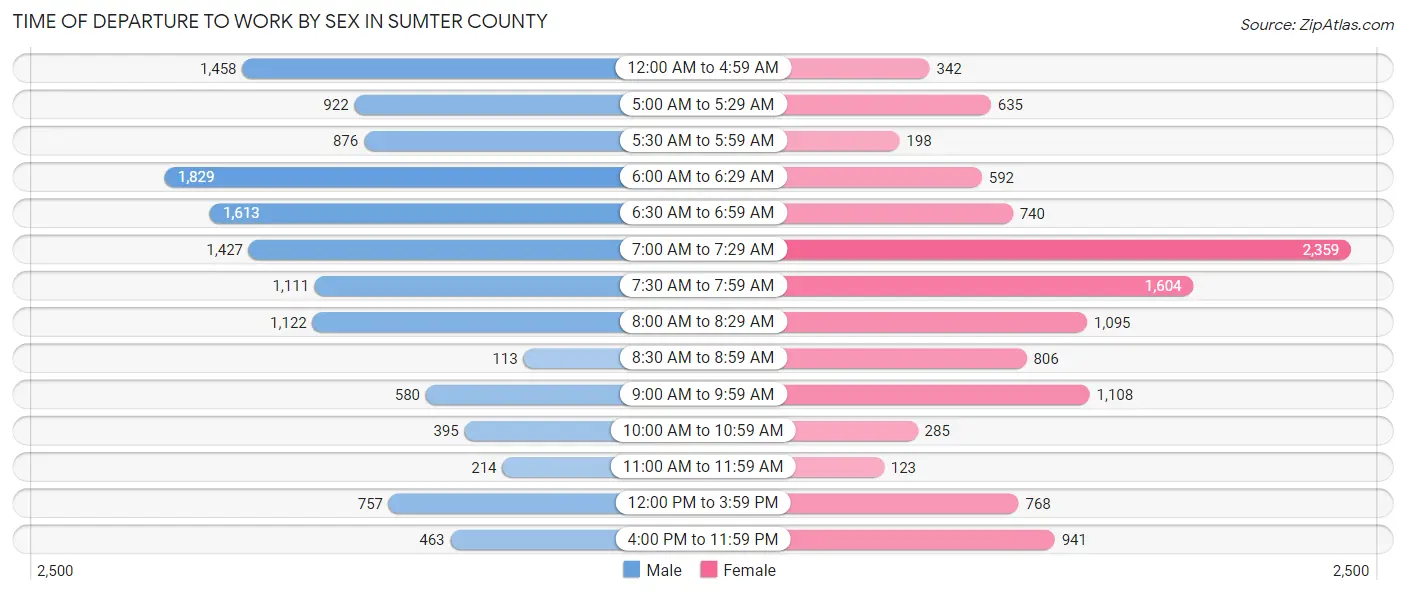
| Time of Departure | Male | Female |
| 12:00 AM to 4:59 AM | 1,458 (11.3%) | 342 (2.9%) |
| 5:00 AM to 5:29 AM | 922 (7.2%) | 635 (5.5%) |
| 5:30 AM to 5:59 AM | 876 (6.8%) | 198 (1.7%) |
| 6:00 AM to 6:29 AM | 1,829 (14.2%) | 592 (5.1%) |
| 6:30 AM to 6:59 AM | 1,613 (12.5%) | 740 (6.4%) |
| 7:00 AM to 7:29 AM | 1,427 (11.1%) | 2,359 (20.3%) |
| 7:30 AM to 7:59 AM | 1,111 (8.6%) | 1,604 (13.8%) |
| 8:00 AM to 8:29 AM | 1,122 (8.7%) | 1,095 (9.4%) |
| 8:30 AM to 8:59 AM | 113 (0.9%) | 806 (7.0%) |
| 9:00 AM to 9:59 AM | 580 (4.5%) | 1,108 (9.6%) |
| 10:00 AM to 10:59 AM | 395 (3.1%) | 285 (2.5%) |
| 11:00 AM to 11:59 AM | 214 (1.7%) | 123 (1.1%) |
| 12:00 PM to 3:59 PM | 757 (5.9%) | 768 (6.6%) |
| 4:00 PM to 11:59 PM | 463 (3.6%) | 941 (8.1%) |
| Total | 12,880 (100.0%) | 11,596 (100.0%) |
Housing Occupancy in Sumter County
Occupancy by Ownership in Sumter County
Of the total 64,305 dwellings in Sumter County, owner-occupied units account for 56,048 (87.2%), while renter-occupied units make up 8,257 (12.8%).
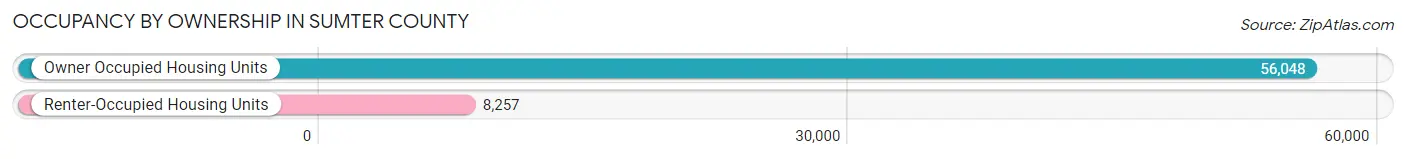
| Occupancy | # Housing Units | % Housing Units |
| Owner Occupied Housing Units | 56,048 | 87.2% |
| Renter-Occupied Housing Units | 8,257 | 12.8% |
| Total Occupied Housing Units | 64,305 | 100.0% |
Occupancy by Household Size in Sumter County
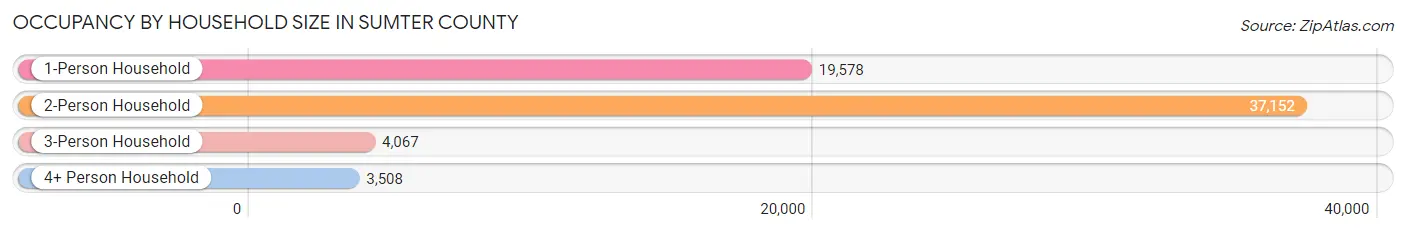
| Household Size | # Housing Units | % Housing Units |
| 1-Person Household | 19,578 | 30.4% |
| 2-Person Household | 37,152 | 57.8% |
| 3-Person Household | 4,067 | 6.3% |
| 4+ Person Household | 3,508 | 5.5% |
| Total Housing Units | 64,305 | 100.0% |
Occupancy by Ownership by Household Size in Sumter County
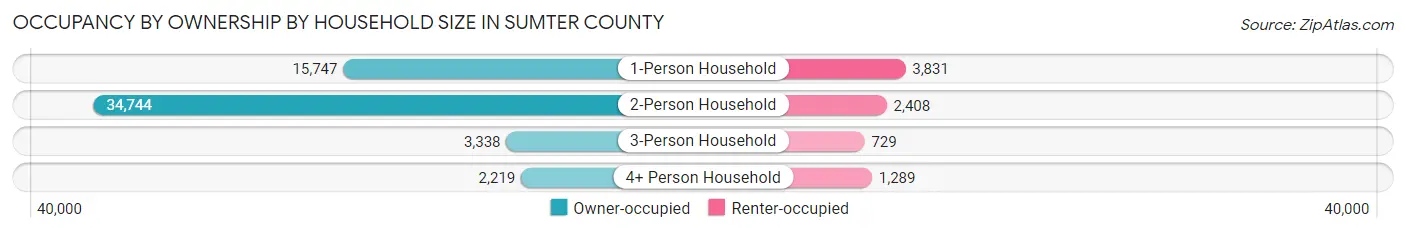
| Household Size | Owner-occupied | Renter-occupied |
| 1-Person Household | 15,747 (80.4%) | 3,831 (19.6%) |
| 2-Person Household | 34,744 (93.5%) | 2,408 (6.5%) |
| 3-Person Household | 3,338 (82.1%) | 729 (17.9%) |
| 4+ Person Household | 2,219 (63.3%) | 1,289 (36.7%) |
| Total Housing Units | 56,048 (87.2%) | 8,257 (12.8%) |
Occupancy by Educational Attainment in Sumter County
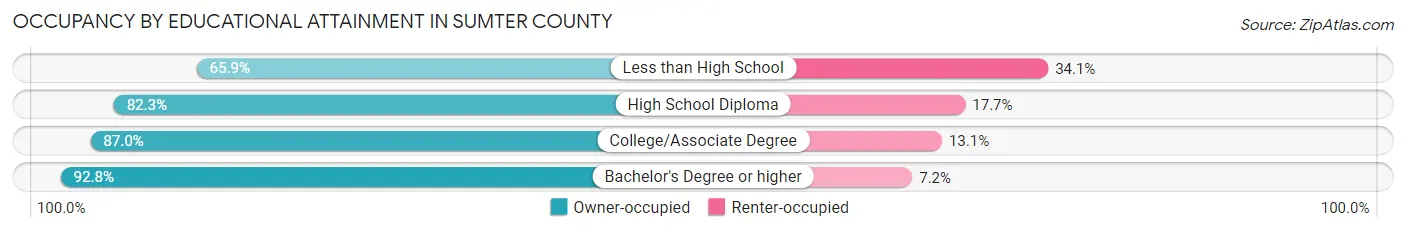
| Household Size | Owner-occupied | Renter-occupied |
| Less than High School | 2,125 (65.9%) | 1,100 (34.1%) |
| High School Diploma | 12,712 (82.3%) | 2,731 (17.7%) |
| College/Associate Degree | 17,102 (87.0%) | 2,567 (13.1%) |
| Bachelor's Degree or higher | 24,109 (92.8%) | 1,859 (7.2%) |
Occupancy by Age of Householder in Sumter County
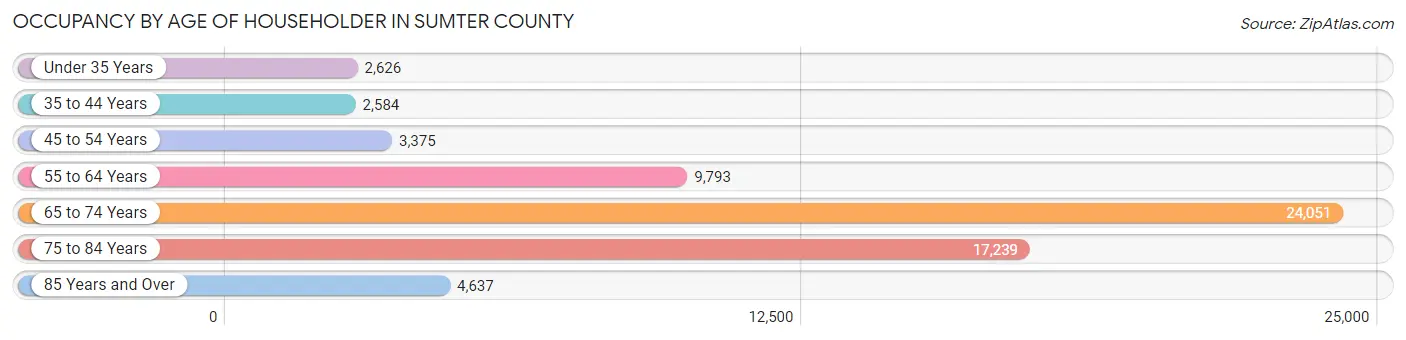
| Age Bracket | # Households | % Households |
| Under 35 Years | 2,626 | 4.1% |
| 35 to 44 Years | 2,584 | 4.0% |
| 45 to 54 Years | 3,375 | 5.2% |
| 55 to 64 Years | 9,793 | 15.2% |
| 65 to 74 Years | 24,051 | 37.4% |
| 75 to 84 Years | 17,239 | 26.8% |
| 85 Years and Over | 4,637 | 7.2% |
| Total | 64,305 | 100.0% |
Housing Finances in Sumter County
Median Income by Occupancy in Sumter County
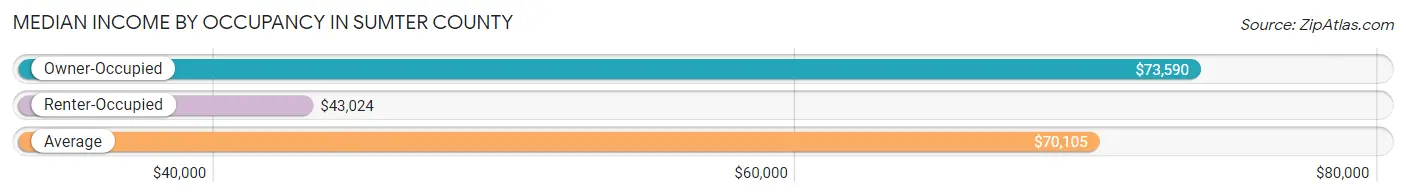
| Occupancy Type | # Households | Median Income |
| Owner-Occupied | 56,048 (87.2%) | $73,590 |
| Renter-Occupied | 8,257 (12.8%) | $43,024 |
| Average | 64,305 (100.0%) | $70,105 |
Occupancy by Householder Income Bracket in Sumter County
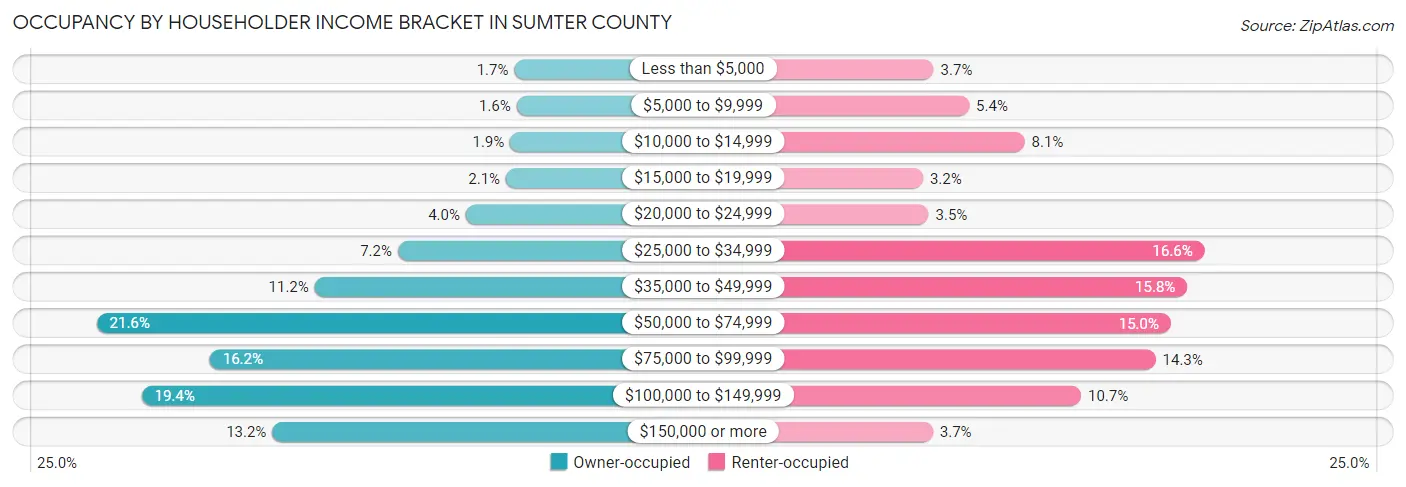
| Income Bracket | Owner-occupied | Renter-occupied |
| Less than $5,000 | 940 (1.7%) | 307 (3.7%) |
| $5,000 to $9,999 | 878 (1.6%) | 447 (5.4%) |
| $10,000 to $14,999 | 1,051 (1.9%) | 665 (8.1%) |
| $15,000 to $19,999 | 1,168 (2.1%) | 265 (3.2%) |
| $20,000 to $24,999 | 2,235 (4.0%) | 287 (3.5%) |
| $25,000 to $34,999 | 4,054 (7.2%) | 1,372 (16.6%) |
| $35,000 to $49,999 | 6,270 (11.2%) | 1,304 (15.8%) |
| $50,000 to $74,999 | 12,089 (21.6%) | 1,239 (15.0%) |
| $75,000 to $99,999 | 9,071 (16.2%) | 1,180 (14.3%) |
| $100,000 to $149,999 | 10,889 (19.4%) | 887 (10.7%) |
| $150,000 or more | 7,403 (13.2%) | 304 (3.7%) |
| Total | 56,048 (100.0%) | 8,257 (100.0%) |
Monthly Housing Cost Tiers in Sumter County
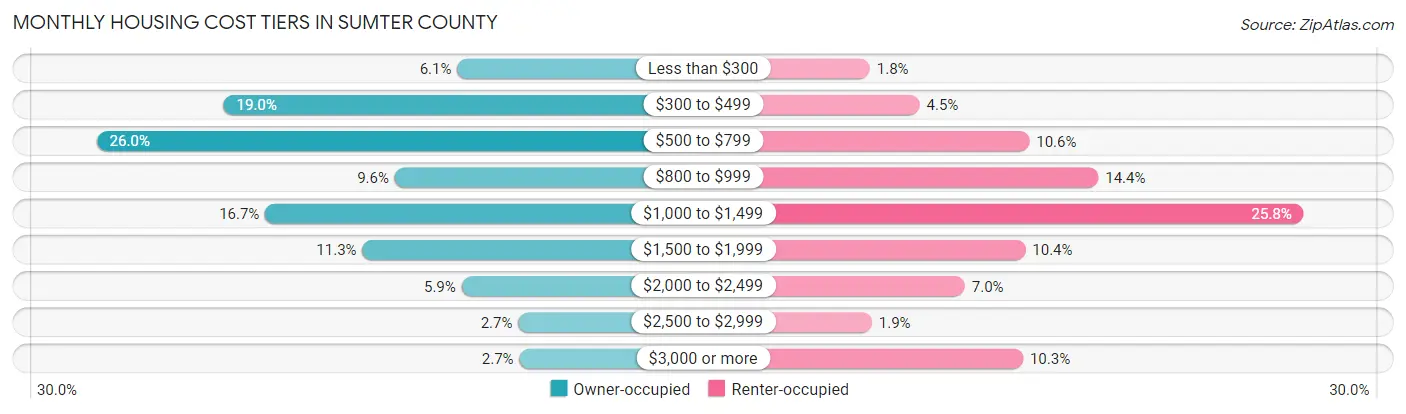
| Monthly Cost | Owner-occupied | Renter-occupied |
| Less than $300 | 3,420 (6.1%) | 148 (1.8%) |
| $300 to $499 | 10,657 (19.0%) | 375 (4.5%) |
| $500 to $799 | 14,582 (26.0%) | 875 (10.6%) |
| $800 to $999 | 5,353 (9.6%) | 1,190 (14.4%) |
| $1,000 to $1,499 | 9,364 (16.7%) | 2,126 (25.8%) |
| $1,500 to $1,999 | 6,357 (11.3%) | 857 (10.4%) |
| $2,000 to $2,499 | 3,286 (5.9%) | 581 (7.0%) |
| $2,500 to $2,999 | 1,532 (2.7%) | 157 (1.9%) |
| $3,000 or more | 1,497 (2.7%) | 846 (10.2%) |
| Total | 56,048 (100.0%) | 8,257 (100.0%) |
Physical Housing Characteristics in Sumter County
Housing Structures in Sumter County
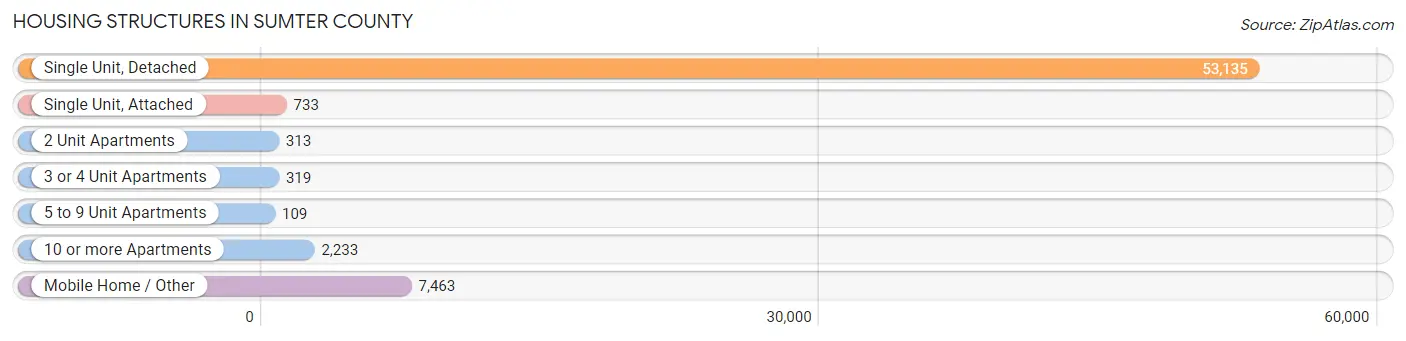
| Structure Type | # Housing Units | % Housing Units |
| Single Unit, Detached | 53,135 | 82.6% |
| Single Unit, Attached | 733 | 1.1% |
| 2 Unit Apartments | 313 | 0.5% |
| 3 or 4 Unit Apartments | 319 | 0.5% |
| 5 to 9 Unit Apartments | 109 | 0.2% |
| 10 or more Apartments | 2,233 | 3.5% |
| Mobile Home / Other | 7,463 | 11.6% |
| Total | 64,305 | 100.0% |
Housing Structures by Occupancy in Sumter County
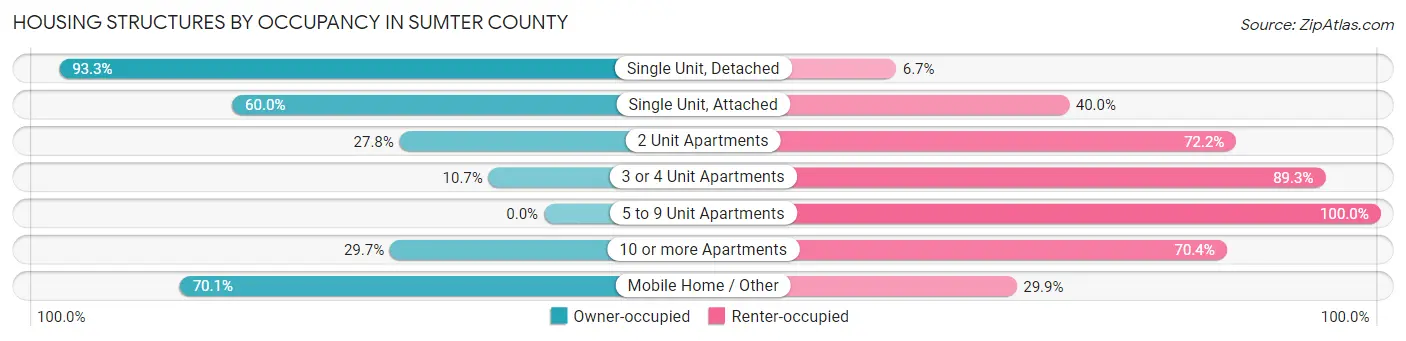
| Structure Type | Owner-occupied | Renter-occupied |
| Single Unit, Detached | 49,591 (93.3%) | 3,544 (6.7%) |
| Single Unit, Attached | 440 (60.0%) | 293 (40.0%) |
| 2 Unit Apartments | 87 (27.8%) | 226 (72.2%) |
| 3 or 4 Unit Apartments | 34 (10.7%) | 285 (89.3%) |
| 5 to 9 Unit Apartments | 0 (0.0%) | 109 (100.0%) |
| 10 or more Apartments | 662 (29.6%) | 1,571 (70.4%) |
| Mobile Home / Other | 5,234 (70.1%) | 2,229 (29.9%) |
| Total | 56,048 (87.2%) | 8,257 (12.8%) |
Housing Structures by Number of Rooms in Sumter County
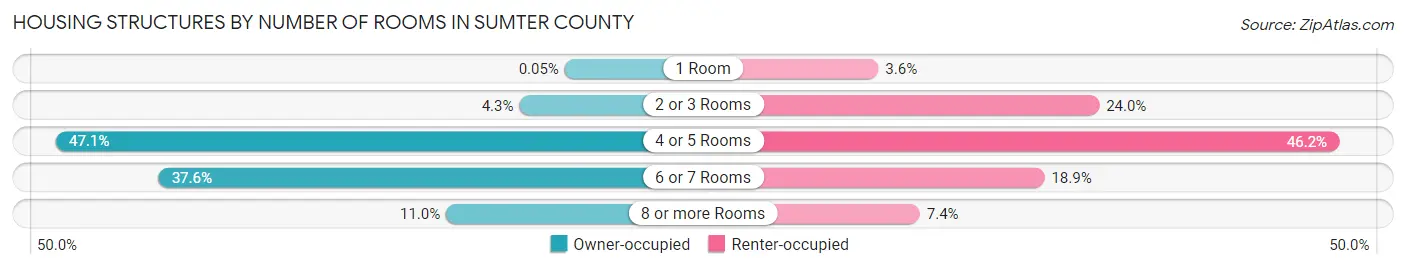
| Number of Rooms | Owner-occupied | Renter-occupied |
| 1 Room | 29 (0.1%) | 294 (3.6%) |
| 2 or 3 Rooms | 2,382 (4.3%) | 1,980 (24.0%) |
| 4 or 5 Rooms | 26,393 (47.1%) | 3,811 (46.2%) |
| 6 or 7 Rooms | 21,066 (37.6%) | 1,562 (18.9%) |
| 8 or more Rooms | 6,178 (11.0%) | 610 (7.4%) |
| Total | 56,048 (100.0%) | 8,257 (100.0%) |
Housing Structure by Heating Type in Sumter County
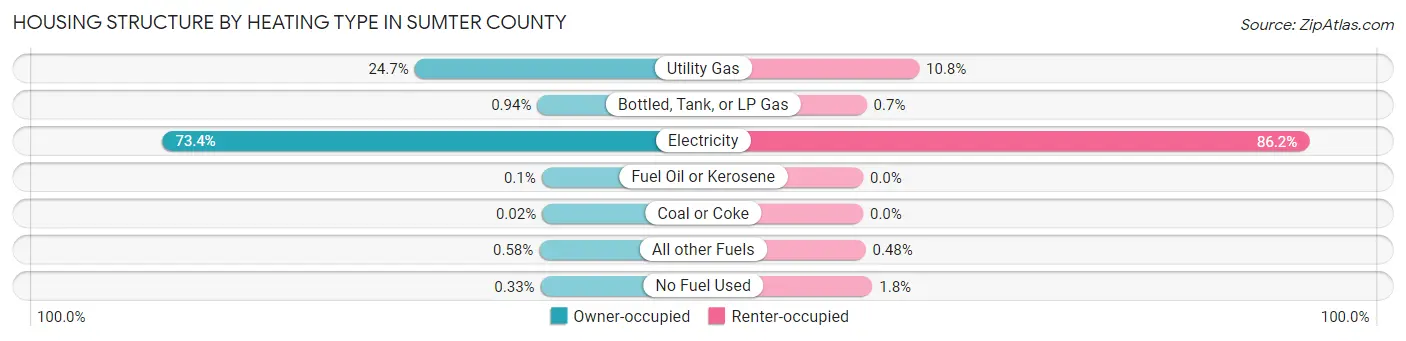
| Heating Type | Owner-occupied | Renter-occupied |
| Utility Gas | 13,824 (24.7%) | 894 (10.8%) |
| Bottled, Tank, or LP Gas | 525 (0.9%) | 58 (0.7%) |
| Electricity | 41,117 (73.4%) | 7,117 (86.2%) |
| Fuel Oil or Kerosene | 57 (0.1%) | 0 (0.0%) |
| Coal or Coke | 13 (0.0%) | 0 (0.0%) |
| All other Fuels | 327 (0.6%) | 40 (0.5%) |
| No Fuel Used | 185 (0.3%) | 148 (1.8%) |
| Total | 56,048 (100.0%) | 8,257 (100.0%) |
Household Vehicle Usage in Sumter County
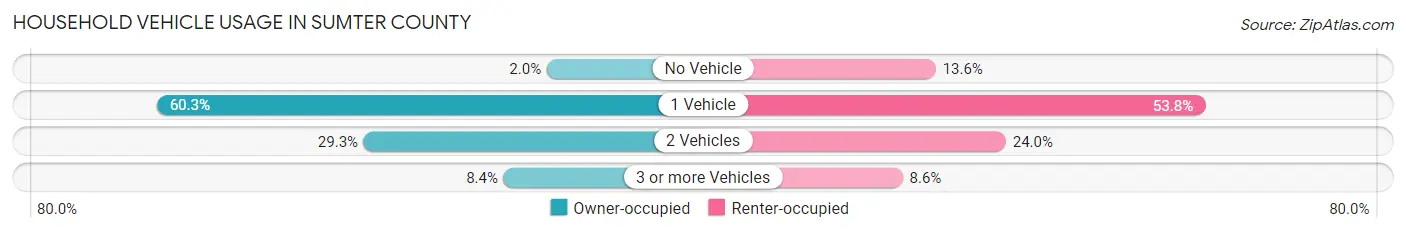
| Vehicles per Household | Owner-occupied | Renter-occupied |
| No Vehicle | 1,111 (2.0%) | 1,120 (13.6%) |
| 1 Vehicle | 33,777 (60.3%) | 4,441 (53.8%) |
| 2 Vehicles | 16,434 (29.3%) | 1,984 (24.0%) |
| 3 or more Vehicles | 4,726 (8.4%) | 712 (8.6%) |
| Total | 56,048 (100.0%) | 8,257 (100.0%) |
Real Estate & Mortgages in Sumter County
Real Estate and Mortgage Overview in Sumter County
| Characteristic | Without Mortgage | With Mortgage |
| Housing Units | 33,057 | 22,991 |
| Median Property Value | $324,400 | $324,500 |
| Median Household Income | $68,548 | $3,249 |
| Monthly Housing Costs | $549 | $1,101 |
| Real Estate Taxes | $2,753 | $574 |
Property Value by Mortgage Status in Sumter County
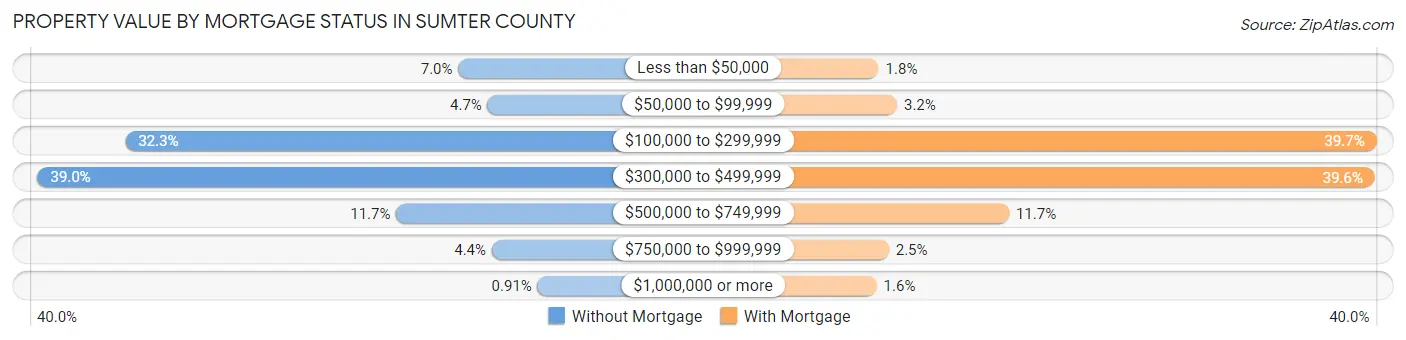
| Property Value | Without Mortgage | With Mortgage |
| Less than $50,000 | 2,298 (7.0%) | 404 (1.8%) |
| $50,000 to $99,999 | 1,559 (4.7%) | 726 (3.2%) |
| $100,000 to $299,999 | 10,686 (32.3%) | 9,124 (39.7%) |
| $300,000 to $499,999 | 12,898 (39.0%) | 9,096 (39.6%) |
| $500,000 to $749,999 | 3,861 (11.7%) | 2,688 (11.7%) |
| $750,000 to $999,999 | 1,454 (4.4%) | 582 (2.5%) |
| $1,000,000 or more | 301 (0.9%) | 371 (1.6%) |
| Total | 33,057 (100.0%) | 22,991 (100.0%) |
Household Income by Mortgage Status in Sumter County
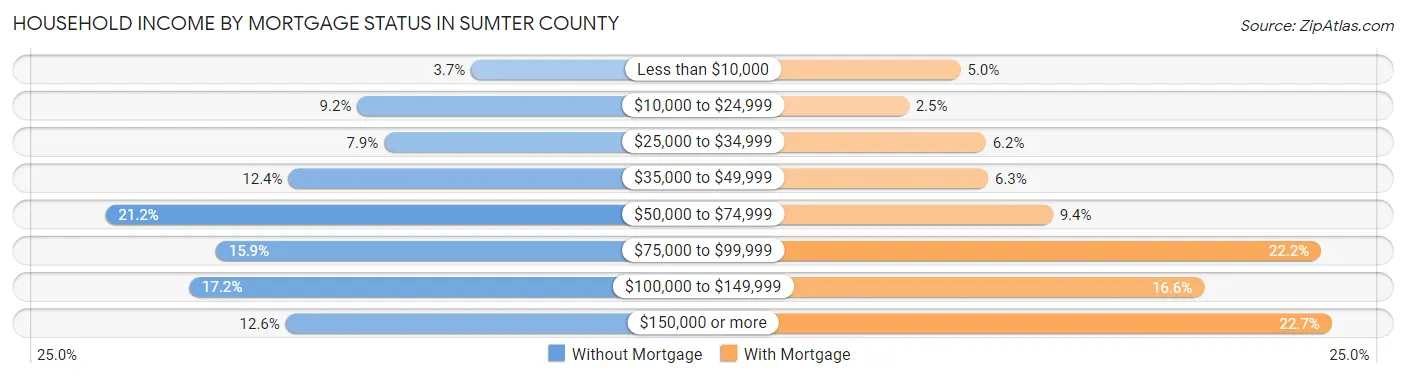
| Household Income | Without Mortgage | With Mortgage |
| Less than $10,000 | 1,236 (3.7%) | 1,149 (5.0%) |
| $10,000 to $24,999 | 3,028 (9.2%) | 582 (2.5%) |
| $25,000 to $34,999 | 2,604 (7.9%) | 1,426 (6.2%) |
| $35,000 to $49,999 | 4,111 (12.4%) | 1,450 (6.3%) |
| $50,000 to $74,999 | 6,993 (21.1%) | 2,159 (9.4%) |
| $75,000 to $99,999 | 5,254 (15.9%) | 5,096 (22.2%) |
| $100,000 to $149,999 | 5,677 (17.2%) | 3,817 (16.6%) |
| $150,000 or more | 4,154 (12.6%) | 5,212 (22.7%) |
| Total | 33,057 (100.0%) | 22,991 (100.0%) |
Property Value to Household Income Ratio in Sumter County
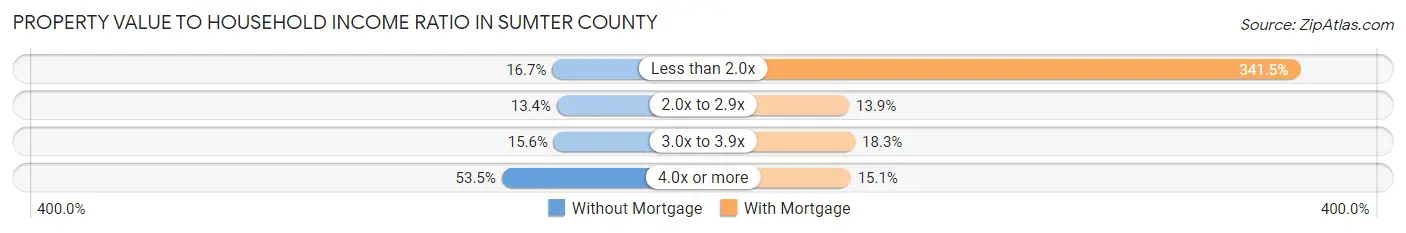
| Value-to-Income Ratio | Without Mortgage | With Mortgage |
| Less than 2.0x | 5,516 (16.7%) | 78,519 (341.5%) |
| 2.0x to 2.9x | 4,423 (13.4%) | 3,204 (13.9%) |
| 3.0x to 3.9x | 5,142 (15.5%) | 4,214 (18.3%) |
| 4.0x or more | 17,680 (53.5%) | 3,472 (15.1%) |
| Total | 33,057 (100.0%) | 22,991 (100.0%) |
Real Estate Taxes by Mortgage Status in Sumter County
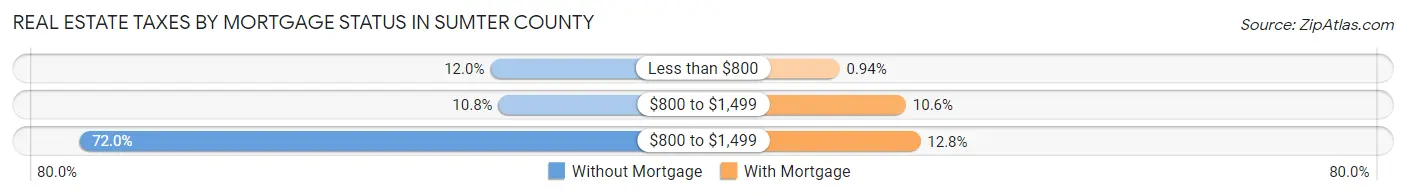
| Property Taxes | Without Mortgage | With Mortgage |
| Less than $800 | 3,953 (12.0%) | 217 (0.9%) |
| $800 to $1,499 | 3,561 (10.8%) | 2,446 (10.6%) |
| $800 to $1,499 | 23,808 (72.0%) | 2,933 (12.8%) |
| Total | 33,057 (100.0%) | 22,991 (100.0%) |
Health & Disability in Sumter County
Health Insurance Coverage by Age in Sumter County
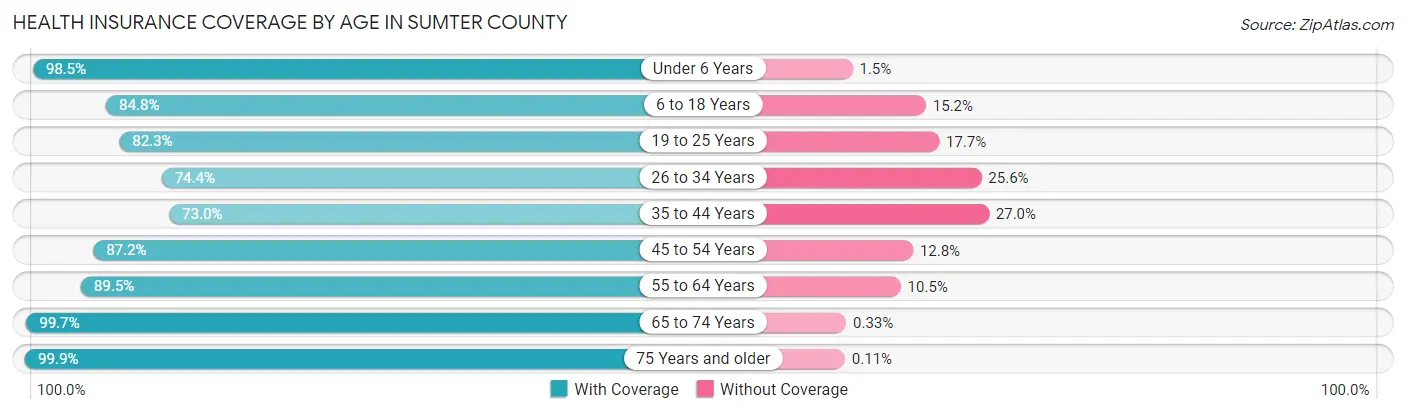
| Age Bracket | With Coverage | Without Coverage |
| Under 6 Years | 2,753 (98.5%) | 43 (1.5%) |
| 6 to 18 Years | 6,100 (84.8%) | 1,094 (15.2%) |
| 19 to 25 Years | 2,837 (82.3%) | 609 (17.7%) |
| 26 to 34 Years | 3,557 (74.4%) | 1,222 (25.6%) |
| 35 to 44 Years | 4,272 (73.0%) | 1,577 (27.0%) |
| 45 to 54 Years | 5,880 (87.2%) | 863 (12.8%) |
| 55 to 64 Years | 15,397 (89.5%) | 1,809 (10.5%) |
| 65 to 74 Years | 41,140 (99.7%) | 137 (0.3%) |
| 75 Years and older | 34,405 (99.9%) | 37 (0.1%) |
| Total | 116,341 (94.0%) | 7,391 (6.0%) |
Health Insurance Coverage by Citizenship Status in Sumter County
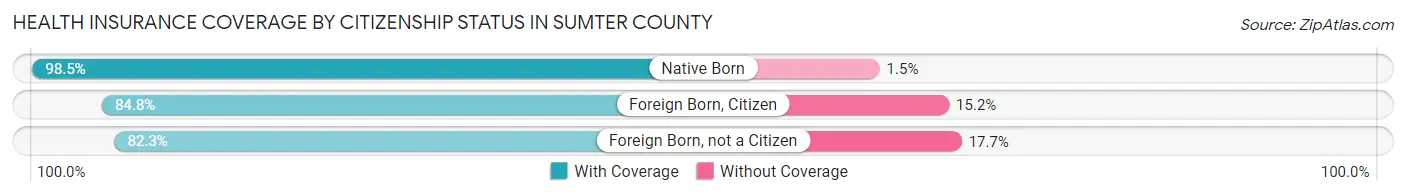
| Citizenship Status | With Coverage | Without Coverage |
| Native Born | 2,753 (98.5%) | 43 (1.5%) |
| Foreign Born, Citizen | 6,100 (84.8%) | 1,094 (15.2%) |
| Foreign Born, not a Citizen | 2,837 (82.3%) | 609 (17.7%) |
Health Insurance Coverage by Household Income in Sumter County
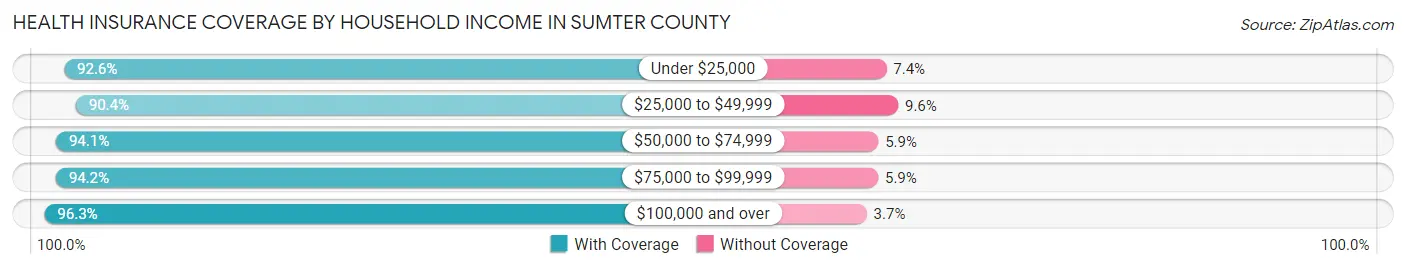
| Household Income | With Coverage | Without Coverage |
| Under $25,000 | 11,762 (92.6%) | 942 (7.4%) |
| $25,000 to $49,999 | 20,607 (90.4%) | 2,188 (9.6%) |
| $50,000 to $74,999 | 23,244 (94.1%) | 1,454 (5.9%) |
| $75,000 to $99,999 | 19,711 (94.2%) | 1,224 (5.9%) |
| $100,000 and over | 40,856 (96.3%) | 1,578 (3.7%) |
Public vs Private Health Insurance Coverage by Age in Sumter County
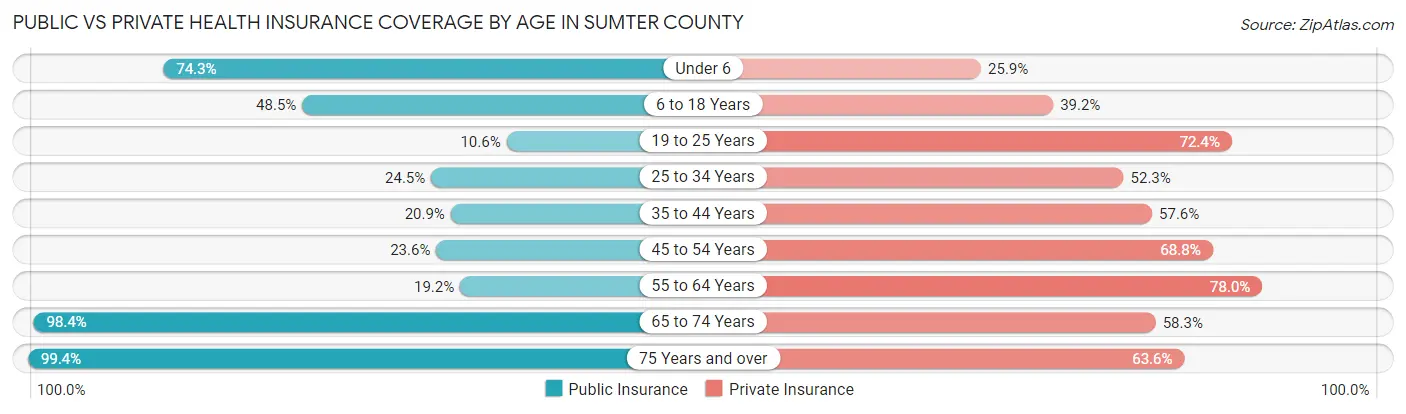
| Age Bracket | Public Insurance | Private Insurance |
| Under 6 | 2,076 (74.3%) | 723 (25.9%) |
| 6 to 18 Years | 3,488 (48.5%) | 2,823 (39.2%) |
| 19 to 25 Years | 364 (10.6%) | 2,494 (72.4%) |
| 25 to 34 Years | 1,173 (24.5%) | 2,500 (52.3%) |
| 35 to 44 Years | 1,223 (20.9%) | 3,369 (57.6%) |
| 45 to 54 Years | 1,591 (23.6%) | 4,639 (68.8%) |
| 55 to 64 Years | 3,299 (19.2%) | 13,424 (78.0%) |
| 65 to 74 Years | 40,595 (98.4%) | 24,053 (58.3%) |
| 75 Years and over | 34,231 (99.4%) | 21,892 (63.6%) |
| Total | 88,040 (71.2%) | 75,917 (61.4%) |
Disability Status by Sex by Age in Sumter County
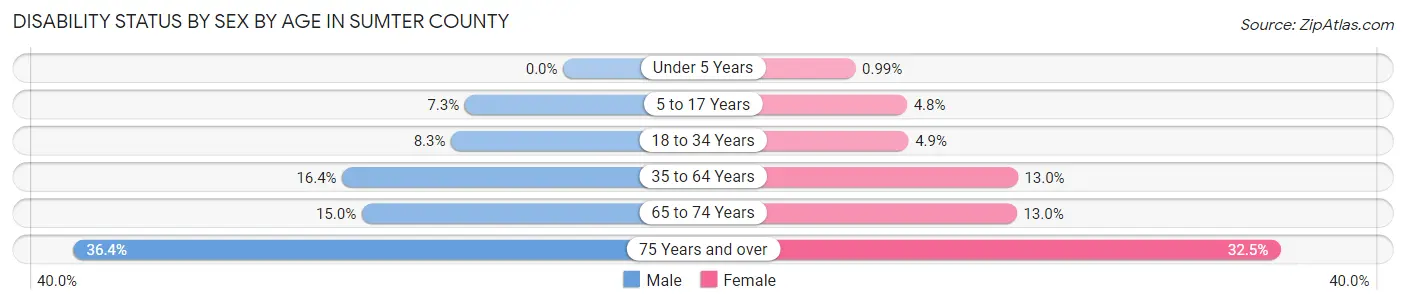
| Age Bracket | Male | Female |
| Under 5 Years | 0 (0.0%) | 12 (1.0%) |
| 5 to 17 Years | 249 (7.3%) | 175 (4.8%) |
| 18 to 34 Years | 373 (8.3%) | 214 (4.9%) |
| 35 to 64 Years | 2,181 (16.4%) | 2,151 (13.0%) |
| 65 to 74 Years | 2,751 (14.9%) | 2,968 (13.0%) |
| 75 Years and over | 6,308 (36.4%) | 5,562 (32.5%) |
Disability Class by Sex by Age in Sumter County
Disability Class: Hearing Difficulty
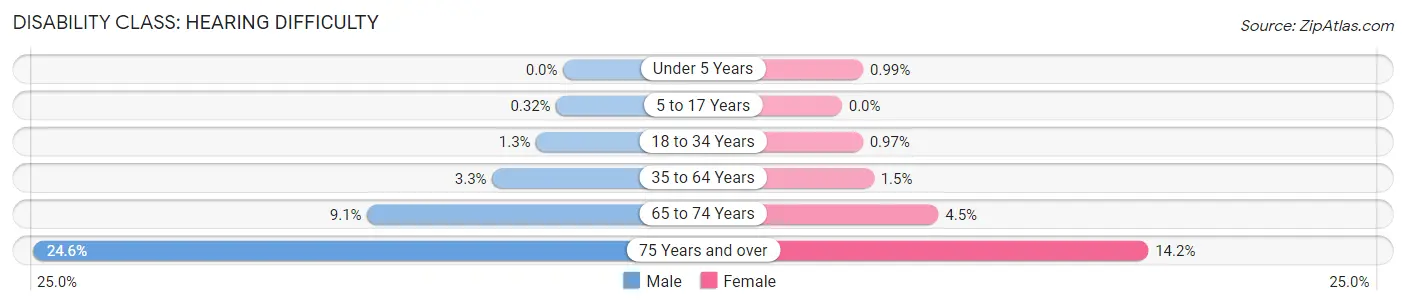
| Age Bracket | Male | Female |
| Under 5 Years | 0 (0.0%) | 12 (1.0%) |
| 5 to 17 Years | 11 (0.3%) | 0 (0.0%) |
| 18 to 34 Years | 56 (1.3%) | 42 (1.0%) |
| 35 to 64 Years | 437 (3.3%) | 245 (1.5%) |
| 65 to 74 Years | 1,673 (9.1%) | 1,025 (4.5%) |
| 75 Years and over | 4,263 (24.6%) | 2,430 (14.2%) |
Disability Class: Vision Difficulty
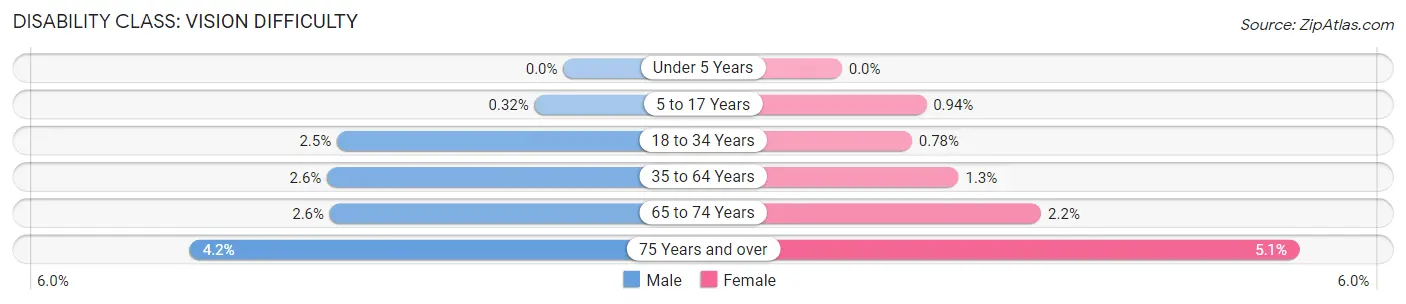
| Age Bracket | Male | Female |
| Under 5 Years | 0 (0.0%) | 0 (0.0%) |
| 5 to 17 Years | 11 (0.3%) | 34 (0.9%) |
| 18 to 34 Years | 113 (2.5%) | 34 (0.8%) |
| 35 to 64 Years | 350 (2.6%) | 214 (1.3%) |
| 65 to 74 Years | 478 (2.6%) | 509 (2.2%) |
| 75 Years and over | 722 (4.2%) | 870 (5.1%) |
Disability Class: Cognitive Difficulty
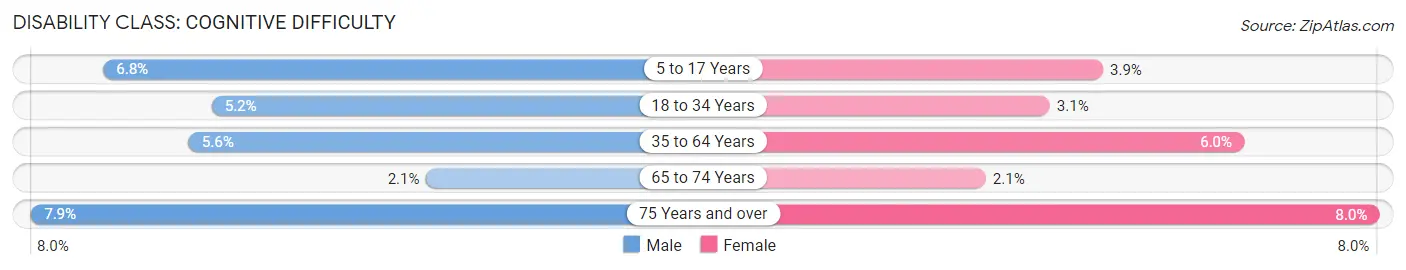
| Age Bracket | Male | Female |
| 5 to 17 Years | 233 (6.8%) | 141 (3.9%) |
| 18 to 34 Years | 234 (5.2%) | 134 (3.1%) |
| 35 to 64 Years | 740 (5.6%) | 985 (6.0%) |
| 65 to 74 Years | 377 (2.1%) | 489 (2.1%) |
| 75 Years and over | 1,371 (7.9%) | 1,364 (8.0%) |
Disability Class: Ambulatory Difficulty
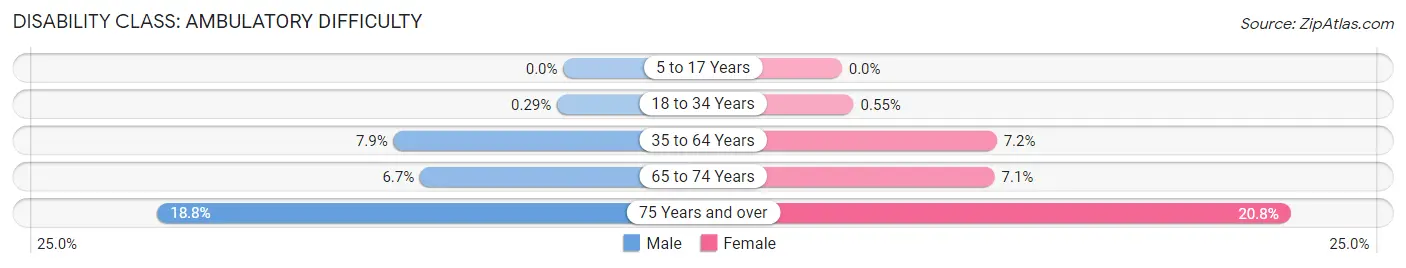
| Age Bracket | Male | Female |
| 5 to 17 Years | 0 (0.0%) | 0 (0.0%) |
| 18 to 34 Years | 13 (0.3%) | 24 (0.5%) |
| 35 to 64 Years | 1,048 (7.9%) | 1,186 (7.2%) |
| 65 to 74 Years | 1,223 (6.7%) | 1,623 (7.1%) |
| 75 Years and over | 3,269 (18.8%) | 3,558 (20.8%) |
Disability Class: Self-Care Difficulty
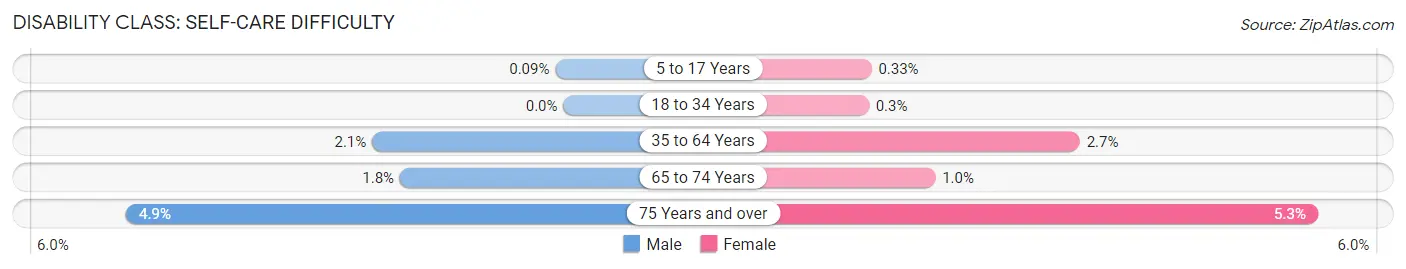
| Age Bracket | Male | Female |
| 5 to 17 Years | 3 (0.1%) | 12 (0.3%) |
| 18 to 34 Years | 0 (0.0%) | 13 (0.3%) |
| 35 to 64 Years | 283 (2.1%) | 437 (2.6%) |
| 65 to 74 Years | 334 (1.8%) | 237 (1.0%) |
| 75 Years and over | 845 (4.9%) | 906 (5.3%) |
Technology Access in Sumter County
Computing Device Access in Sumter County
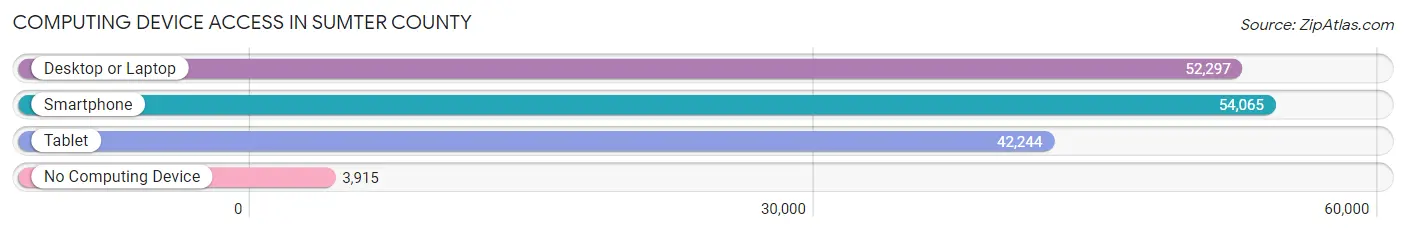
| Device Type | # Households | % Households |
| Desktop or Laptop | 52,297 | 81.3% |
| Smartphone | 54,065 | 84.1% |
| Tablet | 42,244 | 65.7% |
| No Computing Device | 3,915 | 6.1% |
| Total | 64,305 | 100.0% |
Internet Access in Sumter County
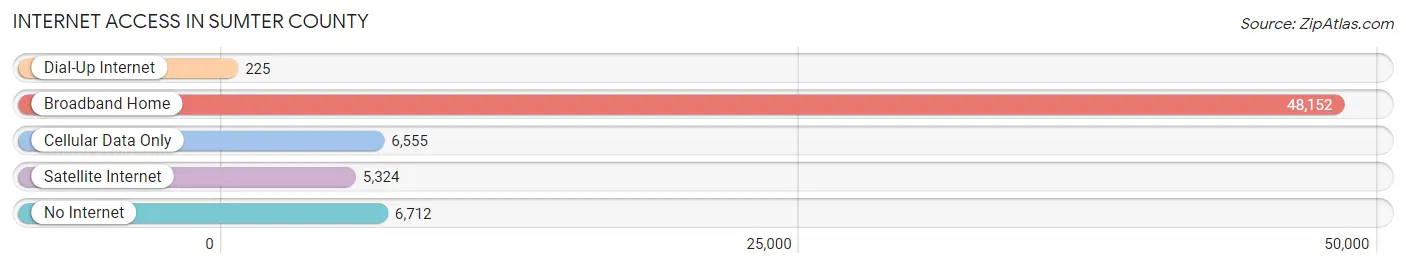
| Internet Type | # Households | % Households |
| Dial-Up Internet | 225 | 0.4% |
| Broadband Home | 48,152 | 74.9% |
| Cellular Data Only | 6,555 | 10.2% |
| Satellite Internet | 5,324 | 8.3% |
| No Internet | 6,712 | 10.4% |
| Total | 64,305 | 100.0% |
Sumter County Summary
Sumter County, Florida is located in the central part of the state and is part of the Tampa Bay Area. It is bordered by Lake County to the north, Marion County to the east, Polk County to the south, and Hernando County to the west. The county seat is Bushnell, and the largest city is The Villages. As of the 2010 census, the population was 93,420.
History
Sumter County was created in 1853 from parts of Alachua, Marion, and Orange counties. It was named for General Thomas Sumter, a Revolutionary War hero. The county was originally part of the Seminole Indian Reservation, and the first settlers were mostly farmers and ranchers.
In the late 19th century, phosphate mining became an important industry in the county. The phosphate industry was a major employer until the mid-20th century, when it began to decline.
In the 1950s, The Villages, a retirement community, was established in Sumter County. It has since become the largest city in the county and one of the fastest-growing cities in the United States.
Geography
Sumter County is located in the central part of Florida, and is part of the Tampa Bay Area. It is bordered by Lake County to the north, Marion County to the east, Polk County to the south, and Hernando County to the west. The county has a total area of 576 square miles, of which 563 square miles is land and 13 square miles is water.
The county is mostly flat, with some rolling hills in the northern part. The highest point in the county is the summit of Iron Mountain, which is located in the northern part of the county and has an elevation of 295 feet.
Economy
The economy of Sumter County is largely based on tourism and retirement. The Villages, a large retirement community, is the largest employer in the county. Other major employers include the Sumter County School District, the Sumter County government, and the Sumter County Sheriff's Office.
The county is also home to several large agricultural operations, including citrus groves, cattle ranches, and vegetable farms. The phosphate mining industry, which was once a major employer in the county, has declined in recent years.
Demographics
As of the 2010 census, there were 93,420 people, 33,945 households, and 25,945 families living in Sumter County. The population density was 166 people per square mile. The racial makeup of the county was 87.3% White, 8.2% African American, 0.5% Native American, 1.2% Asian, 0.1% Pacific Islander, 1.3% from other races, and 1.5% from two or more races. Hispanic or Latino of any race were 5.3% of the population.
The median income for a household in the county was $45,945, and the median income for a family was $51,945. The per capita income for the county was $22,945. About 8.2% of families and 10.3% of the population were below the poverty line, including 14.2% of those under age 18 and 6.2% of those age 65 or over.
Common Questions
What is Per Capita Income in Sumter County?
Per Capita income in Sumter County is $44,431.
What is the Median Family Income in Sumter County?
Median Family Income in Sumter County is $82,977.
What is the Median Household income in Sumter County?
Median Household Income in Sumter County is $70,105.
What is Income or Wage Gap in Sumter County?
Income or Wage Gap in Sumter County is 28.9%.
Women in Sumter County earn 71.1 cents for every dollar earned by a man.
What is Family Income Deficit in Sumter County?
Family Income Deficit in Sumter County is $11,505.
Families that are below poverty line in Sumter County earn $11,505 less on average than the poverty threshold level.
What is Inequality or Gini Index in Sumter County?
Inequality or Gini Index in Sumter County is 0.42.
What is the Total Population of Sumter County?
Total Population of Sumter County is 131,832.
What is the Total Male Population of Sumter County?
Total Male Population of Sumter County is 65,425.
What is the Total Female Population of Sumter County?
Total Female Population of Sumter County is 66,407.
What is the Ratio of Males per 100 Females in Sumter County?
There are 98.52 Males per 100 Females in Sumter County.
What is the Ratio of Females per 100 Males in Sumter County?
There are 101.50 Females per 100 Males in Sumter County.
What is the Median Population Age in Sumter County?
Median Population Age in Sumter County is 68.3 Years.
What is the Average Family Size in Sumter County
Average Family Size in Sumter County is 2.3 People.
What is the Average Household Size in Sumter County
Average Household Size in Sumter County is 1.9 People.
How Large is the Labor Force in Sumter County?
There are 30,252 People in the Labor Forcein in Sumter County.
What is the Percentage of People in the Labor Force in Sumter County?
24.5% of People are in the Labor Force in Sumter County.
What is the Unemployment Rate in Sumter County?
Unemployment Rate in Sumter County is 5.1%.