Putnam County, FL Map & Demographics
Putnam County Map
Putnam County Overview
$25,966
PER CAPITA INCOME
$57,256
AVG FAMILY INCOME
$44,852
AVG HOUSEHOLD INCOME
18.8%
WAGE / INCOME GAP [ % ]
81.2¢/ $1
WAGE / INCOME GAP [ $ ]
$10,867
FAMILY INCOME DEFICIT
0.48
INEQUALITY / GINI INDEX
73,604
TOTAL POPULATION
36,564
MALE POPULATION
37,040
FEMALE POPULATION
98.71
MALES / 100 FEMALES
101.30
FEMALES / 100 MALES
45.1
MEDIAN AGE
3.1
AVG FAMILY SIZE
2.4
AVG HOUSEHOLD SIZE
28,419
LABOR FORCE [ PEOPLE ]
47.7%
PERCENT IN LABOR FORCE
8.9%
UNEMPLOYMENT RATE
Income in Putnam County
Income Overview in Putnam County
Per Capita Income in Putnam County is $25,966, while median incomes of families and households are $57,256 and $44,852 respectively.
| Characteristic | Number | Measure |
| Per Capita Income | 73,604 | $25,966 |
| Median Family Income | 17,758 | $57,256 |
| Mean Family Income | 17,758 | $76,306 |
| Median Household Income | 29,782 | $44,852 |
| Mean Household Income | 29,782 | $62,872 |
| Income Deficit | 17,758 | $10,867 |
| Wage / Income Gap (%) | 73,604 | 18.84% |
| Wage / Income Gap ($) | 73,604 | 81.16¢ per $1 |
| Gini / Inequality Index | 73,604 | 0.48 |
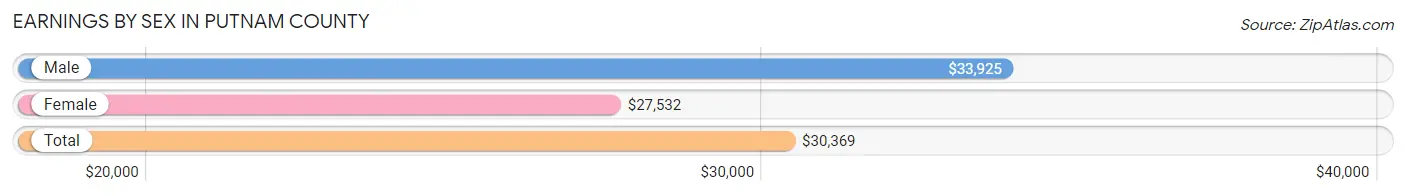
Earnings by Sex in Putnam County
Average Earnings in Putnam County are $30,369, $33,925 for men and $27,532 for women, a difference of 18.8%.
| Sex | Number | Average Earnings |
| Male | 15,584 (52.8%) | $33,925 |
| Female | 13,938 (47.2%) | $27,532 |
| Total | 29,522 (100.0%) | $30,369 |
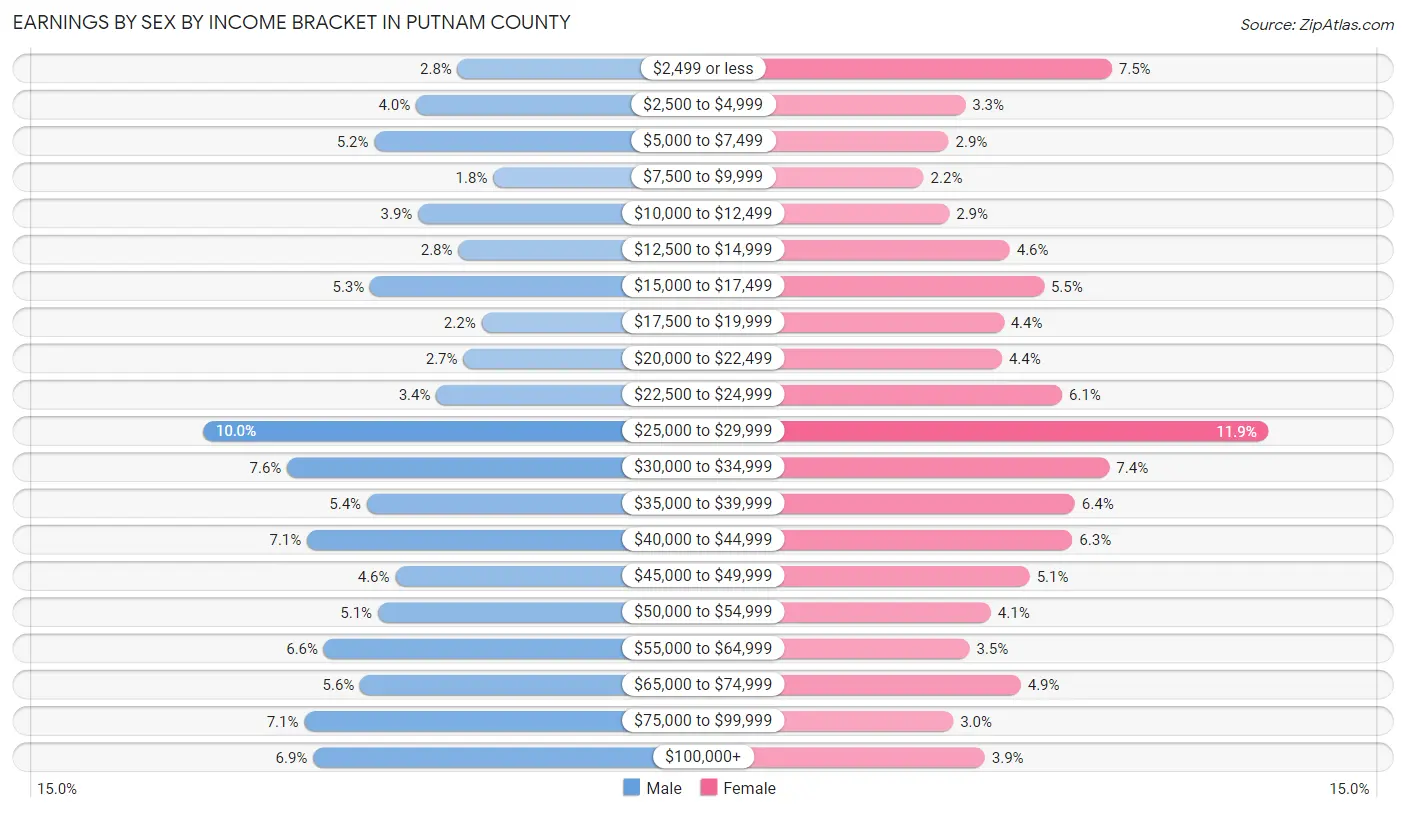
Earnings by Sex by Income Bracket in Putnam County
The most common earnings brackets in Putnam County are $25,000 to $29,999 for men (1,557 | 10.0%) and $25,000 to $29,999 for women (1,651 | 11.8%).
| Income | Male | Female |
| $2,499 or less | 441 (2.8%) | 1,039 (7.4%) |
| $2,500 to $4,999 | 624 (4.0%) | 464 (3.3%) |
| $5,000 to $7,499 | 805 (5.2%) | 398 (2.9%) |
| $7,500 to $9,999 | 285 (1.8%) | 301 (2.2%) |
| $10,000 to $12,499 | 614 (3.9%) | 402 (2.9%) |
| $12,500 to $14,999 | 438 (2.8%) | 639 (4.6%) |
| $15,000 to $17,499 | 824 (5.3%) | 772 (5.5%) |
| $17,500 to $19,999 | 336 (2.2%) | 615 (4.4%) |
| $20,000 to $22,499 | 416 (2.7%) | 608 (4.4%) |
| $22,500 to $24,999 | 535 (3.4%) | 843 (6.0%) |
| $25,000 to $29,999 | 1,557 (10.0%) | 1,651 (11.8%) |
| $30,000 to $34,999 | 1,187 (7.6%) | 1,029 (7.4%) |
| $35,000 to $39,999 | 839 (5.4%) | 893 (6.4%) |
| $40,000 to $44,999 | 1,100 (7.1%) | 884 (6.3%) |
| $45,000 to $49,999 | 713 (4.6%) | 716 (5.1%) |
| $50,000 to $54,999 | 790 (5.1%) | 564 (4.1%) |
| $55,000 to $64,999 | 1,027 (6.6%) | 481 (3.5%) |
| $65,000 to $74,999 | 868 (5.6%) | 681 (4.9%) |
| $75,000 to $99,999 | 1,112 (7.1%) | 417 (3.0%) |
| $100,000+ | 1,073 (6.9%) | 541 (3.9%) |
| Total | 15,584 (100.0%) | 13,938 (100.0%) |
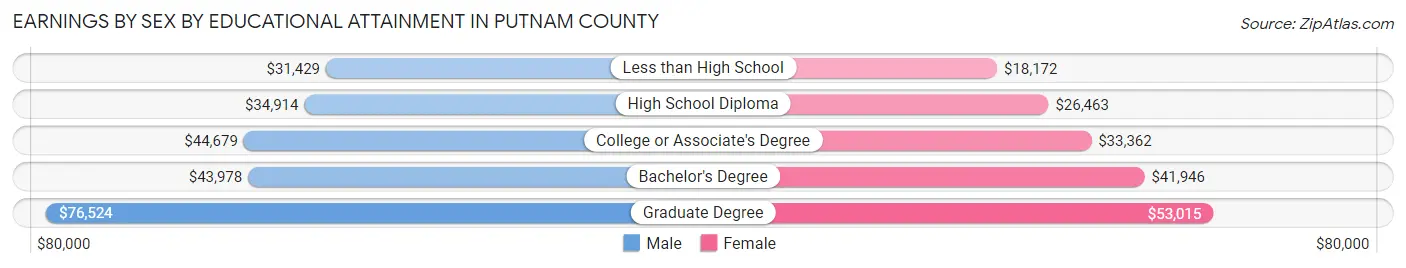
Earnings by Sex by Educational Attainment in Putnam County
Average earnings in Putnam County are $37,816 for men and $29,252 for women, a difference of 22.7%. Men with an educational attainment of graduate degree enjoy the highest average annual earnings of $76,524, while those with less than high school education earn the least with $31,429. Women with an educational attainment of graduate degree earn the most with the average annual earnings of $53,015, while those with less than high school education have the smallest earnings of $18,172.
| Educational Attainment | Male Income | Female Income |
| Less than High School | $31,429 | $18,172 |
| High School Diploma | $34,914 | $26,463 |
| College or Associate's Degree | $44,679 | $33,362 |
| Bachelor's Degree | $43,978 | $41,946 |
| Graduate Degree | $76,524 | $53,015 |
| Total | $37,816 | $29,252 |
Family Income in Putnam County
Family Income Brackets in Putnam County
According to the Putnam County family income data, there are 3,267 families falling into the $50,000 to $74,999 income range, which is the most common income bracket and makes up 18.4% of all families. Conversely, the $10,000 to $14,999 income bracket is the least frequent group with only 355 families (2.0%) belonging to this category.
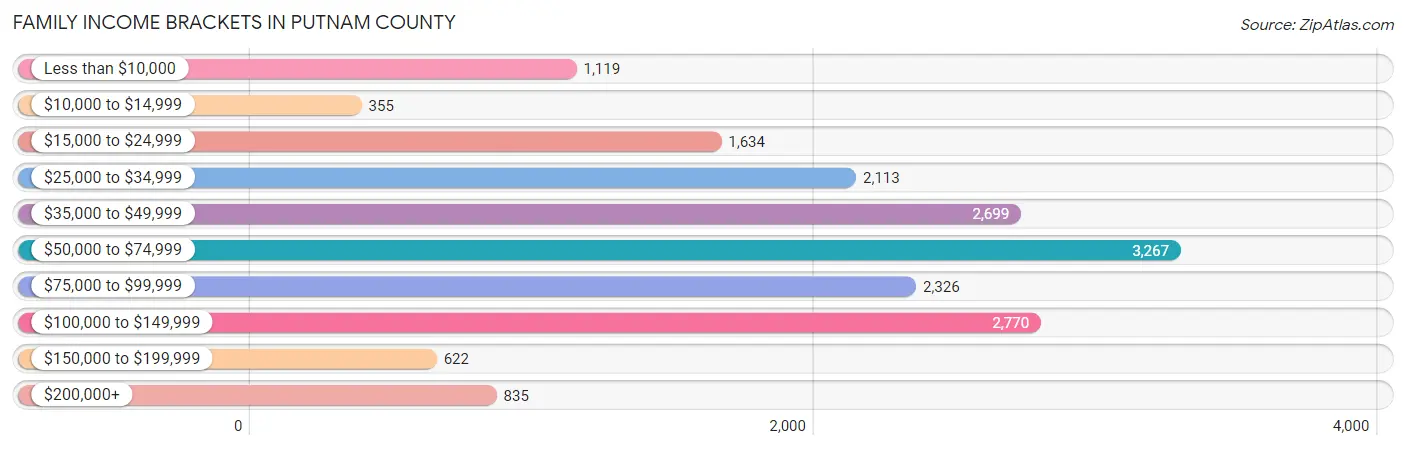
| Income Bracket | # Families | % Families |
| Less than $10,000 | 1,119 | 6.3% |
| $10,000 to $14,999 | 355 | 2.0% |
| $15,000 to $24,999 | 1,634 | 9.2% |
| $25,000 to $34,999 | 2,113 | 11.9% |
| $35,000 to $49,999 | 2,699 | 15.2% |
| $50,000 to $74,999 | 3,267 | 18.4% |
| $75,000 to $99,999 | 2,326 | 13.1% |
| $100,000 to $149,999 | 2,770 | 15.6% |
| $150,000 to $199,999 | 622 | 3.5% |
| $200,000+ | 835 | 4.7% |
Family Income by Famaliy Size in Putnam County
4-person families (2,052 | 11.6%) account for the highest median family income in Putnam County with $77,758 per family, while 2-person families (9,998 | 56.3%) have the highest median income of $28,274 per family member.
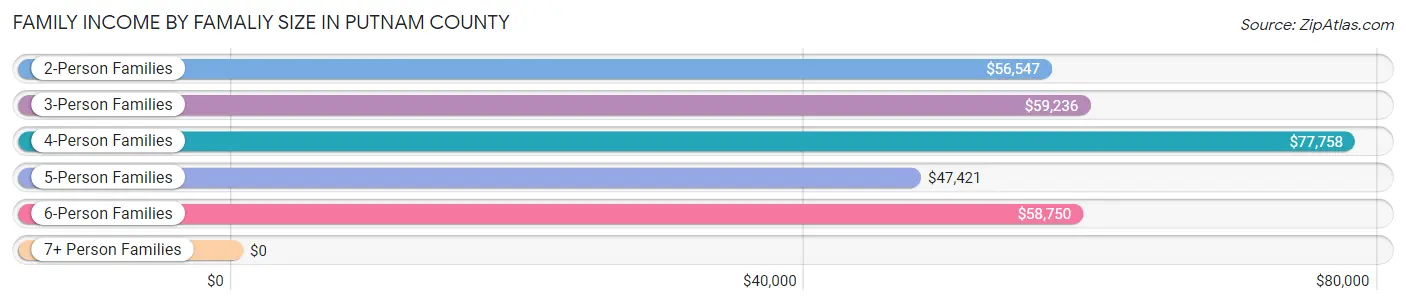
| Income Bracket | # Families | Median Income |
| 2-Person Families | 9,998 (56.3%) | $56,547 |
| 3-Person Families | 3,546 (20.0%) | $59,236 |
| 4-Person Families | 2,052 (11.6%) | $77,758 |
| 5-Person Families | 1,420 (8.0%) | $47,421 |
| 6-Person Families | 404 (2.3%) | $58,750 |
| 7+ Person Families | 338 (1.9%) | $0 |
| Total | 17,758 (100.0%) | $57,256 |
Family Income by Number of Earners in Putnam County
The median family income in Putnam County is $57,256, with families comprising 3+ earners (1,147) having the highest median family income of $120,685, while families with no earners (4,800) have the lowest median family income of $37,997, accounting for 6.5% and 27.0% of families, respectively.
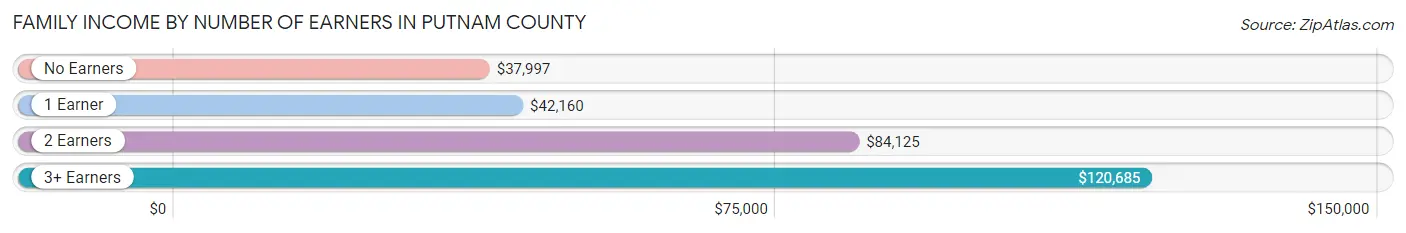
| Number of Earners | # Families | Median Income |
| No Earners | 4,800 (27.0%) | $37,997 |
| 1 Earner | 7,175 (40.4%) | $42,160 |
| 2 Earners | 4,636 (26.1%) | $84,125 |
| 3+ Earners | 1,147 (6.5%) | $120,685 |
| Total | 17,758 (100.0%) | $57,256 |
Household Income in Putnam County
Household Income Brackets in Putnam County
With 5,271 households falling in the category, the $50,000 to $74,999 income range is the most frequent in Putnam County, accounting for 17.7% of all households. In contrast, only 745 households (2.5%) fall into the $150,000 to $199,999 income bracket, making it the least populous group.
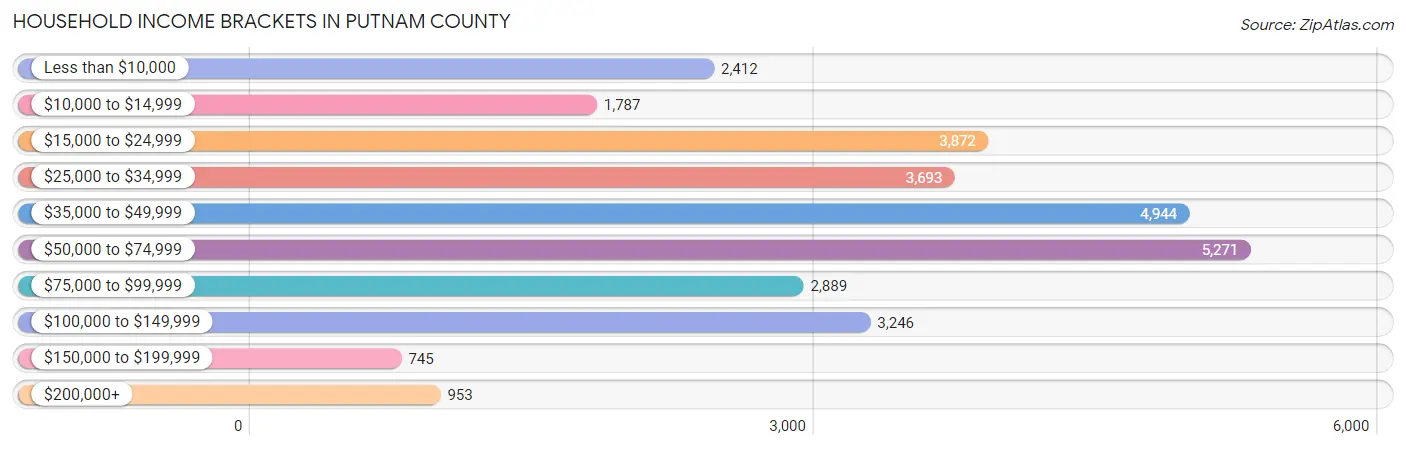
| Income Bracket | # Households | % Households |
| Less than $10,000 | 2,412 | 8.1% |
| $10,000 to $14,999 | 1,787 | 6.0% |
| $15,000 to $24,999 | 3,872 | 13.0% |
| $25,000 to $34,999 | 3,693 | 12.4% |
| $35,000 to $49,999 | 4,944 | 16.6% |
| $50,000 to $74,999 | 5,271 | 17.7% |
| $75,000 to $99,999 | 2,889 | 9.7% |
| $100,000 to $149,999 | 3,246 | 10.9% |
| $150,000 to $199,999 | 745 | 2.5% |
| $200,000+ | 953 | 3.2% |
Household Income by Householder Age in Putnam County
The median household income in Putnam County is $44,852, with the highest median household income of $48,361 found in the 45 to 64 years age bracket for the primary householder. A total of 10,694 households (35.9%) fall into this category. Meanwhile, the 15 to 24 years age bracket for the primary householder has the lowest median household income of $33,430, with 687 households (2.3%) in this group.
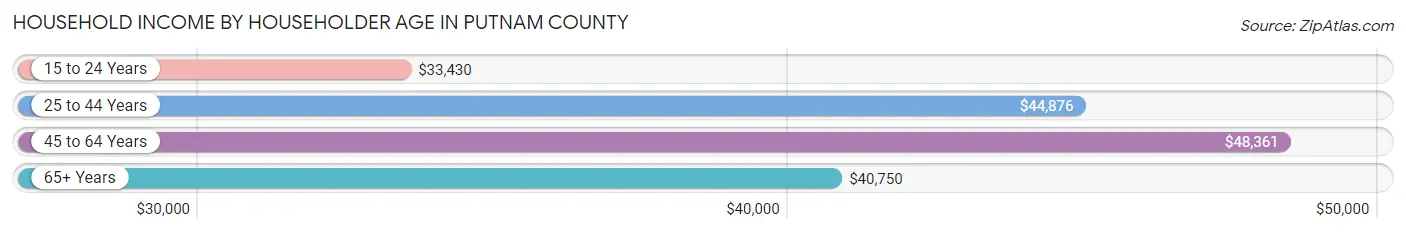
| Income Bracket | # Households | Median Income |
| 15 to 24 Years | 687 (2.3%) | $33,430 |
| 25 to 44 Years | 7,233 (24.3%) | $44,876 |
| 45 to 64 Years | 10,694 (35.9%) | $48,361 |
| 65+ Years | 11,168 (37.5%) | $40,750 |
| Total | 29,782 (100.0%) | $44,852 |
Poverty in Putnam County
Income Below Poverty by Sex and Age in Putnam County
With 19.9% poverty level for males and 25.7% for females among the residents of Putnam County, 15 year old males and 5 year old females are the most vulnerable to poverty, with 153 males (36.3%) and 322 females (62.4%) in their respective age groups living below the poverty level.
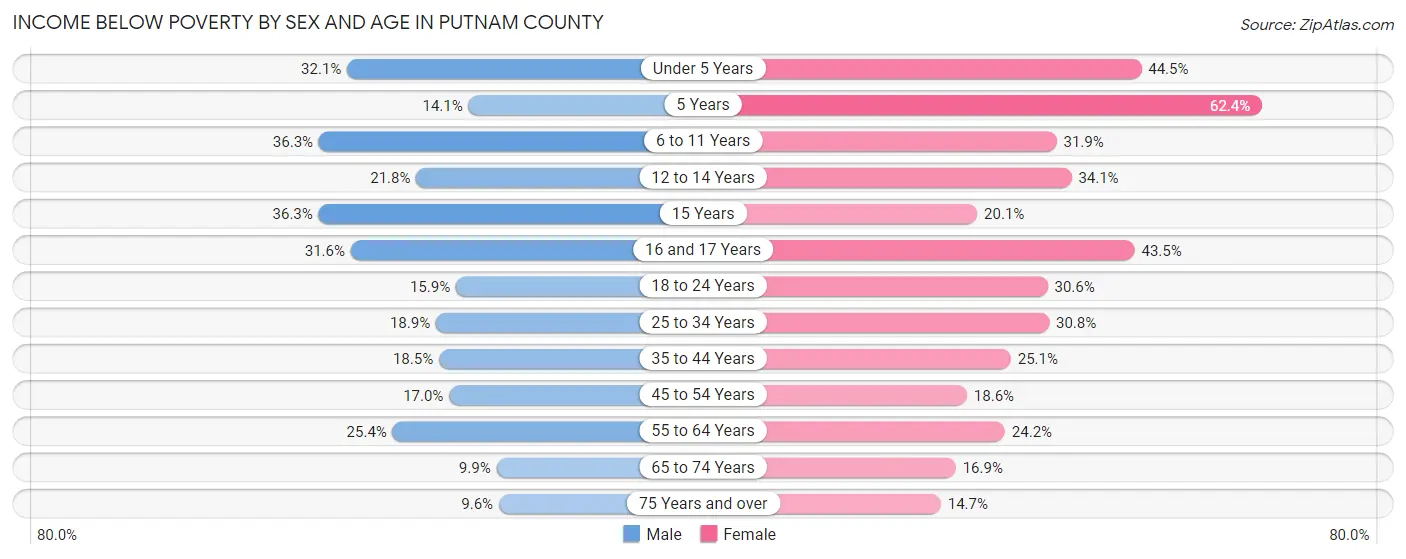
| Age Bracket | Male | Female |
| Under 5 Years | 670 (32.1%) | 885 (44.5%) |
| 5 Years | 79 (14.1%) | 322 (62.4%) |
| 6 to 11 Years | 963 (36.3%) | 650 (31.9%) |
| 12 to 14 Years | 268 (21.8%) | 560 (34.1%) |
| 15 Years | 153 (36.3%) | 121 (20.1%) |
| 16 and 17 Years | 278 (31.6%) | 326 (43.5%) |
| 18 to 24 Years | 416 (15.9%) | 773 (30.5%) |
| 25 to 34 Years | 784 (18.9%) | 1,252 (30.8%) |
| 35 to 44 Years | 640 (18.5%) | 934 (25.1%) |
| 45 to 54 Years | 683 (17.0%) | 772 (18.6%) |
| 55 to 64 Years | 1,373 (25.4%) | 1,417 (24.2%) |
| 65 to 74 Years | 508 (9.9%) | 854 (16.9%) |
| 75 Years and over | 300 (9.6%) | 525 (14.7%) |
| Total | 7,115 (19.9%) | 9,391 (25.7%) |
Income Above Poverty by Sex and Age in Putnam County
According to the poverty statistics in Putnam County, males aged 75 years and over and females aged 75 years and over are the age groups that are most secure financially, with 90.4% of males and 85.3% of females in these age groups living above the poverty line.
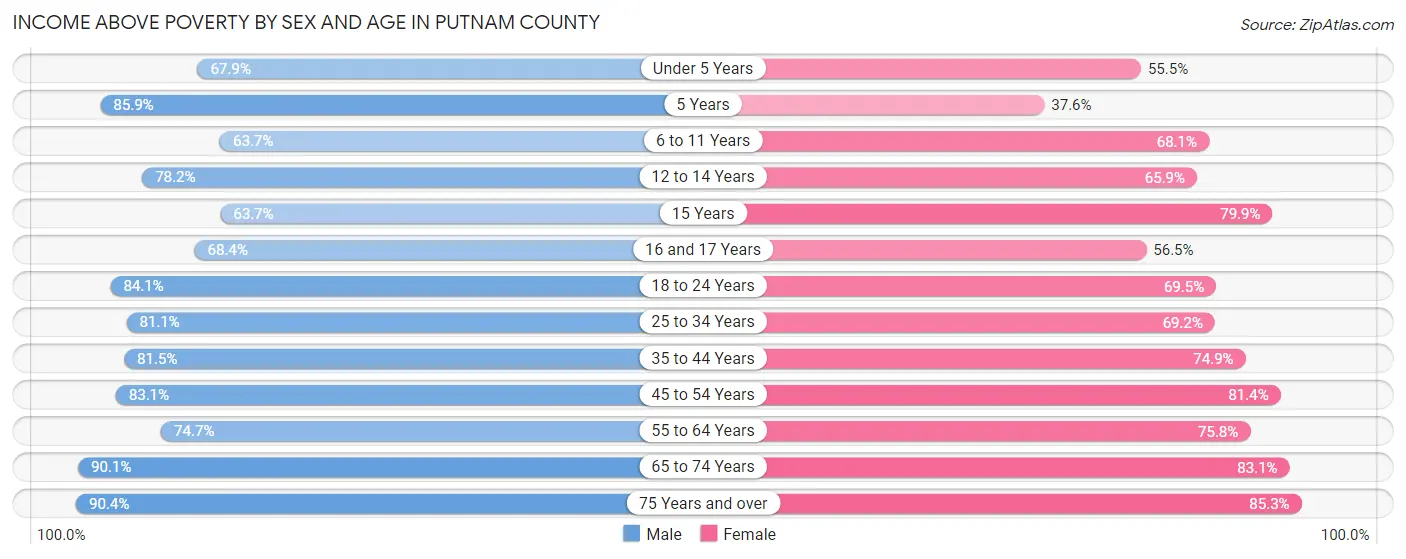
| Age Bracket | Male | Female |
| Under 5 Years | 1,417 (67.9%) | 1,105 (55.5%) |
| 5 Years | 482 (85.9%) | 194 (37.6%) |
| 6 to 11 Years | 1,690 (63.7%) | 1,388 (68.1%) |
| 12 to 14 Years | 959 (78.2%) | 1,082 (65.9%) |
| 15 Years | 268 (63.7%) | 481 (79.9%) |
| 16 and 17 Years | 603 (68.4%) | 424 (56.5%) |
| 18 to 24 Years | 2,194 (84.1%) | 1,757 (69.5%) |
| 25 to 34 Years | 3,363 (81.1%) | 2,816 (69.2%) |
| 35 to 44 Years | 2,825 (81.5%) | 2,788 (74.9%) |
| 45 to 54 Years | 3,346 (83.1%) | 3,384 (81.4%) |
| 55 to 64 Years | 4,044 (74.7%) | 4,433 (75.8%) |
| 65 to 74 Years | 4,610 (90.1%) | 4,192 (83.1%) |
| 75 Years and over | 2,839 (90.4%) | 3,047 (85.3%) |
| Total | 28,640 (80.1%) | 27,091 (74.3%) |
Income Below Poverty Among Married-Couple Families in Putnam County
The poverty statistics for married-couple families in Putnam County show that 9.3% or 1,081 of the total 11,651 families live below the poverty line. Families with 5 or more children have the highest poverty rate of 64.4%, comprising of 47 families. On the other hand, families with no children have the lowest poverty rate of 7.4%, which includes 609 families.
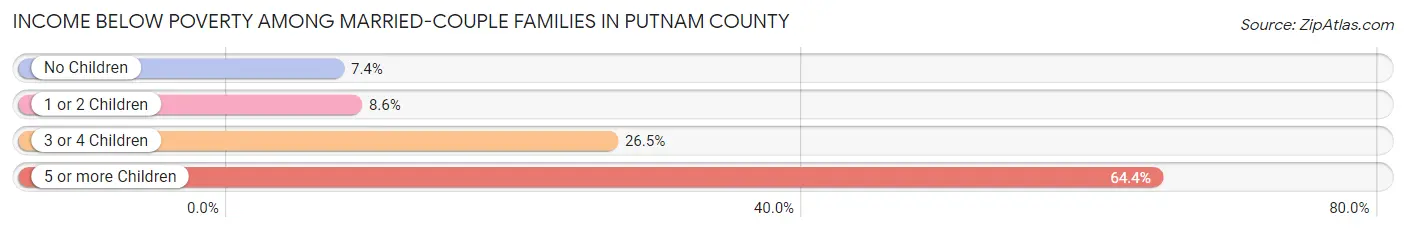
| Children | Above Poverty | Below Poverty |
| No Children | 7,638 (92.6%) | 609 (7.4%) |
| 1 or 2 Children | 2,339 (91.4%) | 221 (8.6%) |
| 3 or 4 Children | 567 (73.5%) | 204 (26.5%) |
| 5 or more Children | 26 (35.6%) | 47 (64.4%) |
| Total | 10,570 (90.7%) | 1,081 (9.3%) |
Income Below Poverty Among Single-Parent Households in Putnam County
According to the poverty data in Putnam County, 15.1% or 236 single-father households and 35.6% or 1,618 single-mother households are living below the poverty line. Among single-father households, those with 3 or 4 children have the highest poverty rate, with 163 households (81.9%) experiencing poverty. Likewise, among single-mother households, those with 5 or more children have the highest poverty rate, with 44 households (62.0%) falling below the poverty line.
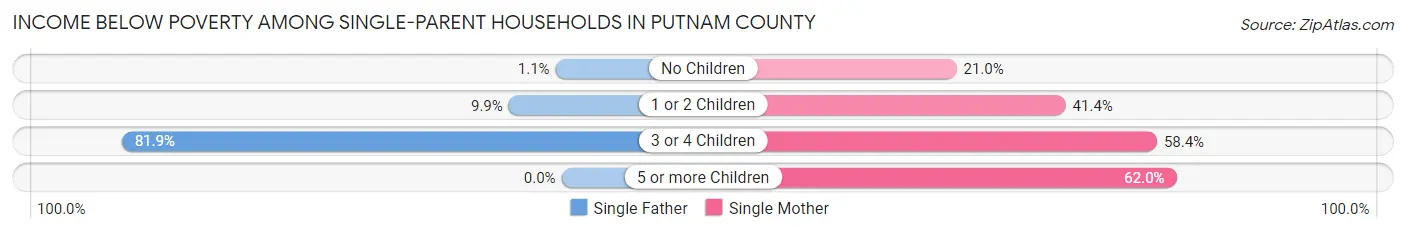
| Children | Single Father | Single Mother |
| No Children | 8 (1.1%) | 368 (21.0%) |
| 1 or 2 Children | 65 (9.9%) | 930 (41.3%) |
| 3 or 4 Children | 163 (81.9%) | 276 (58.4%) |
| 5 or more Children | 0 (0.0%) | 44 (62.0%) |
| Total | 236 (15.1%) | 1,618 (35.6%) |
Income Below Poverty Among Married-Couple vs Single-Parent Households in Putnam County
The poverty data for Putnam County shows that 1,081 of the married-couple family households (9.3%) and 1,854 of the single-parent households (30.4%) are living below the poverty level. Within the married-couple family households, those with 5 or more children have the highest poverty rate, with 47 households (64.4%) falling below the poverty line. Among the single-parent households, those with 3 or 4 children have the highest poverty rate, with 439 household (65.3%) living below poverty.
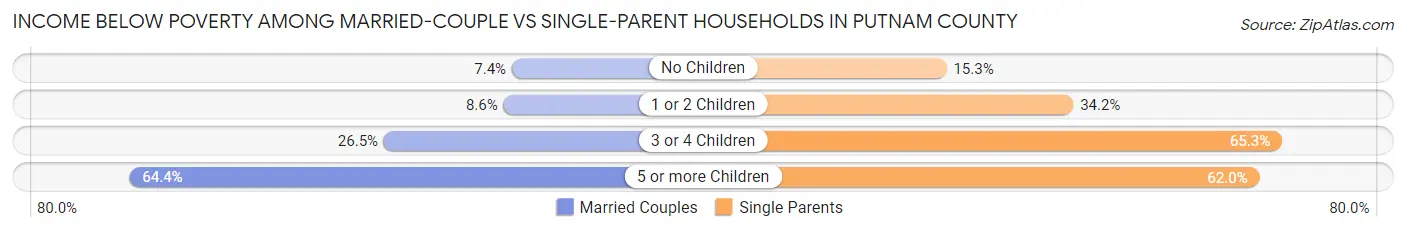
| Children | Married-Couple Families | Single-Parent Households |
| No Children | 609 (7.4%) | 376 (15.3%) |
| 1 or 2 Children | 221 (8.6%) | 995 (34.2%) |
| 3 or 4 Children | 204 (26.5%) | 439 (65.3%) |
| 5 or more Children | 47 (64.4%) | 44 (62.0%) |
| Total | 1,081 (9.3%) | 1,854 (30.4%) |
Race in Putnam County
The most populous races in Putnam County are White / Caucasian (54,928 | 74.6%), Black / African American (11,620 | 15.8%), and Hispanic or Latino (7,727 | 10.5%).
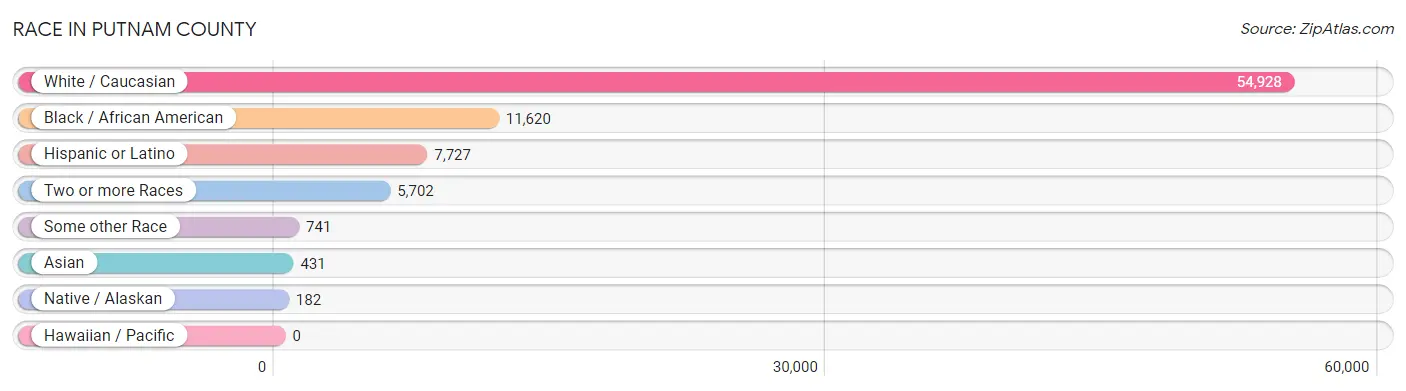
| Race | # Population | % Population |
| Asian | 431 | 0.6% |
| Black / African American | 11,620 | 15.8% |
| Hawaiian / Pacific | 0 | 0.0% |
| Hispanic or Latino | 7,727 | 10.5% |
| Native / Alaskan | 182 | 0.3% |
| White / Caucasian | 54,928 | 74.6% |
| Two or more Races | 5,702 | 7.7% |
| Some other Race | 741 | 1.0% |
| Total | 73,604 | 100.0% |
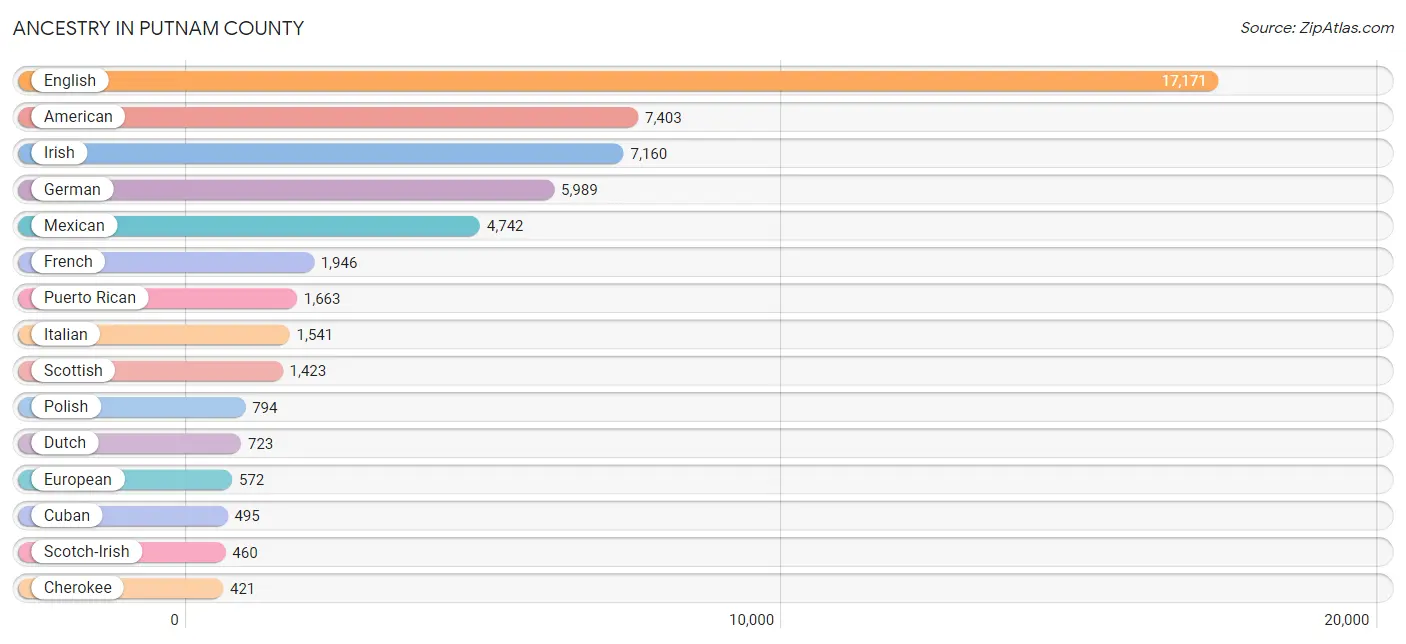
Ancestry in Putnam County
The most populous ancestries reported in Putnam County are English (17,171 | 23.3%), American (7,403 | 10.1%), Irish (7,160 | 9.7%), German (5,989 | 8.1%), and Mexican (4,742 | 6.4%), together accounting for 57.7% of all Putnam County residents.
| Ancestry | # Population | % Population |
| African | 273 | 0.4% |
| American | 7,403 | 10.1% |
| Arab | 17 | 0.0% |
| Austrian | 77 | 0.1% |
| Bahamian | 94 | 0.1% |
| Belgian | 8 | 0.0% |
| Bhutanese | 37 | 0.1% |
| Blackfeet | 54 | 0.1% |
| Brazilian | 39 | 0.1% |
| British | 276 | 0.4% |
| Burmese | 15 | 0.0% |
| Canadian | 266 | 0.4% |
| Central American | 187 | 0.3% |
| Central American Indian | 3 | 0.0% |
| Cherokee | 421 | 0.6% |
| Choctaw | 3 | 0.0% |
| Colombian | 182 | 0.3% |
| Comanche | 4 | 0.0% |
| Creek | 19 | 0.0% |
| Crow | 18 | 0.0% |
| Cuban | 495 | 0.7% |
| Czech | 8 | 0.0% |
| Czechoslovakian | 169 | 0.2% |
| Danish | 139 | 0.2% |
| Dominican | 56 | 0.1% |
| Dutch | 723 | 1.0% |
| Eastern European | 46 | 0.1% |
| Ecuadorian | 68 | 0.1% |
| English | 17,171 | 23.3% |
| European | 572 | 0.8% |
| Finnish | 26 | 0.0% |
| French | 1,946 | 2.6% |
| French American Indian | 15 | 0.0% |
| French Canadian | 281 | 0.4% |
| German | 5,989 | 8.1% |
| German Russian | 5 | 0.0% |
| Greek | 2 | 0.0% |
| Guatemalan | 68 | 0.1% |
| Haitian | 8 | 0.0% |
| Honduran | 57 | 0.1% |
| Hungarian | 173 | 0.2% |
| Indian (Asian) | 129 | 0.2% |
| Inupiat | 34 | 0.1% |
| Irish | 7,160 | 9.7% |
| Italian | 1,541 | 2.1% |
| Jamaican | 129 | 0.2% |
| Korean | 130 | 0.2% |
| Lebanese | 2 | 0.0% |
| Lithuanian | 15 | 0.0% |
| Luxembourger | 9 | 0.0% |
| Malaysian | 130 | 0.2% |
| Mexican | 4,742 | 6.4% |
| Native Hawaiian | 77 | 0.1% |
| Nicaraguan | 57 | 0.1% |
| Northern European | 93 | 0.1% |
| Norwegian | 127 | 0.2% |
| Osage | 11 | 0.0% |
| Pakistani | 4 | 0.0% |
| Polish | 794 | 1.1% |
| Portuguese | 147 | 0.2% |
| Puerto Rican | 1,663 | 2.3% |
| Romanian | 18 | 0.0% |
| Russian | 136 | 0.2% |
| Salvadoran | 5 | 0.0% |
| Scandinavian | 187 | 0.3% |
| Scotch-Irish | 460 | 0.6% |
| Scottish | 1,423 | 1.9% |
| Seminole | 9 | 0.0% |
| Sioux | 10 | 0.0% |
| Slovak | 48 | 0.1% |
| South American | 262 | 0.4% |
| Spaniard | 181 | 0.3% |
| Spanish | 107 | 0.2% |
| Sri Lankan | 22 | 0.0% |
| Subsaharan African | 273 | 0.4% |
| Swedish | 410 | 0.6% |
| Swiss | 34 | 0.1% |
| Thai | 2 | 0.0% |
| Ukrainian | 138 | 0.2% |
| Venezuelan | 12 | 0.0% |
| Vietnamese | 89 | 0.1% |
| Welsh | 372 | 0.5% |
| Yugoslavian | 5 | 0.0% | View All 83 Rows |
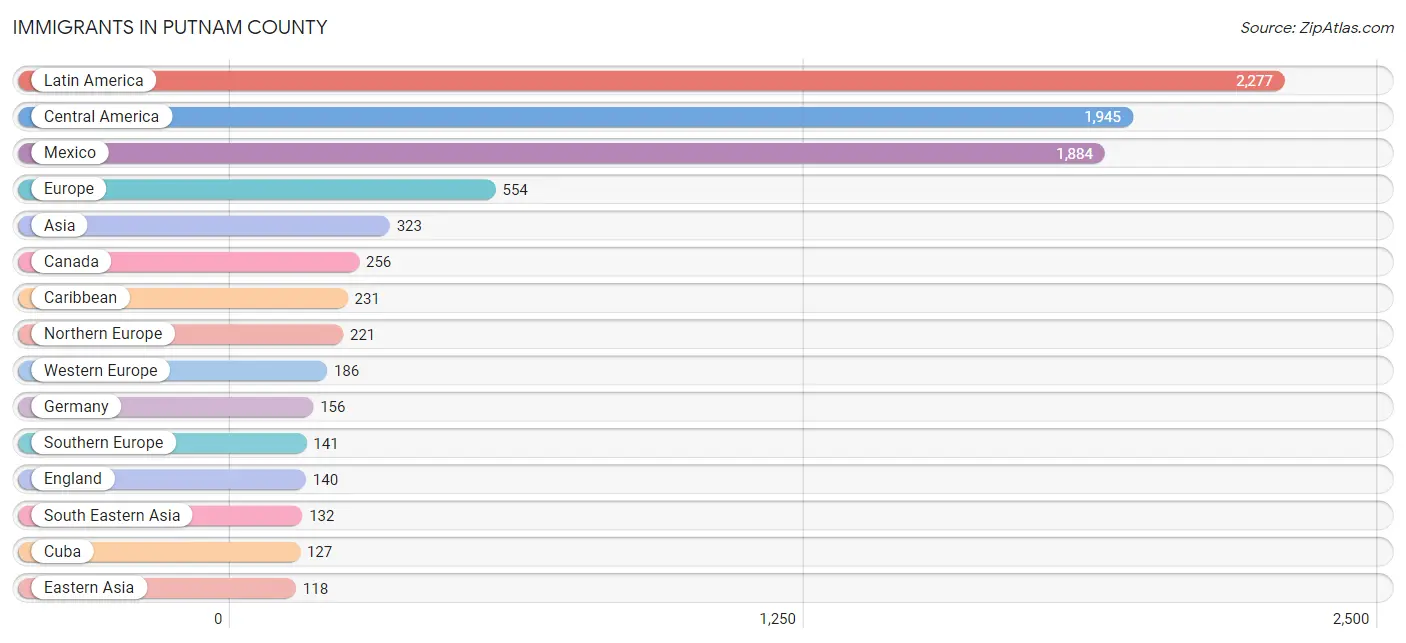
Immigrants in Putnam County
The most numerous immigrant groups reported in Putnam County came from Latin America (2,277 | 3.1%), Central America (1,945 | 2.6%), Mexico (1,884 | 2.6%), Europe (554 | 0.7%), and Asia (323 | 0.4%), together accounting for 9.5% of all Putnam County residents.
| Immigration Origin | # Population | % Population |
| Africa | 43 | 0.1% |
| Argentina | 9 | 0.0% |
| Asia | 323 | 0.4% |
| Bangladesh | 73 | 0.1% |
| Belgium | 7 | 0.0% |
| Brazil | 32 | 0.0% |
| Canada | 256 | 0.4% |
| Caribbean | 231 | 0.3% |
| Central America | 1,945 | 2.6% |
| China | 114 | 0.2% |
| Colombia | 17 | 0.0% |
| Cuba | 127 | 0.2% |
| Dominican Republic | 21 | 0.0% |
| Eastern Asia | 118 | 0.2% |
| Eastern Europe | 6 | 0.0% |
| Ecuador | 23 | 0.0% |
| England | 140 | 0.2% |
| Europe | 554 | 0.7% |
| France | 5 | 0.0% |
| Germany | 156 | 0.2% |
| Guatemala | 49 | 0.1% |
| Honduras | 6 | 0.0% |
| Hungary | 6 | 0.0% |
| Italy | 59 | 0.1% |
| Jamaica | 75 | 0.1% |
| Korea | 4 | 0.0% |
| Laos | 99 | 0.1% |
| Latin America | 2,277 | 3.1% |
| Mexico | 1,884 | 2.6% |
| Netherlands | 18 | 0.0% |
| Nicaragua | 6 | 0.0% |
| Northern Africa | 15 | 0.0% |
| Northern Europe | 221 | 0.3% |
| Philippines | 26 | 0.0% |
| Portugal | 61 | 0.1% |
| South Africa | 15 | 0.0% |
| South America | 101 | 0.1% |
| South Central Asia | 73 | 0.1% |
| South Eastern Asia | 132 | 0.2% |
| Southern Europe | 141 | 0.2% |
| Spain | 21 | 0.0% |
| Venezuela | 20 | 0.0% |
| Vietnam | 7 | 0.0% |
| Western Europe | 186 | 0.3% | View All 44 Rows |
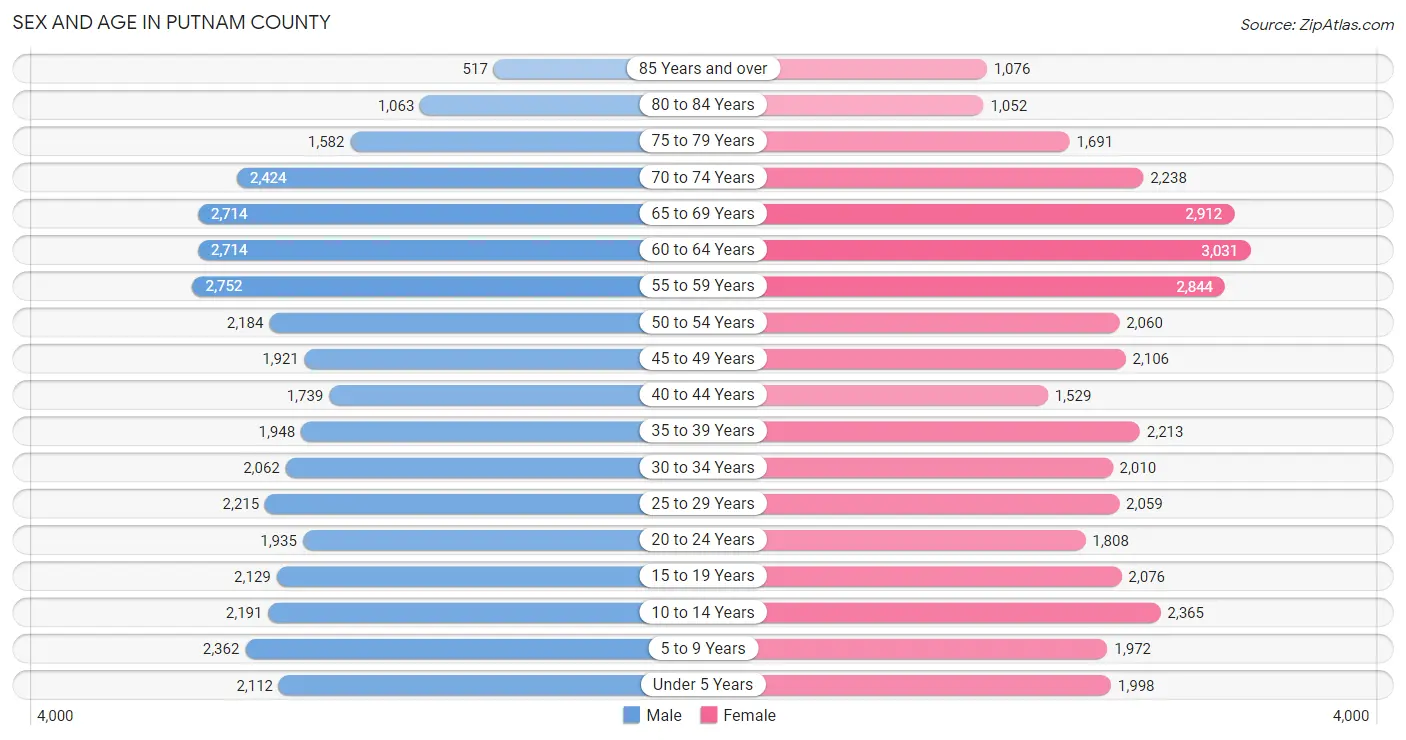
Sex and Age in Putnam County
Sex and Age in Putnam County
The most populous age groups in Putnam County are 55 to 59 Years (2,752 | 7.5%) for men and 60 to 64 Years (3,031 | 8.2%) for women.
| Age Bracket | Male | Female |
| Under 5 Years | 2,112 (5.8%) | 1,998 (5.4%) |
| 5 to 9 Years | 2,362 (6.5%) | 1,972 (5.3%) |
| 10 to 14 Years | 2,191 (6.0%) | 2,365 (6.4%) |
| 15 to 19 Years | 2,129 (5.8%) | 2,076 (5.6%) |
| 20 to 24 Years | 1,935 (5.3%) | 1,808 (4.9%) |
| 25 to 29 Years | 2,215 (6.1%) | 2,059 (5.6%) |
| 30 to 34 Years | 2,062 (5.6%) | 2,010 (5.4%) |
| 35 to 39 Years | 1,948 (5.3%) | 2,213 (6.0%) |
| 40 to 44 Years | 1,739 (4.8%) | 1,529 (4.1%) |
| 45 to 49 Years | 1,921 (5.2%) | 2,106 (5.7%) |
| 50 to 54 Years | 2,184 (6.0%) | 2,060 (5.6%) |
| 55 to 59 Years | 2,752 (7.5%) | 2,844 (7.7%) |
| 60 to 64 Years | 2,714 (7.4%) | 3,031 (8.2%) |
| 65 to 69 Years | 2,714 (7.4%) | 2,912 (7.9%) |
| 70 to 74 Years | 2,424 (6.6%) | 2,238 (6.0%) |
| 75 to 79 Years | 1,582 (4.3%) | 1,691 (4.6%) |
| 80 to 84 Years | 1,063 (2.9%) | 1,052 (2.8%) |
| 85 Years and over | 517 (1.4%) | 1,076 (2.9%) |
| Total | 36,564 (100.0%) | 37,040 (100.0%) |
Families and Households in Putnam County
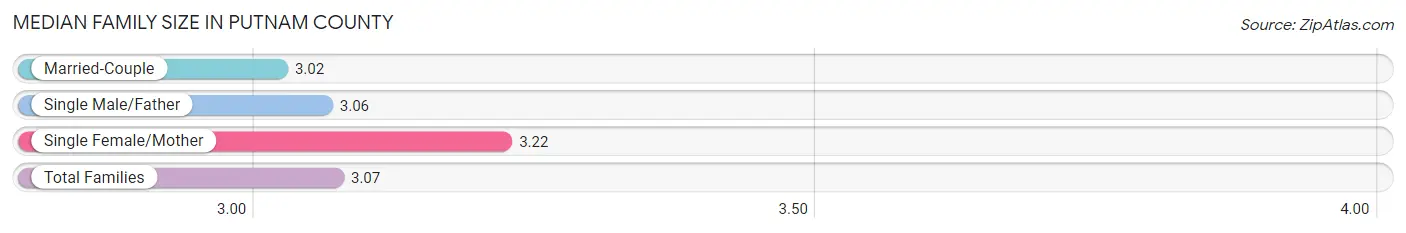
Median Family Size in Putnam County
The median family size in Putnam County is 3.07 persons per family, with single female/mother families (4,543 | 25.6%) accounting for the largest median family size of 3.22 persons per family. On the other hand, married-couple families (11,651 | 65.6%) represent the smallest median family size with 3.02 persons per family.
| Family Type | # Families | Family Size |
| Married-Couple | 11,651 (65.6%) | 3.02 |
| Single Male/Father | 1,564 (8.8%) | 3.06 |
| Single Female/Mother | 4,543 (25.6%) | 3.22 |
| Total Families | 17,758 (100.0%) | 3.07 |
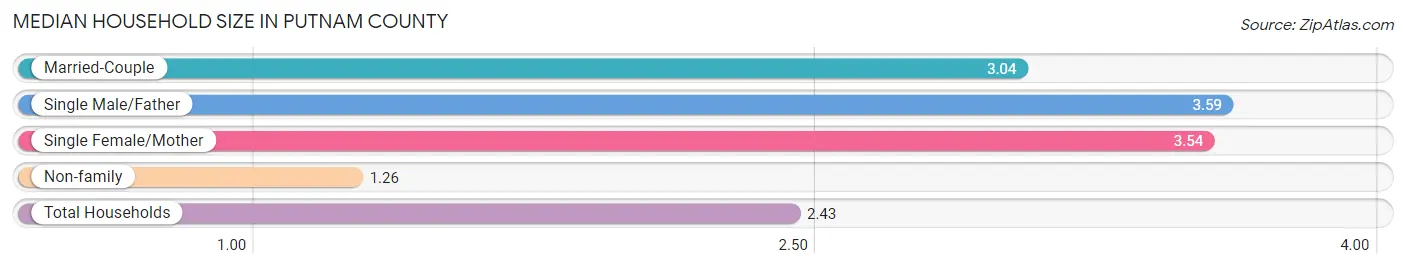
Median Household Size in Putnam County
The median household size in Putnam County is 2.43 persons per household, with single male/father households (1,564 | 5.2%) accounting for the largest median household size of 3.59 persons per household. non-family households (12,024 | 40.4%) represent the smallest median household size with 1.26 persons per household.
| Household Type | # Households | Household Size |
| Married-Couple | 11,651 (39.1%) | 3.04 |
| Single Male/Father | 1,564 (5.2%) | 3.59 |
| Single Female/Mother | 4,543 (15.2%) | 3.54 |
| Non-family | 12,024 (40.4%) | 1.26 |
| Total Households | 29,782 (100.0%) | 2.43 |
Household Size by Marriage Status in Putnam County
Out of a total of 29,782 households in Putnam County, 17,758 (59.6%) are family households, while 12,024 (40.4%) are nonfamily households. The most numerous type of family households are 2-person households, comprising 9,202, and the most common type of nonfamily households are 1-person households, comprising 9,637.
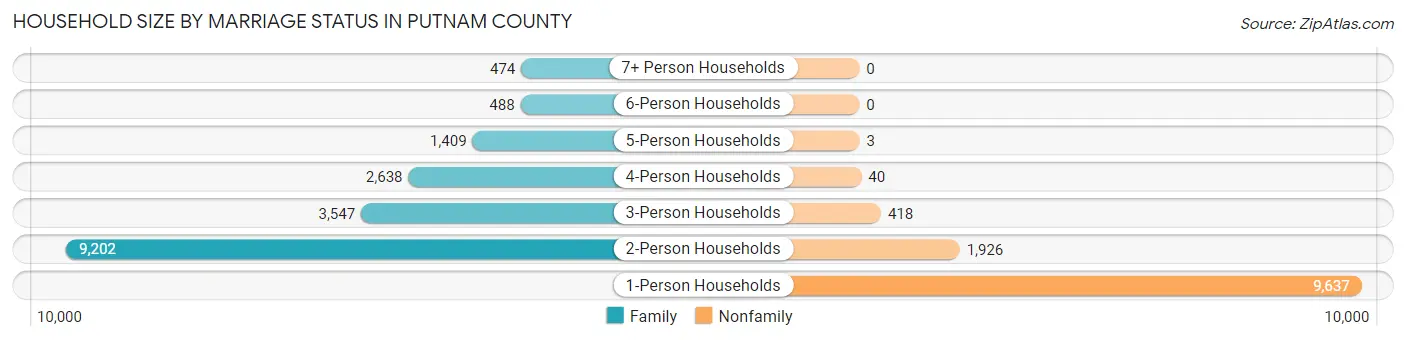
| Household Size | Family Households | Nonfamily Households |
| 1-Person Households | - | 9,637 (32.4%) |
| 2-Person Households | 9,202 (30.9%) | 1,926 (6.5%) |
| 3-Person Households | 3,547 (11.9%) | 418 (1.4%) |
| 4-Person Households | 2,638 (8.9%) | 40 (0.1%) |
| 5-Person Households | 1,409 (4.7%) | 3 (0.0%) |
| 6-Person Households | 488 (1.6%) | 0 (0.0%) |
| 7+ Person Households | 474 (1.6%) | 0 (0.0%) |
| Total | 17,758 (59.6%) | 12,024 (40.4%) |
Female Fertility in Putnam County
Fertility by Age in Putnam County
Average fertility rate in Putnam County is 64.0 births per 1,000 women. Women in the age bracket of 20 to 34 years have the highest fertility rate with 145.0 births per 1,000 women. Women in the age bracket of 20 to 34 years acount for 93.0% of all women with births.
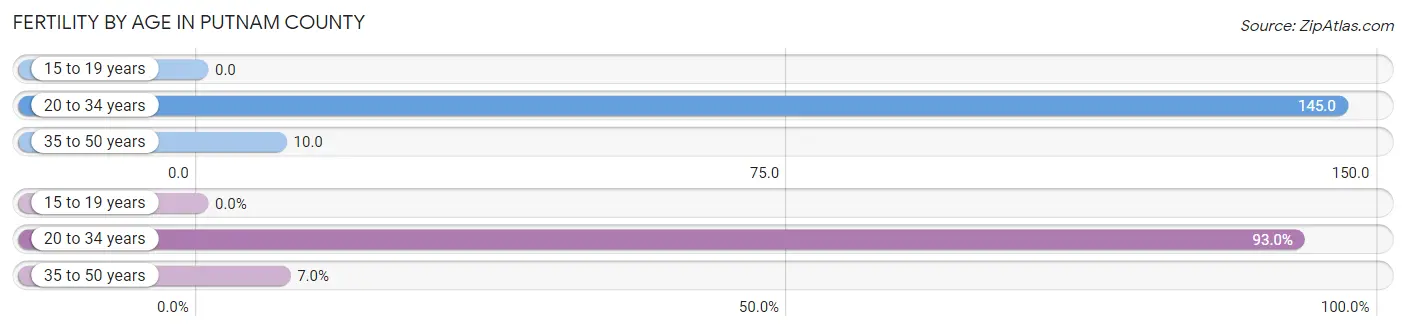
| Age Bracket | Women with Births | Births / 1,000 Women |
| 15 to 19 years | 0 (0.0%) | 0.0 |
| 20 to 34 years | 854 (93.0%) | 145.0 |
| 35 to 50 years | 64 (7.0%) | 10.0 |
| Total | 918 (100.0%) | 64.0 |
Fertility by Age by Marriage Status in Putnam County
32.4% of women with births (918) in Putnam County are married. The highest percentage of unmarried women with births falls into 20 to 34 years age bracket with 69.8% of them unmarried at the time of birth, while the lowest percentage of unmarried women with births belong to 35 to 50 years age bracket with 39.1% of them unmarried.
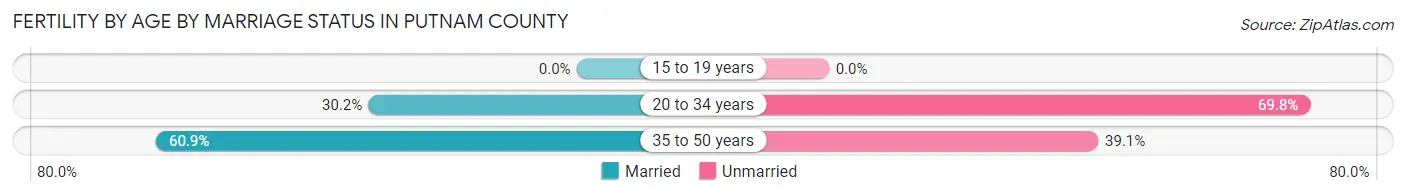
| Age Bracket | Married | Unmarried |
| 15 to 19 years | 0 (0.0%) | 0 (0.0%) |
| 20 to 34 years | 258 (30.2%) | 596 (69.8%) |
| 35 to 50 years | 39 (60.9%) | 25 (39.1%) |
| Total | 297 (32.4%) | 621 (67.6%) |
Fertility by Education in Putnam County
Average fertility rate in Putnam County is 64.0 births per 1,000 women. Women with the education attainment of high school diploma have the highest fertility rate of 105.0 births per 1,000 women, while women with the education attainment of less than high school have the lowest fertility at 18.0 births per 1,000 women. Women with the education attainment of high school diploma represent 52.9% of all women with births.
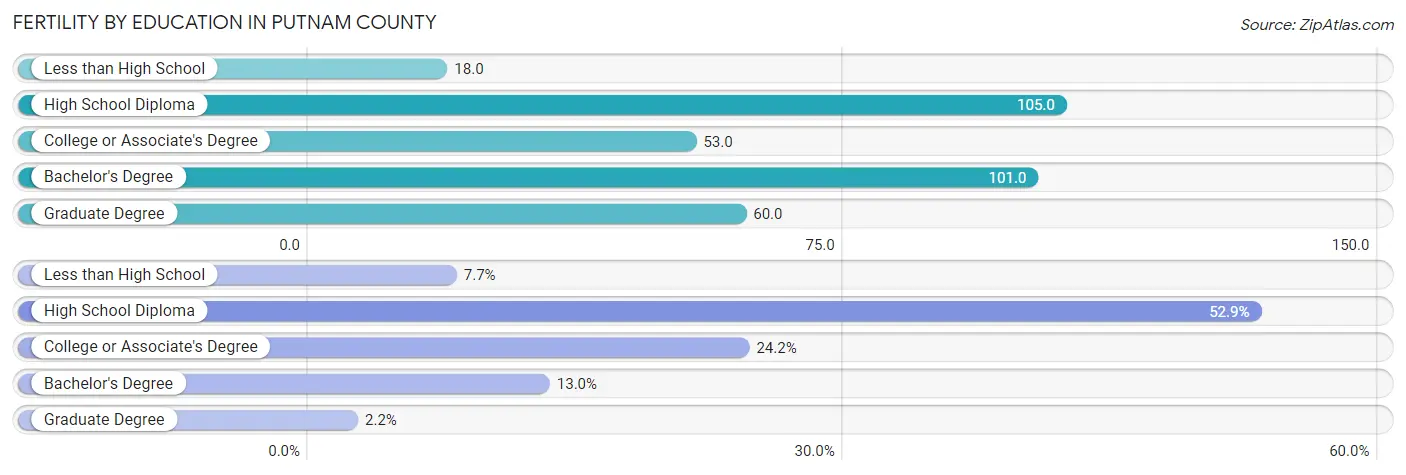
| Educational Attainment | Women with Births | Births / 1,000 Women |
| Less than High School | 71 (7.7%) | 18.0 |
| High School Diploma | 486 (52.9%) | 105.0 |
| College or Associate's Degree | 222 (24.2%) | 53.0 |
| Bachelor's Degree | 119 (13.0%) | 101.0 |
| Graduate Degree | 20 (2.2%) | 60.0 |
| Total | 918 (100.0%) | 64.0 |
Fertility by Education by Marriage Status in Putnam County
67.6% of women with births in Putnam County are unmarried. Women with the educational attainment of graduate degree are most likely to be married with 100.0% of them married at childbirth, while women with the educational attainment of high school diploma are least likely to be married with 75.9% of them unmarried at childbirth.
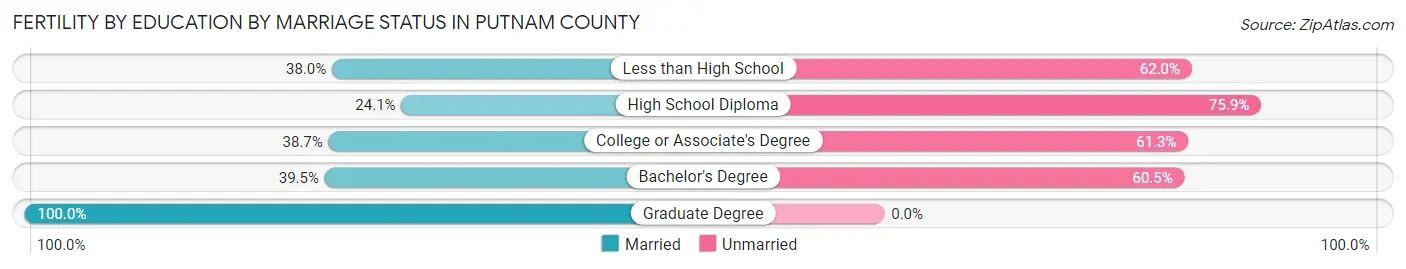
| Educational Attainment | Married | Unmarried |
| Less than High School | 27 (38.0%) | 44 (62.0%) |
| High School Diploma | 117 (24.1%) | 369 (75.9%) |
| College or Associate's Degree | 86 (38.7%) | 136 (61.3%) |
| Bachelor's Degree | 47 (39.5%) | 72 (60.5%) |
| Graduate Degree | 20 (100.0%) | 0 (0.0%) |
| Total | 297 (32.4%) | 621 (67.6%) |
Employment Characteristics in Putnam County
Employment by Class of Employer in Putnam County
Among the 25,550 employed individuals in Putnam County, private company employees (16,742 | 65.5%), local government employees (2,539 | 9.9%), and self-employed (not incorporated) (1,631 | 6.4%) make up the most common classes of employment.
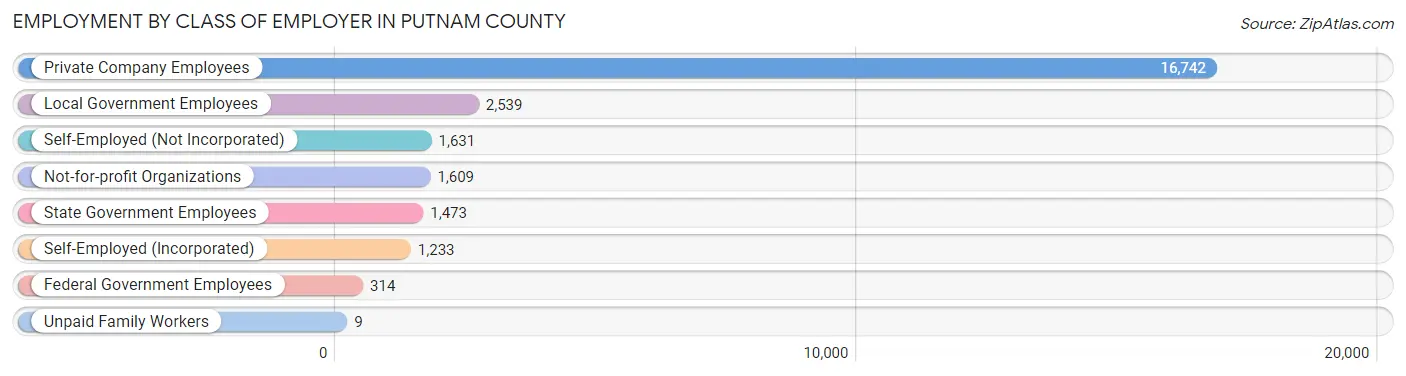
| Employer Class | # Employees | % Employees |
| Private Company Employees | 16,742 | 65.5% |
| Self-Employed (Incorporated) | 1,233 | 4.8% |
| Self-Employed (Not Incorporated) | 1,631 | 6.4% |
| Not-for-profit Organizations | 1,609 | 6.3% |
| Local Government Employees | 2,539 | 9.9% |
| State Government Employees | 1,473 | 5.8% |
| Federal Government Employees | 314 | 1.2% |
| Unpaid Family Workers | 9 | 0.0% |
| Total | 25,550 | 100.0% |
Employment Status by Age in Putnam County
According to the labor force statistics for Putnam County, out of the total population over 16 years of age (59,578), 47.7% or 28,419 individuals are in the labor force, with 8.9% or 2,529 of them unemployed. The age group with the highest labor force participation rate is 25 to 29 years, with 79.2% or 3,385 individuals in the labor force. Within the labor force, the 20 to 24 years age range has the highest percentage of unemployed individuals, with 19.9% or 521 of them being unemployed.
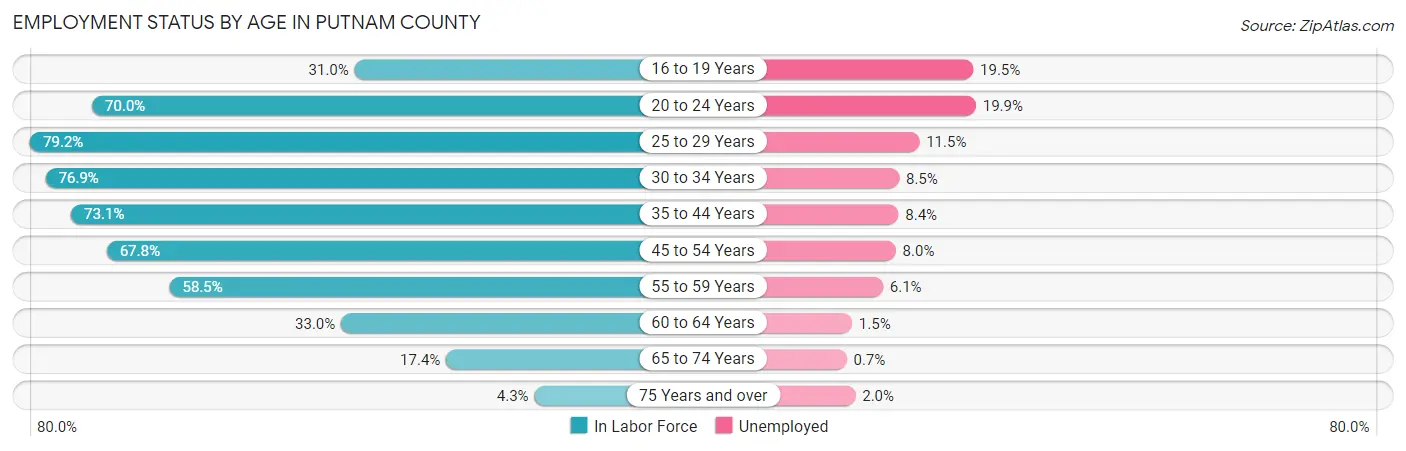
| Age Bracket | In Labor Force | Unemployed |
| 16 to 19 Years | 985 (31.0%) | 192 (19.5%) |
| 20 to 24 Years | 2,620 (70.0%) | 521 (19.9%) |
| 25 to 29 Years | 3,385 (79.2%) | 389 (11.5%) |
| 30 to 34 Years | 3,131 (76.9%) | 266 (8.5%) |
| 35 to 44 Years | 5,431 (73.1%) | 456 (8.4%) |
| 45 to 54 Years | 5,608 (67.8%) | 449 (8.0%) |
| 55 to 59 Years | 3,274 (58.5%) | 200 (6.1%) |
| 60 to 64 Years | 1,896 (33.0%) | 28 (1.5%) |
| 65 to 74 Years | 1,790 (17.4%) | 13 (0.7%) |
| 75 Years and over | 300 (4.3%) | 6 (2.0%) |
| Total | 28,419 (47.7%) | 2,529 (8.9%) |
Employment Status by Educational Attainment in Putnam County
According to labor force statistics for Putnam County, 64.2% of individuals (22,718) out of the total population between 25 and 64 years of age (35,387) are in the labor force, with 7.9% or 1,795 of them being unemployed. The group with the highest labor force participation rate are those with the educational attainment of bachelor's degree or higher, with 72.4% or 2,892 individuals in the labor force. Within the labor force, individuals with less than high school education have the highest percentage of unemployment, with 12.3% or 391 of them being unemployed.
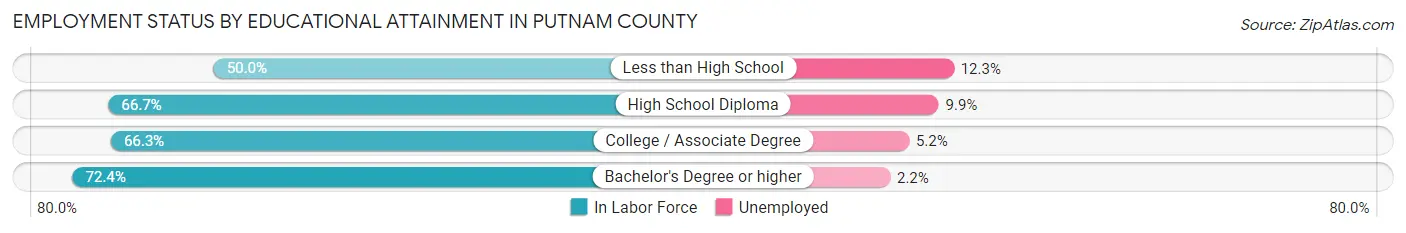
| Educational Attainment | In Labor Force | Unemployed |
| Less than High School | 3,182 (50.0%) | 783 (12.3%) |
| High School Diploma | 9,917 (66.7%) | 1,472 (9.9%) |
| College / Associate Degree | 6,736 (66.3%) | 528 (5.2%) |
| Bachelor's Degree or higher | 2,892 (72.4%) | 88 (2.2%) |
| Total | 22,718 (64.2%) | 2,796 (7.9%) |
Employment Occupations by Sex in Putnam County
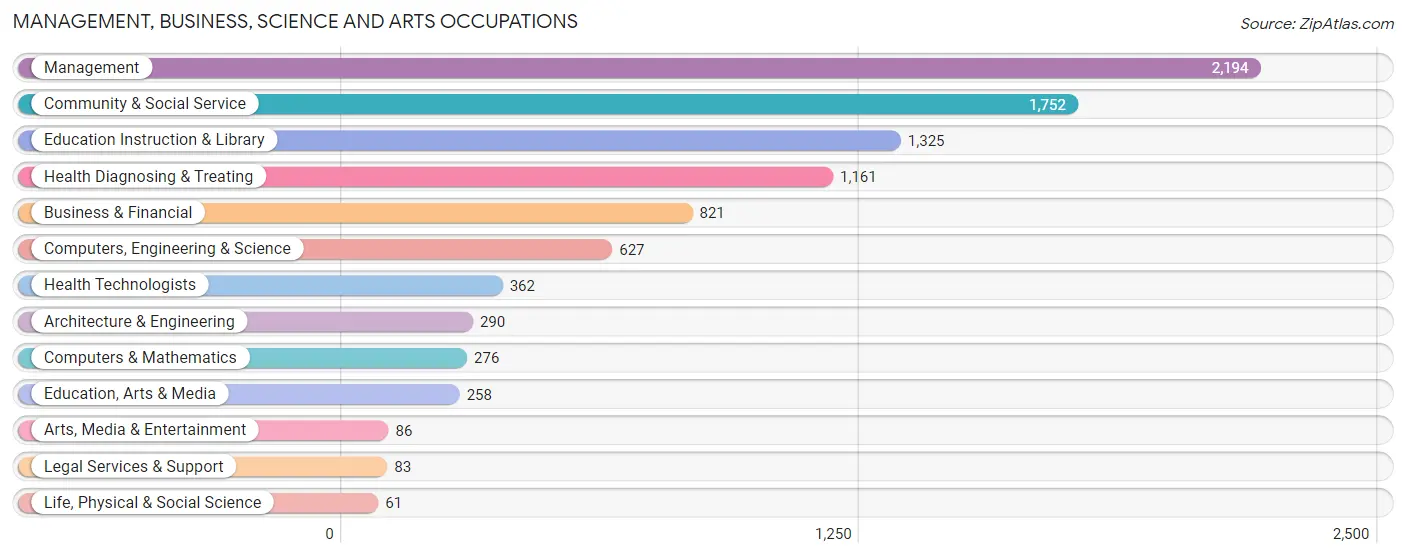
Management, Business, Science and Arts Occupations
The most common Management, Business, Science and Arts occupations in Putnam County are Management (2,194 | 8.5%), Community & Social Service (1,752 | 6.8%), Education Instruction & Library (1,325 | 5.1%), Health Diagnosing & Treating (1,161 | 4.5%), and Business & Financial (821 | 3.2%).
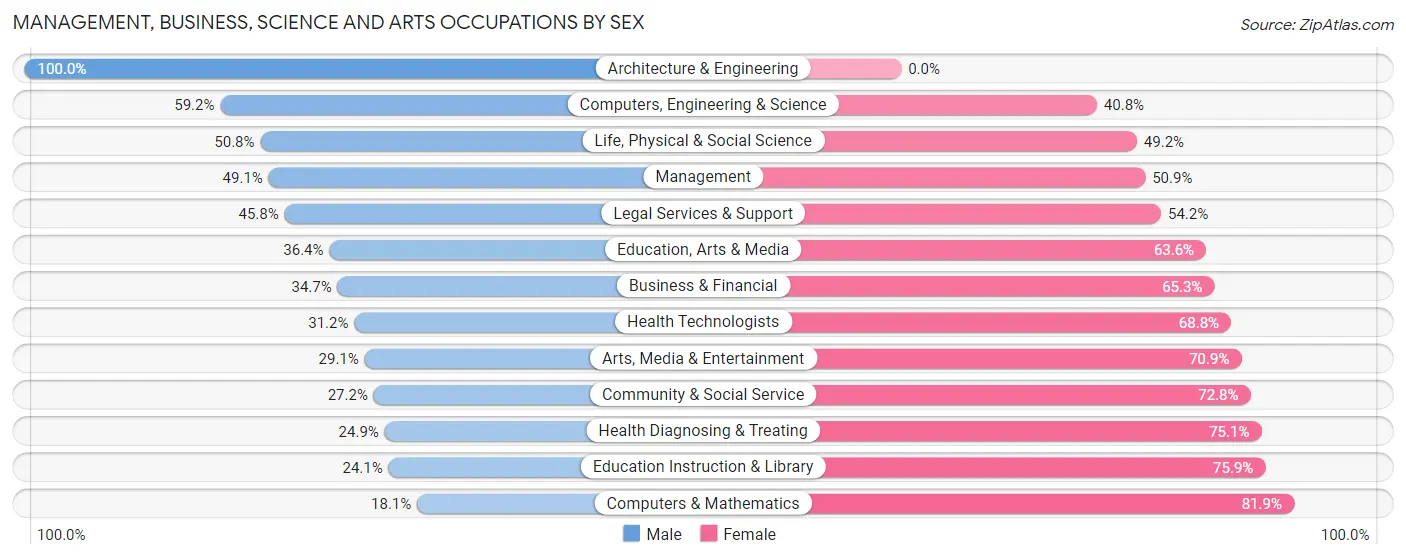
Management, Business, Science and Arts Occupations by Sex
Within the Management, Business, Science and Arts occupations in Putnam County, the most male-oriented occupations are Architecture & Engineering (100.0%), Computers, Engineering & Science (59.2%), and Life, Physical & Social Science (50.8%), while the most female-oriented occupations are Computers & Mathematics (81.9%), Education Instruction & Library (75.9%), and Health Diagnosing & Treating (75.1%).
| Occupation | Male | Female |
| Management | 1,077 (49.1%) | 1,117 (50.9%) |
| Business & Financial | 285 (34.7%) | 536 (65.3%) |
| Computers, Engineering & Science | 371 (59.2%) | 256 (40.8%) |
| Computers & Mathematics | 50 (18.1%) | 226 (81.9%) |
| Architecture & Engineering | 290 (100.0%) | 0 (0.0%) |
| Life, Physical & Social Science | 31 (50.8%) | 30 (49.2%) |
| Community & Social Service | 476 (27.2%) | 1,276 (72.8%) |
| Education, Arts & Media | 94 (36.4%) | 164 (63.6%) |
| Legal Services & Support | 38 (45.8%) | 45 (54.2%) |
| Education Instruction & Library | 319 (24.1%) | 1,006 (75.9%) |
| Arts, Media & Entertainment | 25 (29.1%) | 61 (70.9%) |
| Health Diagnosing & Treating | 289 (24.9%) | 872 (75.1%) |
| Health Technologists | 113 (31.2%) | 249 (68.8%) |
| Total (Category) | 2,498 (38.1%) | 4,057 (61.9%) |
| Total (Overall) | 13,658 (52.7%) | 12,240 (47.3%) |
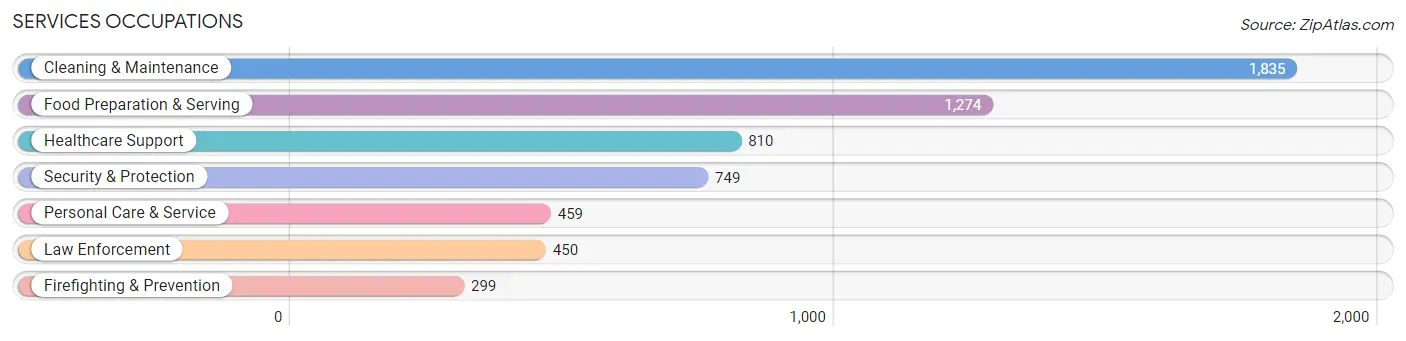
Services Occupations
The most common Services occupations in Putnam County are Cleaning & Maintenance (1,835 | 7.1%), Food Preparation & Serving (1,274 | 4.9%), Healthcare Support (810 | 3.1%), Security & Protection (749 | 2.9%), and Personal Care & Service (459 | 1.8%).
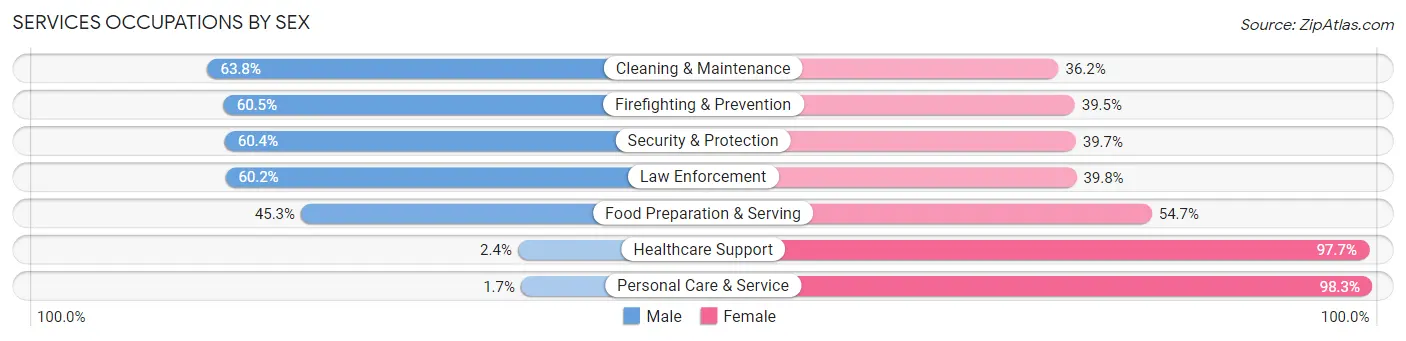
Services Occupations by Sex
Within the Services occupations in Putnam County, the most male-oriented occupations are Cleaning & Maintenance (63.8%), Firefighting & Prevention (60.5%), and Security & Protection (60.4%), while the most female-oriented occupations are Personal Care & Service (98.3%), Healthcare Support (97.7%), and Food Preparation & Serving (54.7%).
| Occupation | Male | Female |
| Healthcare Support | 19 (2.4%) | 791 (97.7%) |
| Security & Protection | 452 (60.4%) | 297 (39.7%) |
| Firefighting & Prevention | 181 (60.5%) | 118 (39.5%) |
| Law Enforcement | 271 (60.2%) | 179 (39.8%) |
| Food Preparation & Serving | 577 (45.3%) | 697 (54.7%) |
| Cleaning & Maintenance | 1,170 (63.8%) | 665 (36.2%) |
| Personal Care & Service | 8 (1.7%) | 451 (98.3%) |
| Total (Category) | 2,226 (43.4%) | 2,901 (56.6%) |
| Total (Overall) | 13,658 (52.7%) | 12,240 (47.3%) |
Sales and Office Occupations
The most common Sales and Office occupations in Putnam County are Office & Administration (3,075 | 11.9%), and Sales & Related (2,278 | 8.8%).
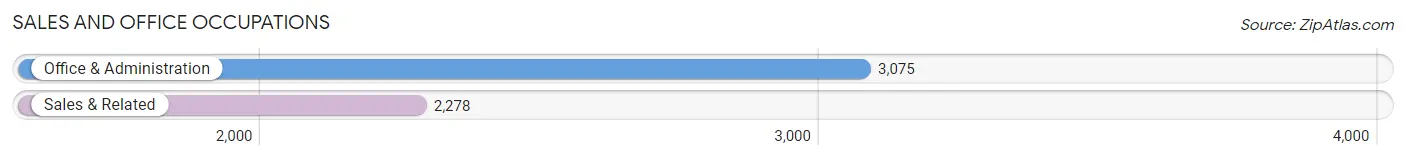
Sales and Office Occupations by Sex
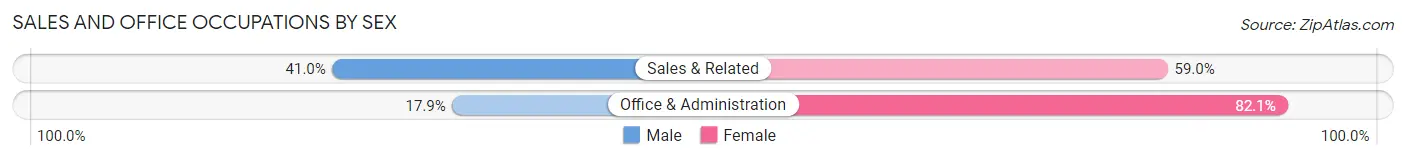
| Occupation | Male | Female |
| Sales & Related | 933 (41.0%) | 1,345 (59.0%) |
| Office & Administration | 550 (17.9%) | 2,525 (82.1%) |
| Total (Category) | 1,483 (27.7%) | 3,870 (72.3%) |
| Total (Overall) | 13,658 (52.7%) | 12,240 (47.3%) |
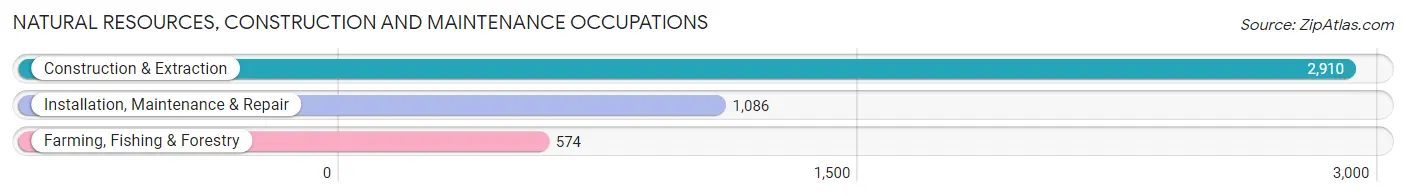
Natural Resources, Construction and Maintenance Occupations
The most common Natural Resources, Construction and Maintenance occupations in Putnam County are Construction & Extraction (2,910 | 11.2%), Installation, Maintenance & Repair (1,086 | 4.2%), and Farming, Fishing & Forestry (574 | 2.2%).
Natural Resources, Construction and Maintenance Occupations by Sex
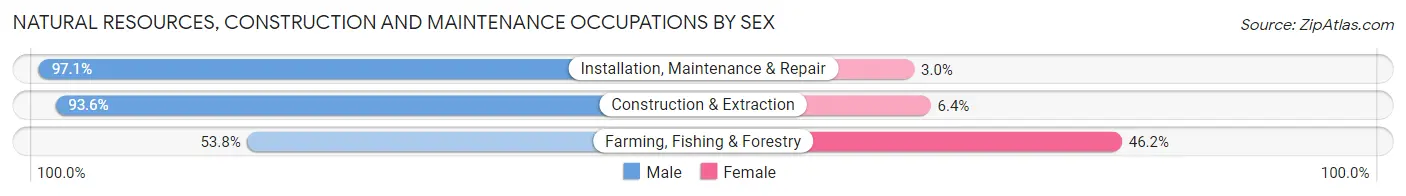
| Occupation | Male | Female |
| Farming, Fishing & Forestry | 309 (53.8%) | 265 (46.2%) |
| Construction & Extraction | 2,724 (93.6%) | 186 (6.4%) |
| Installation, Maintenance & Repair | 1,054 (97.1%) | 32 (2.9%) |
| Total (Category) | 4,087 (89.4%) | 483 (10.6%) |
| Total (Overall) | 13,658 (52.7%) | 12,240 (47.3%) |
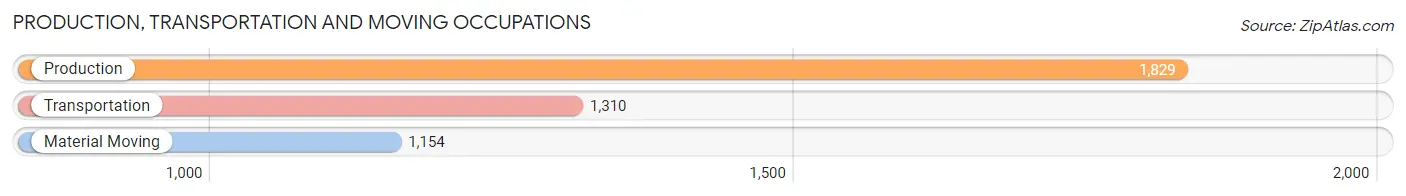
Production, Transportation and Moving Occupations
The most common Production, Transportation and Moving occupations in Putnam County are Production (1,829 | 7.1%), Transportation (1,310 | 5.1%), and Material Moving (1,154 | 4.5%).
Production, Transportation and Moving Occupations by Sex
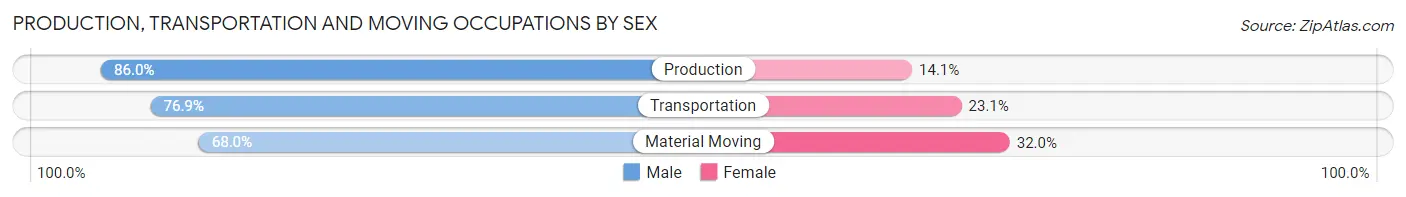
| Occupation | Male | Female |
| Production | 1,572 (86.0%) | 257 (14.1%) |
| Transportation | 1,007 (76.9%) | 303 (23.1%) |
| Material Moving | 785 (68.0%) | 369 (32.0%) |
| Total (Category) | 3,364 (78.4%) | 929 (21.6%) |
| Total (Overall) | 13,658 (52.7%) | 12,240 (47.3%) |
Employment Industries by Sex in Putnam County
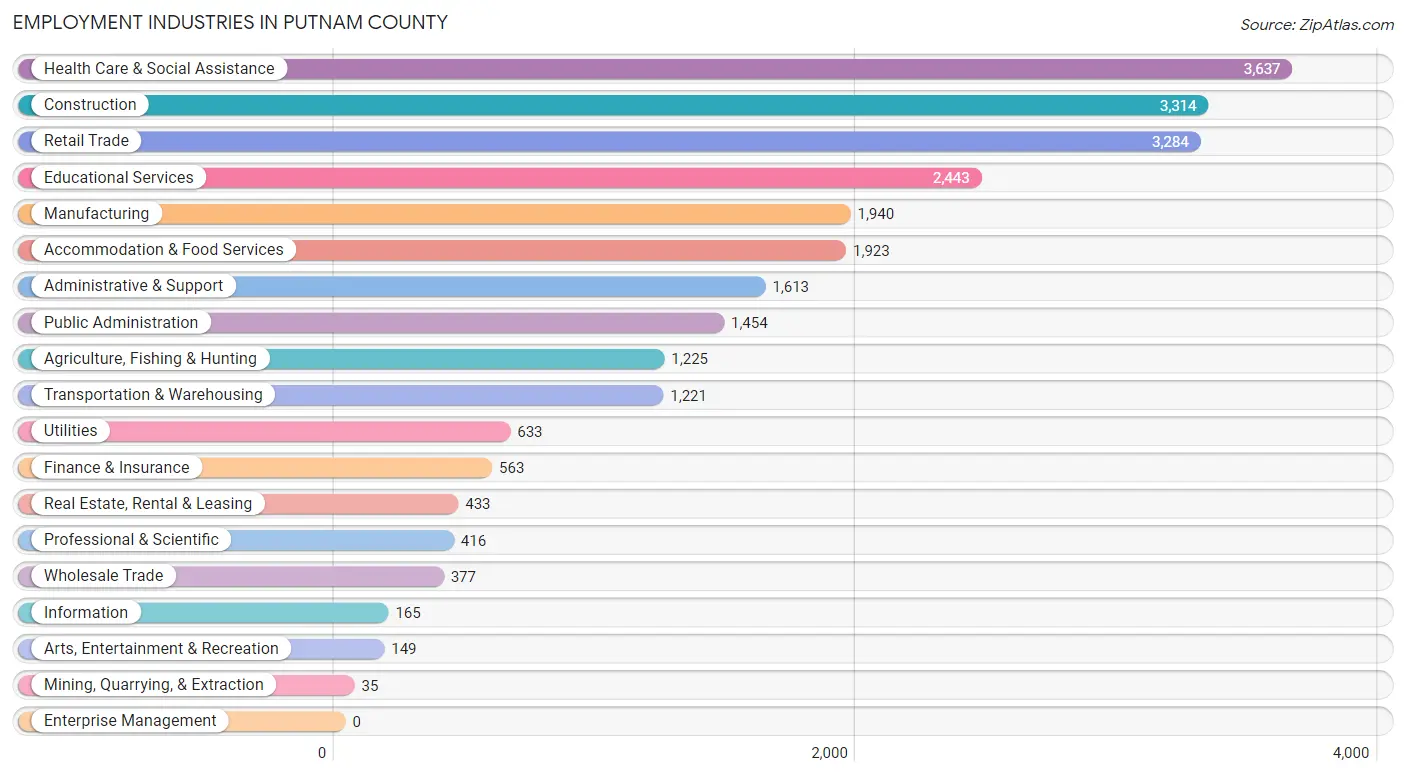
Employment Industries in Putnam County
The major employment industries in Putnam County include Health Care & Social Assistance (3,637 | 14.0%), Construction (3,314 | 12.8%), Retail Trade (3,284 | 12.7%), Educational Services (2,443 | 9.4%), and Manufacturing (1,940 | 7.5%).
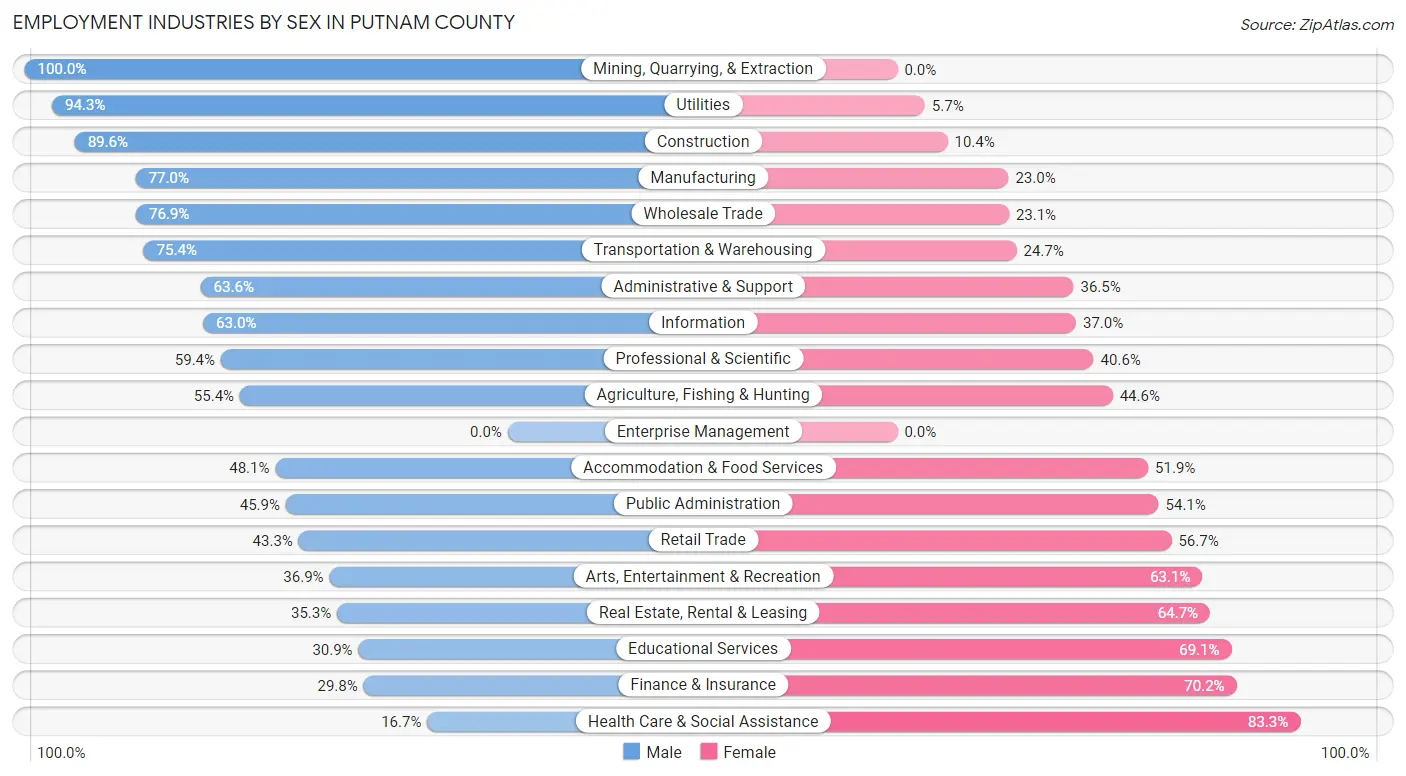
Employment Industries by Sex in Putnam County
The Putnam County industries that see more men than women are Mining, Quarrying, & Extraction (100.0%), Utilities (94.3%), and Construction (89.6%), whereas the industries that tend to have a higher number of women are Health Care & Social Assistance (83.3%), Finance & Insurance (70.2%), and Educational Services (69.1%).
| Industry | Male | Female |
| Agriculture, Fishing & Hunting | 679 (55.4%) | 546 (44.6%) |
| Mining, Quarrying, & Extraction | 35 (100.0%) | 0 (0.0%) |
| Construction | 2,970 (89.6%) | 344 (10.4%) |
| Manufacturing | 1,494 (77.0%) | 446 (23.0%) |
| Wholesale Trade | 290 (76.9%) | 87 (23.1%) |
| Retail Trade | 1,421 (43.3%) | 1,863 (56.7%) |
| Transportation & Warehousing | 920 (75.3%) | 301 (24.6%) |
| Utilities | 597 (94.3%) | 36 (5.7%) |
| Information | 104 (63.0%) | 61 (37.0%) |
| Finance & Insurance | 168 (29.8%) | 395 (70.2%) |
| Real Estate, Rental & Leasing | 153 (35.3%) | 280 (64.7%) |
| Professional & Scientific | 247 (59.4%) | 169 (40.6%) |
| Enterprise Management | 0 (0.0%) | 0 (0.0%) |
| Administrative & Support | 1,025 (63.5%) | 588 (36.4%) |
| Educational Services | 755 (30.9%) | 1,688 (69.1%) |
| Health Care & Social Assistance | 606 (16.7%) | 3,031 (83.3%) |
| Arts, Entertainment & Recreation | 55 (36.9%) | 94 (63.1%) |
| Accommodation & Food Services | 925 (48.1%) | 998 (51.9%) |
| Public Administration | 668 (45.9%) | 786 (54.1%) |
| Total | 13,658 (52.7%) | 12,240 (47.3%) |
Education in Putnam County
School Enrollment in Putnam County
The most common levels of schooling among the 14,854 students in Putnam County are high school (3,761 | 25.3%), elementary school (3,522 | 23.7%), and middle school (3,302 | 22.2%).
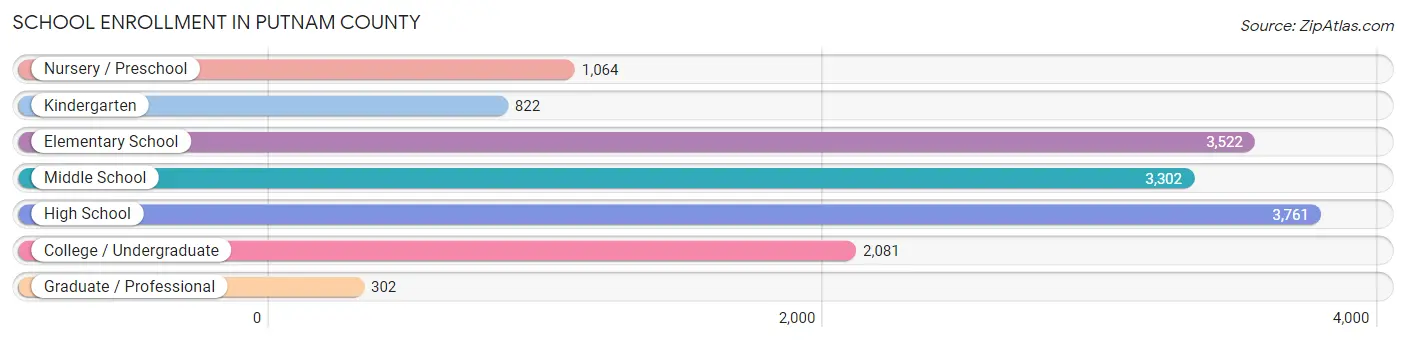
| School Level | # Students | % Students |
| Nursery / Preschool | 1,064 | 7.2% |
| Kindergarten | 822 | 5.5% |
| Elementary School | 3,522 | 23.7% |
| Middle School | 3,302 | 22.2% |
| High School | 3,761 | 25.3% |
| College / Undergraduate | 2,081 | 14.0% |
| Graduate / Professional | 302 | 2.0% |
| Total | 14,854 | 100.0% |
School Enrollment by Age by Funding Source in Putnam County
Out of a total of 14,854 students who are enrolled in schools in Putnam County, 2,837 (19.1%) attend a private institution, while the remaining 12,017 (80.9%) are enrolled in public schools. The age group of 3 to 4 year olds has the highest likelihood of being enrolled in private schools, with 259 (39.6% in the age bracket) enrolled. Conversely, the age group of 18 to 19 year olds has the lowest likelihood of being enrolled in a private school, with 954 (96.9% in the age bracket) attending a public institution.
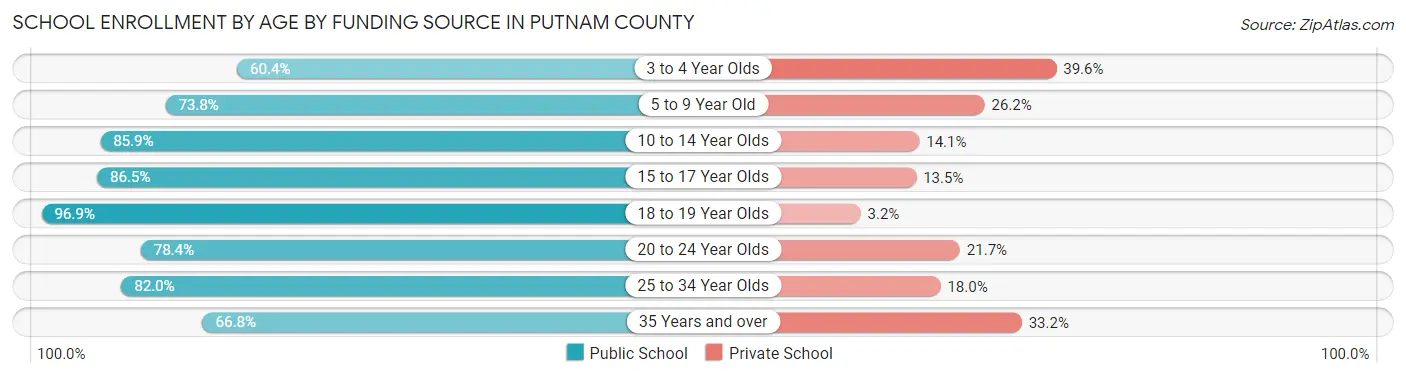
| Age Bracket | Public School | Private School |
| 3 to 4 Year Olds | 395 (60.4%) | 259 (39.6%) |
| 5 to 9 Year Old | 3,109 (73.8%) | 1,106 (26.2%) |
| 10 to 14 Year Olds | 3,800 (85.9%) | 623 (14.1%) |
| 15 to 17 Year Olds | 2,131 (86.5%) | 333 (13.5%) |
| 18 to 19 Year Olds | 954 (96.9%) | 31 (3.2%) |
| 20 to 24 Year Olds | 427 (78.3%) | 118 (21.6%) |
| 25 to 34 Year Olds | 791 (82.0%) | 174 (18.0%) |
| 35 Years and over | 403 (66.8%) | 200 (33.2%) |
| Total | 12,017 (80.9%) | 2,837 (19.1%) |
Educational Attainment by Field of Study in Putnam County
Education (1,735 | 22.9%), business (1,368 | 18.0%), science & technology (791 | 10.4%), bio, nature & agricultural (658 | 8.7%), and engineering (478 | 6.3%) are the most common fields of study among 7,577 individuals in Putnam County who have obtained a bachelor's degree or higher.
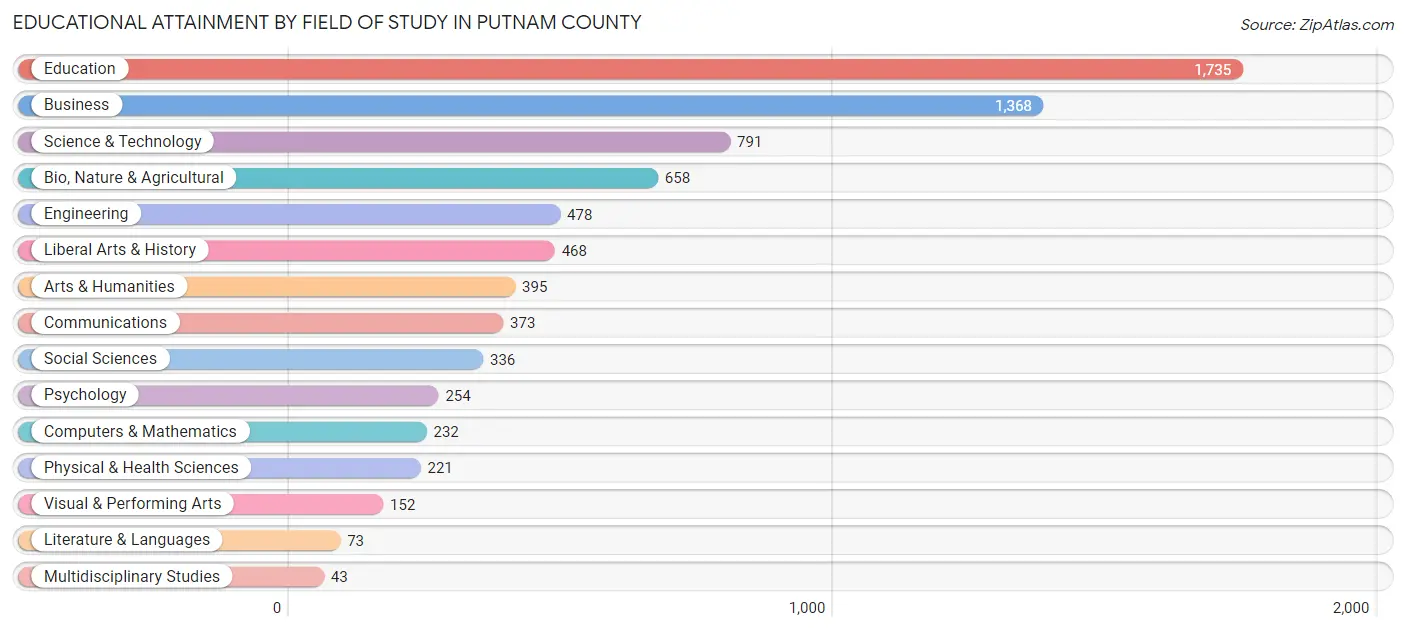
| Field of Study | # Graduates | % Graduates |
| Computers & Mathematics | 232 | 3.1% |
| Bio, Nature & Agricultural | 658 | 8.7% |
| Physical & Health Sciences | 221 | 2.9% |
| Psychology | 254 | 3.4% |
| Social Sciences | 336 | 4.4% |
| Engineering | 478 | 6.3% |
| Multidisciplinary Studies | 43 | 0.6% |
| Science & Technology | 791 | 10.4% |
| Business | 1,368 | 18.0% |
| Education | 1,735 | 22.9% |
| Literature & Languages | 73 | 1.0% |
| Liberal Arts & History | 468 | 6.2% |
| Visual & Performing Arts | 152 | 2.0% |
| Communications | 373 | 4.9% |
| Arts & Humanities | 395 | 5.2% |
| Total | 7,577 | 100.0% |
Transportation & Commute in Putnam County
Vehicle Availability by Sex in Putnam County
The most prevalent vehicle ownership categories in Putnam County are males with 2 vehicles (5,738, accounting for 42.3%) and females with 2 vehicles (4,682, making up 47.9%).
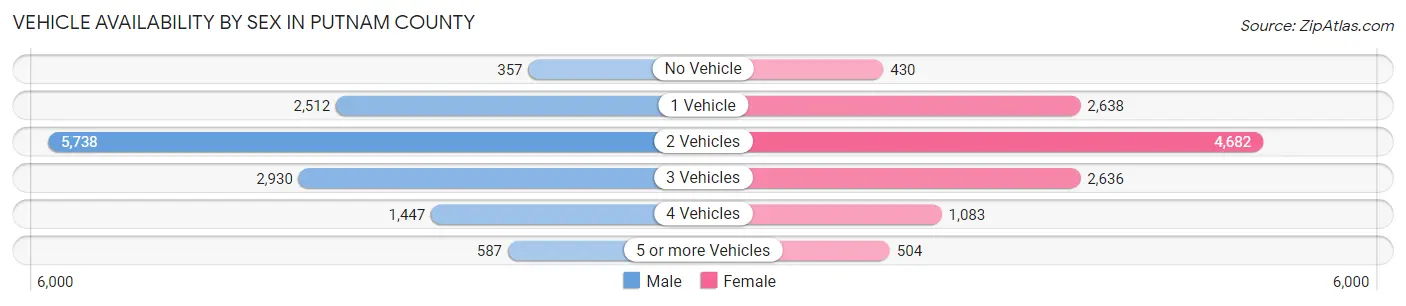
| Vehicles Available | Male | Female |
| No Vehicle | 357 (2.6%) | 430 (3.6%) |
| 1 Vehicle | 2,512 (18.5%) | 2,638 (22.0%) |
| 2 Vehicles | 5,738 (42.3%) | 4,682 (39.1%) |
| 3 Vehicles | 2,930 (21.6%) | 2,636 (22.0%) |
| 4 Vehicles | 1,447 (10.7%) | 1,083 (9.0%) |
| 5 or more Vehicles | 587 (4.3%) | 504 (4.2%) |
| Total | 13,571 (100.0%) | 11,973 (100.0%) |
Commute Time in Putnam County
The most frequently occuring commute durations in Putnam County are 45 to 59 minutes (3,320 commuters, 14.1%), 10 to 14 minutes (3,114 commuters, 13.2%), and 20 to 24 minutes (2,808 commuters, 11.9%).
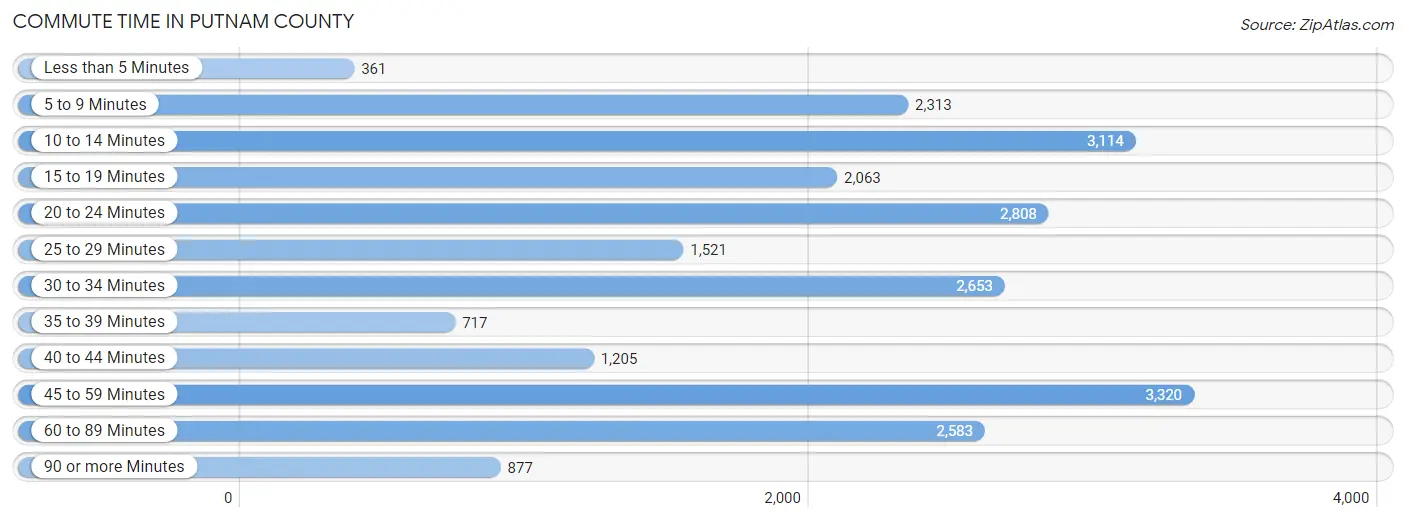
| Commute Time | # Commuters | % Commuters |
| Less than 5 Minutes | 361 | 1.5% |
| 5 to 9 Minutes | 2,313 | 9.8% |
| 10 to 14 Minutes | 3,114 | 13.2% |
| 15 to 19 Minutes | 2,063 | 8.8% |
| 20 to 24 Minutes | 2,808 | 11.9% |
| 25 to 29 Minutes | 1,521 | 6.5% |
| 30 to 34 Minutes | 2,653 | 11.3% |
| 35 to 39 Minutes | 717 | 3.0% |
| 40 to 44 Minutes | 1,205 | 5.1% |
| 45 to 59 Minutes | 3,320 | 14.1% |
| 60 to 89 Minutes | 2,583 | 11.0% |
| 90 or more Minutes | 877 | 3.7% |
Commute Time by Sex in Putnam County
The most common commute times in Putnam County are 45 to 59 minutes (1,681 commuters, 13.3%) for males and 45 to 59 minutes (1,639 commuters, 15.1%) for females.
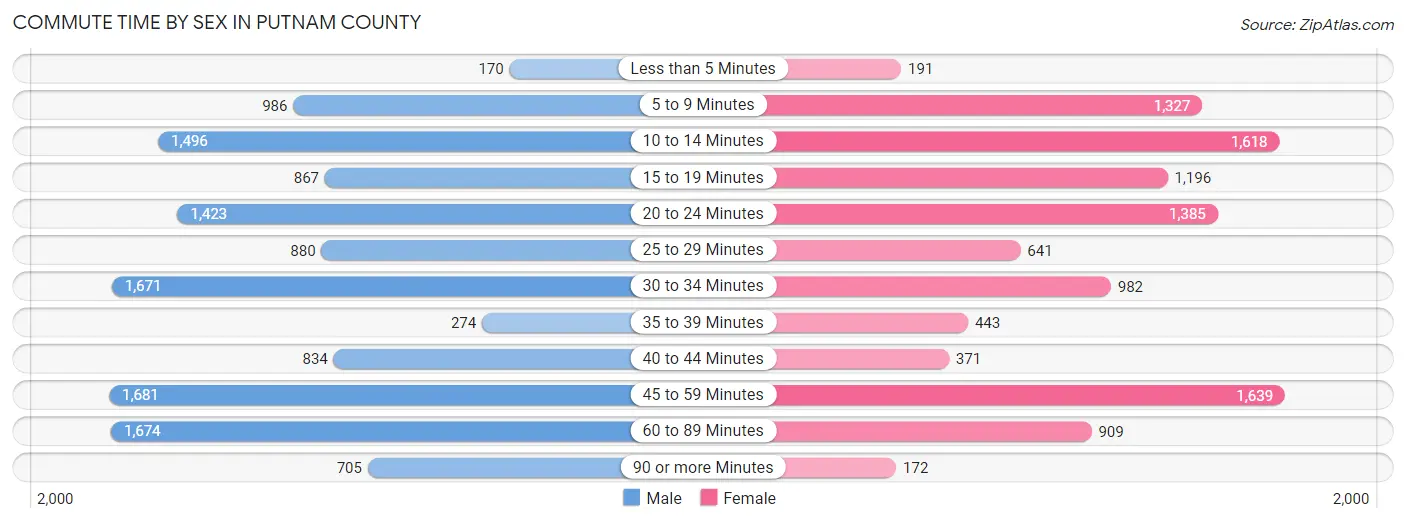
| Commute Time | Male | Female |
| Less than 5 Minutes | 170 (1.3%) | 191 (1.8%) |
| 5 to 9 Minutes | 986 (7.8%) | 1,327 (12.2%) |
| 10 to 14 Minutes | 1,496 (11.8%) | 1,618 (14.9%) |
| 15 to 19 Minutes | 867 (6.9%) | 1,196 (11.0%) |
| 20 to 24 Minutes | 1,423 (11.2%) | 1,385 (12.7%) |
| 25 to 29 Minutes | 880 (7.0%) | 641 (5.9%) |
| 30 to 34 Minutes | 1,671 (13.2%) | 982 (9.0%) |
| 35 to 39 Minutes | 274 (2.2%) | 443 (4.1%) |
| 40 to 44 Minutes | 834 (6.6%) | 371 (3.4%) |
| 45 to 59 Minutes | 1,681 (13.3%) | 1,639 (15.1%) |
| 60 to 89 Minutes | 1,674 (13.2%) | 909 (8.4%) |
| 90 or more Minutes | 705 (5.6%) | 172 (1.6%) |
Time of Departure to Work by Sex in Putnam County
The most frequent times of departure to work in Putnam County are 6:00 AM to 6:29 AM (2,150, 17.0%) for males and 7:00 AM to 7:29 AM (2,193, 20.2%) for females.
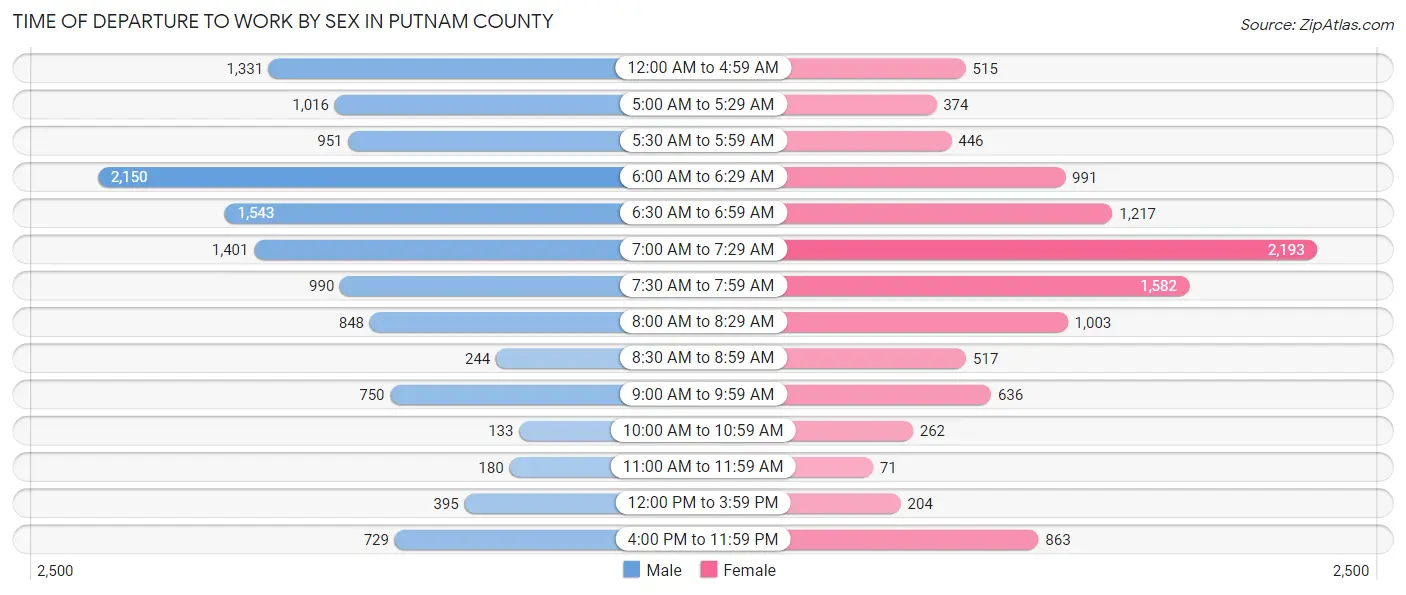
| Time of Departure | Male | Female |
| 12:00 AM to 4:59 AM | 1,331 (10.5%) | 515 (4.7%) |
| 5:00 AM to 5:29 AM | 1,016 (8.0%) | 374 (3.4%) |
| 5:30 AM to 5:59 AM | 951 (7.5%) | 446 (4.1%) |
| 6:00 AM to 6:29 AM | 2,150 (17.0%) | 991 (9.1%) |
| 6:30 AM to 6:59 AM | 1,543 (12.2%) | 1,217 (11.2%) |
| 7:00 AM to 7:29 AM | 1,401 (11.1%) | 2,193 (20.2%) |
| 7:30 AM to 7:59 AM | 990 (7.8%) | 1,582 (14.5%) |
| 8:00 AM to 8:29 AM | 848 (6.7%) | 1,003 (9.2%) |
| 8:30 AM to 8:59 AM | 244 (1.9%) | 517 (4.8%) |
| 9:00 AM to 9:59 AM | 750 (5.9%) | 636 (5.9%) |
| 10:00 AM to 10:59 AM | 133 (1.1%) | 262 (2.4%) |
| 11:00 AM to 11:59 AM | 180 (1.4%) | 71 (0.6%) |
| 12:00 PM to 3:59 PM | 395 (3.1%) | 204 (1.9%) |
| 4:00 PM to 11:59 PM | 729 (5.8%) | 863 (7.9%) |
| Total | 12,661 (100.0%) | 10,874 (100.0%) |
Housing Occupancy in Putnam County
Occupancy by Ownership in Putnam County
Of the total 29,782 dwellings in Putnam County, owner-occupied units account for 21,737 (73.0%), while renter-occupied units make up 8,045 (27.0%).
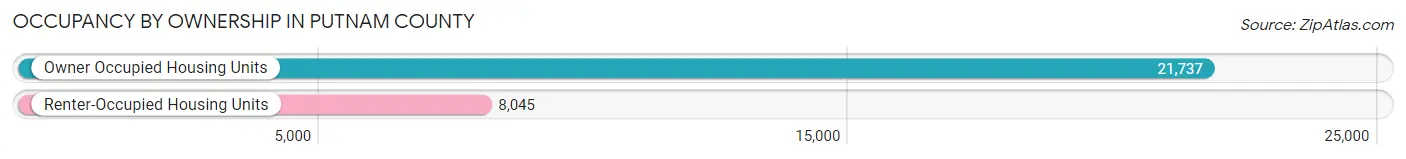
| Occupancy | # Housing Units | % Housing Units |
| Owner Occupied Housing Units | 21,737 | 73.0% |
| Renter-Occupied Housing Units | 8,045 | 27.0% |
| Total Occupied Housing Units | 29,782 | 100.0% |
Occupancy by Household Size in Putnam County
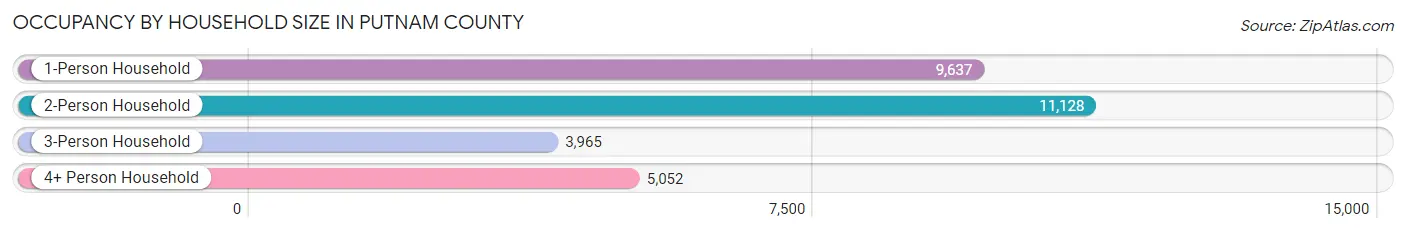
| Household Size | # Housing Units | % Housing Units |
| 1-Person Household | 9,637 | 32.4% |
| 2-Person Household | 11,128 | 37.4% |
| 3-Person Household | 3,965 | 13.3% |
| 4+ Person Household | 5,052 | 17.0% |
| Total Housing Units | 29,782 | 100.0% |
Occupancy by Ownership by Household Size in Putnam County
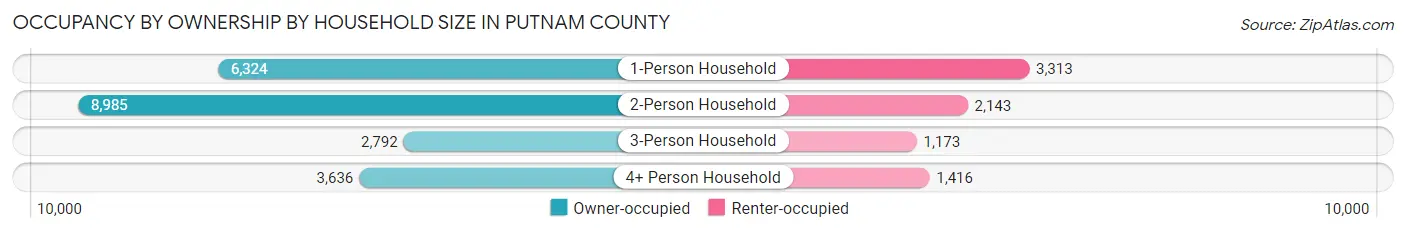
| Household Size | Owner-occupied | Renter-occupied |
| 1-Person Household | 6,324 (65.6%) | 3,313 (34.4%) |
| 2-Person Household | 8,985 (80.7%) | 2,143 (19.3%) |
| 3-Person Household | 2,792 (70.4%) | 1,173 (29.6%) |
| 4+ Person Household | 3,636 (72.0%) | 1,416 (28.0%) |
| Total Housing Units | 21,737 (73.0%) | 8,045 (27.0%) |
Occupancy by Educational Attainment in Putnam County
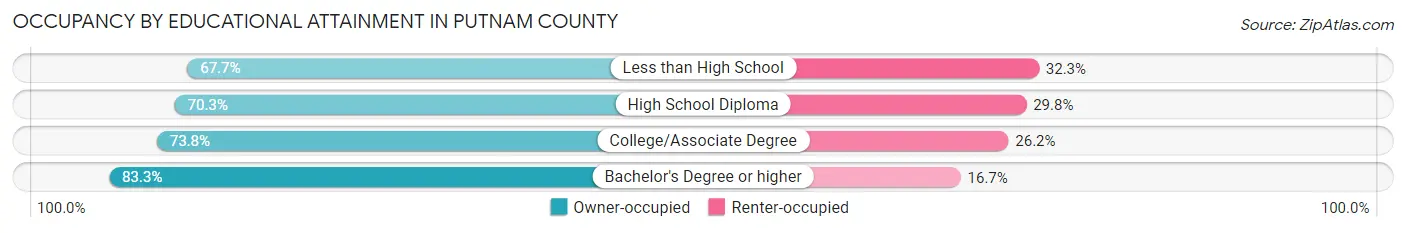
| Household Size | Owner-occupied | Renter-occupied |
| Less than High School | 2,704 (67.7%) | 1,288 (32.3%) |
| High School Diploma | 8,532 (70.3%) | 3,613 (29.7%) |
| College/Associate Degree | 6,696 (73.8%) | 2,379 (26.2%) |
| Bachelor's Degree or higher | 3,805 (83.3%) | 765 (16.7%) |
Occupancy by Age of Householder in Putnam County
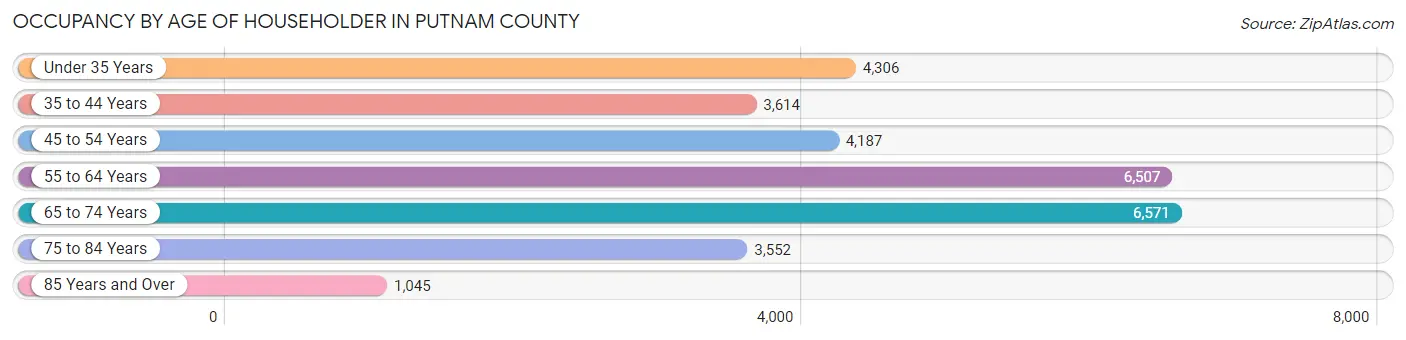
| Age Bracket | # Households | % Households |
| Under 35 Years | 4,306 | 14.5% |
| 35 to 44 Years | 3,614 | 12.1% |
| 45 to 54 Years | 4,187 | 14.1% |
| 55 to 64 Years | 6,507 | 21.8% |
| 65 to 74 Years | 6,571 | 22.1% |
| 75 to 84 Years | 3,552 | 11.9% |
| 85 Years and Over | 1,045 | 3.5% |
| Total | 29,782 | 100.0% |
Housing Finances in Putnam County
Median Income by Occupancy in Putnam County
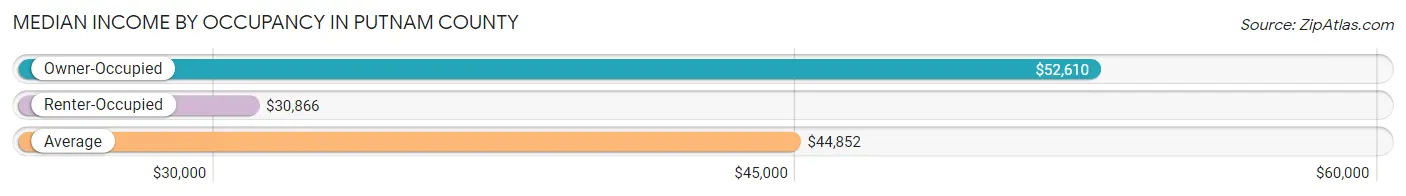
| Occupancy Type | # Households | Median Income |
| Owner-Occupied | 21,737 (73.0%) | $52,610 |
| Renter-Occupied | 8,045 (27.0%) | $30,866 |
| Average | 29,782 (100.0%) | $44,852 |
Occupancy by Householder Income Bracket in Putnam County
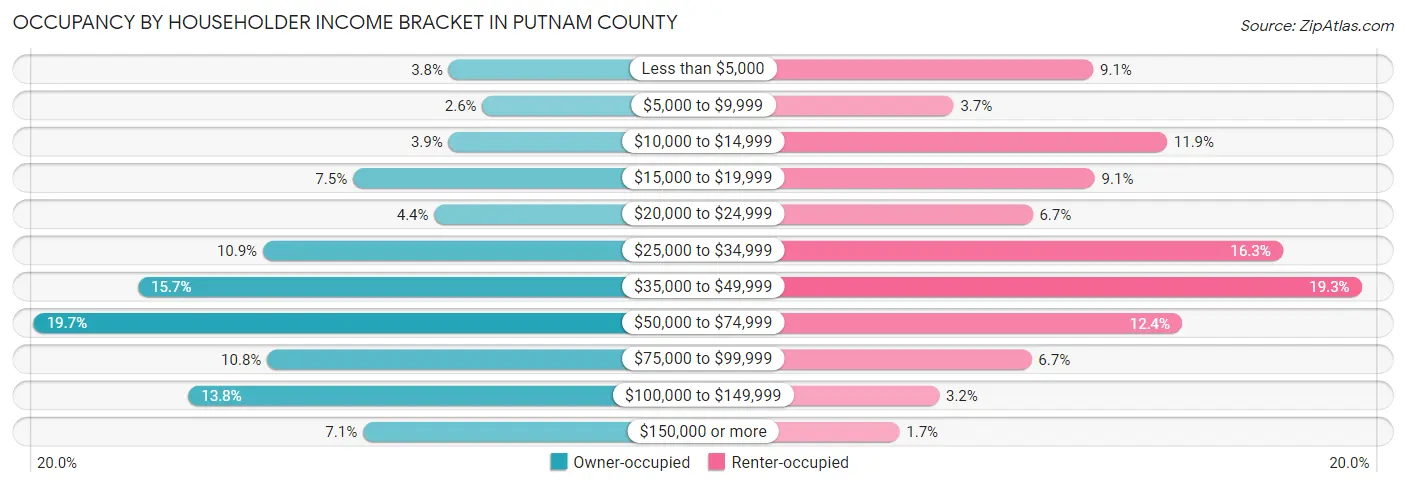
| Income Bracket | Owner-occupied | Renter-occupied |
| Less than $5,000 | 835 (3.8%) | 728 (9.0%) |
| $5,000 to $9,999 | 556 (2.6%) | 300 (3.7%) |
| $10,000 to $14,999 | 836 (3.8%) | 954 (11.9%) |
| $15,000 to $19,999 | 1,629 (7.5%) | 733 (9.1%) |
| $20,000 to $24,999 | 954 (4.4%) | 542 (6.7%) |
| $25,000 to $34,999 | 2,373 (10.9%) | 1,309 (16.3%) |
| $35,000 to $49,999 | 3,408 (15.7%) | 1,550 (19.3%) |
| $50,000 to $74,999 | 4,271 (19.7%) | 1,000 (12.4%) |
| $75,000 to $99,999 | 2,338 (10.8%) | 539 (6.7%) |
| $100,000 to $149,999 | 2,992 (13.8%) | 256 (3.2%) |
| $150,000 or more | 1,545 (7.1%) | 134 (1.7%) |
| Total | 21,737 (100.0%) | 8,045 (100.0%) |
Monthly Housing Cost Tiers in Putnam County
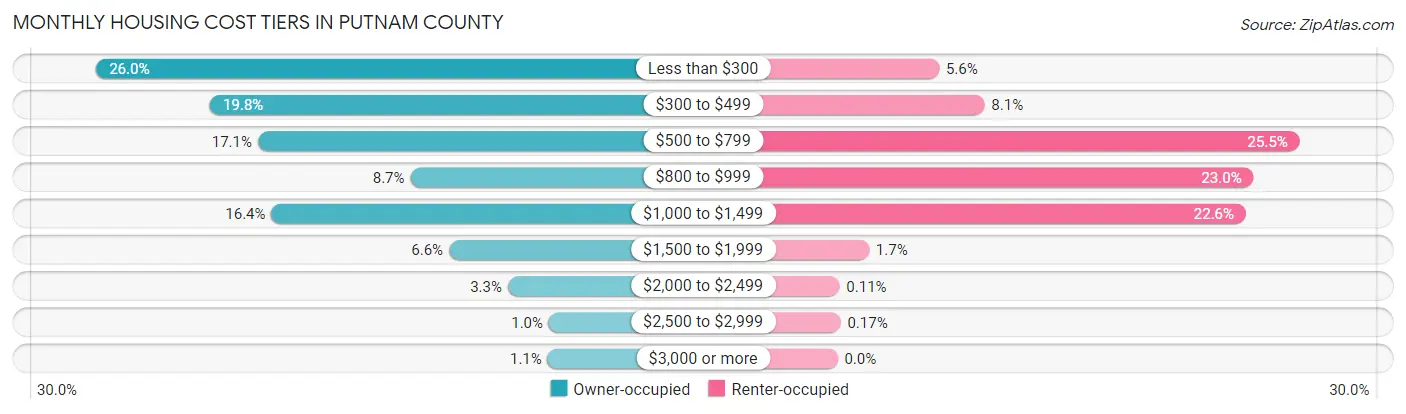
| Monthly Cost | Owner-occupied | Renter-occupied |
| Less than $300 | 5,660 (26.0%) | 451 (5.6%) |
| $300 to $499 | 4,295 (19.8%) | 653 (8.1%) |
| $500 to $799 | 3,722 (17.1%) | 2,054 (25.5%) |
| $800 to $999 | 1,888 (8.7%) | 1,849 (23.0%) |
| $1,000 to $1,499 | 3,558 (16.4%) | 1,815 (22.6%) |
| $1,500 to $1,999 | 1,427 (6.6%) | 140 (1.7%) |
| $2,000 to $2,499 | 720 (3.3%) | 9 (0.1%) |
| $2,500 to $2,999 | 225 (1.0%) | 14 (0.2%) |
| $3,000 or more | 242 (1.1%) | 0 (0.0%) |
| Total | 21,737 (100.0%) | 8,045 (100.0%) |
Physical Housing Characteristics in Putnam County
Housing Structures in Putnam County
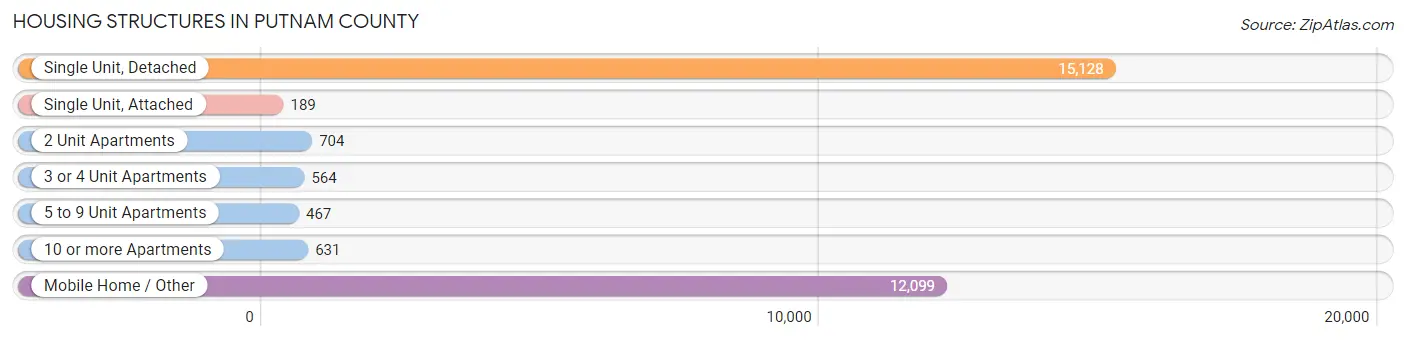
| Structure Type | # Housing Units | % Housing Units |
| Single Unit, Detached | 15,128 | 50.8% |
| Single Unit, Attached | 189 | 0.6% |
| 2 Unit Apartments | 704 | 2.4% |
| 3 or 4 Unit Apartments | 564 | 1.9% |
| 5 to 9 Unit Apartments | 467 | 1.6% |
| 10 or more Apartments | 631 | 2.1% |
| Mobile Home / Other | 12,099 | 40.6% |
| Total | 29,782 | 100.0% |
Housing Structures by Occupancy in Putnam County
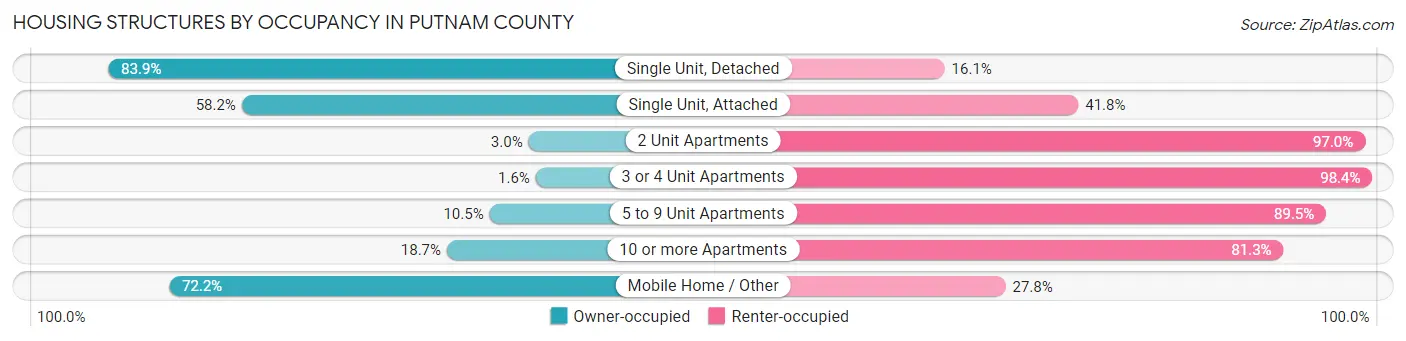
| Structure Type | Owner-occupied | Renter-occupied |
| Single Unit, Detached | 12,695 (83.9%) | 2,433 (16.1%) |
| Single Unit, Attached | 110 (58.2%) | 79 (41.8%) |
| 2 Unit Apartments | 21 (3.0%) | 683 (97.0%) |
| 3 or 4 Unit Apartments | 9 (1.6%) | 555 (98.4%) |
| 5 to 9 Unit Apartments | 49 (10.5%) | 418 (89.5%) |
| 10 or more Apartments | 118 (18.7%) | 513 (81.3%) |
| Mobile Home / Other | 8,735 (72.2%) | 3,364 (27.8%) |
| Total | 21,737 (73.0%) | 8,045 (27.0%) |
Housing Structures by Number of Rooms in Putnam County
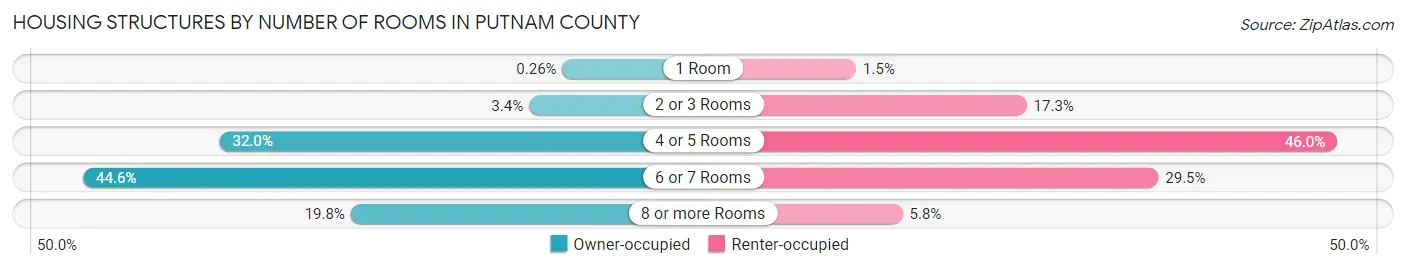
| Number of Rooms | Owner-occupied | Renter-occupied |
| 1 Room | 57 (0.3%) | 121 (1.5%) |
| 2 or 3 Rooms | 728 (3.4%) | 1,389 (17.3%) |
| 4 or 5 Rooms | 6,950 (32.0%) | 3,699 (46.0%) |
| 6 or 7 Rooms | 9,690 (44.6%) | 2,369 (29.4%) |
| 8 or more Rooms | 4,312 (19.8%) | 467 (5.8%) |
| Total | 21,737 (100.0%) | 8,045 (100.0%) |
Housing Structure by Heating Type in Putnam County
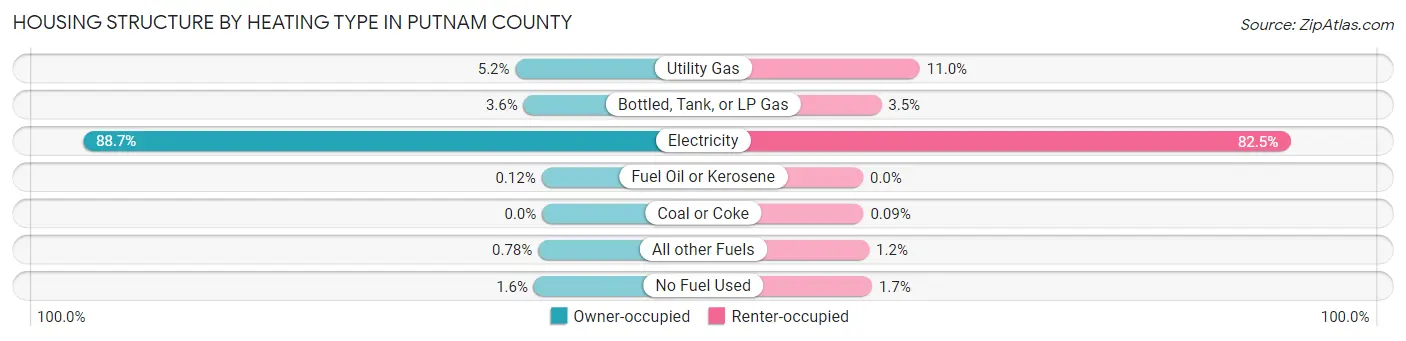
| Heating Type | Owner-occupied | Renter-occupied |
| Utility Gas | 1,124 (5.2%) | 884 (11.0%) |
| Bottled, Tank, or LP Gas | 781 (3.6%) | 284 (3.5%) |
| Electricity | 19,285 (88.7%) | 6,636 (82.5%) |
| Fuel Oil or Kerosene | 27 (0.1%) | 0 (0.0%) |
| Coal or Coke | 0 (0.0%) | 7 (0.1%) |
| All other Fuels | 170 (0.8%) | 95 (1.2%) |
| No Fuel Used | 350 (1.6%) | 139 (1.7%) |
| Total | 21,737 (100.0%) | 8,045 (100.0%) |
Household Vehicle Usage in Putnam County
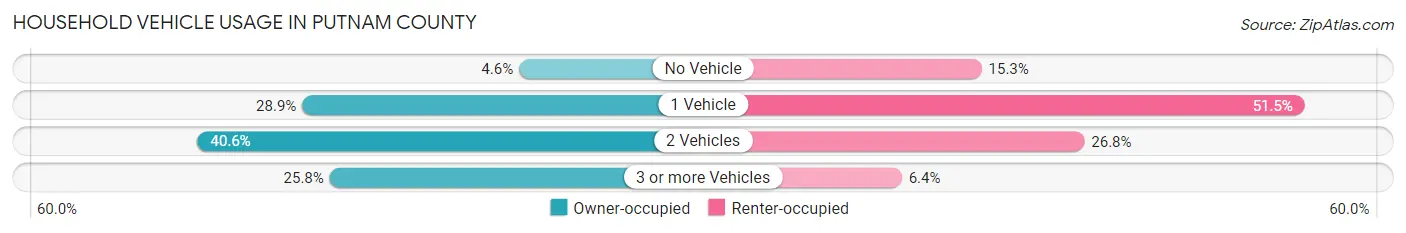
| Vehicles per Household | Owner-occupied | Renter-occupied |
| No Vehicle | 1,004 (4.6%) | 1,232 (15.3%) |
| 1 Vehicle | 6,284 (28.9%) | 4,143 (51.5%) |
| 2 Vehicles | 8,835 (40.6%) | 2,158 (26.8%) |
| 3 or more Vehicles | 5,614 (25.8%) | 512 (6.4%) |
| Total | 21,737 (100.0%) | 8,045 (100.0%) |
Real Estate & Mortgages in Putnam County
Real Estate and Mortgage Overview in Putnam County
| Characteristic | Without Mortgage | With Mortgage |
| Housing Units | 12,889 | 8,848 |
| Median Property Value | $107,600 | $161,900 |
| Median Household Income | $41,617 | $819 |
| Monthly Housing Costs | $325 | $210 |
| Real Estate Taxes | $991 | $352 |
Property Value by Mortgage Status in Putnam County
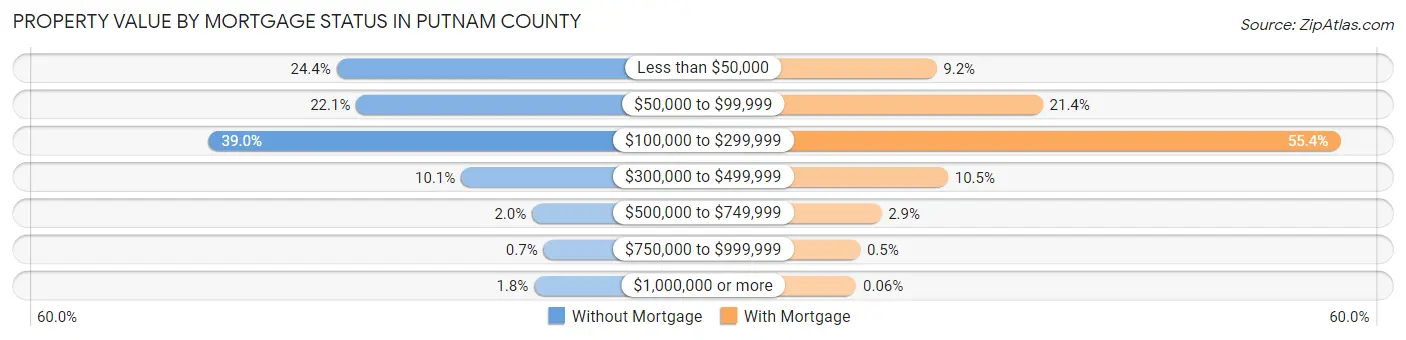
| Property Value | Without Mortgage | With Mortgage |
| Less than $50,000 | 3,138 (24.3%) | 817 (9.2%) |
| $50,000 to $99,999 | 2,848 (22.1%) | 1,892 (21.4%) |
| $100,000 to $299,999 | 5,022 (39.0%) | 4,898 (55.4%) |
| $300,000 to $499,999 | 1,303 (10.1%) | 933 (10.5%) |
| $500,000 to $749,999 | 259 (2.0%) | 259 (2.9%) |
| $750,000 to $999,999 | 90 (0.7%) | 44 (0.5%) |
| $1,000,000 or more | 229 (1.8%) | 5 (0.1%) |
| Total | 12,889 (100.0%) | 8,848 (100.0%) |
Household Income by Mortgage Status in Putnam County
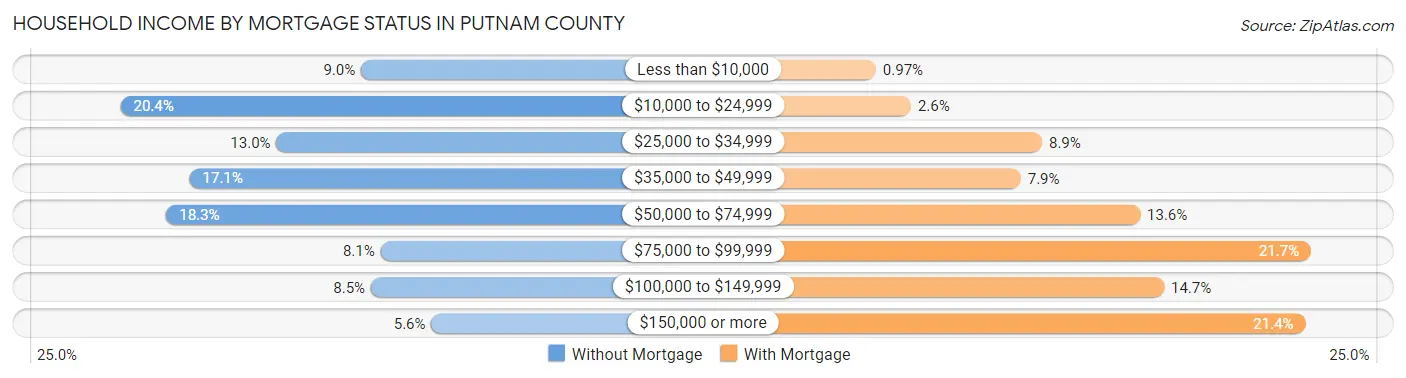
| Household Income | Without Mortgage | With Mortgage |
| Less than $10,000 | 1,157 (9.0%) | 86 (1.0%) |
| $10,000 to $24,999 | 2,633 (20.4%) | 234 (2.6%) |
| $25,000 to $34,999 | 1,677 (13.0%) | 786 (8.9%) |
| $35,000 to $49,999 | 2,209 (17.1%) | 696 (7.9%) |
| $50,000 to $74,999 | 2,352 (18.2%) | 1,199 (13.6%) |
| $75,000 to $99,999 | 1,038 (8.1%) | 1,919 (21.7%) |
| $100,000 to $149,999 | 1,097 (8.5%) | 1,300 (14.7%) |
| $150,000 or more | 726 (5.6%) | 1,895 (21.4%) |
| Total | 12,889 (100.0%) | 8,848 (100.0%) |
Property Value to Household Income Ratio in Putnam County
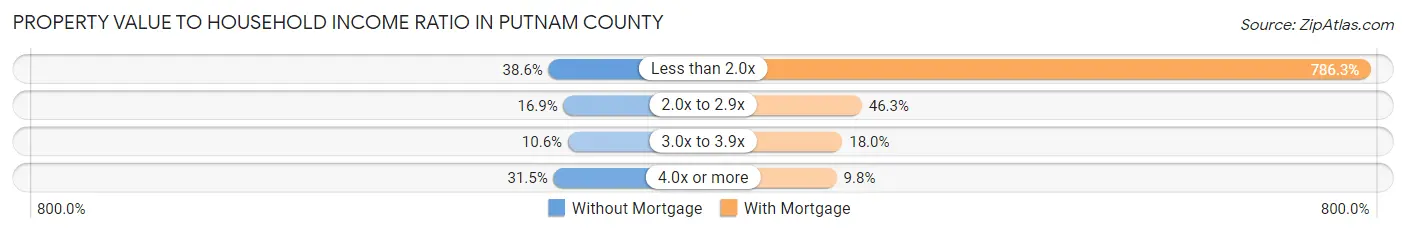
| Value-to-Income Ratio | Without Mortgage | With Mortgage |
| Less than 2.0x | 4,974 (38.6%) | 69,574 (786.3%) |
| 2.0x to 2.9x | 2,182 (16.9%) | 4,095 (46.3%) |
| 3.0x to 3.9x | 1,370 (10.6%) | 1,596 (18.0%) |
| 4.0x or more | 4,061 (31.5%) | 868 (9.8%) |
| Total | 12,889 (100.0%) | 8,848 (100.0%) |
Real Estate Taxes by Mortgage Status in Putnam County
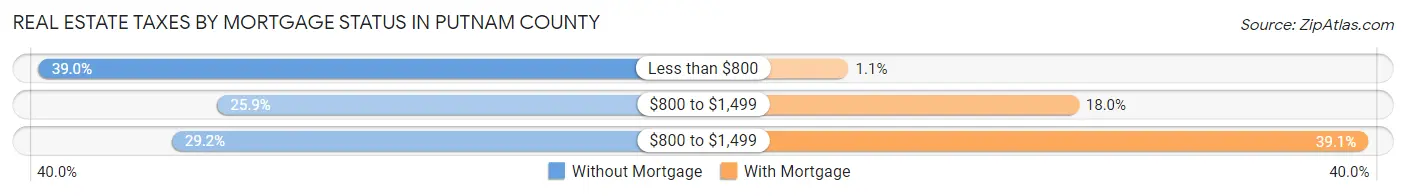
| Property Taxes | Without Mortgage | With Mortgage |
| Less than $800 | 5,021 (39.0%) | 101 (1.1%) |
| $800 to $1,499 | 3,339 (25.9%) | 1,589 (18.0%) |
| $800 to $1,499 | 3,769 (29.2%) | 3,459 (39.1%) |
| Total | 12,889 (100.0%) | 8,848 (100.0%) |
Health & Disability in Putnam County
Health Insurance Coverage by Age in Putnam County
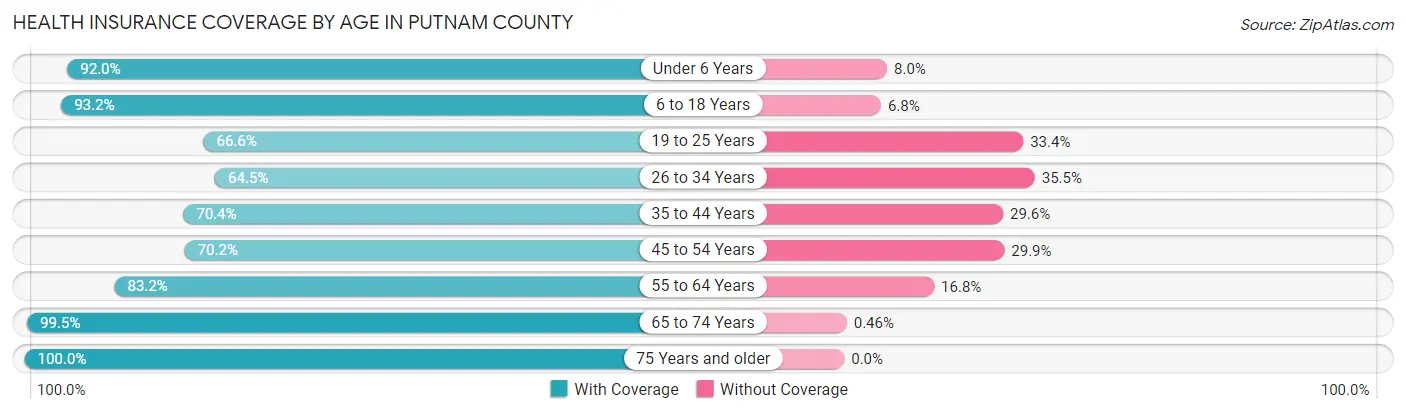
| Age Bracket | With Coverage | Without Coverage |
| Under 6 Years | 4,773 (92.0%) | 414 (8.0%) |
| 6 to 18 Years | 10,557 (93.2%) | 775 (6.8%) |
| 19 to 25 Years | 3,228 (66.6%) | 1,617 (33.4%) |
| 26 to 34 Years | 4,911 (64.5%) | 2,705 (35.5%) |
| 35 to 44 Years | 5,060 (70.4%) | 2,127 (29.6%) |
| 45 to 54 Years | 5,742 (70.2%) | 2,443 (29.8%) |
| 55 to 64 Years | 9,379 (83.2%) | 1,888 (16.8%) |
| 65 to 74 Years | 10,117 (99.5%) | 47 (0.5%) |
| 75 Years and older | 6,711 (100.0%) | 0 (0.0%) |
| Total | 60,478 (83.4%) | 12,016 (16.6%) |
Health Insurance Coverage by Citizenship Status in Putnam County
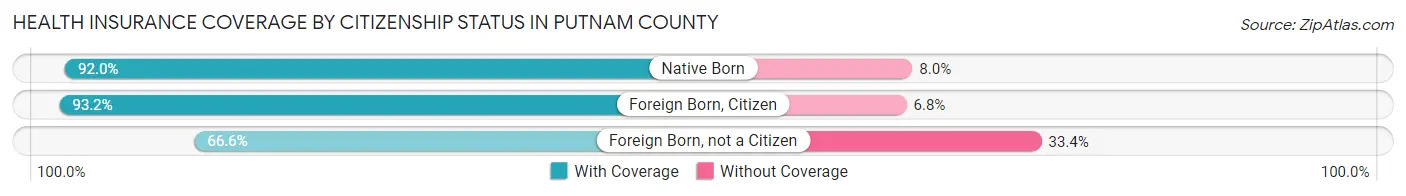
| Citizenship Status | With Coverage | Without Coverage |
| Native Born | 4,773 (92.0%) | 414 (8.0%) |
| Foreign Born, Citizen | 10,557 (93.2%) | 775 (6.8%) |
| Foreign Born, not a Citizen | 3,228 (66.6%) | 1,617 (33.4%) |
Health Insurance Coverage by Household Income in Putnam County
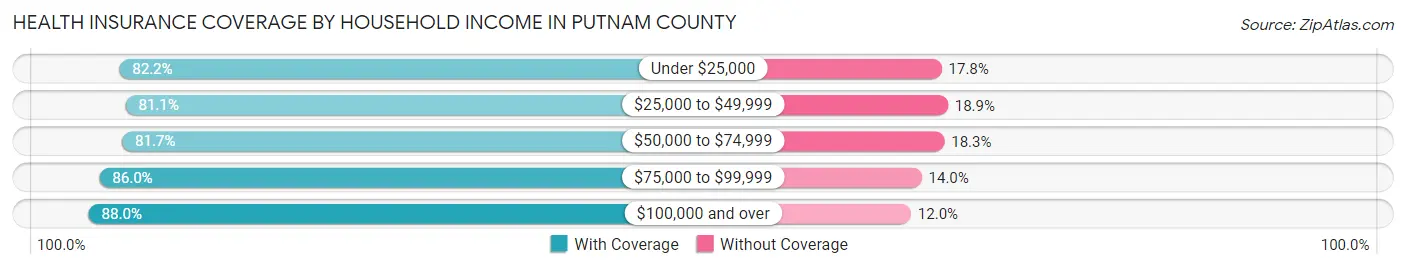
| Household Income | With Coverage | Without Coverage |
| Under $25,000 | 11,088 (82.2%) | 2,395 (17.8%) |
| $25,000 to $49,999 | 17,042 (81.1%) | 3,978 (18.9%) |
| $50,000 to $74,999 | 11,729 (81.7%) | 2,622 (18.3%) |
| $75,000 to $99,999 | 6,880 (86.0%) | 1,122 (14.0%) |
| $100,000 and over | 13,533 (88.0%) | 1,847 (12.0%) |
Public vs Private Health Insurance Coverage by Age in Putnam County
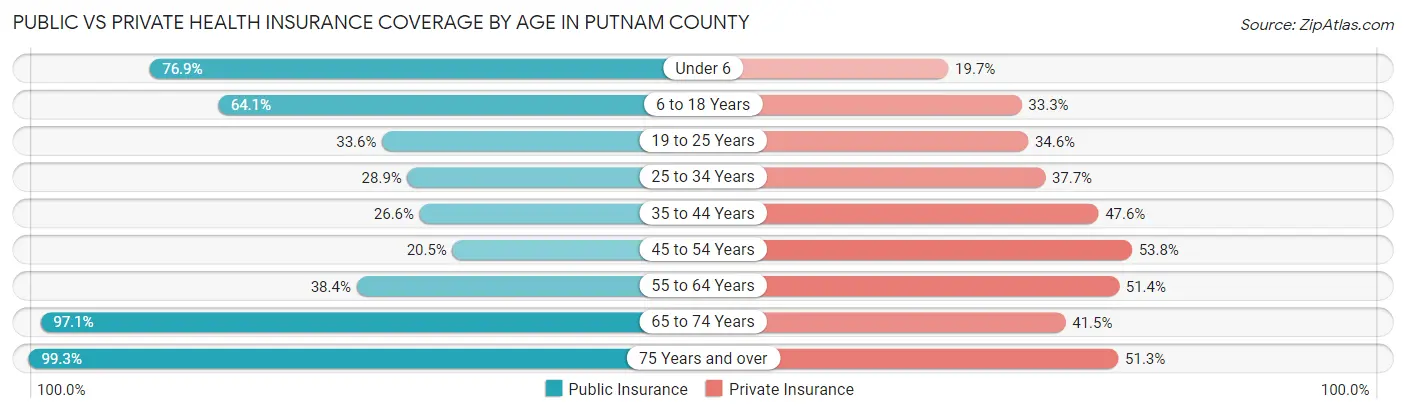
| Age Bracket | Public Insurance | Private Insurance |
| Under 6 | 3,986 (76.8%) | 1,024 (19.7%) |
| 6 to 18 Years | 7,267 (64.1%) | 3,778 (33.3%) |
| 19 to 25 Years | 1,628 (33.6%) | 1,674 (34.5%) |
| 25 to 34 Years | 2,201 (28.9%) | 2,872 (37.7%) |
| 35 to 44 Years | 1,914 (26.6%) | 3,420 (47.6%) |
| 45 to 54 Years | 1,681 (20.5%) | 4,404 (53.8%) |
| 55 to 64 Years | 4,321 (38.4%) | 5,794 (51.4%) |
| 65 to 74 Years | 9,867 (97.1%) | 4,217 (41.5%) |
| 75 Years and over | 6,662 (99.3%) | 3,442 (51.3%) |
| Total | 39,527 (54.5%) | 30,625 (42.2%) |
Disability Status by Sex by Age in Putnam County
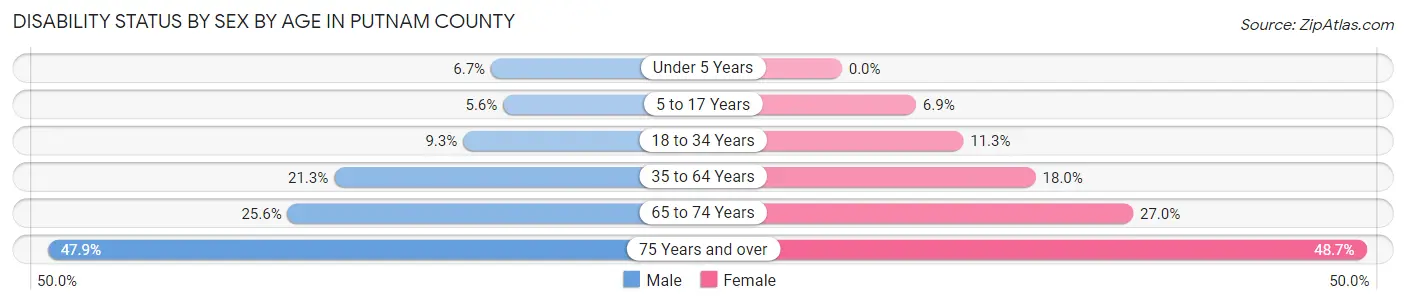
| Age Bracket | Male | Female |
| Under 5 Years | 142 (6.7%) | 0 (0.0%) |
| 5 to 17 Years | 326 (5.6%) | 391 (6.9%) |
| 18 to 34 Years | 629 (9.3%) | 744 (11.3%) |
| 35 to 64 Years | 2,748 (21.3%) | 2,469 (18.0%) |
| 65 to 74 Years | 1,310 (25.6%) | 1,364 (27.0%) |
| 75 Years and over | 1,502 (47.8%) | 1,739 (48.7%) |
Disability Class by Sex by Age in Putnam County
Disability Class: Hearing Difficulty
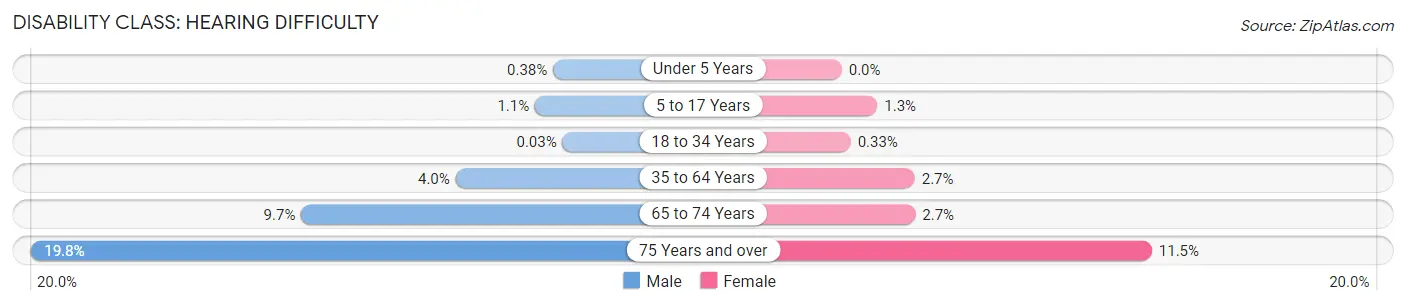
| Age Bracket | Male | Female |
| Under 5 Years | 8 (0.4%) | 0 (0.0%) |
| 5 to 17 Years | 61 (1.1%) | 75 (1.3%) |
| 18 to 34 Years | 2 (0.0%) | 22 (0.3%) |
| 35 to 64 Years | 516 (4.0%) | 372 (2.7%) |
| 65 to 74 Years | 498 (9.7%) | 138 (2.7%) |
| 75 Years and over | 620 (19.8%) | 411 (11.5%) |
Disability Class: Vision Difficulty
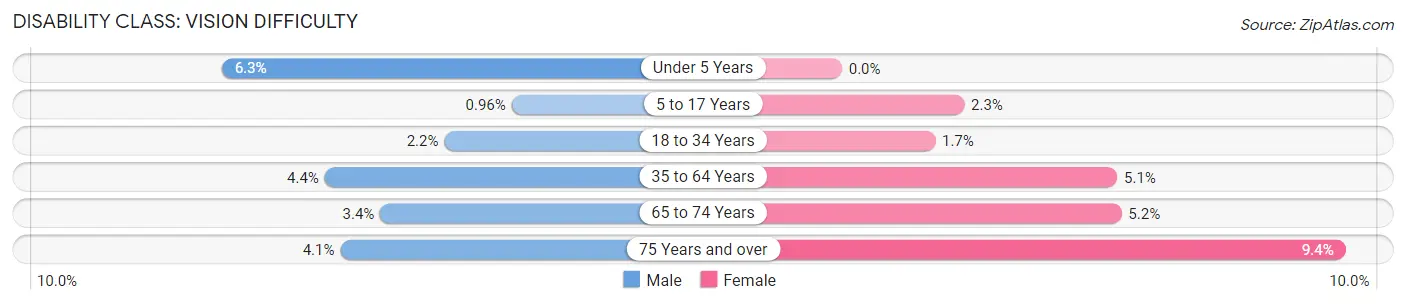
| Age Bracket | Male | Female |
| Under 5 Years | 134 (6.3%) | 0 (0.0%) |
| 5 to 17 Years | 56 (1.0%) | 129 (2.3%) |
| 18 to 34 Years | 149 (2.2%) | 114 (1.7%) |
| 35 to 64 Years | 572 (4.4%) | 702 (5.1%) |
| 65 to 74 Years | 174 (3.4%) | 262 (5.2%) |
| 75 Years and over | 130 (4.1%) | 334 (9.3%) |
Disability Class: Cognitive Difficulty
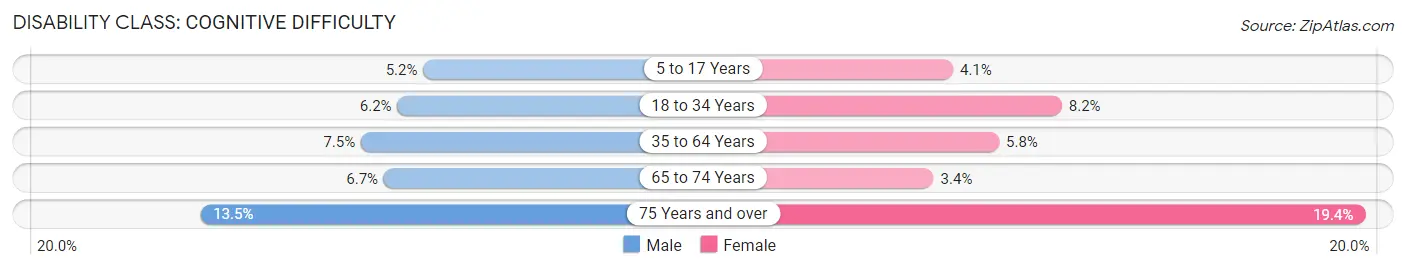
| Age Bracket | Male | Female |
| 5 to 17 Years | 303 (5.2%) | 235 (4.1%) |
| 18 to 34 Years | 416 (6.2%) | 539 (8.2%) |
| 35 to 64 Years | 970 (7.5%) | 802 (5.8%) |
| 65 to 74 Years | 341 (6.7%) | 172 (3.4%) |
| 75 Years and over | 423 (13.5%) | 694 (19.4%) |
Disability Class: Ambulatory Difficulty
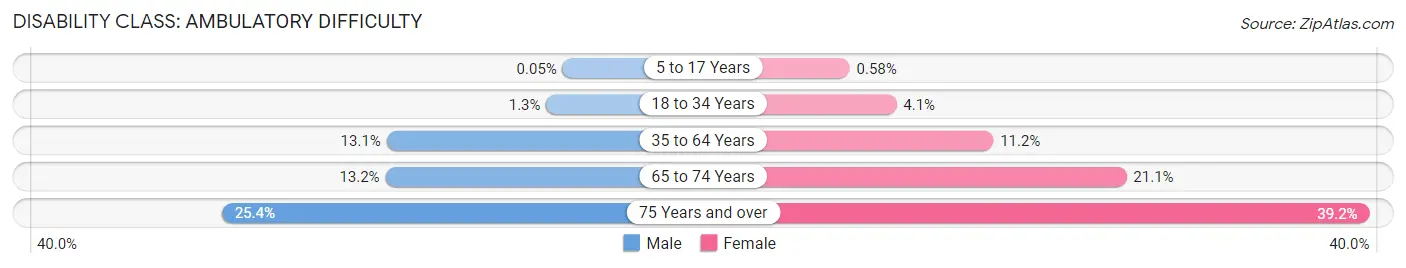
| Age Bracket | Male | Female |
| 5 to 17 Years | 3 (0.1%) | 33 (0.6%) |
| 18 to 34 Years | 85 (1.3%) | 267 (4.1%) |
| 35 to 64 Years | 1,694 (13.1%) | 1,543 (11.2%) |
| 65 to 74 Years | 676 (13.2%) | 1,066 (21.1%) |
| 75 Years and over | 796 (25.4%) | 1,399 (39.2%) |
Disability Class: Self-Care Difficulty
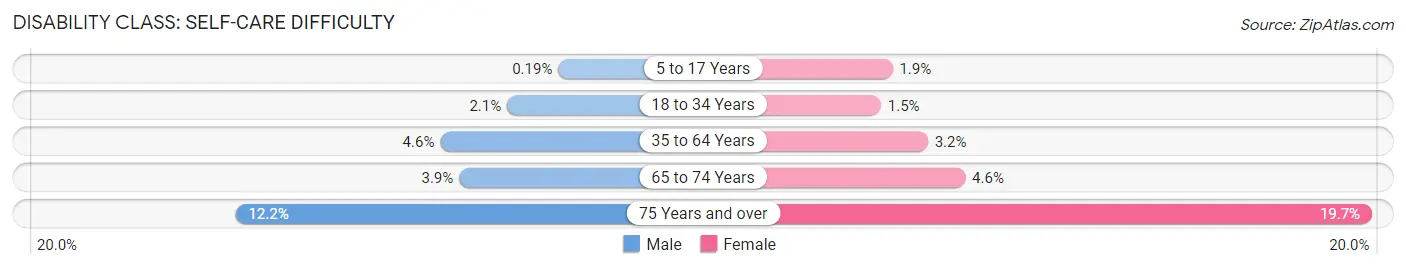
| Age Bracket | Male | Female |
| 5 to 17 Years | 11 (0.2%) | 107 (1.9%) |
| 18 to 34 Years | 141 (2.1%) | 96 (1.5%) |
| 35 to 64 Years | 590 (4.6%) | 438 (3.2%) |
| 65 to 74 Years | 198 (3.9%) | 231 (4.6%) |
| 75 Years and over | 382 (12.2%) | 703 (19.7%) |
Technology Access in Putnam County
Computing Device Access in Putnam County
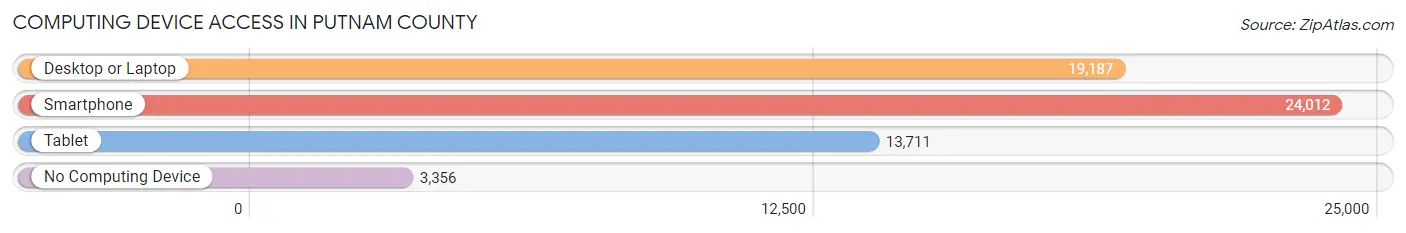
| Device Type | # Households | % Households |
| Desktop or Laptop | 19,187 | 64.4% |
| Smartphone | 24,012 | 80.6% |
| Tablet | 13,711 | 46.0% |
| No Computing Device | 3,356 | 11.3% |
| Total | 29,782 | 100.0% |
Internet Access in Putnam County
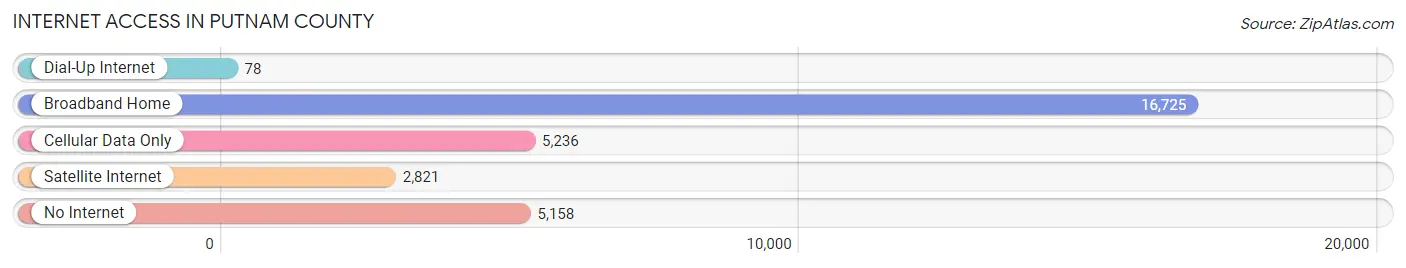
| Internet Type | # Households | % Households |
| Dial-Up Internet | 78 | 0.3% |
| Broadband Home | 16,725 | 56.2% |
| Cellular Data Only | 5,236 | 17.6% |
| Satellite Internet | 2,821 | 9.5% |
| No Internet | 5,158 | 17.3% |
| Total | 29,782 | 100.0% |
Putnam County Summary
Putnam County is located in the northeastern part of the state of Florida, and is part of the Jacksonville metropolitan area. It is bordered by Clay County to the north, St. Johns County to the east, Flagler County to the south, and Marion and Alachua counties to the west. The county seat is Palatka, and the largest city is Interlachen. Putnam County was established in 1849 and named for Benjamin A. Putnam, a soldier in the Second Seminole War and a member of the Florida Territorial Council.
Geography
Putnam County covers an area of 827 square miles, making it the fifth-largest county in Florida. The terrain is mostly flat, with some rolling hills in the northern part of the county. The St. Johns River forms the eastern border of the county, and the Ocklawaha River forms the western border. The county is home to several lakes, including Crescent Lake, Lake Grandin, and Lake George.
Climate
Putnam County has a humid subtropical climate, with hot, humid summers and mild winters. The average annual temperature is 71°F, and the average annual precipitation is 51 inches.
Demographics
As of the 2010 census, Putnam County had a population of 74,364. The racial makeup of the county was 79.2% White, 15.3% African American, 0.5% Native American, 0.7% Asian, 0.1% Pacific Islander, 2.7% from other races, and 1.5% from two or more races. Hispanic or Latino of any race were 8.2% of the population.
Economy
Putnam County’s economy is largely based on agriculture, forestry, and tourism. The county is home to several large farms, and the timber industry is also important. The county is also home to several tourist attractions, including the St. Johns River, the Ocklawaha River, and the Palatka-to-St. Augustine State Trail.
The county’s largest employers are Putnam Community Medical Center, Putnam County School District, and the City of Palatka. Other major employers include the Putnam County Sheriff’s Office, Putnam County Fire Rescue, and the Putnam County Health Department.
Education
Putnam County is served by the Putnam County School District, which operates 24 elementary schools, seven middle schools, and four high schools. The district also operates an adult education center and a virtual school. The county is also home to several private schools, including St. John’s Academy and St. Joseph’s Academy.
Transportation
Putnam County is served by several major highways, including Interstate 95, U.S. Route 17, and State Road 20. The county is also served by the Palatka Municipal Airport and the St. Johns River Ferry.
Conclusion
Putnam County is a rural county in northeastern Florida, with a population of 74,364 as of the 2010 census. The county’s economy is largely based on agriculture, forestry, and tourism, and the county is served by several major highways and the Palatka Municipal Airport. The county is also served by the Putnam County School District, which operates 24 elementary schools, seven middle schools, and four high schools.
Common Questions
What is Per Capita Income in Putnam County?
Per Capita income in Putnam County is $25,966.
What is the Median Family Income in Putnam County?
Median Family Income in Putnam County is $57,256.
What is the Median Household income in Putnam County?
Median Household Income in Putnam County is $44,852.
What is Income or Wage Gap in Putnam County?
Income or Wage Gap in Putnam County is 18.8%.
Women in Putnam County earn 81.2 cents for every dollar earned by a man.
What is Family Income Deficit in Putnam County?
Family Income Deficit in Putnam County is $10,867.
Families that are below poverty line in Putnam County earn $10,867 less on average than the poverty threshold level.
What is Inequality or Gini Index in Putnam County?
Inequality or Gini Index in Putnam County is 0.48.
What is the Total Population of Putnam County?
Total Population of Putnam County is 73,604.
What is the Total Male Population of Putnam County?
Total Male Population of Putnam County is 36,564.
What is the Total Female Population of Putnam County?
Total Female Population of Putnam County is 37,040.
What is the Ratio of Males per 100 Females in Putnam County?
There are 98.71 Males per 100 Females in Putnam County.
What is the Ratio of Females per 100 Males in Putnam County?
There are 101.30 Females per 100 Males in Putnam County.
What is the Median Population Age in Putnam County?
Median Population Age in Putnam County is 45.1 Years.
What is the Average Family Size in Putnam County
Average Family Size in Putnam County is 3.1 People.
What is the Average Household Size in Putnam County
Average Household Size in Putnam County is 2.4 People.
How Large is the Labor Force in Putnam County?
There are 28,419 People in the Labor Forcein in Putnam County.
What is the Percentage of People in the Labor Force in Putnam County?
47.7% of People are in the Labor Force in Putnam County.
What is the Unemployment Rate in Putnam County?
Unemployment Rate in Putnam County is 8.9%.