Okeechobee County, FL Map & Demographics
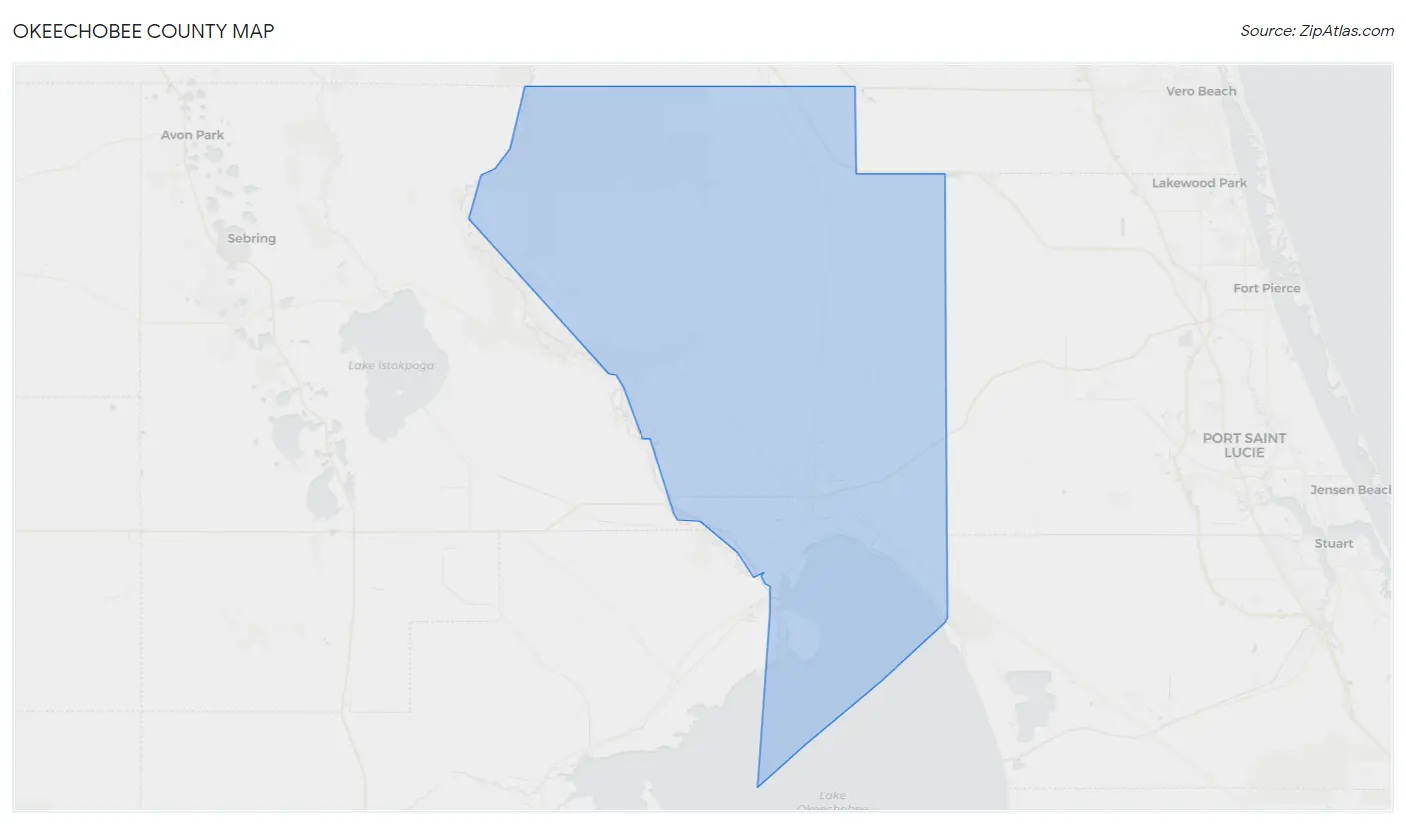
Okeechobee County Map
Okeechobee County Overview
$26,904
PER CAPITA INCOME
$58,527
AVG FAMILY INCOME
$50,476
AVG HOUSEHOLD INCOME
26.9%
WAGE / INCOME GAP [ % ]
73.1¢/ $1
WAGE / INCOME GAP [ $ ]
$10,775
FAMILY INCOME DEFICIT
0.45
INEQUALITY / GINI INDEX
39,870
TOTAL POPULATION
21,440
MALE POPULATION
18,430
FEMALE POPULATION
116.33
MALES / 100 FEMALES
85.96
FEMALES / 100 MALES
40.8
MEDIAN AGE
3.0
AVG FAMILY SIZE
2.5
AVG HOUSEHOLD SIZE
16,367
LABOR FORCE [ PEOPLE ]
50.4%
PERCENT IN LABOR FORCE
6.1%
UNEMPLOYMENT RATE
Okeechobee County Area Codes
Income in Okeechobee County
Income Overview in Okeechobee County
Per Capita Income in Okeechobee County is $26,904, while median incomes of families and households are $58,527 and $50,476 respectively.
| Characteristic | Number | Measure |
| Per Capita Income | 39,870 | $26,904 |
| Median Family Income | 9,904 | $58,527 |
| Mean Family Income | 9,904 | $75,336 |
| Median Household Income | 14,919 | $50,476 |
| Mean Household Income | 14,919 | $69,244 |
| Income Deficit | 9,904 | $10,775 |
| Wage / Income Gap (%) | 39,870 | 26.90% |
| Wage / Income Gap ($) | 39,870 | 73.10¢ per $1 |
| Gini / Inequality Index | 39,870 | 0.45 |
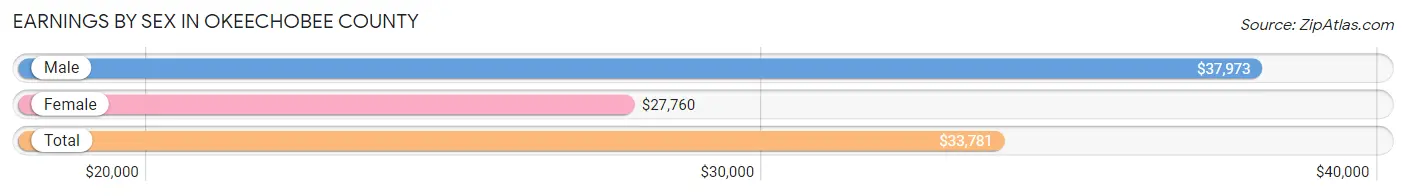
Earnings by Sex in Okeechobee County
Average Earnings in Okeechobee County are $33,781, $37,973 for men and $27,760 for women, a difference of 26.9%.
| Sex | Number | Average Earnings |
| Male | 9,857 (56.7%) | $37,973 |
| Female | 7,523 (43.3%) | $27,760 |
| Total | 17,380 (100.0%) | $33,781 |
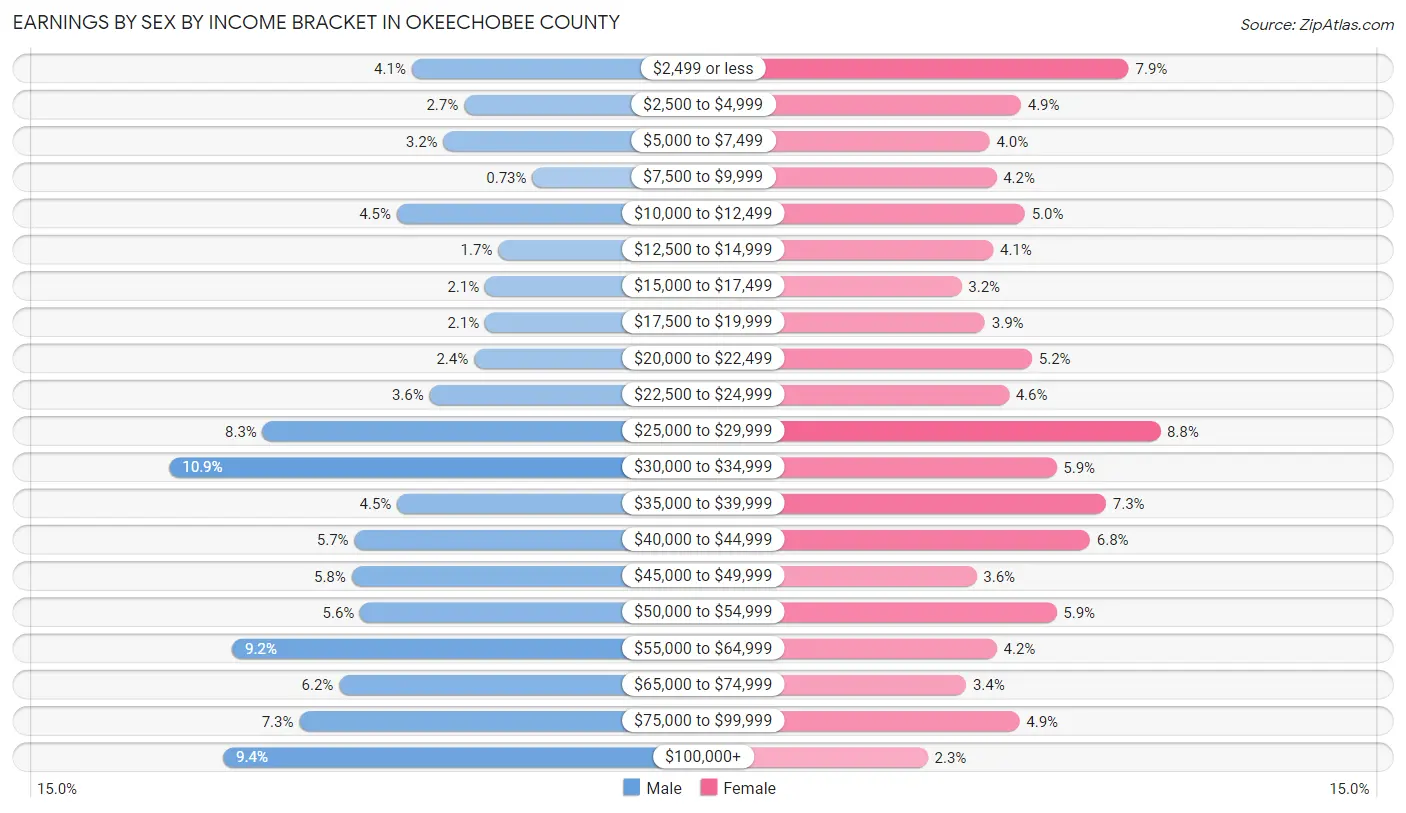
Earnings by Sex by Income Bracket in Okeechobee County
The most common earnings brackets in Okeechobee County are $30,000 to $34,999 for men (1,077 | 10.9%) and $25,000 to $29,999 for women (662 | 8.8%).
| Income | Male | Female |
| $2,499 or less | 406 (4.1%) | 596 (7.9%) |
| $2,500 to $4,999 | 261 (2.6%) | 368 (4.9%) |
| $5,000 to $7,499 | 318 (3.2%) | 302 (4.0%) |
| $7,500 to $9,999 | 72 (0.7%) | 316 (4.2%) |
| $10,000 to $12,499 | 448 (4.5%) | 376 (5.0%) |
| $12,500 to $14,999 | 167 (1.7%) | 309 (4.1%) |
| $15,000 to $17,499 | 203 (2.1%) | 242 (3.2%) |
| $17,500 to $19,999 | 203 (2.1%) | 292 (3.9%) |
| $20,000 to $22,499 | 234 (2.4%) | 391 (5.2%) |
| $22,500 to $24,999 | 357 (3.6%) | 342 (4.5%) |
| $25,000 to $29,999 | 819 (8.3%) | 662 (8.8%) |
| $30,000 to $34,999 | 1,077 (10.9%) | 443 (5.9%) |
| $35,000 to $39,999 | 447 (4.5%) | 548 (7.3%) |
| $40,000 to $44,999 | 565 (5.7%) | 514 (6.8%) |
| $45,000 to $49,999 | 573 (5.8%) | 274 (3.6%) |
| $50,000 to $54,999 | 549 (5.6%) | 443 (5.9%) |
| $55,000 to $64,999 | 904 (9.2%) | 317 (4.2%) |
| $65,000 to $74,999 | 607 (6.2%) | 252 (3.4%) |
| $75,000 to $99,999 | 718 (7.3%) | 365 (4.9%) |
| $100,000+ | 929 (9.4%) | 171 (2.3%) |
| Total | 9,857 (100.0%) | 7,523 (100.0%) |
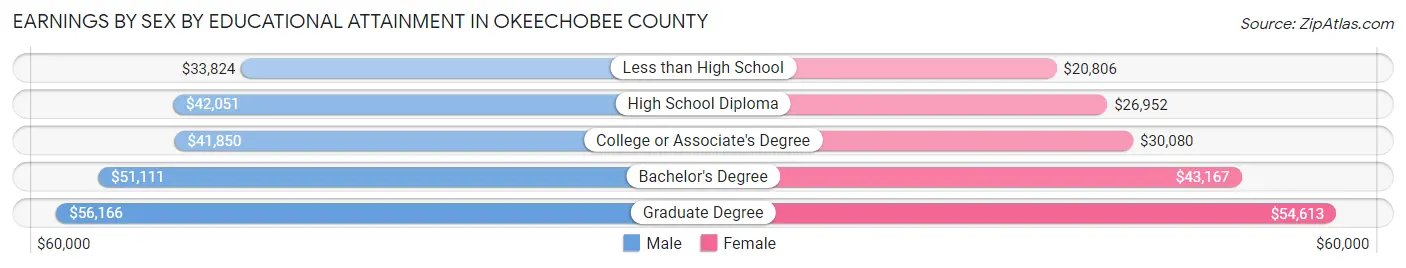
Earnings by Sex by Educational Attainment in Okeechobee County
Average earnings in Okeechobee County are $42,563 for men and $29,394 for women, a difference of 30.9%. Men with an educational attainment of graduate degree enjoy the highest average annual earnings of $56,166, while those with less than high school education earn the least with $33,824. Women with an educational attainment of graduate degree earn the most with the average annual earnings of $54,613, while those with less than high school education have the smallest earnings of $20,806.
| Educational Attainment | Male Income | Female Income |
| Less than High School | $33,824 | $20,806 |
| High School Diploma | $42,051 | $26,952 |
| College or Associate's Degree | $41,850 | $30,080 |
| Bachelor's Degree | $51,111 | $43,167 |
| Graduate Degree | $56,166 | $54,613 |
| Total | $42,563 | $29,394 |
Family Income in Okeechobee County
Family Income Brackets in Okeechobee County
According to the Okeechobee County family income data, there are 2,169 families falling into the $50,000 to $74,999 income range, which is the most common income bracket and makes up 21.9% of all families. Conversely, the $10,000 to $14,999 income bracket is the least frequent group with only 218 families (2.2%) belonging to this category.
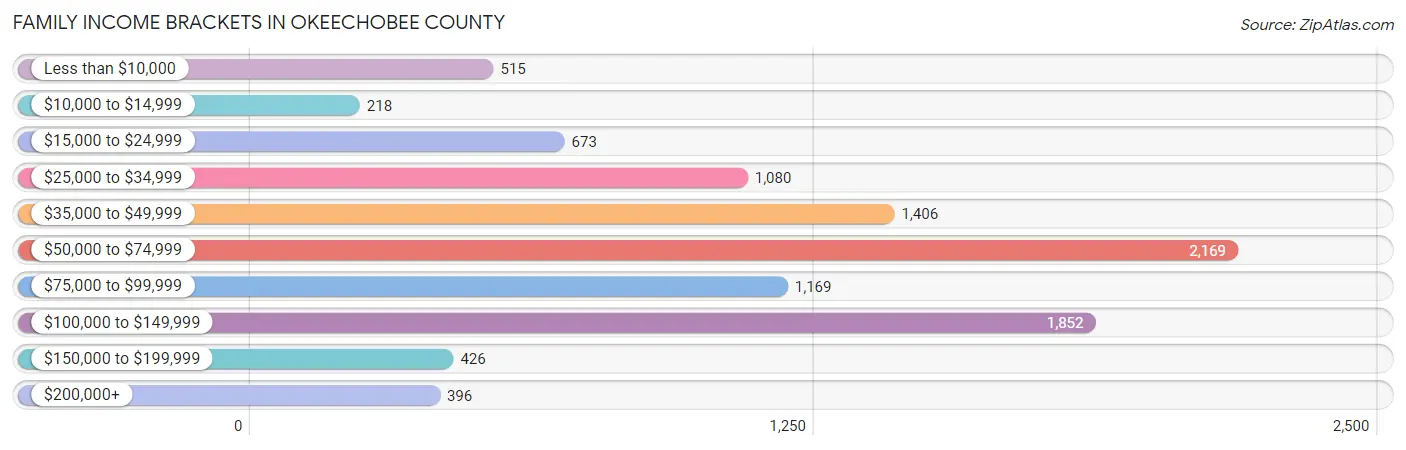
| Income Bracket | # Families | % Families |
| Less than $10,000 | 515 | 5.2% |
| $10,000 to $14,999 | 218 | 2.2% |
| $15,000 to $24,999 | 673 | 6.8% |
| $25,000 to $34,999 | 1,080 | 10.9% |
| $35,000 to $49,999 | 1,406 | 14.2% |
| $50,000 to $74,999 | 2,169 | 21.9% |
| $75,000 to $99,999 | 1,169 | 11.8% |
| $100,000 to $149,999 | 1,852 | 18.7% |
| $150,000 to $199,999 | 426 | 4.3% |
| $200,000+ | 396 | 4.0% |
Family Income by Famaliy Size in Okeechobee County
6-person families (60 | 0.6%) account for the highest median family income in Okeechobee County with $119,167 per family, while 2-person families (5,362 | 54.1%) have the highest median income of $27,848 per family member.
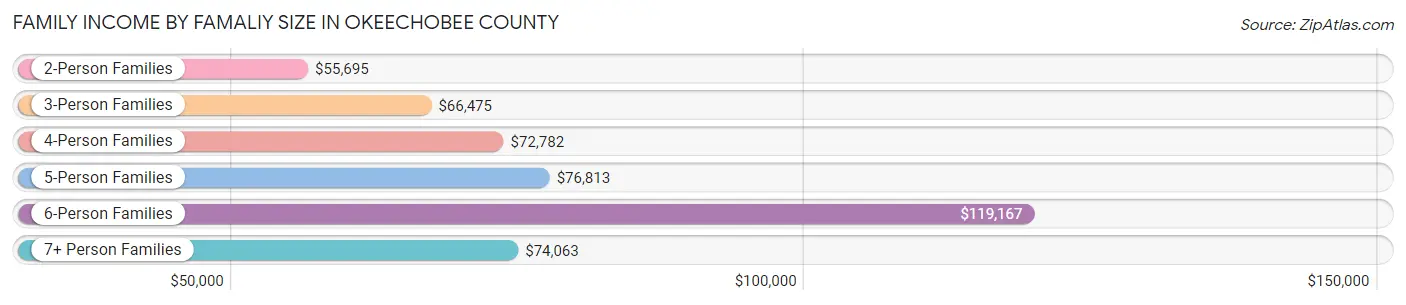
| Income Bracket | # Families | Median Income |
| 2-Person Families | 5,362 (54.1%) | $55,695 |
| 3-Person Families | 1,798 (18.1%) | $66,475 |
| 4-Person Families | 1,621 (16.4%) | $72,782 |
| 5-Person Families | 797 (8.1%) | $76,813 |
| 6-Person Families | 60 (0.6%) | $119,167 |
| 7+ Person Families | 266 (2.7%) | $74,063 |
| Total | 9,904 (100.0%) | $58,527 |
Family Income by Number of Earners in Okeechobee County
The median family income in Okeechobee County is $58,527, with families comprising 3+ earners (807) having the highest median family income of $129,438, while families with no earners (2,175) have the lowest median family income of $37,846, accounting for 8.2% and 22.0% of families, respectively.
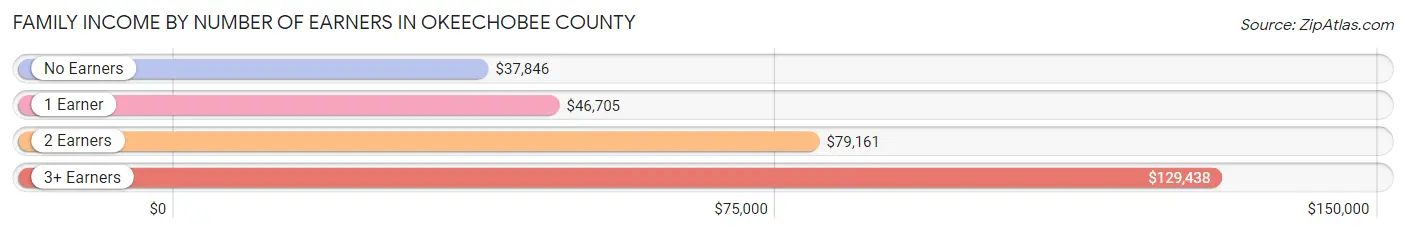
| Number of Earners | # Families | Median Income |
| No Earners | 2,175 (22.0%) | $37,846 |
| 1 Earner | 3,421 (34.5%) | $46,705 |
| 2 Earners | 3,501 (35.3%) | $79,161 |
| 3+ Earners | 807 (8.2%) | $129,438 |
| Total | 9,904 (100.0%) | $58,527 |
Household Income in Okeechobee County
Household Income Brackets in Okeechobee County
With 2,939 households falling in the category, the $50,000 to $74,999 income range is the most frequent in Okeechobee County, accounting for 19.7% of all households. In contrast, only 507 households (3.4%) fall into the $200,000+ income bracket, making it the least populous group.
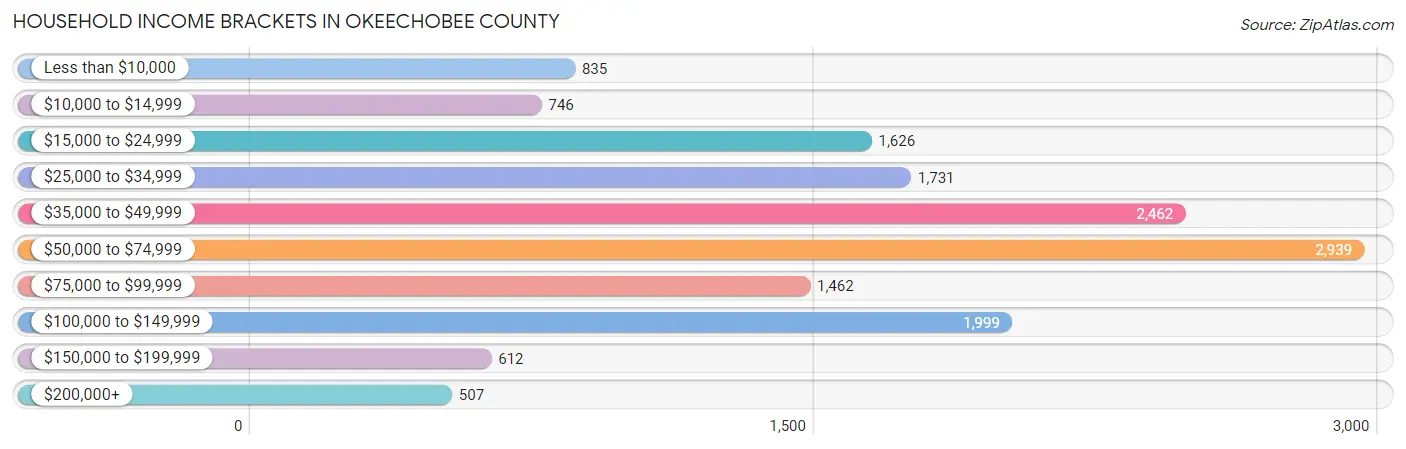
| Income Bracket | # Households | % Households |
| Less than $10,000 | 835 | 5.6% |
| $10,000 to $14,999 | 746 | 5.0% |
| $15,000 to $24,999 | 1,626 | 10.9% |
| $25,000 to $34,999 | 1,731 | 11.6% |
| $35,000 to $49,999 | 2,462 | 16.5% |
| $50,000 to $74,999 | 2,939 | 19.7% |
| $75,000 to $99,999 | 1,462 | 9.8% |
| $100,000 to $149,999 | 1,999 | 13.4% |
| $150,000 to $199,999 | 612 | 4.1% |
| $200,000+ | 507 | 3.4% |
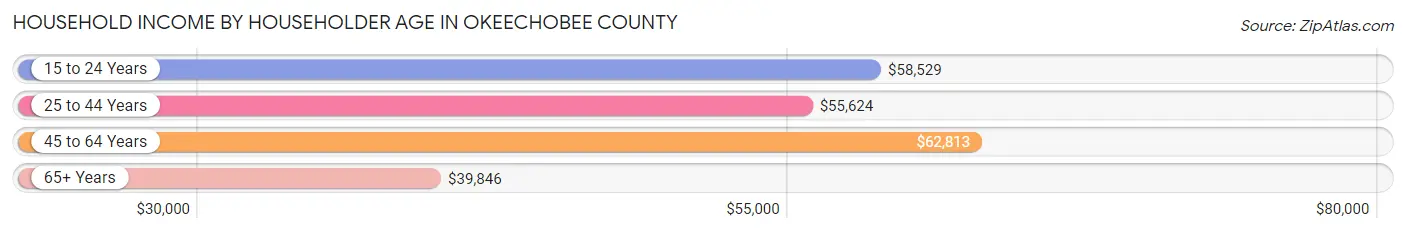
Household Income by Householder Age in Okeechobee County
The median household income in Okeechobee County is $50,476, with the highest median household income of $62,813 found in the 45 to 64 years age bracket for the primary householder. A total of 5,221 households (35.0%) fall into this category. Meanwhile, the 65+ years age bracket for the primary householder has the lowest median household income of $39,846, with 4,697 households (31.5%) in this group.
| Income Bracket | # Households | Median Income |
| 15 to 24 Years | 524 (3.5%) | $58,529 |
| 25 to 44 Years | 4,477 (30.0%) | $55,624 |
| 45 to 64 Years | 5,221 (35.0%) | $62,813 |
| 65+ Years | 4,697 (31.5%) | $39,846 |
| Total | 14,919 (100.0%) | $50,476 |
Poverty in Okeechobee County
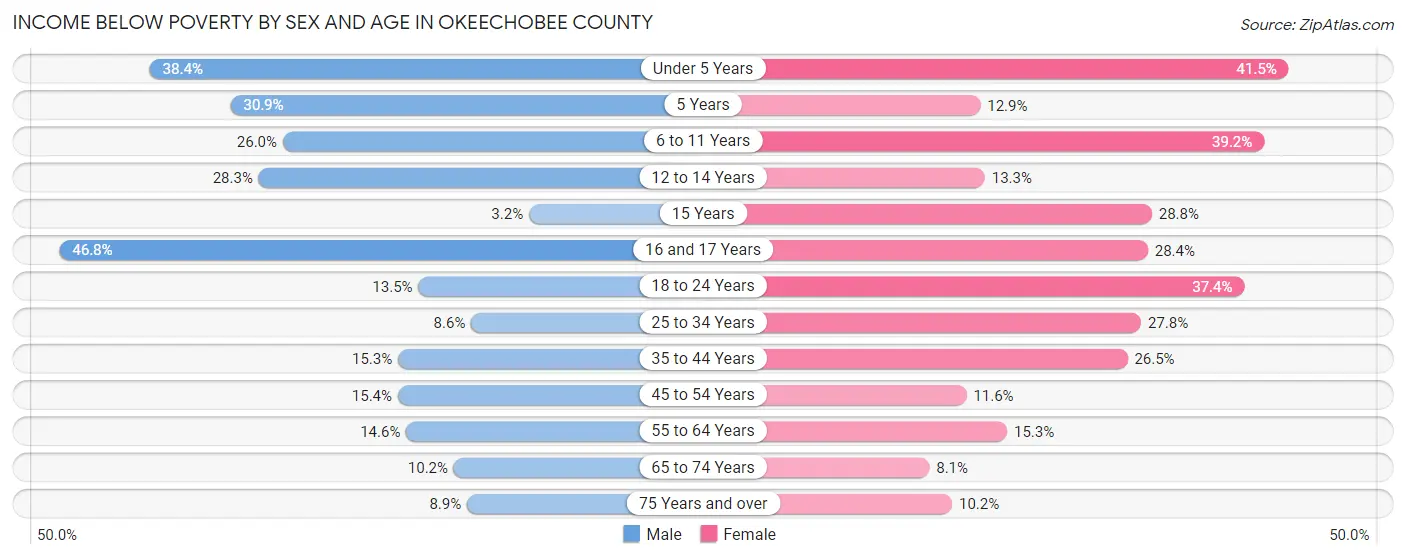
Income Below Poverty by Sex and Age in Okeechobee County
With 16.9% poverty level for males and 21.6% for females among the residents of Okeechobee County, 16 and 17 year old males and under 5 year old females are the most vulnerable to poverty, with 210 males (46.8%) and 464 females (41.5%) in their respective age groups living below the poverty level.
| Age Bracket | Male | Female |
| Under 5 Years | 473 (38.4%) | 464 (41.5%) |
| 5 Years | 93 (30.9%) | 23 (12.9%) |
| 6 to 11 Years | 353 (26.0%) | 515 (39.2%) |
| 12 to 14 Years | 190 (28.3%) | 80 (13.3%) |
| 15 Years | 8 (3.2%) | 21 (28.8%) |
| 16 and 17 Years | 210 (46.8%) | 165 (28.4%) |
| 18 to 24 Years | 184 (13.5%) | 511 (37.3%) |
| 25 to 34 Years | 188 (8.6%) | 629 (27.8%) |
| 35 to 44 Years | 414 (15.3%) | 534 (26.5%) |
| 45 to 54 Years | 373 (15.4%) | 256 (11.6%) |
| 55 to 64 Years | 354 (14.6%) | 384 (15.3%) |
| 65 to 74 Years | 181 (10.2%) | 172 (8.1%) |
| 75 Years and over | 146 (8.9%) | 192 (10.2%) |
| Total | 3,167 (16.9%) | 3,946 (21.6%) |
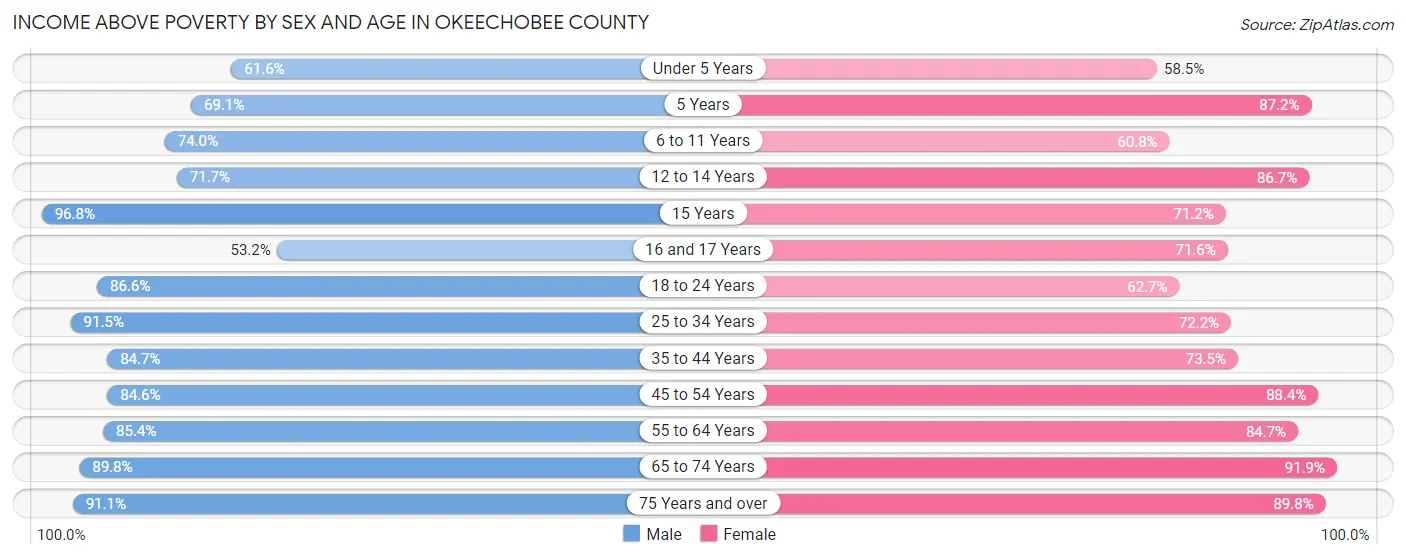
Income Above Poverty by Sex and Age in Okeechobee County
According to the poverty statistics in Okeechobee County, males aged 15 years and females aged 65 to 74 years are the age groups that are most secure financially, with 96.8% of males and 91.9% of females in these age groups living above the poverty line.
| Age Bracket | Male | Female |
| Under 5 Years | 759 (61.6%) | 655 (58.5%) |
| 5 Years | 208 (69.1%) | 156 (87.2%) |
| 6 to 11 Years | 1,003 (74.0%) | 799 (60.8%) |
| 12 to 14 Years | 482 (71.7%) | 523 (86.7%) |
| 15 Years | 243 (96.8%) | 52 (71.2%) |
| 16 and 17 Years | 239 (53.2%) | 416 (71.6%) |
| 18 to 24 Years | 1,184 (86.6%) | 857 (62.6%) |
| 25 to 34 Years | 2,010 (91.4%) | 1,636 (72.2%) |
| 35 to 44 Years | 2,284 (84.7%) | 1,480 (73.5%) |
| 45 to 54 Years | 2,055 (84.6%) | 1,957 (88.4%) |
| 55 to 64 Years | 2,074 (85.4%) | 2,120 (84.7%) |
| 65 to 74 Years | 1,600 (89.8%) | 1,946 (91.9%) |
| 75 Years and over | 1,488 (91.1%) | 1,685 (89.8%) |
| Total | 15,629 (83.2%) | 14,282 (78.3%) |
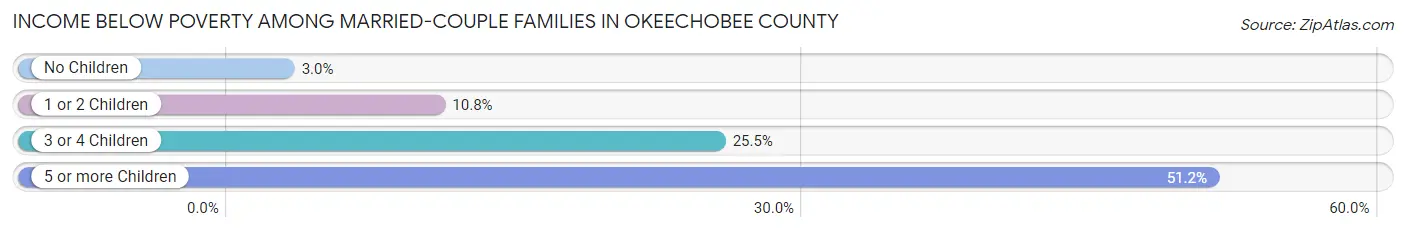
Income Below Poverty Among Married-Couple Families in Okeechobee County
The poverty statistics for married-couple families in Okeechobee County show that 7.1% or 499 of the total 7,059 families live below the poverty line. Families with 5 or more children have the highest poverty rate of 51.2%, comprising of 42 families. On the other hand, families with no children have the lowest poverty rate of 3.0%, which includes 136 families.
| Children | Above Poverty | Below Poverty |
| No Children | 4,455 (97.0%) | 136 (3.0%) |
| 1 or 2 Children | 1,746 (89.2%) | 212 (10.8%) |
| 3 or 4 Children | 319 (74.5%) | 109 (25.5%) |
| 5 or more Children | 40 (48.8%) | 42 (51.2%) |
| Total | 6,560 (92.9%) | 499 (7.1%) |
Income Below Poverty Among Single-Parent Households in Okeechobee County
According to the poverty data in Okeechobee County, 22.6% or 233 single-father households and 36.2% or 658 single-mother households are living below the poverty line. Among single-father households, those with 5 or more children have the highest poverty rate, with 46 households (100.0%) experiencing poverty. Likewise, among single-mother households, those with 3 or 4 children have the highest poverty rate, with 70 households (68.0%) falling below the poverty line.
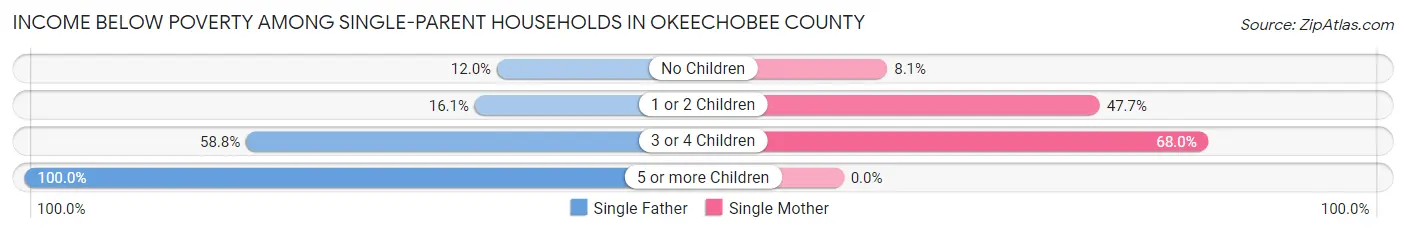
| Children | Single Father | Single Mother |
| No Children | 38 (12.0%) | 47 (8.1%) |
| 1 or 2 Children | 92 (16.1%) | 541 (47.7%) |
| 3 or 4 Children | 57 (58.8%) | 70 (68.0%) |
| 5 or more Children | 46 (100.0%) | 0 (0.0%) |
| Total | 233 (22.6%) | 658 (36.2%) |
Income Below Poverty Among Married-Couple vs Single-Parent Households in Okeechobee County
The poverty data for Okeechobee County shows that 499 of the married-couple family households (7.1%) and 891 of the single-parent households (31.3%) are living below the poverty level. Within the married-couple family households, those with 5 or more children have the highest poverty rate, with 42 households (51.2%) falling below the poverty line. Among the single-parent households, those with 5 or more children have the highest poverty rate, with 46 household (100.0%) living below poverty.
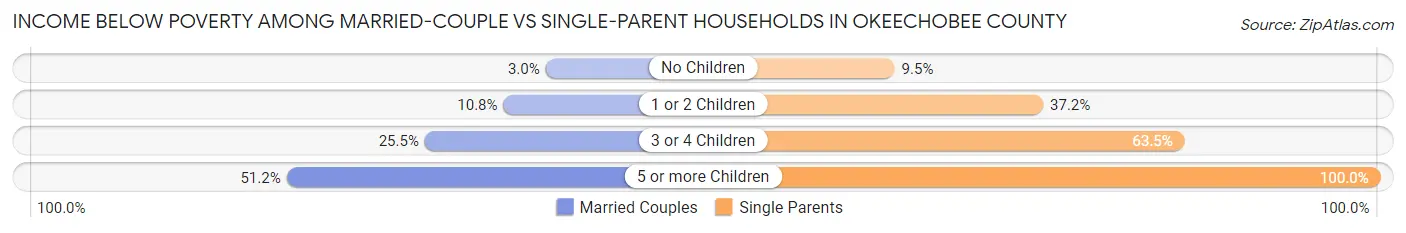
| Children | Married-Couple Families | Single-Parent Households |
| No Children | 136 (3.0%) | 85 (9.5%) |
| 1 or 2 Children | 212 (10.8%) | 633 (37.1%) |
| 3 or 4 Children | 109 (25.5%) | 127 (63.5%) |
| 5 or more Children | 42 (51.2%) | 46 (100.0%) |
| Total | 499 (7.1%) | 891 (31.3%) |
Race in Okeechobee County
The most populous races in Okeechobee County are White / Caucasian (30,033 | 75.3%), Hispanic or Latino (10,661 | 26.7%), and Black / African American (3,241 | 8.1%).
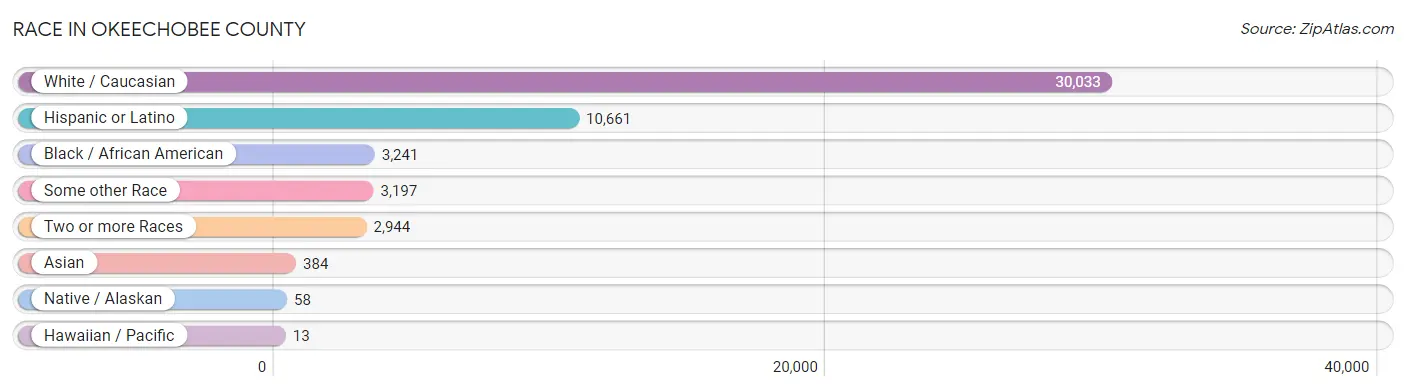
| Race | # Population | % Population |
| Asian | 384 | 1.0% |
| Black / African American | 3,241 | 8.1% |
| Hawaiian / Pacific | 13 | 0.0% |
| Hispanic or Latino | 10,661 | 26.7% |
| Native / Alaskan | 58 | 0.2% |
| White / Caucasian | 30,033 | 75.3% |
| Two or more Races | 2,944 | 7.4% |
| Some other Race | 3,197 | 8.0% |
| Total | 39,870 | 100.0% |
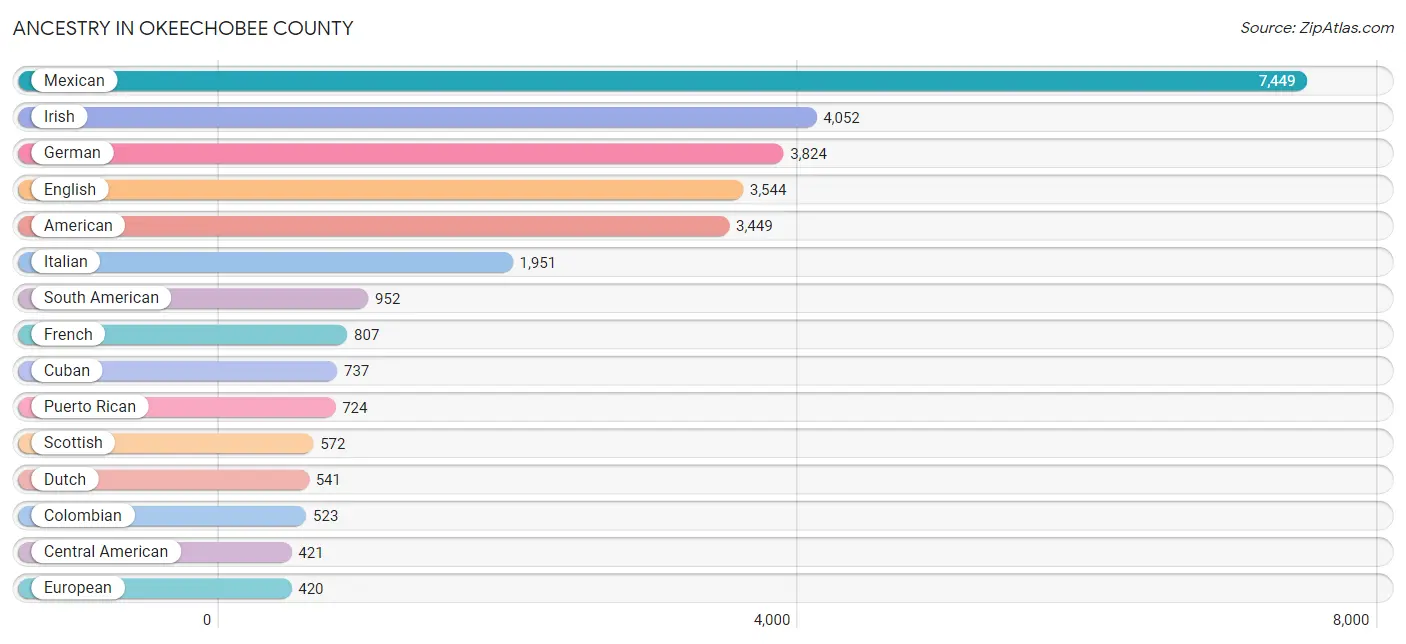
Ancestry in Okeechobee County
The most populous ancestries reported in Okeechobee County are Mexican (7,449 | 18.7%), Irish (4,052 | 10.2%), German (3,824 | 9.6%), English (3,544 | 8.9%), and American (3,449 | 8.6%), together accounting for 56.0% of all Okeechobee County residents.
| Ancestry | # Population | % Population |
| African | 212 | 0.5% |
| Albanian | 24 | 0.1% |
| American | 3,449 | 8.6% |
| Arab | 10 | 0.0% |
| Argentinean | 59 | 0.2% |
| Austrian | 42 | 0.1% |
| Bahamian | 3 | 0.0% |
| Basque | 14 | 0.0% |
| Bhutanese | 48 | 0.1% |
| Blackfeet | 121 | 0.3% |
| Brazilian | 51 | 0.1% |
| British | 110 | 0.3% |
| British West Indian | 28 | 0.1% |
| Burmese | 25 | 0.1% |
| Canadian | 93 | 0.2% |
| Celtic | 9 | 0.0% |
| Central American | 421 | 1.1% |
| Cherokee | 193 | 0.5% |
| Chippewa | 5 | 0.0% |
| Colombian | 523 | 1.3% |
| Costa Rican | 7 | 0.0% |
| Creek | 2 | 0.0% |
| Cuban | 737 | 1.8% |
| Czech | 103 | 0.3% |
| Czechoslovakian | 19 | 0.1% |
| Danish | 35 | 0.1% |
| Dominican | 134 | 0.3% |
| Dutch | 541 | 1.4% |
| Eastern European | 131 | 0.3% |
| Ecuadorian | 16 | 0.0% |
| English | 3,544 | 8.9% |
| European | 420 | 1.1% |
| Finnish | 24 | 0.1% |
| French | 807 | 2.0% |
| French American Indian | 21 | 0.1% |
| French Canadian | 157 | 0.4% |
| German | 3,824 | 9.6% |
| Greek | 47 | 0.1% |
| Guatemalan | 301 | 0.7% |
| Haitian | 118 | 0.3% |
| Honduran | 31 | 0.1% |
| Hungarian | 142 | 0.4% |
| Indian (Asian) | 86 | 0.2% |
| Irish | 4,052 | 10.2% |
| Iroquois | 25 | 0.1% |
| Israeli | 3 | 0.0% |
| Italian | 1,951 | 4.9% |
| Jamaican | 244 | 0.6% |
| Korean | 207 | 0.5% |
| Lebanese | 10 | 0.0% |
| Lithuanian | 6 | 0.0% |
| Lumbee | 6 | 0.0% |
| Macedonian | 13 | 0.0% |
| Malaysian | 6 | 0.0% |
| Menominee | 3 | 0.0% |
| Mexican | 7,449 | 18.7% |
| Native Hawaiian | 22 | 0.1% |
| Nicaraguan | 22 | 0.1% |
| Nigerian | 3 | 0.0% |
| Norwegian | 109 | 0.3% |
| Panamanian | 20 | 0.1% |
| Pennsylvania German | 45 | 0.1% |
| Peruvian | 34 | 0.1% |
| Polish | 271 | 0.7% |
| Portuguese | 25 | 0.1% |
| Potawatomi | 8 | 0.0% |
| Puerto Rican | 724 | 1.8% |
| Romanian | 11 | 0.0% |
| Russian | 109 | 0.3% |
| Salvadoran | 40 | 0.1% |
| Scandinavian | 172 | 0.4% |
| Scotch-Irish | 284 | 0.7% |
| Scottish | 572 | 1.4% |
| Seminole | 73 | 0.2% |
| Slovak | 24 | 0.1% |
| South African | 11 | 0.0% |
| South American | 952 | 2.4% |
| Spaniard | 132 | 0.3% |
| Spanish | 71 | 0.2% |
| Sri Lankan | 96 | 0.2% |
| Subsaharan African | 226 | 0.6% |
| Swedish | 133 | 0.3% |
| Swiss | 27 | 0.1% |
| Thai | 58 | 0.2% |
| Trinidadian and Tobagonian | 21 | 0.1% |
| Turkish | 11 | 0.0% |
| U.S. Virgin Islander | 14 | 0.0% |
| Venezuelan | 320 | 0.8% |
| Vietnamese | 34 | 0.1% |
| Welsh | 156 | 0.4% |
| West Indian | 12 | 0.0% | View All 91 Rows |
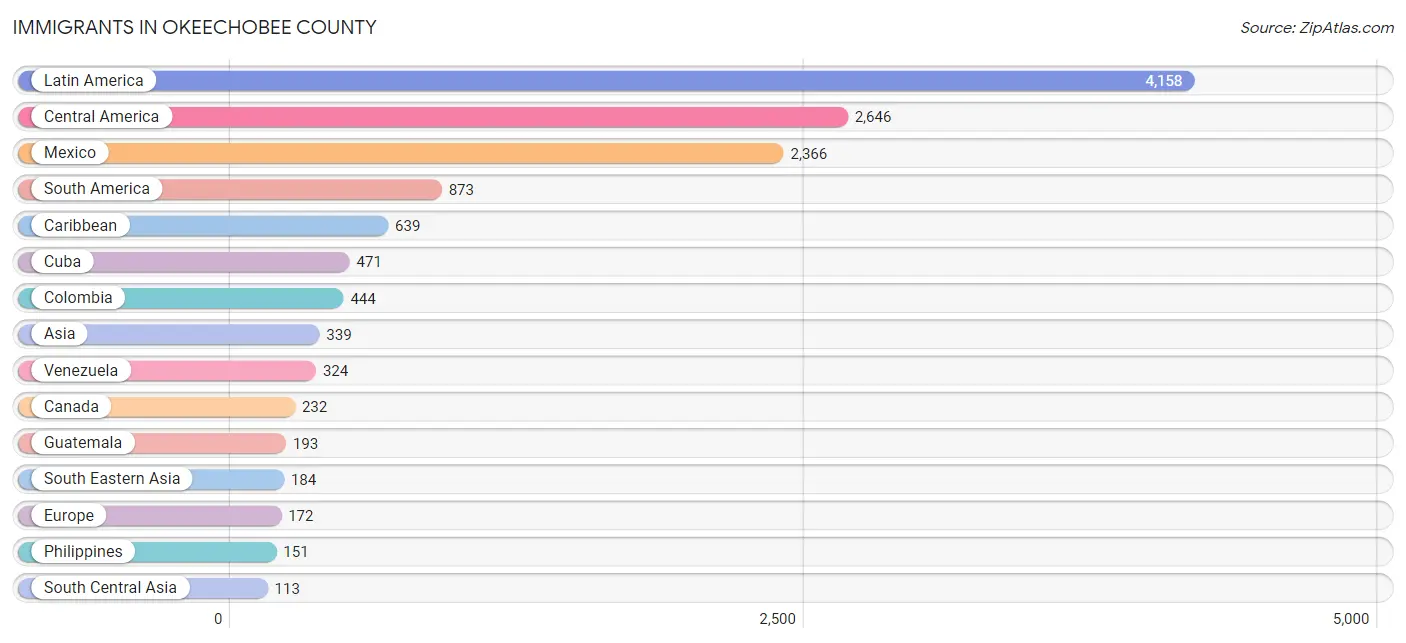
Immigrants in Okeechobee County
The most numerous immigrant groups reported in Okeechobee County came from Latin America (4,158 | 10.4%), Central America (2,646 | 6.6%), Mexico (2,366 | 5.9%), South America (873 | 2.2%), and Caribbean (639 | 1.6%), together accounting for 26.8% of all Okeechobee County residents.
| Immigration Origin | # Population | % Population |
| Africa | 27 | 0.1% |
| Albania | 24 | 0.1% |
| Argentina | 59 | 0.2% |
| Asia | 339 | 0.9% |
| Bahamas | 19 | 0.1% |
| Bangladesh | 34 | 0.1% |
| Belgium | 11 | 0.0% |
| Brazil | 27 | 0.1% |
| Canada | 232 | 0.6% |
| Caribbean | 639 | 1.6% |
| Central America | 2,646 | 6.6% |
| Colombia | 444 | 1.1% |
| Costa Rica | 14 | 0.0% |
| Cuba | 471 | 1.2% |
| Dominican Republic | 5 | 0.0% |
| Eastern Asia | 19 | 0.1% |
| Eastern Europe | 109 | 0.3% |
| El Salvador | 10 | 0.0% |
| England | 10 | 0.0% |
| Europe | 172 | 0.4% |
| Guatemala | 193 | 0.5% |
| Haiti | 102 | 0.3% |
| Honduras | 51 | 0.1% |
| Hungary | 65 | 0.2% |
| Iran | 48 | 0.1% |
| Israel | 7 | 0.0% |
| Italy | 42 | 0.1% |
| Jamaica | 35 | 0.1% |
| Korea | 19 | 0.1% |
| Latin America | 4,158 | 10.4% |
| Mexico | 2,366 | 5.9% |
| Nepal | 31 | 0.1% |
| Nicaragua | 5 | 0.0% |
| Northern Europe | 10 | 0.0% |
| Panama | 7 | 0.0% |
| Peru | 19 | 0.1% |
| Philippines | 151 | 0.4% |
| South Africa | 11 | 0.0% |
| South America | 873 | 2.2% |
| South Central Asia | 113 | 0.3% |
| South Eastern Asia | 184 | 0.5% |
| Southern Europe | 42 | 0.1% |
| Trinidad and Tobago | 7 | 0.0% |
| Ukraine | 20 | 0.1% |
| Venezuela | 324 | 0.8% |
| Vietnam | 33 | 0.1% |
| Western Africa | 16 | 0.0% |
| Western Asia | 23 | 0.1% |
| Western Europe | 11 | 0.0% | View All 49 Rows |
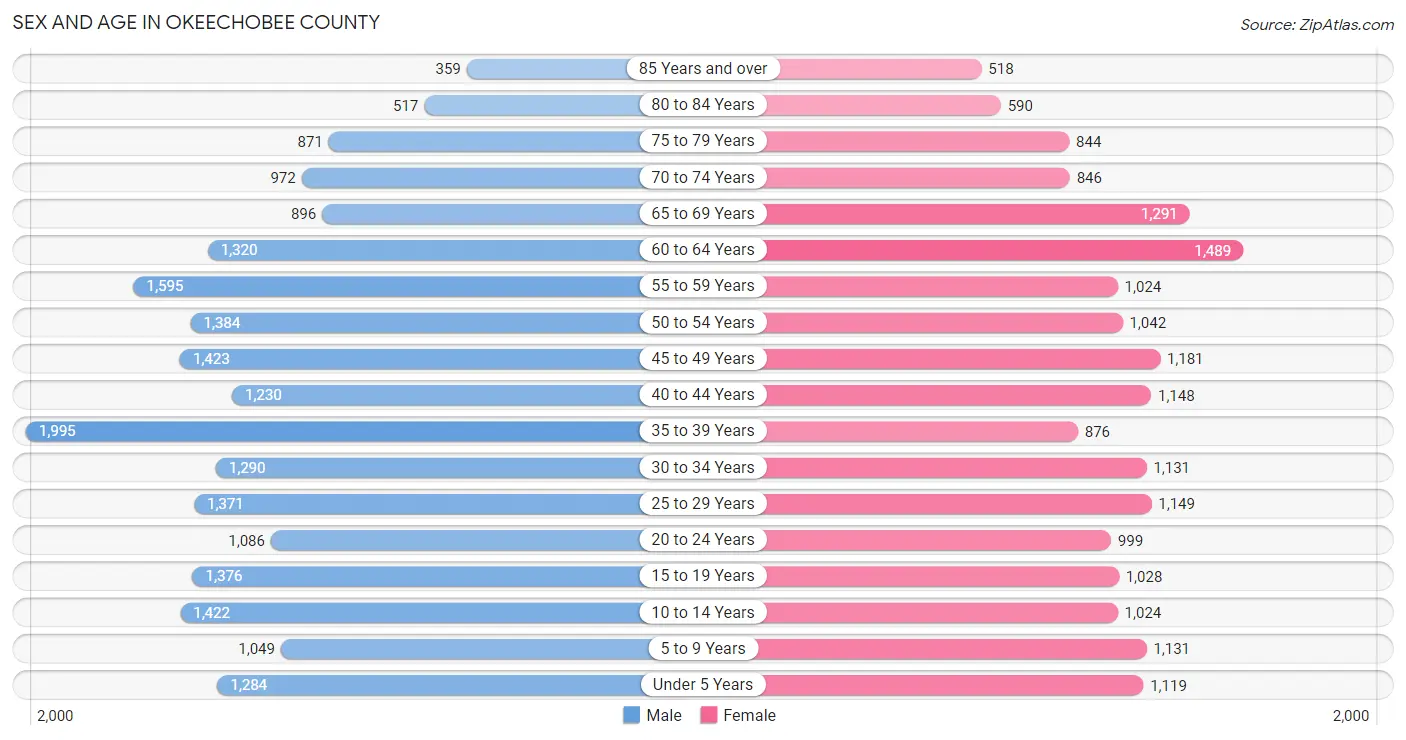
Sex and Age in Okeechobee County
Sex and Age in Okeechobee County
The most populous age groups in Okeechobee County are 35 to 39 Years (1,995 | 9.3%) for men and 60 to 64 Years (1,489 | 8.1%) for women.
| Age Bracket | Male | Female |
| Under 5 Years | 1,284 (6.0%) | 1,119 (6.1%) |
| 5 to 9 Years | 1,049 (4.9%) | 1,131 (6.1%) |
| 10 to 14 Years | 1,422 (6.6%) | 1,024 (5.6%) |
| 15 to 19 Years | 1,376 (6.4%) | 1,028 (5.6%) |
| 20 to 24 Years | 1,086 (5.1%) | 999 (5.4%) |
| 25 to 29 Years | 1,371 (6.4%) | 1,149 (6.2%) |
| 30 to 34 Years | 1,290 (6.0%) | 1,131 (6.1%) |
| 35 to 39 Years | 1,995 (9.3%) | 876 (4.8%) |
| 40 to 44 Years | 1,230 (5.7%) | 1,148 (6.2%) |
| 45 to 49 Years | 1,423 (6.6%) | 1,181 (6.4%) |
| 50 to 54 Years | 1,384 (6.5%) | 1,042 (5.7%) |
| 55 to 59 Years | 1,595 (7.4%) | 1,024 (5.6%) |
| 60 to 64 Years | 1,320 (6.2%) | 1,489 (8.1%) |
| 65 to 69 Years | 896 (4.2%) | 1,291 (7.0%) |
| 70 to 74 Years | 972 (4.5%) | 846 (4.6%) |
| 75 to 79 Years | 871 (4.1%) | 844 (4.6%) |
| 80 to 84 Years | 517 (2.4%) | 590 (3.2%) |
| 85 Years and over | 359 (1.7%) | 518 (2.8%) |
| Total | 21,440 (100.0%) | 18,430 (100.0%) |
Families and Households in Okeechobee County
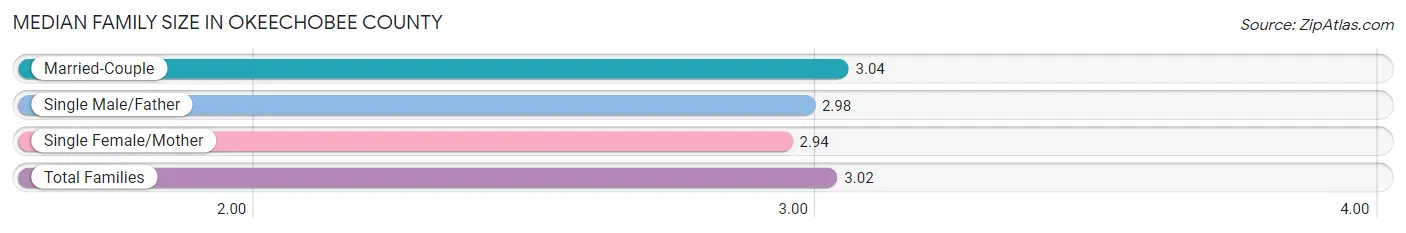
Median Family Size in Okeechobee County
The median family size in Okeechobee County is 3.02 persons per family, with married-couple families (7,059 | 71.3%) accounting for the largest median family size of 3.04 persons per family. On the other hand, single female/mother families (1,816 | 18.3%) represent the smallest median family size with 2.94 persons per family.
| Family Type | # Families | Family Size |
| Married-Couple | 7,059 (71.3%) | 3.04 |
| Single Male/Father | 1,029 (10.4%) | 2.98 |
| Single Female/Mother | 1,816 (18.3%) | 2.94 |
| Total Families | 9,904 (100.0%) | 3.02 |
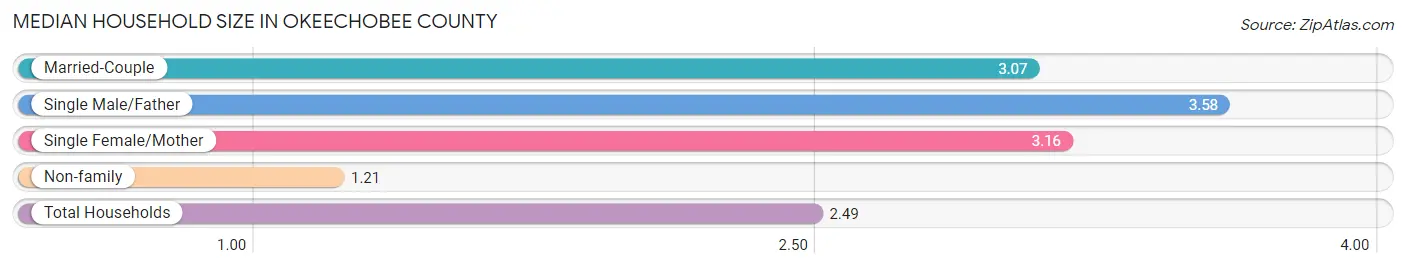
Median Household Size in Okeechobee County
The median household size in Okeechobee County is 2.49 persons per household, with single male/father households (1,029 | 6.9%) accounting for the largest median household size of 3.58 persons per household. non-family households (5,015 | 33.6%) represent the smallest median household size with 1.21 persons per household.
| Household Type | # Households | Household Size |
| Married-Couple | 7,059 (47.3%) | 3.07 |
| Single Male/Father | 1,029 (6.9%) | 3.58 |
| Single Female/Mother | 1,816 (12.2%) | 3.16 |
| Non-family | 5,015 (33.6%) | 1.21 |
| Total Households | 14,919 (100.0%) | 2.49 |
Household Size by Marriage Status in Okeechobee County
Out of a total of 14,919 households in Okeechobee County, 9,904 (66.4%) are family households, while 5,015 (33.6%) are nonfamily households. The most numerous type of family households are 2-person households, comprising 4,758, and the most common type of nonfamily households are 1-person households, comprising 4,157.
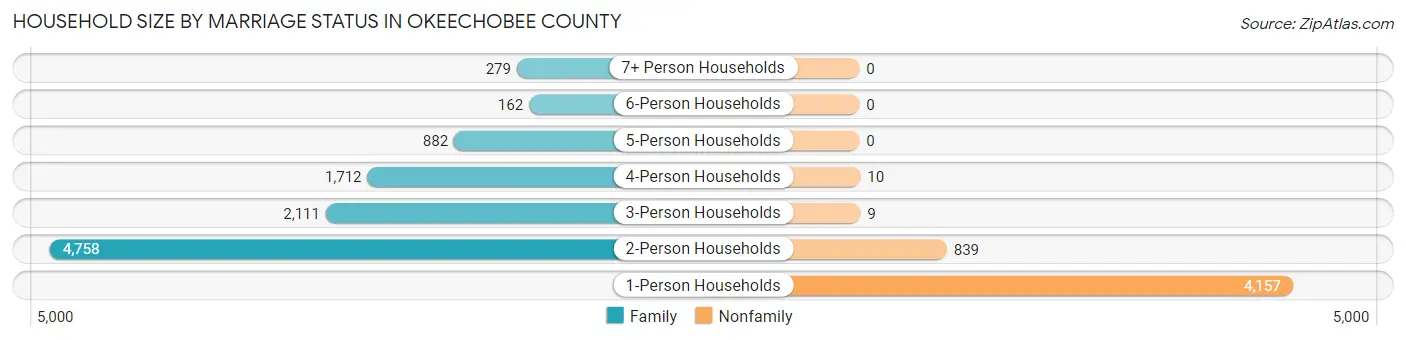
| Household Size | Family Households | Nonfamily Households |
| 1-Person Households | - | 4,157 (27.9%) |
| 2-Person Households | 4,758 (31.9%) | 839 (5.6%) |
| 3-Person Households | 2,111 (14.1%) | 9 (0.1%) |
| 4-Person Households | 1,712 (11.5%) | 10 (0.1%) |
| 5-Person Households | 882 (5.9%) | 0 (0.0%) |
| 6-Person Households | 162 (1.1%) | 0 (0.0%) |
| 7+ Person Households | 279 (1.9%) | 0 (0.0%) |
| Total | 9,904 (66.4%) | 5,015 (33.6%) |
Female Fertility in Okeechobee County
Fertility by Age in Okeechobee County
Average fertility rate in Okeechobee County is 65.0 births per 1,000 women. Women in the age bracket of 20 to 34 years have the highest fertility rate with 126.0 births per 1,000 women. Women in the age bracket of 20 to 34 years acount for 81.9% of all women with births.
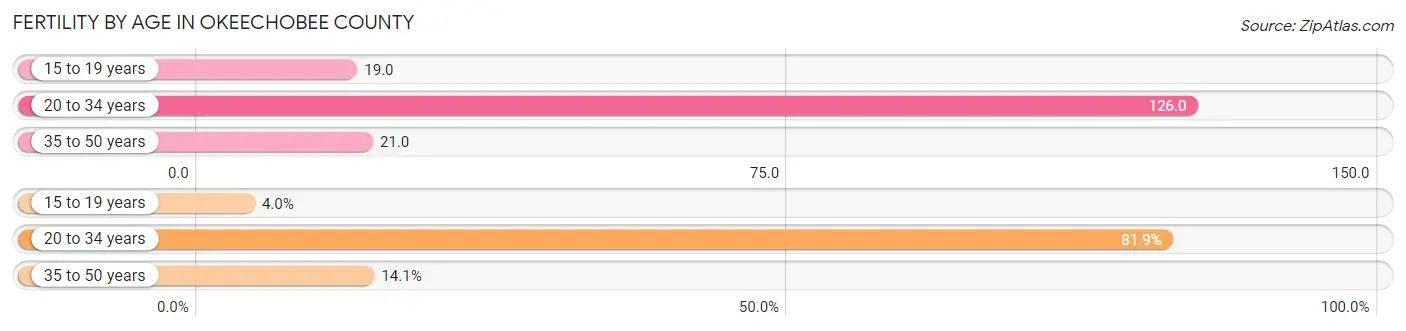
| Age Bracket | Women with Births | Births / 1,000 Women |
| 15 to 19 years | 20 (4.0%) | 19.0 |
| 20 to 34 years | 412 (81.9%) | 126.0 |
| 35 to 50 years | 71 (14.1%) | 21.0 |
| Total | 503 (100.0%) | 65.0 |
Fertility by Age by Marriage Status in Okeechobee County
61.0% of women with births (503) in Okeechobee County are married. The highest percentage of unmarried women with births falls into 15 to 19 years age bracket with 100.0% of them unmarried at the time of birth, while the lowest percentage of unmarried women with births belong to 35 to 50 years age bracket with 0.0% of them unmarried.
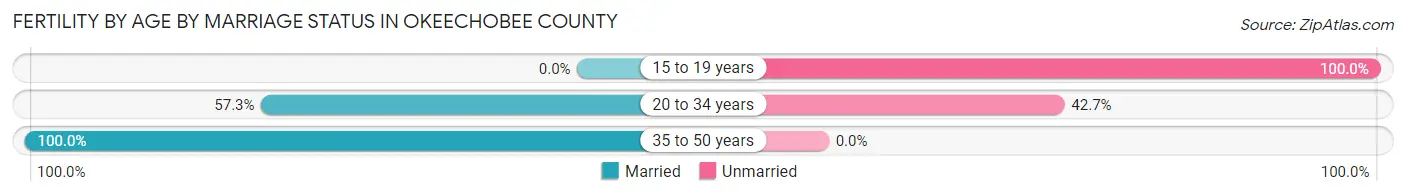
| Age Bracket | Married | Unmarried |
| 15 to 19 years | 0 (0.0%) | 20 (100.0%) |
| 20 to 34 years | 236 (57.3%) | 176 (42.7%) |
| 35 to 50 years | 71 (100.0%) | 0 (0.0%) |
| Total | 307 (61.0%) | 196 (39.0%) |
Fertility by Education in Okeechobee County
Average fertility rate in Okeechobee County is 65.0 births per 1,000 women. Women with the education attainment of bachelor's degree have the highest fertility rate of 97.0 births per 1,000 women, while women with the education attainment of graduate degree have the lowest fertility at 29.0 births per 1,000 women. Women with the education attainment of high school diploma represent 35.6% of all women with births.
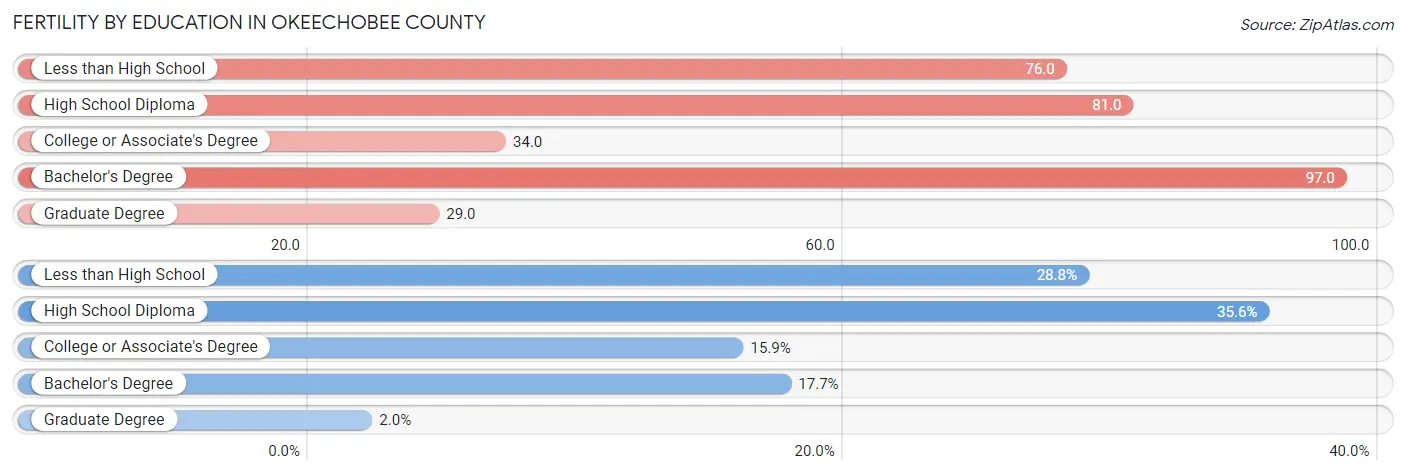
| Educational Attainment | Women with Births | Births / 1,000 Women |
| Less than High School | 145 (28.8%) | 76.0 |
| High School Diploma | 179 (35.6%) | 81.0 |
| College or Associate's Degree | 80 (15.9%) | 34.0 |
| Bachelor's Degree | 89 (17.7%) | 97.0 |
| Graduate Degree | 10 (2.0%) | 29.0 |
| Total | 503 (100.0%) | 65.0 |
Fertility by Education by Marriage Status in Okeechobee County
39.0% of women with births in Okeechobee County are unmarried. Women with the educational attainment of bachelor's degree are most likely to be married with 100.0% of them married at childbirth, while women with the educational attainment of high school diploma are least likely to be married with 91.1% of them unmarried at childbirth.
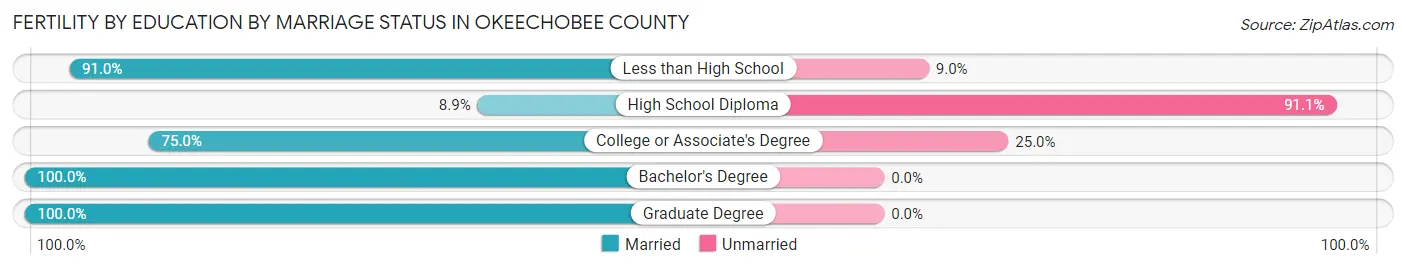
| Educational Attainment | Married | Unmarried |
| Less than High School | 132 (91.0%) | 13 (9.0%) |
| High School Diploma | 16 (8.9%) | 163 (91.1%) |
| College or Associate's Degree | 60 (75.0%) | 20 (25.0%) |
| Bachelor's Degree | 89 (100.0%) | 0 (0.0%) |
| Graduate Degree | 10 (100.0%) | 0 (0.0%) |
| Total | 307 (61.0%) | 196 (39.0%) |
Employment Characteristics in Okeechobee County
Employment by Class of Employer in Okeechobee County
Among the 15,091 employed individuals in Okeechobee County, private company employees (8,742 | 57.9%), local government employees (2,026 | 13.4%), and self-employed (incorporated) (1,274 | 8.4%) make up the most common classes of employment.
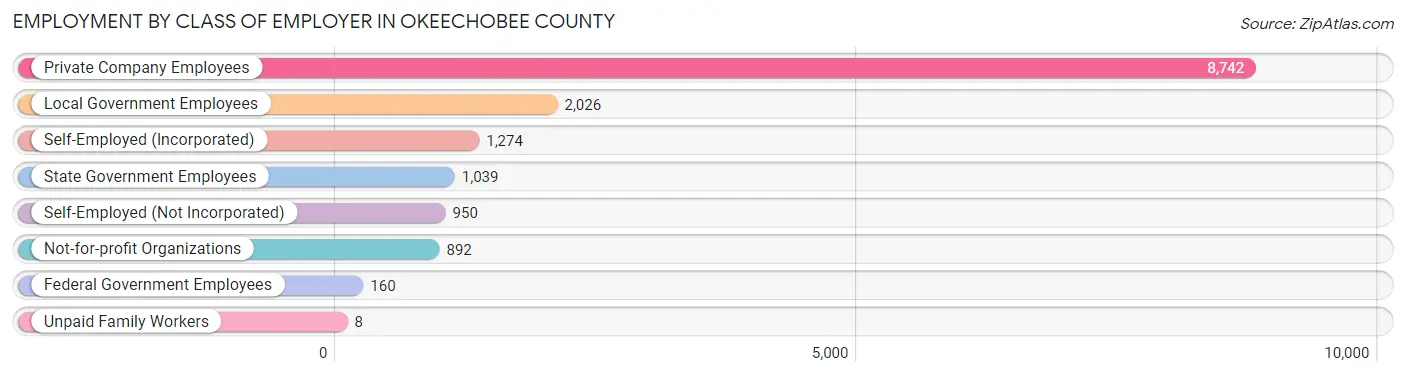
| Employer Class | # Employees | % Employees |
| Private Company Employees | 8,742 | 57.9% |
| Self-Employed (Incorporated) | 1,274 | 8.4% |
| Self-Employed (Not Incorporated) | 950 | 6.3% |
| Not-for-profit Organizations | 892 | 5.9% |
| Local Government Employees | 2,026 | 13.4% |
| State Government Employees | 1,039 | 6.9% |
| Federal Government Employees | 160 | 1.1% |
| Unpaid Family Workers | 8 | 0.1% |
| Total | 15,091 | 100.0% |
Employment Status by Age in Okeechobee County
According to the labor force statistics for Okeechobee County, out of the total population over 16 years of age (32,474), 50.4% or 16,367 individuals are in the labor force, with 6.1% or 998 of them unemployed. The age group with the highest labor force participation rate is 20 to 24 years, with 77.0% or 1,605 individuals in the labor force. Within the labor force, the 16 to 19 years age range has the highest percentage of unemployed individuals, with 34.6% or 238 of them being unemployed.
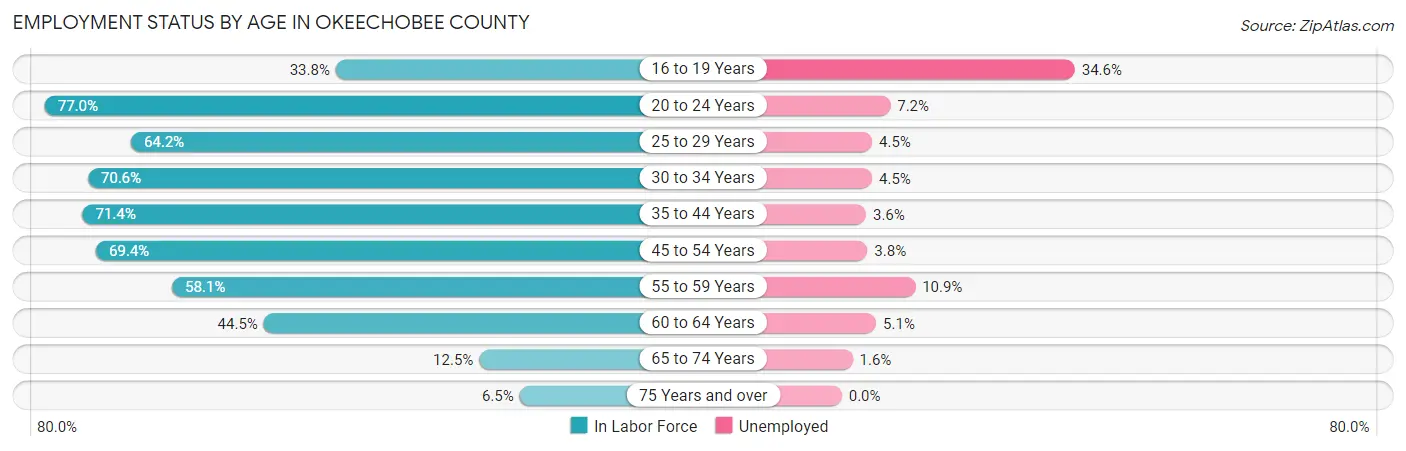
| Age Bracket | In Labor Force | Unemployed |
| 16 to 19 Years | 689 (33.8%) | 238 (34.6%) |
| 20 to 24 Years | 1,605 (77.0%) | 116 (7.2%) |
| 25 to 29 Years | 1,618 (64.2%) | 73 (4.5%) |
| 30 to 34 Years | 1,709 (70.6%) | 77 (4.5%) |
| 35 to 44 Years | 3,748 (71.4%) | 135 (3.6%) |
| 45 to 54 Years | 3,491 (69.4%) | 133 (3.8%) |
| 55 to 59 Years | 1,522 (58.1%) | 166 (10.9%) |
| 60 to 64 Years | 1,250 (44.5%) | 64 (5.1%) |
| 65 to 74 Years | 501 (12.5%) | 8 (1.6%) |
| 75 Years and over | 240 (6.5%) | 0 (0.0%) |
| Total | 16,367 (50.4%) | 998 (6.1%) |
Employment Status by Educational Attainment in Okeechobee County
According to labor force statistics for Okeechobee County, 64.6% of individuals (13,339) out of the total population between 25 and 64 years of age (20,648) are in the labor force, with 4.8% or 640 of them being unemployed. The group with the highest labor force participation rate are those with the educational attainment of bachelor's degree or higher, with 81.3% or 3,019 individuals in the labor force. Within the labor force, individuals with less than high school education have the highest percentage of unemployment, with 10.7% or 220 of them being unemployed.
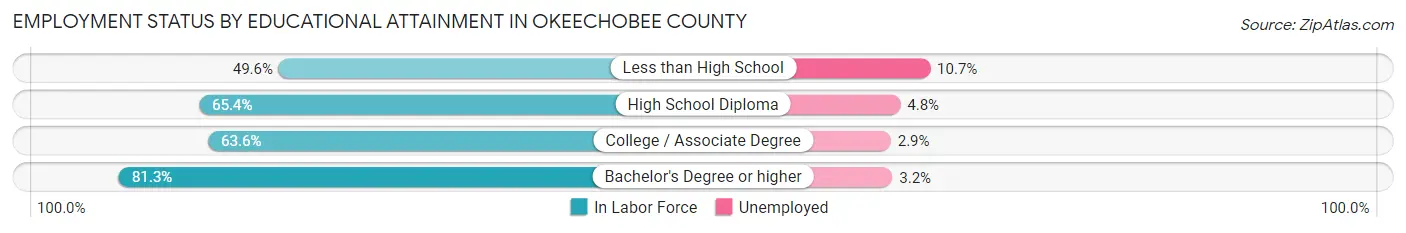
| Educational Attainment | In Labor Force | Unemployed |
| Less than High School | 2,060 (49.6%) | 444 (10.7%) |
| High School Diploma | 4,637 (65.4%) | 340 (4.8%) |
| College / Associate Degree | 3,619 (63.6%) | 165 (2.9%) |
| Bachelor's Degree or higher | 3,019 (81.3%) | 119 (3.2%) |
| Total | 13,339 (64.6%) | 991 (4.8%) |
Employment Occupations by Sex in Okeechobee County
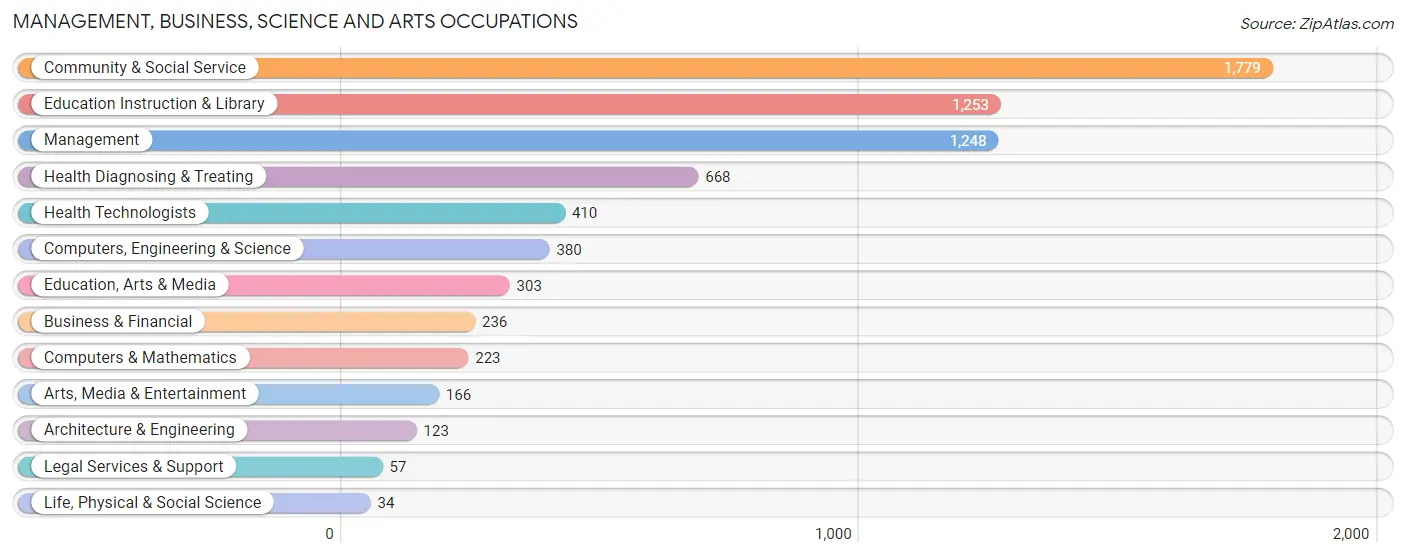
Management, Business, Science and Arts Occupations
The most common Management, Business, Science and Arts occupations in Okeechobee County are Community & Social Service (1,779 | 11.6%), Education Instruction & Library (1,253 | 8.2%), Management (1,248 | 8.1%), Health Diagnosing & Treating (668 | 4.3%), and Health Technologists (410 | 2.7%).
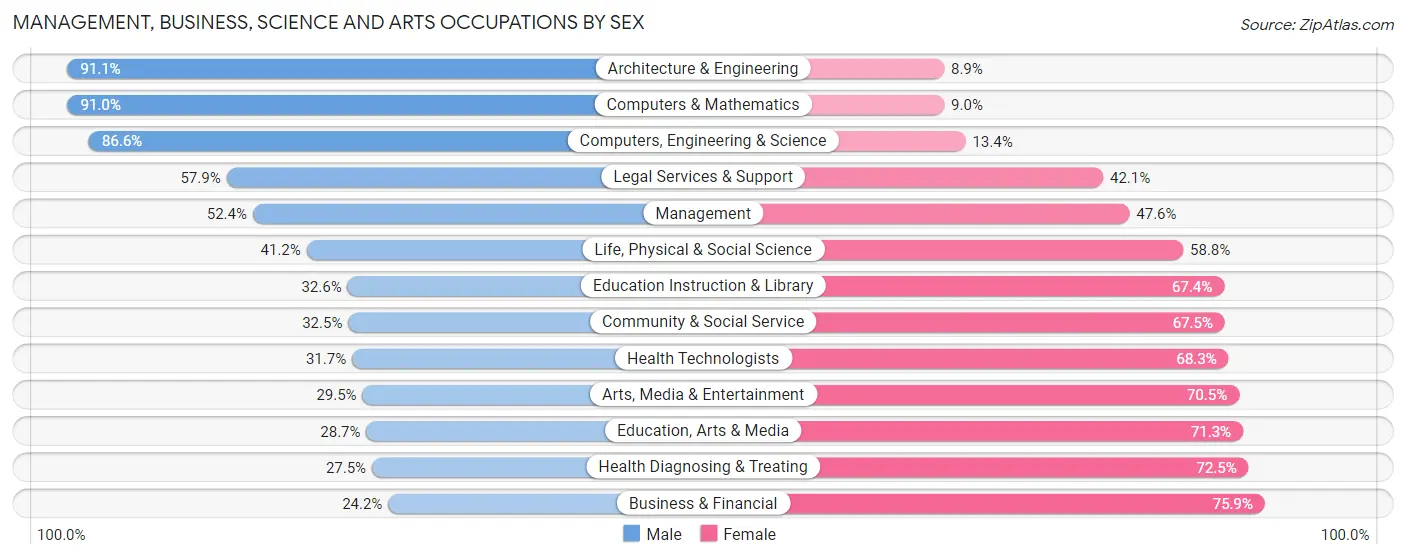
Management, Business, Science and Arts Occupations by Sex
Within the Management, Business, Science and Arts occupations in Okeechobee County, the most male-oriented occupations are Architecture & Engineering (91.1%), Computers & Mathematics (91.0%), and Computers, Engineering & Science (86.6%), while the most female-oriented occupations are Business & Financial (75.8%), Health Diagnosing & Treating (72.5%), and Education, Arts & Media (71.3%).
| Occupation | Male | Female |
| Management | 654 (52.4%) | 594 (47.6%) |
| Business & Financial | 57 (24.1%) | 179 (75.8%) |
| Computers, Engineering & Science | 329 (86.6%) | 51 (13.4%) |
| Computers & Mathematics | 203 (91.0%) | 20 (9.0%) |
| Architecture & Engineering | 112 (91.1%) | 11 (8.9%) |
| Life, Physical & Social Science | 14 (41.2%) | 20 (58.8%) |
| Community & Social Service | 578 (32.5%) | 1,201 (67.5%) |
| Education, Arts & Media | 87 (28.7%) | 216 (71.3%) |
| Legal Services & Support | 33 (57.9%) | 24 (42.1%) |
| Education Instruction & Library | 409 (32.6%) | 844 (67.4%) |
| Arts, Media & Entertainment | 49 (29.5%) | 117 (70.5%) |
| Health Diagnosing & Treating | 184 (27.5%) | 484 (72.5%) |
| Health Technologists | 130 (31.7%) | 280 (68.3%) |
| Total (Category) | 1,802 (41.8%) | 2,509 (58.2%) |
| Total (Overall) | 8,689 (56.5%) | 6,682 (43.5%) |
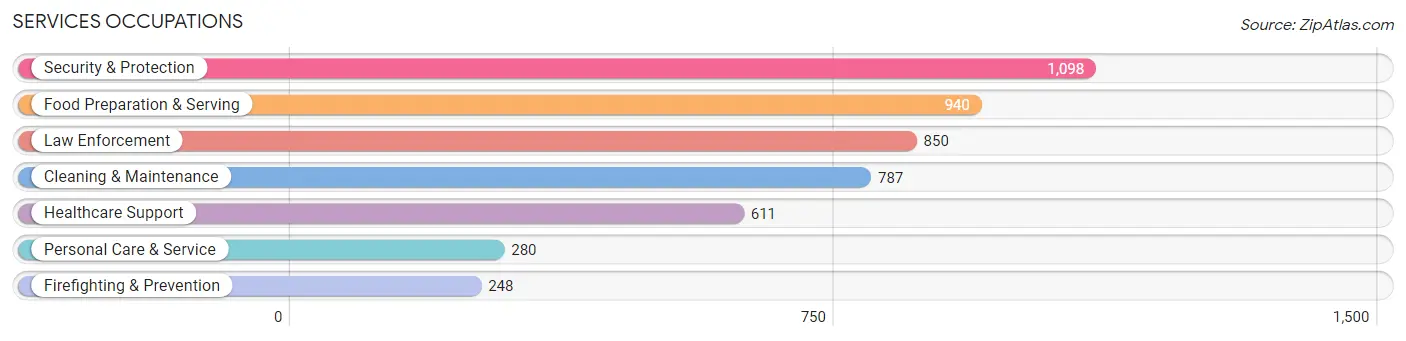
Services Occupations
The most common Services occupations in Okeechobee County are Security & Protection (1,098 | 7.1%), Food Preparation & Serving (940 | 6.1%), Law Enforcement (850 | 5.5%), Cleaning & Maintenance (787 | 5.1%), and Healthcare Support (611 | 4.0%).
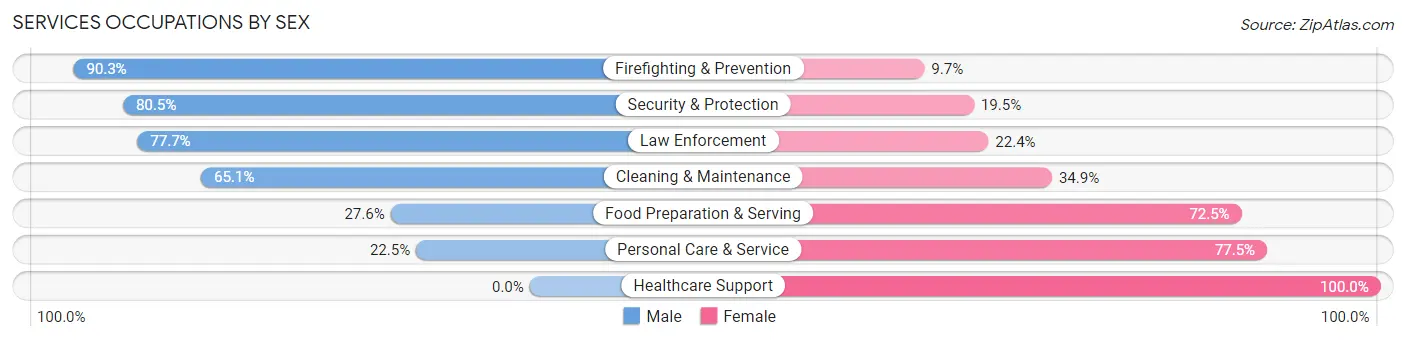
Services Occupations by Sex
Within the Services occupations in Okeechobee County, the most male-oriented occupations are Firefighting & Prevention (90.3%), Security & Protection (80.5%), and Law Enforcement (77.6%), while the most female-oriented occupations are Healthcare Support (100.0%), Personal Care & Service (77.5%), and Food Preparation & Serving (72.5%).
| Occupation | Male | Female |
| Healthcare Support | 0 (0.0%) | 611 (100.0%) |
| Security & Protection | 884 (80.5%) | 214 (19.5%) |
| Firefighting & Prevention | 224 (90.3%) | 24 (9.7%) |
| Law Enforcement | 660 (77.6%) | 190 (22.4%) |
| Food Preparation & Serving | 259 (27.6%) | 681 (72.5%) |
| Cleaning & Maintenance | 512 (65.1%) | 275 (34.9%) |
| Personal Care & Service | 63 (22.5%) | 217 (77.5%) |
| Total (Category) | 1,718 (46.2%) | 1,998 (53.8%) |
| Total (Overall) | 8,689 (56.5%) | 6,682 (43.5%) |
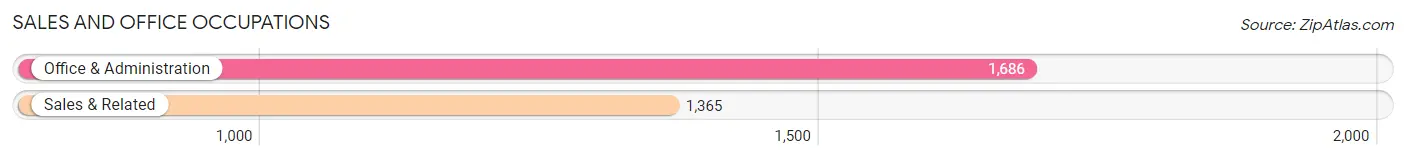
Sales and Office Occupations
The most common Sales and Office occupations in Okeechobee County are Office & Administration (1,686 | 11.0%), and Sales & Related (1,365 | 8.9%).
Sales and Office Occupations by Sex
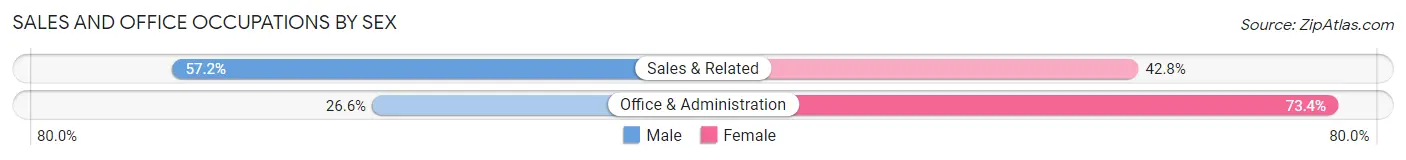
| Occupation | Male | Female |
| Sales & Related | 781 (57.2%) | 584 (42.8%) |
| Office & Administration | 448 (26.6%) | 1,238 (73.4%) |
| Total (Category) | 1,229 (40.3%) | 1,822 (59.7%) |
| Total (Overall) | 8,689 (56.5%) | 6,682 (43.5%) |
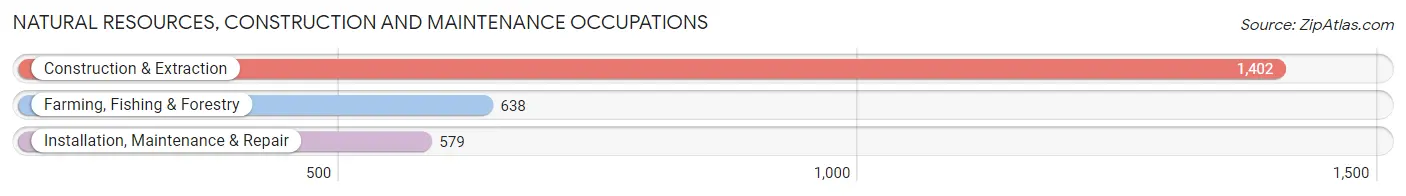
Natural Resources, Construction and Maintenance Occupations
The most common Natural Resources, Construction and Maintenance occupations in Okeechobee County are Construction & Extraction (1,402 | 9.1%), Farming, Fishing & Forestry (638 | 4.2%), and Installation, Maintenance & Repair (579 | 3.8%).
Natural Resources, Construction and Maintenance Occupations by Sex
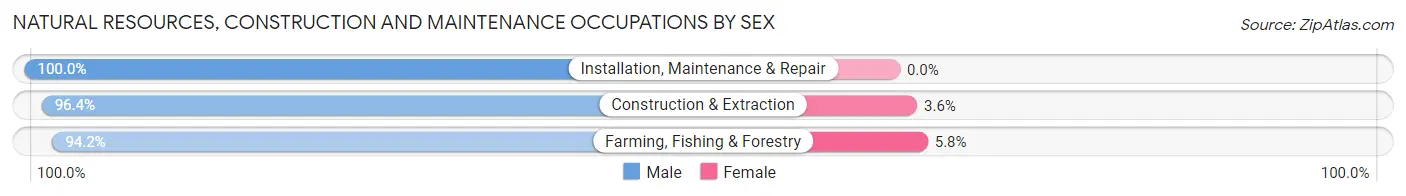
| Occupation | Male | Female |
| Farming, Fishing & Forestry | 601 (94.2%) | 37 (5.8%) |
| Construction & Extraction | 1,352 (96.4%) | 50 (3.6%) |
| Installation, Maintenance & Repair | 579 (100.0%) | 0 (0.0%) |
| Total (Category) | 2,532 (96.7%) | 87 (3.3%) |
| Total (Overall) | 8,689 (56.5%) | 6,682 (43.5%) |
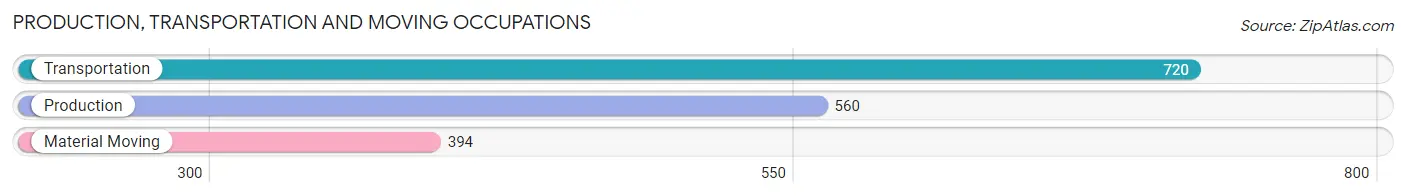
Production, Transportation and Moving Occupations
The most common Production, Transportation and Moving occupations in Okeechobee County are Transportation (720 | 4.7%), Production (560 | 3.6%), and Material Moving (394 | 2.6%).
Production, Transportation and Moving Occupations by Sex
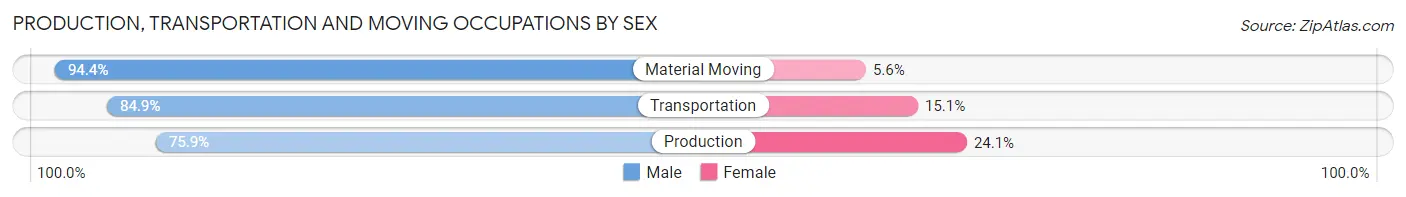
| Occupation | Male | Female |
| Production | 425 (75.9%) | 135 (24.1%) |
| Transportation | 611 (84.9%) | 109 (15.1%) |
| Material Moving | 372 (94.4%) | 22 (5.6%) |
| Total (Category) | 1,408 (84.1%) | 266 (15.9%) |
| Total (Overall) | 8,689 (56.5%) | 6,682 (43.5%) |
Employment Industries by Sex in Okeechobee County
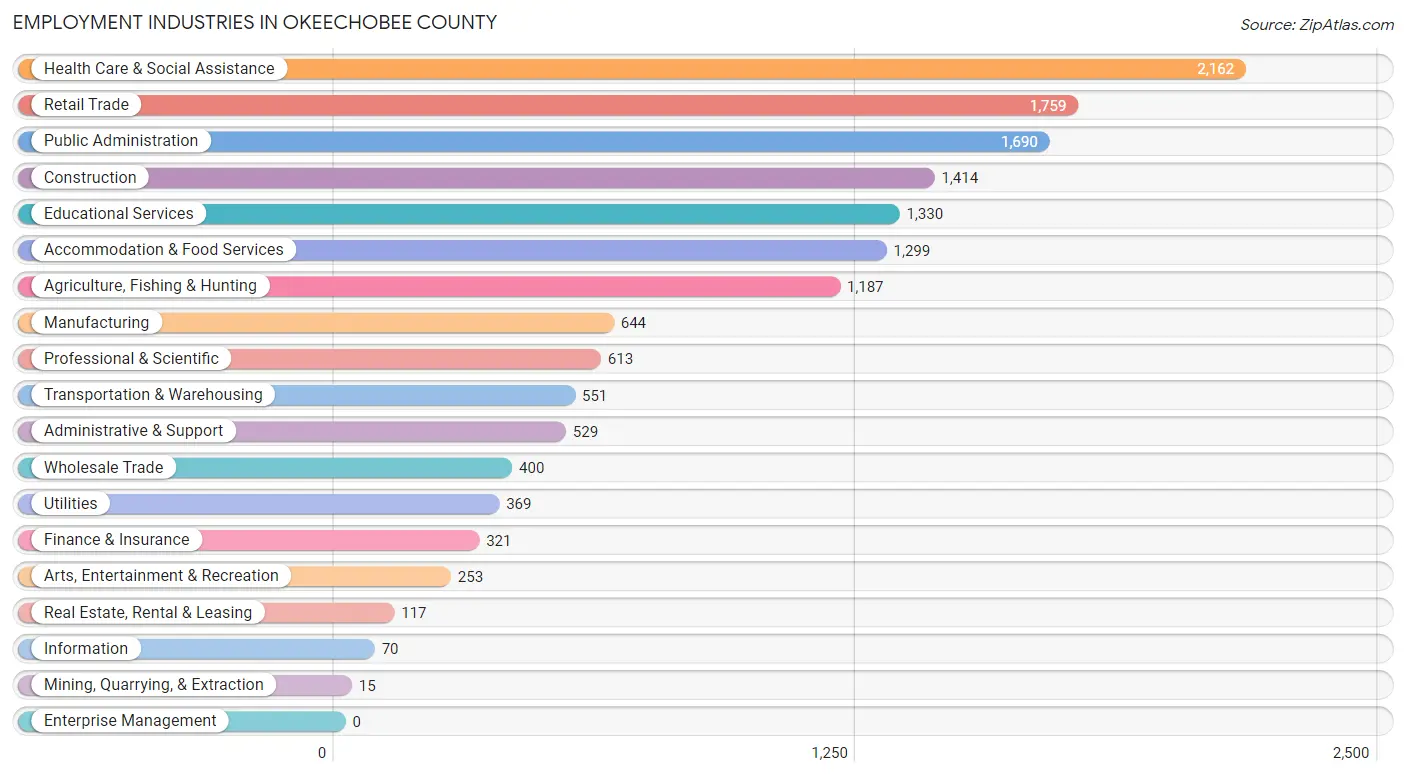
Employment Industries in Okeechobee County
The major employment industries in Okeechobee County include Health Care & Social Assistance (2,162 | 14.1%), Retail Trade (1,759 | 11.4%), Public Administration (1,690 | 11.0%), Construction (1,414 | 9.2%), and Educational Services (1,330 | 8.6%).
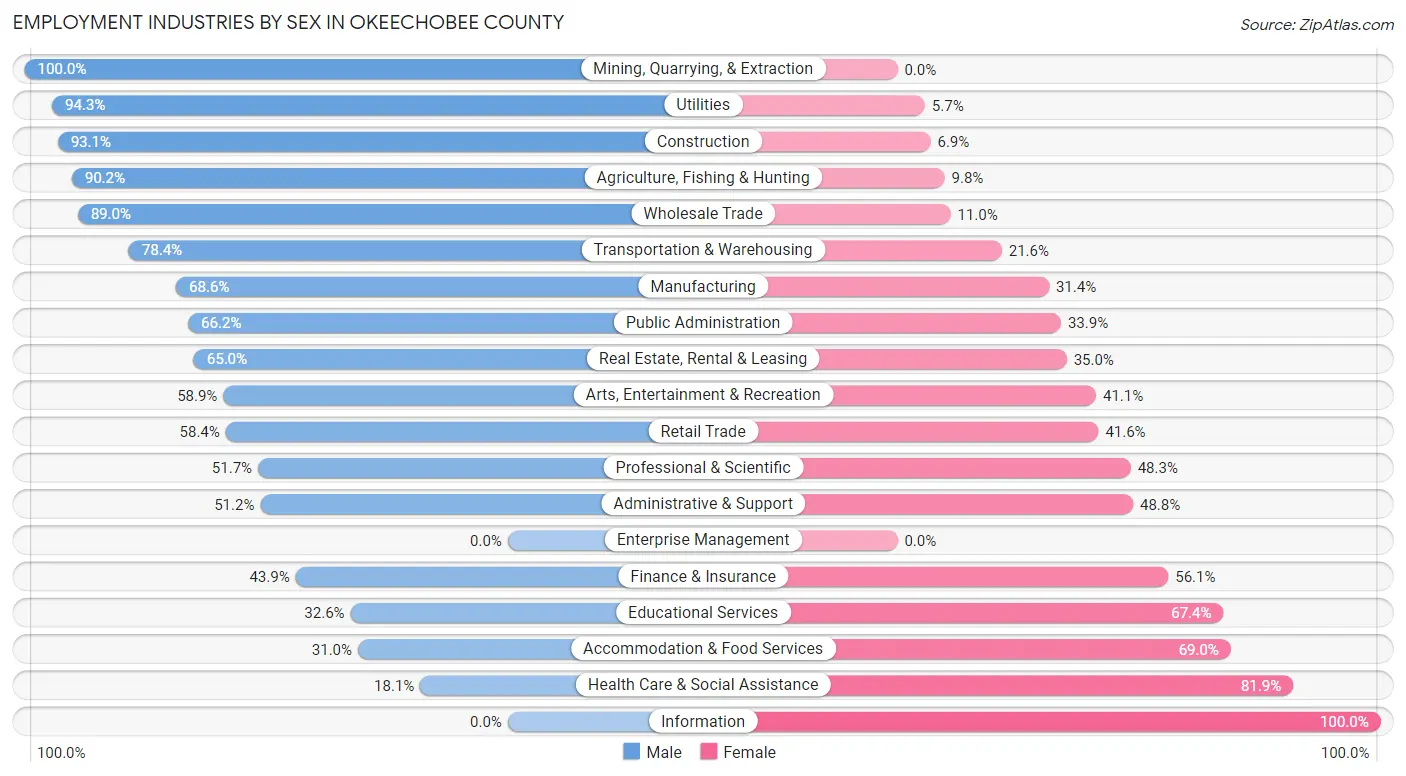
Employment Industries by Sex in Okeechobee County
The Okeechobee County industries that see more men than women are Mining, Quarrying, & Extraction (100.0%), Utilities (94.3%), and Construction (93.1%), whereas the industries that tend to have a higher number of women are Information (100.0%), Health Care & Social Assistance (81.9%), and Accommodation & Food Services (69.0%).
| Industry | Male | Female |
| Agriculture, Fishing & Hunting | 1,071 (90.2%) | 116 (9.8%) |
| Mining, Quarrying, & Extraction | 15 (100.0%) | 0 (0.0%) |
| Construction | 1,317 (93.1%) | 97 (6.9%) |
| Manufacturing | 442 (68.6%) | 202 (31.4%) |
| Wholesale Trade | 356 (89.0%) | 44 (11.0%) |
| Retail Trade | 1,027 (58.4%) | 732 (41.6%) |
| Transportation & Warehousing | 432 (78.4%) | 119 (21.6%) |
| Utilities | 348 (94.3%) | 21 (5.7%) |
| Information | 0 (0.0%) | 70 (100.0%) |
| Finance & Insurance | 141 (43.9%) | 180 (56.1%) |
| Real Estate, Rental & Leasing | 76 (65.0%) | 41 (35.0%) |
| Professional & Scientific | 317 (51.7%) | 296 (48.3%) |
| Enterprise Management | 0 (0.0%) | 0 (0.0%) |
| Administrative & Support | 271 (51.2%) | 258 (48.8%) |
| Educational Services | 433 (32.6%) | 897 (67.4%) |
| Health Care & Social Assistance | 392 (18.1%) | 1,770 (81.9%) |
| Arts, Entertainment & Recreation | 149 (58.9%) | 104 (41.1%) |
| Accommodation & Food Services | 403 (31.0%) | 896 (69.0%) |
| Public Administration | 1,118 (66.1%) | 572 (33.9%) |
| Total | 8,689 (56.5%) | 6,682 (43.5%) |
Education in Okeechobee County
School Enrollment in Okeechobee County
The most common levels of schooling among the 7,846 students in Okeechobee County are middle school (2,156 | 27.5%), high school (1,705 | 21.7%), and elementary school (1,693 | 21.6%).
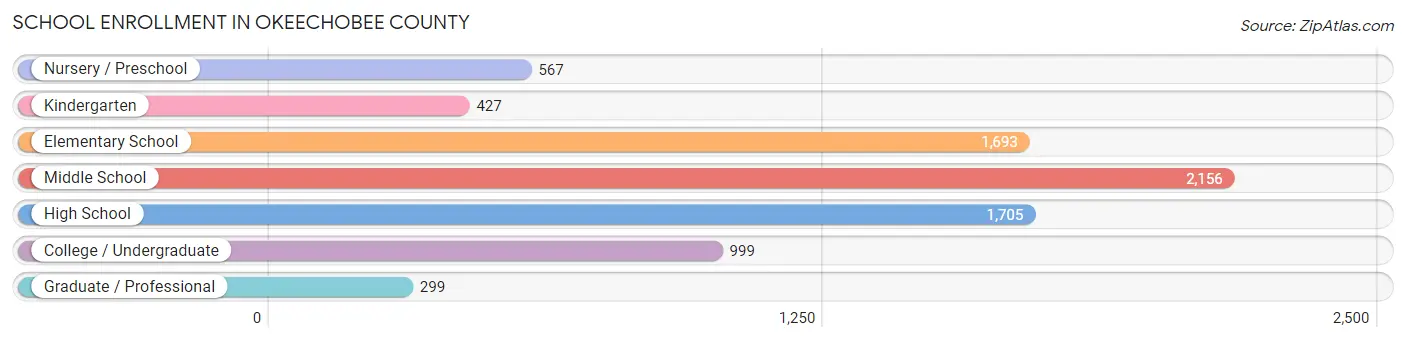
| School Level | # Students | % Students |
| Nursery / Preschool | 567 | 7.2% |
| Kindergarten | 427 | 5.4% |
| Elementary School | 1,693 | 21.6% |
| Middle School | 2,156 | 27.5% |
| High School | 1,705 | 21.7% |
| College / Undergraduate | 999 | 12.7% |
| Graduate / Professional | 299 | 3.8% |
| Total | 7,846 | 100.0% |
School Enrollment by Age by Funding Source in Okeechobee County
Out of a total of 7,846 students who are enrolled in schools in Okeechobee County, 1,381 (17.6%) attend a private institution, while the remaining 6,465 (82.4%) are enrolled in public schools. The age group of 35 years and over has the highest likelihood of being enrolled in private schools, with 165 (54.3% in the age bracket) enrolled. Conversely, the age group of 15 to 17 year olds has the lowest likelihood of being enrolled in a private school, with 1,149 (91.4% in the age bracket) attending a public institution.
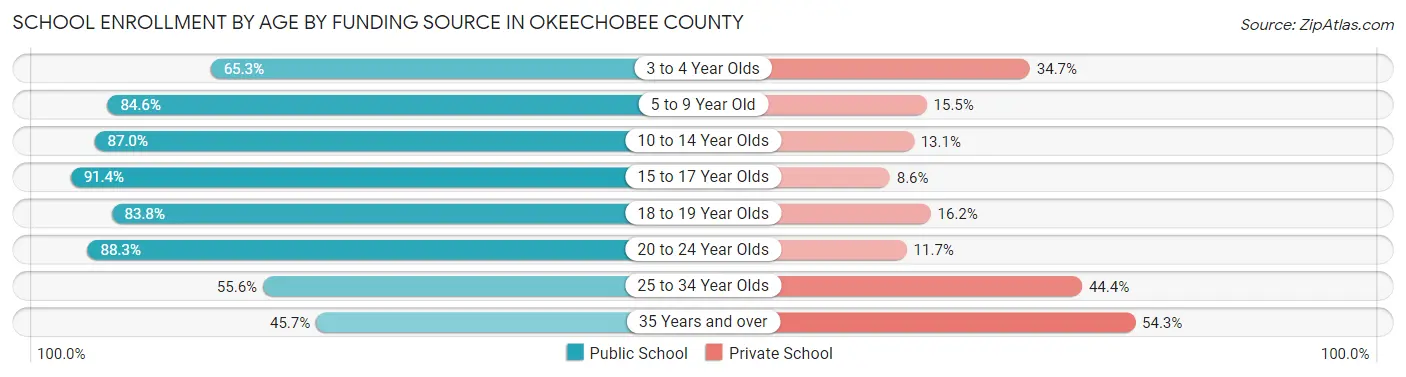
| Age Bracket | Public School | Private School |
| 3 to 4 Year Olds | 275 (65.3%) | 146 (34.7%) |
| 5 to 9 Year Old | 1,735 (84.6%) | 317 (15.4%) |
| 10 to 14 Year Olds | 2,092 (87.0%) | 314 (13.1%) |
| 15 to 17 Year Olds | 1,149 (91.4%) | 108 (8.6%) |
| 18 to 19 Year Olds | 383 (83.8%) | 74 (16.2%) |
| 20 to 24 Year Olds | 444 (88.3%) | 59 (11.7%) |
| 25 to 34 Year Olds | 248 (55.6%) | 198 (44.4%) |
| 35 Years and over | 139 (45.7%) | 165 (54.3%) |
| Total | 6,465 (82.4%) | 1,381 (17.6%) |
Educational Attainment by Field of Study in Okeechobee County
Education (1,042 | 20.7%), business (1,028 | 20.4%), science & technology (579 | 11.5%), bio, nature & agricultural (511 | 10.2%), and arts & humanities (393 | 7.8%) are the most common fields of study among 5,026 individuals in Okeechobee County who have obtained a bachelor's degree or higher.
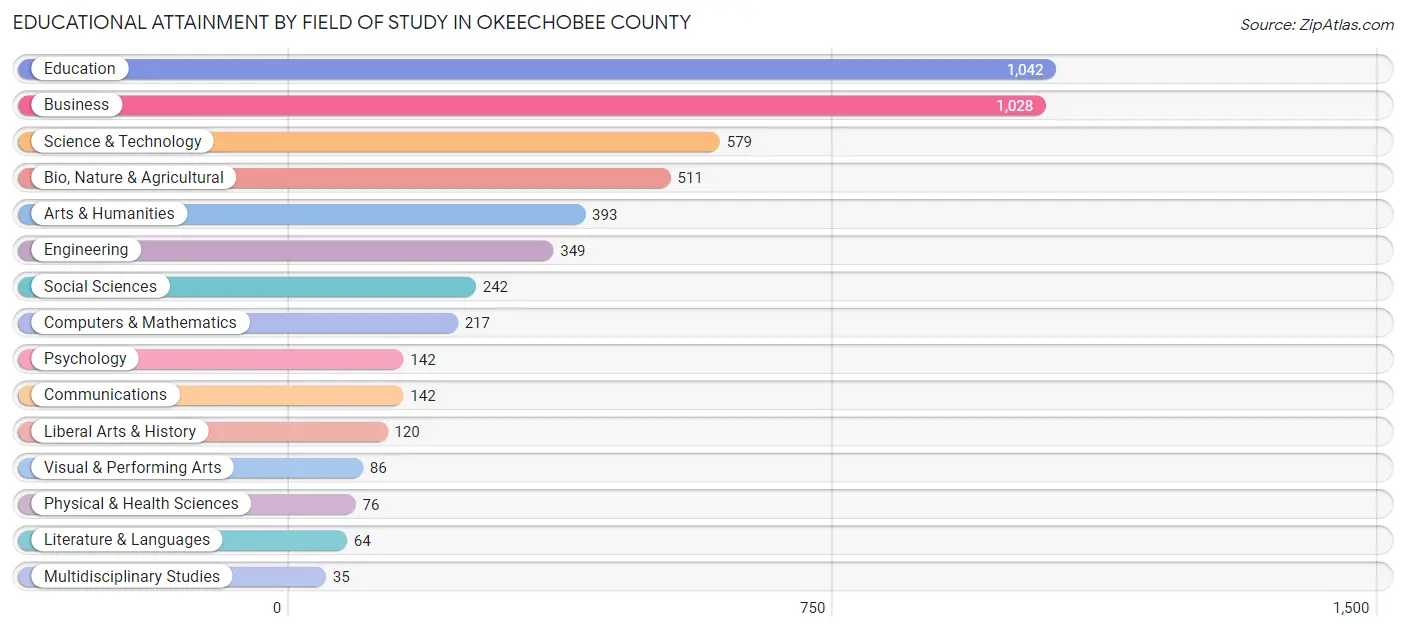
| Field of Study | # Graduates | % Graduates |
| Computers & Mathematics | 217 | 4.3% |
| Bio, Nature & Agricultural | 511 | 10.2% |
| Physical & Health Sciences | 76 | 1.5% |
| Psychology | 142 | 2.8% |
| Social Sciences | 242 | 4.8% |
| Engineering | 349 | 6.9% |
| Multidisciplinary Studies | 35 | 0.7% |
| Science & Technology | 579 | 11.5% |
| Business | 1,028 | 20.4% |
| Education | 1,042 | 20.7% |
| Literature & Languages | 64 | 1.3% |
| Liberal Arts & History | 120 | 2.4% |
| Visual & Performing Arts | 86 | 1.7% |
| Communications | 142 | 2.8% |
| Arts & Humanities | 393 | 7.8% |
| Total | 5,026 | 100.0% |
Transportation & Commute in Okeechobee County
Vehicle Availability by Sex in Okeechobee County
The most prevalent vehicle ownership categories in Okeechobee County are males with 2 vehicles (3,781, accounting for 44.2%) and females with 2 vehicles (2,866, making up 57.9%).
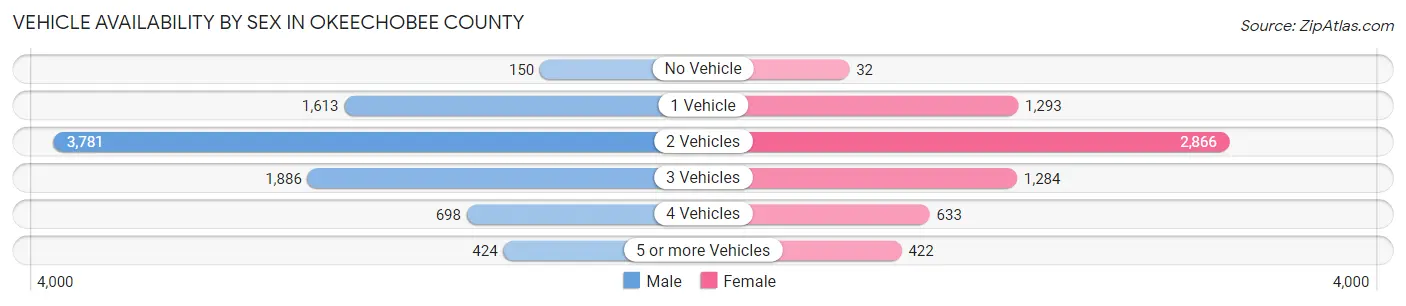
| Vehicles Available | Male | Female |
| No Vehicle | 150 (1.8%) | 32 (0.5%) |
| 1 Vehicle | 1,613 (18.9%) | 1,293 (19.8%) |
| 2 Vehicles | 3,781 (44.2%) | 2,866 (43.9%) |
| 3 Vehicles | 1,886 (22.1%) | 1,284 (19.7%) |
| 4 Vehicles | 698 (8.2%) | 633 (9.7%) |
| 5 or more Vehicles | 424 (5.0%) | 422 (6.5%) |
| Total | 8,552 (100.0%) | 6,530 (100.0%) |
Commute Time in Okeechobee County
The most frequently occuring commute durations in Okeechobee County are 10 to 14 minutes (2,346 commuters, 16.6%), 5 to 9 minutes (2,157 commuters, 15.3%), and 15 to 19 minutes (1,866 commuters, 13.2%).
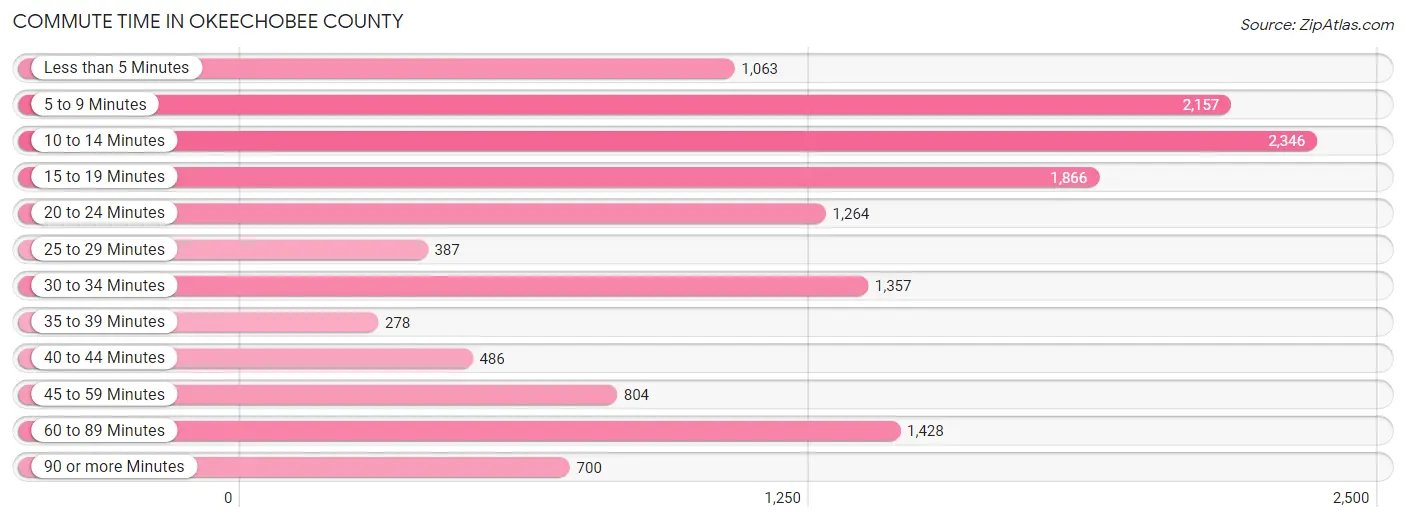
| Commute Time | # Commuters | % Commuters |
| Less than 5 Minutes | 1,063 | 7.5% |
| 5 to 9 Minutes | 2,157 | 15.3% |
| 10 to 14 Minutes | 2,346 | 16.6% |
| 15 to 19 Minutes | 1,866 | 13.2% |
| 20 to 24 Minutes | 1,264 | 8.9% |
| 25 to 29 Minutes | 387 | 2.7% |
| 30 to 34 Minutes | 1,357 | 9.6% |
| 35 to 39 Minutes | 278 | 2.0% |
| 40 to 44 Minutes | 486 | 3.4% |
| 45 to 59 Minutes | 804 | 5.7% |
| 60 to 89 Minutes | 1,428 | 10.1% |
| 90 or more Minutes | 700 | 5.0% |
Commute Time by Sex in Okeechobee County
The most common commute times in Okeechobee County are 60 to 89 minutes (1,106 commuters, 13.5%) for males and 10 to 14 minutes (1,368 commuters, 22.9%) for females.
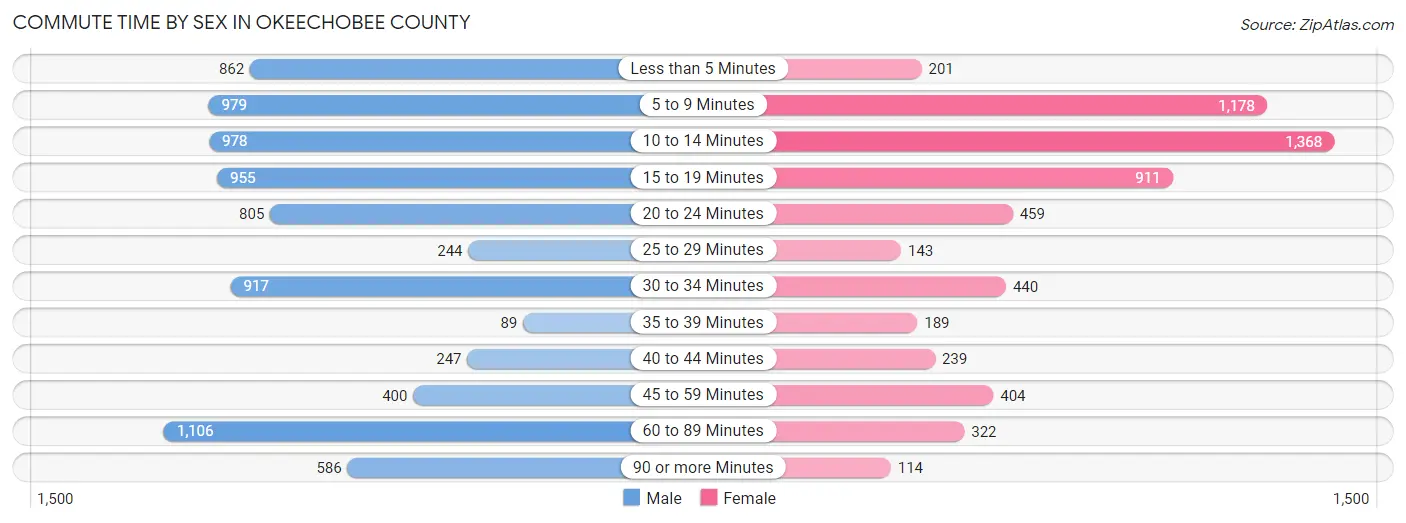
| Commute Time | Male | Female |
| Less than 5 Minutes | 862 (10.5%) | 201 (3.4%) |
| 5 to 9 Minutes | 979 (12.0%) | 1,178 (19.7%) |
| 10 to 14 Minutes | 978 (12.0%) | 1,368 (22.9%) |
| 15 to 19 Minutes | 955 (11.7%) | 911 (15.3%) |
| 20 to 24 Minutes | 805 (9.9%) | 459 (7.7%) |
| 25 to 29 Minutes | 244 (3.0%) | 143 (2.4%) |
| 30 to 34 Minutes | 917 (11.2%) | 440 (7.4%) |
| 35 to 39 Minutes | 89 (1.1%) | 189 (3.2%) |
| 40 to 44 Minutes | 247 (3.0%) | 239 (4.0%) |
| 45 to 59 Minutes | 400 (4.9%) | 404 (6.8%) |
| 60 to 89 Minutes | 1,106 (13.5%) | 322 (5.4%) |
| 90 or more Minutes | 586 (7.2%) | 114 (1.9%) |
Time of Departure to Work by Sex in Okeechobee County
The most frequent times of departure to work in Okeechobee County are 7:00 AM to 7:29 AM (1,691, 20.7%) for males and 7:00 AM to 7:29 AM (1,197, 20.1%) for females.
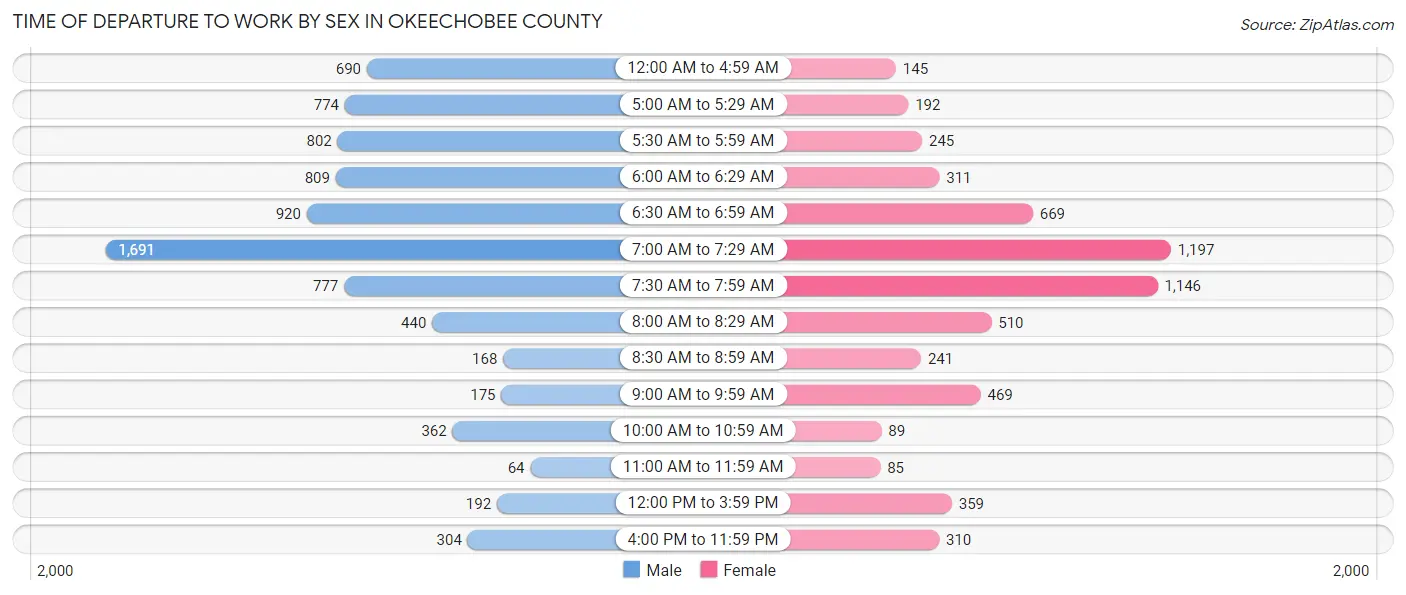
| Time of Departure | Male | Female |
| 12:00 AM to 4:59 AM | 690 (8.5%) | 145 (2.4%) |
| 5:00 AM to 5:29 AM | 774 (9.5%) | 192 (3.2%) |
| 5:30 AM to 5:59 AM | 802 (9.8%) | 245 (4.1%) |
| 6:00 AM to 6:29 AM | 809 (9.9%) | 311 (5.2%) |
| 6:30 AM to 6:59 AM | 920 (11.3%) | 669 (11.2%) |
| 7:00 AM to 7:29 AM | 1,691 (20.7%) | 1,197 (20.1%) |
| 7:30 AM to 7:59 AM | 777 (9.5%) | 1,146 (19.2%) |
| 8:00 AM to 8:29 AM | 440 (5.4%) | 510 (8.6%) |
| 8:30 AM to 8:59 AM | 168 (2.1%) | 241 (4.0%) |
| 9:00 AM to 9:59 AM | 175 (2.1%) | 469 (7.9%) |
| 10:00 AM to 10:59 AM | 362 (4.4%) | 89 (1.5%) |
| 11:00 AM to 11:59 AM | 64 (0.8%) | 85 (1.4%) |
| 12:00 PM to 3:59 PM | 192 (2.4%) | 359 (6.0%) |
| 4:00 PM to 11:59 PM | 304 (3.7%) | 310 (5.2%) |
| Total | 8,168 (100.0%) | 5,968 (100.0%) |
Housing Occupancy in Okeechobee County
Occupancy by Ownership in Okeechobee County
Of the total 14,919 dwellings in Okeechobee County, owner-occupied units account for 11,101 (74.4%), while renter-occupied units make up 3,818 (25.6%).
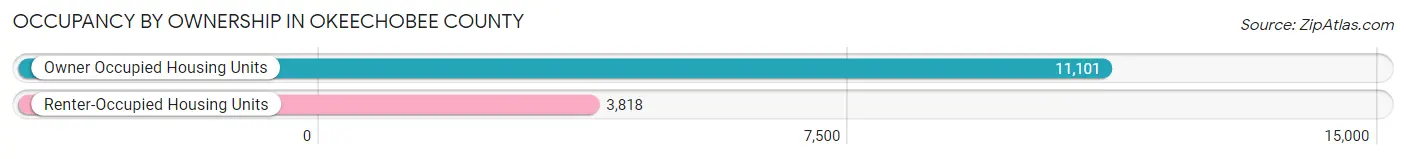
| Occupancy | # Housing Units | % Housing Units |
| Owner Occupied Housing Units | 11,101 | 74.4% |
| Renter-Occupied Housing Units | 3,818 | 25.6% |
| Total Occupied Housing Units | 14,919 | 100.0% |
Occupancy by Household Size in Okeechobee County
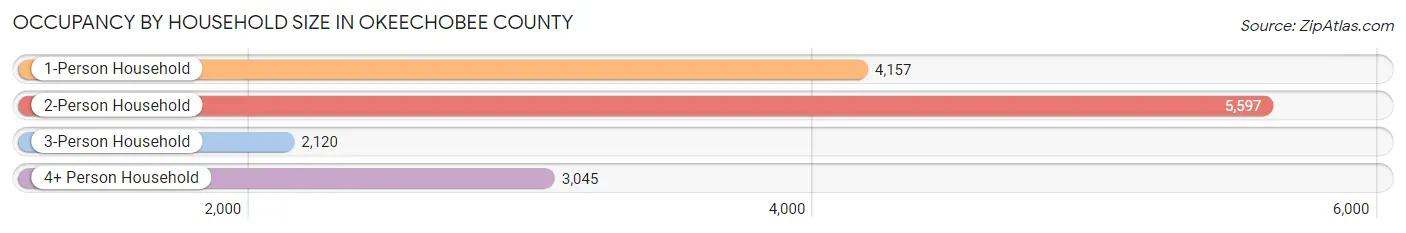
| Household Size | # Housing Units | % Housing Units |
| 1-Person Household | 4,157 | 27.9% |
| 2-Person Household | 5,597 | 37.5% |
| 3-Person Household | 2,120 | 14.2% |
| 4+ Person Household | 3,045 | 20.4% |
| Total Housing Units | 14,919 | 100.0% |
Occupancy by Ownership by Household Size in Okeechobee County
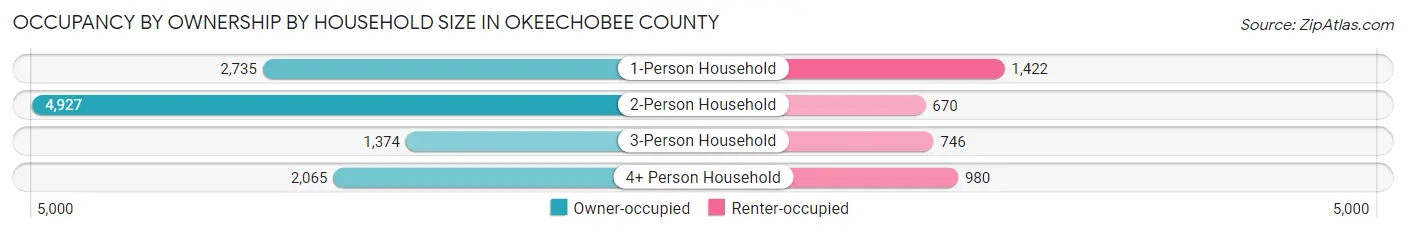
| Household Size | Owner-occupied | Renter-occupied |
| 1-Person Household | 2,735 (65.8%) | 1,422 (34.2%) |
| 2-Person Household | 4,927 (88.0%) | 670 (12.0%) |
| 3-Person Household | 1,374 (64.8%) | 746 (35.2%) |
| 4+ Person Household | 2,065 (67.8%) | 980 (32.2%) |
| Total Housing Units | 11,101 (74.4%) | 3,818 (25.6%) |
Occupancy by Educational Attainment in Okeechobee County
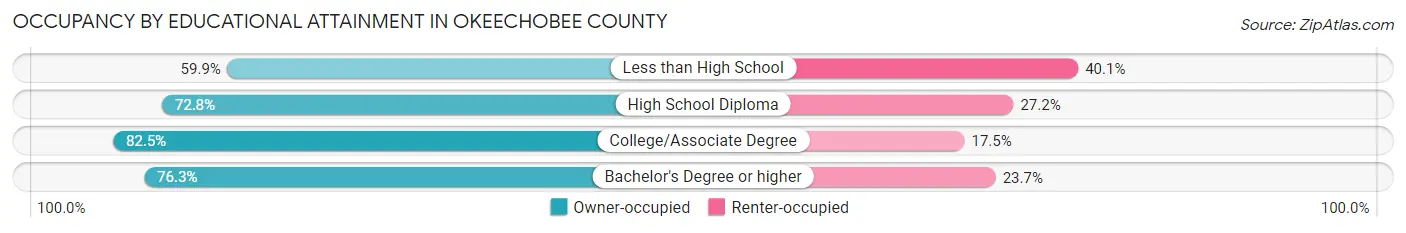
| Household Size | Owner-occupied | Renter-occupied |
| Less than High School | 1,417 (59.9%) | 947 (40.1%) |
| High School Diploma | 3,557 (72.8%) | 1,330 (27.2%) |
| College/Associate Degree | 3,691 (82.5%) | 784 (17.5%) |
| Bachelor's Degree or higher | 2,436 (76.3%) | 757 (23.7%) |
Occupancy by Age of Householder in Okeechobee County
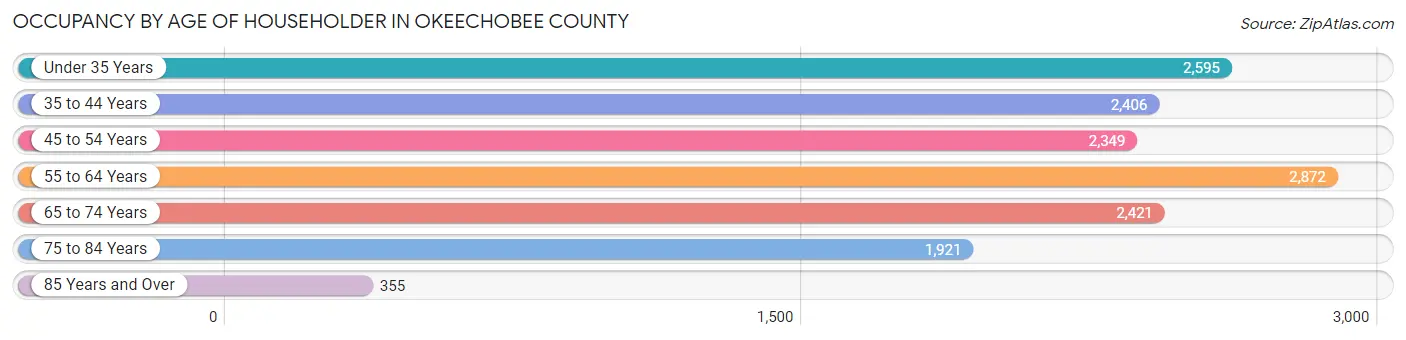
| Age Bracket | # Households | % Households |
| Under 35 Years | 2,595 | 17.4% |
| 35 to 44 Years | 2,406 | 16.1% |
| 45 to 54 Years | 2,349 | 15.8% |
| 55 to 64 Years | 2,872 | 19.3% |
| 65 to 74 Years | 2,421 | 16.2% |
| 75 to 84 Years | 1,921 | 12.9% |
| 85 Years and Over | 355 | 2.4% |
| Total | 14,919 | 100.0% |
Housing Finances in Okeechobee County
Median Income by Occupancy in Okeechobee County
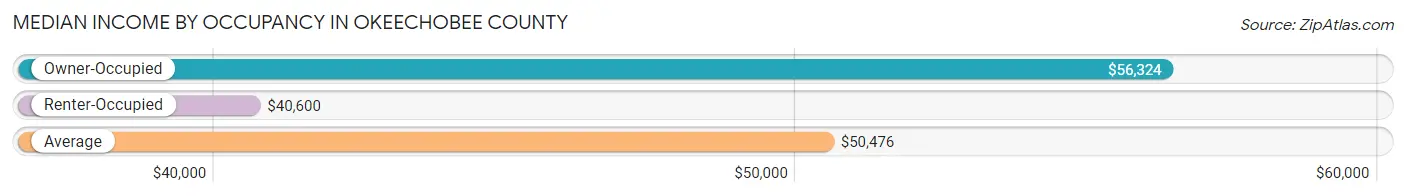
| Occupancy Type | # Households | Median Income |
| Owner-Occupied | 11,101 (74.4%) | $56,324 |
| Renter-Occupied | 3,818 (25.6%) | $40,600 |
| Average | 14,919 (100.0%) | $50,476 |
Occupancy by Householder Income Bracket in Okeechobee County
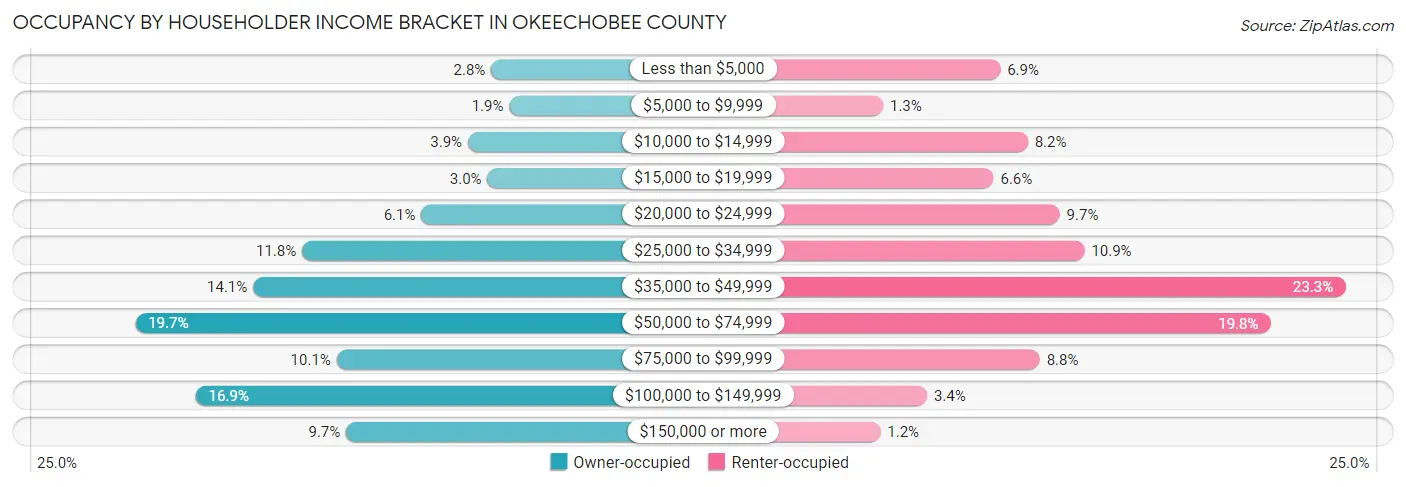
| Income Bracket | Owner-occupied | Renter-occupied |
| Less than $5,000 | 309 (2.8%) | 263 (6.9%) |
| $5,000 to $9,999 | 213 (1.9%) | 50 (1.3%) |
| $10,000 to $14,999 | 432 (3.9%) | 313 (8.2%) |
| $15,000 to $19,999 | 329 (3.0%) | 251 (6.6%) |
| $20,000 to $24,999 | 678 (6.1%) | 371 (9.7%) |
| $25,000 to $34,999 | 1,309 (11.8%) | 416 (10.9%) |
| $35,000 to $49,999 | 1,567 (14.1%) | 890 (23.3%) |
| $50,000 to $74,999 | 2,190 (19.7%) | 754 (19.8%) |
| $75,000 to $99,999 | 1,126 (10.1%) | 335 (8.8%) |
| $100,000 to $149,999 | 1,872 (16.9%) | 130 (3.4%) |
| $150,000 or more | 1,076 (9.7%) | 45 (1.2%) |
| Total | 11,101 (100.0%) | 3,818 (100.0%) |
Monthly Housing Cost Tiers in Okeechobee County
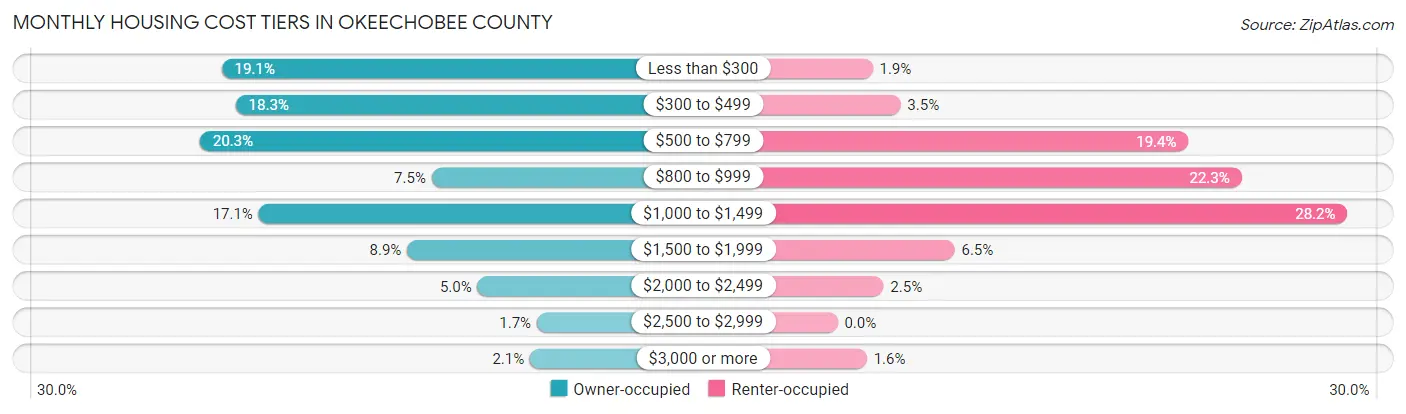
| Monthly Cost | Owner-occupied | Renter-occupied |
| Less than $300 | 2,122 (19.1%) | 74 (1.9%) |
| $300 to $499 | 2,036 (18.3%) | 133 (3.5%) |
| $500 to $799 | 2,256 (20.3%) | 740 (19.4%) |
| $800 to $999 | 834 (7.5%) | 852 (22.3%) |
| $1,000 to $1,499 | 1,895 (17.1%) | 1,075 (28.2%) |
| $1,500 to $1,999 | 985 (8.9%) | 247 (6.5%) |
| $2,000 to $2,499 | 553 (5.0%) | 97 (2.5%) |
| $2,500 to $2,999 | 189 (1.7%) | 0 (0.0%) |
| $3,000 or more | 231 (2.1%) | 62 (1.6%) |
| Total | 11,101 (100.0%) | 3,818 (100.0%) |
Physical Housing Characteristics in Okeechobee County
Housing Structures in Okeechobee County
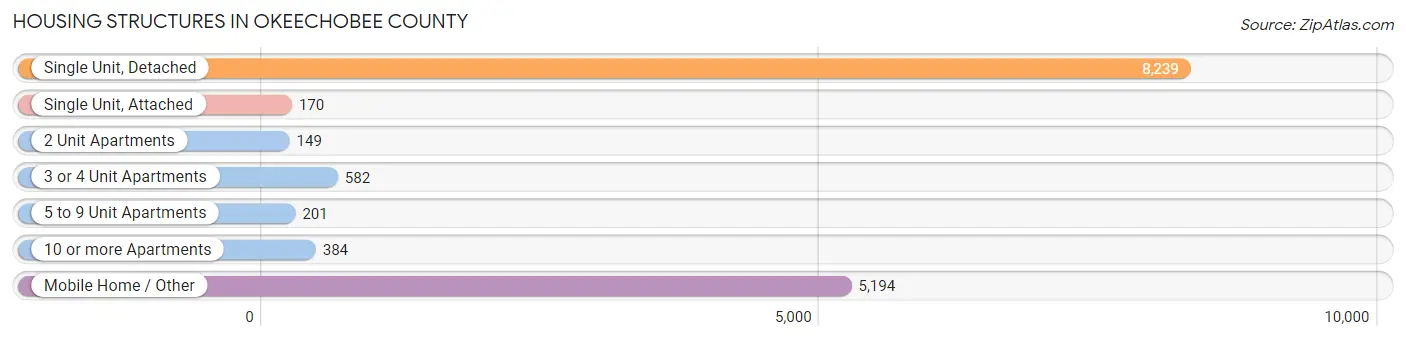
| Structure Type | # Housing Units | % Housing Units |
| Single Unit, Detached | 8,239 | 55.2% |
| Single Unit, Attached | 170 | 1.1% |
| 2 Unit Apartments | 149 | 1.0% |
| 3 or 4 Unit Apartments | 582 | 3.9% |
| 5 to 9 Unit Apartments | 201 | 1.3% |
| 10 or more Apartments | 384 | 2.6% |
| Mobile Home / Other | 5,194 | 34.8% |
| Total | 14,919 | 100.0% |
Housing Structures by Occupancy in Okeechobee County
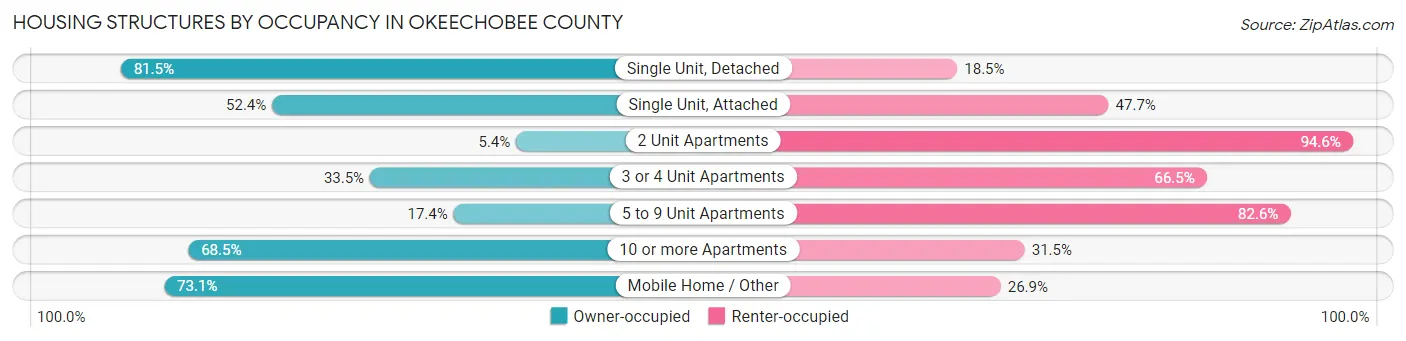
| Structure Type | Owner-occupied | Renter-occupied |
| Single Unit, Detached | 6,713 (81.5%) | 1,526 (18.5%) |
| Single Unit, Attached | 89 (52.3%) | 81 (47.6%) |
| 2 Unit Apartments | 8 (5.4%) | 141 (94.6%) |
| 3 or 4 Unit Apartments | 195 (33.5%) | 387 (66.5%) |
| 5 to 9 Unit Apartments | 35 (17.4%) | 166 (82.6%) |
| 10 or more Apartments | 263 (68.5%) | 121 (31.5%) |
| Mobile Home / Other | 3,798 (73.1%) | 1,396 (26.9%) |
| Total | 11,101 (74.4%) | 3,818 (25.6%) |
Housing Structures by Number of Rooms in Okeechobee County
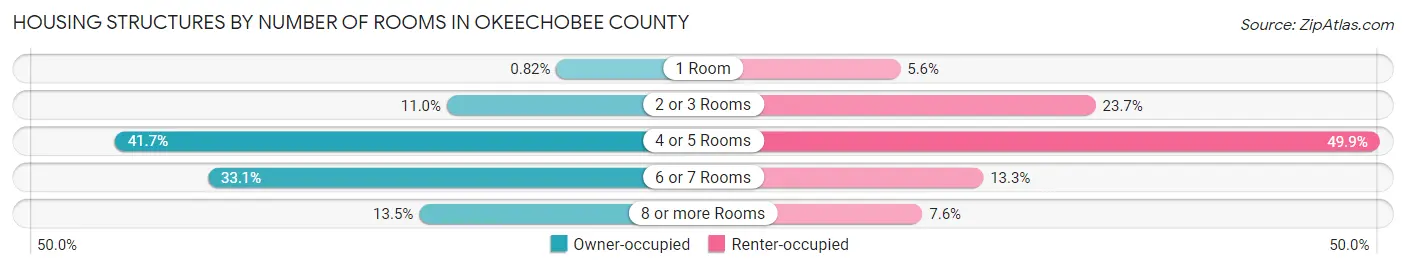
| Number of Rooms | Owner-occupied | Renter-occupied |
| 1 Room | 91 (0.8%) | 213 (5.6%) |
| 2 or 3 Rooms | 1,216 (11.0%) | 903 (23.6%) |
| 4 or 5 Rooms | 4,625 (41.7%) | 1,905 (49.9%) |
| 6 or 7 Rooms | 3,669 (33.1%) | 506 (13.3%) |
| 8 or more Rooms | 1,500 (13.5%) | 291 (7.6%) |
| Total | 11,101 (100.0%) | 3,818 (100.0%) |
Housing Structure by Heating Type in Okeechobee County
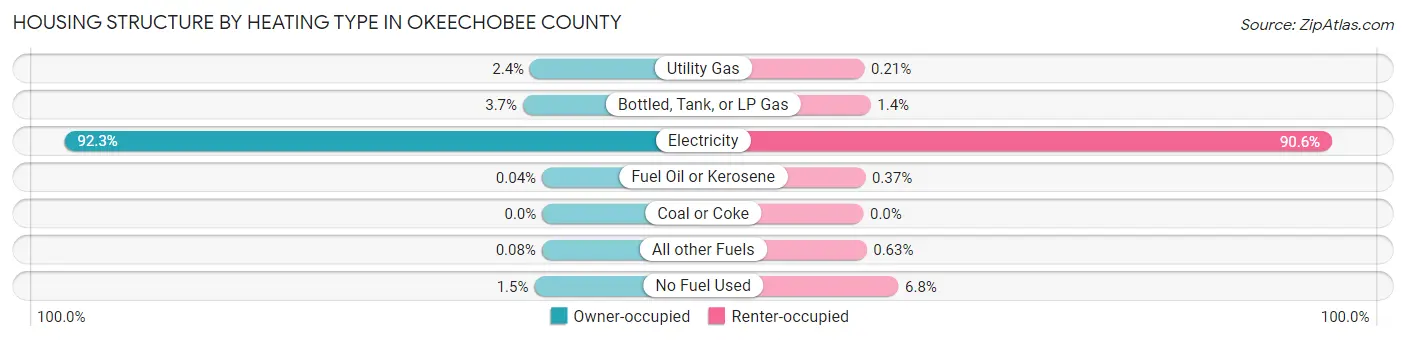
| Heating Type | Owner-occupied | Renter-occupied |
| Utility Gas | 261 (2.4%) | 8 (0.2%) |
| Bottled, Tank, or LP Gas | 413 (3.7%) | 54 (1.4%) |
| Electricity | 10,246 (92.3%) | 3,459 (90.6%) |
| Fuel Oil or Kerosene | 4 (0.0%) | 14 (0.4%) |
| Coal or Coke | 0 (0.0%) | 0 (0.0%) |
| All other Fuels | 9 (0.1%) | 24 (0.6%) |
| No Fuel Used | 168 (1.5%) | 259 (6.8%) |
| Total | 11,101 (100.0%) | 3,818 (100.0%) |
Household Vehicle Usage in Okeechobee County
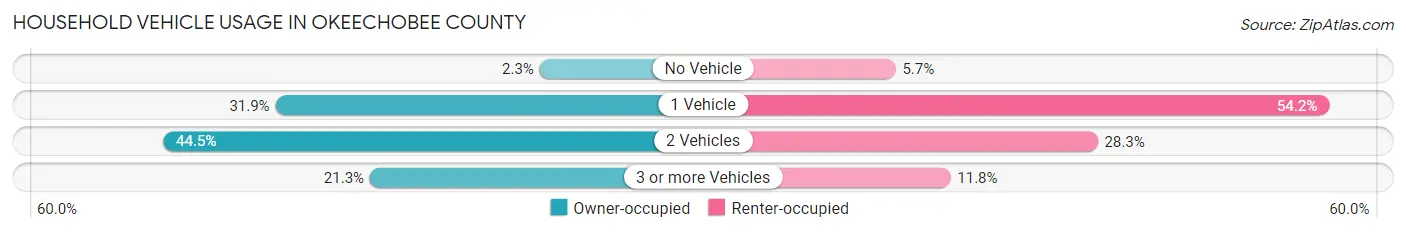
| Vehicles per Household | Owner-occupied | Renter-occupied |
| No Vehicle | 255 (2.3%) | 216 (5.7%) |
| 1 Vehicle | 3,541 (31.9%) | 2,071 (54.2%) |
| 2 Vehicles | 4,938 (44.5%) | 1,080 (28.3%) |
| 3 or more Vehicles | 2,367 (21.3%) | 451 (11.8%) |
| Total | 11,101 (100.0%) | 3,818 (100.0%) |
Real Estate & Mortgages in Okeechobee County
Real Estate and Mortgage Overview in Okeechobee County
| Characteristic | Without Mortgage | With Mortgage |
| Housing Units | 6,080 | 5,021 |
| Median Property Value | $115,900 | $197,500 |
| Median Household Income | $46,959 | $776 |
| Monthly Housing Costs | $387 | $230 |
| Real Estate Taxes | $1,042 | $250 |
Property Value by Mortgage Status in Okeechobee County
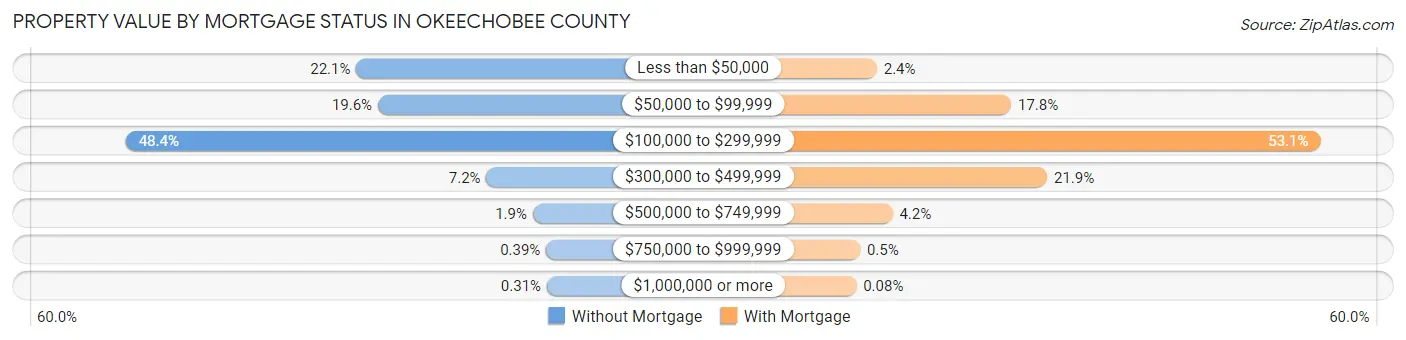
| Property Value | Without Mortgage | With Mortgage |
| Less than $50,000 | 1,343 (22.1%) | 122 (2.4%) |
| $50,000 to $99,999 | 1,193 (19.6%) | 892 (17.8%) |
| $100,000 to $299,999 | 2,945 (48.4%) | 2,667 (53.1%) |
| $300,000 to $499,999 | 439 (7.2%) | 1,099 (21.9%) |
| $500,000 to $749,999 | 117 (1.9%) | 212 (4.2%) |
| $750,000 to $999,999 | 24 (0.4%) | 25 (0.5%) |
| $1,000,000 or more | 19 (0.3%) | 4 (0.1%) |
| Total | 6,080 (100.0%) | 5,021 (100.0%) |
Household Income by Mortgage Status in Okeechobee County
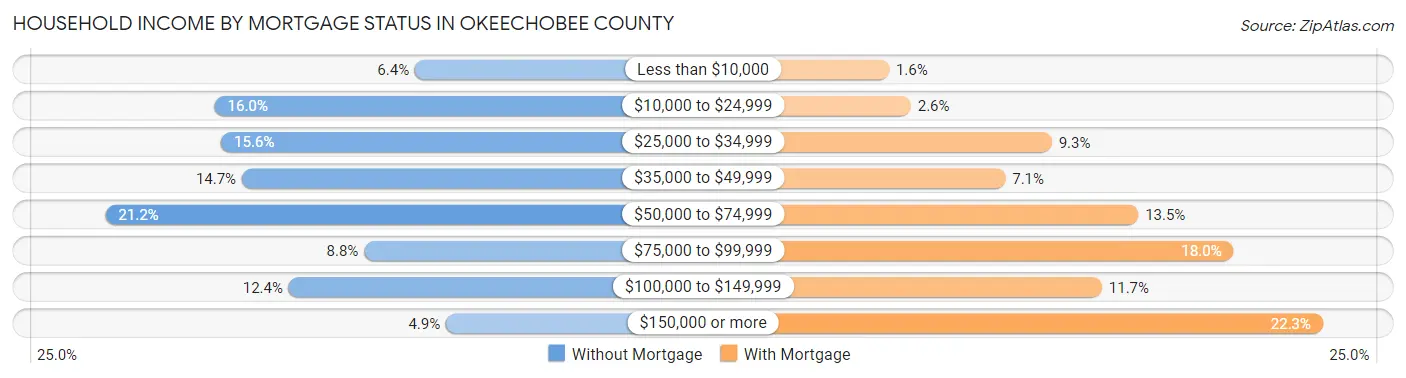
| Household Income | Without Mortgage | With Mortgage |
| Less than $10,000 | 390 (6.4%) | 80 (1.6%) |
| $10,000 to $24,999 | 970 (16.0%) | 132 (2.6%) |
| $25,000 to $34,999 | 951 (15.6%) | 469 (9.3%) |
| $35,000 to $49,999 | 891 (14.6%) | 358 (7.1%) |
| $50,000 to $74,999 | 1,286 (21.1%) | 676 (13.5%) |
| $75,000 to $99,999 | 537 (8.8%) | 904 (18.0%) |
| $100,000 to $149,999 | 755 (12.4%) | 589 (11.7%) |
| $150,000 or more | 300 (4.9%) | 1,117 (22.3%) |
| Total | 6,080 (100.0%) | 5,021 (100.0%) |
Property Value to Household Income Ratio in Okeechobee County
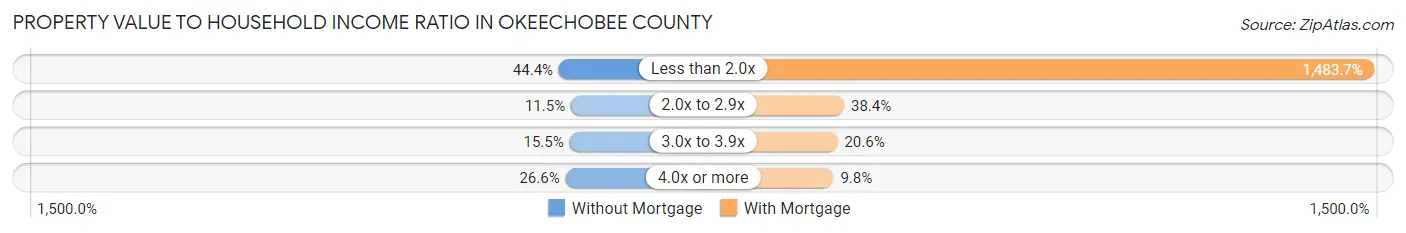
| Value-to-Income Ratio | Without Mortgage | With Mortgage |
| Less than 2.0x | 2,699 (44.4%) | 74,495 (1,483.7%) |
| 2.0x to 2.9x | 699 (11.5%) | 1,928 (38.4%) |
| 3.0x to 3.9x | 940 (15.5%) | 1,035 (20.6%) |
| 4.0x or more | 1,617 (26.6%) | 491 (9.8%) |
| Total | 6,080 (100.0%) | 5,021 (100.0%) |
Real Estate Taxes by Mortgage Status in Okeechobee County
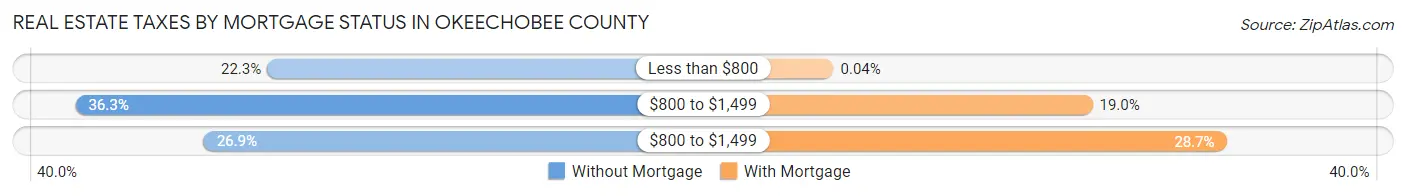
| Property Taxes | Without Mortgage | With Mortgage |
| Less than $800 | 1,355 (22.3%) | 2 (0.0%) |
| $800 to $1,499 | 2,206 (36.3%) | 952 (19.0%) |
| $800 to $1,499 | 1,636 (26.9%) | 1,443 (28.7%) |
| Total | 6,080 (100.0%) | 5,021 (100.0%) |
Health & Disability in Okeechobee County
Health Insurance Coverage by Age in Okeechobee County
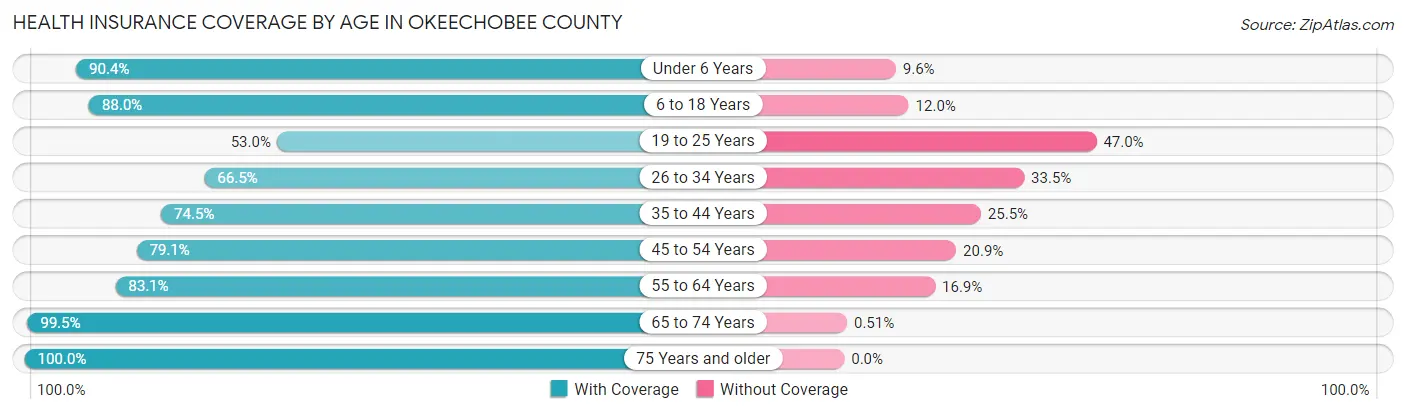
| Age Bracket | With Coverage | Without Coverage |
| Under 6 Years | 2,625 (90.4%) | 279 (9.6%) |
| 6 to 18 Years | 5,172 (88.0%) | 705 (12.0%) |
| 19 to 25 Years | 1,484 (53.0%) | 1,317 (47.0%) |
| 26 to 34 Years | 2,633 (66.5%) | 1,329 (33.5%) |
| 35 to 44 Years | 3,512 (74.5%) | 1,200 (25.5%) |
| 45 to 54 Years | 3,673 (79.1%) | 968 (20.9%) |
| 55 to 64 Years | 4,097 (83.1%) | 835 (16.9%) |
| 65 to 74 Years | 3,879 (99.5%) | 20 (0.5%) |
| 75 Years and older | 3,511 (100.0%) | 0 (0.0%) |
| Total | 30,586 (82.1%) | 6,653 (17.9%) |
Health Insurance Coverage by Citizenship Status in Okeechobee County
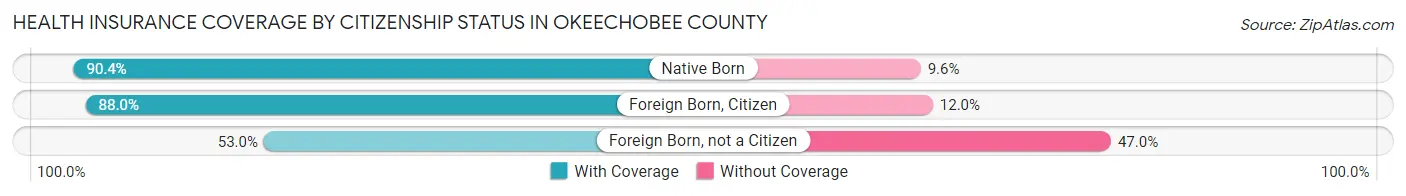
| Citizenship Status | With Coverage | Without Coverage |
| Native Born | 2,625 (90.4%) | 279 (9.6%) |
| Foreign Born, Citizen | 5,172 (88.0%) | 705 (12.0%) |
| Foreign Born, not a Citizen | 1,484 (53.0%) | 1,317 (47.0%) |
Health Insurance Coverage by Household Income in Okeechobee County
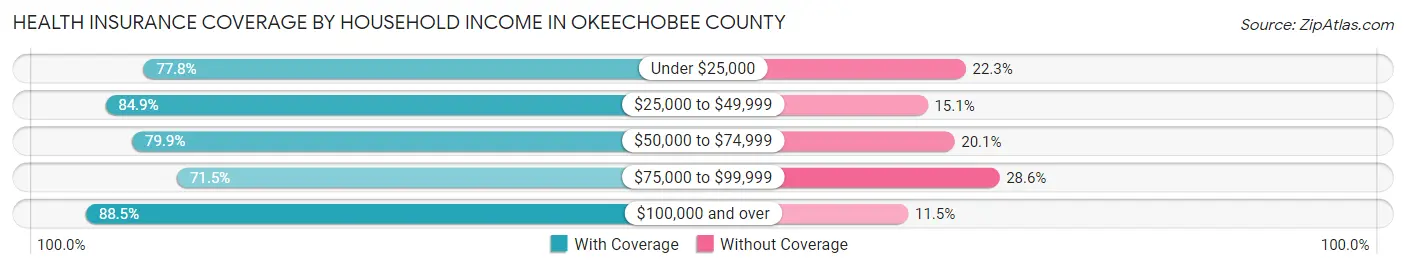
| Household Income | With Coverage | Without Coverage |
| Under $25,000 | 4,872 (77.7%) | 1,394 (22.3%) |
| $25,000 to $49,999 | 7,831 (84.9%) | 1,395 (15.1%) |
| $50,000 to $74,999 | 6,181 (79.9%) | 1,559 (20.1%) |
| $75,000 to $99,999 | 2,733 (71.5%) | 1,092 (28.5%) |
| $100,000 and over | 8,940 (88.5%) | 1,158 (11.5%) |
Public vs Private Health Insurance Coverage by Age in Okeechobee County
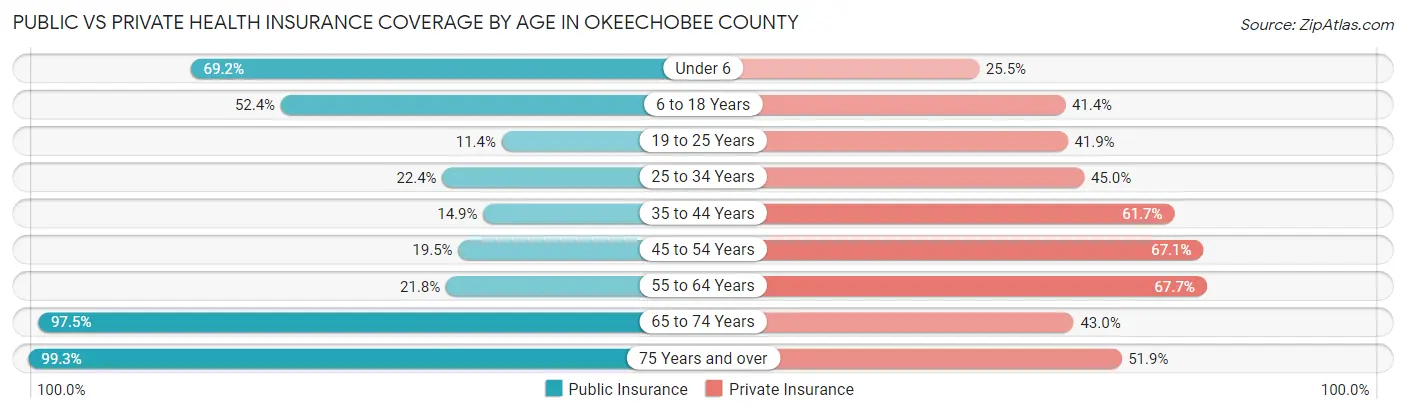
| Age Bracket | Public Insurance | Private Insurance |
| Under 6 | 2,009 (69.2%) | 739 (25.5%) |
| 6 to 18 Years | 3,081 (52.4%) | 2,434 (41.4%) |
| 19 to 25 Years | 320 (11.4%) | 1,173 (41.9%) |
| 25 to 34 Years | 889 (22.4%) | 1,782 (45.0%) |
| 35 to 44 Years | 700 (14.9%) | 2,908 (61.7%) |
| 45 to 54 Years | 904 (19.5%) | 3,114 (67.1%) |
| 55 to 64 Years | 1,073 (21.8%) | 3,340 (67.7%) |
| 65 to 74 Years | 3,802 (97.5%) | 1,677 (43.0%) |
| 75 Years and over | 3,486 (99.3%) | 1,821 (51.9%) |
| Total | 16,264 (43.7%) | 18,988 (51.0%) |
Disability Status by Sex by Age in Okeechobee County
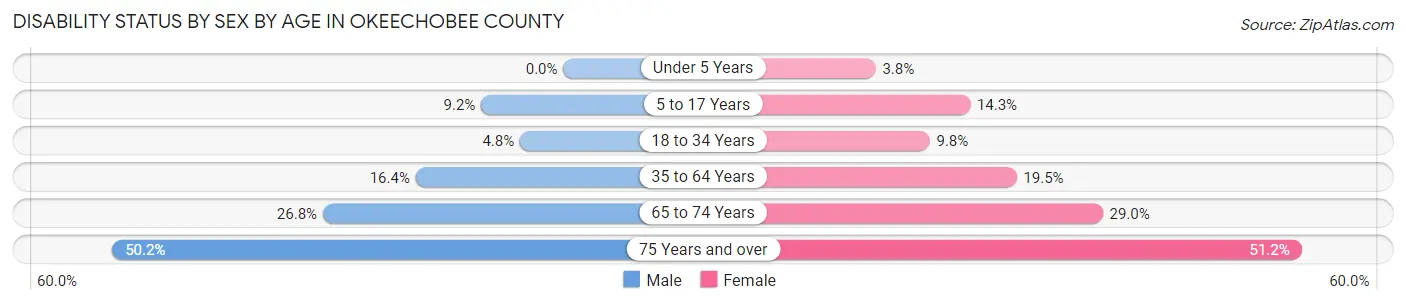
| Age Bracket | Male | Female |
| Under 5 Years | 0 (0.0%) | 42 (3.7%) |
| 5 to 17 Years | 289 (9.1%) | 397 (14.3%) |
| 18 to 34 Years | 172 (4.8%) | 355 (9.8%) |
| 35 to 64 Years | 1,242 (16.4%) | 1,309 (19.5%) |
| 65 to 74 Years | 477 (26.8%) | 615 (29.0%) |
| 75 Years and over | 821 (50.2%) | 961 (51.2%) |
Disability Class by Sex by Age in Okeechobee County
Disability Class: Hearing Difficulty
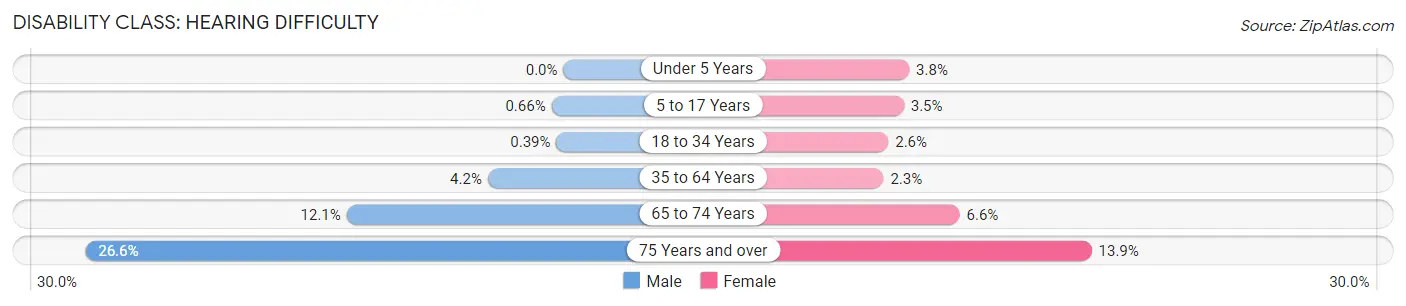
| Age Bracket | Male | Female |
| Under 5 Years | 0 (0.0%) | 42 (3.7%) |
| 5 to 17 Years | 21 (0.7%) | 96 (3.5%) |
| 18 to 34 Years | 14 (0.4%) | 94 (2.6%) |
| 35 to 64 Years | 318 (4.2%) | 156 (2.3%) |
| 65 to 74 Years | 215 (12.1%) | 139 (6.6%) |
| 75 Years and over | 435 (26.6%) | 261 (13.9%) |
Disability Class: Vision Difficulty
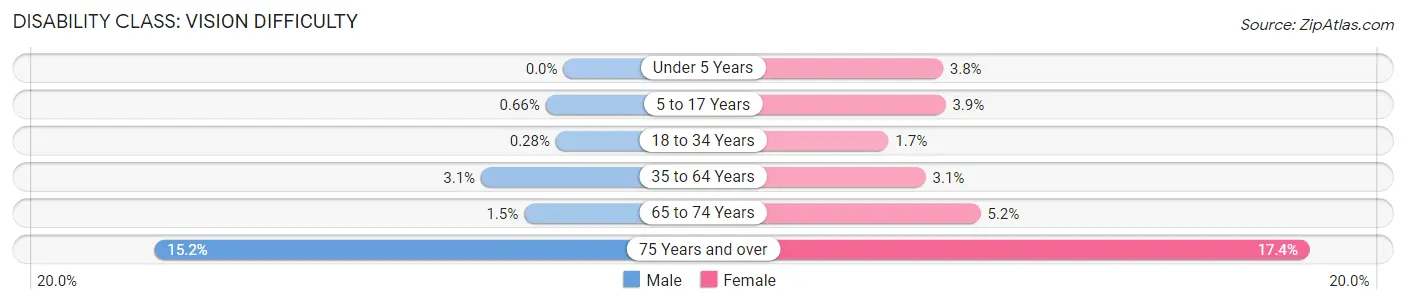
| Age Bracket | Male | Female |
| Under 5 Years | 0 (0.0%) | 42 (3.7%) |
| 5 to 17 Years | 21 (0.7%) | 107 (3.8%) |
| 18 to 34 Years | 10 (0.3%) | 63 (1.7%) |
| 35 to 64 Years | 231 (3.1%) | 209 (3.1%) |
| 65 to 74 Years | 26 (1.5%) | 109 (5.1%) |
| 75 Years and over | 248 (15.2%) | 326 (17.4%) |
Disability Class: Cognitive Difficulty
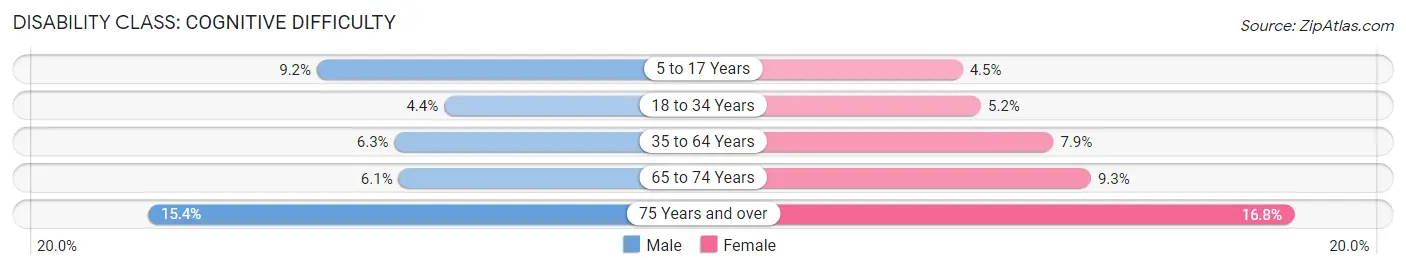
| Age Bracket | Male | Female |
| 5 to 17 Years | 289 (9.1%) | 125 (4.5%) |
| 18 to 34 Years | 158 (4.4%) | 188 (5.2%) |
| 35 to 64 Years | 474 (6.3%) | 529 (7.9%) |
| 65 to 74 Years | 109 (6.1%) | 196 (9.2%) |
| 75 Years and over | 252 (15.4%) | 315 (16.8%) |
Disability Class: Ambulatory Difficulty
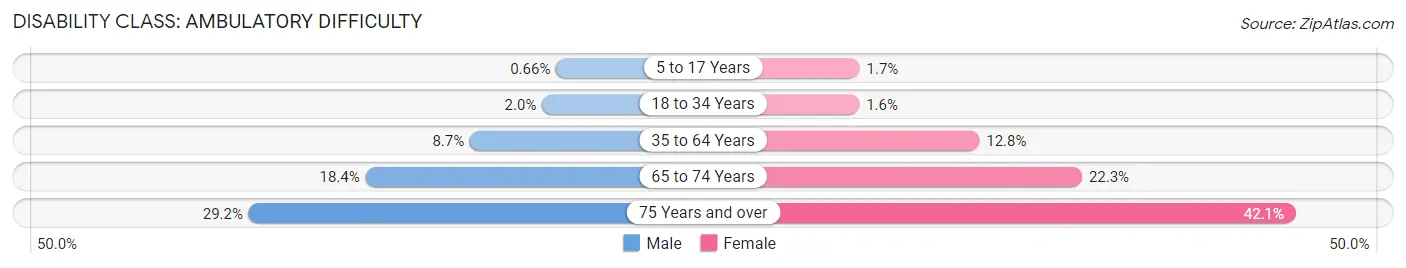
| Age Bracket | Male | Female |
| 5 to 17 Years | 21 (0.7%) | 46 (1.7%) |
| 18 to 34 Years | 70 (2.0%) | 59 (1.6%) |
| 35 to 64 Years | 654 (8.7%) | 859 (12.8%) |
| 65 to 74 Years | 327 (18.4%) | 472 (22.3%) |
| 75 Years and over | 477 (29.2%) | 791 (42.1%) |
Disability Class: Self-Care Difficulty
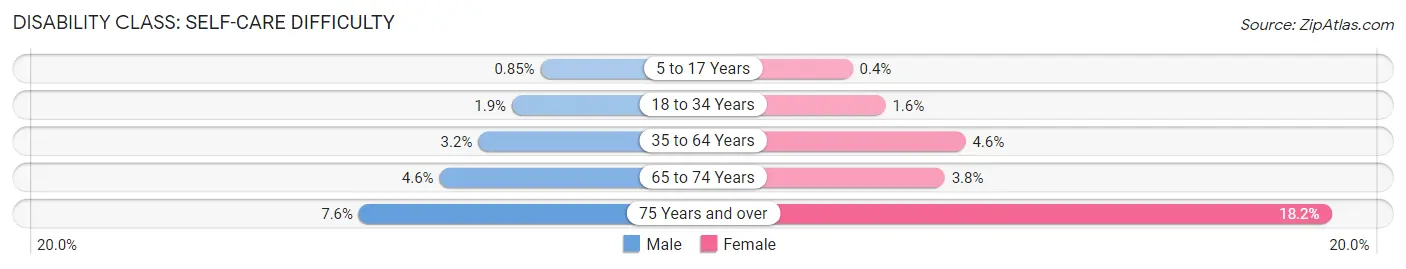
| Age Bracket | Male | Female |
| 5 to 17 Years | 27 (0.9%) | 11 (0.4%) |
| 18 to 34 Years | 68 (1.9%) | 59 (1.6%) |
| 35 to 64 Years | 239 (3.2%) | 309 (4.6%) |
| 65 to 74 Years | 82 (4.6%) | 81 (3.8%) |
| 75 Years and over | 124 (7.6%) | 341 (18.2%) |
Technology Access in Okeechobee County
Computing Device Access in Okeechobee County
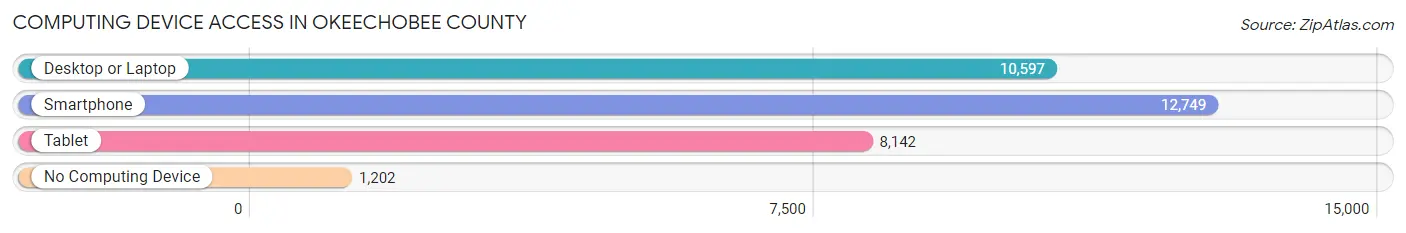
| Device Type | # Households | % Households |
| Desktop or Laptop | 10,597 | 71.0% |
| Smartphone | 12,749 | 85.5% |
| Tablet | 8,142 | 54.6% |
| No Computing Device | 1,202 | 8.1% |
| Total | 14,919 | 100.0% |
Internet Access in Okeechobee County
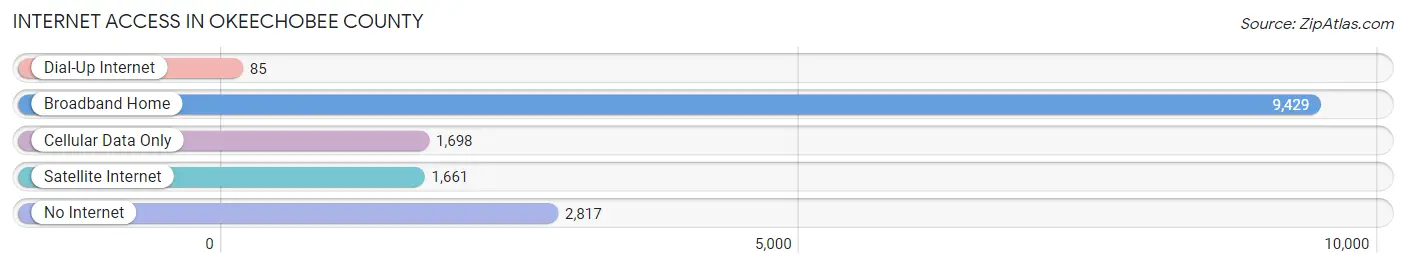
| Internet Type | # Households | % Households |
| Dial-Up Internet | 85 | 0.6% |
| Broadband Home | 9,429 | 63.2% |
| Cellular Data Only | 1,698 | 11.4% |
| Satellite Internet | 1,661 | 11.1% |
| No Internet | 2,817 | 18.9% |
| Total | 14,919 | 100.0% |
Okeechobee County Summary
Okeechobee County is located in the state of Florida in the United States. It is part of the Treasure Coast region and is bordered by Martin, St. Lucie, Glades, and Highlands counties. The county seat is Okeechobee, and the county has a population of approximately 40,000 people.
History
Okeechobee County was created in 1917 from parts of St. Lucie and Palm Beach counties. The county was named after Lake Okeechobee, which is the largest lake in the state of Florida. The lake was named after the Hitchiti Indian word for “big water”. The county was originally inhabited by the Seminole Indians, who were forced to move to the reservation in the Everglades in the late 1800s.
The first settlers in the area were cattle ranchers, who began arriving in the late 1800s. The first town in the county was Fort Drum, which was established in 1876. The town was named after the nearby military fort. The county was largely rural until the 1950s, when the population began to grow rapidly due to the development of the citrus industry.
Geography
Okeechobee County is located in the central part of the state of Florida. It is bordered by Martin, St. Lucie, Glades, and Highlands counties. The county covers an area of 1,945 square miles and is the second largest county in the state. The county is mostly flat and is home to several lakes, including Lake Okeechobee, which is the largest lake in the state. The county is also home to the Kissimmee River, which flows through the county and empties into Lake Okeechobee.
Economy
The economy of Okeechobee County is largely based on agriculture. The county is home to several large citrus groves, as well as cattle ranches and dairy farms. The county is also home to several manufacturing companies, including a paper mill and a plastics factory. Tourism is also an important part of the economy, with several popular attractions, such as the Okeechobee County Historical Museum and the Okeechobee Music Festival.
Demographics
As of the 2010 census, the population of Okeechobee County was 40,000. The population is largely white (77.3%), with a small African American population (14.2%) and a small Hispanic population (7.5%). The median household income in the county is $37,000, and the median age is 41. The county has a higher than average poverty rate (20.2%), and the unemployment rate is 6.2%.
Conclusion
Okeechobee County is located in the state of Florida in the United States. It is part of the Treasure Coast region and is bordered by Martin, St. Lucie, Glades, and Highlands counties. The county was created in 1917 and is named after Lake Okeechobee, which is the largest lake in the state. The economy of the county is largely based on agriculture, with several large citrus groves, cattle ranches, and dairy farms. The population of the county is 40,000, and the median household income is $37,000. The county has a higher than average poverty rate and an unemployment rate of 6.2%.
Common Questions
What is Per Capita Income in Okeechobee County?
Per Capita income in Okeechobee County is $26,904.
What is the Median Family Income in Okeechobee County?
Median Family Income in Okeechobee County is $58,527.
What is the Median Household income in Okeechobee County?
Median Household Income in Okeechobee County is $50,476.
What is Income or Wage Gap in Okeechobee County?
Income or Wage Gap in Okeechobee County is 26.9%.
Women in Okeechobee County earn 73.1 cents for every dollar earned by a man.
What is Family Income Deficit in Okeechobee County?
Family Income Deficit in Okeechobee County is $10,775.
Families that are below poverty line in Okeechobee County earn $10,775 less on average than the poverty threshold level.
What is Inequality or Gini Index in Okeechobee County?
Inequality or Gini Index in Okeechobee County is 0.45.
What is the Total Population of Okeechobee County?
Total Population of Okeechobee County is 39,870.
What is the Total Male Population of Okeechobee County?
Total Male Population of Okeechobee County is 21,440.
What is the Total Female Population of Okeechobee County?
Total Female Population of Okeechobee County is 18,430.
What is the Ratio of Males per 100 Females in Okeechobee County?
There are 116.33 Males per 100 Females in Okeechobee County.
What is the Ratio of Females per 100 Males in Okeechobee County?
There are 85.96 Females per 100 Males in Okeechobee County.
What is the Median Population Age in Okeechobee County?
Median Population Age in Okeechobee County is 40.8 Years.
What is the Average Family Size in Okeechobee County
Average Family Size in Okeechobee County is 3.0 People.
What is the Average Household Size in Okeechobee County
Average Household Size in Okeechobee County is 2.5 People.
How Large is the Labor Force in Okeechobee County?
There are 16,367 People in the Labor Forcein in Okeechobee County.
What is the Percentage of People in the Labor Force in Okeechobee County?
50.4% of People are in the Labor Force in Okeechobee County.
What is the Unemployment Rate in Okeechobee County?
Unemployment Rate in Okeechobee County is 6.1%.