Nassau County, FL Map & Demographics
Nassau County Map
Nassau County Overview
$44,483
PER CAPITA INCOME
$96,039
AVG FAMILY INCOME
$84,085
AVG HOUSEHOLD INCOME
35.3%
WAGE / INCOME GAP [ % ]
64.7¢/ $1
WAGE / INCOME GAP [ $ ]
$10,314
FAMILY INCOME DEFICIT
0.44
INEQUALITY / GINI INDEX
91,538
TOTAL POPULATION
45,302
MALE POPULATION
46,236
FEMALE POPULATION
97.98
MALES / 100 FEMALES
102.06
FEMALES / 100 MALES
46.3
MEDIAN AGE
2.9
AVG FAMILY SIZE
2.5
AVG HOUSEHOLD SIZE
43,634
LABOR FORCE [ PEOPLE ]
57.7%
PERCENT IN LABOR FORCE
4.1%
UNEMPLOYMENT RATE
Nassau County Area Codes
Income in Nassau County
Income Overview in Nassau County
Per Capita Income in Nassau County is $44,483, while median incomes of families and households are $96,039 and $84,085 respectively.
| Characteristic | Number | Measure |
| Per Capita Income | 91,538 | $44,483 |
| Median Family Income | 26,434 | $96,039 |
| Mean Family Income | 26,434 | $121,230 |
| Median Household Income | 36,336 | $84,085 |
| Mean Household Income | 36,336 | $109,291 |
| Income Deficit | 26,434 | $10,314 |
| Wage / Income Gap (%) | 91,538 | 35.27% |
| Wage / Income Gap ($) | 91,538 | 64.73¢ per $1 |
| Gini / Inequality Index | 91,538 | 0.44 |
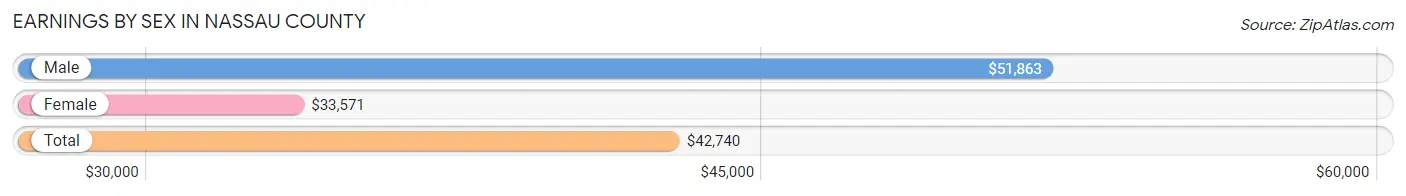
Earnings by Sex in Nassau County
Average Earnings in Nassau County are $42,740, $51,863 for men and $33,571 for women, a difference of 35.3%.
| Sex | Number | Average Earnings |
| Male | 24,752 (53.8%) | $51,863 |
| Female | 21,242 (46.2%) | $33,571 |
| Total | 45,994 (100.0%) | $42,740 |
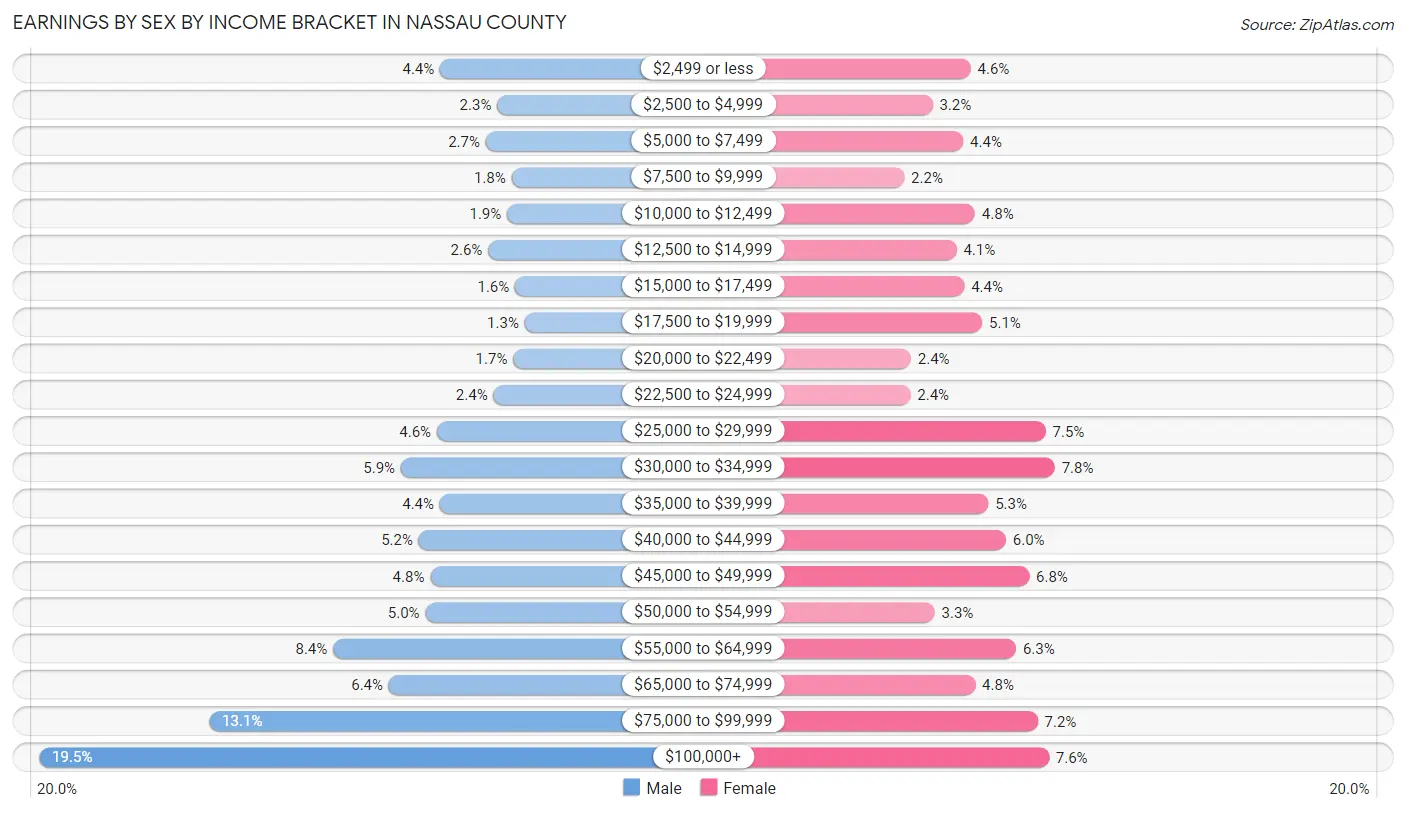
Earnings by Sex by Income Bracket in Nassau County
The most common earnings brackets in Nassau County are $100,000+ for men (4,817 | 19.5%) and $30,000 to $34,999 for women (1,654 | 7.8%).
| Income | Male | Female |
| $2,499 or less | 1,097 (4.4%) | 986 (4.6%) |
| $2,500 to $4,999 | 567 (2.3%) | 682 (3.2%) |
| $5,000 to $7,499 | 674 (2.7%) | 926 (4.4%) |
| $7,500 to $9,999 | 434 (1.8%) | 457 (2.1%) |
| $10,000 to $12,499 | 475 (1.9%) | 1,020 (4.8%) |
| $12,500 to $14,999 | 652 (2.6%) | 873 (4.1%) |
| $15,000 to $17,499 | 402 (1.6%) | 934 (4.4%) |
| $17,500 to $19,999 | 313 (1.3%) | 1,078 (5.1%) |
| $20,000 to $22,499 | 418 (1.7%) | 509 (2.4%) |
| $22,500 to $24,999 | 602 (2.4%) | 505 (2.4%) |
| $25,000 to $29,999 | 1,126 (4.5%) | 1,583 (7.4%) |
| $30,000 to $34,999 | 1,461 (5.9%) | 1,654 (7.8%) |
| $35,000 to $39,999 | 1,100 (4.4%) | 1,126 (5.3%) |
| $40,000 to $44,999 | 1,295 (5.2%) | 1,265 (6.0%) |
| $45,000 to $49,999 | 1,187 (4.8%) | 1,451 (6.8%) |
| $50,000 to $54,999 | 1,232 (5.0%) | 699 (3.3%) |
| $55,000 to $64,999 | 2,089 (8.4%) | 1,346 (6.3%) |
| $65,000 to $74,999 | 1,572 (6.4%) | 1,021 (4.8%) |
| $75,000 to $99,999 | 3,239 (13.1%) | 1,518 (7.1%) |
| $100,000+ | 4,817 (19.5%) | 1,609 (7.6%) |
| Total | 24,752 (100.0%) | 21,242 (100.0%) |
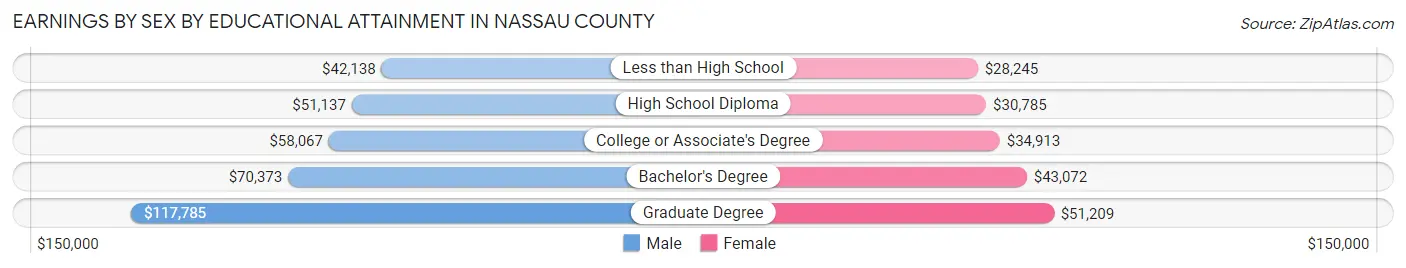
Earnings by Sex by Educational Attainment in Nassau County
Average earnings in Nassau County are $56,594 for men and $36,426 for women, a difference of 35.6%. Men with an educational attainment of graduate degree enjoy the highest average annual earnings of $117,785, while those with less than high school education earn the least with $42,138. Women with an educational attainment of graduate degree earn the most with the average annual earnings of $51,209, while those with less than high school education have the smallest earnings of $28,245.
| Educational Attainment | Male Income | Female Income |
| Less than High School | $42,138 | $28,245 |
| High School Diploma | $51,137 | $30,785 |
| College or Associate's Degree | $58,067 | $34,913 |
| Bachelor's Degree | $70,373 | $43,072 |
| Graduate Degree | $117,785 | $51,209 |
| Total | $56,594 | $36,426 |
Family Income in Nassau County
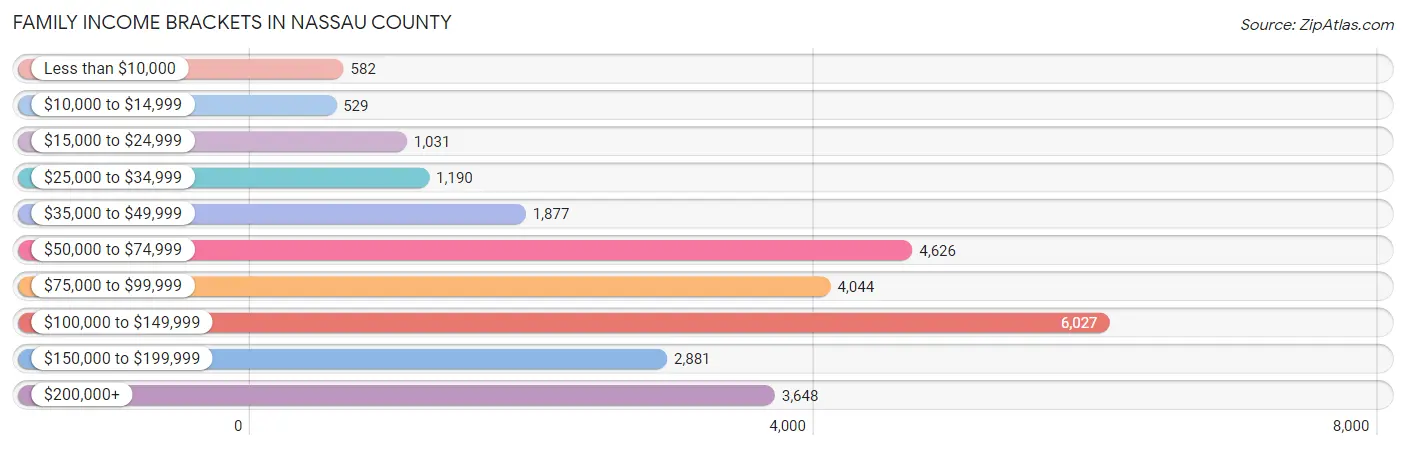
Family Income Brackets in Nassau County
According to the Nassau County family income data, there are 6,027 families falling into the $100,000 to $149,999 income range, which is the most common income bracket and makes up 22.8% of all families. Conversely, the $10,000 to $14,999 income bracket is the least frequent group with only 529 families (2.0%) belonging to this category.
| Income Bracket | # Families | % Families |
| Less than $10,000 | 582 | 2.2% |
| $10,000 to $14,999 | 529 | 2.0% |
| $15,000 to $24,999 | 1,031 | 3.9% |
| $25,000 to $34,999 | 1,190 | 4.5% |
| $35,000 to $49,999 | 1,877 | 7.1% |
| $50,000 to $74,999 | 4,626 | 17.5% |
| $75,000 to $99,999 | 4,044 | 15.3% |
| $100,000 to $149,999 | 6,027 | 22.8% |
| $150,000 to $199,999 | 2,881 | 10.9% |
| $200,000+ | 3,648 | 13.8% |
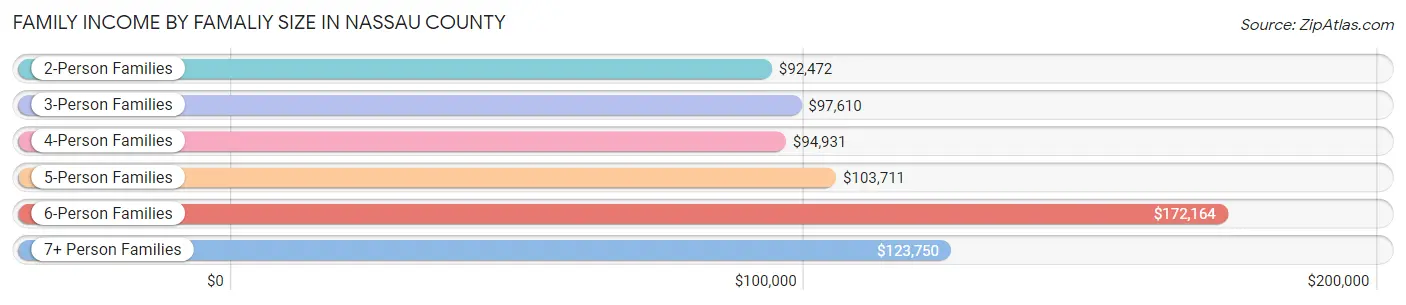
Family Income by Famaliy Size in Nassau County
6-person families (782 | 3.0%) account for the highest median family income in Nassau County with $172,164 per family, while 2-person families (14,683 | 55.5%) have the highest median income of $46,236 per family member.
| Income Bracket | # Families | Median Income |
| 2-Person Families | 14,683 (55.5%) | $92,472 |
| 3-Person Families | 5,664 (21.4%) | $97,610 |
| 4-Person Families | 3,489 (13.2%) | $94,931 |
| 5-Person Families | 1,498 (5.7%) | $103,711 |
| 6-Person Families | 782 (3.0%) | $172,164 |
| 7+ Person Families | 318 (1.2%) | $123,750 |
| Total | 26,434 (100.0%) | $96,039 |
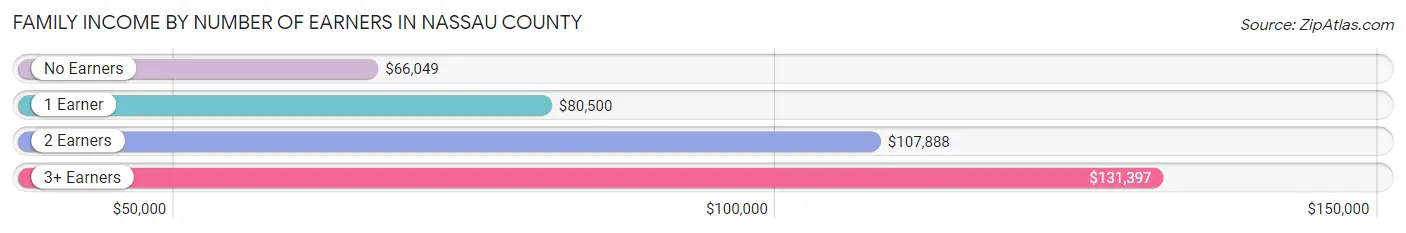
Family Income by Number of Earners in Nassau County
The median family income in Nassau County is $96,039, with families comprising 3+ earners (2,249) having the highest median family income of $131,397, while families with no earners (5,871) have the lowest median family income of $66,049, accounting for 8.5% and 22.2% of families, respectively.
| Number of Earners | # Families | Median Income |
| No Earners | 5,871 (22.2%) | $66,049 |
| 1 Earner | 8,296 (31.4%) | $80,500 |
| 2 Earners | 10,018 (37.9%) | $107,888 |
| 3+ Earners | 2,249 (8.5%) | $131,397 |
| Total | 26,434 (100.0%) | $96,039 |
Household Income in Nassau County
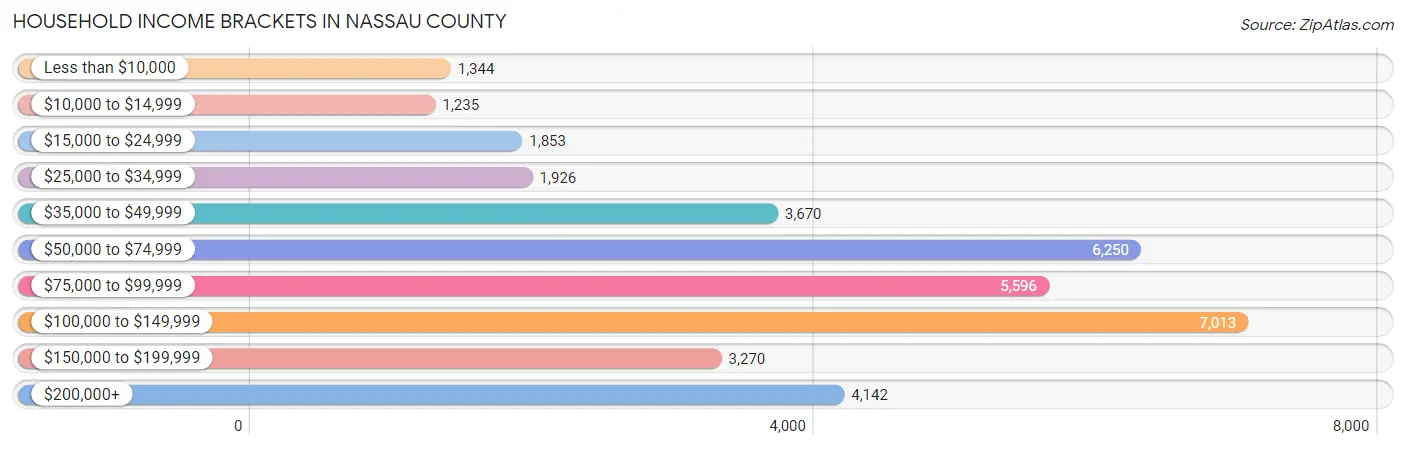
Household Income Brackets in Nassau County
With 7,013 households falling in the category, the $100,000 to $149,999 income range is the most frequent in Nassau County, accounting for 19.3% of all households. In contrast, only 1,235 households (3.4%) fall into the $10,000 to $14,999 income bracket, making it the least populous group.
| Income Bracket | # Households | % Households |
| Less than $10,000 | 1,344 | 3.7% |
| $10,000 to $14,999 | 1,235 | 3.4% |
| $15,000 to $24,999 | 1,853 | 5.1% |
| $25,000 to $34,999 | 1,926 | 5.3% |
| $35,000 to $49,999 | 3,670 | 10.1% |
| $50,000 to $74,999 | 6,250 | 17.2% |
| $75,000 to $99,999 | 5,596 | 15.4% |
| $100,000 to $149,999 | 7,013 | 19.3% |
| $150,000 to $199,999 | 3,270 | 9.0% |
| $200,000+ | 4,142 | 11.4% |
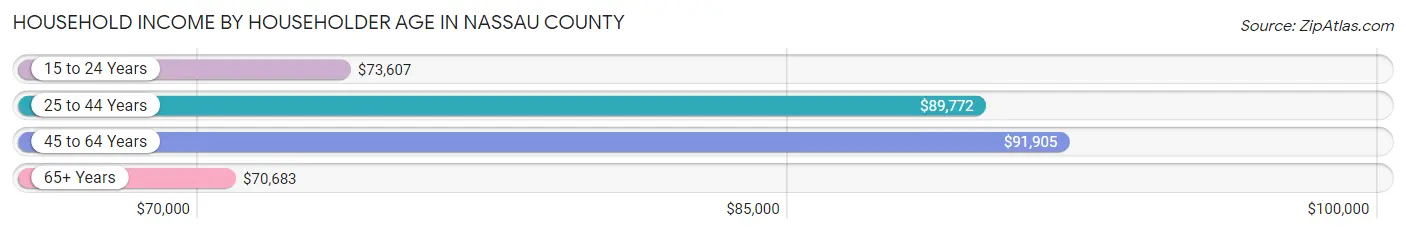
Household Income by Householder Age in Nassau County
The median household income in Nassau County is $84,085, with the highest median household income of $91,905 found in the 45 to 64 years age bracket for the primary householder. A total of 14,076 households (38.7%) fall into this category. Meanwhile, the 65+ years age bracket for the primary householder has the lowest median household income of $70,683, with 12,193 households (33.6%) in this group.
| Income Bracket | # Households | Median Income |
| 15 to 24 Years | 673 (1.8%) | $73,607 |
| 25 to 44 Years | 9,394 (25.9%) | $89,772 |
| 45 to 64 Years | 14,076 (38.7%) | $91,905 |
| 65+ Years | 12,193 (33.6%) | $70,683 |
| Total | 36,336 (100.0%) | $84,085 |
Poverty in Nassau County
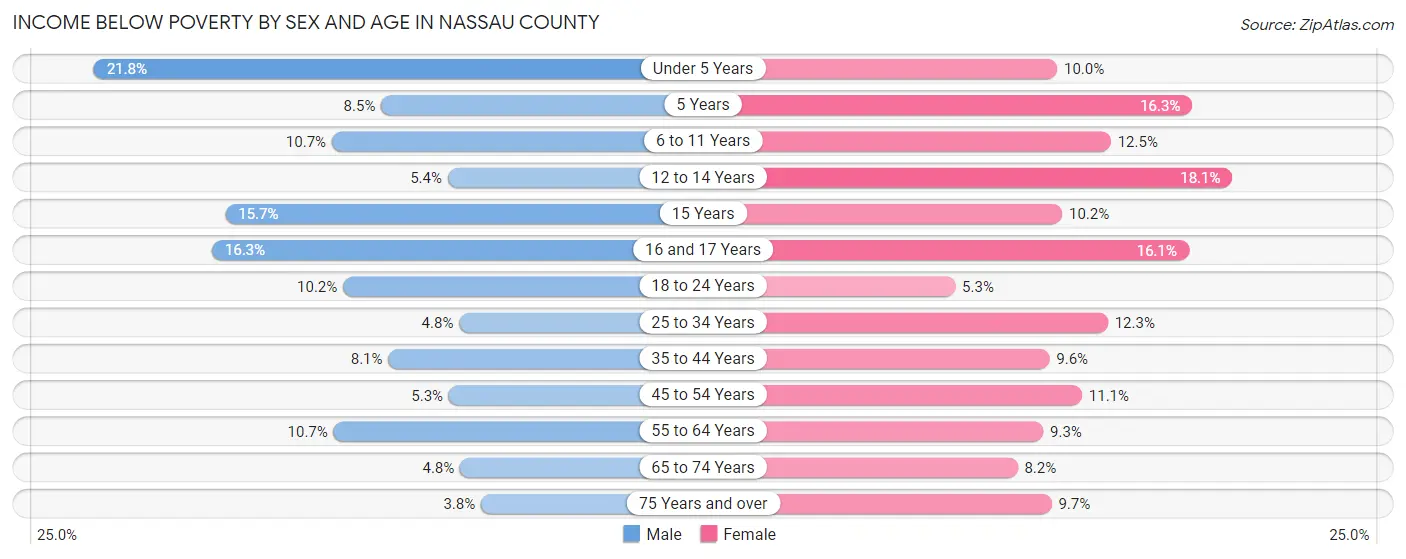
Income Below Poverty by Sex and Age in Nassau County
With 8.1% poverty level for males and 10.3% for females among the residents of Nassau County, under 5 year old males and 12 to 14 year old females are the most vulnerable to poverty, with 459 males (21.8%) and 251 females (18.1%) in their respective age groups living below the poverty level.
| Age Bracket | Male | Female |
| Under 5 Years | 459 (21.8%) | 217 (10.0%) |
| 5 Years | 49 (8.5%) | 86 (16.3%) |
| 6 to 11 Years | 315 (10.7%) | 398 (12.5%) |
| 12 to 14 Years | 87 (5.4%) | 251 (18.1%) |
| 15 Years | 86 (15.7%) | 60 (10.2%) |
| 16 and 17 Years | 196 (16.3%) | 124 (16.1%) |
| 18 to 24 Years | 303 (10.2%) | 148 (5.3%) |
| 25 to 34 Years | 236 (4.8%) | 618 (12.3%) |
| 35 to 44 Years | 445 (8.1%) | 494 (9.6%) |
| 45 to 54 Years | 316 (5.3%) | 665 (11.1%) |
| 55 to 64 Years | 715 (10.7%) | 683 (9.3%) |
| 65 to 74 Years | 289 (4.8%) | 536 (8.2%) |
| 75 Years and over | 146 (3.8%) | 421 (9.7%) |
| Total | 3,642 (8.1%) | 4,701 (10.3%) |
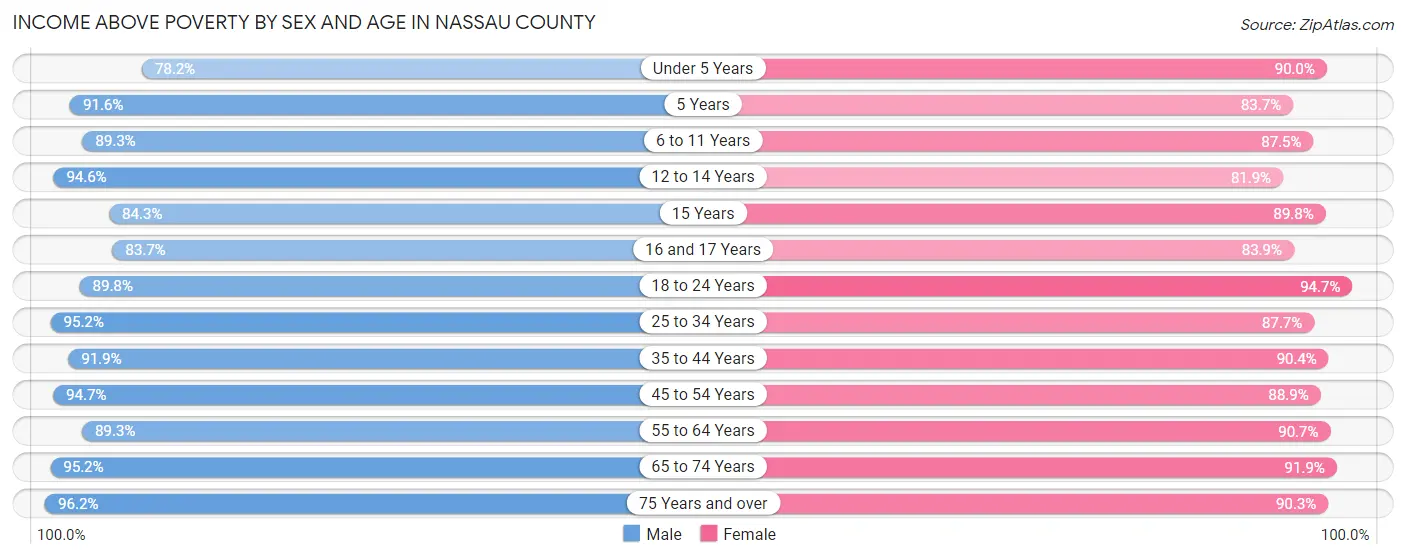
Income Above Poverty by Sex and Age in Nassau County
According to the poverty statistics in Nassau County, males aged 75 years and over and females aged 18 to 24 years are the age groups that are most secure financially, with 96.2% of males and 94.7% of females in these age groups living above the poverty line.
| Age Bracket | Male | Female |
| Under 5 Years | 1,647 (78.2%) | 1,956 (90.0%) |
| 5 Years | 531 (91.5%) | 443 (83.7%) |
| 6 to 11 Years | 2,617 (89.3%) | 2,791 (87.5%) |
| 12 to 14 Years | 1,537 (94.6%) | 1,134 (81.9%) |
| 15 Years | 462 (84.3%) | 527 (89.8%) |
| 16 and 17 Years | 1,006 (83.7%) | 646 (83.9%) |
| 18 to 24 Years | 2,661 (89.8%) | 2,666 (94.7%) |
| 25 to 34 Years | 4,648 (95.2%) | 4,391 (87.7%) |
| 35 to 44 Years | 5,036 (91.9%) | 4,638 (90.4%) |
| 45 to 54 Years | 5,630 (94.7%) | 5,305 (88.9%) |
| 55 to 64 Years | 5,995 (89.3%) | 6,630 (90.7%) |
| 65 to 74 Years | 5,748 (95.2%) | 6,042 (91.8%) |
| 75 Years and over | 3,677 (96.2%) | 3,907 (90.3%) |
| Total | 41,195 (91.9%) | 41,076 (89.7%) |
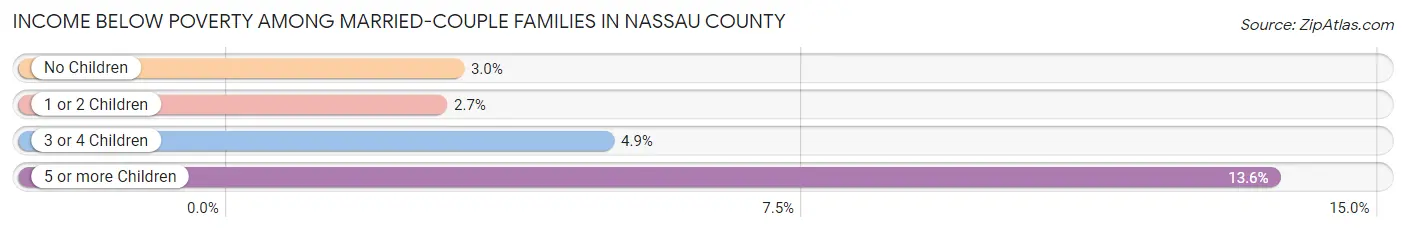
Income Below Poverty Among Married-Couple Families in Nassau County
The poverty statistics for married-couple families in Nassau County show that 3.1% or 650 of the total 20,829 families live below the poverty line. Families with 5 or more children have the highest poverty rate of 13.6%, comprising of 23 families. On the other hand, families with 1 or 2 children have the lowest poverty rate of 2.7%, which includes 144 families.
| Children | Above Poverty | Below Poverty |
| No Children | 13,465 (97.1%) | 409 (2.9%) |
| 1 or 2 Children | 5,136 (97.3%) | 144 (2.7%) |
| 3 or 4 Children | 1,432 (95.1%) | 74 (4.9%) |
| 5 or more Children | 146 (86.4%) | 23 (13.6%) |
| Total | 20,179 (96.9%) | 650 (3.1%) |
Income Below Poverty Among Single-Parent Households in Nassau County
According to the poverty data in Nassau County, 3.6% or 70 single-father households and 31.1% or 1,145 single-mother households are living below the poverty line. Among single-father households, those with 1 or 2 children have the highest poverty rate, with 58 households (6.6%) experiencing poverty. Likewise, among single-mother households, those with 3 or 4 children have the highest poverty rate, with 322 households (64.5%) falling below the poverty line.
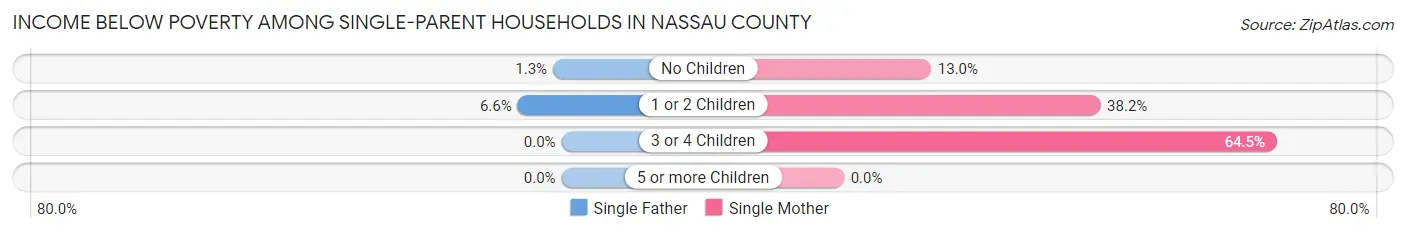
| Children | Single Father | Single Mother |
| No Children | 12 (1.3%) | 203 (13.0%) |
| 1 or 2 Children | 58 (6.6%) | 620 (38.2%) |
| 3 or 4 Children | 0 (0.0%) | 322 (64.5%) |
| 5 or more Children | 0 (0.0%) | 0 (0.0%) |
| Total | 70 (3.6%) | 1,145 (31.1%) |
Income Below Poverty Among Married-Couple vs Single-Parent Households in Nassau County
The poverty data for Nassau County shows that 650 of the married-couple family households (3.1%) and 1,215 of the single-parent households (21.7%) are living below the poverty level. Within the married-couple family households, those with 5 or more children have the highest poverty rate, with 23 households (13.6%) falling below the poverty line. Among the single-parent households, those with 3 or 4 children have the highest poverty rate, with 322 household (54.7%) living below poverty.
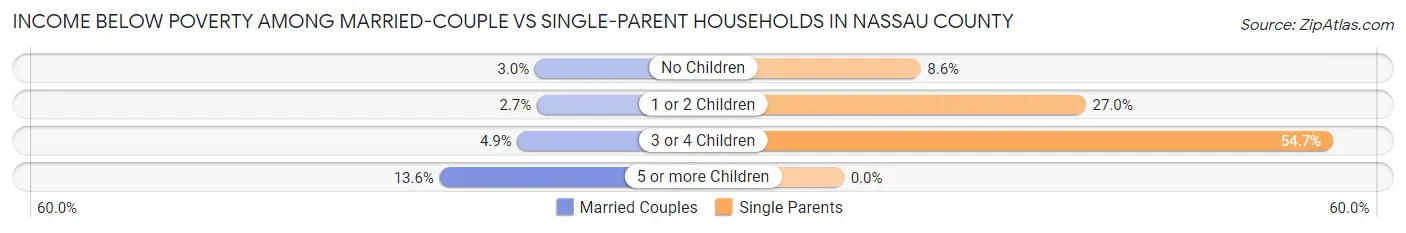
| Children | Married-Couple Families | Single-Parent Households |
| No Children | 409 (2.9%) | 215 (8.6%) |
| 1 or 2 Children | 144 (2.7%) | 678 (27.0%) |
| 3 or 4 Children | 74 (4.9%) | 322 (54.7%) |
| 5 or more Children | 23 (13.6%) | 0 (0.0%) |
| Total | 650 (3.1%) | 1,215 (21.7%) |
Race in Nassau County
The most populous races in Nassau County are White / Caucasian (80,013 | 87.4%), Black / African American (5,013 | 5.5%), and Hispanic or Latino (4,579 | 5.0%).
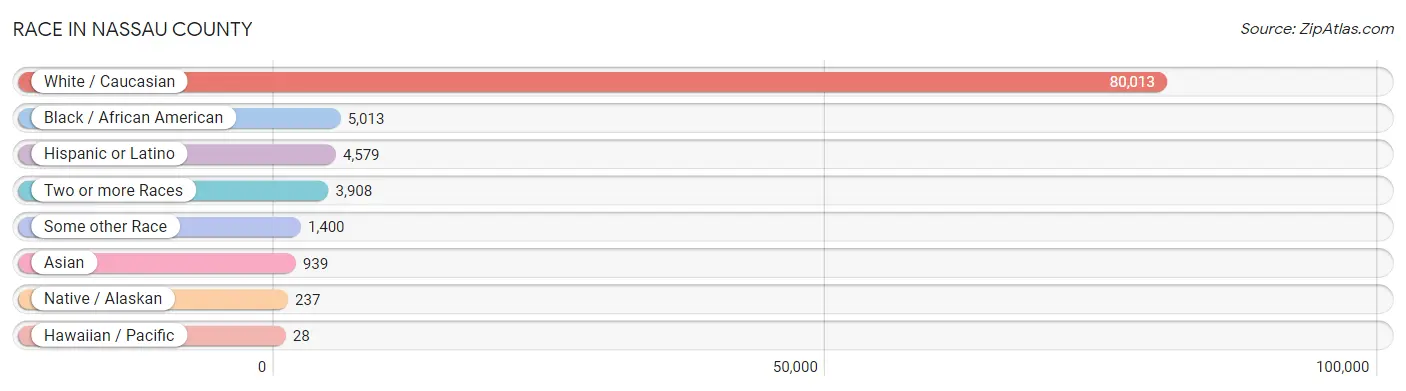
| Race | # Population | % Population |
| Asian | 939 | 1.0% |
| Black / African American | 5,013 | 5.5% |
| Hawaiian / Pacific | 28 | 0.0% |
| Hispanic or Latino | 4,579 | 5.0% |
| Native / Alaskan | 237 | 0.3% |
| White / Caucasian | 80,013 | 87.4% |
| Two or more Races | 3,908 | 4.3% |
| Some other Race | 1,400 | 1.5% |
| Total | 91,538 | 100.0% |
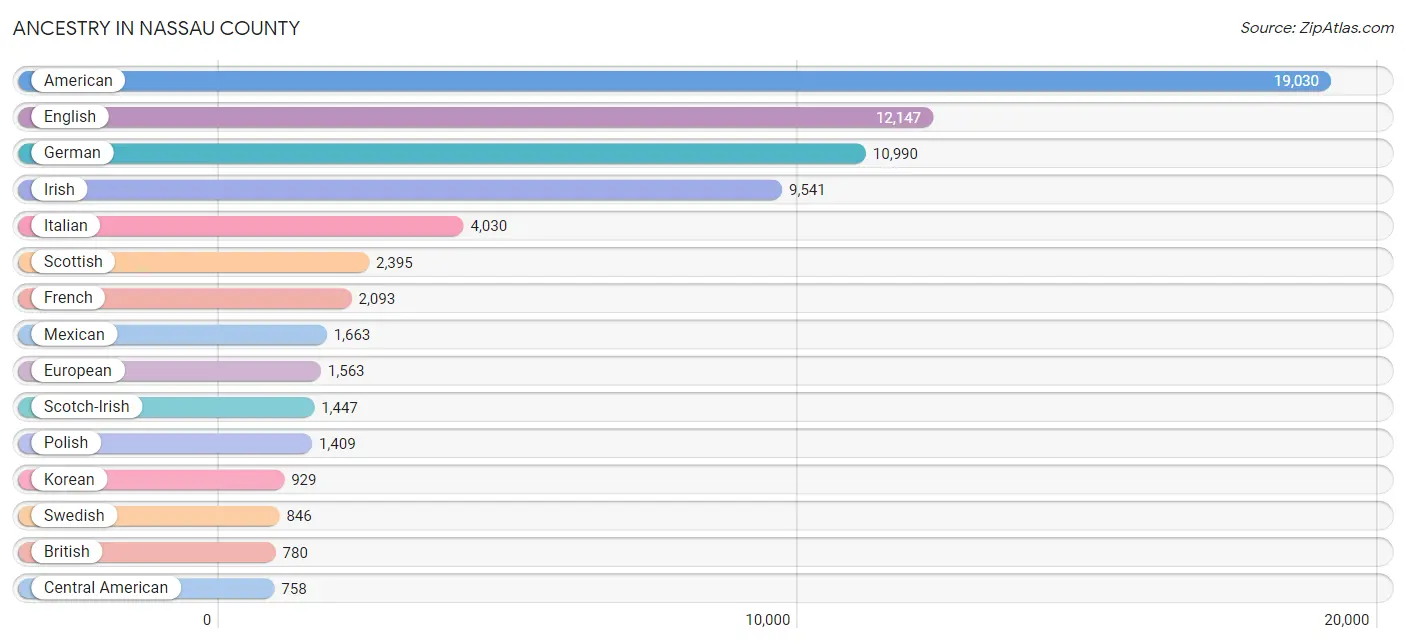
Ancestry in Nassau County
The most populous ancestries reported in Nassau County are American (19,030 | 20.8%), English (12,147 | 13.3%), German (10,990 | 12.0%), Irish (9,541 | 10.4%), and Italian (4,030 | 4.4%), together accounting for 60.9% of all Nassau County residents.
| Ancestry | # Population | % Population |
| African | 116 | 0.1% |
| American | 19,030 | 20.8% |
| Apache | 44 | 0.1% |
| Arab | 154 | 0.2% |
| Argentinean | 98 | 0.1% |
| Austrian | 99 | 0.1% |
| Bahamian | 25 | 0.0% |
| Barbadian | 20 | 0.0% |
| Basque | 20 | 0.0% |
| Belgian | 149 | 0.2% |
| Bhutanese | 24 | 0.0% |
| Blackfeet | 11 | 0.0% |
| Bolivian | 6 | 0.0% |
| Brazilian | 45 | 0.1% |
| British | 780 | 0.9% |
| Burmese | 125 | 0.1% |
| Canadian | 182 | 0.2% |
| Cape Verdean | 11 | 0.0% |
| Celtic | 9 | 0.0% |
| Central American | 758 | 0.8% |
| Central American Indian | 13 | 0.0% |
| Cherokee | 122 | 0.1% |
| Chilean | 15 | 0.0% |
| Choctaw | 7 | 0.0% |
| Colombian | 191 | 0.2% |
| Costa Rican | 293 | 0.3% |
| Creek | 78 | 0.1% |
| Croatian | 96 | 0.1% |
| Cuban | 352 | 0.4% |
| Cypriot | 94 | 0.1% |
| Czech | 259 | 0.3% |
| Czechoslovakian | 27 | 0.0% |
| Danish | 138 | 0.2% |
| Dominican | 59 | 0.1% |
| Dutch | 542 | 0.6% |
| Dutch West Indian | 64 | 0.1% |
| Eastern European | 109 | 0.1% |
| Ecuadorian | 11 | 0.0% |
| English | 12,147 | 13.3% |
| Estonian | 15 | 0.0% |
| European | 1,563 | 1.7% |
| Finnish | 206 | 0.2% |
| French | 2,093 | 2.3% |
| French Canadian | 273 | 0.3% |
| German | 10,990 | 12.0% |
| German Russian | 6 | 0.0% |
| Greek | 191 | 0.2% |
| Guamanian / Chamorro | 21 | 0.0% |
| Guatemalan | 45 | 0.1% |
| Haitian | 35 | 0.0% |
| Honduran | 21 | 0.0% |
| Hungarian | 718 | 0.8% |
| Icelander | 9 | 0.0% |
| Indian (Asian) | 286 | 0.3% |
| Iranian | 55 | 0.1% |
| Irish | 9,541 | 10.4% |
| Iroquois | 20 | 0.0% |
| Italian | 4,030 | 4.4% |
| Jamaican | 69 | 0.1% |
| Korean | 929 | 1.0% |
| Laotian | 22 | 0.0% |
| Lebanese | 82 | 0.1% |
| Lithuanian | 188 | 0.2% |
| Mexican | 1,663 | 1.8% |
| Mexican American Indian | 1 | 0.0% |
| Native Hawaiian | 41 | 0.0% |
| Nicaraguan | 116 | 0.1% |
| Nigerian | 43 | 0.1% |
| Northern European | 267 | 0.3% |
| Norwegian | 529 | 0.6% |
| Panamanian | 67 | 0.1% |
| Pennsylvania German | 24 | 0.0% |
| Polish | 1,409 | 1.5% |
| Portuguese | 113 | 0.1% |
| Puerto Rican | 755 | 0.8% |
| Romanian | 17 | 0.0% |
| Russian | 268 | 0.3% |
| Salvadoran | 127 | 0.1% |
| Scandinavian | 275 | 0.3% |
| Scotch-Irish | 1,447 | 1.6% |
| Scottish | 2,395 | 2.6% |
| Seminole | 9 | 0.0% |
| Slovak | 334 | 0.4% |
| Slovene | 9 | 0.0% |
| South American | 416 | 0.4% |
| South American Indian | 54 | 0.1% |
| Spaniard | 307 | 0.3% |
| Spanish | 181 | 0.2% |
| Sri Lankan | 36 | 0.0% |
| Subsaharan African | 170 | 0.2% |
| Swedish | 846 | 0.9% |
| Swiss | 278 | 0.3% |
| Syrian | 72 | 0.1% |
| Thai | 236 | 0.3% |
| Trinidadian and Tobagonian | 20 | 0.0% |
| Turkish | 27 | 0.0% |
| Ukrainian | 336 | 0.4% |
| Uruguayan | 46 | 0.1% |
| Venezuelan | 49 | 0.1% |
| Welsh | 377 | 0.4% | View All 100 Rows |
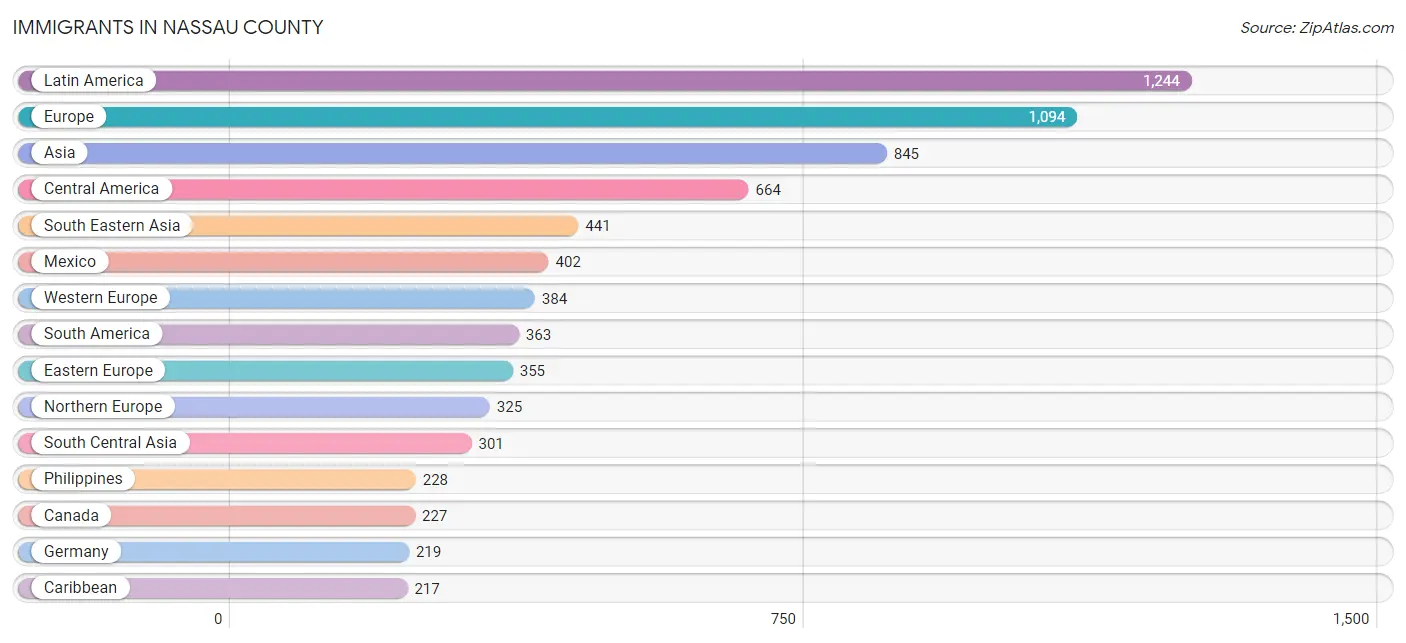
Immigrants in Nassau County
The most numerous immigrant groups reported in Nassau County came from Latin America (1,244 | 1.4%), Europe (1,094 | 1.2%), Asia (845 | 0.9%), Central America (664 | 0.7%), and South Eastern Asia (441 | 0.5%), together accounting for 4.7% of all Nassau County residents.
| Immigration Origin | # Population | % Population |
| Africa | 111 | 0.1% |
| Argentina | 52 | 0.1% |
| Asia | 845 | 0.9% |
| Australia | 48 | 0.1% |
| Bahamas | 22 | 0.0% |
| Bangladesh | 100 | 0.1% |
| Bolivia | 6 | 0.0% |
| Brazil | 92 | 0.1% |
| Cabo Verde | 12 | 0.0% |
| Canada | 227 | 0.3% |
| Caribbean | 217 | 0.2% |
| Central America | 664 | 0.7% |
| China | 63 | 0.1% |
| Colombia | 132 | 0.1% |
| Costa Rica | 29 | 0.0% |
| Croatia | 61 | 0.1% |
| Cuba | 136 | 0.2% |
| Czechoslovakia | 152 | 0.2% |
| Denmark | 10 | 0.0% |
| Dominican Republic | 32 | 0.0% |
| Eastern Asia | 90 | 0.1% |
| Eastern Europe | 355 | 0.4% |
| Ecuador | 11 | 0.0% |
| El Salvador | 42 | 0.1% |
| England | 87 | 0.1% |
| Europe | 1,094 | 1.2% |
| France | 67 | 0.1% |
| Germany | 219 | 0.2% |
| Ghana | 72 | 0.1% |
| Guatemala | 47 | 0.1% |
| Haiti | 23 | 0.0% |
| Honduras | 24 | 0.0% |
| Hong Kong | 46 | 0.1% |
| Hungary | 18 | 0.0% |
| India | 129 | 0.1% |
| Indonesia | 22 | 0.0% |
| Iran | 43 | 0.1% |
| Ireland | 86 | 0.1% |
| Italy | 17 | 0.0% |
| Japan | 5 | 0.0% |
| Korea | 22 | 0.0% |
| Latin America | 1,244 | 1.4% |
| Malaysia | 94 | 0.1% |
| Mexico | 402 | 0.4% |
| Netherlands | 65 | 0.1% |
| Nicaragua | 55 | 0.1% |
| Northern Europe | 325 | 0.4% |
| Oceania | 57 | 0.1% |
| Pakistan | 29 | 0.0% |
| Panama | 19 | 0.0% |
| Philippines | 228 | 0.3% |
| Poland | 23 | 0.0% |
| Portugal | 13 | 0.0% |
| Romania | 34 | 0.0% |
| Russia | 33 | 0.0% |
| Scotland | 9 | 0.0% |
| Singapore | 61 | 0.1% |
| South Africa | 27 | 0.0% |
| South America | 363 | 0.4% |
| South Central Asia | 301 | 0.3% |
| South Eastern Asia | 441 | 0.5% |
| Southern Europe | 30 | 0.0% |
| Sweden | 15 | 0.0% |
| Switzerland | 33 | 0.0% |
| Syria | 7 | 0.0% |
| Trinidad and Tobago | 4 | 0.0% |
| Turkey | 6 | 0.0% |
| Ukraine | 34 | 0.0% |
| Uruguay | 35 | 0.0% |
| Venezuela | 35 | 0.0% |
| Vietnam | 36 | 0.0% |
| Western Africa | 84 | 0.1% |
| Western Asia | 13 | 0.0% |
| Western Europe | 384 | 0.4% | View All 74 Rows |
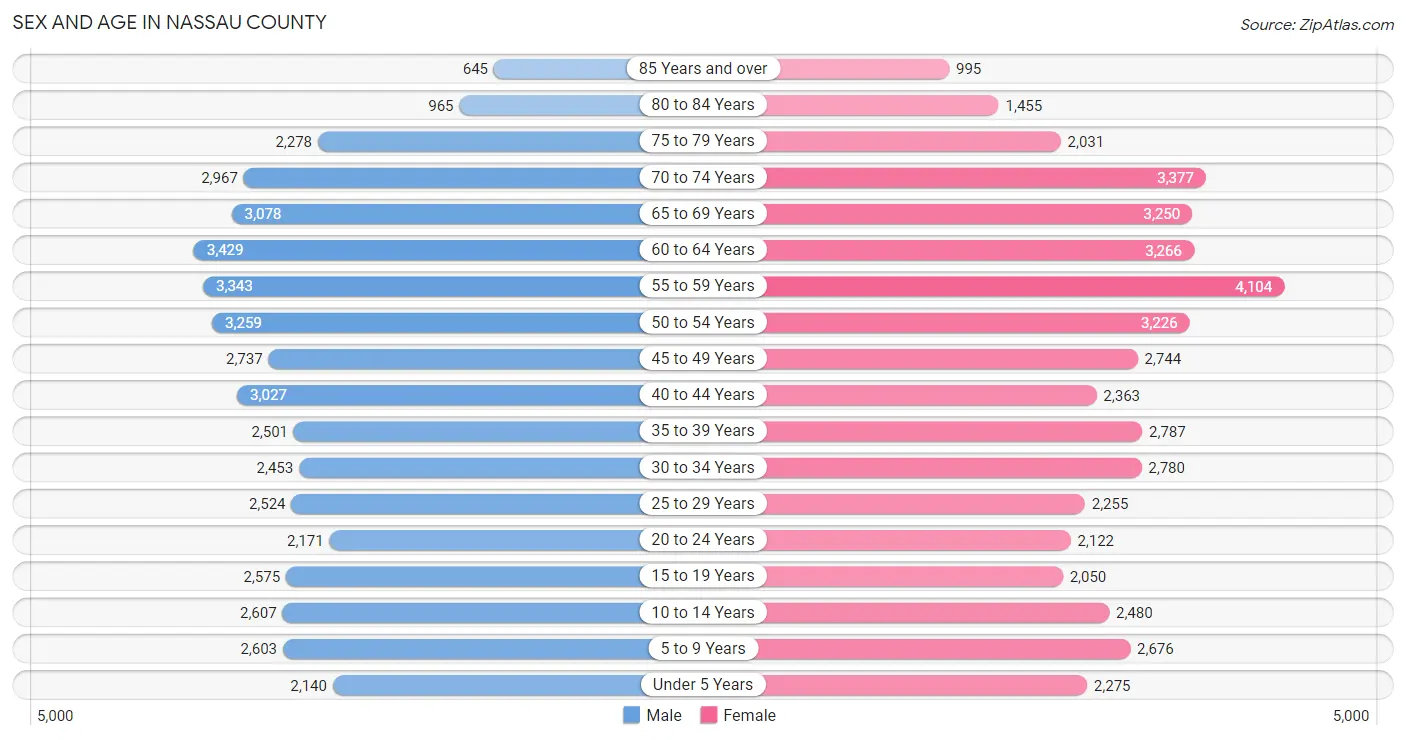
Sex and Age in Nassau County
Sex and Age in Nassau County
The most populous age groups in Nassau County are 60 to 64 Years (3,429 | 7.6%) for men and 55 to 59 Years (4,104 | 8.9%) for women.
| Age Bracket | Male | Female |
| Under 5 Years | 2,140 (4.7%) | 2,275 (4.9%) |
| 5 to 9 Years | 2,603 (5.8%) | 2,676 (5.8%) |
| 10 to 14 Years | 2,607 (5.8%) | 2,480 (5.4%) |
| 15 to 19 Years | 2,575 (5.7%) | 2,050 (4.4%) |
| 20 to 24 Years | 2,171 (4.8%) | 2,122 (4.6%) |
| 25 to 29 Years | 2,524 (5.6%) | 2,255 (4.9%) |
| 30 to 34 Years | 2,453 (5.4%) | 2,780 (6.0%) |
| 35 to 39 Years | 2,501 (5.5%) | 2,787 (6.0%) |
| 40 to 44 Years | 3,027 (6.7%) | 2,363 (5.1%) |
| 45 to 49 Years | 2,737 (6.0%) | 2,744 (5.9%) |
| 50 to 54 Years | 3,259 (7.2%) | 3,226 (7.0%) |
| 55 to 59 Years | 3,343 (7.4%) | 4,104 (8.9%) |
| 60 to 64 Years | 3,429 (7.6%) | 3,266 (7.1%) |
| 65 to 69 Years | 3,078 (6.8%) | 3,250 (7.0%) |
| 70 to 74 Years | 2,967 (6.6%) | 3,377 (7.3%) |
| 75 to 79 Years | 2,278 (5.0%) | 2,031 (4.4%) |
| 80 to 84 Years | 965 (2.1%) | 1,455 (3.2%) |
| 85 Years and over | 645 (1.4%) | 995 (2.1%) |
| Total | 45,302 (100.0%) | 46,236 (100.0%) |
Families and Households in Nassau County
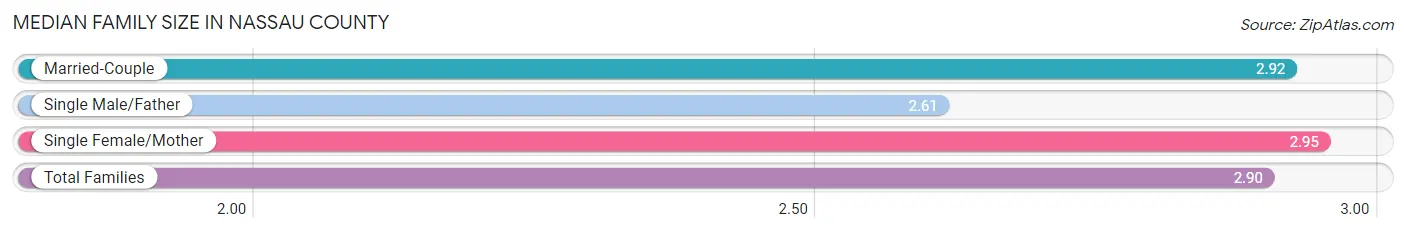
Median Family Size in Nassau County
The median family size in Nassau County is 2.90 persons per family, with single female/mother families (3,684 | 13.9%) accounting for the largest median family size of 2.95 persons per family. On the other hand, single male/father families (1,921 | 7.3%) represent the smallest median family size with 2.61 persons per family.
| Family Type | # Families | Family Size |
| Married-Couple | 20,829 (78.8%) | 2.92 |
| Single Male/Father | 1,921 (7.3%) | 2.61 |
| Single Female/Mother | 3,684 (13.9%) | 2.95 |
| Total Families | 26,434 (100.0%) | 2.90 |
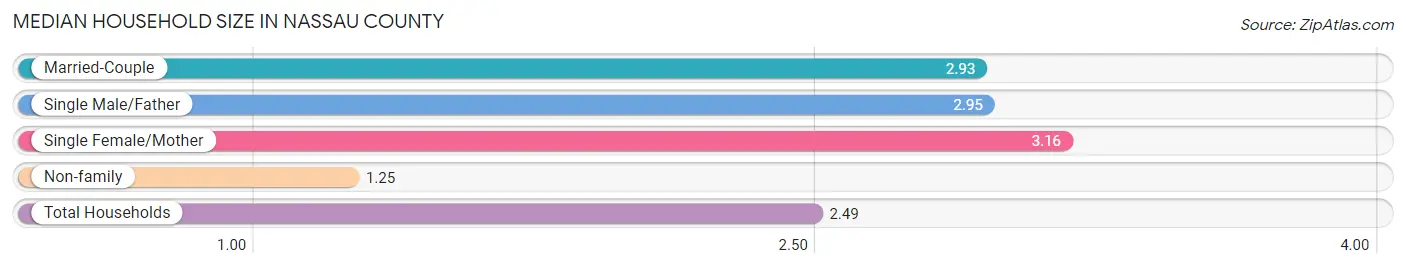
Median Household Size in Nassau County
The median household size in Nassau County is 2.49 persons per household, with single female/mother households (3,684 | 10.1%) accounting for the largest median household size of 3.16 persons per household. non-family households (9,902 | 27.3%) represent the smallest median household size with 1.25 persons per household.
| Household Type | # Households | Household Size |
| Married-Couple | 20,829 (57.3%) | 2.93 |
| Single Male/Father | 1,921 (5.3%) | 2.95 |
| Single Female/Mother | 3,684 (10.1%) | 3.16 |
| Non-family | 9,902 (27.3%) | 1.25 |
| Total Households | 36,336 (100.0%) | 2.49 |
Household Size by Marriage Status in Nassau County
Out of a total of 36,336 households in Nassau County, 26,434 (72.8%) are family households, while 9,902 (27.3%) are nonfamily households. The most numerous type of family households are 2-person households, comprising 14,125, and the most common type of nonfamily households are 1-person households, comprising 7,947.
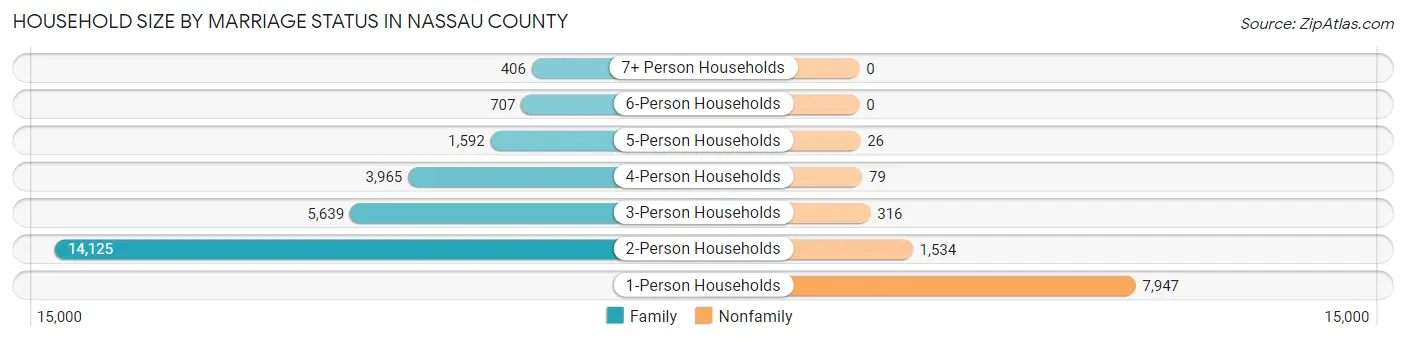
| Household Size | Family Households | Nonfamily Households |
| 1-Person Households | - | 7,947 (21.9%) |
| 2-Person Households | 14,125 (38.9%) | 1,534 (4.2%) |
| 3-Person Households | 5,639 (15.5%) | 316 (0.9%) |
| 4-Person Households | 3,965 (10.9%) | 79 (0.2%) |
| 5-Person Households | 1,592 (4.4%) | 26 (0.1%) |
| 6-Person Households | 707 (1.9%) | 0 (0.0%) |
| 7+ Person Households | 406 (1.1%) | 0 (0.0%) |
| Total | 26,434 (72.8%) | 9,902 (27.3%) |
Female Fertility in Nassau County
Fertility by Age in Nassau County
Average fertility rate in Nassau County is 41.0 births per 1,000 women. Women in the age bracket of 20 to 34 years have the highest fertility rate with 71.0 births per 1,000 women. Women in the age bracket of 20 to 34 years acount for 70.5% of all women with births.
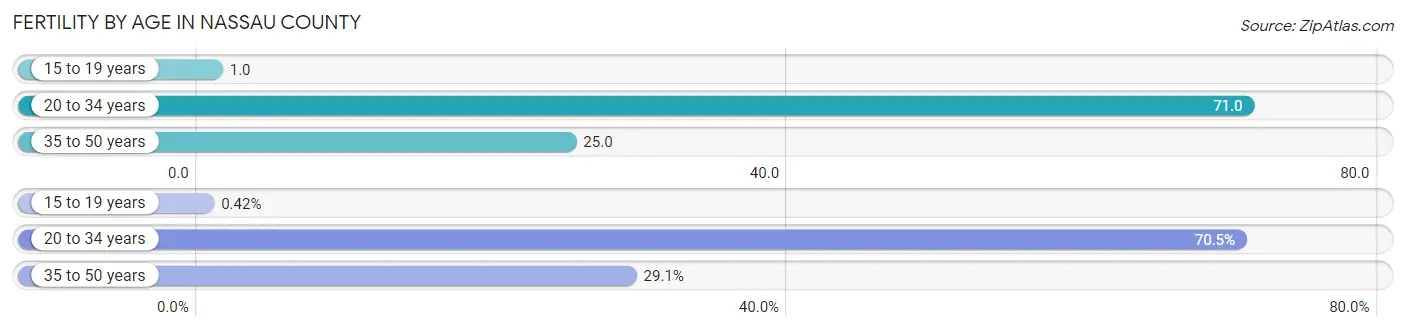
| Age Bracket | Women with Births | Births / 1,000 Women |
| 15 to 19 years | 3 (0.4%) | 1.0 |
| 20 to 34 years | 509 (70.5%) | 71.0 |
| 35 to 50 years | 210 (29.1%) | 25.0 |
| Total | 722 (100.0%) | 41.0 |
Fertility by Age by Marriage Status in Nassau County
54.0% of women with births (722) in Nassau County are married. The highest percentage of unmarried women with births falls into 15 to 19 years age bracket with 100.0% of them unmarried at the time of birth, while the lowest percentage of unmarried women with births belong to 35 to 50 years age bracket with 31.9% of them unmarried.
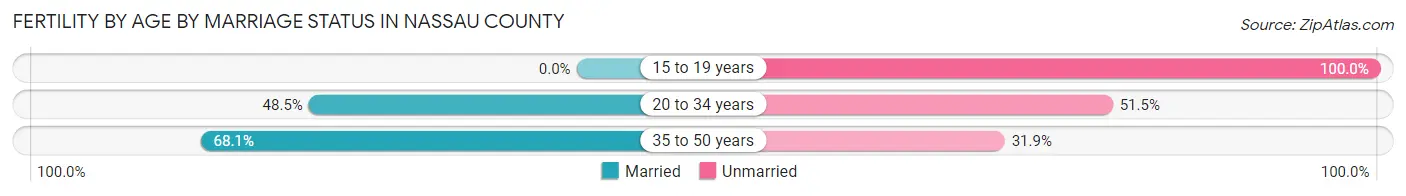
| Age Bracket | Married | Unmarried |
| 15 to 19 years | 0 (0.0%) | 3 (100.0%) |
| 20 to 34 years | 247 (48.5%) | 262 (51.5%) |
| 35 to 50 years | 143 (68.1%) | 67 (31.9%) |
| Total | 390 (54.0%) | 332 (46.0%) |
Fertility by Education in Nassau County
Average fertility rate in Nassau County is 41.0 births per 1,000 women. Women with the education attainment of college or associate's degree have the highest fertility rate of 65.0 births per 1,000 women, while women with the education attainment of bachelor's degree have the lowest fertility at 15.0 births per 1,000 women. Women with the education attainment of college or associate's degree represent 55.0% of all women with births.
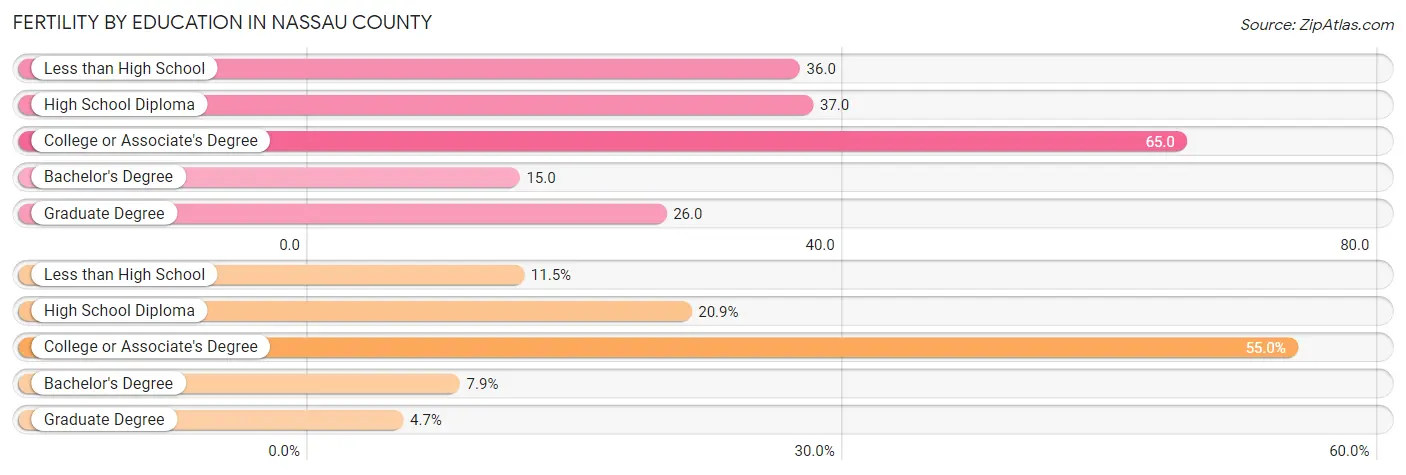
| Educational Attainment | Women with Births | Births / 1,000 Women |
| Less than High School | 83 (11.5%) | 36.0 |
| High School Diploma | 151 (20.9%) | 37.0 |
| College or Associate's Degree | 397 (55.0%) | 65.0 |
| Bachelor's Degree | 57 (7.9%) | 15.0 |
| Graduate Degree | 34 (4.7%) | 26.0 |
| Total | 722 (100.0%) | 41.0 |
Fertility by Education by Marriage Status in Nassau County
46.0% of women with births in Nassau County are unmarried. Women with the educational attainment of bachelor's degree are most likely to be married with 100.0% of them married at childbirth, while women with the educational attainment of less than high school are least likely to be married with 77.1% of them unmarried at childbirth.
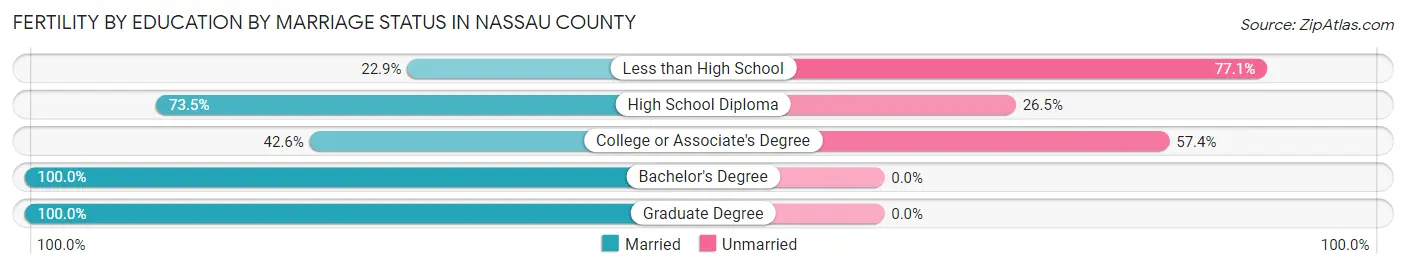
| Educational Attainment | Married | Unmarried |
| Less than High School | 19 (22.9%) | 64 (77.1%) |
| High School Diploma | 111 (73.5%) | 40 (26.5%) |
| College or Associate's Degree | 169 (42.6%) | 228 (57.4%) |
| Bachelor's Degree | 57 (100.0%) | 0 (0.0%) |
| Graduate Degree | 34 (100.0%) | 0 (0.0%) |
| Total | 390 (54.0%) | 332 (46.0%) |
Employment Characteristics in Nassau County
Employment by Class of Employer in Nassau County
Among the 41,279 employed individuals in Nassau County, private company employees (28,561 | 69.2%), local government employees (2,856 | 6.9%), and not-for-profit organizations (2,638 | 6.4%) make up the most common classes of employment.
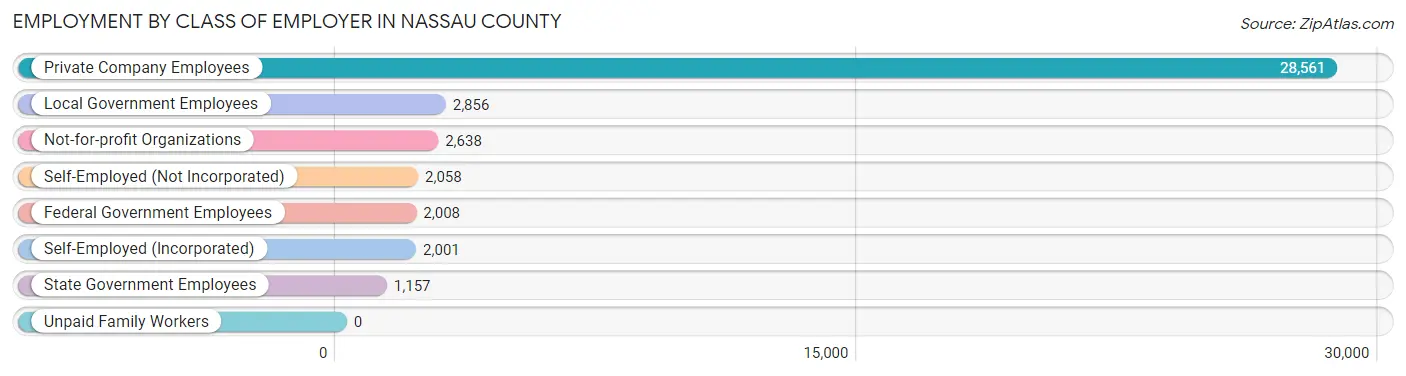
| Employer Class | # Employees | % Employees |
| Private Company Employees | 28,561 | 69.2% |
| Self-Employed (Incorporated) | 2,001 | 4.9% |
| Self-Employed (Not Incorporated) | 2,058 | 5.0% |
| Not-for-profit Organizations | 2,638 | 6.4% |
| Local Government Employees | 2,856 | 6.9% |
| State Government Employees | 1,157 | 2.8% |
| Federal Government Employees | 2,008 | 4.9% |
| Unpaid Family Workers | 0 | 0.0% |
| Total | 41,279 | 100.0% |
Employment Status by Age in Nassau County
According to the labor force statistics for Nassau County, out of the total population over 16 years of age (75,622), 57.7% or 43,634 individuals are in the labor force, with 4.1% or 1,789 of them unemployed. The age group with the highest labor force participation rate is 30 to 34 years, with 86.9% or 4,547 individuals in the labor force. Within the labor force, the 16 to 19 years age range has the highest percentage of unemployed individuals, with 8.8% or 135 of them being unemployed.
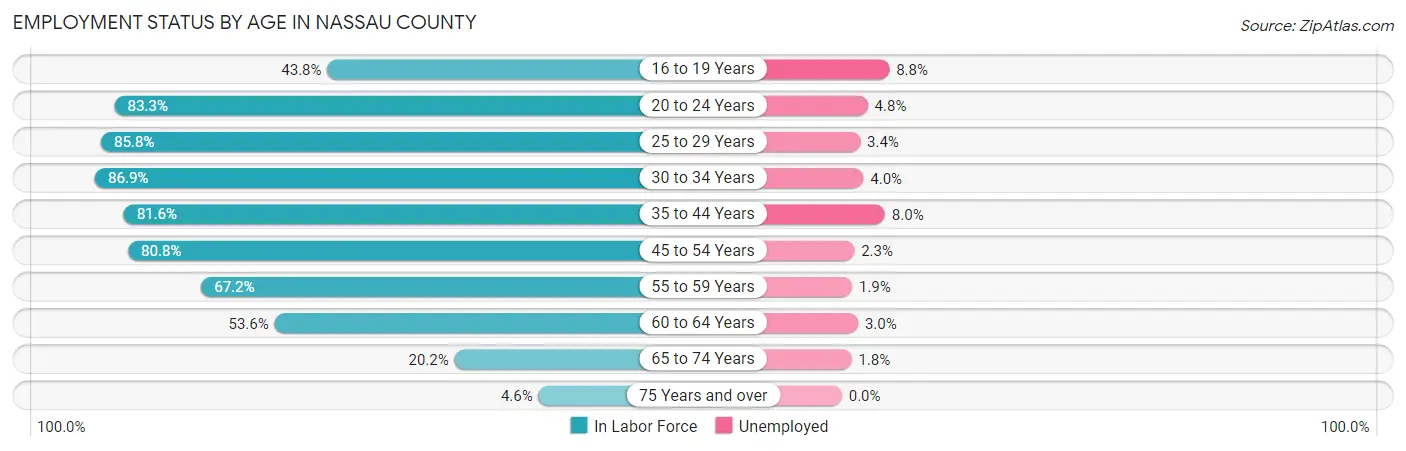
| Age Bracket | In Labor Force | Unemployed |
| 16 to 19 Years | 1,529 (43.8%) | 135 (8.8%) |
| 20 to 24 Years | 3,576 (83.3%) | 172 (4.8%) |
| 25 to 29 Years | 4,100 (85.8%) | 139 (3.4%) |
| 30 to 34 Years | 4,547 (86.9%) | 182 (4.0%) |
| 35 to 44 Years | 8,713 (81.6%) | 697 (8.0%) |
| 45 to 54 Years | 9,669 (80.8%) | 222 (2.3%) |
| 55 to 59 Years | 5,004 (67.2%) | 95 (1.9%) |
| 60 to 64 Years | 3,589 (53.6%) | 108 (3.0%) |
| 65 to 74 Years | 2,560 (20.2%) | 46 (1.8%) |
| 75 Years and over | 385 (4.6%) | 0 (0.0%) |
| Total | 43,634 (57.7%) | 1,789 (4.1%) |
Employment Status by Educational Attainment in Nassau County
According to labor force statistics for Nassau County, 76.1% of individuals (35,613) out of the total population between 25 and 64 years of age (46,798) are in the labor force, with 4.0% or 1,425 of them being unemployed. The group with the highest labor force participation rate are those with the educational attainment of bachelor's degree or higher, with 80.0% or 10,644 individuals in the labor force. Within the labor force, individuals with college / associate degree education have the highest percentage of unemployment, with 5.6% or 663 of them being unemployed.
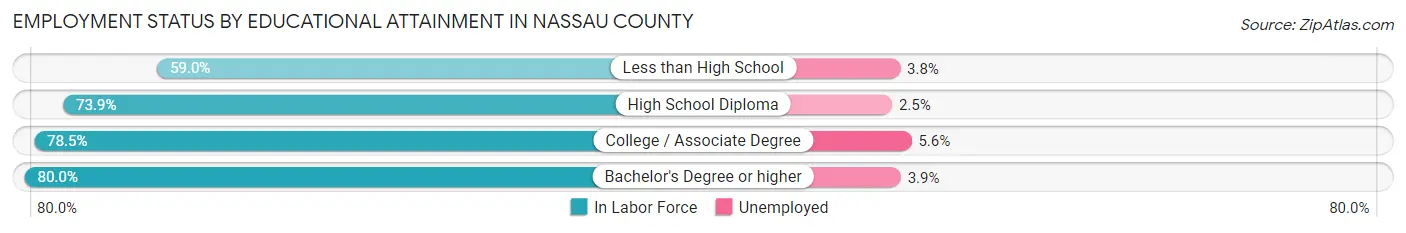
| Educational Attainment | In Labor Force | Unemployed |
| Less than High School | 1,906 (59.0%) | 123 (3.8%) |
| High School Diploma | 11,217 (73.9%) | 379 (2.5%) |
| College / Associate Degree | 11,841 (78.5%) | 845 (5.6%) |
| Bachelor's Degree or higher | 10,644 (80.0%) | 519 (3.9%) |
| Total | 35,613 (76.1%) | 1,872 (4.0%) |
Employment Occupations by Sex in Nassau County
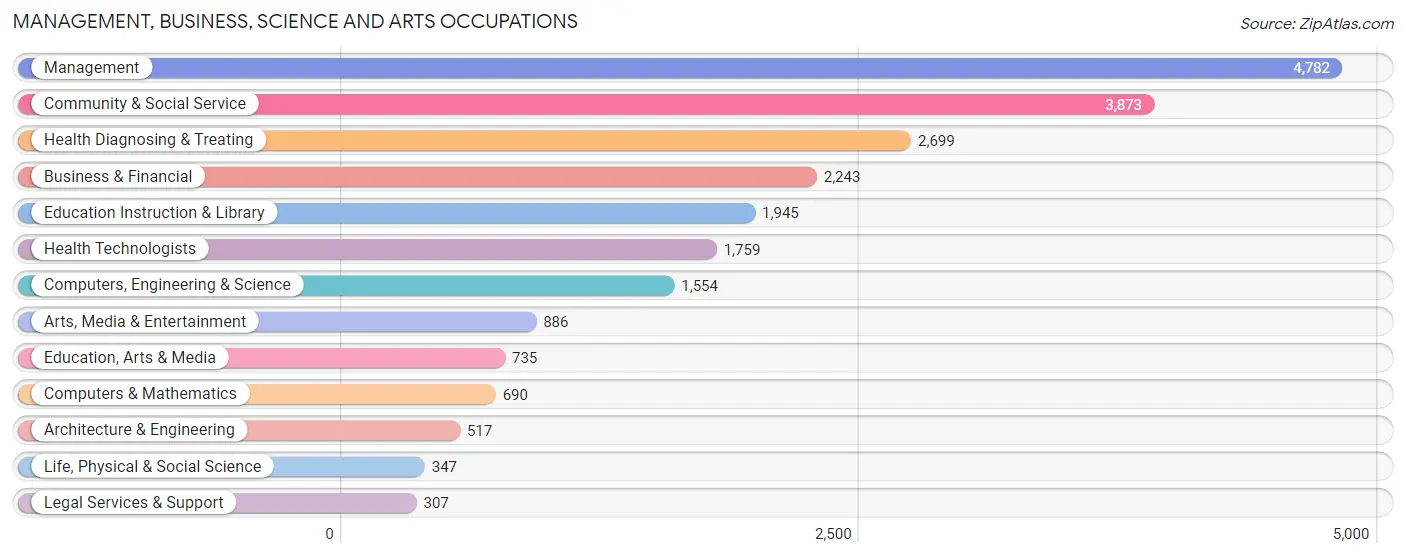
Management, Business, Science and Arts Occupations
The most common Management, Business, Science and Arts occupations in Nassau County are Management (4,782 | 11.6%), Community & Social Service (3,873 | 9.4%), Health Diagnosing & Treating (2,699 | 6.5%), Business & Financial (2,243 | 5.4%), and Education Instruction & Library (1,945 | 4.7%).
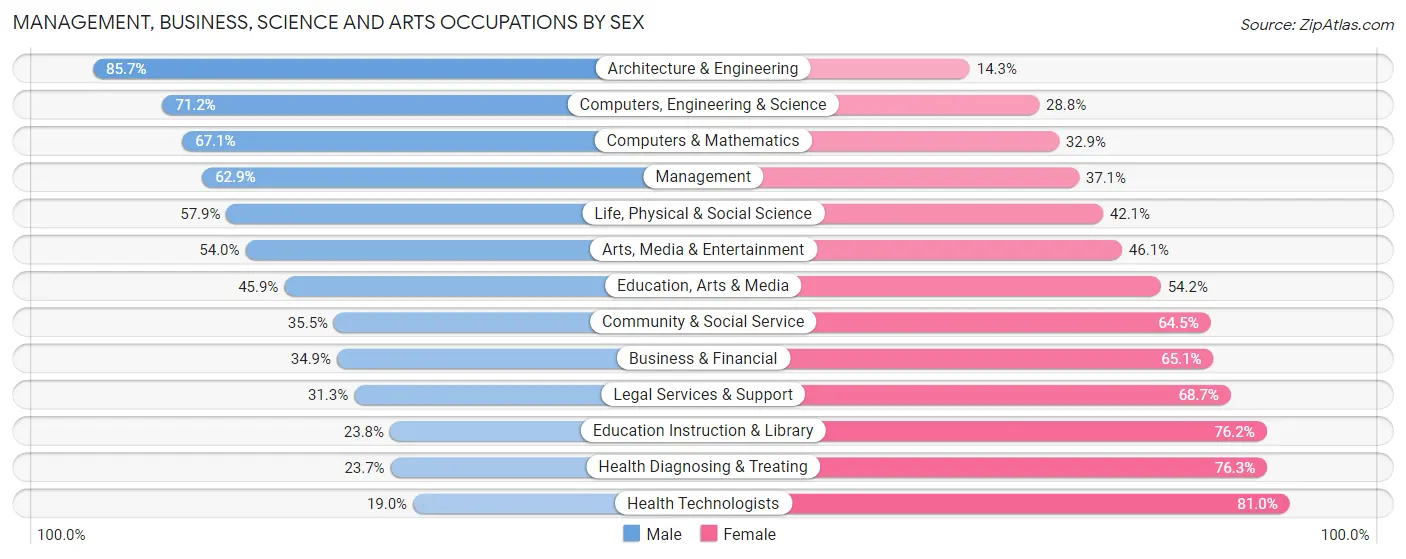
Management, Business, Science and Arts Occupations by Sex
Within the Management, Business, Science and Arts occupations in Nassau County, the most male-oriented occupations are Architecture & Engineering (85.7%), Computers, Engineering & Science (71.2%), and Computers & Mathematics (67.1%), while the most female-oriented occupations are Health Technologists (81.0%), Health Diagnosing & Treating (76.3%), and Education Instruction & Library (76.2%).
| Occupation | Male | Female |
| Management | 3,010 (62.9%) | 1,772 (37.1%) |
| Business & Financial | 782 (34.9%) | 1,461 (65.1%) |
| Computers, Engineering & Science | 1,107 (71.2%) | 447 (28.8%) |
| Computers & Mathematics | 463 (67.1%) | 227 (32.9%) |
| Architecture & Engineering | 443 (85.7%) | 74 (14.3%) |
| Life, Physical & Social Science | 201 (57.9%) | 146 (42.1%) |
| Community & Social Service | 1,374 (35.5%) | 2,499 (64.5%) |
| Education, Arts & Media | 337 (45.9%) | 398 (54.1%) |
| Legal Services & Support | 96 (31.3%) | 211 (68.7%) |
| Education Instruction & Library | 463 (23.8%) | 1,482 (76.2%) |
| Arts, Media & Entertainment | 478 (53.9%) | 408 (46.1%) |
| Health Diagnosing & Treating | 639 (23.7%) | 2,060 (76.3%) |
| Health Technologists | 334 (19.0%) | 1,425 (81.0%) |
| Total (Category) | 6,912 (45.6%) | 8,239 (54.4%) |
| Total (Overall) | 22,008 (53.2%) | 19,328 (46.8%) |
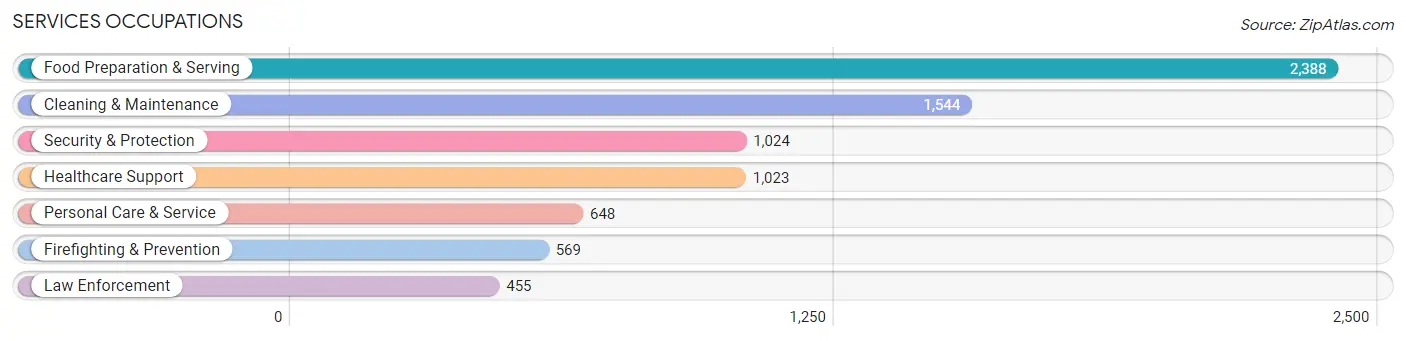
Services Occupations
The most common Services occupations in Nassau County are Food Preparation & Serving (2,388 | 5.8%), Cleaning & Maintenance (1,544 | 3.7%), Security & Protection (1,024 | 2.5%), Healthcare Support (1,023 | 2.5%), and Personal Care & Service (648 | 1.6%).
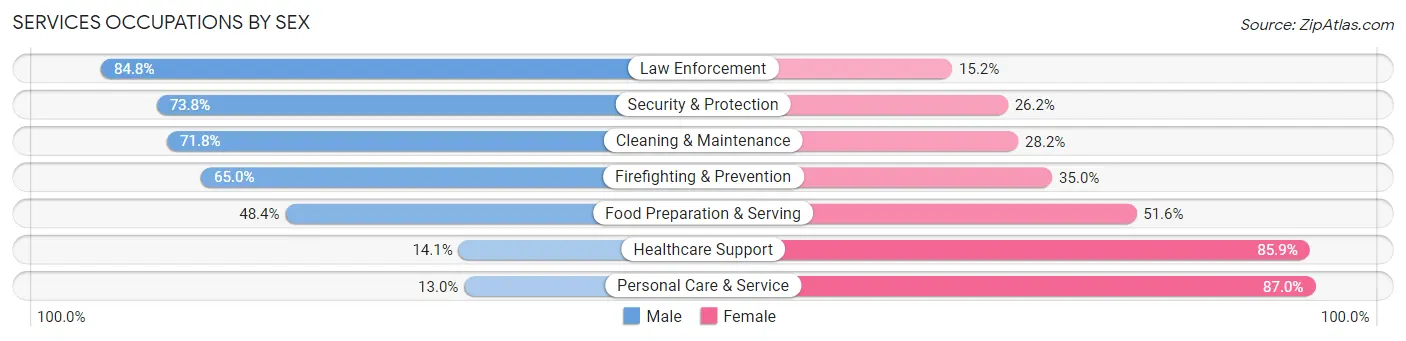
Services Occupations by Sex
Within the Services occupations in Nassau County, the most male-oriented occupations are Law Enforcement (84.8%), Security & Protection (73.8%), and Cleaning & Maintenance (71.8%), while the most female-oriented occupations are Personal Care & Service (87.0%), Healthcare Support (85.9%), and Food Preparation & Serving (51.6%).
| Occupation | Male | Female |
| Healthcare Support | 144 (14.1%) | 879 (85.9%) |
| Security & Protection | 756 (73.8%) | 268 (26.2%) |
| Firefighting & Prevention | 370 (65.0%) | 199 (35.0%) |
| Law Enforcement | 386 (84.8%) | 69 (15.2%) |
| Food Preparation & Serving | 1,155 (48.4%) | 1,233 (51.6%) |
| Cleaning & Maintenance | 1,108 (71.8%) | 436 (28.2%) |
| Personal Care & Service | 84 (13.0%) | 564 (87.0%) |
| Total (Category) | 3,247 (49.0%) | 3,380 (51.0%) |
| Total (Overall) | 22,008 (53.2%) | 19,328 (46.8%) |
Sales and Office Occupations
The most common Sales and Office occupations in Nassau County are Office & Administration (5,809 | 14.1%), and Sales & Related (3,829 | 9.3%).

Sales and Office Occupations by Sex

| Occupation | Male | Female |
| Sales & Related | 1,907 (49.8%) | 1,922 (50.2%) |
| Office & Administration | 1,071 (18.4%) | 4,738 (81.6%) |
| Total (Category) | 2,978 (30.9%) | 6,660 (69.1%) |
| Total (Overall) | 22,008 (53.2%) | 19,328 (46.8%) |
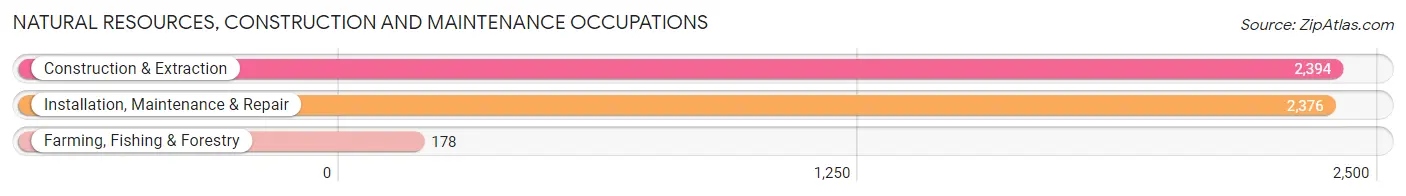
Natural Resources, Construction and Maintenance Occupations
The most common Natural Resources, Construction and Maintenance occupations in Nassau County are Construction & Extraction (2,394 | 5.8%), Installation, Maintenance & Repair (2,376 | 5.8%), and Farming, Fishing & Forestry (178 | 0.4%).
Natural Resources, Construction and Maintenance Occupations by Sex
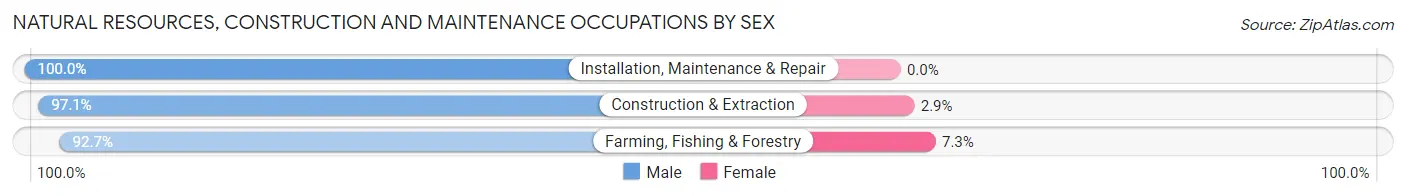
| Occupation | Male | Female |
| Farming, Fishing & Forestry | 165 (92.7%) | 13 (7.3%) |
| Construction & Extraction | 2,325 (97.1%) | 69 (2.9%) |
| Installation, Maintenance & Repair | 2,376 (100.0%) | 0 (0.0%) |
| Total (Category) | 4,866 (98.3%) | 82 (1.7%) |
| Total (Overall) | 22,008 (53.2%) | 19,328 (46.8%) |
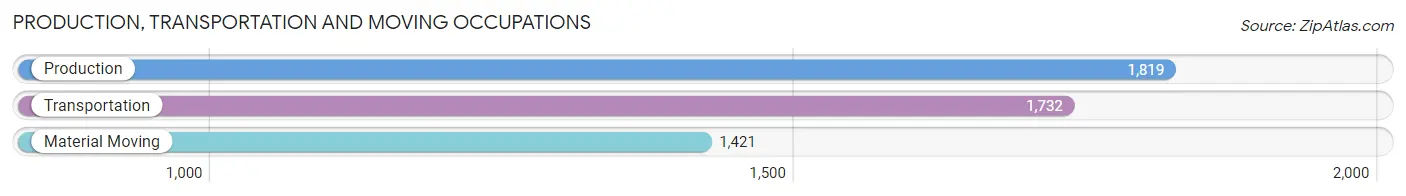
Production, Transportation and Moving Occupations
The most common Production, Transportation and Moving occupations in Nassau County are Production (1,819 | 4.4%), Transportation (1,732 | 4.2%), and Material Moving (1,421 | 3.4%).
Production, Transportation and Moving Occupations by Sex
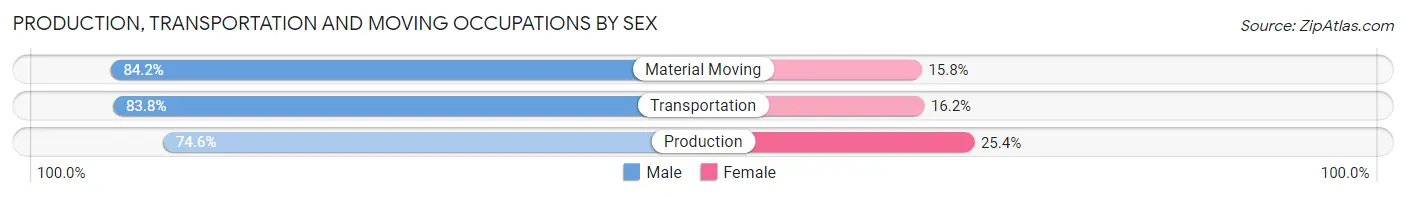
| Occupation | Male | Female |
| Production | 1,357 (74.6%) | 462 (25.4%) |
| Transportation | 1,451 (83.8%) | 281 (16.2%) |
| Material Moving | 1,197 (84.2%) | 224 (15.8%) |
| Total (Category) | 4,005 (80.5%) | 967 (19.5%) |
| Total (Overall) | 22,008 (53.2%) | 19,328 (46.8%) |
Employment Industries by Sex in Nassau County
Employment Industries in Nassau County
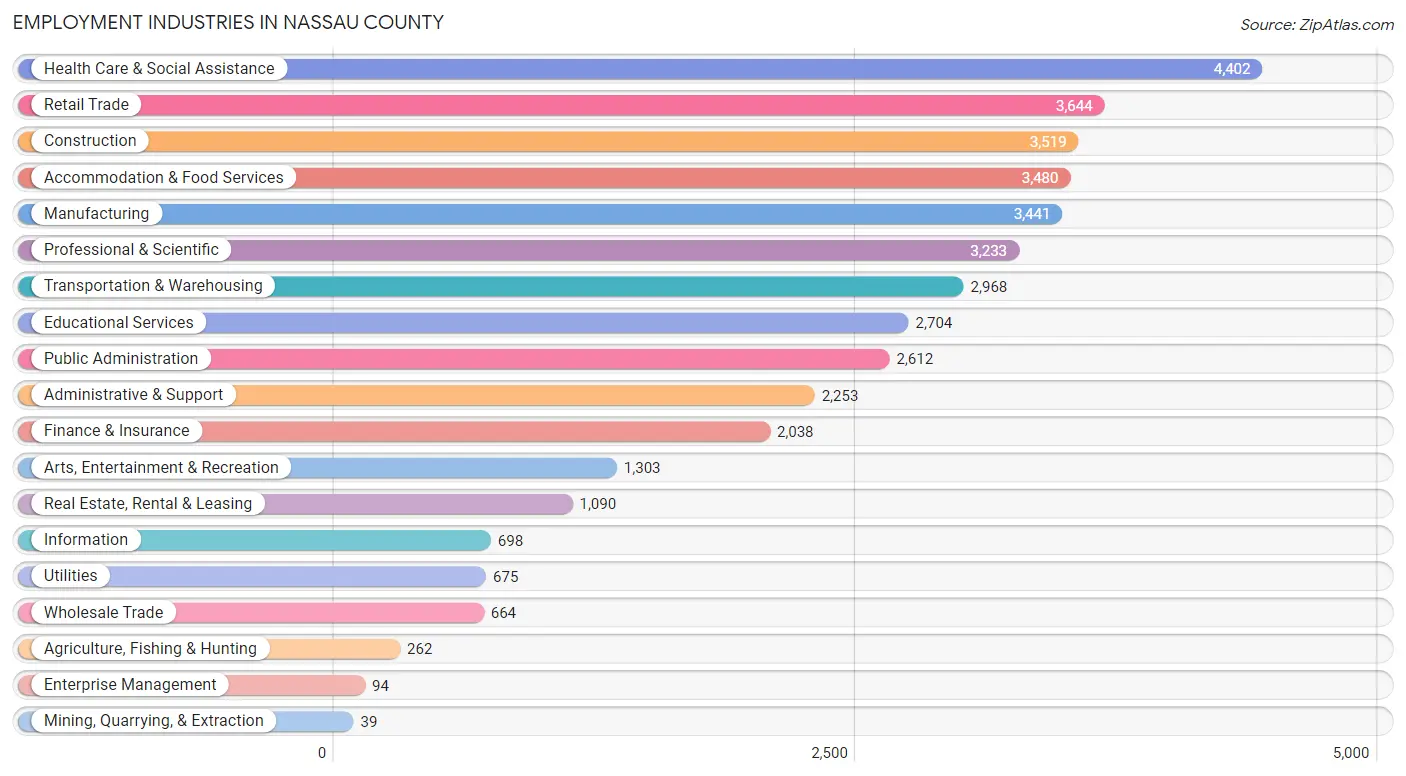
The major employment industries in Nassau County include Health Care & Social Assistance (4,402 | 10.6%), Retail Trade (3,644 | 8.8%), Construction (3,519 | 8.5%), Accommodation & Food Services (3,480 | 8.4%), and Manufacturing (3,441 | 8.3%).
Employment Industries by Sex in Nassau County
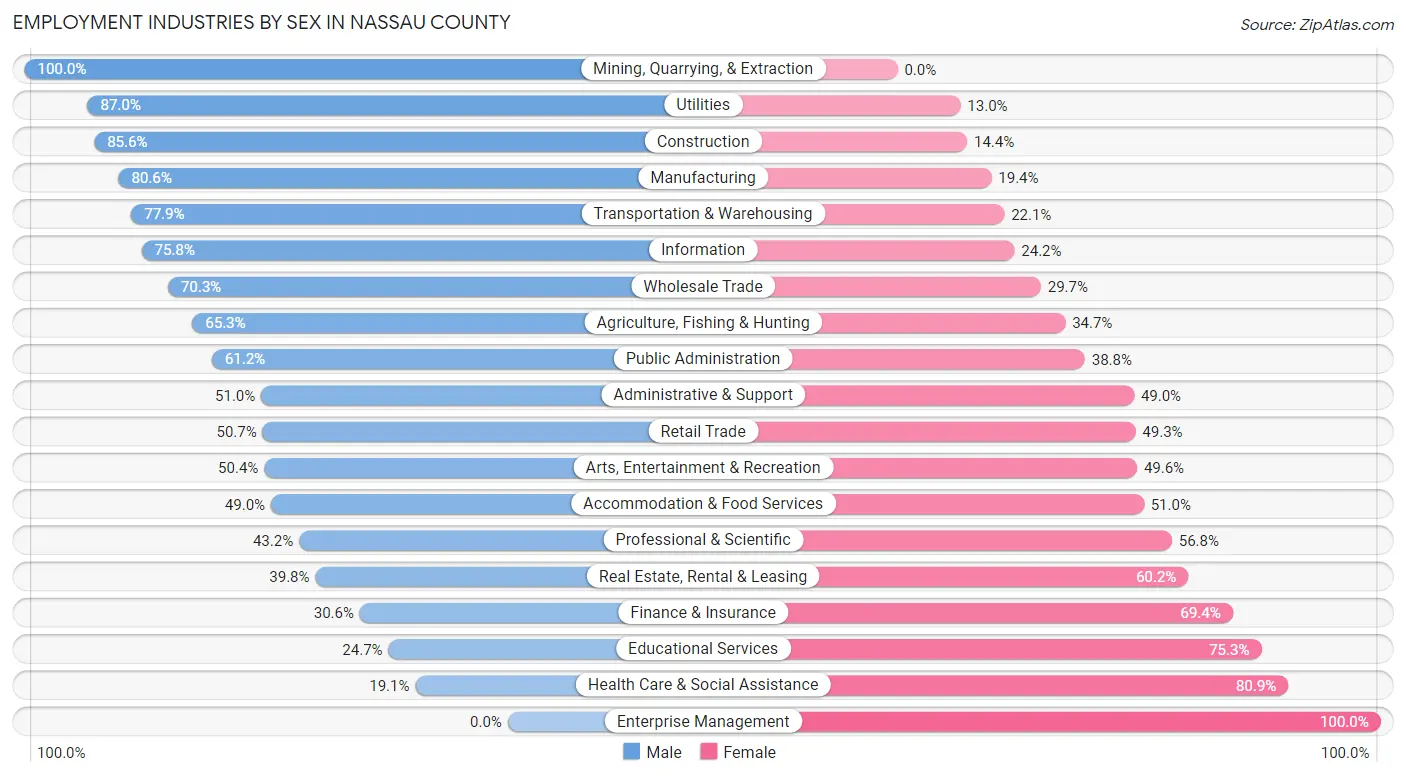
The Nassau County industries that see more men than women are Mining, Quarrying, & Extraction (100.0%), Utilities (87.0%), and Construction (85.6%), whereas the industries that tend to have a higher number of women are Enterprise Management (100.0%), Health Care & Social Assistance (80.9%), and Educational Services (75.3%).
| Industry | Male | Female |
| Agriculture, Fishing & Hunting | 171 (65.3%) | 91 (34.7%) |
| Mining, Quarrying, & Extraction | 39 (100.0%) | 0 (0.0%) |
| Construction | 3,012 (85.6%) | 507 (14.4%) |
| Manufacturing | 2,772 (80.6%) | 669 (19.4%) |
| Wholesale Trade | 467 (70.3%) | 197 (29.7%) |
| Retail Trade | 1,849 (50.7%) | 1,795 (49.3%) |
| Transportation & Warehousing | 2,312 (77.9%) | 656 (22.1%) |
| Utilities | 587 (87.0%) | 88 (13.0%) |
| Information | 529 (75.8%) | 169 (24.2%) |
| Finance & Insurance | 624 (30.6%) | 1,414 (69.4%) |
| Real Estate, Rental & Leasing | 434 (39.8%) | 656 (60.2%) |
| Professional & Scientific | 1,397 (43.2%) | 1,836 (56.8%) |
| Enterprise Management | 0 (0.0%) | 94 (100.0%) |
| Administrative & Support | 1,150 (51.0%) | 1,103 (49.0%) |
| Educational Services | 668 (24.7%) | 2,036 (75.3%) |
| Health Care & Social Assistance | 842 (19.1%) | 3,560 (80.9%) |
| Arts, Entertainment & Recreation | 657 (50.4%) | 646 (49.6%) |
| Accommodation & Food Services | 1,706 (49.0%) | 1,774 (51.0%) |
| Public Administration | 1,599 (61.2%) | 1,013 (38.8%) |
| Total | 22,008 (53.2%) | 19,328 (46.8%) |
Education in Nassau County
School Enrollment in Nassau County
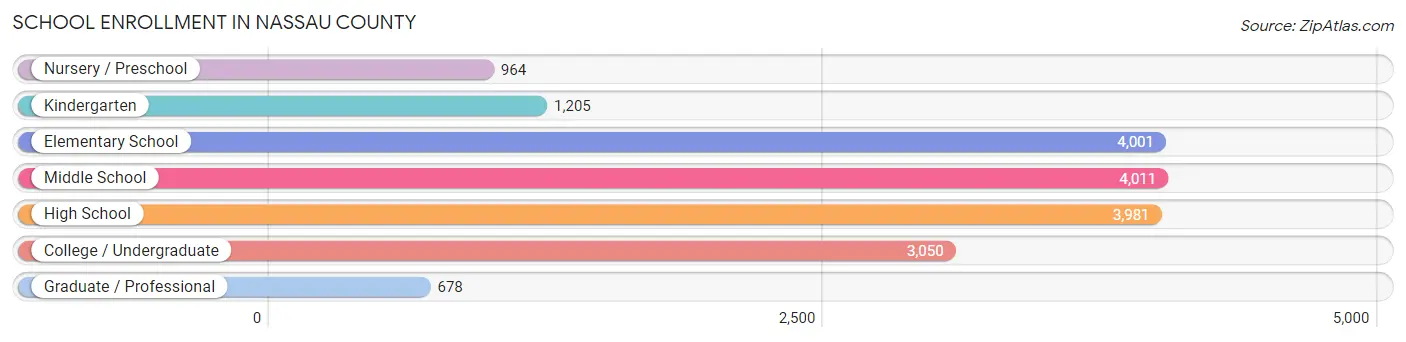
The most common levels of schooling among the 17,890 students in Nassau County are middle school (4,011 | 22.4%), elementary school (4,001 | 22.4%), and high school (3,981 | 22.3%).
| School Level | # Students | % Students |
| Nursery / Preschool | 964 | 5.4% |
| Kindergarten | 1,205 | 6.7% |
| Elementary School | 4,001 | 22.4% |
| Middle School | 4,011 | 22.4% |
| High School | 3,981 | 22.3% |
| College / Undergraduate | 3,050 | 17.1% |
| Graduate / Professional | 678 | 3.8% |
| Total | 17,890 | 100.0% |
School Enrollment by Age by Funding Source in Nassau County
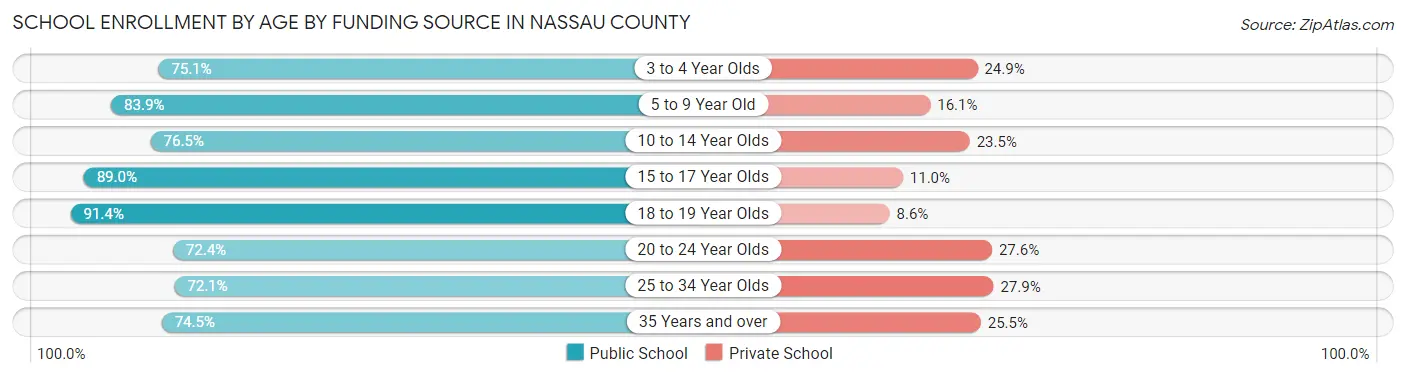
Out of a total of 17,890 students who are enrolled in schools in Nassau County, 3,417 (19.1%) attend a private institution, while the remaining 14,473 (80.9%) are enrolled in public schools. The age group of 25 to 34 year olds has the highest likelihood of being enrolled in private schools, with 267 (27.9% in the age bracket) enrolled. Conversely, the age group of 18 to 19 year olds has the lowest likelihood of being enrolled in a private school, with 1,015 (91.4% in the age bracket) attending a public institution.
| Age Bracket | Public School | Private School |
| 3 to 4 Year Olds | 485 (75.1%) | 161 (24.9%) |
| 5 to 9 Year Old | 4,259 (83.9%) | 819 (16.1%) |
| 10 to 14 Year Olds | 3,825 (76.5%) | 1,174 (23.5%) |
| 15 to 17 Year Olds | 2,624 (89.0%) | 325 (11.0%) |
| 18 to 19 Year Olds | 1,015 (91.4%) | 95 (8.6%) |
| 20 to 24 Year Olds | 820 (72.4%) | 313 (27.6%) |
| 25 to 34 Year Olds | 690 (72.1%) | 267 (27.9%) |
| 35 Years and over | 758 (74.5%) | 260 (25.5%) |
| Total | 14,473 (80.9%) | 3,417 (19.1%) |
Educational Attainment by Field of Study in Nassau County
Business (5,051 | 21.9%), education (2,857 | 12.4%), science & technology (2,548 | 11.0%), social sciences (1,967 | 8.5%), and arts & humanities (1,427 | 6.2%) are the most common fields of study among 23,070 individuals in Nassau County who have obtained a bachelor's degree or higher.
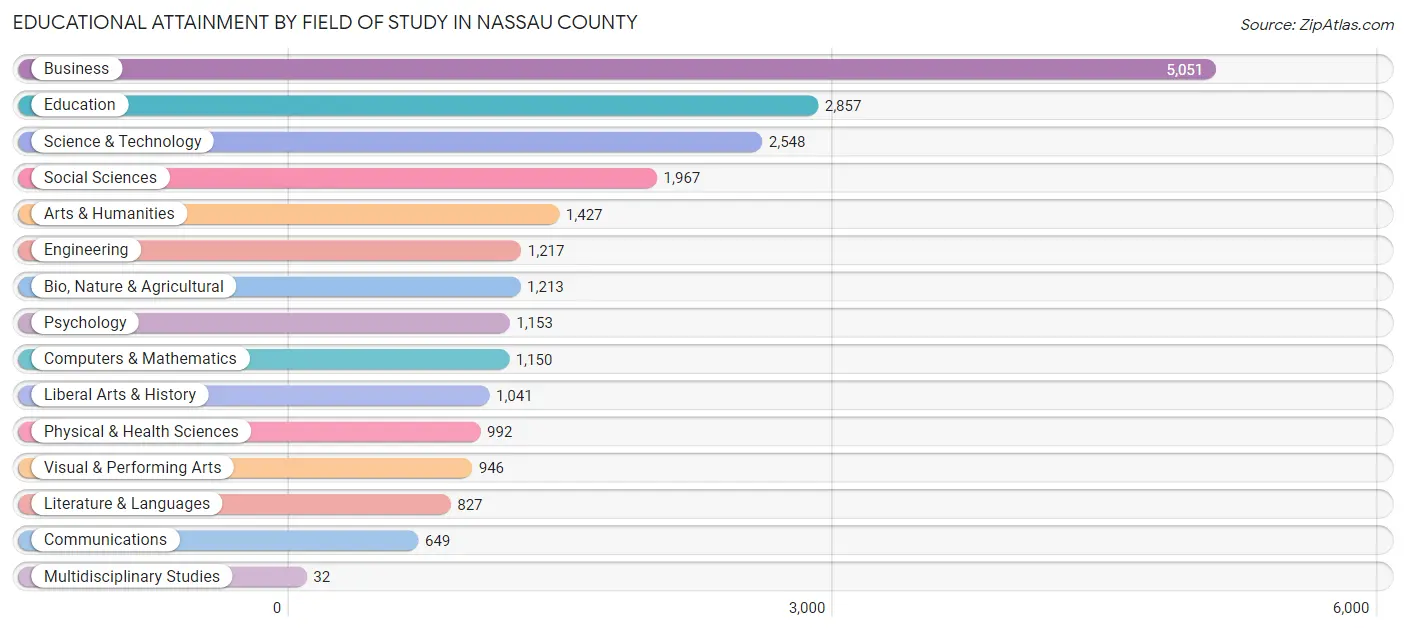
| Field of Study | # Graduates | % Graduates |
| Computers & Mathematics | 1,150 | 5.0% |
| Bio, Nature & Agricultural | 1,213 | 5.3% |
| Physical & Health Sciences | 992 | 4.3% |
| Psychology | 1,153 | 5.0% |
| Social Sciences | 1,967 | 8.5% |
| Engineering | 1,217 | 5.3% |
| Multidisciplinary Studies | 32 | 0.1% |
| Science & Technology | 2,548 | 11.0% |
| Business | 5,051 | 21.9% |
| Education | 2,857 | 12.4% |
| Literature & Languages | 827 | 3.6% |
| Liberal Arts & History | 1,041 | 4.5% |
| Visual & Performing Arts | 946 | 4.1% |
| Communications | 649 | 2.8% |
| Arts & Humanities | 1,427 | 6.2% |
| Total | 23,070 | 100.0% |
Transportation & Commute in Nassau County
Vehicle Availability by Sex in Nassau County
The most prevalent vehicle ownership categories in Nassau County are males with 2 vehicles (9,871, accounting for 44.4%) and females with 2 vehicles (8,071, making up 51.8%).
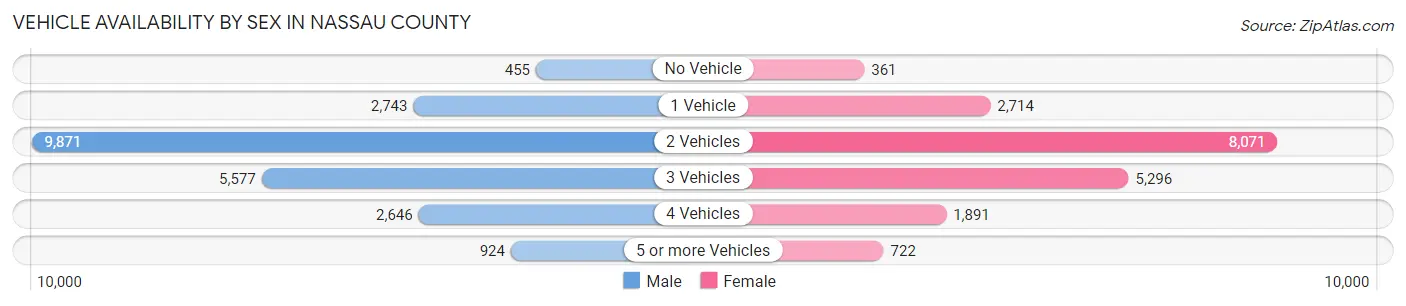
| Vehicles Available | Male | Female |
| No Vehicle | 455 (2.1%) | 361 (1.9%) |
| 1 Vehicle | 2,743 (12.3%) | 2,714 (14.2%) |
| 2 Vehicles | 9,871 (44.4%) | 8,071 (42.4%) |
| 3 Vehicles | 5,577 (25.1%) | 5,296 (27.8%) |
| 4 Vehicles | 2,646 (11.9%) | 1,891 (9.9%) |
| 5 or more Vehicles | 924 (4.2%) | 722 (3.8%) |
| Total | 22,216 (100.0%) | 19,055 (100.0%) |
Commute Time in Nassau County
The most frequently occuring commute durations in Nassau County are 45 to 59 minutes (6,300 commuters, 17.0%), 30 to 34 minutes (6,083 commuters, 16.4%), and 15 to 19 minutes (3,828 commuters, 10.3%).
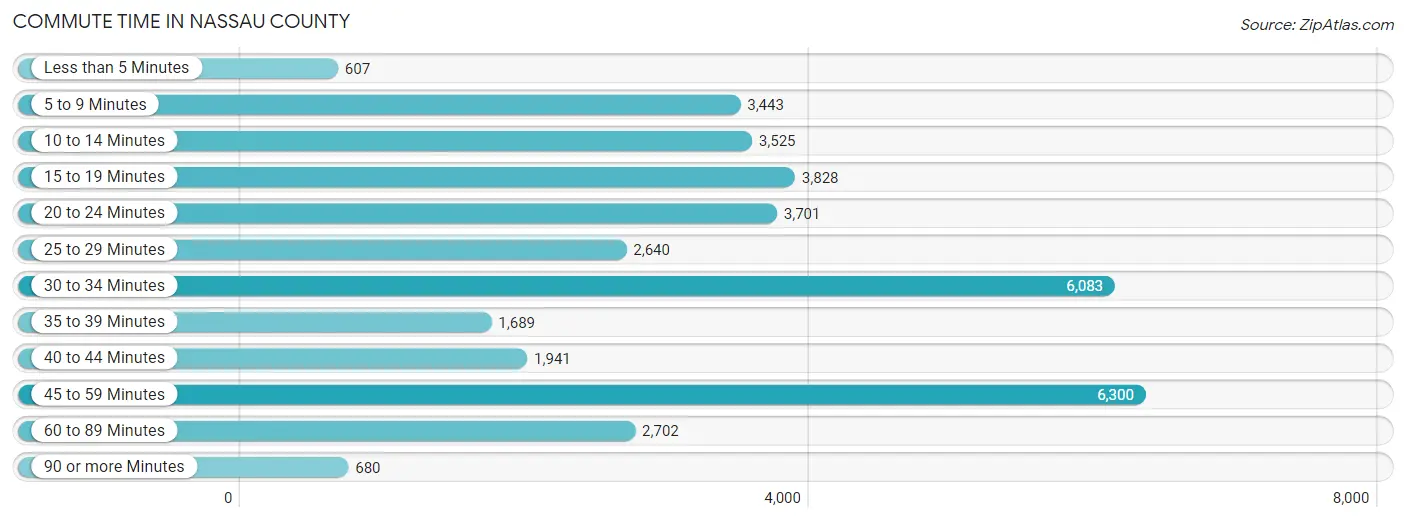
| Commute Time | # Commuters | % Commuters |
| Less than 5 Minutes | 607 | 1.6% |
| 5 to 9 Minutes | 3,443 | 9.3% |
| 10 to 14 Minutes | 3,525 | 9.5% |
| 15 to 19 Minutes | 3,828 | 10.3% |
| 20 to 24 Minutes | 3,701 | 10.0% |
| 25 to 29 Minutes | 2,640 | 7.1% |
| 30 to 34 Minutes | 6,083 | 16.4% |
| 35 to 39 Minutes | 1,689 | 4.5% |
| 40 to 44 Minutes | 1,941 | 5.2% |
| 45 to 59 Minutes | 6,300 | 17.0% |
| 60 to 89 Minutes | 2,702 | 7.3% |
| 90 or more Minutes | 680 | 1.8% |
Commute Time by Sex in Nassau County
The most common commute times in Nassau County are 30 to 34 minutes (3,813 commuters, 18.5%) for males and 45 to 59 minutes (2,498 commuters, 15.1%) for females.
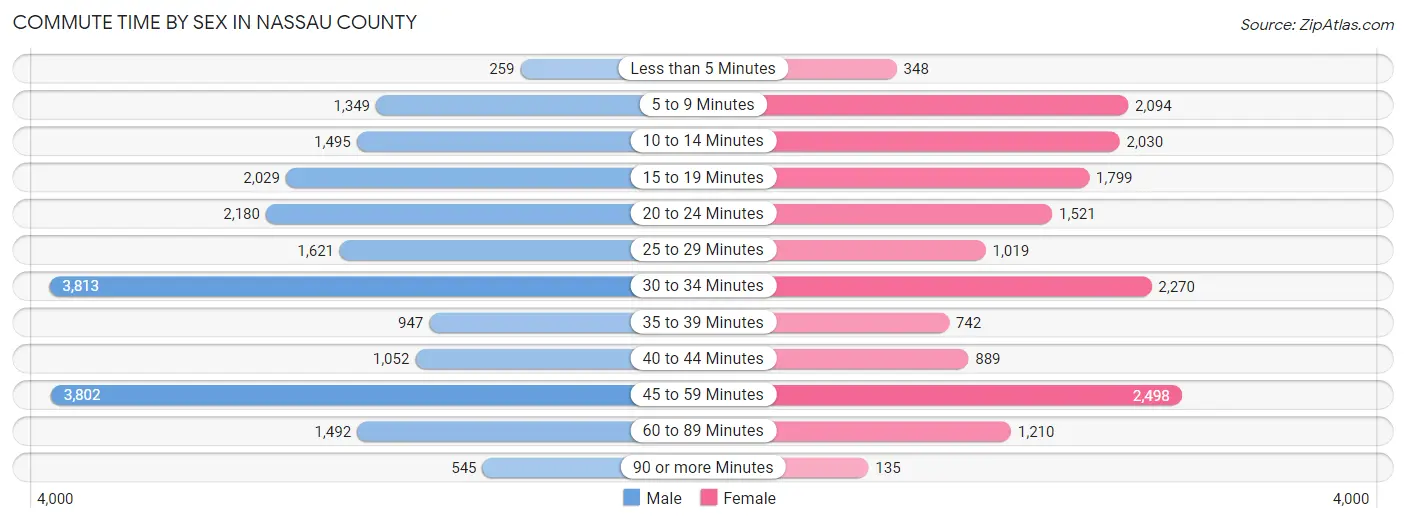
| Commute Time | Male | Female |
| Less than 5 Minutes | 259 (1.3%) | 348 (2.1%) |
| 5 to 9 Minutes | 1,349 (6.6%) | 2,094 (12.7%) |
| 10 to 14 Minutes | 1,495 (7.3%) | 2,030 (12.3%) |
| 15 to 19 Minutes | 2,029 (9.9%) | 1,799 (10.9%) |
| 20 to 24 Minutes | 2,180 (10.6%) | 1,521 (9.2%) |
| 25 to 29 Minutes | 1,621 (7.9%) | 1,019 (6.2%) |
| 30 to 34 Minutes | 3,813 (18.5%) | 2,270 (13.7%) |
| 35 to 39 Minutes | 947 (4.6%) | 742 (4.5%) |
| 40 to 44 Minutes | 1,052 (5.1%) | 889 (5.4%) |
| 45 to 59 Minutes | 3,802 (18.5%) | 2,498 (15.1%) |
| 60 to 89 Minutes | 1,492 (7.2%) | 1,210 (7.3%) |
| 90 or more Minutes | 545 (2.6%) | 135 (0.8%) |
Time of Departure to Work by Sex in Nassau County
The most frequent times of departure to work in Nassau County are 6:00 AM to 6:29 AM (2,677, 13.0%) for males and 7:00 AM to 7:29 AM (2,781, 16.8%) for females.
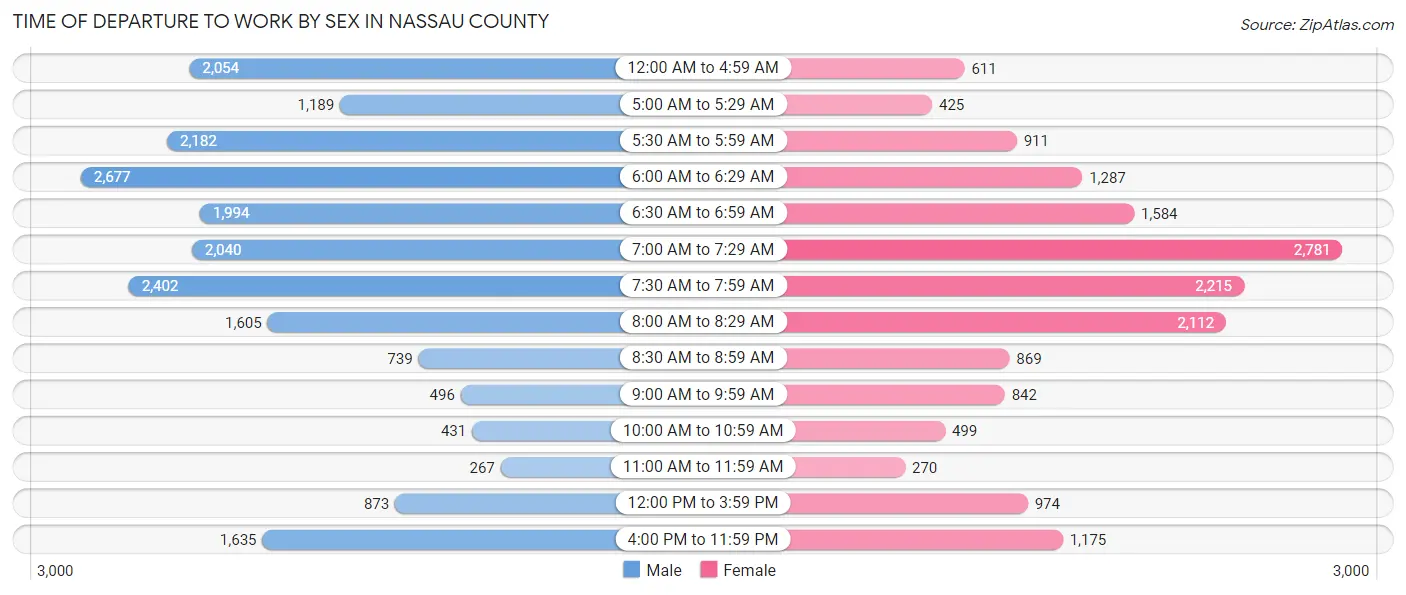
| Time of Departure | Male | Female |
| 12:00 AM to 4:59 AM | 2,054 (10.0%) | 611 (3.7%) |
| 5:00 AM to 5:29 AM | 1,189 (5.8%) | 425 (2.6%) |
| 5:30 AM to 5:59 AM | 2,182 (10.6%) | 911 (5.5%) |
| 6:00 AM to 6:29 AM | 2,677 (13.0%) | 1,287 (7.8%) |
| 6:30 AM to 6:59 AM | 1,994 (9.7%) | 1,584 (9.6%) |
| 7:00 AM to 7:29 AM | 2,040 (9.9%) | 2,781 (16.8%) |
| 7:30 AM to 7:59 AM | 2,402 (11.7%) | 2,215 (13.4%) |
| 8:00 AM to 8:29 AM | 1,605 (7.8%) | 2,112 (12.8%) |
| 8:30 AM to 8:59 AM | 739 (3.6%) | 869 (5.2%) |
| 9:00 AM to 9:59 AM | 496 (2.4%) | 842 (5.1%) |
| 10:00 AM to 10:59 AM | 431 (2.1%) | 499 (3.0%) |
| 11:00 AM to 11:59 AM | 267 (1.3%) | 270 (1.6%) |
| 12:00 PM to 3:59 PM | 873 (4.2%) | 974 (5.9%) |
| 4:00 PM to 11:59 PM | 1,635 (7.9%) | 1,175 (7.1%) |
| Total | 20,584 (100.0%) | 16,555 (100.0%) |
Housing Occupancy in Nassau County
Occupancy by Ownership in Nassau County
Of the total 36,336 dwellings in Nassau County, owner-occupied units account for 30,031 (82.7%), while renter-occupied units make up 6,305 (17.3%).
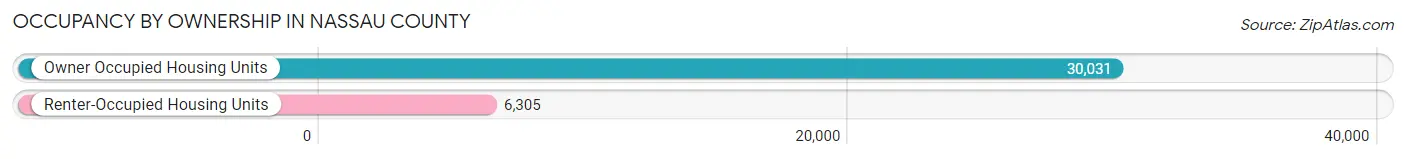
| Occupancy | # Housing Units | % Housing Units |
| Owner Occupied Housing Units | 30,031 | 82.7% |
| Renter-Occupied Housing Units | 6,305 | 17.3% |
| Total Occupied Housing Units | 36,336 | 100.0% |
Occupancy by Household Size in Nassau County
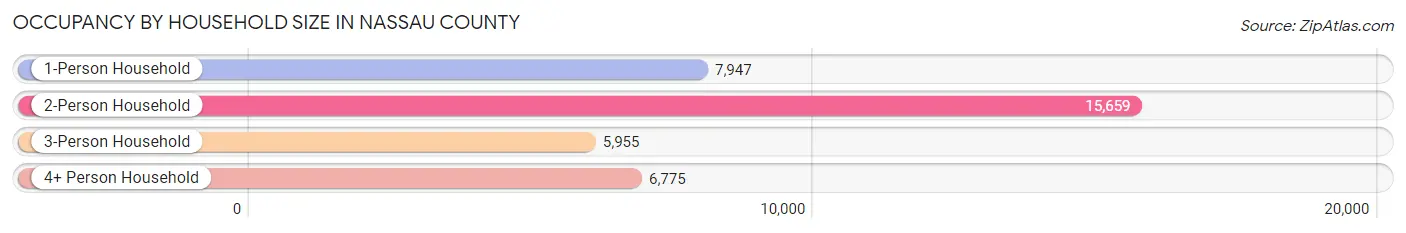
| Household Size | # Housing Units | % Housing Units |
| 1-Person Household | 7,947 | 21.9% |
| 2-Person Household | 15,659 | 43.1% |
| 3-Person Household | 5,955 | 16.4% |
| 4+ Person Household | 6,775 | 18.6% |
| Total Housing Units | 36,336 | 100.0% |
Occupancy by Ownership by Household Size in Nassau County
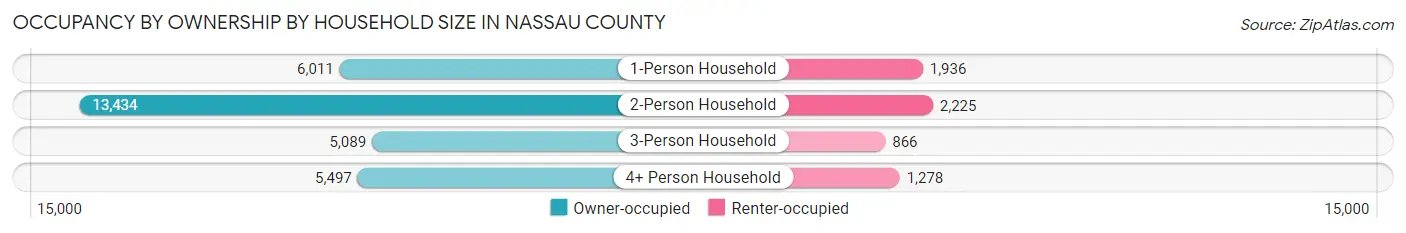
| Household Size | Owner-occupied | Renter-occupied |
| 1-Person Household | 6,011 (75.6%) | 1,936 (24.4%) |
| 2-Person Household | 13,434 (85.8%) | 2,225 (14.2%) |
| 3-Person Household | 5,089 (85.5%) | 866 (14.5%) |
| 4+ Person Household | 5,497 (81.1%) | 1,278 (18.9%) |
| Total Housing Units | 30,031 (82.7%) | 6,305 (17.3%) |
Occupancy by Educational Attainment in Nassau County
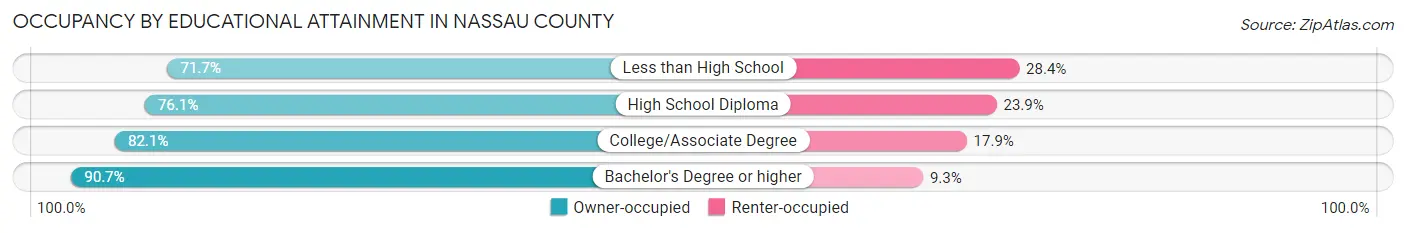
| Household Size | Owner-occupied | Renter-occupied |
| Less than High School | 2,067 (71.7%) | 818 (28.3%) |
| High School Diploma | 7,111 (76.1%) | 2,229 (23.9%) |
| College/Associate Degree | 9,671 (82.1%) | 2,114 (17.9%) |
| Bachelor's Degree or higher | 11,182 (90.7%) | 1,144 (9.3%) |
Occupancy by Age of Householder in Nassau County
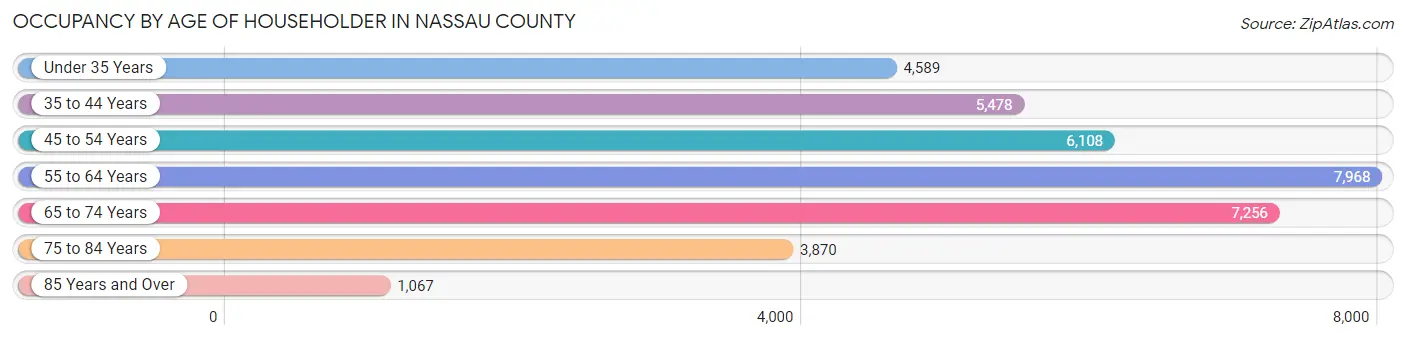
| Age Bracket | # Households | % Households |
| Under 35 Years | 4,589 | 12.6% |
| 35 to 44 Years | 5,478 | 15.1% |
| 45 to 54 Years | 6,108 | 16.8% |
| 55 to 64 Years | 7,968 | 21.9% |
| 65 to 74 Years | 7,256 | 20.0% |
| 75 to 84 Years | 3,870 | 10.6% |
| 85 Years and Over | 1,067 | 2.9% |
| Total | 36,336 | 100.0% |
Housing Finances in Nassau County
Median Income by Occupancy in Nassau County
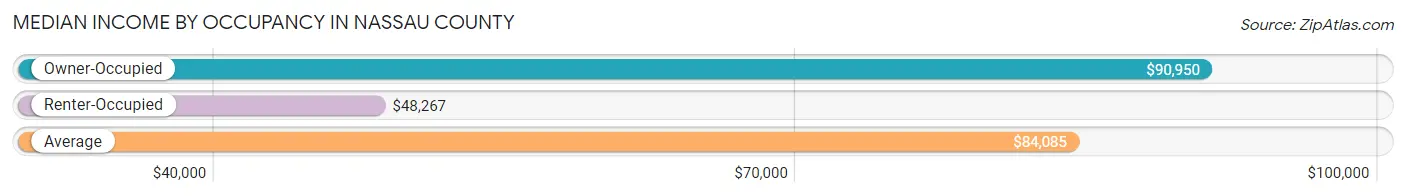
| Occupancy Type | # Households | Median Income |
| Owner-Occupied | 30,031 (82.7%) | $90,950 |
| Renter-Occupied | 6,305 (17.3%) | $48,267 |
| Average | 36,336 (100.0%) | $84,085 |
Occupancy by Householder Income Bracket in Nassau County
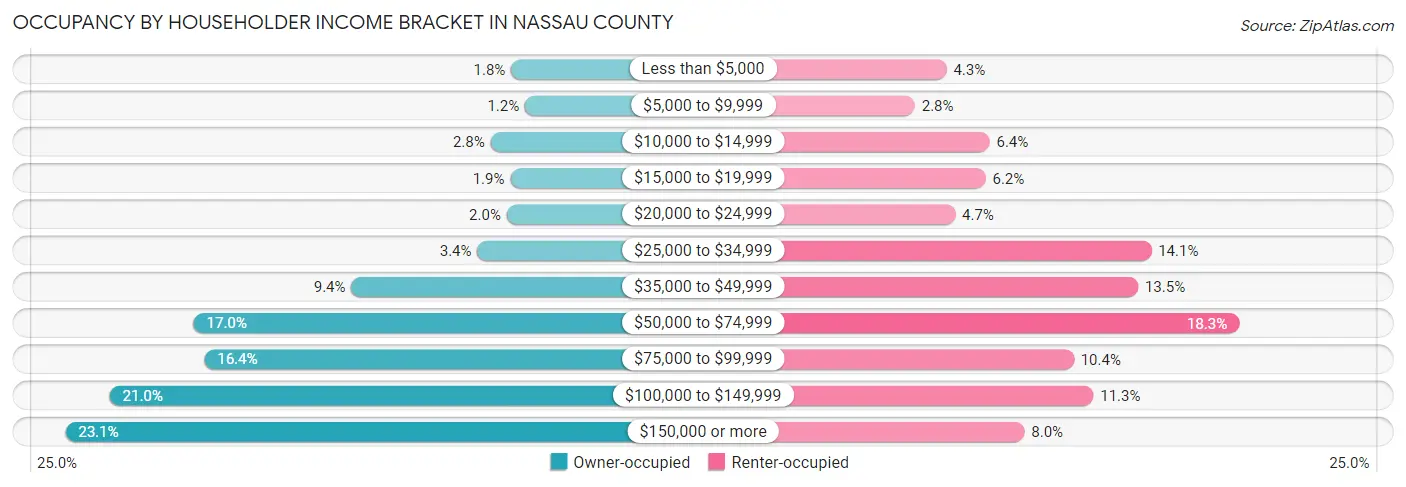
| Income Bracket | Owner-occupied | Renter-occupied |
| Less than $5,000 | 550 (1.8%) | 273 (4.3%) |
| $5,000 to $9,999 | 352 (1.2%) | 178 (2.8%) |
| $10,000 to $14,999 | 843 (2.8%) | 402 (6.4%) |
| $15,000 to $19,999 | 562 (1.9%) | 390 (6.2%) |
| $20,000 to $24,999 | 614 (2.0%) | 299 (4.7%) |
| $25,000 to $34,999 | 1,032 (3.4%) | 888 (14.1%) |
| $35,000 to $49,999 | 2,835 (9.4%) | 848 (13.5%) |
| $50,000 to $74,999 | 5,090 (17.0%) | 1,151 (18.3%) |
| $75,000 to $99,999 | 4,938 (16.4%) | 655 (10.4%) |
| $100,000 to $149,999 | 6,291 (20.9%) | 714 (11.3%) |
| $150,000 or more | 6,924 (23.1%) | 507 (8.0%) |
| Total | 30,031 (100.0%) | 6,305 (100.0%) |
Monthly Housing Cost Tiers in Nassau County
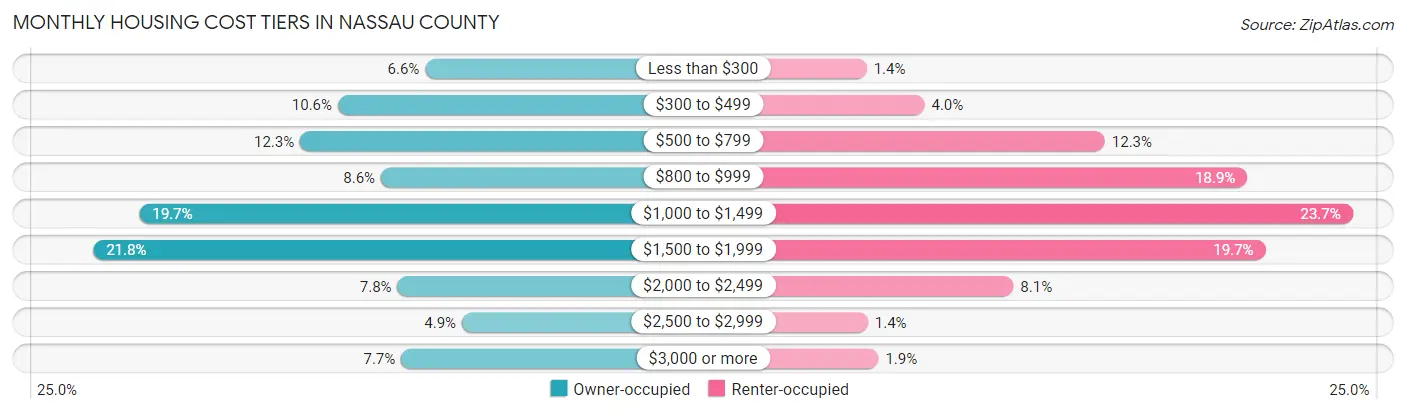
| Monthly Cost | Owner-occupied | Renter-occupied |
| Less than $300 | 1,970 (6.6%) | 85 (1.3%) |
| $300 to $499 | 3,177 (10.6%) | 253 (4.0%) |
| $500 to $799 | 3,699 (12.3%) | 776 (12.3%) |
| $800 to $999 | 2,584 (8.6%) | 1,189 (18.9%) |
| $1,000 to $1,499 | 5,923 (19.7%) | 1,495 (23.7%) |
| $1,500 to $1,999 | 6,558 (21.8%) | 1,242 (19.7%) |
| $2,000 to $2,499 | 2,354 (7.8%) | 511 (8.1%) |
| $2,500 to $2,999 | 1,463 (4.9%) | 88 (1.4%) |
| $3,000 or more | 2,303 (7.7%) | 119 (1.9%) |
| Total | 30,031 (100.0%) | 6,305 (100.0%) |
Physical Housing Characteristics in Nassau County
Housing Structures in Nassau County
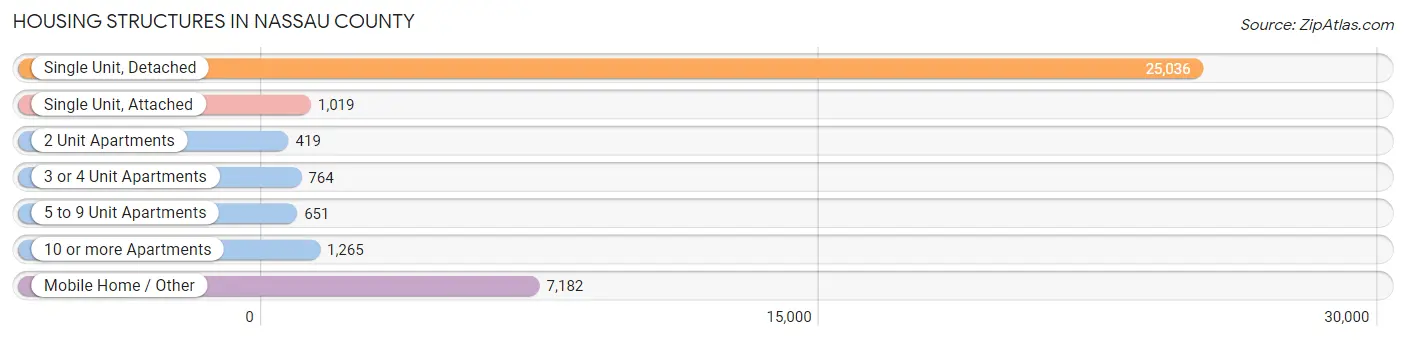
| Structure Type | # Housing Units | % Housing Units |
| Single Unit, Detached | 25,036 | 68.9% |
| Single Unit, Attached | 1,019 | 2.8% |
| 2 Unit Apartments | 419 | 1.1% |
| 3 or 4 Unit Apartments | 764 | 2.1% |
| 5 to 9 Unit Apartments | 651 | 1.8% |
| 10 or more Apartments | 1,265 | 3.5% |
| Mobile Home / Other | 7,182 | 19.8% |
| Total | 36,336 | 100.0% |
Housing Structures by Occupancy in Nassau County
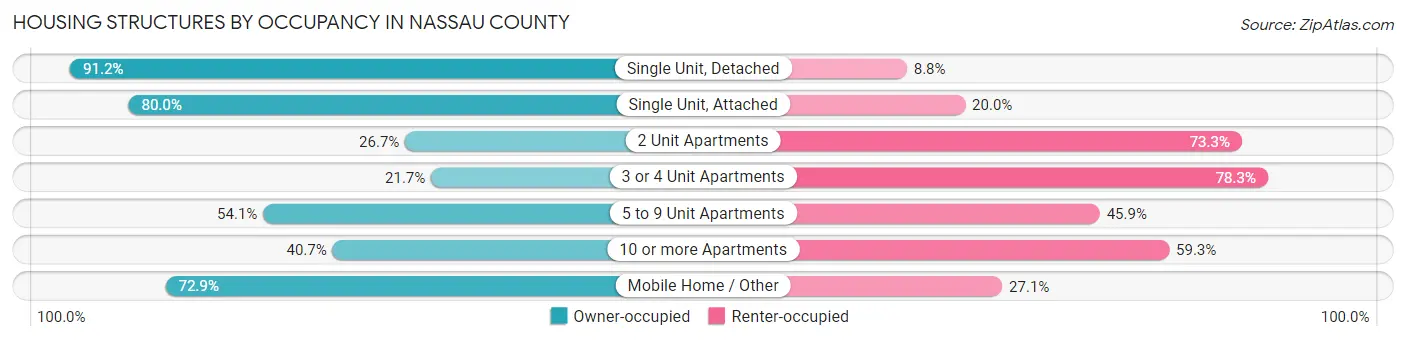
| Structure Type | Owner-occupied | Renter-occupied |
| Single Unit, Detached | 22,838 (91.2%) | 2,198 (8.8%) |
| Single Unit, Attached | 815 (80.0%) | 204 (20.0%) |
| 2 Unit Apartments | 112 (26.7%) | 307 (73.3%) |
| 3 or 4 Unit Apartments | 166 (21.7%) | 598 (78.3%) |
| 5 to 9 Unit Apartments | 352 (54.1%) | 299 (45.9%) |
| 10 or more Apartments | 515 (40.7%) | 750 (59.3%) |
| Mobile Home / Other | 5,233 (72.9%) | 1,949 (27.1%) |
| Total | 30,031 (82.7%) | 6,305 (17.3%) |
Housing Structures by Number of Rooms in Nassau County
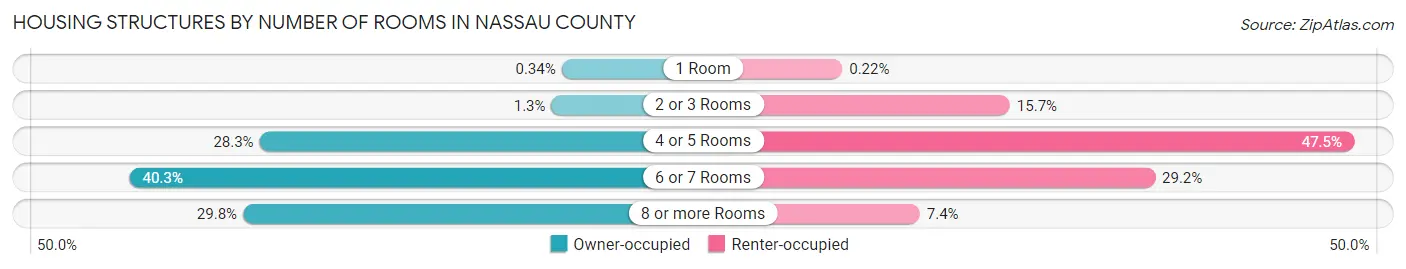
| Number of Rooms | Owner-occupied | Renter-occupied |
| 1 Room | 102 (0.3%) | 14 (0.2%) |
| 2 or 3 Rooms | 383 (1.3%) | 991 (15.7%) |
| 4 or 5 Rooms | 8,494 (28.3%) | 2,996 (47.5%) |
| 6 or 7 Rooms | 12,100 (40.3%) | 1,838 (29.1%) |
| 8 or more Rooms | 8,952 (29.8%) | 466 (7.4%) |
| Total | 30,031 (100.0%) | 6,305 (100.0%) |
Housing Structure by Heating Type in Nassau County
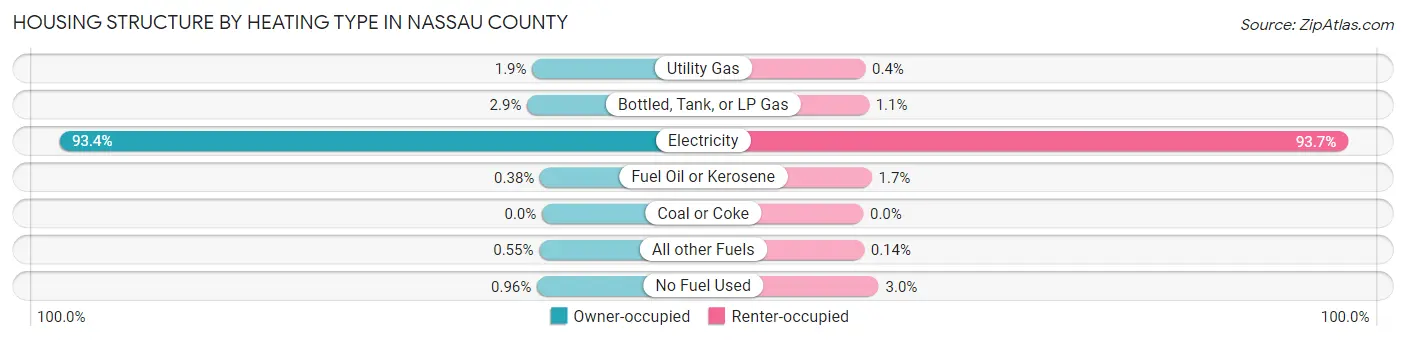
| Heating Type | Owner-occupied | Renter-occupied |
| Utility Gas | 566 (1.9%) | 25 (0.4%) |
| Bottled, Tank, or LP Gas | 862 (2.9%) | 69 (1.1%) |
| Electricity | 28,033 (93.3%) | 5,908 (93.7%) |
| Fuel Oil or Kerosene | 115 (0.4%) | 104 (1.7%) |
| Coal or Coke | 0 (0.0%) | 0 (0.0%) |
| All other Fuels | 166 (0.5%) | 9 (0.1%) |
| No Fuel Used | 289 (1.0%) | 190 (3.0%) |
| Total | 30,031 (100.0%) | 6,305 (100.0%) |
Household Vehicle Usage in Nassau County
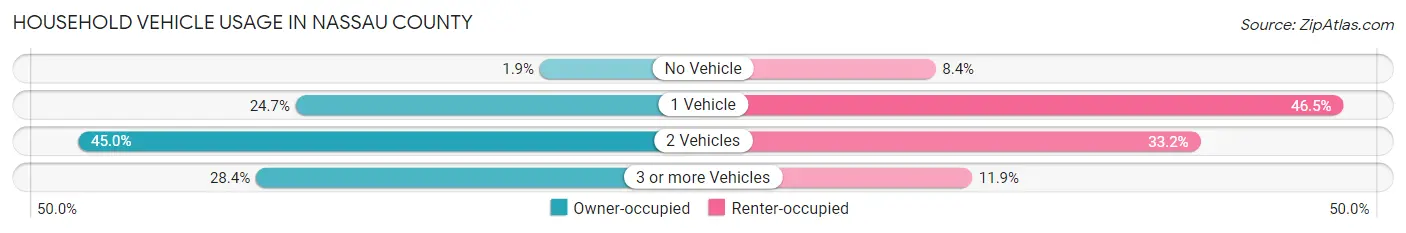
| Vehicles per Household | Owner-occupied | Renter-occupied |
| No Vehicle | 570 (1.9%) | 532 (8.4%) |
| 1 Vehicle | 7,414 (24.7%) | 2,934 (46.5%) |
| 2 Vehicles | 13,517 (45.0%) | 2,092 (33.2%) |
| 3 or more Vehicles | 8,530 (28.4%) | 747 (11.8%) |
| Total | 30,031 (100.0%) | 6,305 (100.0%) |
Real Estate & Mortgages in Nassau County
Real Estate and Mortgage Overview in Nassau County
| Characteristic | Without Mortgage | With Mortgage |
| Housing Units | 11,225 | 18,806 |
| Median Property Value | $298,700 | $309,900 |
| Median Household Income | $69,319 | $4,769 |
| Monthly Housing Costs | $550 | $2,031 |
| Real Estate Taxes | $2,154 | $588 |
Property Value by Mortgage Status in Nassau County
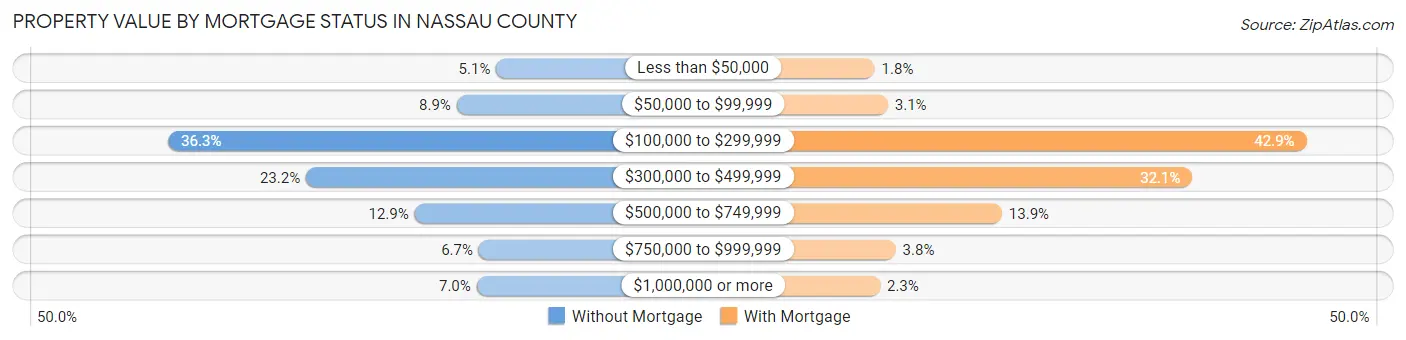
| Property Value | Without Mortgage | With Mortgage |
| Less than $50,000 | 570 (5.1%) | 343 (1.8%) |
| $50,000 to $99,999 | 993 (8.8%) | 579 (3.1%) |
| $100,000 to $299,999 | 4,078 (36.3%) | 8,075 (42.9%) |
| $300,000 to $499,999 | 2,604 (23.2%) | 6,032 (32.1%) |
| $500,000 to $749,999 | 1,443 (12.9%) | 2,621 (13.9%) |
| $750,000 to $999,999 | 757 (6.7%) | 718 (3.8%) |
| $1,000,000 or more | 780 (7.0%) | 438 (2.3%) |
| Total | 11,225 (100.0%) | 18,806 (100.0%) |
Household Income by Mortgage Status in Nassau County
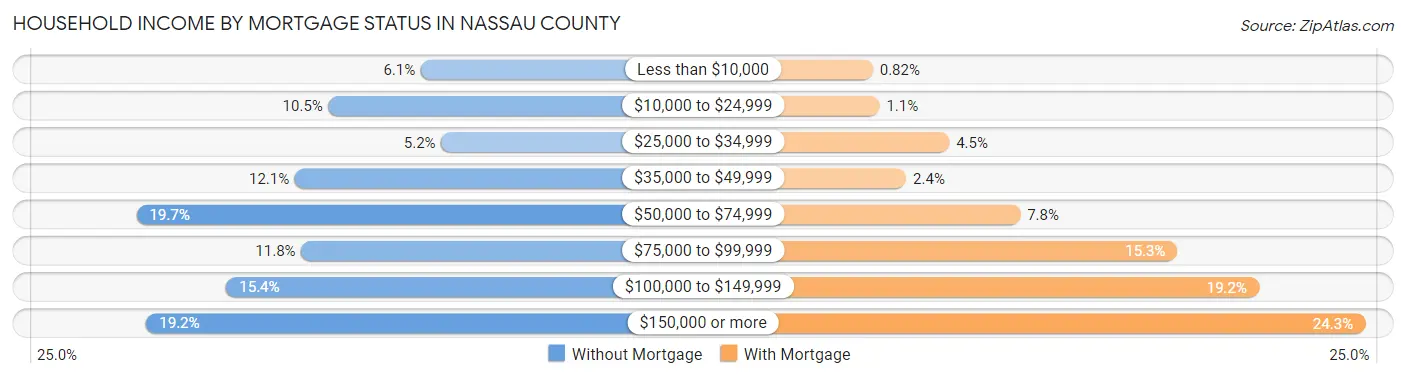
| Household Income | Without Mortgage | With Mortgage |
| Less than $10,000 | 687 (6.1%) | 154 (0.8%) |
| $10,000 to $24,999 | 1,181 (10.5%) | 215 (1.1%) |
| $25,000 to $34,999 | 578 (5.1%) | 838 (4.5%) |
| $35,000 to $49,999 | 1,361 (12.1%) | 454 (2.4%) |
| $50,000 to $74,999 | 2,208 (19.7%) | 1,474 (7.8%) |
| $75,000 to $99,999 | 1,327 (11.8%) | 2,882 (15.3%) |
| $100,000 to $149,999 | 1,728 (15.4%) | 3,611 (19.2%) |
| $150,000 or more | 2,155 (19.2%) | 4,563 (24.3%) |
| Total | 11,225 (100.0%) | 18,806 (100.0%) |
Property Value to Household Income Ratio in Nassau County
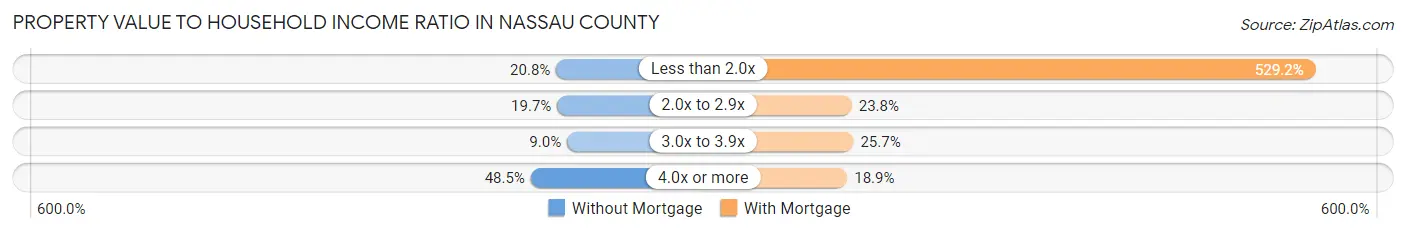
| Value-to-Income Ratio | Without Mortgage | With Mortgage |
| Less than 2.0x | 2,333 (20.8%) | 99,512 (529.2%) |
| 2.0x to 2.9x | 2,211 (19.7%) | 4,478 (23.8%) |
| 3.0x to 3.9x | 1,007 (9.0%) | 4,827 (25.7%) |
| 4.0x or more | 5,449 (48.5%) | 3,555 (18.9%) |
| Total | 11,225 (100.0%) | 18,806 (100.0%) |
Real Estate Taxes by Mortgage Status in Nassau County
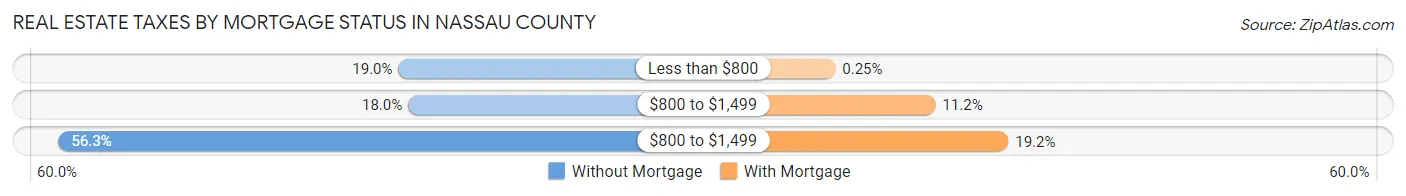
| Property Taxes | Without Mortgage | With Mortgage |
| Less than $800 | 2,137 (19.0%) | 47 (0.3%) |
| $800 to $1,499 | 2,018 (18.0%) | 2,111 (11.2%) |
| $800 to $1,499 | 6,319 (56.3%) | 3,613 (19.2%) |
| Total | 11,225 (100.0%) | 18,806 (100.0%) |
Health & Disability in Nassau County
Health Insurance Coverage by Age in Nassau County
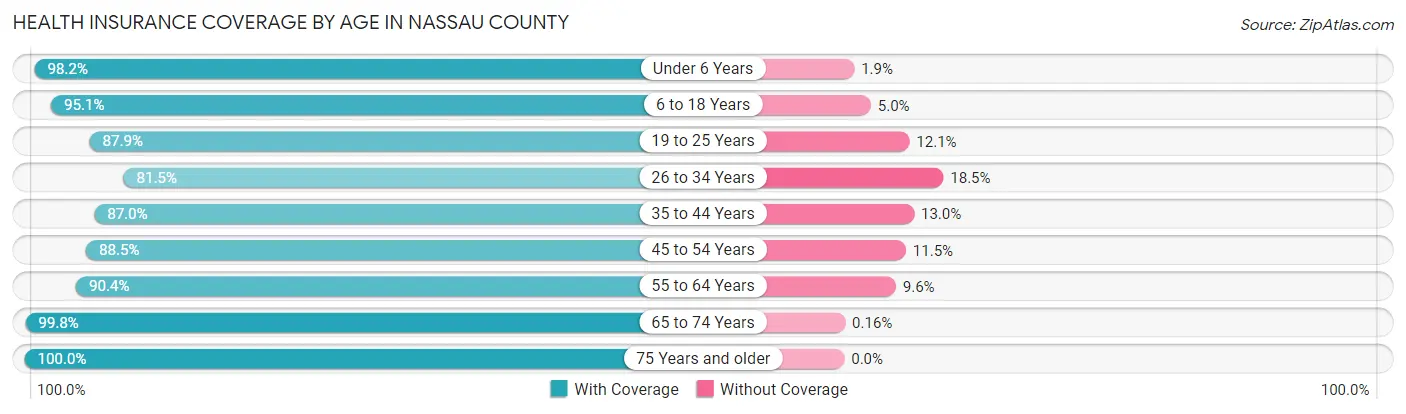
| Age Bracket | With Coverage | Without Coverage |
| Under 6 Years | 5,452 (98.2%) | 103 (1.8%) |
| 6 to 18 Years | 12,607 (95.1%) | 657 (5.0%) |
| 19 to 25 Years | 5,045 (87.9%) | 697 (12.1%) |
| 26 to 34 Years | 7,012 (81.5%) | 1,588 (18.5%) |
| 35 to 44 Years | 9,085 (87.0%) | 1,357 (13.0%) |
| 45 to 54 Years | 10,547 (88.5%) | 1,369 (11.5%) |
| 55 to 64 Years | 12,675 (90.4%) | 1,348 (9.6%) |
| 65 to 74 Years | 12,595 (99.8%) | 20 (0.2%) |
| 75 Years and older | 8,151 (100.0%) | 0 (0.0%) |
| Total | 83,169 (92.1%) | 7,139 (7.9%) |
Health Insurance Coverage by Citizenship Status in Nassau County
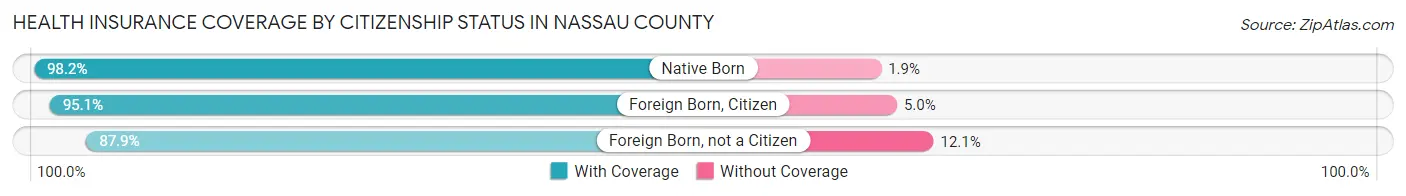
| Citizenship Status | With Coverage | Without Coverage |
| Native Born | 5,452 (98.2%) | 103 (1.8%) |
| Foreign Born, Citizen | 12,607 (95.1%) | 657 (5.0%) |
| Foreign Born, not a Citizen | 5,045 (87.9%) | 697 (12.1%) |
Health Insurance Coverage by Household Income in Nassau County
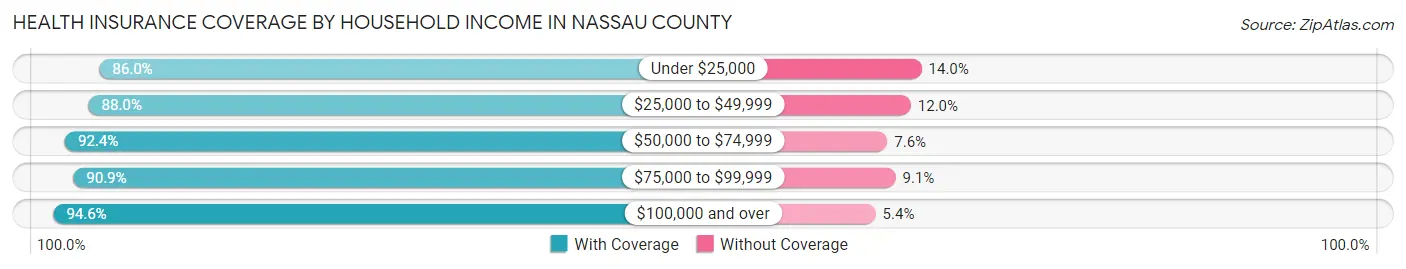
| Household Income | With Coverage | Without Coverage |
| Under $25,000 | 6,901 (86.0%) | 1,125 (14.0%) |
| $25,000 to $49,999 | 9,571 (88.0%) | 1,305 (12.0%) |
| $50,000 to $74,999 | 14,850 (92.4%) | 1,219 (7.6%) |
| $75,000 to $99,999 | 12,220 (90.9%) | 1,229 (9.1%) |
| $100,000 and over | 39,414 (94.6%) | 2,253 (5.4%) |
Public vs Private Health Insurance Coverage by Age in Nassau County
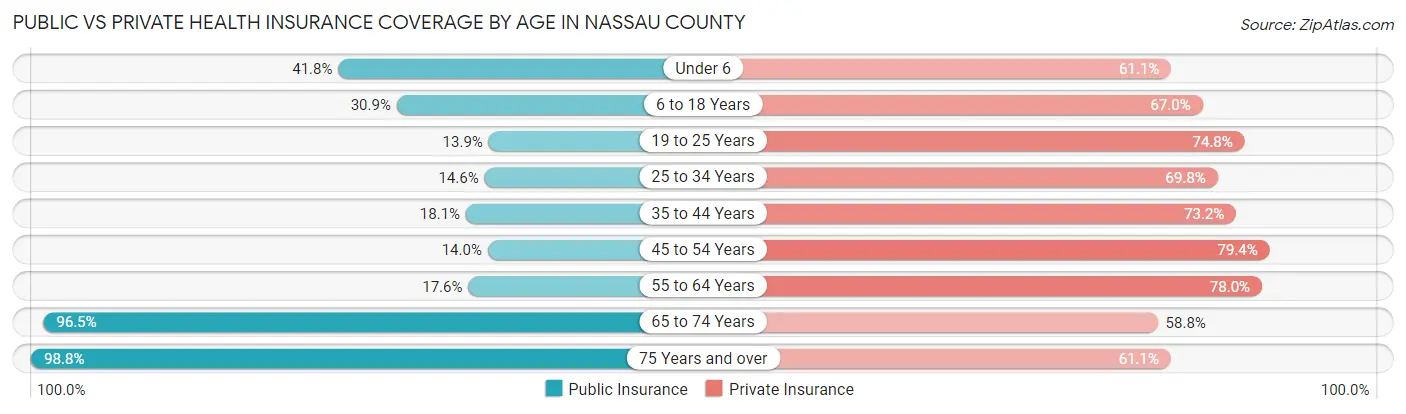
| Age Bracket | Public Insurance | Private Insurance |
| Under 6 | 2,321 (41.8%) | 3,396 (61.1%) |
| 6 to 18 Years | 4,103 (30.9%) | 8,881 (67.0%) |
| 19 to 25 Years | 796 (13.9%) | 4,293 (74.8%) |
| 25 to 34 Years | 1,259 (14.6%) | 5,999 (69.8%) |
| 35 to 44 Years | 1,889 (18.1%) | 7,644 (73.2%) |
| 45 to 54 Years | 1,673 (14.0%) | 9,461 (79.4%) |
| 55 to 64 Years | 2,474 (17.6%) | 10,934 (78.0%) |
| 65 to 74 Years | 12,175 (96.5%) | 7,419 (58.8%) |
| 75 Years and over | 8,053 (98.8%) | 4,977 (61.1%) |
| Total | 34,743 (38.5%) | 63,004 (69.8%) |
Disability Status by Sex by Age in Nassau County
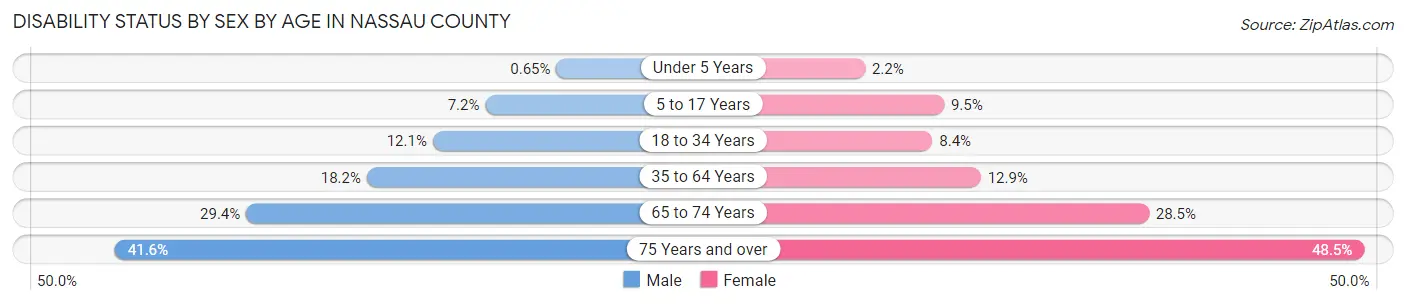
| Age Bracket | Male | Female |
| Under 5 Years | 14 (0.6%) | 49 (2.1%) |
| 5 to 17 Years | 504 (7.2%) | 617 (9.5%) |
| 18 to 34 Years | 903 (12.1%) | 657 (8.4%) |
| 35 to 64 Years | 3,279 (18.2%) | 2,373 (12.9%) |
| 65 to 74 Years | 1,777 (29.4%) | 1,874 (28.5%) |
| 75 Years and over | 1,591 (41.6%) | 2,098 (48.5%) |
Disability Class by Sex by Age in Nassau County
Disability Class: Hearing Difficulty
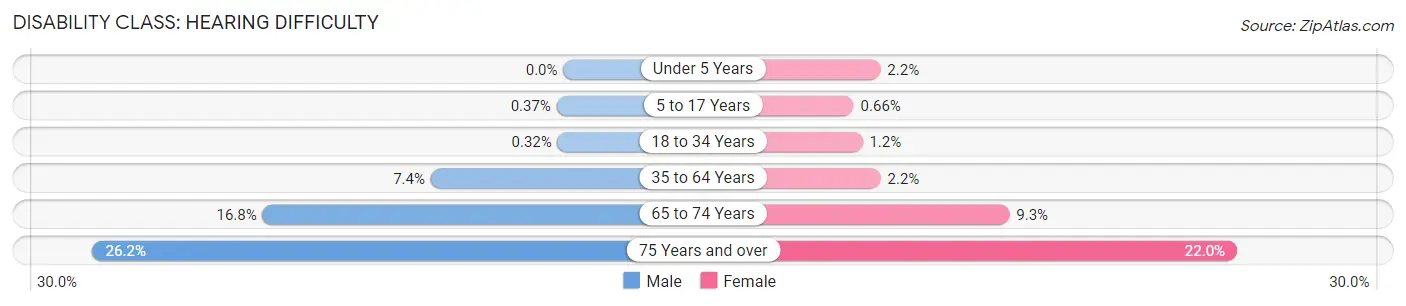
| Age Bracket | Male | Female |
| Under 5 Years | 0 (0.0%) | 49 (2.1%) |
| 5 to 17 Years | 26 (0.4%) | 43 (0.7%) |
| 18 to 34 Years | 24 (0.3%) | 90 (1.1%) |
| 35 to 64 Years | 1,327 (7.4%) | 397 (2.2%) |
| 65 to 74 Years | 1,011 (16.8%) | 614 (9.3%) |
| 75 Years and over | 1,002 (26.2%) | 952 (22.0%) |
Disability Class: Vision Difficulty
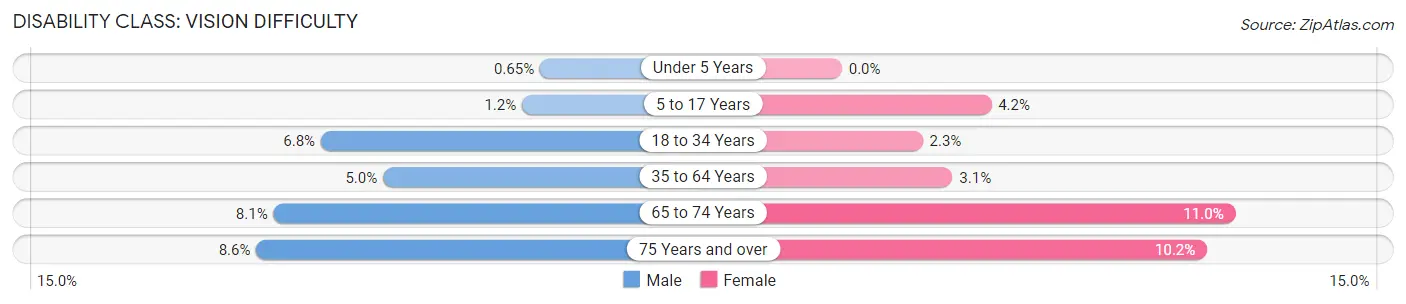
| Age Bracket | Male | Female |
| Under 5 Years | 14 (0.6%) | 0 (0.0%) |
| 5 to 17 Years | 80 (1.1%) | 271 (4.2%) |
| 18 to 34 Years | 503 (6.8%) | 176 (2.2%) |
| 35 to 64 Years | 903 (5.0%) | 567 (3.1%) |
| 65 to 74 Years | 487 (8.1%) | 721 (11.0%) |
| 75 Years and over | 327 (8.6%) | 440 (10.2%) |
Disability Class: Cognitive Difficulty
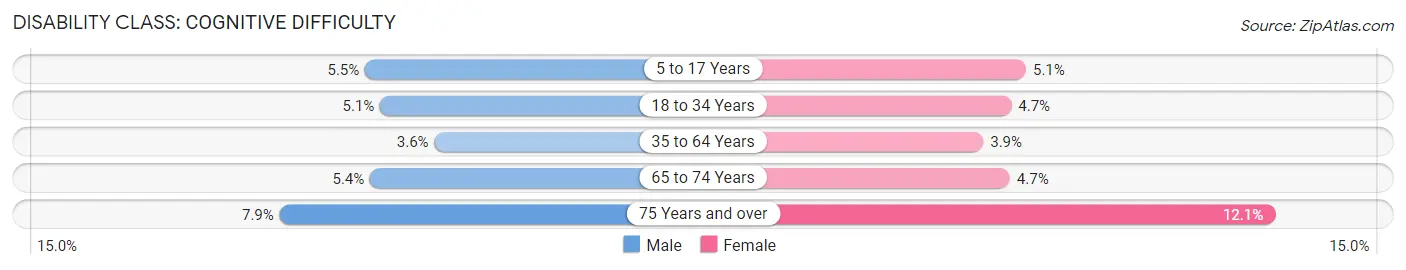
| Age Bracket | Male | Female |
| 5 to 17 Years | 384 (5.5%) | 334 (5.1%) |
| 18 to 34 Years | 380 (5.1%) | 369 (4.7%) |
| 35 to 64 Years | 646 (3.6%) | 725 (3.9%) |
| 65 to 74 Years | 325 (5.4%) | 308 (4.7%) |
| 75 Years and over | 302 (7.9%) | 522 (12.1%) |
Disability Class: Ambulatory Difficulty
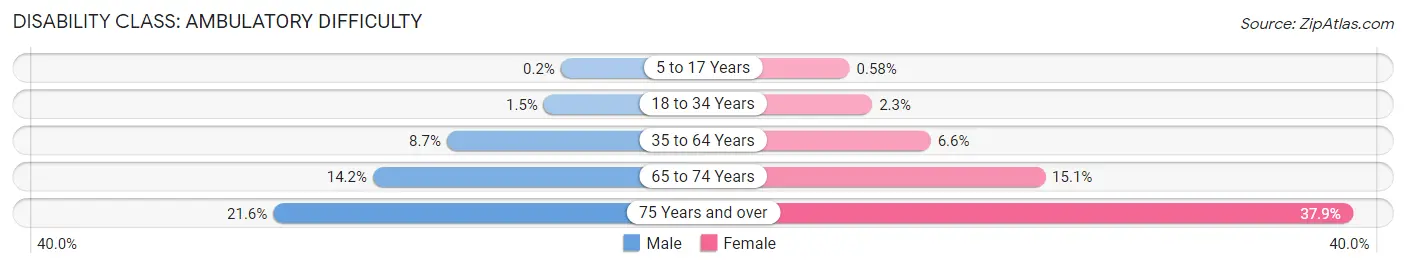
| Age Bracket | Male | Female |
| 5 to 17 Years | 14 (0.2%) | 38 (0.6%) |
| 18 to 34 Years | 109 (1.5%) | 177 (2.3%) |
| 35 to 64 Years | 1,557 (8.7%) | 1,215 (6.6%) |
| 65 to 74 Years | 854 (14.1%) | 993 (15.1%) |
| 75 Years and over | 824 (21.5%) | 1,641 (37.9%) |
Disability Class: Self-Care Difficulty
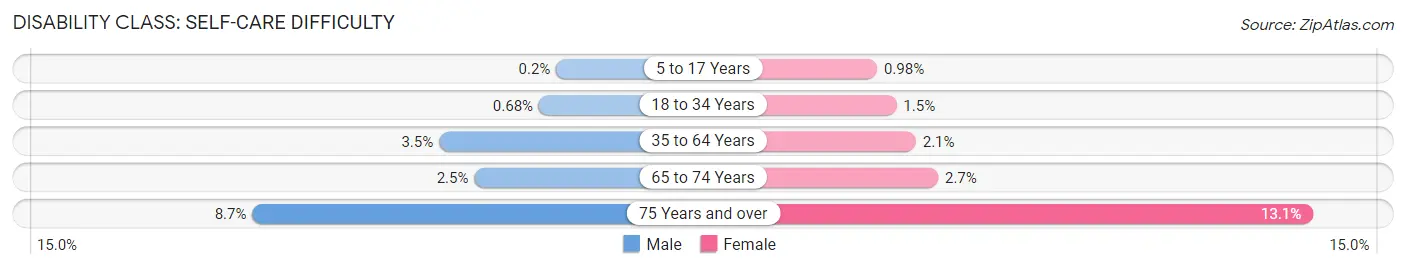
| Age Bracket | Male | Female |
| 5 to 17 Years | 14 (0.2%) | 64 (1.0%) |
| 18 to 34 Years | 51 (0.7%) | 119 (1.5%) |
| 35 to 64 Years | 622 (3.5%) | 380 (2.1%) |
| 65 to 74 Years | 150 (2.5%) | 176 (2.7%) |
| 75 Years and over | 331 (8.7%) | 568 (13.1%) |
Technology Access in Nassau County
Computing Device Access in Nassau County
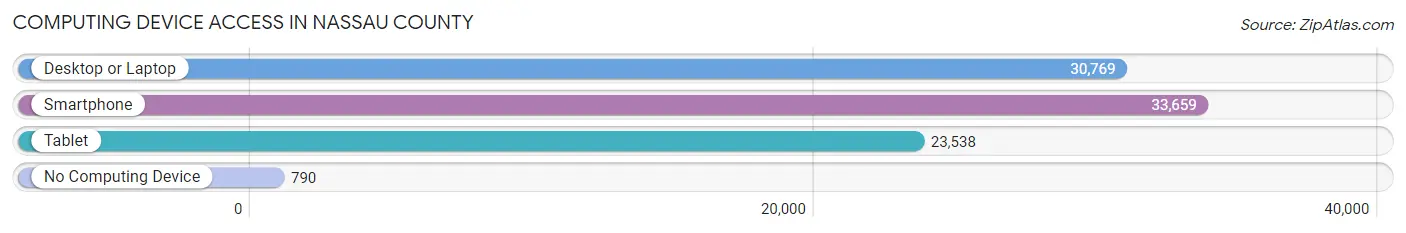
| Device Type | # Households | % Households |
| Desktop or Laptop | 30,769 | 84.7% |
| Smartphone | 33,659 | 92.6% |
| Tablet | 23,538 | 64.8% |
| No Computing Device | 790 | 2.2% |
| Total | 36,336 | 100.0% |
Internet Access in Nassau County
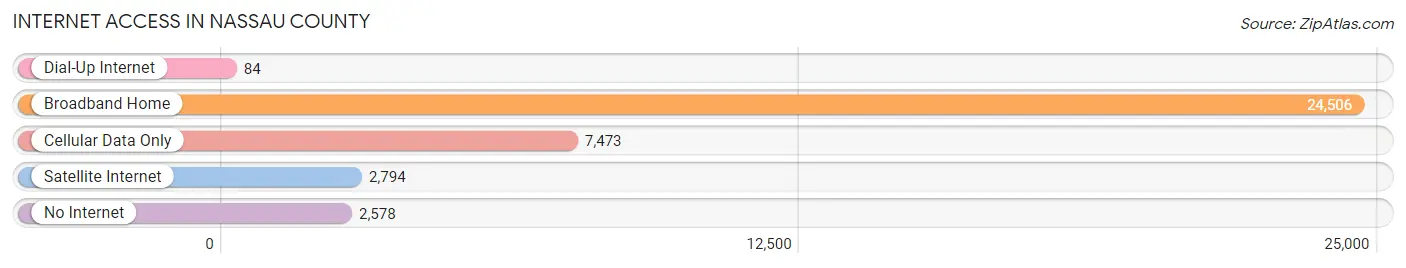
| Internet Type | # Households | % Households |
| Dial-Up Internet | 84 | 0.2% |
| Broadband Home | 24,506 | 67.4% |
| Cellular Data Only | 7,473 | 20.6% |
| Satellite Internet | 2,794 | 7.7% |
| No Internet | 2,578 | 7.1% |
| Total | 36,336 | 100.0% |
Nassau County Summary
Nassau County is located in the northeastern corner of Florida, and is part of the Jacksonville metropolitan area. It is bordered by Duval County to the west, Baker County to the north, and Camden County, Georgia to the east. Nassau County is home to approximately 80,000 people, and is the sixth most populous county in Florida.
History
Nassau County was established in 1824, and was named after the German duchy of Nassau. The county was originally part of Duval County, but was split off in 1858. The county seat is located in Fernandina Beach, which is the oldest city in Florida.
The county was originally inhabited by the Timucua and Mocama Native American tribes. The first European settlers arrived in the area in the late 1700s, and the county was officially established in 1824.
During the Civil War, Nassau County was a major center of Confederate activity. The Battle of Olustee, which was the largest battle in Florida during the war, was fought in the county in 1864.
Geography
Nassau County is located in the northeastern corner of Florida, and is part of the Jacksonville metropolitan area. It is bordered by Duval County to the west, Baker County to the north, and Camden County, Georgia to the east. The county covers an area of 726 square miles, and is the sixth largest county in Florida.
The county is mostly flat, with some rolling hills in the northern part of the county. The highest point in the county is located in the northern part of the county, and is approximately 100 feet above sea level. The county is mostly covered in pine forests, and is home to several state parks and wildlife preserves.
Economy
Nassau County has a diverse economy, with a mix of manufacturing, tourism, and agriculture. The county is home to several large manufacturing companies, including Rayonier Advanced Materials, Georgia-Pacific, and International Paper.
Tourism is also an important part of the county’s economy. The county is home to several popular beaches, including Amelia Island, Fernandina Beach, and Fort Clinch State Park. The county is also home to several golf courses, and is a popular destination for fishing and boating.
Agriculture is also an important part of the county’s economy. The county is home to several large farms, and is a major producer of vegetables, fruits, and livestock.
Demographics
As of the 2010 census, Nassau County had a population of 74,816 people. The population is spread out, with 33.3% under the age of 18, 10.2% from 18 to 24, 28.2% from 25 to 44, 21.2% from 45 to 64, and 7.1% who were 65 years of age or older. The median age was 34.3 years.
The racial makeup of the county was 79.2% White, 15.3% African American, 0.4% Native American, 1.7% Asian, 0.1% Pacific Islander, 1.7% from other races, and 1.6% from two or more races. Hispanic or Latino of any race were 5.2% of the population.
The median income for a household in the county was $45,890, and the median income for a family was $54,890. The per capita income for the county was $24,890. About 11.2% of families and 14.3% of the population were below the poverty line, including 19.2% of those under age 18 and 8.2% of those age 65 or over.
Common Questions
What is Per Capita Income in Nassau County?
Per Capita income in Nassau County is $44,483.
What is the Median Family Income in Nassau County?
Median Family Income in Nassau County is $96,039.
What is the Median Household income in Nassau County?
Median Household Income in Nassau County is $84,085.
What is Income or Wage Gap in Nassau County?
Income or Wage Gap in Nassau County is 35.3%.
Women in Nassau County earn 64.7 cents for every dollar earned by a man.
What is Family Income Deficit in Nassau County?
Family Income Deficit in Nassau County is $10,314.
Families that are below poverty line in Nassau County earn $10,314 less on average than the poverty threshold level.
What is Inequality or Gini Index in Nassau County?
Inequality or Gini Index in Nassau County is 0.44.
What is the Total Population of Nassau County?
Total Population of Nassau County is 91,538.
What is the Total Male Population of Nassau County?
Total Male Population of Nassau County is 45,302.
What is the Total Female Population of Nassau County?
Total Female Population of Nassau County is 46,236.
What is the Ratio of Males per 100 Females in Nassau County?
There are 97.98 Males per 100 Females in Nassau County.
What is the Ratio of Females per 100 Males in Nassau County?
There are 102.06 Females per 100 Males in Nassau County.
What is the Median Population Age in Nassau County?
Median Population Age in Nassau County is 46.3 Years.
What is the Average Family Size in Nassau County
Average Family Size in Nassau County is 2.9 People.
What is the Average Household Size in Nassau County
Average Household Size in Nassau County is 2.5 People.
How Large is the Labor Force in Nassau County?
There are 43,634 People in the Labor Forcein in Nassau County.
What is the Percentage of People in the Labor Force in Nassau County?
57.7% of People are in the Labor Force in Nassau County.
What is the Unemployment Rate in Nassau County?
Unemployment Rate in Nassau County is 4.1%.