Madison County, FL Map & Demographics
Madison County Map
Madison County Overview
$22,760
PER CAPITA INCOME
$56,621
AVG FAMILY INCOME
$43,386
AVG HOUSEHOLD INCOME
23.1%
WAGE / INCOME GAP [ % ]
76.9¢/ $1
WAGE / INCOME GAP [ $ ]
$12,708
FAMILY INCOME DEFICIT
0.47
INEQUALITY / GINI INDEX
17,986
TOTAL POPULATION
9,439
MALE POPULATION
8,547
FEMALE POPULATION
110.44
MALES / 100 FEMALES
90.55
FEMALES / 100 MALES
44.5
MEDIAN AGE
3.1
AVG FAMILY SIZE
2.4
AVG HOUSEHOLD SIZE
6,392
LABOR FORCE [ PEOPLE ]
42.4%
PERCENT IN LABOR FORCE
2.7%
UNEMPLOYMENT RATE
Income in Madison County
Income Overview in Madison County
Per Capita Income in Madison County is $22,760, while median incomes of families and households are $56,621 and $43,386 respectively.
| Characteristic | Number | Measure |
| Per Capita Income | 17,986 | $22,760 |
| Median Family Income | 3,984 | $56,621 |
| Mean Family Income | 3,984 | $74,794 |
| Median Household Income | 6,693 | $43,386 |
| Mean Household Income | 6,693 | $60,056 |
| Income Deficit | 3,984 | $12,708 |
| Wage / Income Gap (%) | 17,986 | 23.12% |
| Wage / Income Gap ($) | 17,986 | 76.88¢ per $1 |
| Gini / Inequality Index | 17,986 | 0.47 |
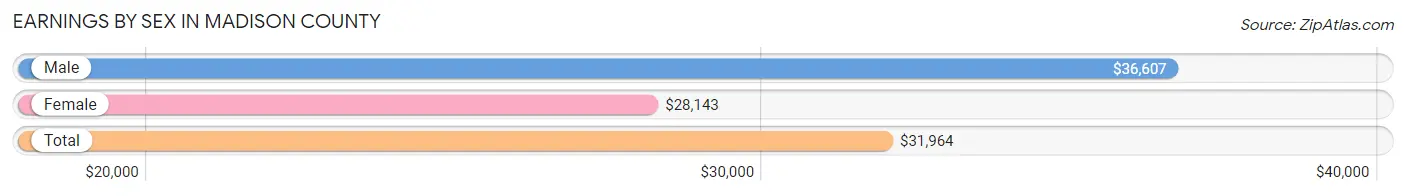
Earnings by Sex in Madison County
Average Earnings in Madison County are $31,964, $36,607 for men and $28,143 for women, a difference of 23.1%.
| Sex | Number | Average Earnings |
| Male | 3,529 (53.1%) | $36,607 |
| Female | 3,116 (46.9%) | $28,143 |
| Total | 6,645 (100.0%) | $31,964 |
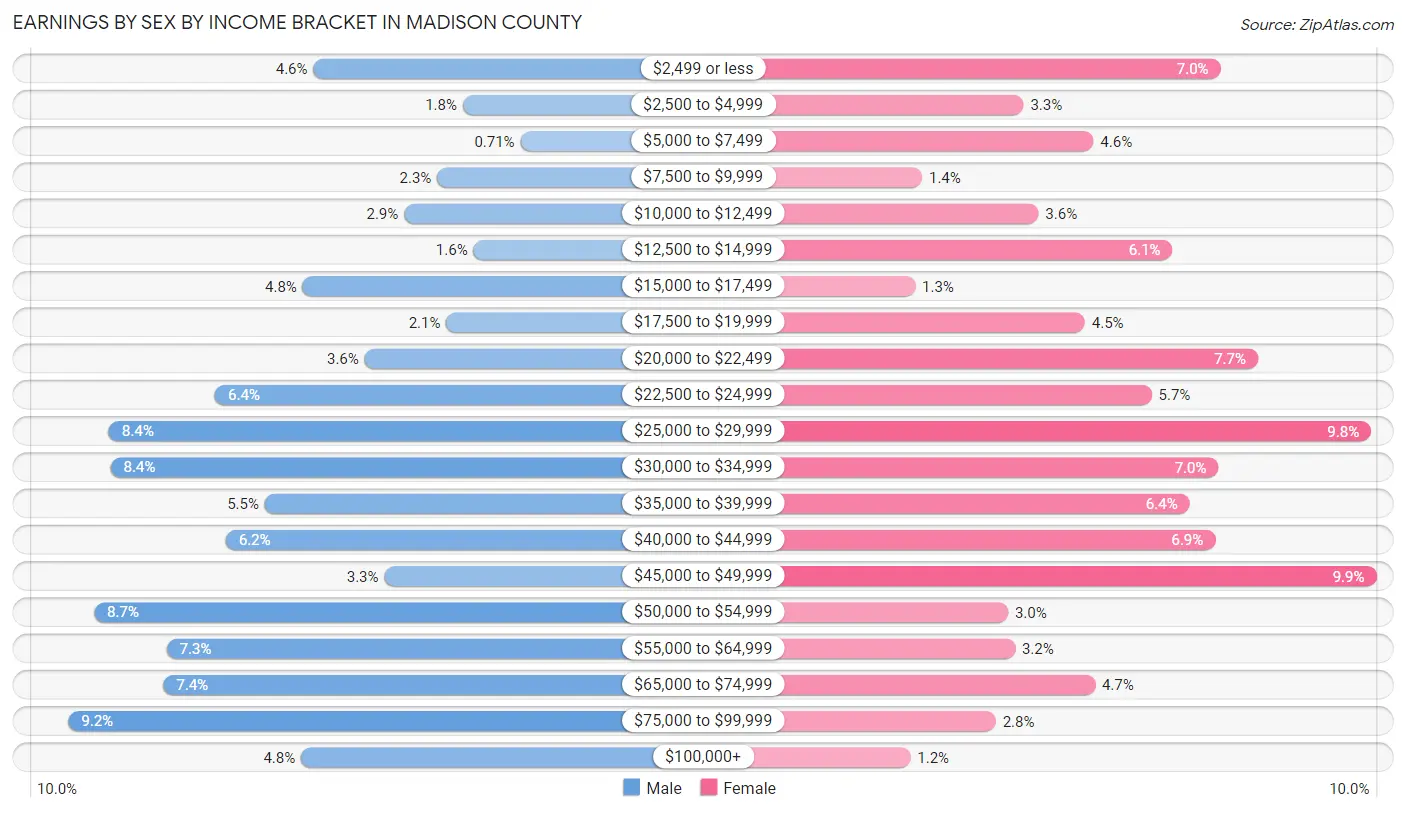
Earnings by Sex by Income Bracket in Madison County
The most common earnings brackets in Madison County are $75,000 to $99,999 for men (324 | 9.2%) and $45,000 to $49,999 for women (309 | 9.9%).
| Income | Male | Female |
| $2,499 or less | 162 (4.6%) | 218 (7.0%) |
| $2,500 to $4,999 | 63 (1.8%) | 103 (3.3%) |
| $5,000 to $7,499 | 25 (0.7%) | 144 (4.6%) |
| $7,500 to $9,999 | 80 (2.3%) | 44 (1.4%) |
| $10,000 to $12,499 | 102 (2.9%) | 112 (3.6%) |
| $12,500 to $14,999 | 56 (1.6%) | 190 (6.1%) |
| $15,000 to $17,499 | 169 (4.8%) | 40 (1.3%) |
| $17,500 to $19,999 | 74 (2.1%) | 139 (4.5%) |
| $20,000 to $22,499 | 128 (3.6%) | 240 (7.7%) |
| $22,500 to $24,999 | 227 (6.4%) | 178 (5.7%) |
| $25,000 to $29,999 | 297 (8.4%) | 306 (9.8%) |
| $30,000 to $34,999 | 296 (8.4%) | 217 (7.0%) |
| $35,000 to $39,999 | 194 (5.5%) | 200 (6.4%) |
| $40,000 to $44,999 | 220 (6.2%) | 215 (6.9%) |
| $45,000 to $49,999 | 115 (3.3%) | 309 (9.9%) |
| $50,000 to $54,999 | 307 (8.7%) | 94 (3.0%) |
| $55,000 to $64,999 | 259 (7.3%) | 98 (3.2%) |
| $65,000 to $74,999 | 261 (7.4%) | 145 (4.6%) |
| $75,000 to $99,999 | 324 (9.2%) | 87 (2.8%) |
| $100,000+ | 170 (4.8%) | 37 (1.2%) |
| Total | 3,529 (100.0%) | 3,116 (100.0%) |
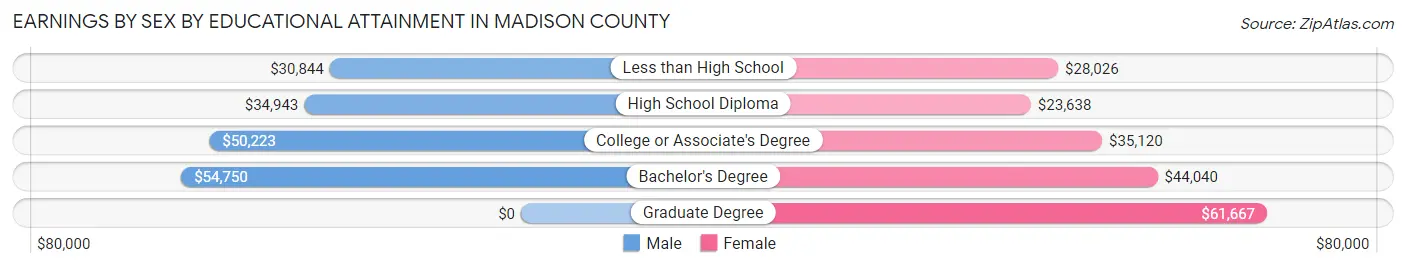
Earnings by Sex by Educational Attainment in Madison County
Average earnings in Madison County are $41,173 for men and $33,397 for women, a difference of 18.9%. Men with an educational attainment of bachelor's degree enjoy the highest average annual earnings of $54,750, while those with less than high school education earn the least with $30,844. Women with an educational attainment of graduate degree earn the most with the average annual earnings of $61,667, while those with high school diploma education have the smallest earnings of $23,638.
| Educational Attainment | Male Income | Female Income |
| Less than High School | $30,844 | $28,026 |
| High School Diploma | $34,943 | $23,638 |
| College or Associate's Degree | $50,223 | $35,120 |
| Bachelor's Degree | $54,750 | $44,040 |
| Graduate Degree | - | - |
| Total | $41,173 | $33,397 |
Family Income in Madison County
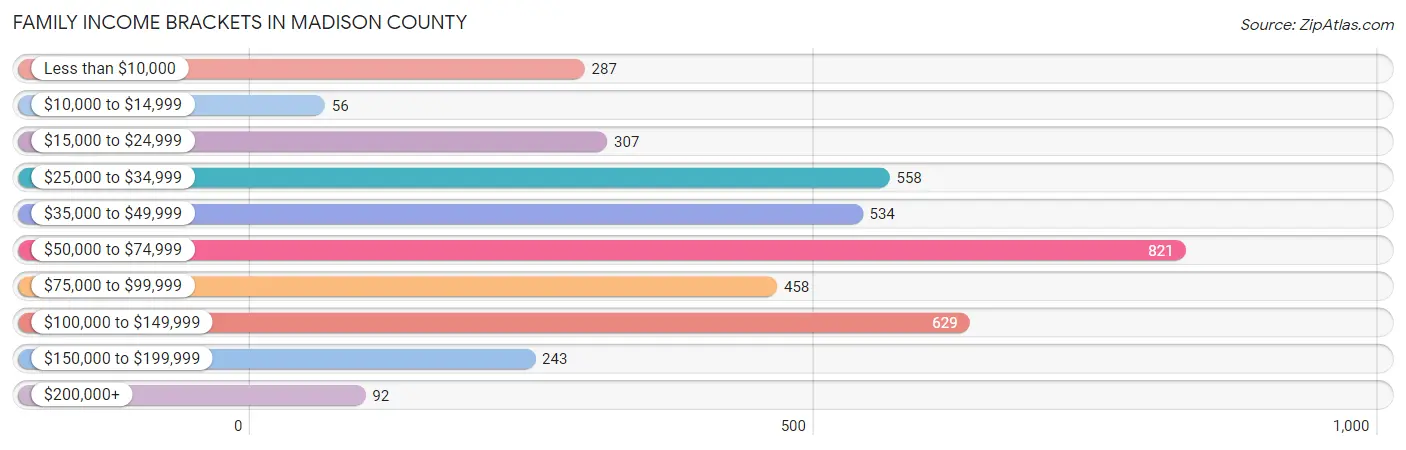
Family Income Brackets in Madison County
According to the Madison County family income data, there are 821 families falling into the $50,000 to $74,999 income range, which is the most common income bracket and makes up 20.6% of all families. Conversely, the $10,000 to $14,999 income bracket is the least frequent group with only 56 families (1.4%) belonging to this category.
| Income Bracket | # Families | % Families |
| Less than $10,000 | 287 | 7.2% |
| $10,000 to $14,999 | 56 | 1.4% |
| $15,000 to $24,999 | 307 | 7.7% |
| $25,000 to $34,999 | 558 | 14.0% |
| $35,000 to $49,999 | 534 | 13.4% |
| $50,000 to $74,999 | 821 | 20.6% |
| $75,000 to $99,999 | 458 | 11.5% |
| $100,000 to $149,999 | 629 | 15.8% |
| $150,000 to $199,999 | 243 | 6.1% |
| $200,000+ | 92 | 2.3% |
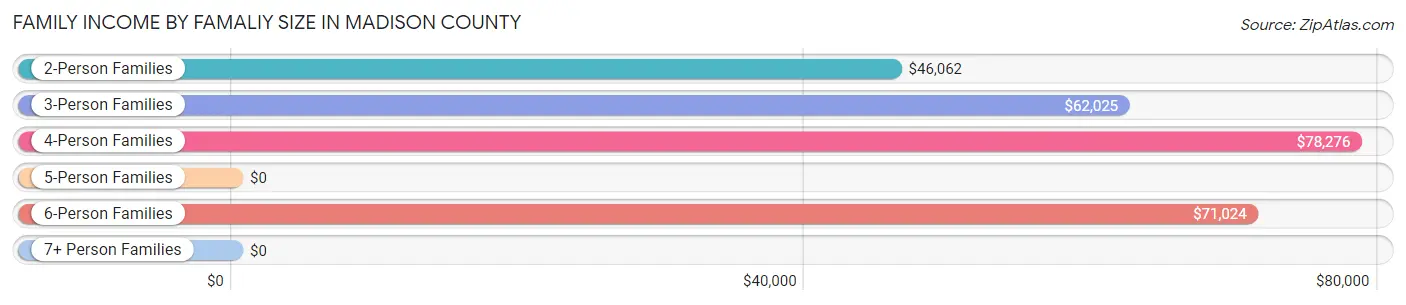
Family Income by Famaliy Size in Madison County
4-person families (724 | 18.2%) account for the highest median family income in Madison County with $78,276 per family, while 2-person families (2,050 | 51.5%) have the highest median income of $23,031 per family member.
| Income Bracket | # Families | Median Income |
| 2-Person Families | 2,050 (51.5%) | $46,062 |
| 3-Person Families | 745 (18.7%) | $62,025 |
| 4-Person Families | 724 (18.2%) | $78,276 |
| 5-Person Families | 258 (6.5%) | $0 |
| 6-Person Families | 107 (2.7%) | $71,024 |
| 7+ Person Families | 100 (2.5%) | $0 |
| Total | 3,984 (100.0%) | $56,621 |
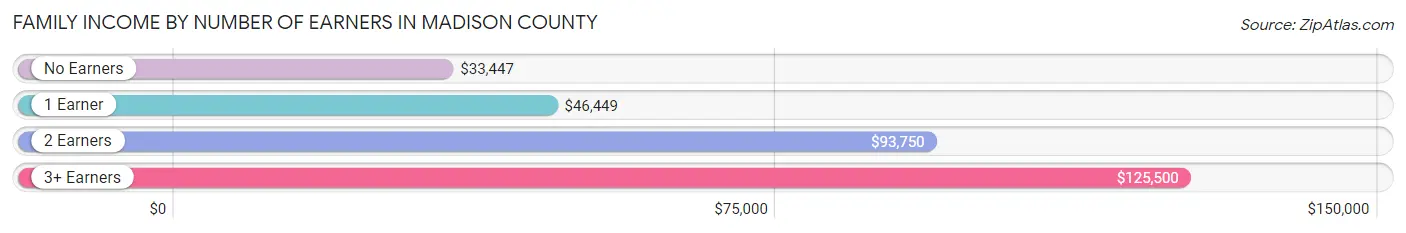
Family Income by Number of Earners in Madison County
The median family income in Madison County is $56,621, with families comprising 3+ earners (284) having the highest median family income of $125,500, while families with no earners (1,077) have the lowest median family income of $33,447, accounting for 7.1% and 27.0% of families, respectively.
| Number of Earners | # Families | Median Income |
| No Earners | 1,077 (27.0%) | $33,447 |
| 1 Earner | 1,390 (34.9%) | $46,449 |
| 2 Earners | 1,233 (30.9%) | $93,750 |
| 3+ Earners | 284 (7.1%) | $125,500 |
| Total | 3,984 (100.0%) | $56,621 |
Household Income in Madison County
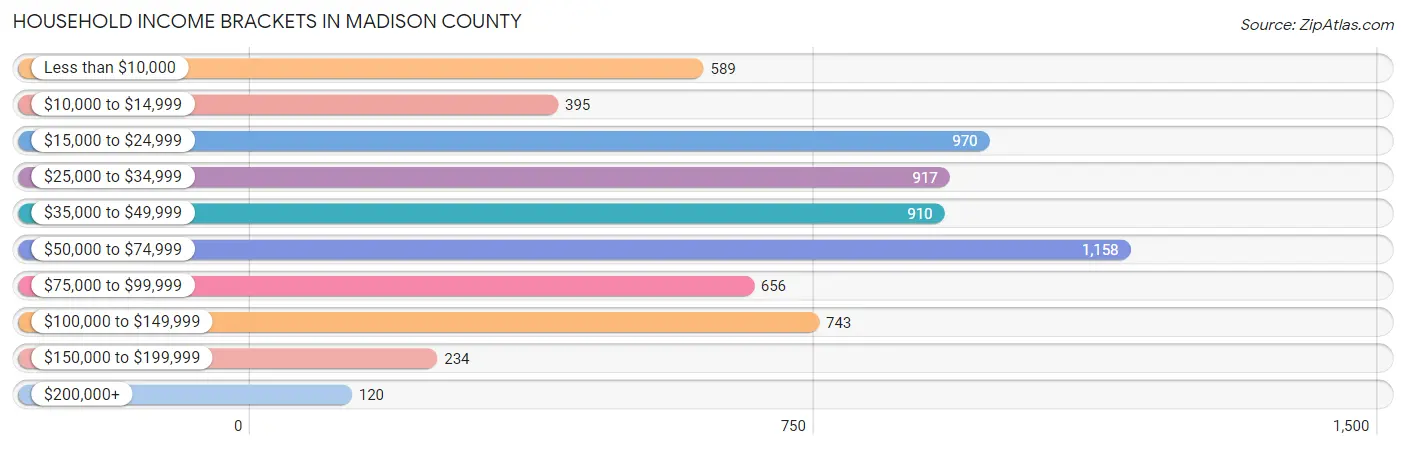
Household Income Brackets in Madison County
With 1,158 households falling in the category, the $50,000 to $74,999 income range is the most frequent in Madison County, accounting for 17.3% of all households. In contrast, only 120 households (1.8%) fall into the $200,000+ income bracket, making it the least populous group.
| Income Bracket | # Households | % Households |
| Less than $10,000 | 589 | 8.8% |
| $10,000 to $14,999 | 395 | 5.9% |
| $15,000 to $24,999 | 970 | 14.5% |
| $25,000 to $34,999 | 917 | 13.7% |
| $35,000 to $49,999 | 910 | 13.6% |
| $50,000 to $74,999 | 1,158 | 17.3% |
| $75,000 to $99,999 | 656 | 9.8% |
| $100,000 to $149,999 | 743 | 11.1% |
| $150,000 to $199,999 | 234 | 3.5% |
| $200,000+ | 120 | 1.8% |
Household Income by Householder Age in Madison County
The median household income in Madison County is $43,386, with the highest median household income of $49,595 found in the 25 to 44 years age bracket for the primary householder. A total of 1,780 households (26.6%) fall into this category. Meanwhile, the 15 to 24 years age bracket for the primary householder has the lowest median household income of $0, with 244 households (3.6%) in this group.
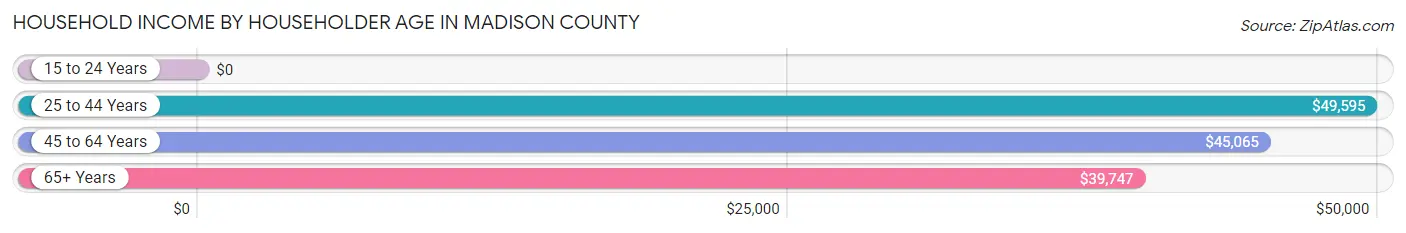
| Income Bracket | # Households | Median Income |
| 15 to 24 Years | 244 (3.6%) | $0 |
| 25 to 44 Years | 1,780 (26.6%) | $49,595 |
| 45 to 64 Years | 2,327 (34.8%) | $45,065 |
| 65+ Years | 2,342 (35.0%) | $39,747 |
| Total | 6,693 (100.0%) | $43,386 |
Poverty in Madison County
Income Below Poverty by Sex and Age in Madison County
With 21.9% poverty level for males and 22.9% for females among the residents of Madison County, 5 year old males and 5 year old females are the most vulnerable to poverty, with 103 males (56.0%) and 86 females (78.2%) in their respective age groups living below the poverty level.
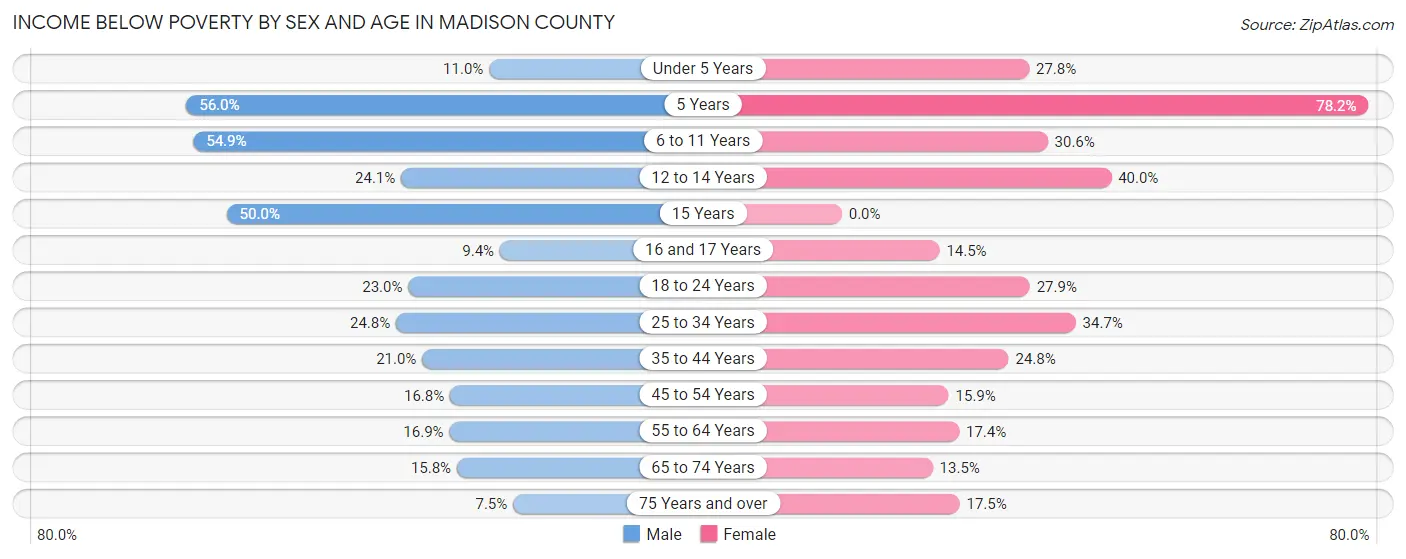
| Age Bracket | Male | Female |
| Under 5 Years | 51 (11.0%) | 104 (27.8%) |
| 5 Years | 103 (56.0%) | 86 (78.2%) |
| 6 to 11 Years | 289 (54.9%) | 165 (30.6%) |
| 12 to 14 Years | 79 (24.1%) | 66 (40.0%) |
| 15 Years | 47 (50.0%) | 0 (0.0%) |
| 16 and 17 Years | 18 (9.4%) | 19 (14.5%) |
| 18 to 24 Years | 99 (23.0%) | 151 (27.9%) |
| 25 to 34 Years | 320 (24.8%) | 389 (34.7%) |
| 35 to 44 Years | 183 (21.0%) | 235 (24.8%) |
| 45 to 54 Years | 148 (16.8%) | 158 (15.9%) |
| 55 to 64 Years | 158 (16.9%) | 227 (17.4%) |
| 65 to 74 Years | 179 (15.8%) | 156 (13.5%) |
| 75 Years and over | 35 (7.5%) | 146 (17.5%) |
| Total | 1,709 (21.9%) | 1,902 (22.9%) |
Income Above Poverty by Sex and Age in Madison County
According to the poverty statistics in Madison County, males aged 75 years and over and females aged 15 years are the age groups that are most secure financially, with 92.5% of males and 100.0% of females in these age groups living above the poverty line.
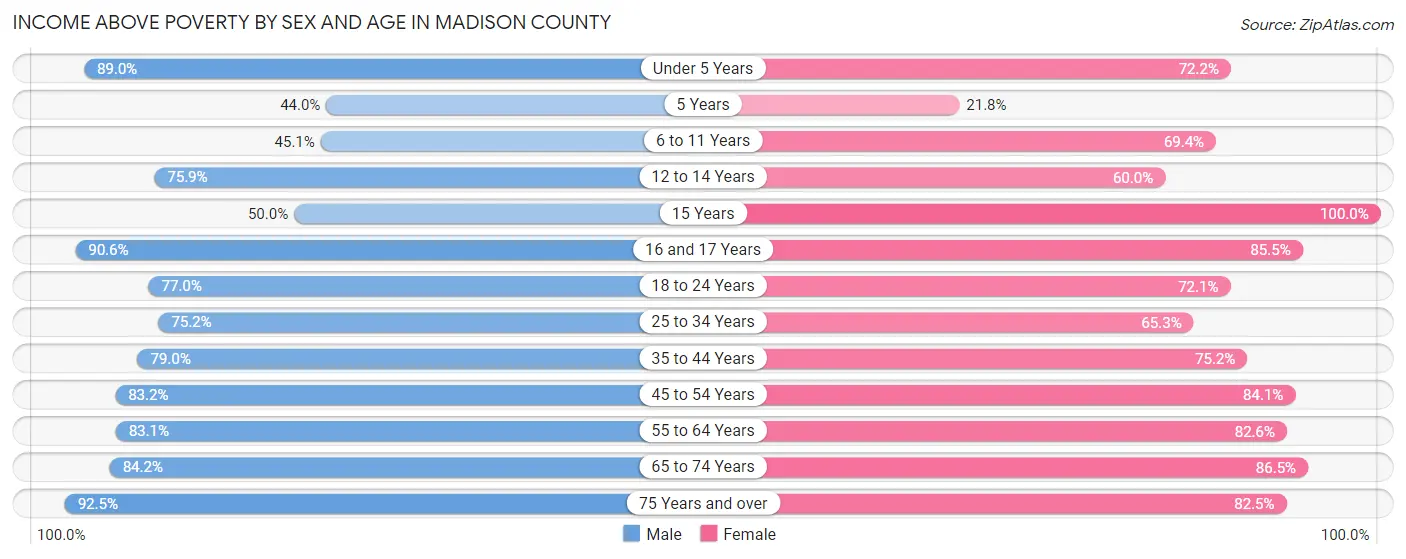
| Age Bracket | Male | Female |
| Under 5 Years | 412 (89.0%) | 270 (72.2%) |
| 5 Years | 81 (44.0%) | 24 (21.8%) |
| 6 to 11 Years | 237 (45.1%) | 375 (69.4%) |
| 12 to 14 Years | 249 (75.9%) | 99 (60.0%) |
| 15 Years | 47 (50.0%) | 73 (100.0%) |
| 16 and 17 Years | 173 (90.6%) | 112 (85.5%) |
| 18 to 24 Years | 331 (77.0%) | 390 (72.1%) |
| 25 to 34 Years | 968 (75.2%) | 731 (65.3%) |
| 35 to 44 Years | 690 (79.0%) | 714 (75.2%) |
| 45 to 54 Years | 732 (83.2%) | 838 (84.1%) |
| 55 to 64 Years | 776 (83.1%) | 1,077 (82.6%) |
| 65 to 74 Years | 954 (84.2%) | 1,000 (86.5%) |
| 75 Years and over | 434 (92.5%) | 689 (82.5%) |
| Total | 6,084 (78.1%) | 6,392 (77.1%) |
Income Below Poverty Among Married-Couple Families in Madison County
The poverty statistics for married-couple families in Madison County show that 12.9% or 361 of the total 2,793 families live below the poverty line. Families with 5 or more children have the highest poverty rate of 100.0%, comprising of 61 families. On the other hand, families with 1 or 2 children have the lowest poverty rate of 2.9%, which includes 22 families.
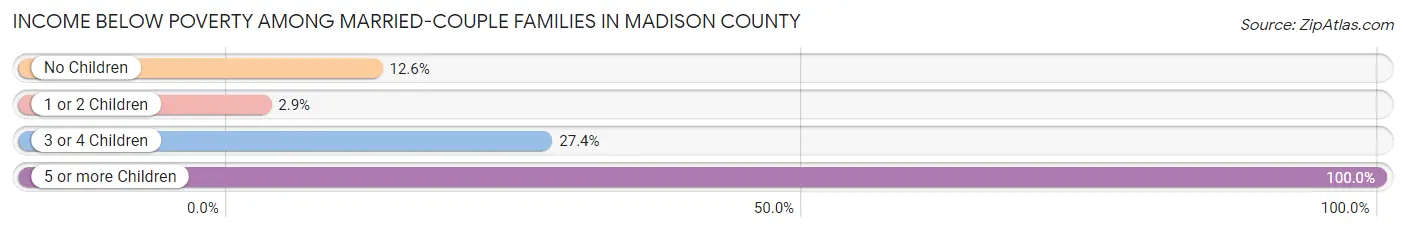
| Children | Above Poverty | Below Poverty |
| No Children | 1,550 (87.4%) | 223 (12.6%) |
| 1 or 2 Children | 736 (97.1%) | 22 (2.9%) |
| 3 or 4 Children | 146 (72.6%) | 55 (27.4%) |
| 5 or more Children | 0 (0.0%) | 61 (100.0%) |
| Total | 2,432 (87.1%) | 361 (12.9%) |
Income Below Poverty Among Single-Parent Households in Madison County
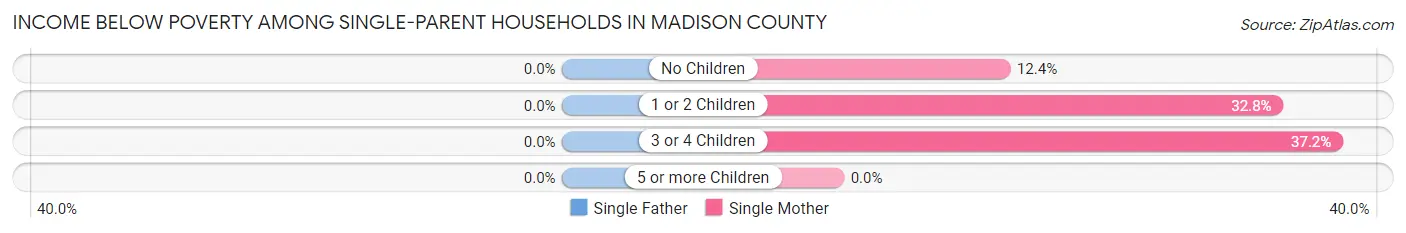
| Children | Single Father | Single Mother |
| No Children | 0 (0.0%) | 41 (12.4%) |
| 1 or 2 Children | 0 (0.0%) | 134 (32.8%) |
| 3 or 4 Children | 0 (0.0%) | 64 (37.2%) |
| 5 or more Children | 0 (0.0%) | 0 (0.0%) |
| Total | 0 (0.0%) | 239 (26.2%) |
Income Below Poverty Among Married-Couple vs Single-Parent Households in Madison County
The poverty data for Madison County shows that 361 of the married-couple family households (12.9%) and 239 of the single-parent households (20.1%) are living below the poverty level. Within the married-couple family households, those with 5 or more children have the highest poverty rate, with 61 households (100.0%) falling below the poverty line. Among the single-parent households, those with 3 or 4 children have the highest poverty rate, with 64 household (34.8%) living below poverty.
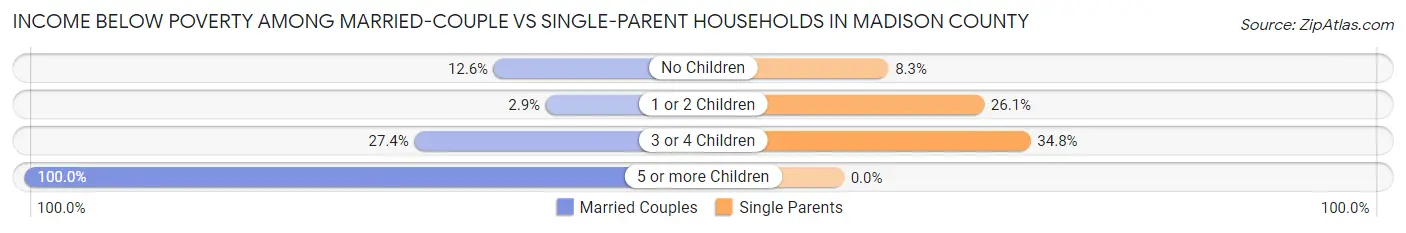
| Children | Married-Couple Families | Single-Parent Households |
| No Children | 223 (12.6%) | 41 (8.3%) |
| 1 or 2 Children | 22 (2.9%) | 134 (26.1%) |
| 3 or 4 Children | 55 (27.4%) | 64 (34.8%) |
| 5 or more Children | 61 (100.0%) | 0 (0.0%) |
| Total | 361 (12.9%) | 239 (20.1%) |
Race in Madison County
The most populous races in Madison County are White / Caucasian (10,260 | 57.0%), Black / African American (6,541 | 36.4%), and Hispanic or Latino (1,139 | 6.3%).
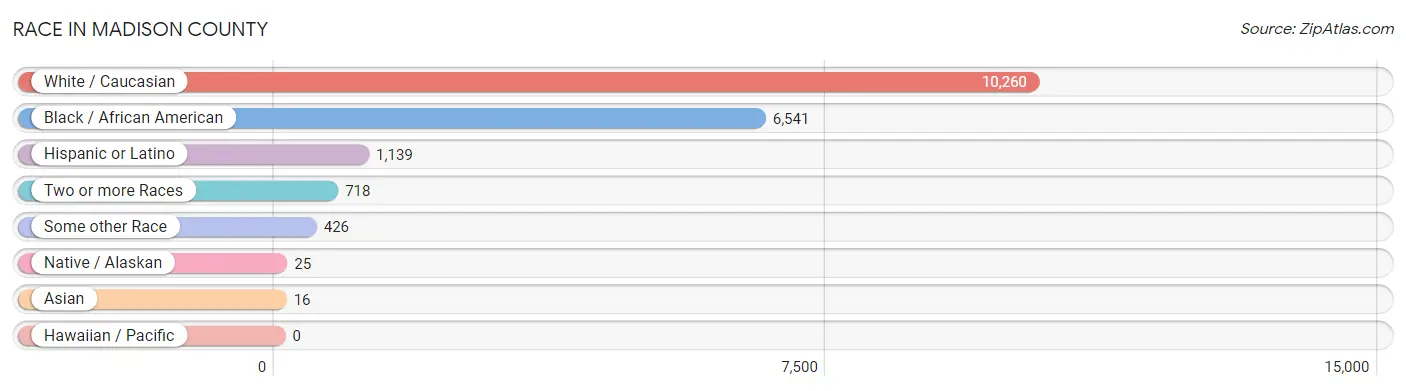
| Race | # Population | % Population |
| Asian | 16 | 0.1% |
| Black / African American | 6,541 | 36.4% |
| Hawaiian / Pacific | 0 | 0.0% |
| Hispanic or Latino | 1,139 | 6.3% |
| Native / Alaskan | 25 | 0.1% |
| White / Caucasian | 10,260 | 57.0% |
| Two or more Races | 718 | 4.0% |
| Some other Race | 426 | 2.4% |
| Total | 17,986 | 100.0% |
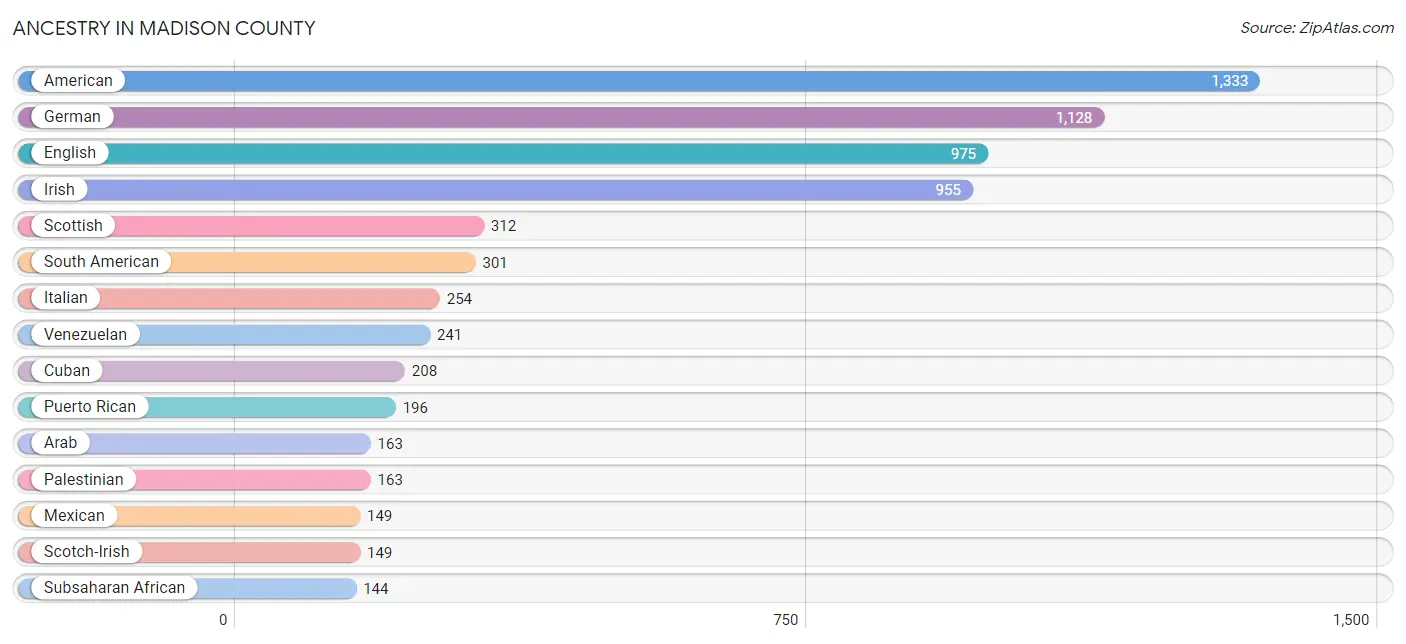
Ancestry in Madison County
The most populous ancestries reported in Madison County are American (1,333 | 7.4%), German (1,128 | 6.3%), English (975 | 5.4%), Irish (955 | 5.3%), and Scottish (312 | 1.7%), together accounting for 26.1% of all Madison County residents.
| Ancestry | # Population | % Population |
| African | 123 | 0.7% |
| American | 1,333 | 7.4% |
| Arab | 163 | 0.9% |
| Austrian | 9 | 0.1% |
| Bahamian | 1 | 0.0% |
| Belgian | 8 | 0.0% |
| Blackfeet | 51 | 0.3% |
| British | 62 | 0.3% |
| Burmese | 11 | 0.1% |
| Canadian | 37 | 0.2% |
| Cape Verdean | 21 | 0.1% |
| Celtic | 5 | 0.0% |
| Central American | 133 | 0.7% |
| Central American Indian | 2 | 0.0% |
| Cherokee | 32 | 0.2% |
| Chippewa | 7 | 0.0% |
| Colombian | 53 | 0.3% |
| Creek | 21 | 0.1% |
| Cuban | 208 | 1.2% |
| Danish | 5 | 0.0% |
| Dominican | 95 | 0.5% |
| Dutch | 31 | 0.2% |
| English | 975 | 5.4% |
| European | 54 | 0.3% |
| French | 70 | 0.4% |
| French Canadian | 4 | 0.0% |
| German | 1,128 | 6.3% |
| Guatemalan | 8 | 0.0% |
| Haitian | 49 | 0.3% |
| Honduran | 27 | 0.2% |
| Houma | 3 | 0.0% |
| Hungarian | 33 | 0.2% |
| Irish | 955 | 5.3% |
| Italian | 254 | 1.4% |
| Jamaican | 98 | 0.5% |
| Mexican | 149 | 0.8% |
| Mexican American Indian | 7 | 0.0% |
| Nicaraguan | 98 | 0.5% |
| Norwegian | 31 | 0.2% |
| Palestinian | 163 | 0.9% |
| Paraguayan | 7 | 0.0% |
| Pennsylvania German | 46 | 0.3% |
| Polish | 60 | 0.3% |
| Puerto Rican | 196 | 1.1% |
| Scandinavian | 71 | 0.4% |
| Scotch-Irish | 149 | 0.8% |
| Scottish | 312 | 1.7% |
| South American | 301 | 1.7% |
| Spanish | 47 | 0.3% |
| Sri Lankan | 4 | 0.0% |
| Subsaharan African | 144 | 0.8% |
| Swedish | 47 | 0.3% |
| Swiss | 14 | 0.1% |
| Thai | 1 | 0.0% |
| Trinidadian and Tobagonian | 6 | 0.0% |
| Venezuelan | 241 | 1.3% |
| Welsh | 128 | 0.7% | View All 57 Rows |
Immigrants in Madison County
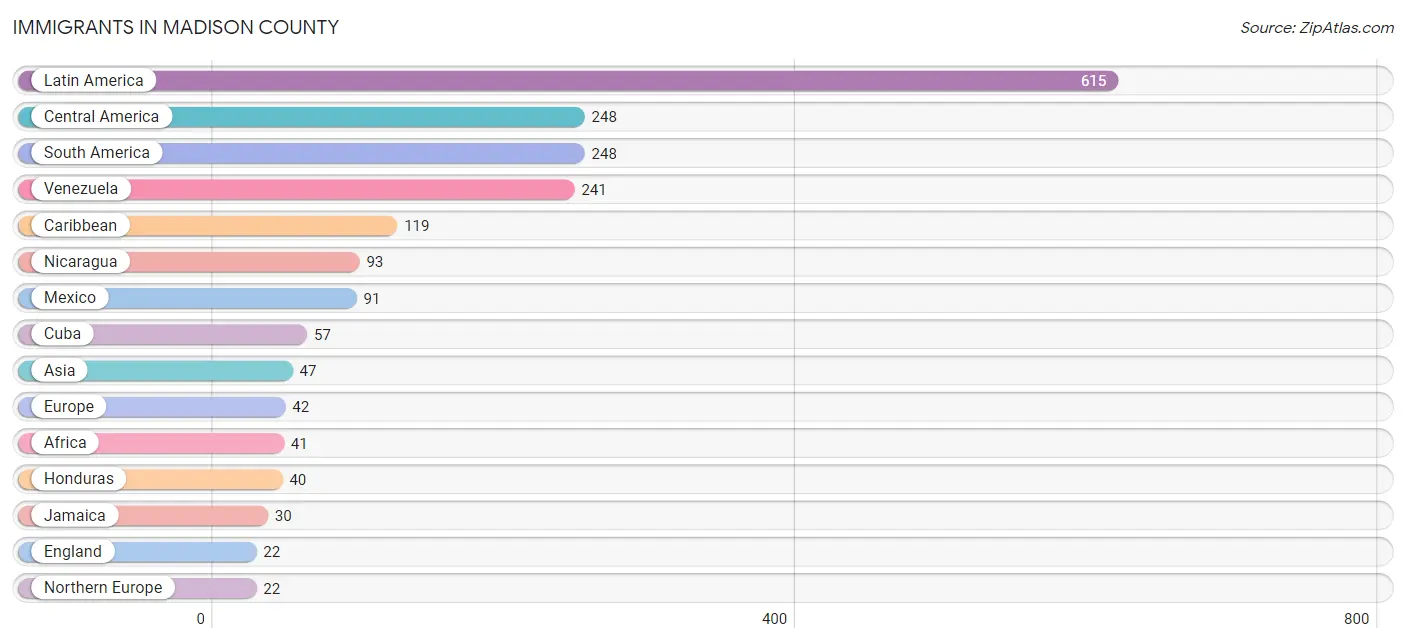
The most numerous immigrant groups reported in Madison County came from Latin America (615 | 3.4%), Central America (248 | 1.4%), South America (248 | 1.4%), Venezuela (241 | 1.3%), and Caribbean (119 | 0.7%), together accounting for 8.2% of all Madison County residents.
| Immigration Origin | # Population | % Population |
| Africa | 41 | 0.2% |
| Asia | 47 | 0.3% |
| Belgium | 8 | 0.0% |
| Cabo Verde | 21 | 0.1% |
| Canada | 17 | 0.1% |
| Caribbean | 119 | 0.7% |
| Central America | 248 | 1.4% |
| Cuba | 57 | 0.3% |
| Dominican Republic | 19 | 0.1% |
| Eastern Asia | 11 | 0.1% |
| England | 22 | 0.1% |
| Europe | 42 | 0.2% |
| Guatemala | 17 | 0.1% |
| Haiti | 13 | 0.1% |
| Honduras | 40 | 0.2% |
| Italy | 12 | 0.1% |
| Jamaica | 30 | 0.2% |
| Korea | 11 | 0.1% |
| Latin America | 615 | 3.4% |
| Mexico | 91 | 0.5% |
| Nicaragua | 93 | 0.5% |
| Northern Europe | 22 | 0.1% |
| Panama | 7 | 0.0% |
| South Africa | 7 | 0.0% |
| South America | 248 | 1.4% |
| South Eastern Asia | 1 | 0.0% |
| Southern Europe | 12 | 0.1% |
| Venezuela | 241 | 1.3% |
| Vietnam | 1 | 0.0% |
| Western Africa | 21 | 0.1% |
| Western Europe | 8 | 0.0% | View All 31 Rows |
Sex and Age in Madison County
Sex and Age in Madison County
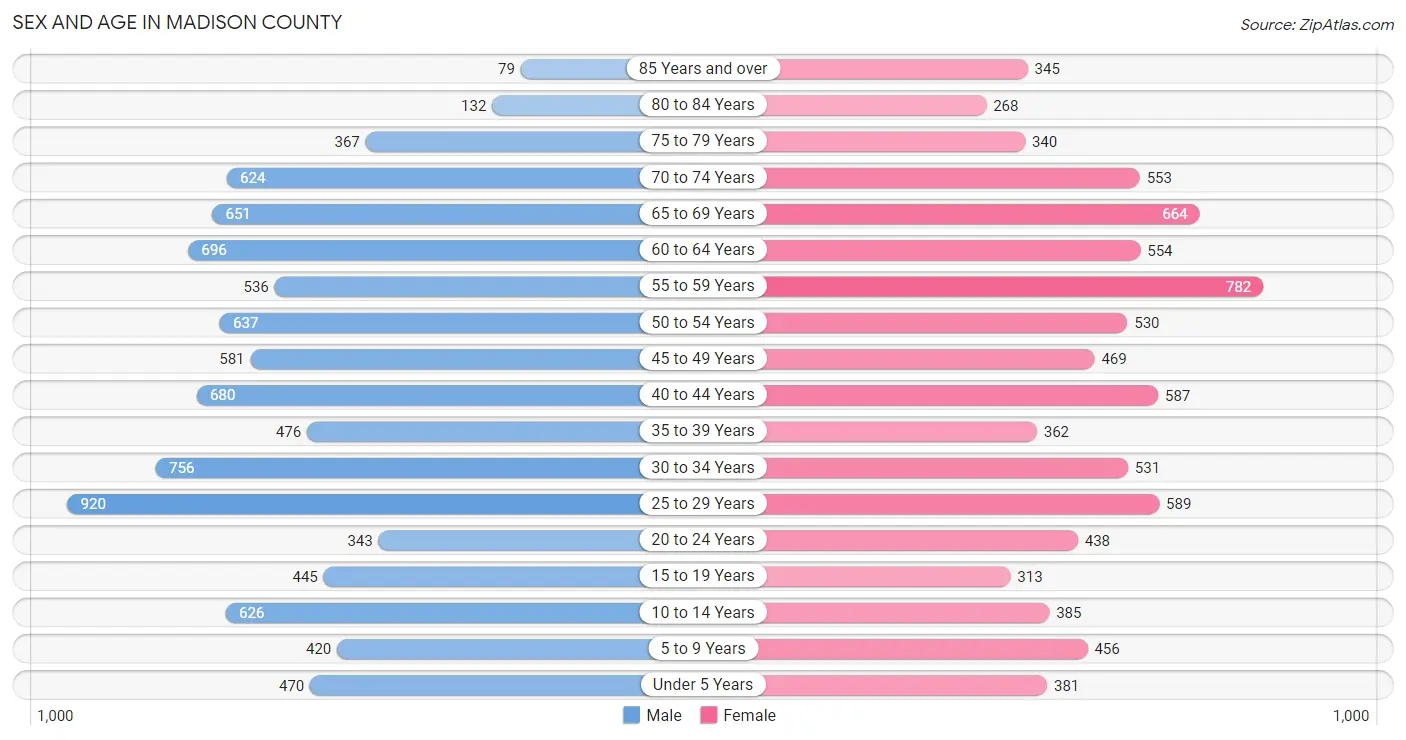
The most populous age groups in Madison County are 25 to 29 Years (920 | 9.8%) for men and 55 to 59 Years (782 | 9.1%) for women.
| Age Bracket | Male | Female |
| Under 5 Years | 470 (5.0%) | 381 (4.5%) |
| 5 to 9 Years | 420 (4.4%) | 456 (5.3%) |
| 10 to 14 Years | 626 (6.6%) | 385 (4.5%) |
| 15 to 19 Years | 445 (4.7%) | 313 (3.7%) |
| 20 to 24 Years | 343 (3.6%) | 438 (5.1%) |
| 25 to 29 Years | 920 (9.8%) | 589 (6.9%) |
| 30 to 34 Years | 756 (8.0%) | 531 (6.2%) |
| 35 to 39 Years | 476 (5.0%) | 362 (4.2%) |
| 40 to 44 Years | 680 (7.2%) | 587 (6.9%) |
| 45 to 49 Years | 581 (6.2%) | 469 (5.5%) |
| 50 to 54 Years | 637 (6.8%) | 530 (6.2%) |
| 55 to 59 Years | 536 (5.7%) | 782 (9.1%) |
| 60 to 64 Years | 696 (7.4%) | 554 (6.5%) |
| 65 to 69 Years | 651 (6.9%) | 664 (7.8%) |
| 70 to 74 Years | 624 (6.6%) | 553 (6.5%) |
| 75 to 79 Years | 367 (3.9%) | 340 (4.0%) |
| 80 to 84 Years | 132 (1.4%) | 268 (3.1%) |
| 85 Years and over | 79 (0.8%) | 345 (4.0%) |
| Total | 9,439 (100.0%) | 8,547 (100.0%) |
Families and Households in Madison County
Median Family Size in Madison County
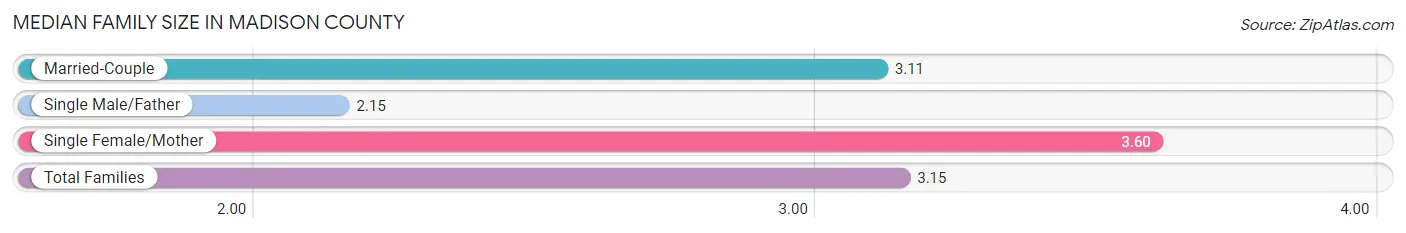
The median family size in Madison County is 3.15 persons per family, with single female/mother families (912 | 22.9%) accounting for the largest median family size of 3.6 persons per family. On the other hand, single male/father families (279 | 7.0%) represent the smallest median family size with 2.15 persons per family.
| Family Type | # Families | Family Size |
| Married-Couple | 2,793 (70.1%) | 3.11 |
| Single Male/Father | 279 (7.0%) | 2.15 |
| Single Female/Mother | 912 (22.9%) | 3.60 |
| Total Families | 3,984 (100.0%) | 3.15 |
Median Household Size in Madison County
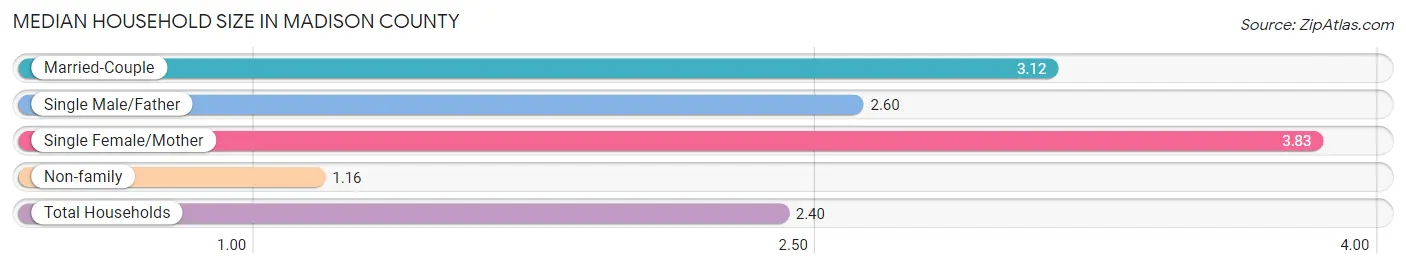
The median household size in Madison County is 2.40 persons per household, with single female/mother households (912 | 13.6%) accounting for the largest median household size of 3.83 persons per household. non-family households (2,709 | 40.5%) represent the smallest median household size with 1.16 persons per household.
| Household Type | # Households | Household Size |
| Married-Couple | 2,793 (41.7%) | 3.12 |
| Single Male/Father | 279 (4.2%) | 2.60 |
| Single Female/Mother | 912 (13.6%) | 3.83 |
| Non-family | 2,709 (40.5%) | 1.16 |
| Total Households | 6,693 (100.0%) | 2.40 |
Household Size by Marriage Status in Madison County
Out of a total of 6,693 households in Madison County, 3,984 (59.5%) are family households, while 2,709 (40.5%) are nonfamily households. The most numerous type of family households are 2-person households, comprising 1,925, and the most common type of nonfamily households are 1-person households, comprising 2,281.
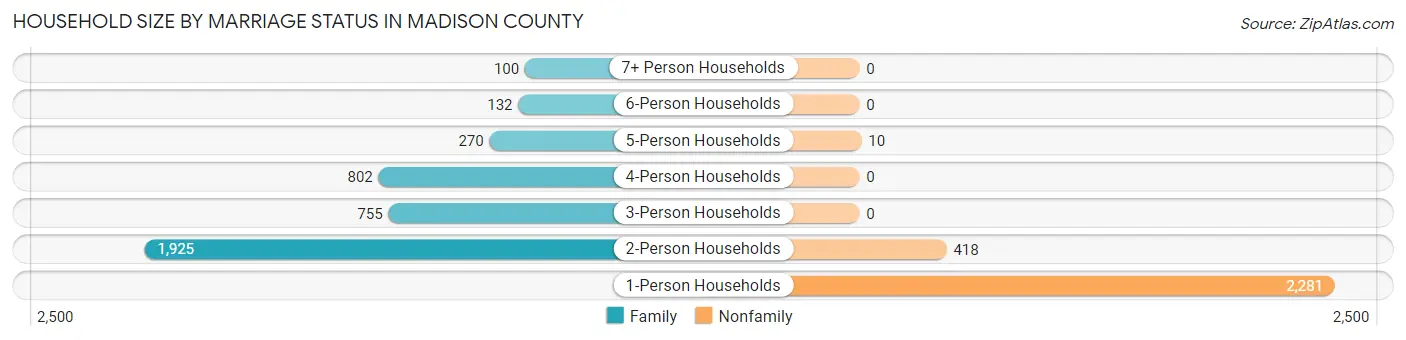
| Household Size | Family Households | Nonfamily Households |
| 1-Person Households | - | 2,281 (34.1%) |
| 2-Person Households | 1,925 (28.8%) | 418 (6.2%) |
| 3-Person Households | 755 (11.3%) | 0 (0.0%) |
| 4-Person Households | 802 (12.0%) | 0 (0.0%) |
| 5-Person Households | 270 (4.0%) | 10 (0.2%) |
| 6-Person Households | 132 (2.0%) | 0 (0.0%) |
| 7+ Person Households | 100 (1.5%) | 0 (0.0%) |
| Total | 3,984 (59.5%) | 2,709 (40.5%) |
Female Fertility in Madison County
Fertility by Age in Madison County
Average fertility rate in Madison County is 195.0 births per 1,000 women. Women in the age bracket of 20 to 34 years have the highest fertility rate with 257.0 births per 1,000 women. Women in the age bracket of 20 to 34 years acount for 59.7% of all women with births.
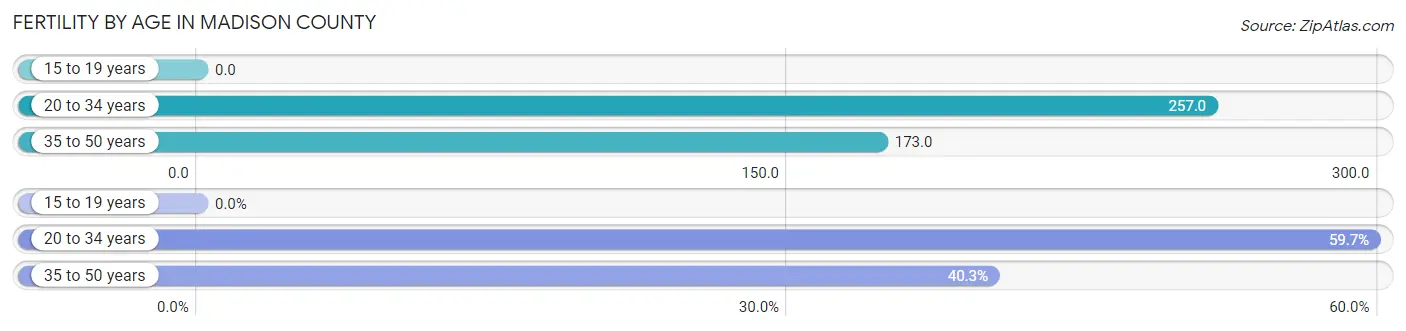
| Age Bracket | Women with Births | Births / 1,000 Women |
| 15 to 19 years | 0 (0.0%) | 0.0 |
| 20 to 34 years | 400 (59.7%) | 257.0 |
| 35 to 50 years | 270 (40.3%) | 173.0 |
| Total | 670 (100.0%) | 195.0 |
Fertility by Age by Marriage Status in Madison County
37.6% of women with births (670) in Madison County are married. The highest percentage of unmarried women with births falls into 20 to 34 years age bracket with 65.7% of them unmarried at the time of birth, while the lowest percentage of unmarried women with births belong to 35 to 50 years age bracket with 57.4% of them unmarried.
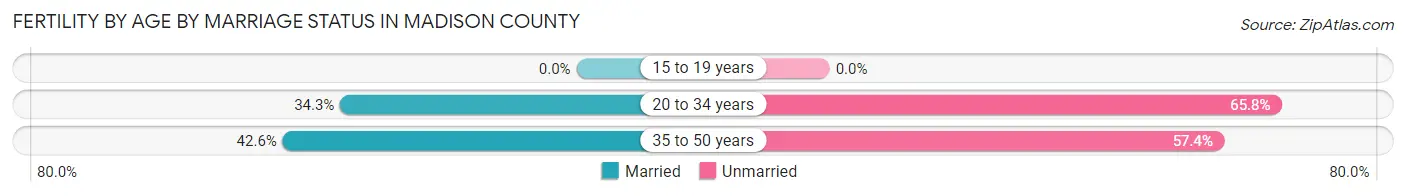
| Age Bracket | Married | Unmarried |
| 15 to 19 years | 0 (0.0%) | 0 (0.0%) |
| 20 to 34 years | 137 (34.3%) | 263 (65.7%) |
| 35 to 50 years | 115 (42.6%) | 155 (57.4%) |
| Total | 252 (37.6%) | 418 (62.4%) |
Fertility by Education in Madison County
Average fertility rate in Madison County is 195.0 births per 1,000 women. Women with the education attainment of college or associate's degree have the highest fertility rate of 271.0 births per 1,000 women, while women with the education attainment of bachelor's degree have the lowest fertility at 17.0 births per 1,000 women. Women with the education attainment of college or associate's degree represent 46.4% of all women with births.
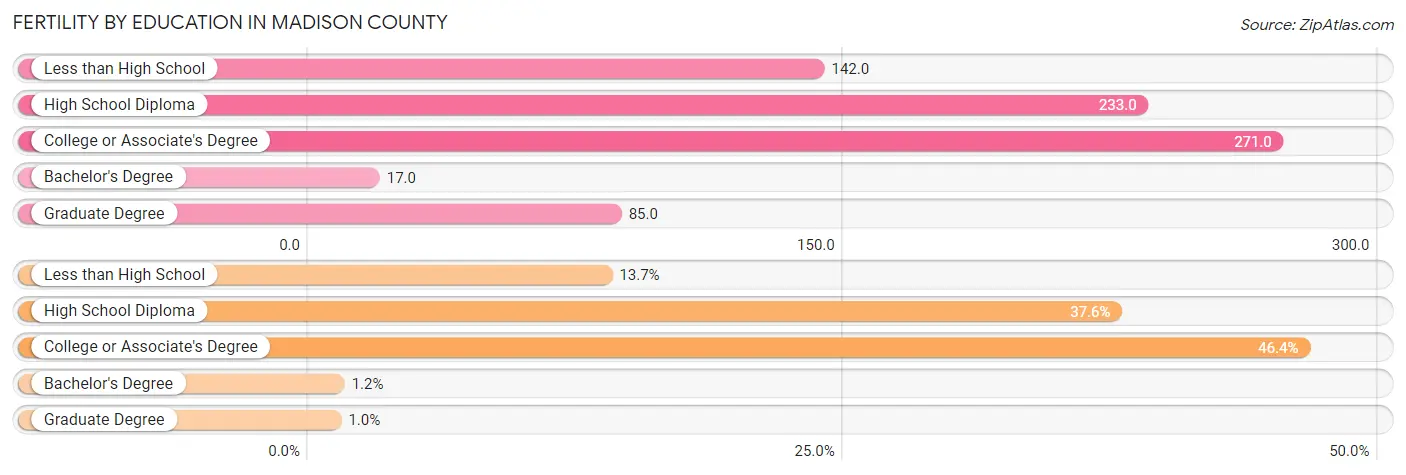
| Educational Attainment | Women with Births | Births / 1,000 Women |
| Less than High School | 92 (13.7%) | 142.0 |
| High School Diploma | 252 (37.6%) | 233.0 |
| College or Associate's Degree | 311 (46.4%) | 271.0 |
| Bachelor's Degree | 8 (1.2%) | 17.0 |
| Graduate Degree | 7 (1.0%) | 85.0 |
| Total | 670 (100.0%) | 195.0 |
Fertility by Education by Marriage Status in Madison County
62.4% of women with births in Madison County are unmarried. Women with the educational attainment of bachelor's degree are most likely to be married with 100.0% of them married at childbirth, while women with the educational attainment of less than high school are least likely to be married with 79.3% of them unmarried at childbirth.
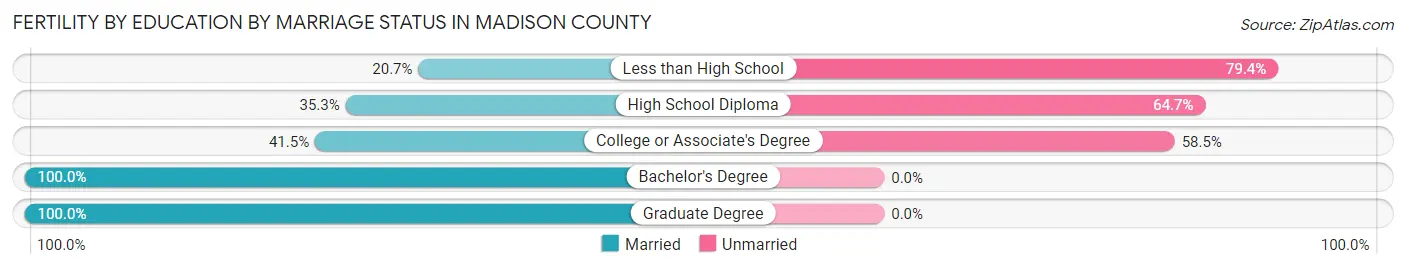
| Educational Attainment | Married | Unmarried |
| Less than High School | 19 (20.6%) | 73 (79.3%) |
| High School Diploma | 89 (35.3%) | 163 (64.7%) |
| College or Associate's Degree | 129 (41.5%) | 182 (58.5%) |
| Bachelor's Degree | 8 (100.0%) | 0 (0.0%) |
| Graduate Degree | 7 (100.0%) | 0 (0.0%) |
| Total | 252 (37.6%) | 418 (62.4%) |
Employment Characteristics in Madison County
Employment by Class of Employer in Madison County
Among the 6,020 employed individuals in Madison County, private company employees (3,631 | 60.3%), state government employees (738 | 12.3%), and local government employees (602 | 10.0%) make up the most common classes of employment.
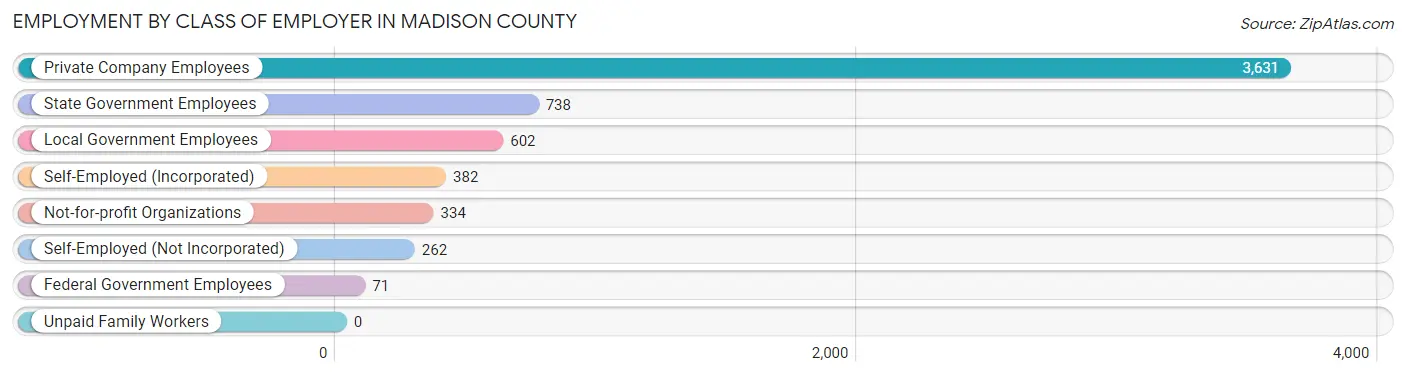
| Employer Class | # Employees | % Employees |
| Private Company Employees | 3,631 | 60.3% |
| Self-Employed (Incorporated) | 382 | 6.4% |
| Self-Employed (Not Incorporated) | 262 | 4.3% |
| Not-for-profit Organizations | 334 | 5.6% |
| Local Government Employees | 602 | 10.0% |
| State Government Employees | 738 | 12.3% |
| Federal Government Employees | 71 | 1.2% |
| Unpaid Family Workers | 0 | 0.0% |
| Total | 6,020 | 100.0% |
Employment Status by Age in Madison County
According to the labor force statistics for Madison County, out of the total population over 16 years of age (15,075), 42.4% or 6,392 individuals are in the labor force, with 2.7% or 173 of them unemployed. The age group with the highest labor force participation rate is 20 to 24 years, with 84.8% or 662 individuals in the labor force. Within the labor force, the 16 to 19 years age range has the highest percentage of unemployed individuals, with 17.6% or 44 of them being unemployed.
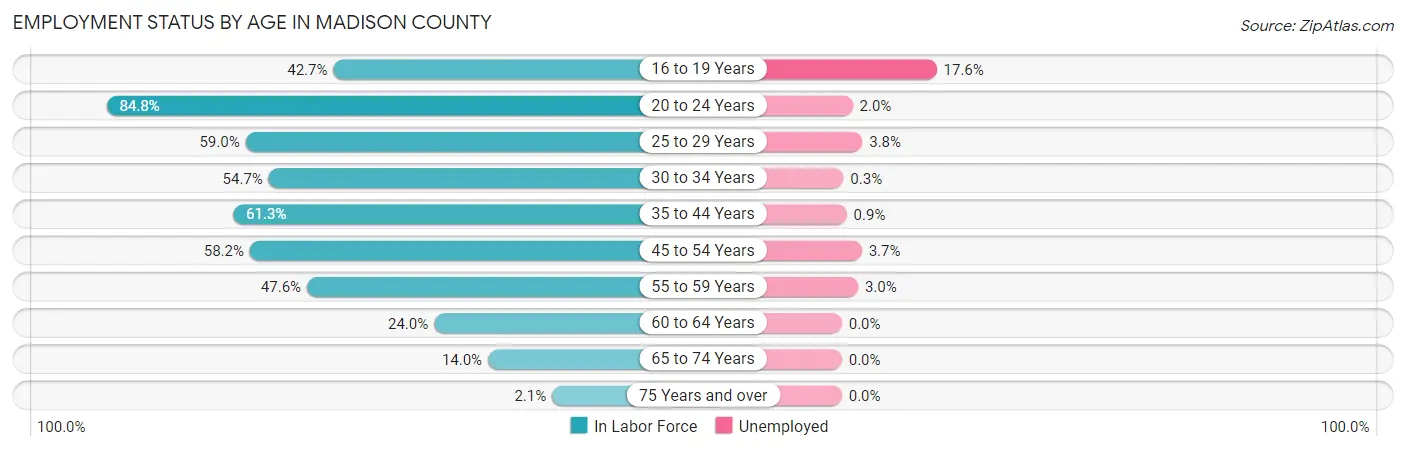
| Age Bracket | In Labor Force | Unemployed |
| 16 to 19 Years | 250 (42.7%) | 44 (17.6%) |
| 20 to 24 Years | 662 (84.8%) | 13 (2.0%) |
| 25 to 29 Years | 890 (59.0%) | 34 (3.8%) |
| 30 to 34 Years | 704 (54.7%) | 2 (0.3%) |
| 35 to 44 Years | 1,290 (61.3%) | 12 (0.9%) |
| 45 to 54 Years | 1,290 (58.2%) | 48 (3.7%) |
| 55 to 59 Years | 627 (47.6%) | 19 (3.0%) |
| 60 to 64 Years | 300 (24.0%) | 0 (0.0%) |
| 65 to 74 Years | 349 (14.0%) | 0 (0.0%) |
| 75 Years and over | 32 (2.1%) | 0 (0.0%) |
| Total | 6,392 (42.4%) | 173 (2.7%) |
Employment Status by Educational Attainment in Madison County
According to labor force statistics for Madison County, 52.7% of individuals (5,105) out of the total population between 25 and 64 years of age (9,686) are in the labor force, with 2.3% or 117 of them being unemployed. The group with the highest labor force participation rate are those with the educational attainment of bachelor's degree or higher, with 68.5% or 896 individuals in the labor force. Within the labor force, individuals with high school diploma education have the highest percentage of unemployment, with 6.0% or 100 of them being unemployed.
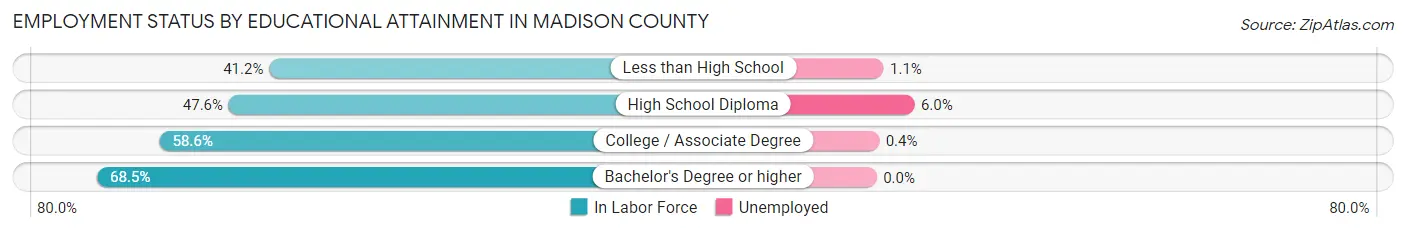
| Educational Attainment | In Labor Force | Unemployed |
| Less than High School | 754 (41.2%) | 20 (1.1%) |
| High School Diploma | 1,660 (47.6%) | 209 (6.0%) |
| College / Associate Degree | 1,794 (58.6%) | 12 (0.4%) |
| Bachelor's Degree or higher | 896 (68.5%) | 0 (0.0%) |
| Total | 5,105 (52.7%) | 223 (2.3%) |
Employment Occupations by Sex in Madison County
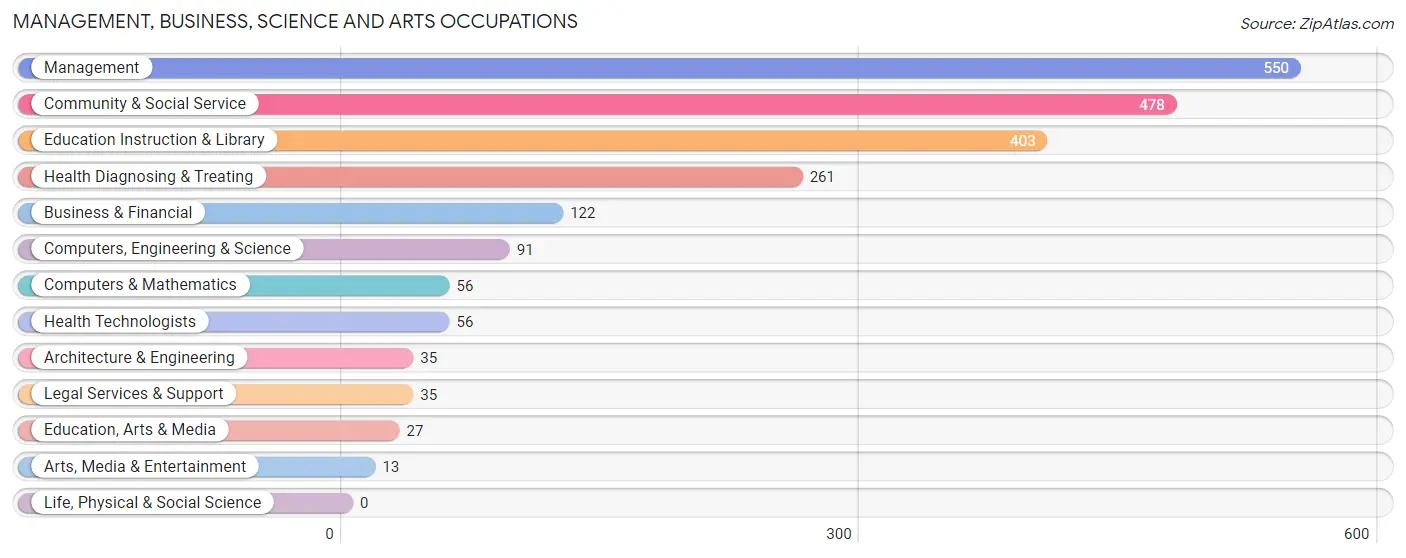
Management, Business, Science and Arts Occupations
The most common Management, Business, Science and Arts occupations in Madison County are Management (550 | 8.8%), Community & Social Service (478 | 7.7%), Education Instruction & Library (403 | 6.5%), Health Diagnosing & Treating (261 | 4.2%), and Business & Financial (122 | 2.0%).
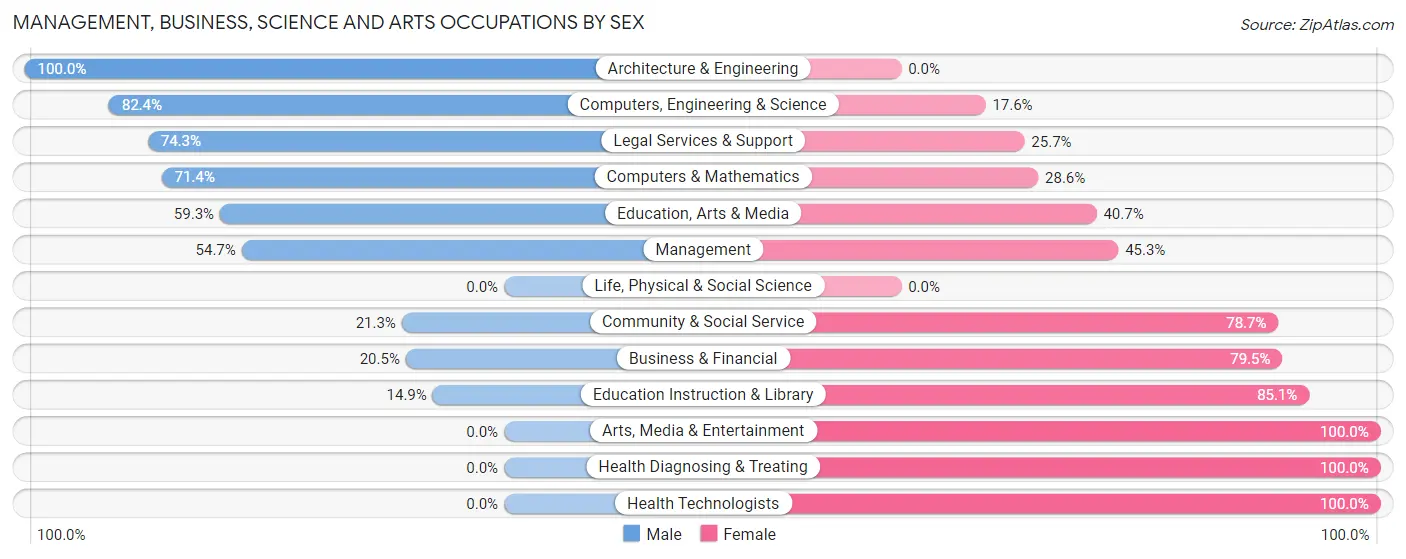
Management, Business, Science and Arts Occupations by Sex
Within the Management, Business, Science and Arts occupations in Madison County, the most male-oriented occupations are Architecture & Engineering (100.0%), Computers, Engineering & Science (82.4%), and Legal Services & Support (74.3%), while the most female-oriented occupations are Arts, Media & Entertainment (100.0%), Health Diagnosing & Treating (100.0%), and Health Technologists (100.0%).
| Occupation | Male | Female |
| Management | 301 (54.7%) | 249 (45.3%) |
| Business & Financial | 25 (20.5%) | 97 (79.5%) |
| Computers, Engineering & Science | 75 (82.4%) | 16 (17.6%) |
| Computers & Mathematics | 40 (71.4%) | 16 (28.6%) |
| Architecture & Engineering | 35 (100.0%) | 0 (0.0%) |
| Life, Physical & Social Science | 0 (0.0%) | 0 (0.0%) |
| Community & Social Service | 102 (21.3%) | 376 (78.7%) |
| Education, Arts & Media | 16 (59.3%) | 11 (40.7%) |
| Legal Services & Support | 26 (74.3%) | 9 (25.7%) |
| Education Instruction & Library | 60 (14.9%) | 343 (85.1%) |
| Arts, Media & Entertainment | 0 (0.0%) | 13 (100.0%) |
| Health Diagnosing & Treating | 0 (0.0%) | 261 (100.0%) |
| Health Technologists | 0 (0.0%) | 56 (100.0%) |
| Total (Category) | 503 (33.5%) | 999 (66.5%) |
| Total (Overall) | 3,291 (52.9%) | 2,934 (47.1%) |
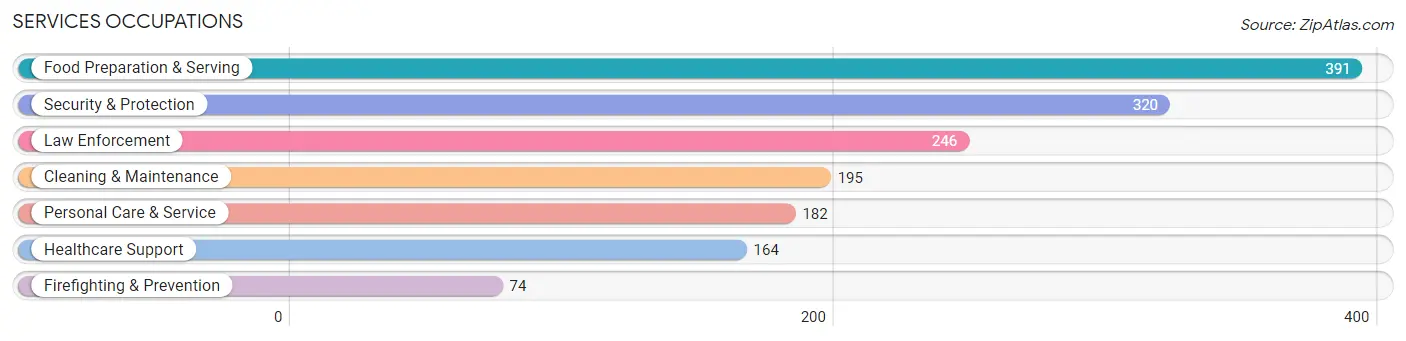
Services Occupations
The most common Services occupations in Madison County are Food Preparation & Serving (391 | 6.3%), Security & Protection (320 | 5.1%), Law Enforcement (246 | 4.0%), Cleaning & Maintenance (195 | 3.1%), and Personal Care & Service (182 | 2.9%).
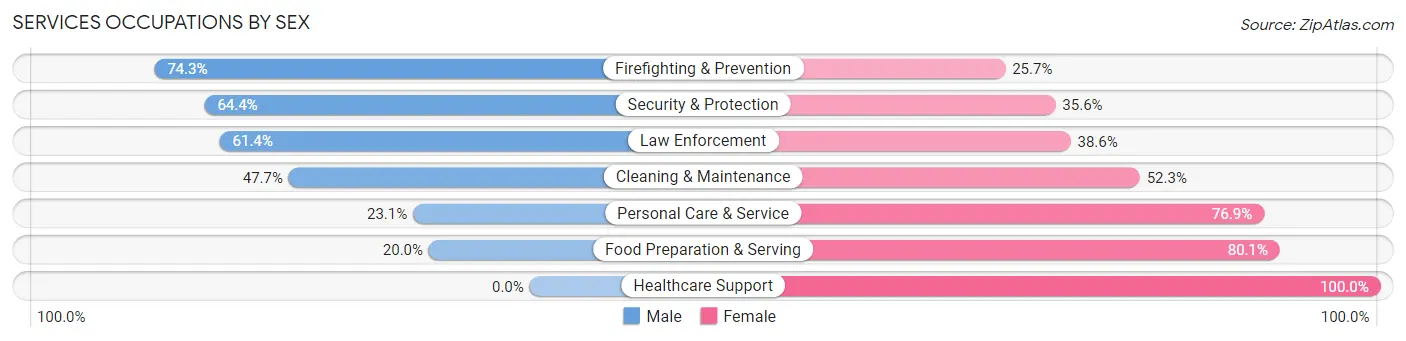
Services Occupations by Sex
Within the Services occupations in Madison County, the most male-oriented occupations are Firefighting & Prevention (74.3%), Security & Protection (64.4%), and Law Enforcement (61.4%), while the most female-oriented occupations are Healthcare Support (100.0%), Food Preparation & Serving (80.0%), and Personal Care & Service (76.9%).
| Occupation | Male | Female |
| Healthcare Support | 0 (0.0%) | 164 (100.0%) |
| Security & Protection | 206 (64.4%) | 114 (35.6%) |
| Firefighting & Prevention | 55 (74.3%) | 19 (25.7%) |
| Law Enforcement | 151 (61.4%) | 95 (38.6%) |
| Food Preparation & Serving | 78 (20.0%) | 313 (80.0%) |
| Cleaning & Maintenance | 93 (47.7%) | 102 (52.3%) |
| Personal Care & Service | 42 (23.1%) | 140 (76.9%) |
| Total (Category) | 419 (33.5%) | 833 (66.5%) |
| Total (Overall) | 3,291 (52.9%) | 2,934 (47.1%) |
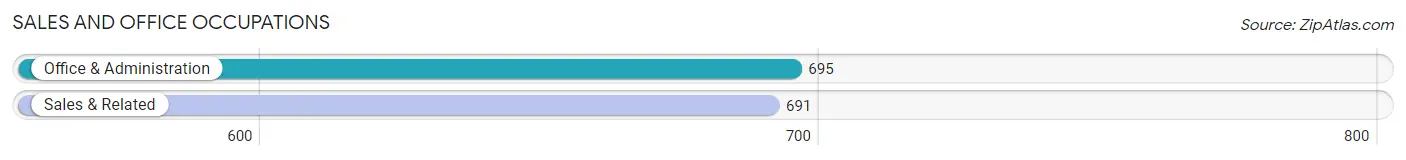
Sales and Office Occupations
The most common Sales and Office occupations in Madison County are Office & Administration (695 | 11.2%), and Sales & Related (691 | 11.1%).
Sales and Office Occupations by Sex
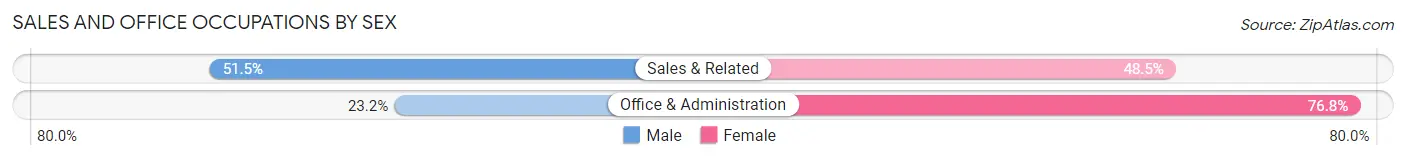
| Occupation | Male | Female |
| Sales & Related | 356 (51.5%) | 335 (48.5%) |
| Office & Administration | 161 (23.2%) | 534 (76.8%) |
| Total (Category) | 517 (37.3%) | 869 (62.7%) |
| Total (Overall) | 3,291 (52.9%) | 2,934 (47.1%) |
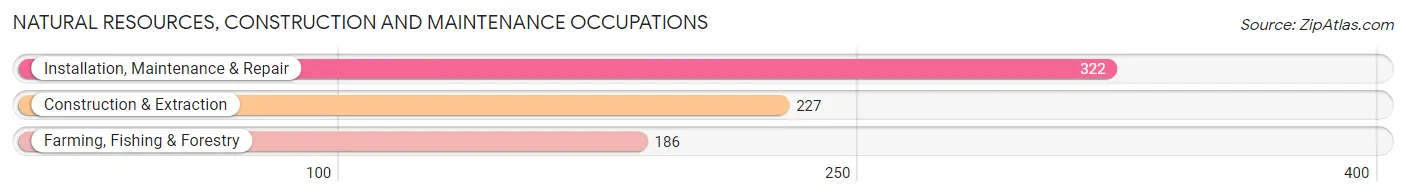
Natural Resources, Construction and Maintenance Occupations
The most common Natural Resources, Construction and Maintenance occupations in Madison County are Installation, Maintenance & Repair (322 | 5.2%), Construction & Extraction (227 | 3.6%), and Farming, Fishing & Forestry (186 | 3.0%).
Natural Resources, Construction and Maintenance Occupations by Sex
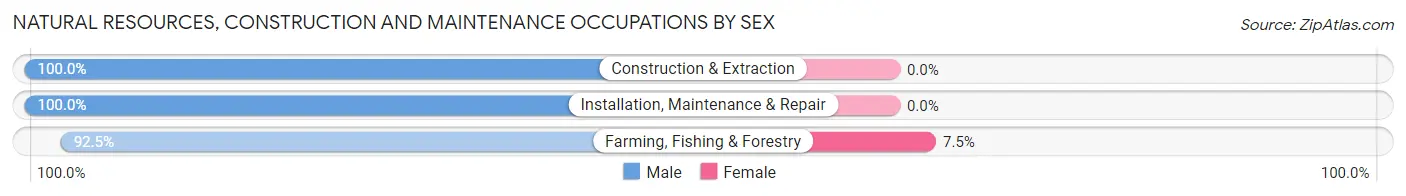
| Occupation | Male | Female |
| Farming, Fishing & Forestry | 172 (92.5%) | 14 (7.5%) |
| Construction & Extraction | 227 (100.0%) | 0 (0.0%) |
| Installation, Maintenance & Repair | 322 (100.0%) | 0 (0.0%) |
| Total (Category) | 721 (98.1%) | 14 (1.9%) |
| Total (Overall) | 3,291 (52.9%) | 2,934 (47.1%) |
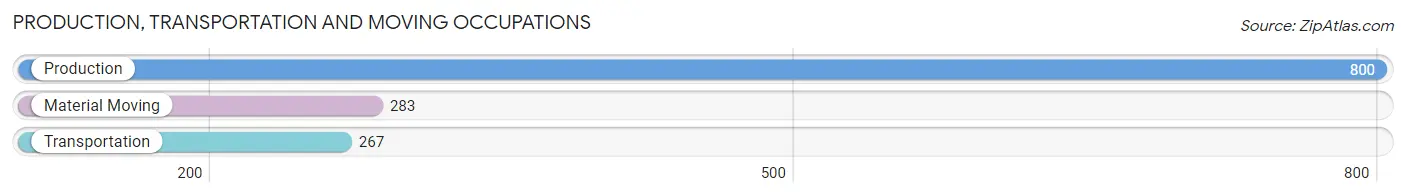
Production, Transportation and Moving Occupations
The most common Production, Transportation and Moving occupations in Madison County are Production (800 | 12.9%), Material Moving (283 | 4.5%), and Transportation (267 | 4.3%).
Production, Transportation and Moving Occupations by Sex
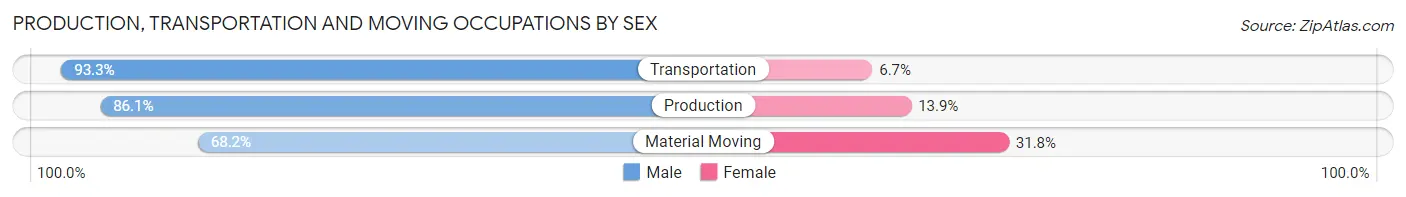
| Occupation | Male | Female |
| Production | 689 (86.1%) | 111 (13.9%) |
| Transportation | 249 (93.3%) | 18 (6.7%) |
| Material Moving | 193 (68.2%) | 90 (31.8%) |
| Total (Category) | 1,131 (83.8%) | 219 (16.2%) |
| Total (Overall) | 3,291 (52.9%) | 2,934 (47.1%) |
Employment Industries by Sex in Madison County
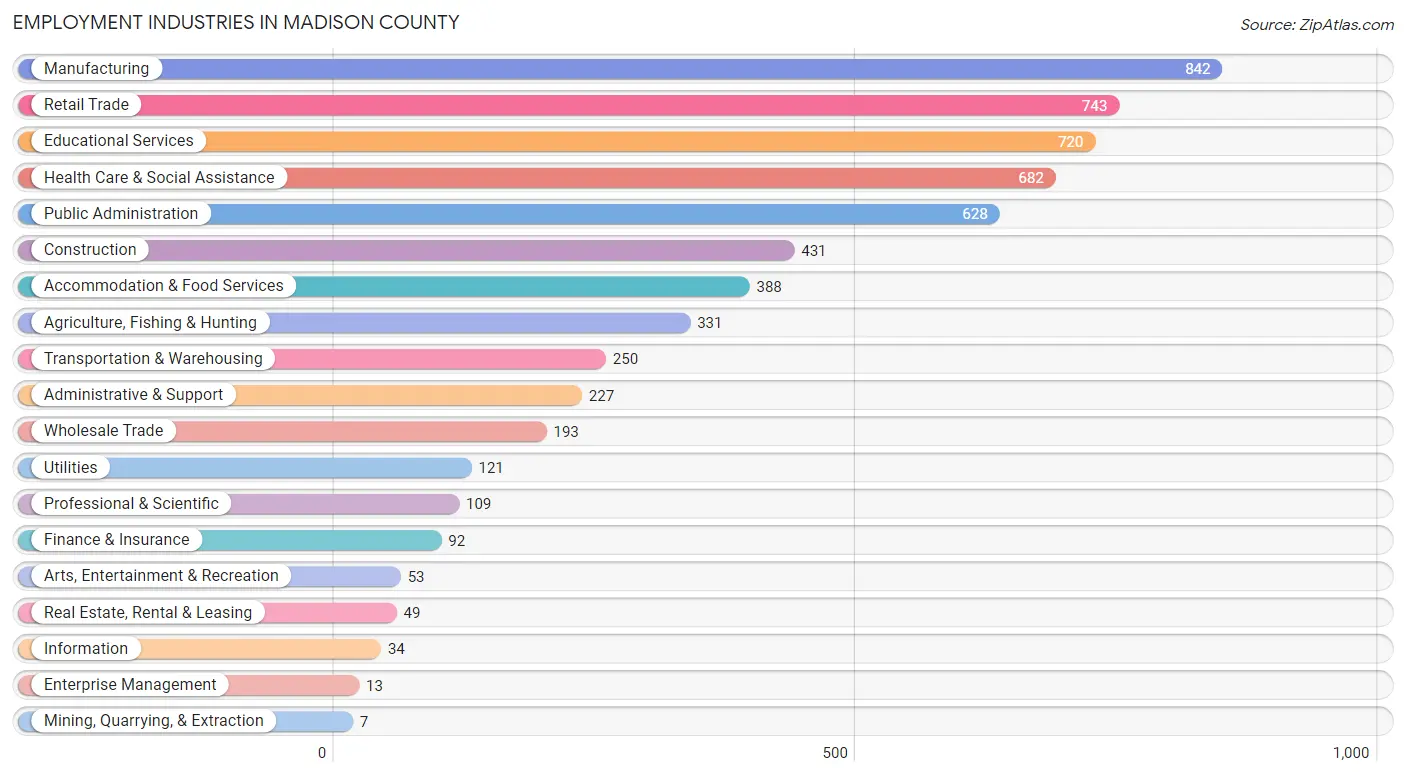
Employment Industries in Madison County
The major employment industries in Madison County include Manufacturing (842 | 13.5%), Retail Trade (743 | 11.9%), Educational Services (720 | 11.6%), Health Care & Social Assistance (682 | 11.0%), and Public Administration (628 | 10.1%).
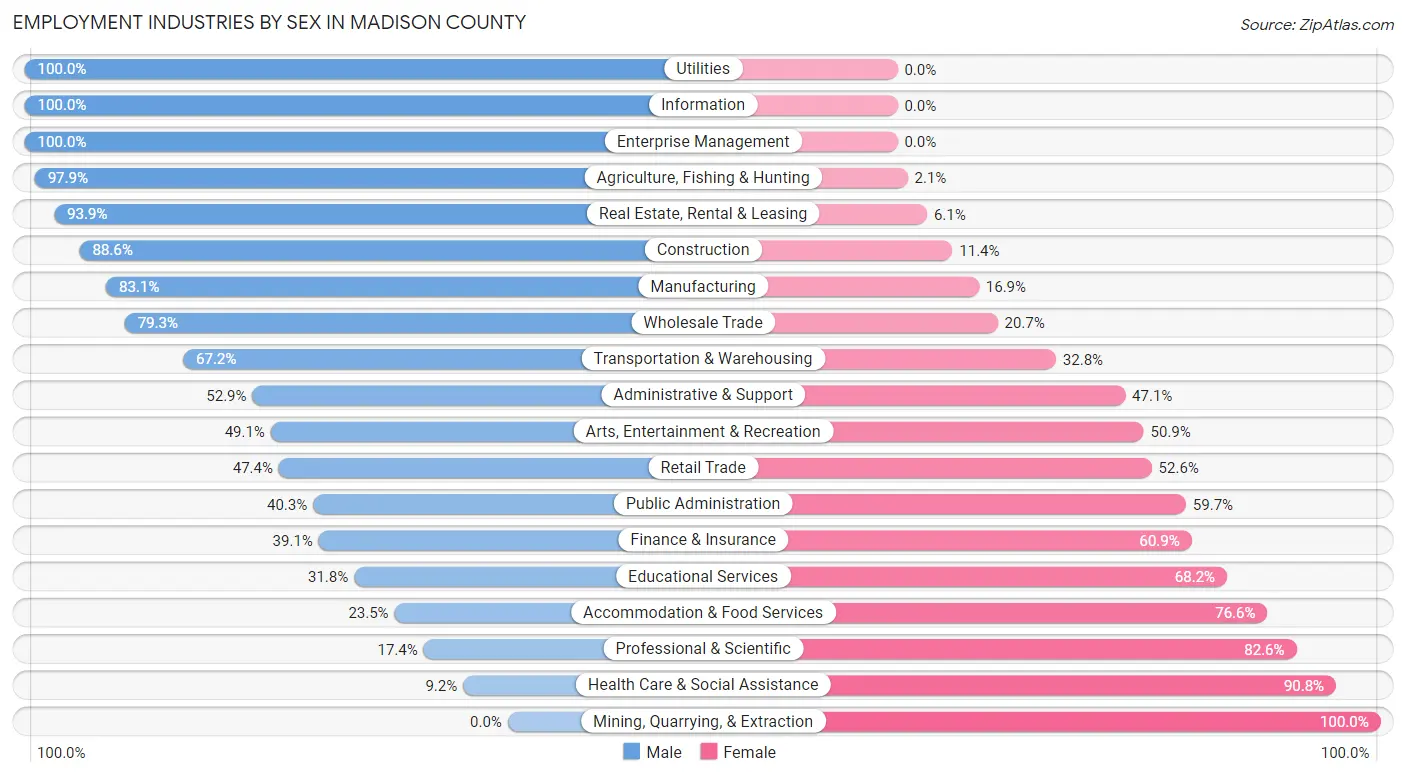
Employment Industries by Sex in Madison County
The Madison County industries that see more men than women are Utilities (100.0%), Information (100.0%), and Enterprise Management (100.0%), whereas the industries that tend to have a higher number of women are Mining, Quarrying, & Extraction (100.0%), Health Care & Social Assistance (90.8%), and Professional & Scientific (82.6%).
| Industry | Male | Female |
| Agriculture, Fishing & Hunting | 324 (97.9%) | 7 (2.1%) |
| Mining, Quarrying, & Extraction | 0 (0.0%) | 7 (100.0%) |
| Construction | 382 (88.6%) | 49 (11.4%) |
| Manufacturing | 700 (83.1%) | 142 (16.9%) |
| Wholesale Trade | 153 (79.3%) | 40 (20.7%) |
| Retail Trade | 352 (47.4%) | 391 (52.6%) |
| Transportation & Warehousing | 168 (67.2%) | 82 (32.8%) |
| Utilities | 121 (100.0%) | 0 (0.0%) |
| Information | 34 (100.0%) | 0 (0.0%) |
| Finance & Insurance | 36 (39.1%) | 56 (60.9%) |
| Real Estate, Rental & Leasing | 46 (93.9%) | 3 (6.1%) |
| Professional & Scientific | 19 (17.4%) | 90 (82.6%) |
| Enterprise Management | 13 (100.0%) | 0 (0.0%) |
| Administrative & Support | 120 (52.9%) | 107 (47.1%) |
| Educational Services | 229 (31.8%) | 491 (68.2%) |
| Health Care & Social Assistance | 63 (9.2%) | 619 (90.8%) |
| Arts, Entertainment & Recreation | 26 (49.1%) | 27 (50.9%) |
| Accommodation & Food Services | 91 (23.4%) | 297 (76.5%) |
| Public Administration | 253 (40.3%) | 375 (59.7%) |
| Total | 3,291 (52.9%) | 2,934 (47.1%) |
Education in Madison County
School Enrollment in Madison County
The most common levels of schooling among the 2,853 students in Madison County are high school (700 | 24.5%), middle school (599 | 21.0%), and elementary school (555 | 19.5%).
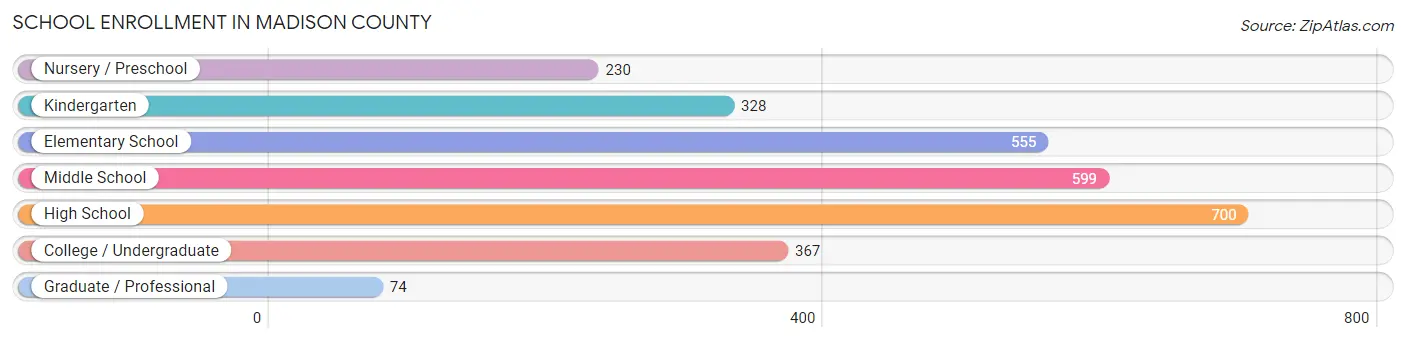
| School Level | # Students | % Students |
| Nursery / Preschool | 230 | 8.1% |
| Kindergarten | 328 | 11.5% |
| Elementary School | 555 | 19.5% |
| Middle School | 599 | 21.0% |
| High School | 700 | 24.5% |
| College / Undergraduate | 367 | 12.9% |
| Graduate / Professional | 74 | 2.6% |
| Total | 2,853 | 100.0% |
School Enrollment by Age by Funding Source in Madison County
Out of a total of 2,853 students who are enrolled in schools in Madison County, 200 (7.0%) attend a private institution, while the remaining 2,653 (93.0%) are enrolled in public schools. The age group of 3 to 4 year olds has the highest likelihood of being enrolled in private schools, with 54 (31.2% in the age bracket) enrolled. Conversely, the age group of 18 to 19 year olds has the lowest likelihood of being enrolled in a private school, with 146 (100.0% in the age bracket) attending a public institution.
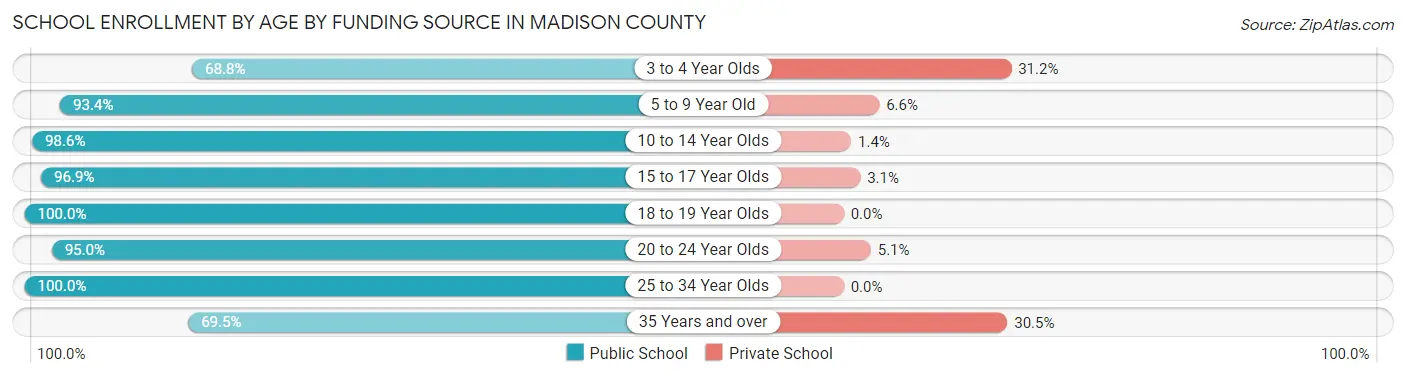
| Age Bracket | Public School | Private School |
| 3 to 4 Year Olds | 119 (68.8%) | 54 (31.2%) |
| 5 to 9 Year Old | 748 (93.4%) | 53 (6.6%) |
| 10 to 14 Year Olds | 786 (98.6%) | 11 (1.4%) |
| 15 to 17 Year Olds | 441 (96.9%) | 14 (3.1%) |
| 18 to 19 Year Olds | 146 (100.0%) | 0 (0.0%) |
| 20 to 24 Year Olds | 94 (95.0%) | 5 (5.1%) |
| 25 to 34 Year Olds | 172 (100.0%) | 0 (0.0%) |
| 35 Years and over | 146 (69.5%) | 64 (30.5%) |
| Total | 2,653 (93.0%) | 200 (7.0%) |
Educational Attainment by Field of Study in Madison County
Education (454 | 25.1%), business (348 | 19.2%), arts & humanities (284 | 15.7%), bio, nature & agricultural (124 | 6.9%), and science & technology (113 | 6.2%) are the most common fields of study among 1,810 individuals in Madison County who have obtained a bachelor's degree or higher.
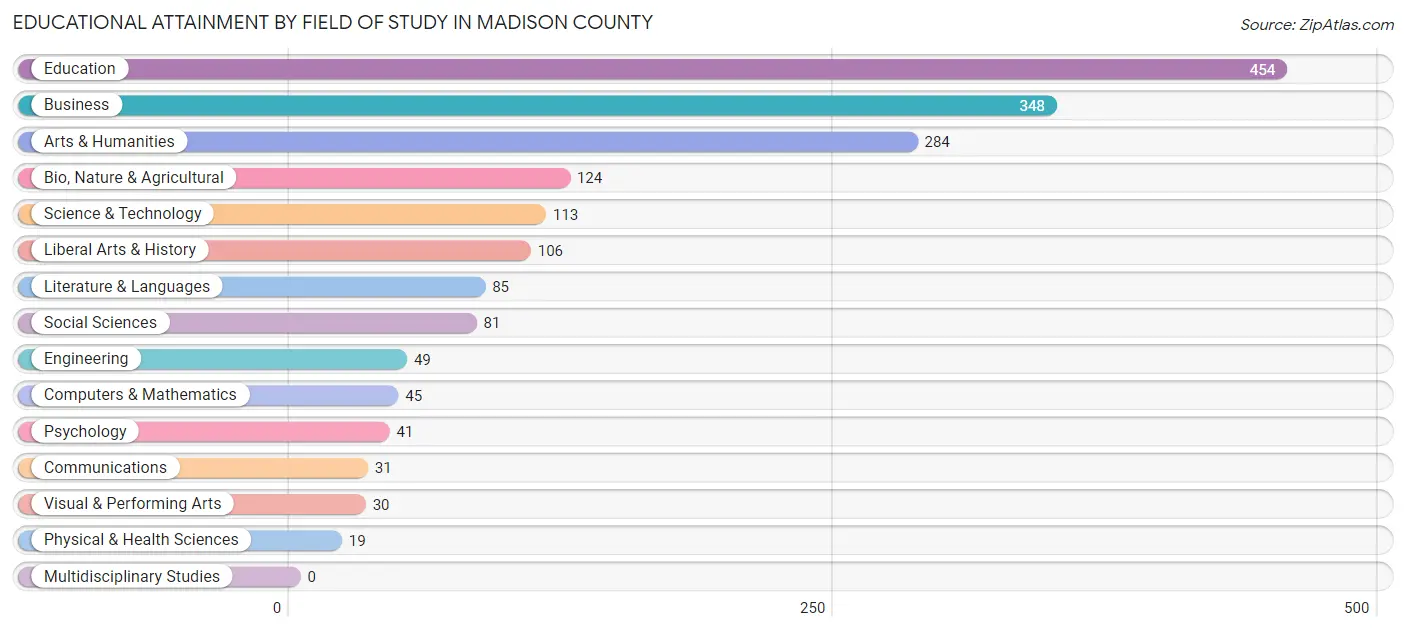
| Field of Study | # Graduates | % Graduates |
| Computers & Mathematics | 45 | 2.5% |
| Bio, Nature & Agricultural | 124 | 6.9% |
| Physical & Health Sciences | 19 | 1.1% |
| Psychology | 41 | 2.3% |
| Social Sciences | 81 | 4.5% |
| Engineering | 49 | 2.7% |
| Multidisciplinary Studies | 0 | 0.0% |
| Science & Technology | 113 | 6.2% |
| Business | 348 | 19.2% |
| Education | 454 | 25.1% |
| Literature & Languages | 85 | 4.7% |
| Liberal Arts & History | 106 | 5.9% |
| Visual & Performing Arts | 30 | 1.7% |
| Communications | 31 | 1.7% |
| Arts & Humanities | 284 | 15.7% |
| Total | 1,810 | 100.0% |
Transportation & Commute in Madison County
Vehicle Availability by Sex in Madison County
The most prevalent vehicle ownership categories in Madison County are males with 2 vehicles (1,379, accounting for 43.1%) and females with 2 vehicles (1,150, making up 48.9%).
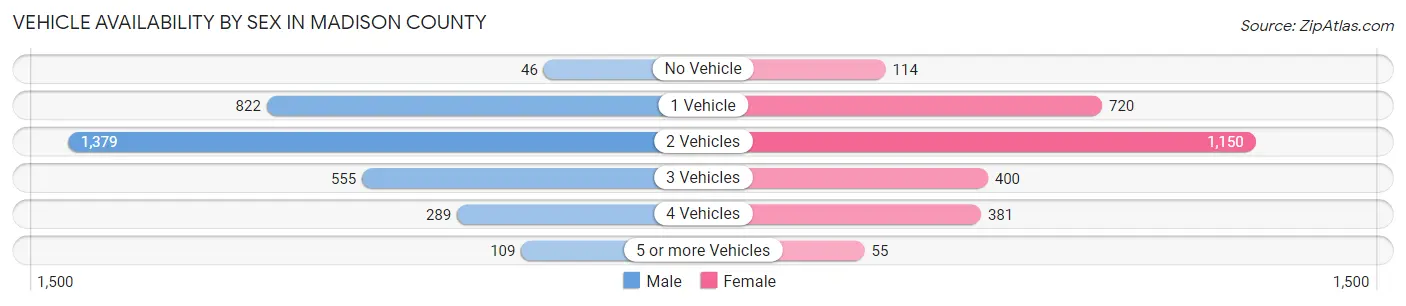
| Vehicles Available | Male | Female |
| No Vehicle | 46 (1.4%) | 114 (4.0%) |
| 1 Vehicle | 822 (25.7%) | 720 (25.5%) |
| 2 Vehicles | 1,379 (43.1%) | 1,150 (40.8%) |
| 3 Vehicles | 555 (17.3%) | 400 (14.2%) |
| 4 Vehicles | 289 (9.0%) | 381 (13.5%) |
| 5 or more Vehicles | 109 (3.4%) | 55 (1.9%) |
| Total | 3,200 (100.0%) | 2,820 (100.0%) |
Commute Time in Madison County
The most frequently occuring commute durations in Madison County are 15 to 19 minutes (1,154 commuters, 19.7%), 10 to 14 minutes (870 commuters, 14.9%), and 20 to 24 minutes (829 commuters, 14.2%).
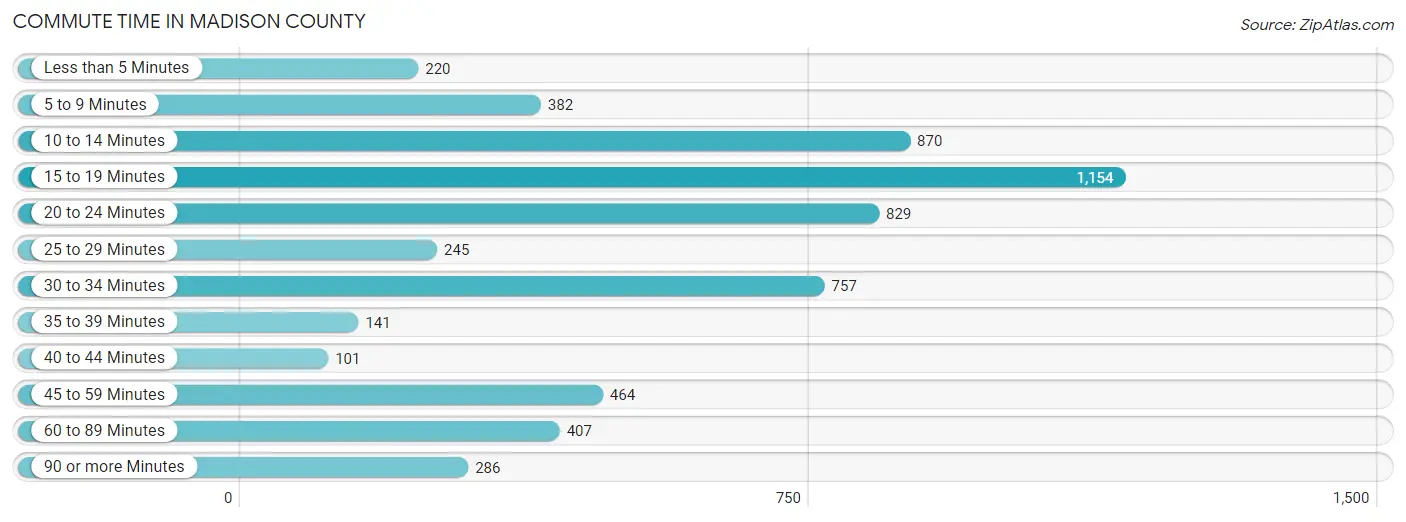
| Commute Time | # Commuters | % Commuters |
| Less than 5 Minutes | 220 | 3.8% |
| 5 to 9 Minutes | 382 | 6.5% |
| 10 to 14 Minutes | 870 | 14.9% |
| 15 to 19 Minutes | 1,154 | 19.7% |
| 20 to 24 Minutes | 829 | 14.2% |
| 25 to 29 Minutes | 245 | 4.2% |
| 30 to 34 Minutes | 757 | 12.9% |
| 35 to 39 Minutes | 141 | 2.4% |
| 40 to 44 Minutes | 101 | 1.7% |
| 45 to 59 Minutes | 464 | 7.9% |
| 60 to 89 Minutes | 407 | 7.0% |
| 90 or more Minutes | 286 | 4.9% |
Commute Time by Sex in Madison County
The most common commute times in Madison County are 15 to 19 minutes (561 commuters, 17.9%) for males and 15 to 19 minutes (593 commuters, 21.8%) for females.
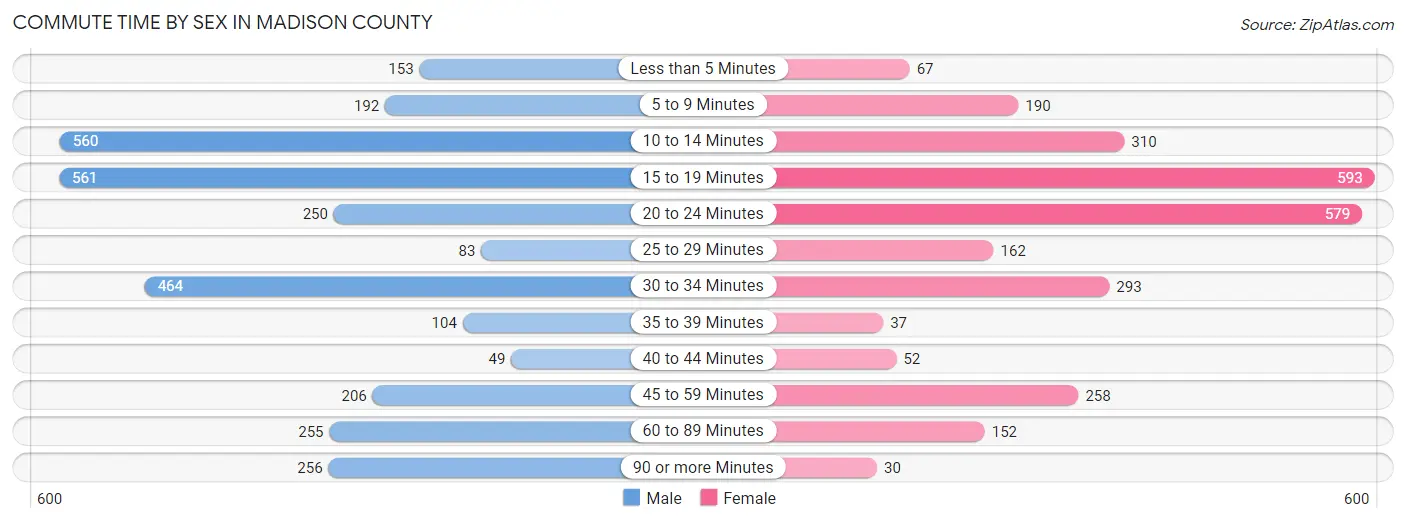
| Commute Time | Male | Female |
| Less than 5 Minutes | 153 (4.9%) | 67 (2.5%) |
| 5 to 9 Minutes | 192 (6.1%) | 190 (7.0%) |
| 10 to 14 Minutes | 560 (17.9%) | 310 (11.4%) |
| 15 to 19 Minutes | 561 (17.9%) | 593 (21.8%) |
| 20 to 24 Minutes | 250 (8.0%) | 579 (21.3%) |
| 25 to 29 Minutes | 83 (2.6%) | 162 (5.9%) |
| 30 to 34 Minutes | 464 (14.8%) | 293 (10.8%) |
| 35 to 39 Minutes | 104 (3.3%) | 37 (1.4%) |
| 40 to 44 Minutes | 49 (1.6%) | 52 (1.9%) |
| 45 to 59 Minutes | 206 (6.6%) | 258 (9.5%) |
| 60 to 89 Minutes | 255 (8.1%) | 152 (5.6%) |
| 90 or more Minutes | 256 (8.2%) | 30 (1.1%) |
Time of Departure to Work by Sex in Madison County
The most frequent times of departure to work in Madison County are 6:30 AM to 6:59 AM (569, 18.2%) for males and 7:00 AM to 7:29 AM (544, 20.0%) for females.
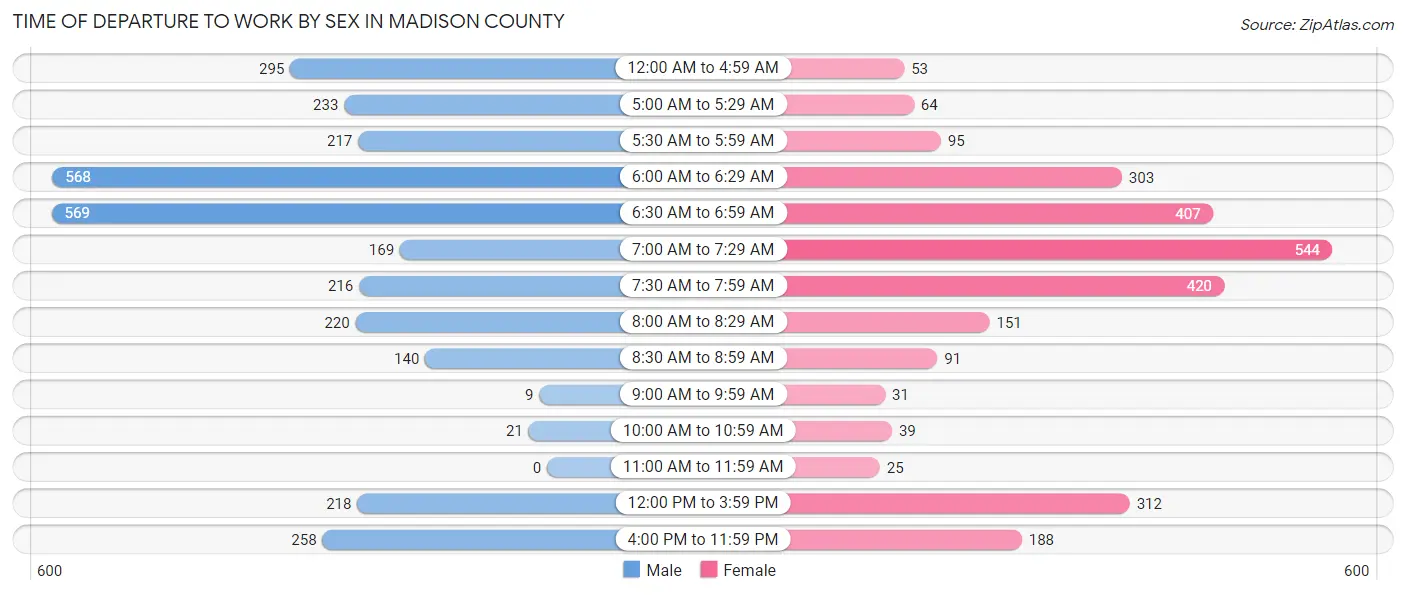
| Time of Departure | Male | Female |
| 12:00 AM to 4:59 AM | 295 (9.4%) | 53 (1.9%) |
| 5:00 AM to 5:29 AM | 233 (7.4%) | 64 (2.4%) |
| 5:30 AM to 5:59 AM | 217 (6.9%) | 95 (3.5%) |
| 6:00 AM to 6:29 AM | 568 (18.1%) | 303 (11.1%) |
| 6:30 AM to 6:59 AM | 569 (18.2%) | 407 (14.9%) |
| 7:00 AM to 7:29 AM | 169 (5.4%) | 544 (20.0%) |
| 7:30 AM to 7:59 AM | 216 (6.9%) | 420 (15.4%) |
| 8:00 AM to 8:29 AM | 220 (7.0%) | 151 (5.6%) |
| 8:30 AM to 8:59 AM | 140 (4.5%) | 91 (3.3%) |
| 9:00 AM to 9:59 AM | 9 (0.3%) | 31 (1.1%) |
| 10:00 AM to 10:59 AM | 21 (0.7%) | 39 (1.4%) |
| 11:00 AM to 11:59 AM | 0 (0.0%) | 25 (0.9%) |
| 12:00 PM to 3:59 PM | 218 (7.0%) | 312 (11.5%) |
| 4:00 PM to 11:59 PM | 258 (8.2%) | 188 (6.9%) |
| Total | 3,133 (100.0%) | 2,723 (100.0%) |
Housing Occupancy in Madison County
Occupancy by Ownership in Madison County
Of the total 6,693 dwellings in Madison County, owner-occupied units account for 4,748 (70.9%), while renter-occupied units make up 1,945 (29.1%).
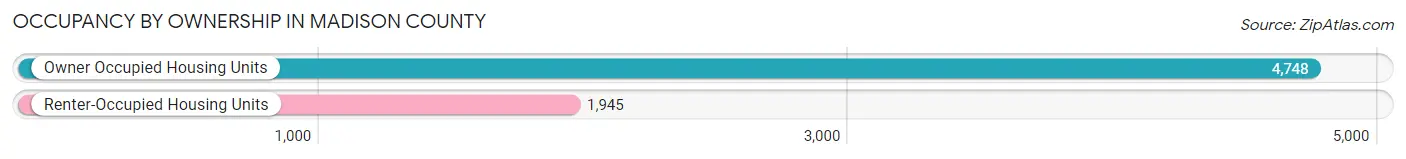
| Occupancy | # Housing Units | % Housing Units |
| Owner Occupied Housing Units | 4,748 | 70.9% |
| Renter-Occupied Housing Units | 1,945 | 29.1% |
| Total Occupied Housing Units | 6,693 | 100.0% |
Occupancy by Household Size in Madison County
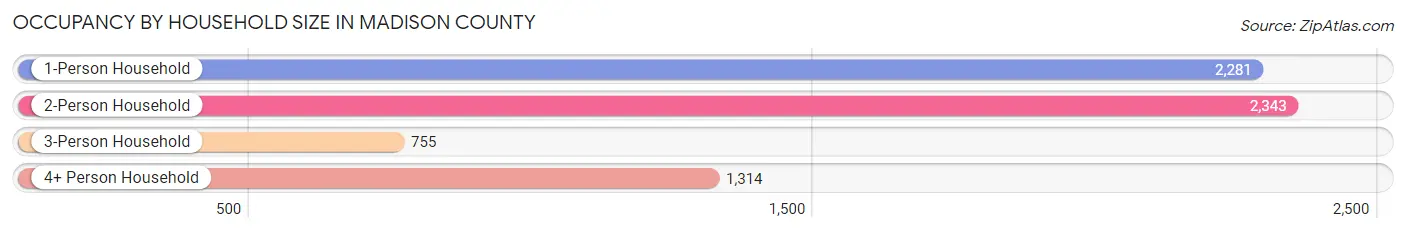
| Household Size | # Housing Units | % Housing Units |
| 1-Person Household | 2,281 | 34.1% |
| 2-Person Household | 2,343 | 35.0% |
| 3-Person Household | 755 | 11.3% |
| 4+ Person Household | 1,314 | 19.6% |
| Total Housing Units | 6,693 | 100.0% |
Occupancy by Ownership by Household Size in Madison County
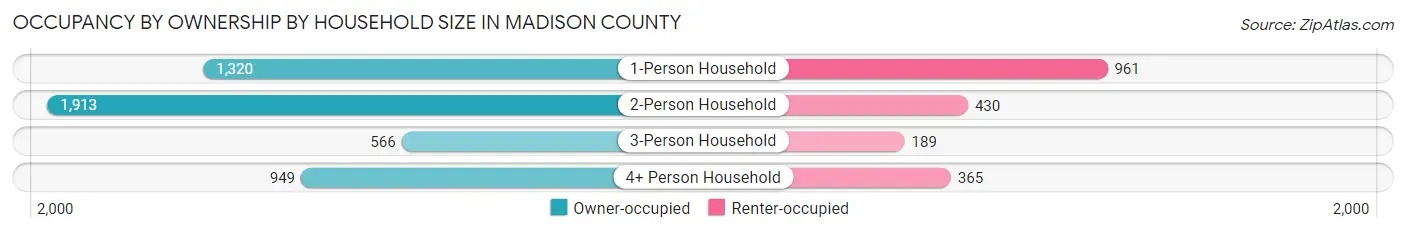
| Household Size | Owner-occupied | Renter-occupied |
| 1-Person Household | 1,320 (57.9%) | 961 (42.1%) |
| 2-Person Household | 1,913 (81.7%) | 430 (18.3%) |
| 3-Person Household | 566 (75.0%) | 189 (25.0%) |
| 4+ Person Household | 949 (72.2%) | 365 (27.8%) |
| Total Housing Units | 4,748 (70.9%) | 1,945 (29.1%) |
Occupancy by Educational Attainment in Madison County
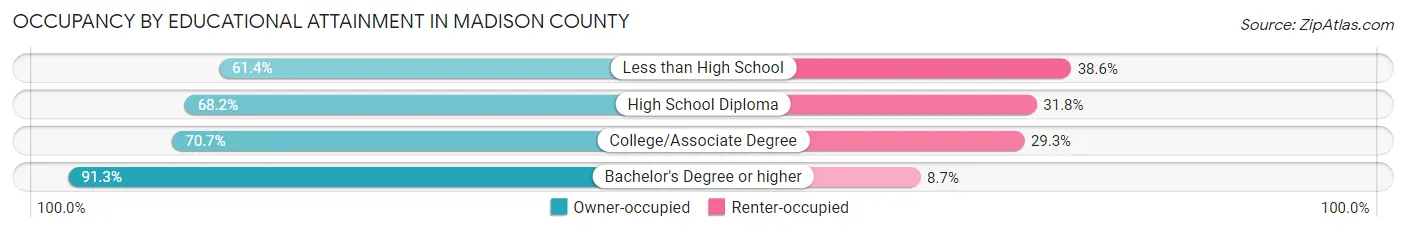
| Household Size | Owner-occupied | Renter-occupied |
| Less than High School | 753 (61.4%) | 473 (38.6%) |
| High School Diploma | 1,435 (68.2%) | 668 (31.8%) |
| College/Associate Degree | 1,754 (70.7%) | 727 (29.3%) |
| Bachelor's Degree or higher | 806 (91.3%) | 77 (8.7%) |
Occupancy by Age of Householder in Madison County
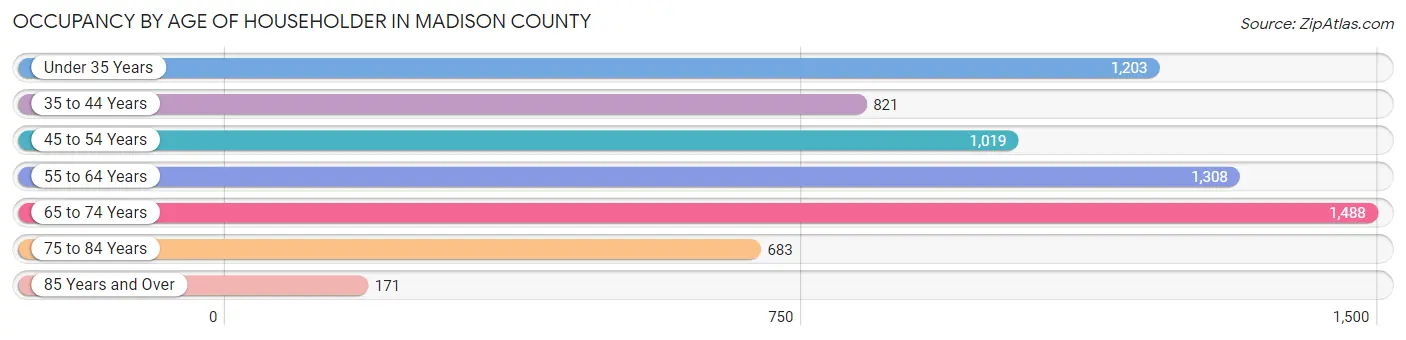
| Age Bracket | # Households | % Households |
| Under 35 Years | 1,203 | 18.0% |
| 35 to 44 Years | 821 | 12.3% |
| 45 to 54 Years | 1,019 | 15.2% |
| 55 to 64 Years | 1,308 | 19.5% |
| 65 to 74 Years | 1,488 | 22.2% |
| 75 to 84 Years | 683 | 10.2% |
| 85 Years and Over | 171 | 2.5% |
| Total | 6,693 | 100.0% |
Housing Finances in Madison County
Median Income by Occupancy in Madison County
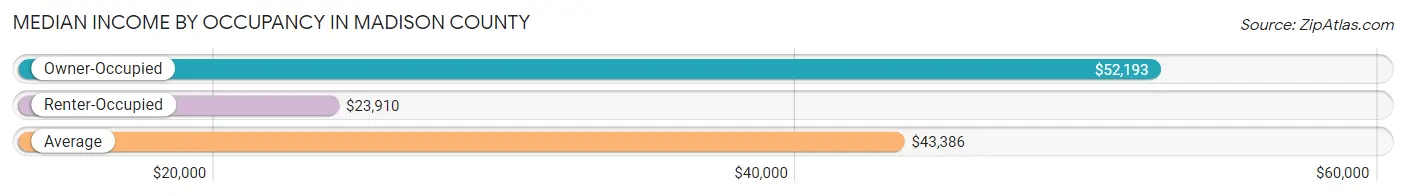
| Occupancy Type | # Households | Median Income |
| Owner-Occupied | 4,748 (70.9%) | $52,193 |
| Renter-Occupied | 1,945 (29.1%) | $23,910 |
| Average | 6,693 (100.0%) | $43,386 |
Occupancy by Householder Income Bracket in Madison County
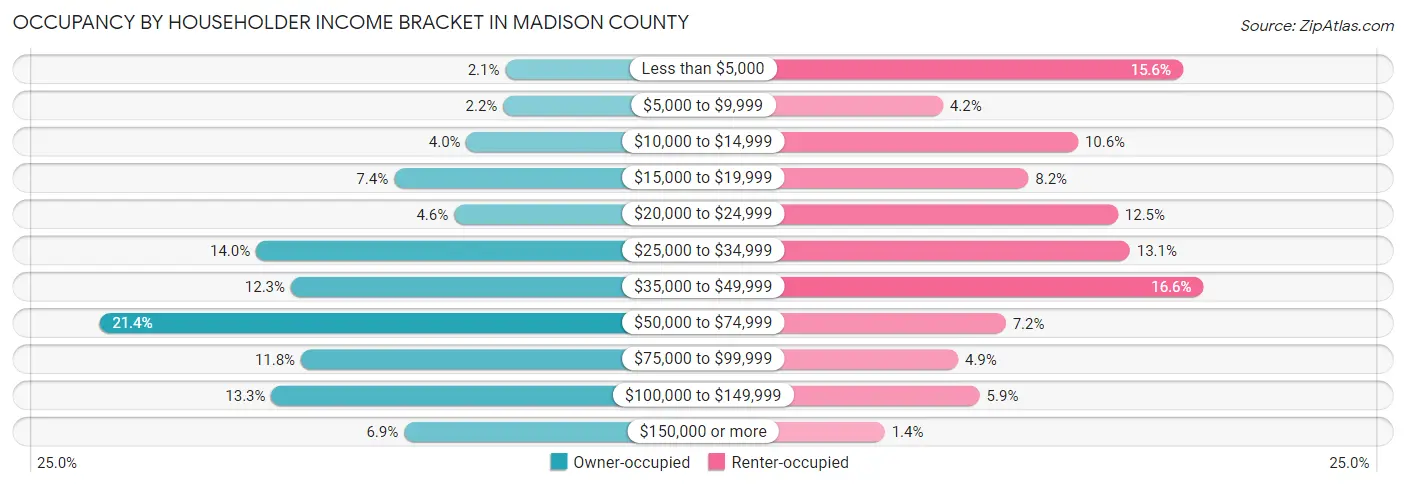
| Income Bracket | Owner-occupied | Renter-occupied |
| Less than $5,000 | 100 (2.1%) | 303 (15.6%) |
| $5,000 to $9,999 | 105 (2.2%) | 81 (4.2%) |
| $10,000 to $14,999 | 188 (4.0%) | 206 (10.6%) |
| $15,000 to $19,999 | 352 (7.4%) | 160 (8.2%) |
| $20,000 to $24,999 | 216 (4.5%) | 243 (12.5%) |
| $25,000 to $34,999 | 664 (14.0%) | 254 (13.1%) |
| $35,000 to $49,999 | 585 (12.3%) | 322 (16.6%) |
| $50,000 to $74,999 | 1,018 (21.4%) | 139 (7.1%) |
| $75,000 to $99,999 | 562 (11.8%) | 95 (4.9%) |
| $100,000 to $149,999 | 629 (13.3%) | 115 (5.9%) |
| $150,000 or more | 329 (6.9%) | 27 (1.4%) |
| Total | 4,748 (100.0%) | 1,945 (100.0%) |
Monthly Housing Cost Tiers in Madison County
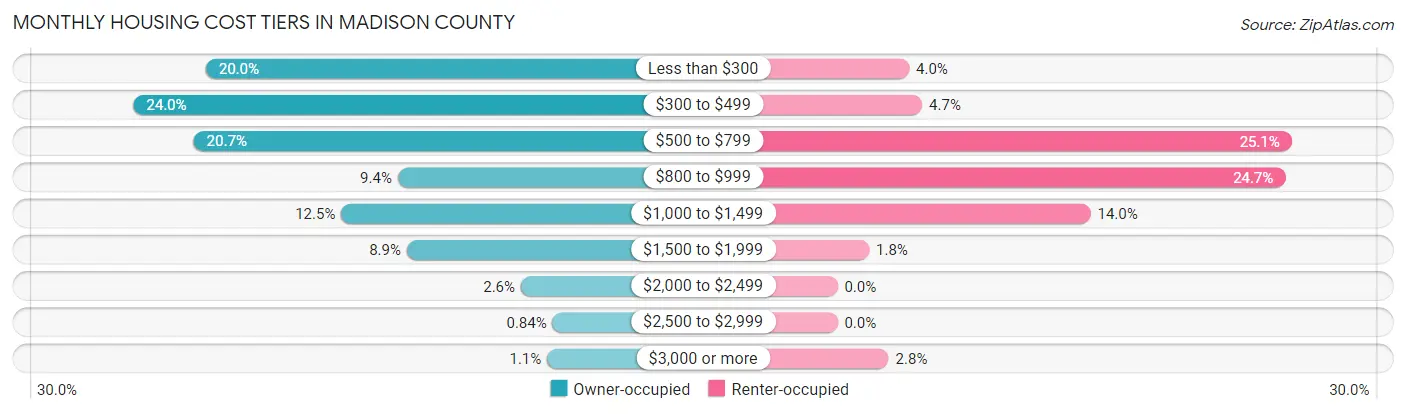
| Monthly Cost | Owner-occupied | Renter-occupied |
| Less than $300 | 949 (20.0%) | 77 (4.0%) |
| $300 to $499 | 1,139 (24.0%) | 91 (4.7%) |
| $500 to $799 | 981 (20.7%) | 488 (25.1%) |
| $800 to $999 | 446 (9.4%) | 481 (24.7%) |
| $1,000 to $1,499 | 594 (12.5%) | 272 (14.0%) |
| $1,500 to $1,999 | 422 (8.9%) | 34 (1.8%) |
| $2,000 to $2,499 | 123 (2.6%) | 0 (0.0%) |
| $2,500 to $2,999 | 40 (0.8%) | 0 (0.0%) |
| $3,000 or more | 54 (1.1%) | 55 (2.8%) |
| Total | 4,748 (100.0%) | 1,945 (100.0%) |
Physical Housing Characteristics in Madison County
Housing Structures in Madison County
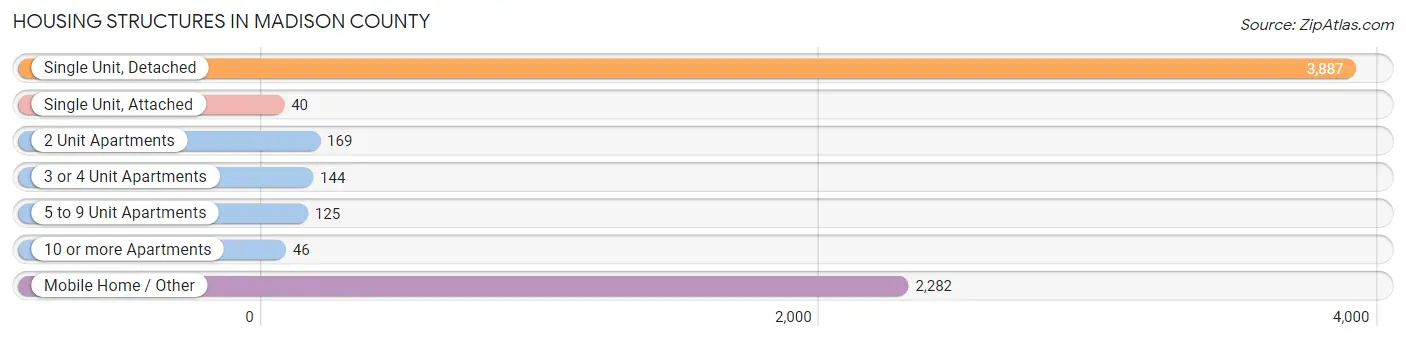
| Structure Type | # Housing Units | % Housing Units |
| Single Unit, Detached | 3,887 | 58.1% |
| Single Unit, Attached | 40 | 0.6% |
| 2 Unit Apartments | 169 | 2.5% |
| 3 or 4 Unit Apartments | 144 | 2.1% |
| 5 to 9 Unit Apartments | 125 | 1.9% |
| 10 or more Apartments | 46 | 0.7% |
| Mobile Home / Other | 2,282 | 34.1% |
| Total | 6,693 | 100.0% |
Housing Structures by Occupancy in Madison County
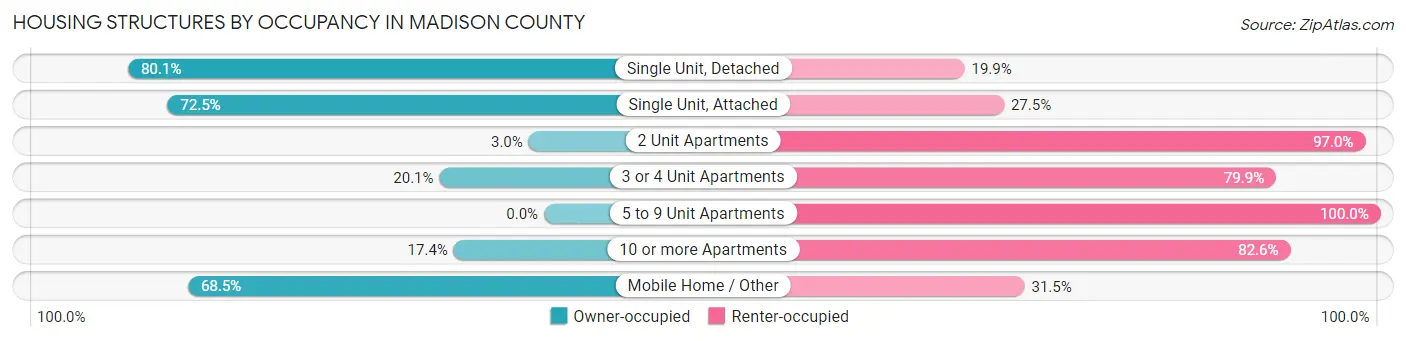
| Structure Type | Owner-occupied | Renter-occupied |
| Single Unit, Detached | 3,113 (80.1%) | 774 (19.9%) |
| Single Unit, Attached | 29 (72.5%) | 11 (27.5%) |
| 2 Unit Apartments | 5 (3.0%) | 164 (97.0%) |
| 3 or 4 Unit Apartments | 29 (20.1%) | 115 (79.9%) |
| 5 to 9 Unit Apartments | 0 (0.0%) | 125 (100.0%) |
| 10 or more Apartments | 8 (17.4%) | 38 (82.6%) |
| Mobile Home / Other | 1,564 (68.5%) | 718 (31.5%) |
| Total | 4,748 (70.9%) | 1,945 (29.1%) |
Housing Structures by Number of Rooms in Madison County
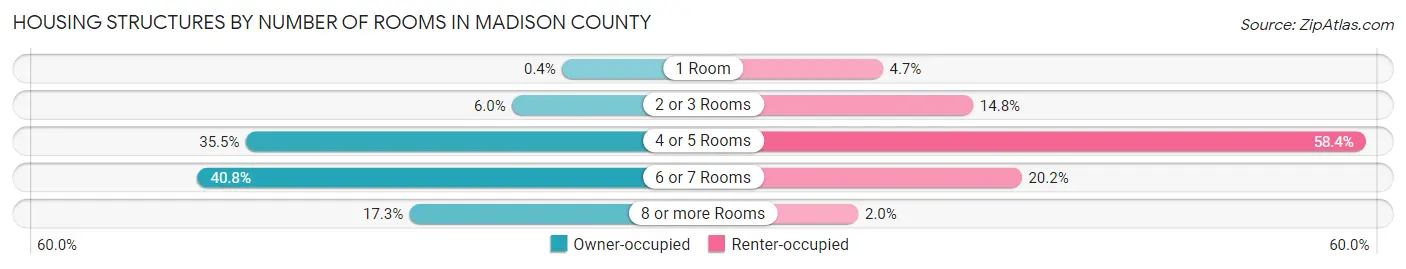
| Number of Rooms | Owner-occupied | Renter-occupied |
| 1 Room | 19 (0.4%) | 92 (4.7%) |
| 2 or 3 Rooms | 283 (6.0%) | 287 (14.8%) |
| 4 or 5 Rooms | 1,686 (35.5%) | 1,135 (58.4%) |
| 6 or 7 Rooms | 1,937 (40.8%) | 392 (20.2%) |
| 8 or more Rooms | 823 (17.3%) | 39 (2.0%) |
| Total | 4,748 (100.0%) | 1,945 (100.0%) |
Housing Structure by Heating Type in Madison County
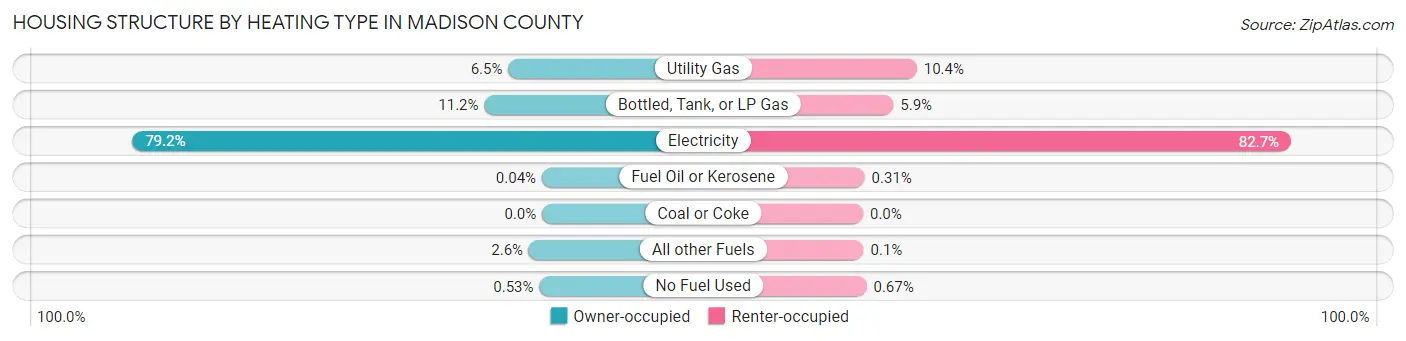
| Heating Type | Owner-occupied | Renter-occupied |
| Utility Gas | 310 (6.5%) | 202 (10.4%) |
| Bottled, Tank, or LP Gas | 530 (11.2%) | 114 (5.9%) |
| Electricity | 3,760 (79.2%) | 1,608 (82.7%) |
| Fuel Oil or Kerosene | 2 (0.0%) | 6 (0.3%) |
| Coal or Coke | 0 (0.0%) | 0 (0.0%) |
| All other Fuels | 121 (2.5%) | 2 (0.1%) |
| No Fuel Used | 25 (0.5%) | 13 (0.7%) |
| Total | 4,748 (100.0%) | 1,945 (100.0%) |
Household Vehicle Usage in Madison County
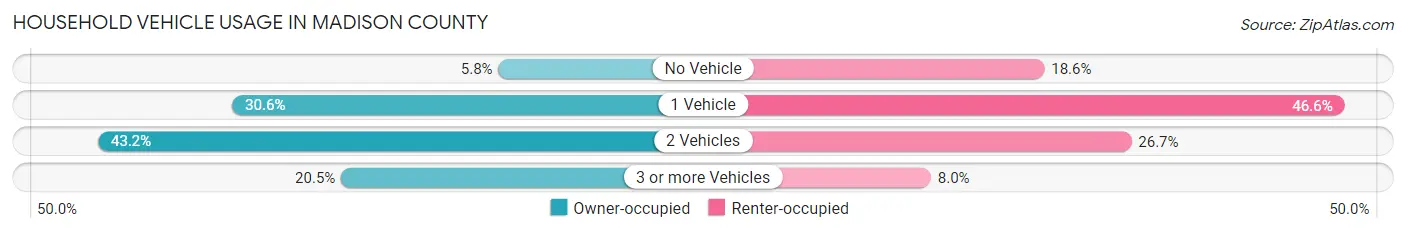
| Vehicles per Household | Owner-occupied | Renter-occupied |
| No Vehicle | 274 (5.8%) | 362 (18.6%) |
| 1 Vehicle | 1,454 (30.6%) | 907 (46.6%) |
| 2 Vehicles | 2,049 (43.2%) | 520 (26.7%) |
| 3 or more Vehicles | 971 (20.4%) | 156 (8.0%) |
| Total | 4,748 (100.0%) | 1,945 (100.0%) |
Real Estate & Mortgages in Madison County
Real Estate and Mortgage Overview in Madison County
| Characteristic | Without Mortgage | With Mortgage |
| Housing Units | 2,644 | 2,104 |
| Median Property Value | $73,800 | $134,500 |
| Median Household Income | $43,649 | $217 |
| Monthly Housing Costs | $347 | $54 |
| Real Estate Taxes | $687 | $355 |
Property Value by Mortgage Status in Madison County
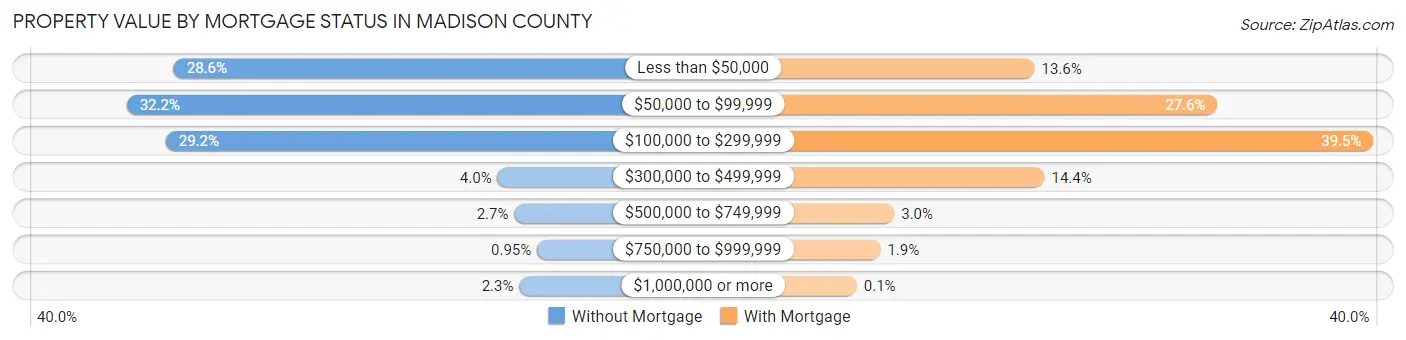
| Property Value | Without Mortgage | With Mortgage |
| Less than $50,000 | 757 (28.6%) | 287 (13.6%) |
| $50,000 to $99,999 | 852 (32.2%) | 580 (27.6%) |
| $100,000 to $299,999 | 773 (29.2%) | 830 (39.5%) |
| $300,000 to $499,999 | 105 (4.0%) | 303 (14.4%) |
| $500,000 to $749,999 | 71 (2.7%) | 62 (2.9%) |
| $750,000 to $999,999 | 25 (0.9%) | 40 (1.9%) |
| $1,000,000 or more | 61 (2.3%) | 2 (0.1%) |
| Total | 2,644 (100.0%) | 2,104 (100.0%) |
Household Income by Mortgage Status in Madison County
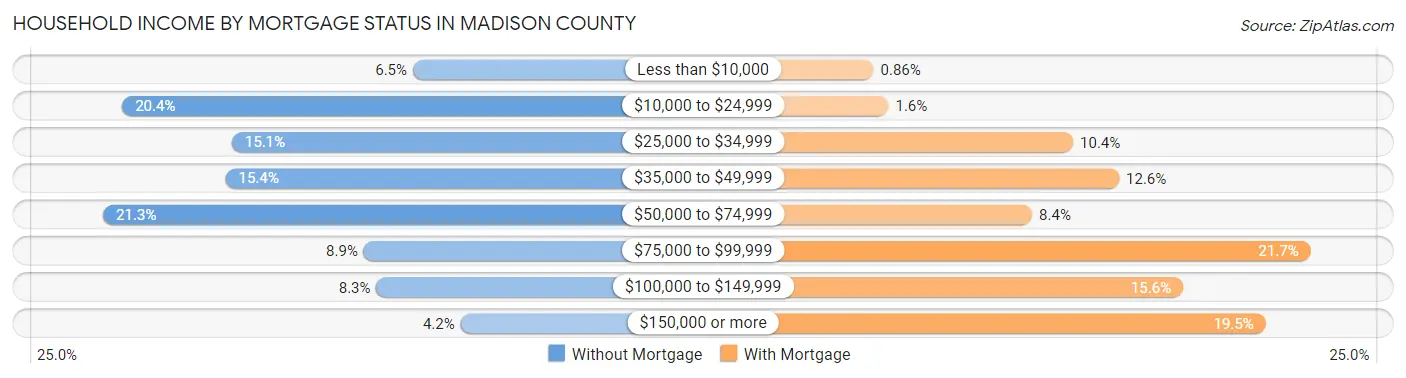
| Household Income | Without Mortgage | With Mortgage |
| Less than $10,000 | 172 (6.5%) | 18 (0.9%) |
| $10,000 to $24,999 | 538 (20.3%) | 33 (1.6%) |
| $25,000 to $34,999 | 400 (15.1%) | 218 (10.4%) |
| $35,000 to $49,999 | 408 (15.4%) | 264 (12.6%) |
| $50,000 to $74,999 | 562 (21.3%) | 177 (8.4%) |
| $75,000 to $99,999 | 234 (8.8%) | 456 (21.7%) |
| $100,000 to $149,999 | 218 (8.3%) | 328 (15.6%) |
| $150,000 or more | 112 (4.2%) | 411 (19.5%) |
| Total | 2,644 (100.0%) | 2,104 (100.0%) |
Property Value to Household Income Ratio in Madison County
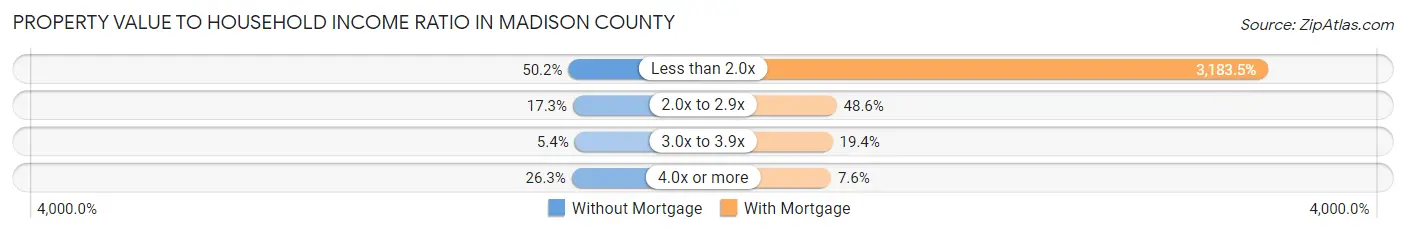
| Value-to-Income Ratio | Without Mortgage | With Mortgage |
| Less than 2.0x | 1,328 (50.2%) | 66,980 (3,183.5%) |
| 2.0x to 2.9x | 456 (17.2%) | 1,023 (48.6%) |
| 3.0x to 3.9x | 142 (5.4%) | 408 (19.4%) |
| 4.0x or more | 694 (26.3%) | 160 (7.6%) |
| Total | 2,644 (100.0%) | 2,104 (100.0%) |
Real Estate Taxes by Mortgage Status in Madison County
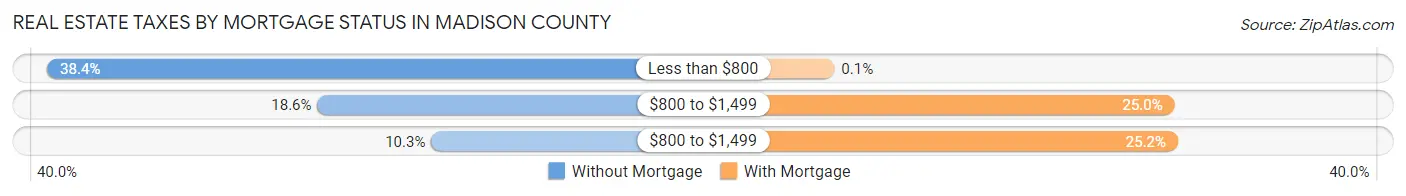
| Property Taxes | Without Mortgage | With Mortgage |
| Less than $800 | 1,014 (38.4%) | 2 (0.1%) |
| $800 to $1,499 | 492 (18.6%) | 525 (24.9%) |
| $800 to $1,499 | 272 (10.3%) | 530 (25.2%) |
| Total | 2,644 (100.0%) | 2,104 (100.0%) |
Health & Disability in Madison County
Health Insurance Coverage by Age in Madison County
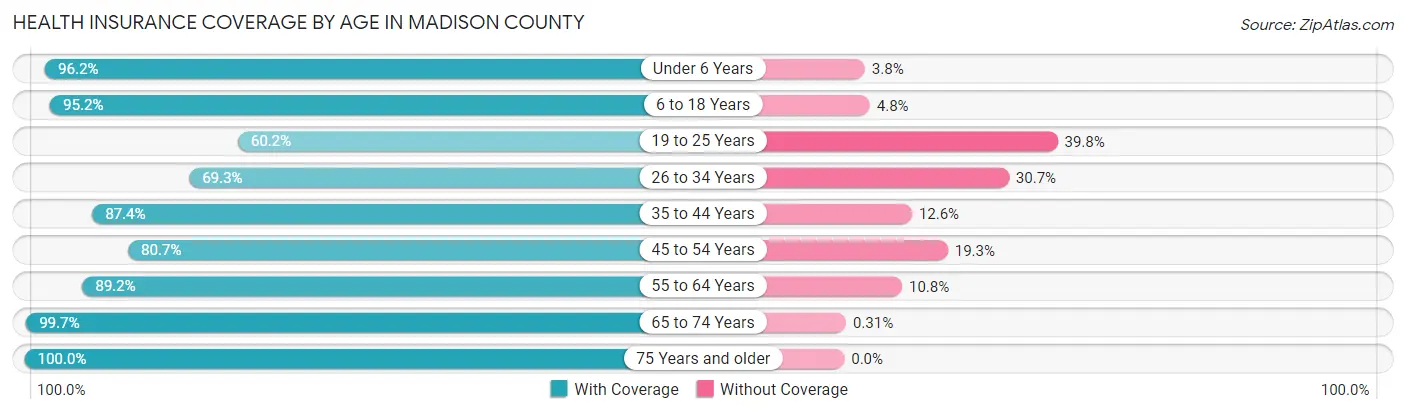
| Age Bracket | With Coverage | Without Coverage |
| Under 6 Years | 1,101 (96.2%) | 44 (3.8%) |
| 6 to 18 Years | 2,137 (95.2%) | 107 (4.8%) |
| 19 to 25 Years | 612 (60.2%) | 404 (39.8%) |
| 26 to 34 Years | 1,517 (69.3%) | 672 (30.7%) |
| 35 to 44 Years | 1,592 (87.4%) | 230 (12.6%) |
| 45 to 54 Years | 1,514 (80.7%) | 362 (19.3%) |
| 55 to 64 Years | 1,997 (89.2%) | 241 (10.8%) |
| 65 to 74 Years | 2,282 (99.7%) | 7 (0.3%) |
| 75 Years and older | 1,304 (100.0%) | 0 (0.0%) |
| Total | 14,056 (87.2%) | 2,067 (12.8%) |
Health Insurance Coverage by Citizenship Status in Madison County
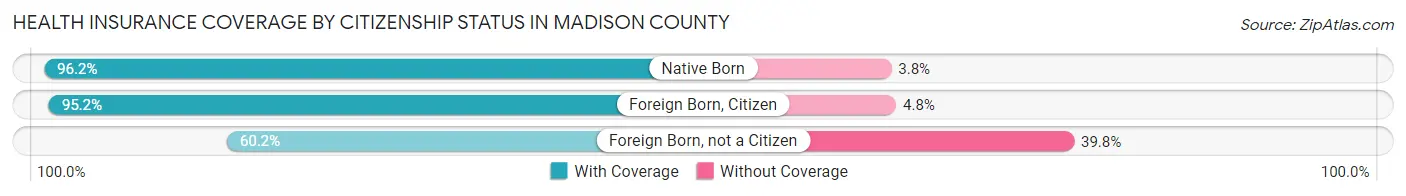
| Citizenship Status | With Coverage | Without Coverage |
| Native Born | 1,101 (96.2%) | 44 (3.8%) |
| Foreign Born, Citizen | 2,137 (95.2%) | 107 (4.8%) |
| Foreign Born, not a Citizen | 612 (60.2%) | 404 (39.8%) |
Health Insurance Coverage by Household Income in Madison County
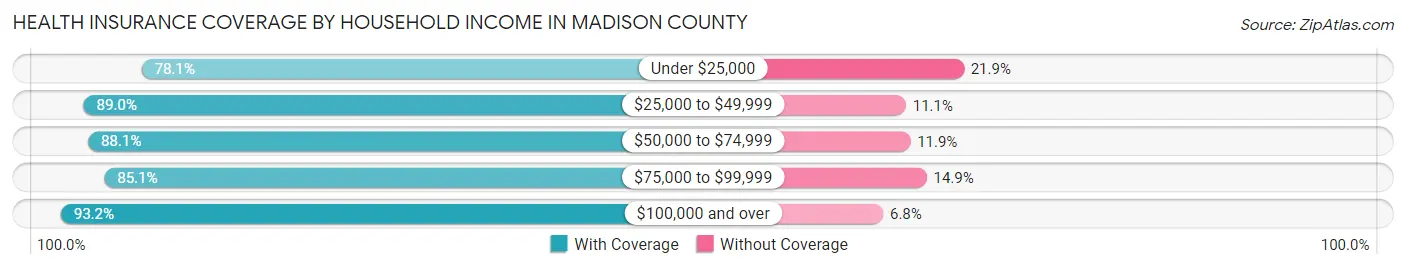
| Household Income | With Coverage | Without Coverage |
| Under $25,000 | 2,473 (78.1%) | 694 (21.9%) |
| $25,000 to $49,999 | 3,903 (88.9%) | 485 (11.1%) |
| $50,000 to $74,999 | 2,664 (88.1%) | 359 (11.9%) |
| $75,000 to $99,999 | 1,543 (85.1%) | 271 (14.9%) |
| $100,000 and over | 3,432 (93.2%) | 250 (6.8%) |
Public vs Private Health Insurance Coverage by Age in Madison County
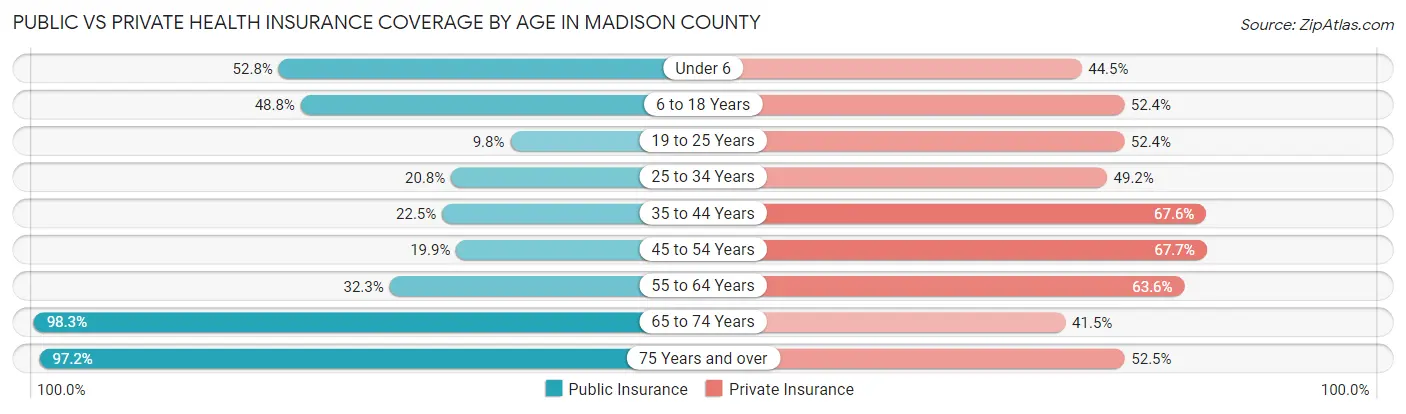
| Age Bracket | Public Insurance | Private Insurance |
| Under 6 | 605 (52.8%) | 509 (44.5%) |
| 6 to 18 Years | 1,094 (48.7%) | 1,175 (52.4%) |
| 19 to 25 Years | 100 (9.8%) | 532 (52.4%) |
| 25 to 34 Years | 456 (20.8%) | 1,076 (49.1%) |
| 35 to 44 Years | 410 (22.5%) | 1,232 (67.6%) |
| 45 to 54 Years | 373 (19.9%) | 1,270 (67.7%) |
| 55 to 64 Years | 722 (32.3%) | 1,423 (63.6%) |
| 65 to 74 Years | 2,250 (98.3%) | 949 (41.5%) |
| 75 Years and over | 1,268 (97.2%) | 684 (52.4%) |
| Total | 7,278 (45.1%) | 8,850 (54.9%) |
Disability Status by Sex by Age in Madison County
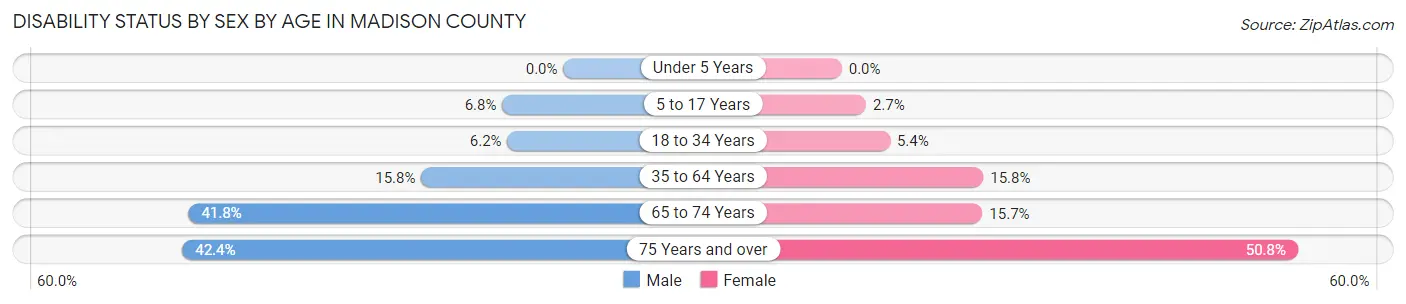
| Age Bracket | Male | Female |
| Under 5 Years | 0 (0.0%) | 0 (0.0%) |
| 5 to 17 Years | 90 (6.8%) | 28 (2.7%) |
| 18 to 34 Years | 107 (6.2%) | 89 (5.4%) |
| 35 to 64 Years | 425 (15.8%) | 512 (15.8%) |
| 65 to 74 Years | 473 (41.7%) | 181 (15.7%) |
| 75 Years and over | 199 (42.4%) | 424 (50.8%) |
Disability Class by Sex by Age in Madison County
Disability Class: Hearing Difficulty
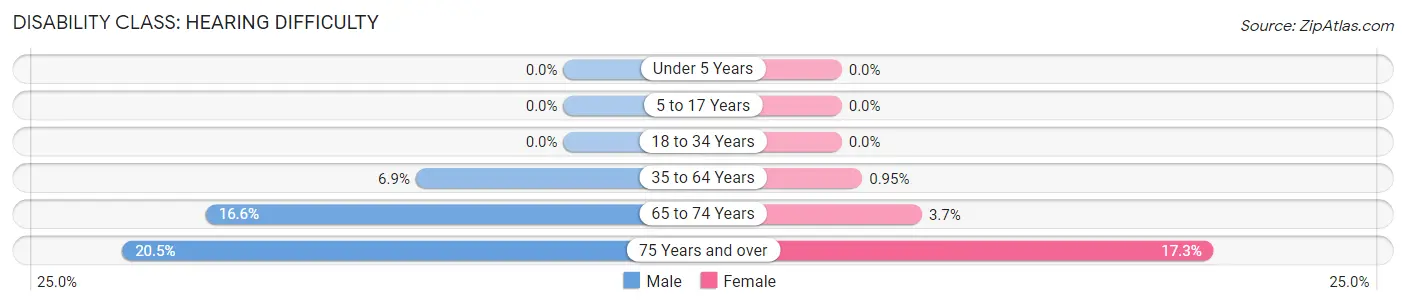
| Age Bracket | Male | Female |
| Under 5 Years | 0 (0.0%) | 0 (0.0%) |
| 5 to 17 Years | 0 (0.0%) | 0 (0.0%) |
| 18 to 34 Years | 0 (0.0%) | 0 (0.0%) |
| 35 to 64 Years | 184 (6.9%) | 31 (0.9%) |
| 65 to 74 Years | 188 (16.6%) | 43 (3.7%) |
| 75 Years and over | 96 (20.5%) | 144 (17.2%) |
Disability Class: Vision Difficulty
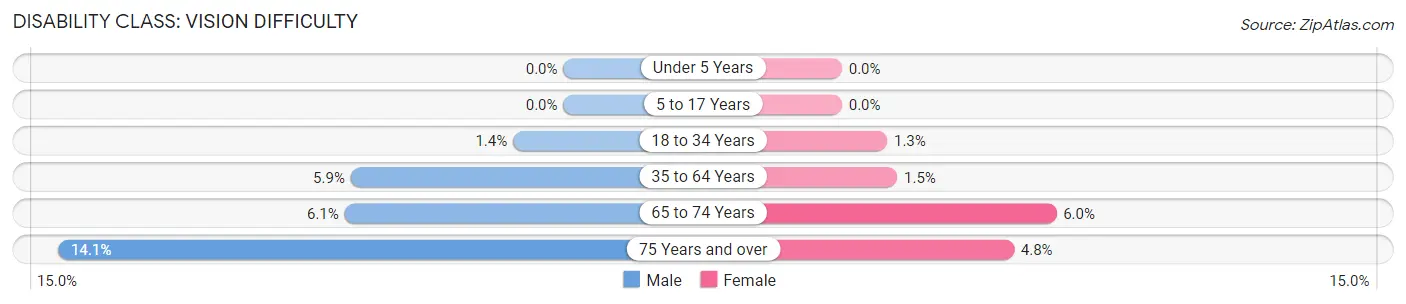
| Age Bracket | Male | Female |
| Under 5 Years | 0 (0.0%) | 0 (0.0%) |
| 5 to 17 Years | 0 (0.0%) | 0 (0.0%) |
| 18 to 34 Years | 24 (1.4%) | 21 (1.3%) |
| 35 to 64 Years | 159 (5.9%) | 50 (1.5%) |
| 65 to 74 Years | 69 (6.1%) | 69 (6.0%) |
| 75 Years and over | 66 (14.1%) | 40 (4.8%) |
Disability Class: Cognitive Difficulty
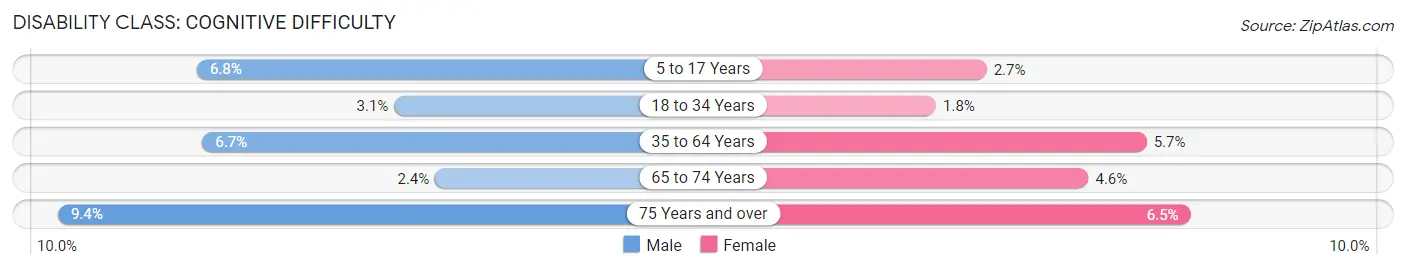
| Age Bracket | Male | Female |
| 5 to 17 Years | 90 (6.8%) | 28 (2.7%) |
| 18 to 34 Years | 54 (3.1%) | 29 (1.8%) |
| 35 to 64 Years | 180 (6.7%) | 184 (5.7%) |
| 65 to 74 Years | 27 (2.4%) | 53 (4.6%) |
| 75 Years and over | 44 (9.4%) | 54 (6.5%) |
Disability Class: Ambulatory Difficulty
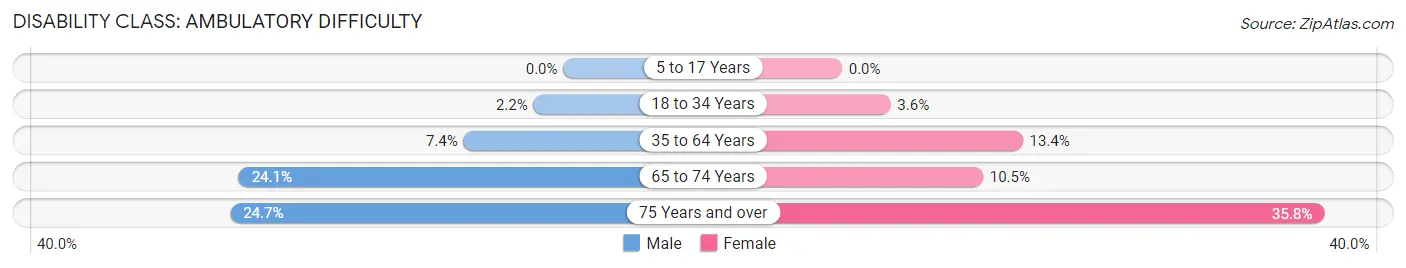
| Age Bracket | Male | Female |
| 5 to 17 Years | 0 (0.0%) | 0 (0.0%) |
| 18 to 34 Years | 38 (2.2%) | 60 (3.6%) |
| 35 to 64 Years | 199 (7.4%) | 436 (13.4%) |
| 65 to 74 Years | 273 (24.1%) | 121 (10.5%) |
| 75 Years and over | 116 (24.7%) | 299 (35.8%) |
Disability Class: Self-Care Difficulty
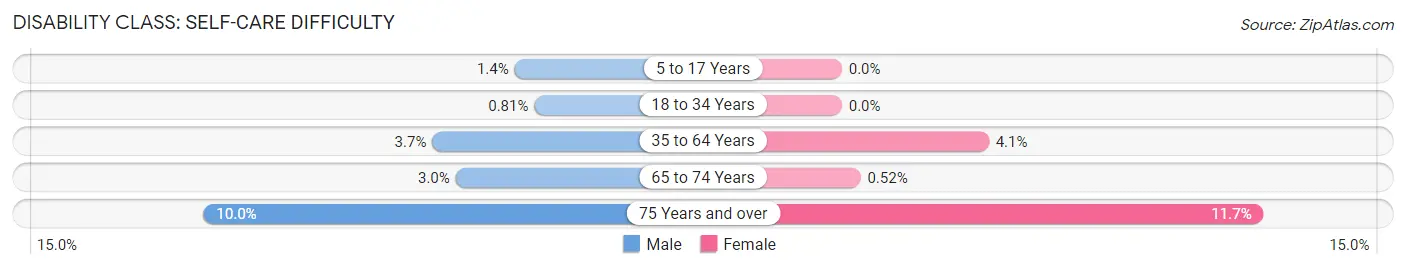
| Age Bracket | Male | Female |
| 5 to 17 Years | 18 (1.4%) | 0 (0.0%) |
| 18 to 34 Years | 14 (0.8%) | 0 (0.0%) |
| 35 to 64 Years | 98 (3.6%) | 133 (4.1%) |
| 65 to 74 Years | 34 (3.0%) | 6 (0.5%) |
| 75 Years and over | 47 (10.0%) | 98 (11.7%) |
Technology Access in Madison County
Computing Device Access in Madison County
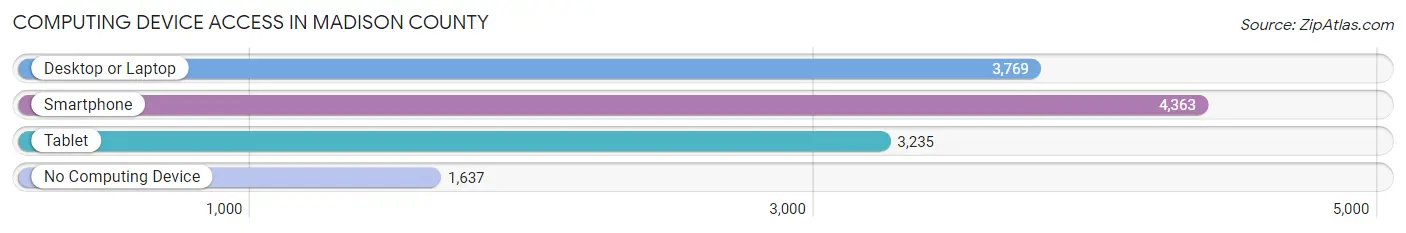
| Device Type | # Households | % Households |
| Desktop or Laptop | 3,769 | 56.3% |
| Smartphone | 4,363 | 65.2% |
| Tablet | 3,235 | 48.3% |
| No Computing Device | 1,637 | 24.5% |
| Total | 6,693 | 100.0% |
Internet Access in Madison County
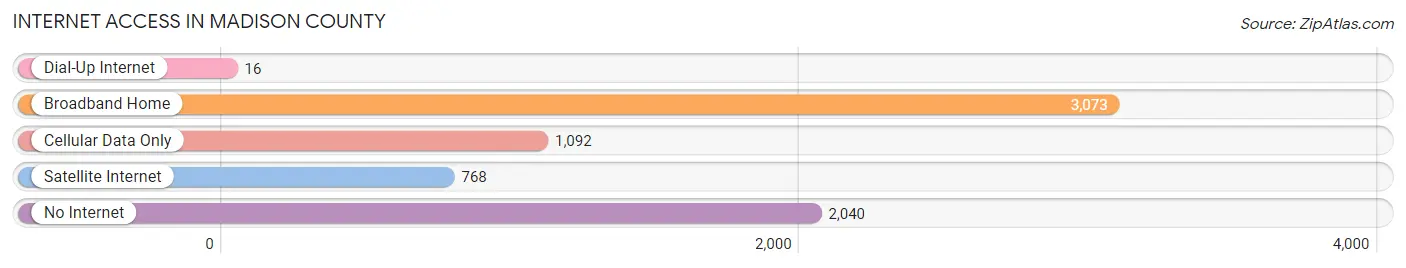
| Internet Type | # Households | % Households |
| Dial-Up Internet | 16 | 0.2% |
| Broadband Home | 3,073 | 45.9% |
| Cellular Data Only | 1,092 | 16.3% |
| Satellite Internet | 768 | 11.5% |
| No Internet | 2,040 | 30.5% |
| Total | 6,693 | 100.0% |
Madison County Summary
Madison County is a county located in the state of Florida in the United States. It is part of the Tallahassee, Florida Metropolitan Statistical Area. As of the 2010 census, the population was 19,224. The county seat is Madison.
History
Madison County was created in 1827 from a portion of Jefferson County. It was named for James Madison, the fourth President of the United States. The county was originally part of the Apalachee Province, a Spanish colony that extended from the Gulf of Mexico to the Atlantic Ocean. The area was first settled by Europeans in the early 1700s, and the county was officially established in 1827.
Geography
Madison County is located in the northern part of the state of Florida. It is bordered by Jefferson County to the north, Taylor County to the east, Lafayette County to the south, and Leon County to the west. The county has a total area of 576 square miles, of which 573 square miles is land and 3 square miles (0.5%) is water.
The county is mostly flat, with some rolling hills in the northern part. The highest point in the county is the summit of Pine Log Hill, which has an elevation of 200 feet. The county is drained by the Aucilla River, which flows through the western part of the county.
Economy
The economy of Madison County is largely based on agriculture. The county is home to several large farms, which produce a variety of crops, including cotton, peanuts, corn, soybeans, and hay. The county also has a thriving timber industry, with several large sawmills located in the area.
In addition to agriculture, Madison County is home to several manufacturing companies, including a paper mill, a furniture factory, and a plastics plant. The county also has a growing tourism industry, with several popular attractions, such as the Suwannee River State Park and the Madison Blue Springs State Park.
Demographics
As of the 2010 census, there were 19,224 people, 7,541 households, and 5,092 families residing in the county. The population density was 33.5 people per square mile. There were 8,717 housing units at an average density of 15.2 per square mile. The racial makeup of the county was 68.2% White, 28.2% Black or African American, 0.4% Native American, 0.6% Asian, 0.1% Pacific Islander, 1.2% from other races, and 1.3% from two or more races. Hispanic or Latino of any race were 3.3% of the population.
There were 7,541 households, out of which 28.2% had children under the age of 18 living with them, 48.2% were married couples living together, 15.2% had a female householder with no husband present, and 32.2% were non-families. 27.2% of all households were made up of individuals, and 11.7% had someone living alone who was 65 years of age or older. The average household size was 2.48 and the average family size was 3.00.
In the county, the population was spread out, with 24.2% under the age of 18, 8.2% from 18 to 24, 25.2% from 25 to 44, 25.2% from 45 to 64, and 17.2% who were 65 years of age or older. The median age was 39 years. For every 100 females, there were 94.2 males. For every 100 females age 18 and over, there were 91.2 males.
The median income for a household in the county was $30,945, and the median income for a family was $37,813. Males had a median income of $30,945 versus $21,813 for females. The per capita income for the county was $16,845. About 14.2% of families and 17.7% of the population were below the poverty line, including 24.2% of those under age 18 and 14.2% of those age 65 or over.
Common Questions
What is Per Capita Income in Madison County?
Per Capita income in Madison County is $22,760.
What is the Median Family Income in Madison County?
Median Family Income in Madison County is $56,621.
What is the Median Household income in Madison County?
Median Household Income in Madison County is $43,386.
What is Income or Wage Gap in Madison County?
Income or Wage Gap in Madison County is 23.1%.
Women in Madison County earn 76.9 cents for every dollar earned by a man.
What is Family Income Deficit in Madison County?
Family Income Deficit in Madison County is $12,708.
Families that are below poverty line in Madison County earn $12,708 less on average than the poverty threshold level.
What is Inequality or Gini Index in Madison County?
Inequality or Gini Index in Madison County is 0.47.
What is the Total Population of Madison County?
Total Population of Madison County is 17,986.
What is the Total Male Population of Madison County?
Total Male Population of Madison County is 9,439.
What is the Total Female Population of Madison County?
Total Female Population of Madison County is 8,547.
What is the Ratio of Males per 100 Females in Madison County?
There are 110.44 Males per 100 Females in Madison County.
What is the Ratio of Females per 100 Males in Madison County?
There are 90.55 Females per 100 Males in Madison County.
What is the Median Population Age in Madison County?
Median Population Age in Madison County is 44.5 Years.
What is the Average Family Size in Madison County
Average Family Size in Madison County is 3.1 People.
What is the Average Household Size in Madison County
Average Household Size in Madison County is 2.4 People.
How Large is the Labor Force in Madison County?
There are 6,392 People in the Labor Forcein in Madison County.
What is the Percentage of People in the Labor Force in Madison County?
42.4% of People are in the Labor Force in Madison County.
What is the Unemployment Rate in Madison County?
Unemployment Rate in Madison County is 2.7%.