Liberty County, FL Map & Demographics
Liberty County Map
Liberty County Overview
$24,080
PER CAPITA INCOME
$61,018
AVG FAMILY INCOME
$51,723
AVG HOUSEHOLD INCOME
17.8%
WAGE / INCOME GAP [ % ]
82.2¢/ $1
WAGE / INCOME GAP [ $ ]
$10,018
FAMILY INCOME DEFICIT
0.42
INEQUALITY / GINI INDEX
7,704
TOTAL POPULATION
4,317
MALE POPULATION
3,387
FEMALE POPULATION
127.46
MALES / 100 FEMALES
78.46
FEMALES / 100 MALES
39.6
MEDIAN AGE
3.2
AVG FAMILY SIZE
2.6
AVG HOUSEHOLD SIZE
2,770
LABOR FORCE [ PEOPLE ]
42.4%
PERCENT IN LABOR FORCE
8.2%
UNEMPLOYMENT RATE
Liberty County Area Codes
Income in Liberty County
Income Overview in Liberty County
Per Capita Income in Liberty County is $24,080, while median incomes of families and households are $61,018 and $51,723 respectively.
| Characteristic | Number | Measure |
| Per Capita Income | 7,704 | $24,080 |
| Median Family Income | 1,655 | $61,018 |
| Mean Family Income | 1,655 | $73,217 |
| Median Household Income | 2,447 | $51,723 |
| Mean Household Income | 2,447 | $61,612 |
| Income Deficit | 1,655 | $10,018 |
| Wage / Income Gap (%) | 7,704 | 17.80% |
| Wage / Income Gap ($) | 7,704 | 82.20¢ per $1 |
| Gini / Inequality Index | 7,704 | 0.42 |
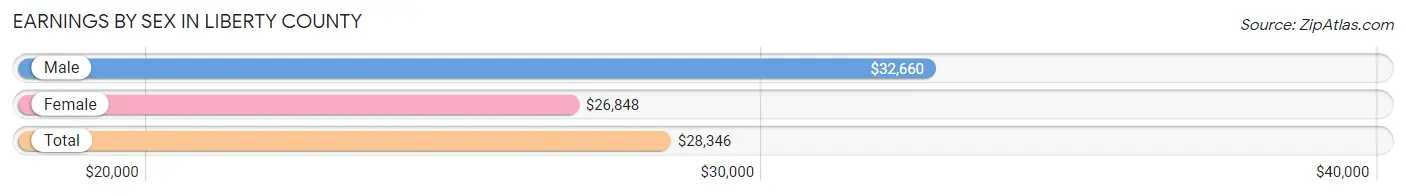
Earnings by Sex in Liberty County
Average Earnings in Liberty County are $28,346, $32,660 for men and $26,848 for women, a difference of 17.8%.
| Sex | Number | Average Earnings |
| Male | 1,609 (50.8%) | $32,660 |
| Female | 1,558 (49.2%) | $26,848 |
| Total | 3,167 (100.0%) | $28,346 |
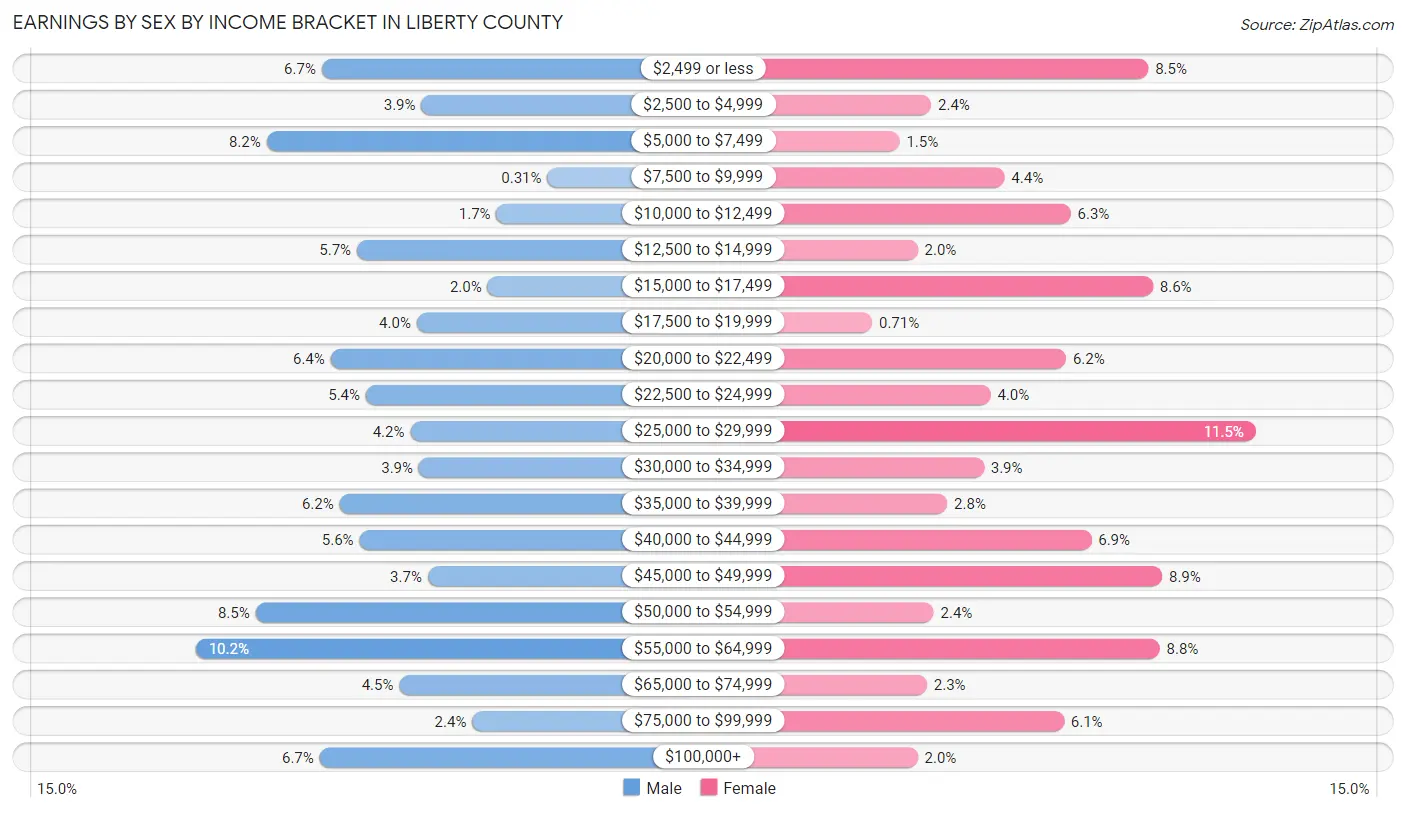
Earnings by Sex by Income Bracket in Liberty County
The most common earnings brackets in Liberty County are $55,000 to $64,999 for men (164 | 10.2%) and $25,000 to $29,999 for women (179 | 11.5%).
| Income | Male | Female |
| $2,499 or less | 107 (6.7%) | 132 (8.5%) |
| $2,500 to $4,999 | 62 (3.8%) | 37 (2.4%) |
| $5,000 to $7,499 | 132 (8.2%) | 23 (1.5%) |
| $7,500 to $9,999 | 5 (0.3%) | 69 (4.4%) |
| $10,000 to $12,499 | 28 (1.7%) | 98 (6.3%) |
| $12,500 to $14,999 | 91 (5.7%) | 31 (2.0%) |
| $15,000 to $17,499 | 32 (2.0%) | 134 (8.6%) |
| $17,500 to $19,999 | 64 (4.0%) | 11 (0.7%) |
| $20,000 to $22,499 | 103 (6.4%) | 96 (6.2%) |
| $22,500 to $24,999 | 87 (5.4%) | 63 (4.0%) |
| $25,000 to $29,999 | 67 (4.2%) | 179 (11.5%) |
| $30,000 to $34,999 | 63 (3.9%) | 60 (3.8%) |
| $35,000 to $39,999 | 99 (6.1%) | 44 (2.8%) |
| $40,000 to $44,999 | 90 (5.6%) | 107 (6.9%) |
| $45,000 to $49,999 | 59 (3.7%) | 138 (8.9%) |
| $50,000 to $54,999 | 137 (8.5%) | 38 (2.4%) |
| $55,000 to $64,999 | 164 (10.2%) | 137 (8.8%) |
| $65,000 to $74,999 | 72 (4.5%) | 35 (2.2%) |
| $75,000 to $99,999 | 39 (2.4%) | 95 (6.1%) |
| $100,000+ | 108 (6.7%) | 31 (2.0%) |
| Total | 1,609 (100.0%) | 1,558 (100.0%) |
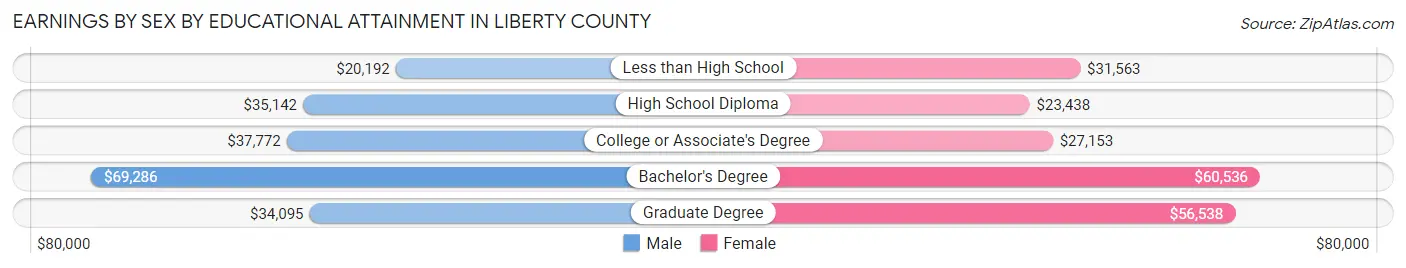
Earnings by Sex by Educational Attainment in Liberty County
Average earnings in Liberty County are $31,838 for men and $31,500 for women, a difference of 1.1%. Men with an educational attainment of bachelor's degree enjoy the highest average annual earnings of $69,286, while those with less than high school education earn the least with $20,192. Women with an educational attainment of bachelor's degree earn the most with the average annual earnings of $60,536, while those with high school diploma education have the smallest earnings of $23,438.
| Educational Attainment | Male Income | Female Income |
| Less than High School | $20,192 | $31,563 |
| High School Diploma | $35,142 | $23,438 |
| College or Associate's Degree | $37,772 | $27,153 |
| Bachelor's Degree | $69,286 | $60,536 |
| Graduate Degree | $34,095 | $56,538 |
| Total | $31,838 | $31,500 |
Family Income in Liberty County
Family Income Brackets in Liberty County
According to the Liberty County family income data, there are 412 families falling into the $50,000 to $74,999 income range, which is the most common income bracket and makes up 24.9% of all families. Conversely, the $10,000 to $14,999 income bracket is the least frequent group with only 36 families (2.2%) belonging to this category.
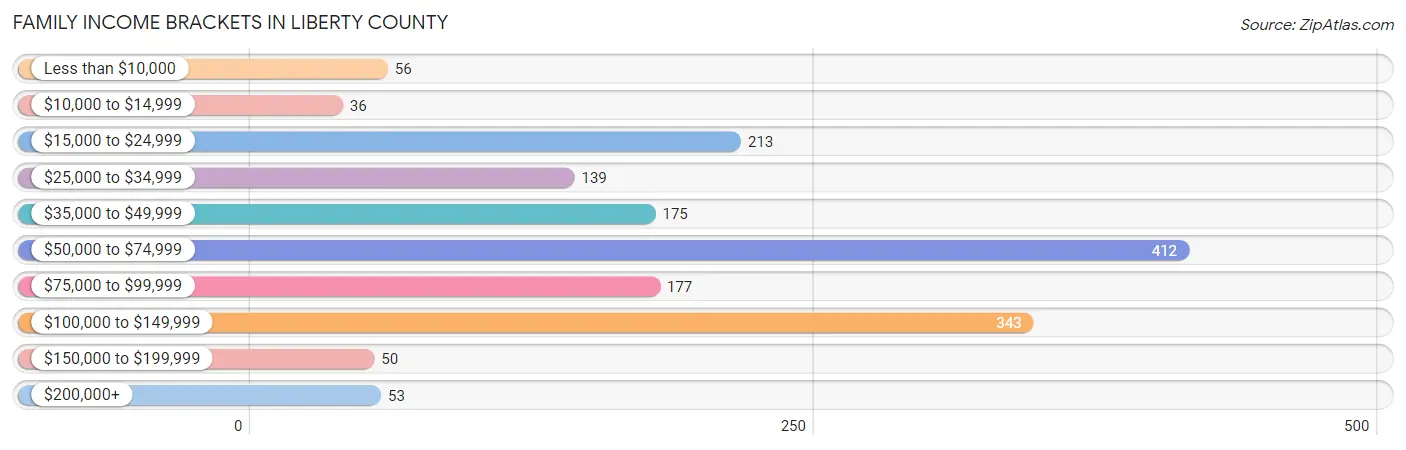
| Income Bracket | # Families | % Families |
| Less than $10,000 | 56 | 3.4% |
| $10,000 to $14,999 | 36 | 2.2% |
| $15,000 to $24,999 | 213 | 12.9% |
| $25,000 to $34,999 | 139 | 8.4% |
| $35,000 to $49,999 | 175 | 10.6% |
| $50,000 to $74,999 | 412 | 24.9% |
| $75,000 to $99,999 | 177 | 10.7% |
| $100,000 to $149,999 | 343 | 20.7% |
| $150,000 to $199,999 | 50 | 3.0% |
| $200,000+ | 53 | 3.2% |
Family Income by Famaliy Size in Liberty County
4-person families (280 | 16.9%) account for the highest median family income in Liberty County with $69,722 per family, while 2-person families (749 | 45.3%) have the highest median income of $29,930 per family member.
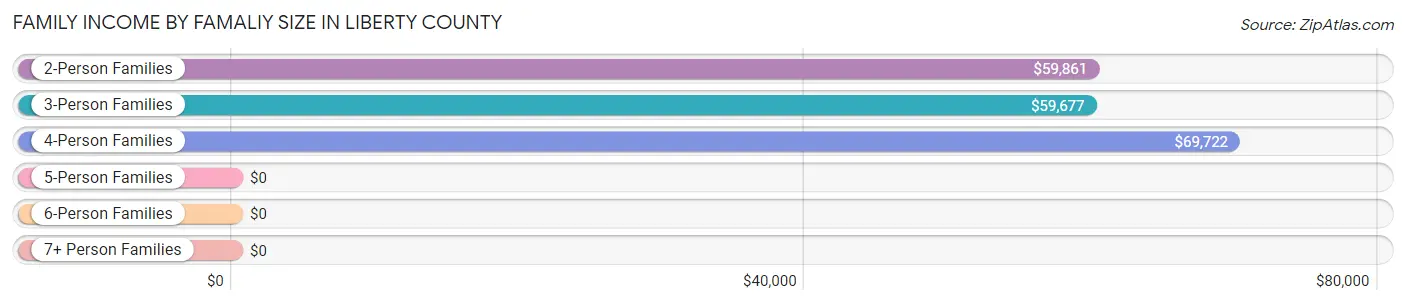
| Income Bracket | # Families | Median Income |
| 2-Person Families | 749 (45.3%) | $59,861 |
| 3-Person Families | 490 (29.6%) | $59,677 |
| 4-Person Families | 280 (16.9%) | $69,722 |
| 5-Person Families | 119 (7.2%) | $0 |
| 6-Person Families | 15 (0.9%) | $0 |
| 7+ Person Families | 2 (0.1%) | $0 |
| Total | 1,655 (100.0%) | $61,018 |
Family Income by Number of Earners in Liberty County
The median family income in Liberty County is $61,018, with families comprising 3+ earners (71) having the highest median family income of $113,897, while families with no earners (316) have the lowest median family income of $38,684, accounting for 4.3% and 19.1% of families, respectively.
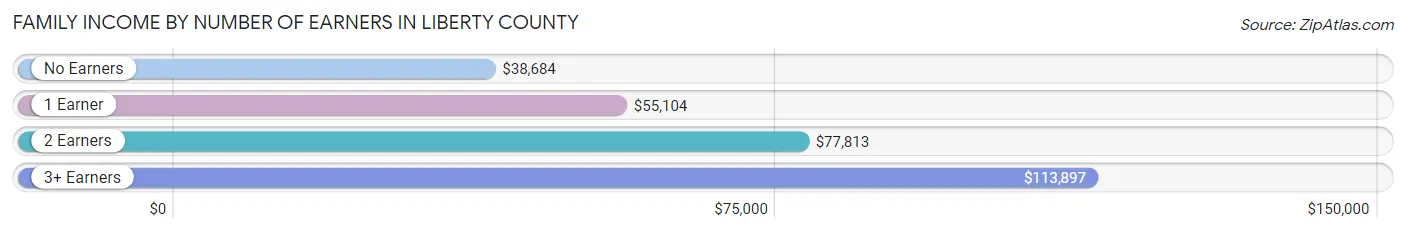
| Number of Earners | # Families | Median Income |
| No Earners | 316 (19.1%) | $38,684 |
| 1 Earner | 577 (34.9%) | $55,104 |
| 2 Earners | 691 (41.7%) | $77,813 |
| 3+ Earners | 71 (4.3%) | $113,897 |
| Total | 1,655 (100.0%) | $61,018 |
Household Income in Liberty County
Household Income Brackets in Liberty County
With 582 households falling in the category, the $50,000 to $74,999 income range is the most frequent in Liberty County, accounting for 23.8% of all households. In contrast, only 49 households (2.0%) fall into the $150,000 to $199,999 income bracket, making it the least populous group.
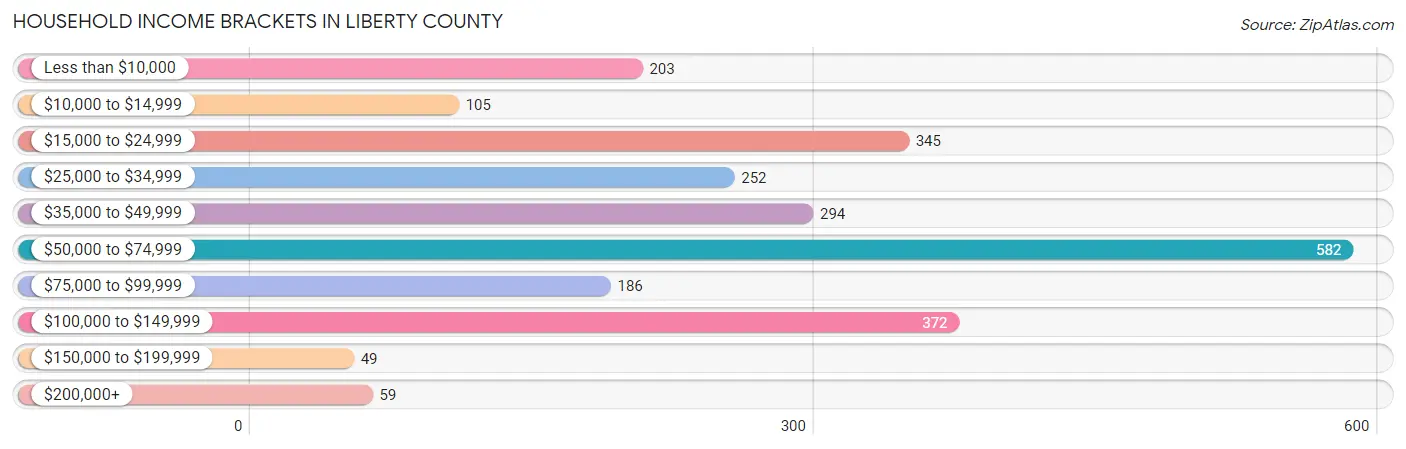
| Income Bracket | # Households | % Households |
| Less than $10,000 | 203 | 8.3% |
| $10,000 to $14,999 | 105 | 4.3% |
| $15,000 to $24,999 | 345 | 14.1% |
| $25,000 to $34,999 | 252 | 10.3% |
| $35,000 to $49,999 | 294 | 12.0% |
| $50,000 to $74,999 | 582 | 23.8% |
| $75,000 to $99,999 | 186 | 7.6% |
| $100,000 to $149,999 | 372 | 15.2% |
| $150,000 to $199,999 | 49 | 2.0% |
| $200,000+ | 59 | 2.4% |
Household Income by Householder Age in Liberty County
The median household income in Liberty County is $51,723, with the highest median household income of $68,150 found in the 15 to 24 years age bracket for the primary householder. A total of 75 households (3.1%) fall into this category. Meanwhile, the 45 to 64 years age bracket for the primary householder has the lowest median household income of $41,932, with 1,038 households (42.4%) in this group.
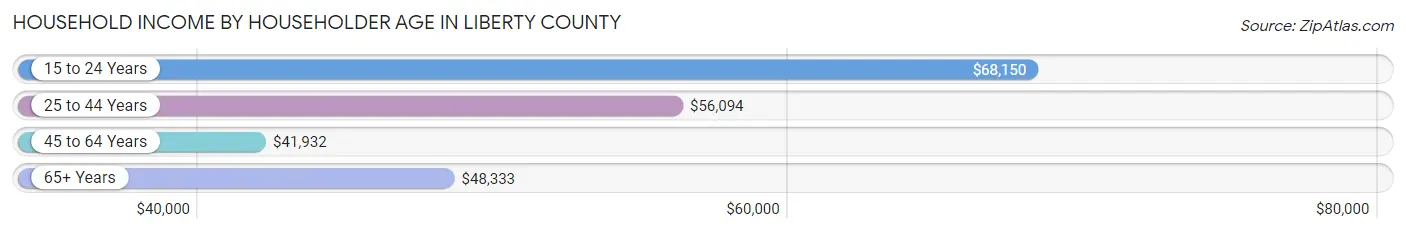
| Income Bracket | # Households | Median Income |
| 15 to 24 Years | 75 (3.1%) | $68,150 |
| 25 to 44 Years | 686 (28.0%) | $56,094 |
| 45 to 64 Years | 1,038 (42.4%) | $41,932 |
| 65+ Years | 648 (26.5%) | $48,333 |
| Total | 2,447 (100.0%) | $51,723 |
Poverty in Liberty County
Income Below Poverty by Sex and Age in Liberty County
With 19.2% poverty level for males and 24.0% for females among the residents of Liberty County, 55 to 64 year old males and 12 to 14 year old females are the most vulnerable to poverty, with 131 males (32.5%) and 115 females (60.5%) in their respective age groups living below the poverty level.
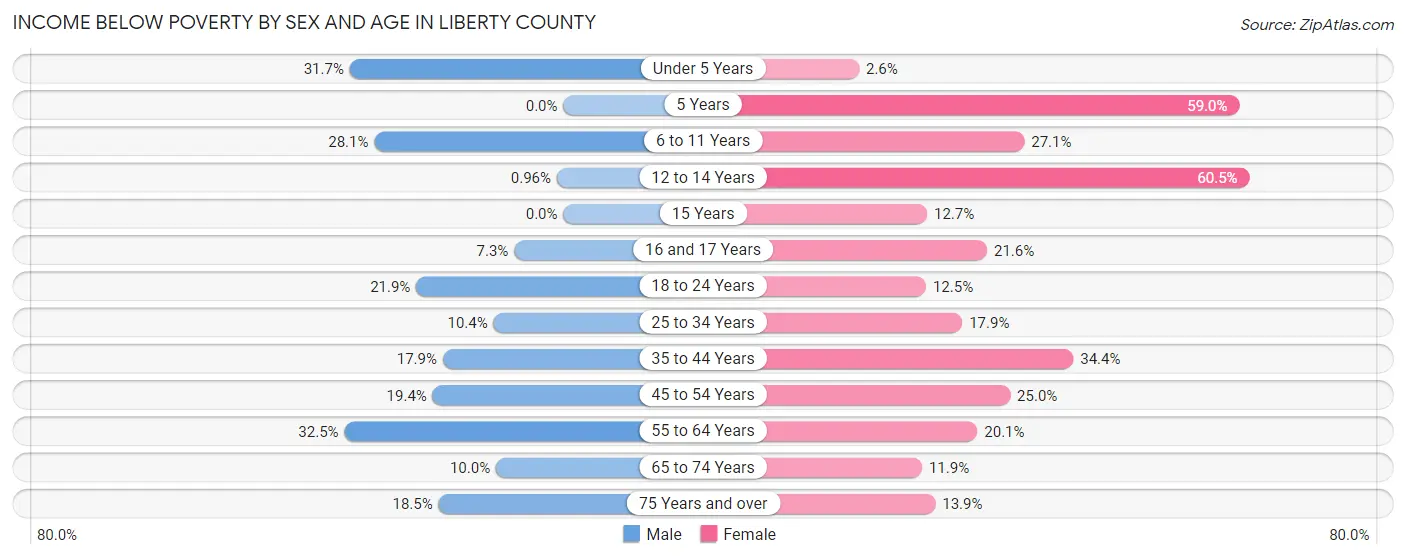
| Age Bracket | Male | Female |
| Under 5 Years | 46 (31.7%) | 2 (2.6%) |
| 5 Years | 0 (0.0%) | 36 (59.0%) |
| 6 to 11 Years | 73 (28.1%) | 58 (27.1%) |
| 12 to 14 Years | 1 (1.0%) | 115 (60.5%) |
| 15 Years | 0 (0.0%) | 10 (12.7%) |
| 16 and 17 Years | 10 (7.3%) | 33 (21.6%) |
| 18 to 24 Years | 66 (21.8%) | 35 (12.5%) |
| 25 to 34 Years | 43 (10.4%) | 59 (17.9%) |
| 35 to 44 Years | 46 (17.9%) | 186 (34.4%) |
| 45 to 54 Years | 86 (19.4%) | 113 (25.0%) |
| 55 to 64 Years | 131 (32.5%) | 94 (20.1%) |
| 65 to 74 Years | 22 (10.0%) | 33 (11.9%) |
| 75 Years and over | 43 (18.5%) | 34 (13.9%) |
| Total | 567 (19.2%) | 808 (24.0%) |
Income Above Poverty by Sex and Age in Liberty County
According to the poverty statistics in Liberty County, males aged 5 years and females aged under 5 years are the age groups that are most secure financially, with 100.0% of males and 97.4% of females in these age groups living above the poverty line.
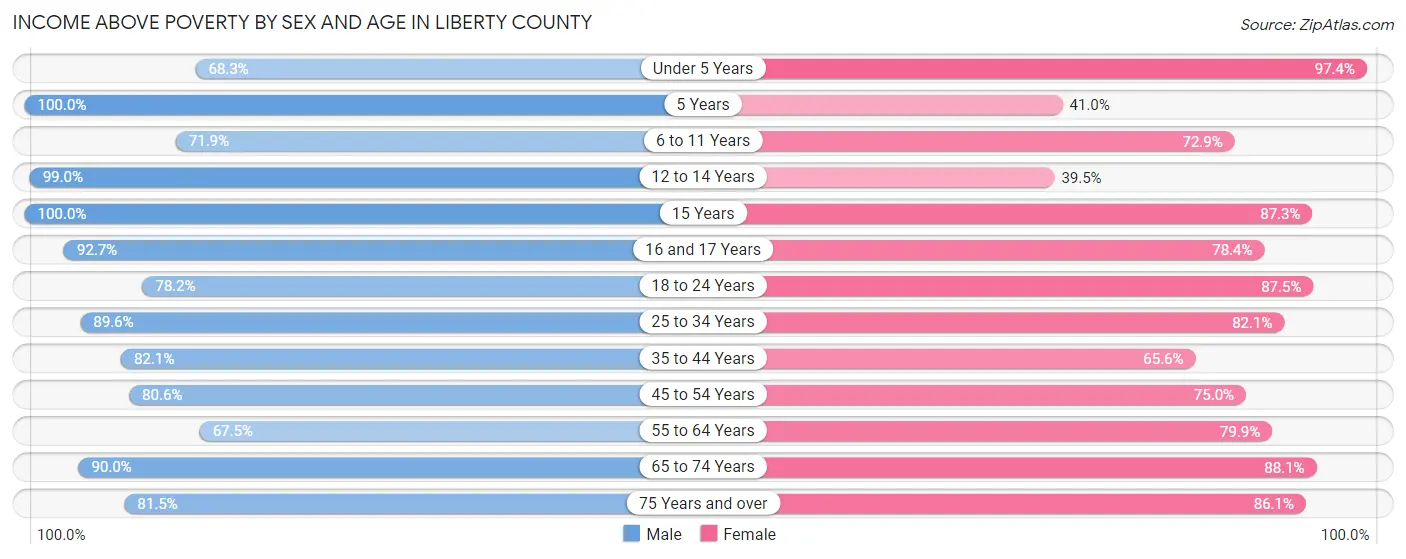
| Age Bracket | Male | Female |
| Under 5 Years | 99 (68.3%) | 76 (97.4%) |
| 5 Years | 6 (100.0%) | 25 (41.0%) |
| 6 to 11 Years | 187 (71.9%) | 156 (72.9%) |
| 12 to 14 Years | 103 (99.0%) | 75 (39.5%) |
| 15 Years | 23 (100.0%) | 69 (87.3%) |
| 16 and 17 Years | 127 (92.7%) | 120 (78.4%) |
| 18 to 24 Years | 236 (78.1%) | 245 (87.5%) |
| 25 to 34 Years | 372 (89.6%) | 271 (82.1%) |
| 35 to 44 Years | 211 (82.1%) | 355 (65.6%) |
| 45 to 54 Years | 357 (80.6%) | 339 (75.0%) |
| 55 to 64 Years | 272 (67.5%) | 373 (79.9%) |
| 65 to 74 Years | 198 (90.0%) | 244 (88.1%) |
| 75 Years and over | 189 (81.5%) | 211 (86.1%) |
| Total | 2,380 (80.8%) | 2,559 (76.0%) |
Income Below Poverty Among Married-Couple Families in Liberty County
The poverty statistics for married-couple families in Liberty County show that 7.8% or 78 of the total 1,004 families live below the poverty line. Families with 1 or 2 children have the highest poverty rate of 9.3%, comprising of 36 families. On the other hand, families with no children have the lowest poverty rate of 6.8%, which includes 38 families.
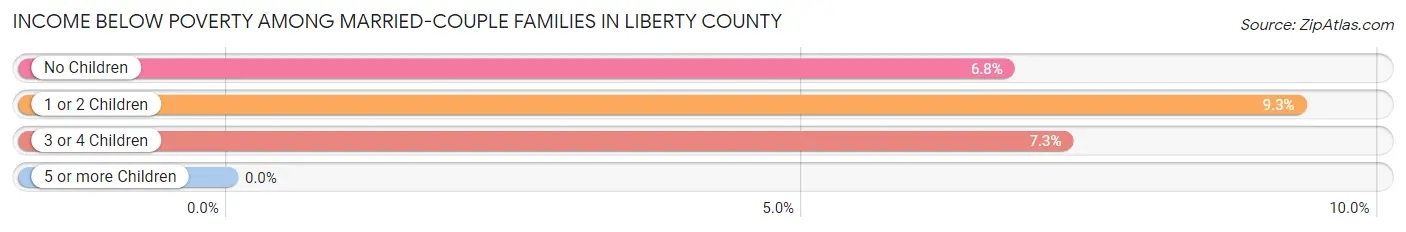
| Children | Above Poverty | Below Poverty |
| No Children | 524 (93.2%) | 38 (6.8%) |
| 1 or 2 Children | 351 (90.7%) | 36 (9.3%) |
| 3 or 4 Children | 51 (92.7%) | 4 (7.3%) |
| 5 or more Children | 0 (0.0%) | 0 (0.0%) |
| Total | 926 (92.2%) | 78 (7.8%) |
Income Below Poverty Among Single-Parent Households in Liberty County
According to the poverty data in Liberty County, 33.3% or 42 single-father households and 29.3% or 154 single-mother households are living below the poverty line. Among single-father households, those with 3 or 4 children have the highest poverty rate, with 12 households (85.7%) experiencing poverty. Likewise, among single-mother households, those with 1 or 2 children have the highest poverty rate, with 130 households (40.5%) falling below the poverty line.
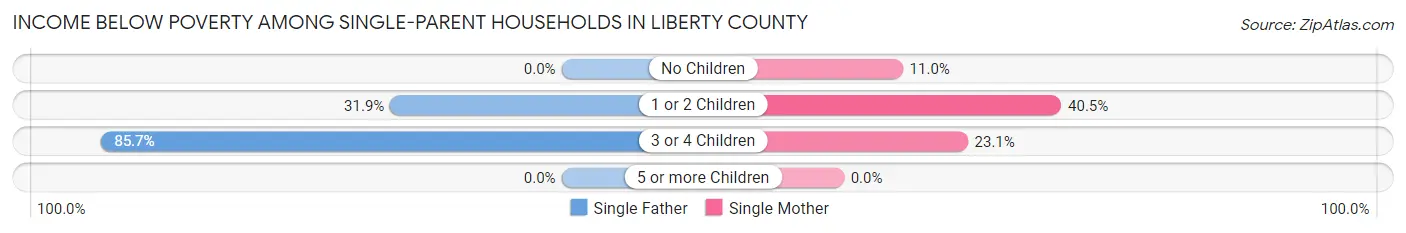
| Children | Single Father | Single Mother |
| No Children | 0 (0.0%) | 21 (11.0%) |
| 1 or 2 Children | 30 (31.9%) | 130 (40.5%) |
| 3 or 4 Children | 12 (85.7%) | 3 (23.1%) |
| 5 or more Children | 0 (0.0%) | 0 (0.0%) |
| Total | 42 (33.3%) | 154 (29.3%) |
Income Below Poverty Among Married-Couple vs Single-Parent Households in Liberty County
The poverty data for Liberty County shows that 78 of the married-couple family households (7.8%) and 196 of the single-parent households (30.1%) are living below the poverty level. Within the married-couple family households, those with 1 or 2 children have the highest poverty rate, with 36 households (9.3%) falling below the poverty line. Among the single-parent households, those with 3 or 4 children have the highest poverty rate, with 15 household (55.6%) living below poverty.
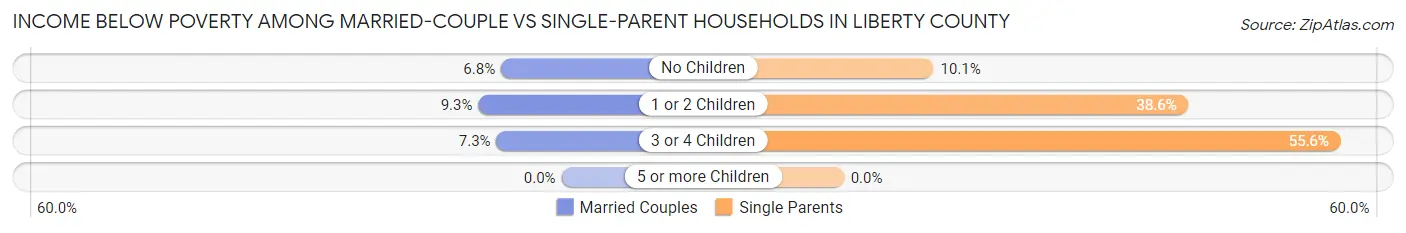
| Children | Married-Couple Families | Single-Parent Households |
| No Children | 38 (6.8%) | 21 (10.1%) |
| 1 or 2 Children | 36 (9.3%) | 160 (38.6%) |
| 3 or 4 Children | 4 (7.3%) | 15 (55.6%) |
| 5 or more Children | 0 (0.0%) | 0 (0.0%) |
| Total | 78 (7.8%) | 196 (30.1%) |
Race in Liberty County
The most populous races in Liberty County are White / Caucasian (5,863 | 76.1%), Black / African American (1,158 | 15.0%), and Hispanic or Latino (603 | 7.8%).
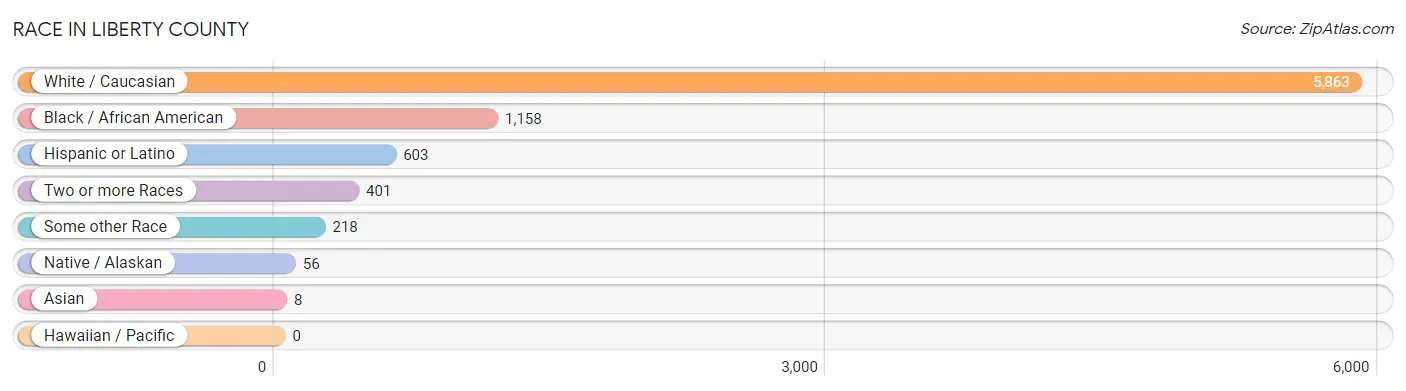
| Race | # Population | % Population |
| Asian | 8 | 0.1% |
| Black / African American | 1,158 | 15.0% |
| Hawaiian / Pacific | 0 | 0.0% |
| Hispanic or Latino | 603 | 7.8% |
| Native / Alaskan | 56 | 0.7% |
| White / Caucasian | 5,863 | 76.1% |
| Two or more Races | 401 | 5.2% |
| Some other Race | 218 | 2.8% |
| Total | 7,704 | 100.0% |
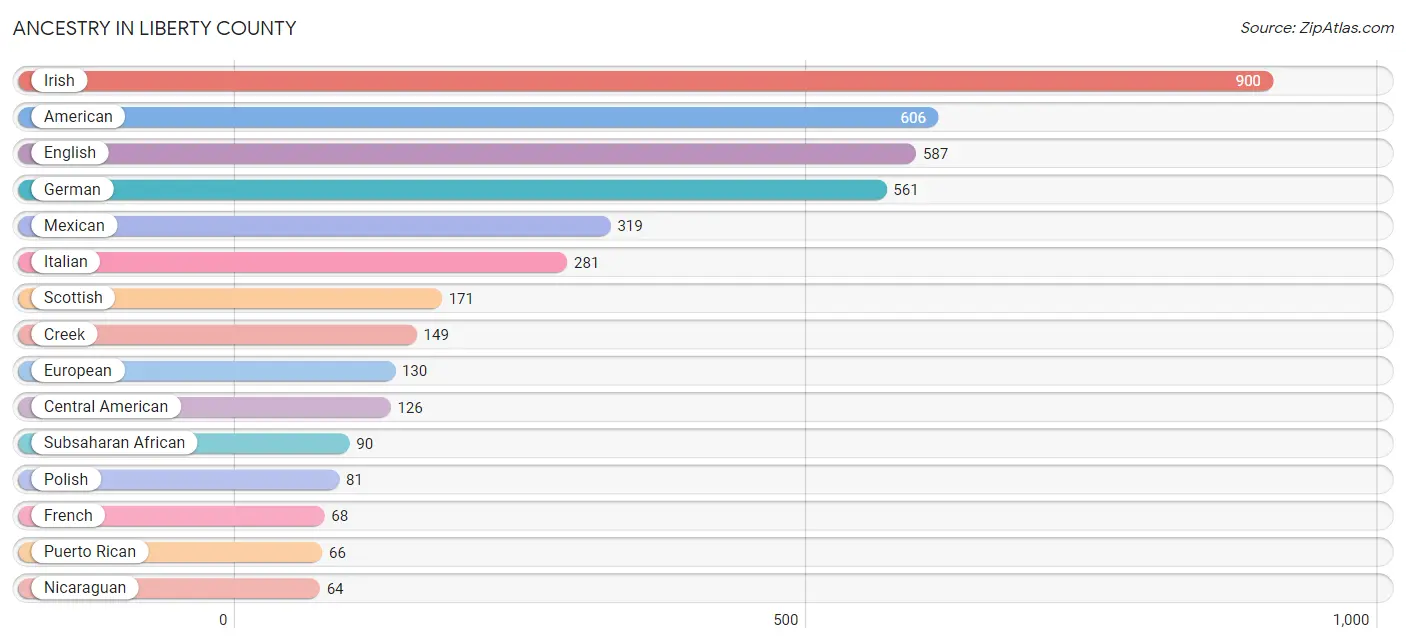
Ancestry in Liberty County
The most populous ancestries reported in Liberty County are Irish (900 | 11.7%), American (606 | 7.9%), English (587 | 7.6%), German (561 | 7.3%), and Mexican (319 | 4.1%), together accounting for 38.6% of all Liberty County residents.
| Ancestry | # Population | % Population |
| African | 39 | 0.5% |
| American | 606 | 7.9% |
| Arab | 30 | 0.4% |
| Bahamian | 8 | 0.1% |
| Blackfeet | 3 | 0.0% |
| British | 39 | 0.5% |
| Central American | 126 | 1.6% |
| Cherokee | 18 | 0.2% |
| Chippewa | 13 | 0.2% |
| Colombian | 7 | 0.1% |
| Creek | 149 | 1.9% |
| Cuban | 23 | 0.3% |
| Czech | 8 | 0.1% |
| Danish | 17 | 0.2% |
| Dutch | 51 | 0.7% |
| Egyptian | 8 | 0.1% |
| English | 587 | 7.6% |
| European | 130 | 1.7% |
| Finnish | 3 | 0.0% |
| French | 68 | 0.9% |
| French Canadian | 7 | 0.1% |
| German | 561 | 7.3% |
| Greek | 5 | 0.1% |
| Guatemalan | 28 | 0.4% |
| Haitian | 18 | 0.2% |
| Honduran | 34 | 0.4% |
| Indian (Asian) | 13 | 0.2% |
| Irish | 900 | 11.7% |
| Israeli | 21 | 0.3% |
| Italian | 281 | 3.6% |
| Mexican | 319 | 4.1% |
| Nicaraguan | 64 | 0.8% |
| Nigerian | 3 | 0.0% |
| Northern European | 22 | 0.3% |
| Norwegian | 2 | 0.0% |
| Peruvian | 15 | 0.2% |
| Polish | 81 | 1.1% |
| Portuguese | 5 | 0.1% |
| Puerto Rican | 66 | 0.9% |
| Russian | 32 | 0.4% |
| Scandinavian | 47 | 0.6% |
| Scotch-Irish | 56 | 0.7% |
| Scottish | 171 | 2.2% |
| South American | 22 | 0.3% |
| Spaniard | 9 | 0.1% |
| Sri Lankan | 50 | 0.6% |
| Subsaharan African | 90 | 1.2% |
| Welsh | 15 | 0.2% | View All 48 Rows |
Immigrants in Liberty County
The most numerous immigrant groups reported in Liberty County came from Latin America (166 | 2.1%), Central America (124 | 1.6%), Mexico (87 | 1.1%), Africa (48 | 0.6%), and Eastern Africa (48 | 0.6%), together accounting for 6.1% of all Liberty County residents.
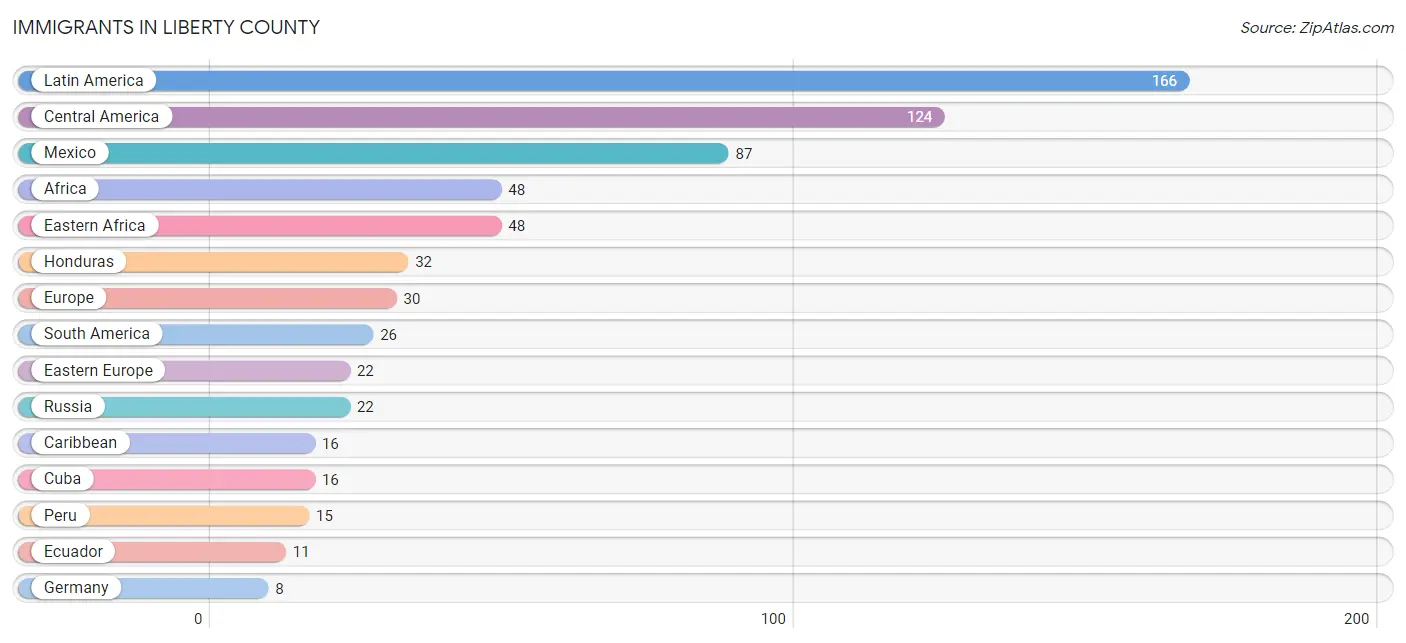
| Immigration Origin | # Population | % Population |
| Africa | 48 | 0.6% |
| Asia | 7 | 0.1% |
| Caribbean | 16 | 0.2% |
| Central America | 124 | 1.6% |
| China | 3 | 0.0% |
| Cuba | 16 | 0.2% |
| Eastern Africa | 48 | 0.6% |
| Eastern Asia | 3 | 0.0% |
| Eastern Europe | 22 | 0.3% |
| Ecuador | 11 | 0.1% |
| Europe | 30 | 0.4% |
| Germany | 8 | 0.1% |
| Guatemala | 5 | 0.1% |
| Honduras | 32 | 0.4% |
| Latin America | 166 | 2.1% |
| Mexico | 87 | 1.1% |
| Peru | 15 | 0.2% |
| Russia | 22 | 0.3% |
| South America | 26 | 0.3% |
| South Eastern Asia | 4 | 0.1% |
| Taiwan | 3 | 0.0% |
| Vietnam | 4 | 0.1% |
| Western Europe | 8 | 0.1% | View All 23 Rows |
Sex and Age in Liberty County
Sex and Age in Liberty County
The most populous age groups in Liberty County are 25 to 29 Years (486 | 11.3%) for men and 15 to 19 Years (381 | 11.3%) for women.
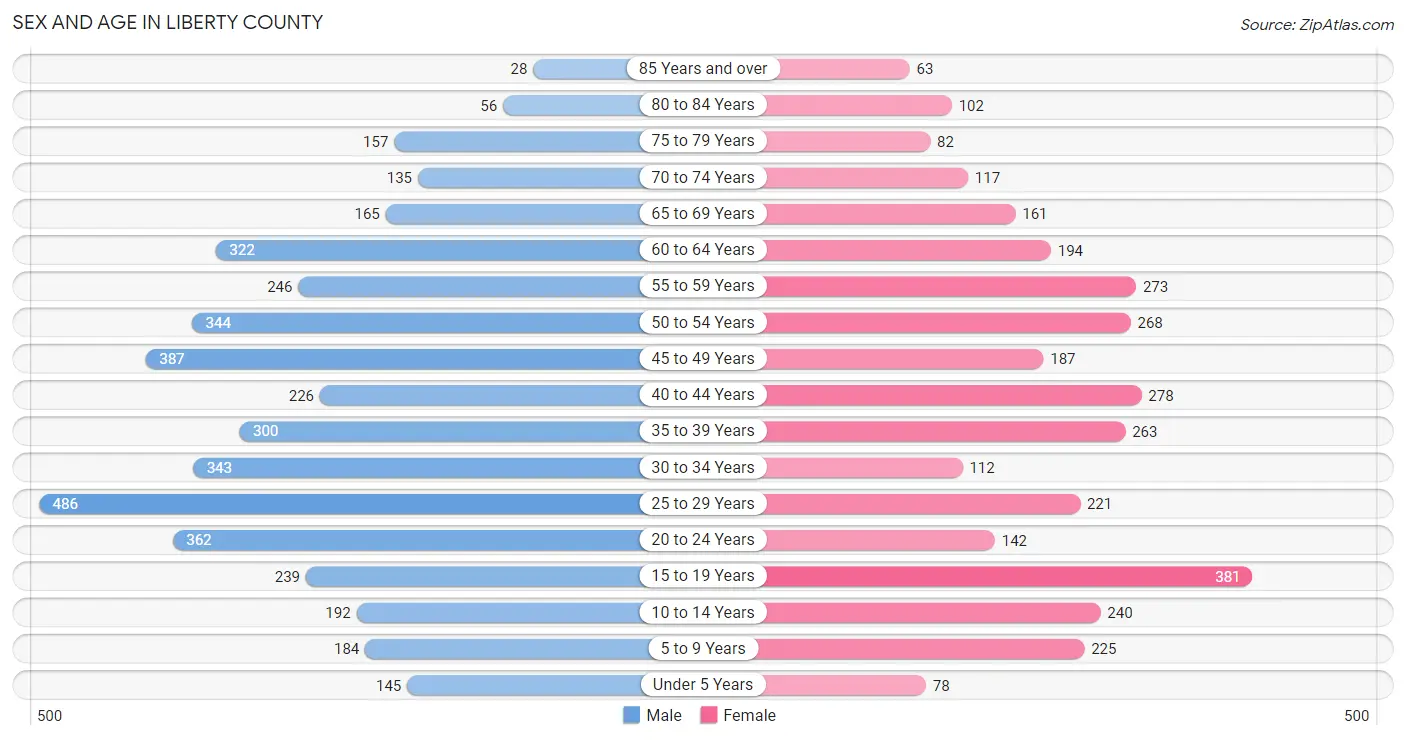
| Age Bracket | Male | Female |
| Under 5 Years | 145 (3.4%) | 78 (2.3%) |
| 5 to 9 Years | 184 (4.3%) | 225 (6.6%) |
| 10 to 14 Years | 192 (4.4%) | 240 (7.1%) |
| 15 to 19 Years | 239 (5.5%) | 381 (11.3%) |
| 20 to 24 Years | 362 (8.4%) | 142 (4.2%) |
| 25 to 29 Years | 486 (11.3%) | 221 (6.5%) |
| 30 to 34 Years | 343 (8.0%) | 112 (3.3%) |
| 35 to 39 Years | 300 (7.0%) | 263 (7.8%) |
| 40 to 44 Years | 226 (5.2%) | 278 (8.2%) |
| 45 to 49 Years | 387 (9.0%) | 187 (5.5%) |
| 50 to 54 Years | 344 (8.0%) | 268 (7.9%) |
| 55 to 59 Years | 246 (5.7%) | 273 (8.1%) |
| 60 to 64 Years | 322 (7.5%) | 194 (5.7%) |
| 65 to 69 Years | 165 (3.8%) | 161 (4.8%) |
| 70 to 74 Years | 135 (3.1%) | 117 (3.5%) |
| 75 to 79 Years | 157 (3.6%) | 82 (2.4%) |
| 80 to 84 Years | 56 (1.3%) | 102 (3.0%) |
| 85 Years and over | 28 (0.6%) | 63 (1.9%) |
| Total | 4,317 (100.0%) | 3,387 (100.0%) |
Families and Households in Liberty County
Median Family Size in Liberty County
The median family size in Liberty County is 3.16 persons per family, with single male/father families (126 | 7.6%) accounting for the largest median family size of 3.94 persons per family. On the other hand, married-couple families (1,004 | 60.7%) represent the smallest median family size with 3.00 persons per family.
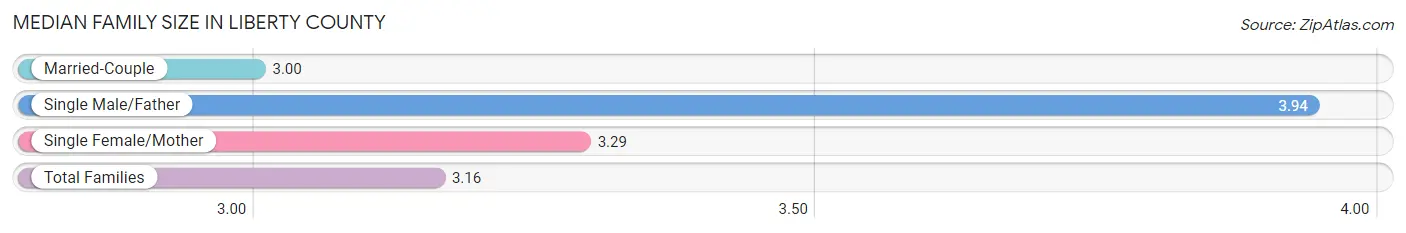
| Family Type | # Families | Family Size |
| Married-Couple | 1,004 (60.7%) | 3.00 |
| Single Male/Father | 126 (7.6%) | 3.94 |
| Single Female/Mother | 525 (31.7%) | 3.29 |
| Total Families | 1,655 (100.0%) | 3.16 |
Median Household Size in Liberty County
The median household size in Liberty County is 2.56 persons per household, with single male/father households (126 | 5.1%) accounting for the largest median household size of 4.6 persons per household. non-family households (792 | 32.4%) represent the smallest median household size with 1.12 persons per household.
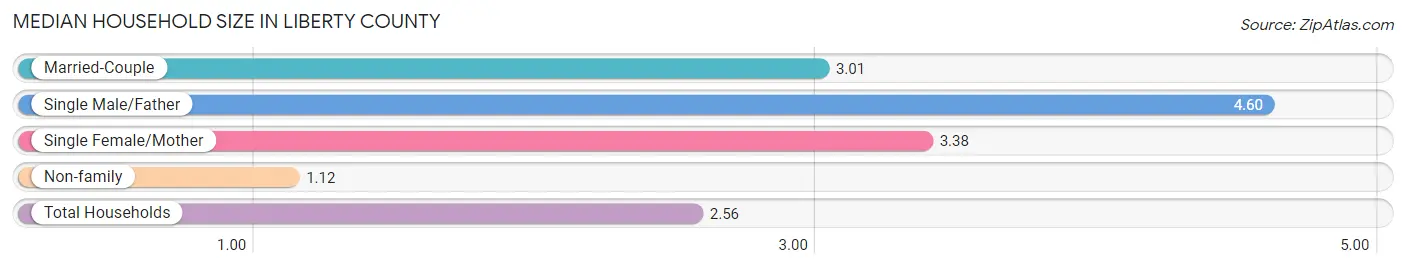
| Household Type | # Households | Household Size |
| Married-Couple | 1,004 (41.0%) | 3.01 |
| Single Male/Father | 126 (5.1%) | 4.60 |
| Single Female/Mother | 525 (21.4%) | 3.38 |
| Non-family | 792 (32.4%) | 1.12 |
| Total Households | 2,447 (100.0%) | 2.56 |
Household Size by Marriage Status in Liberty County
Out of a total of 2,447 households in Liberty County, 1,655 (67.6%) are family households, while 792 (32.4%) are nonfamily households. The most numerous type of family households are 2-person households, comprising 708, and the most common type of nonfamily households are 1-person households, comprising 708.
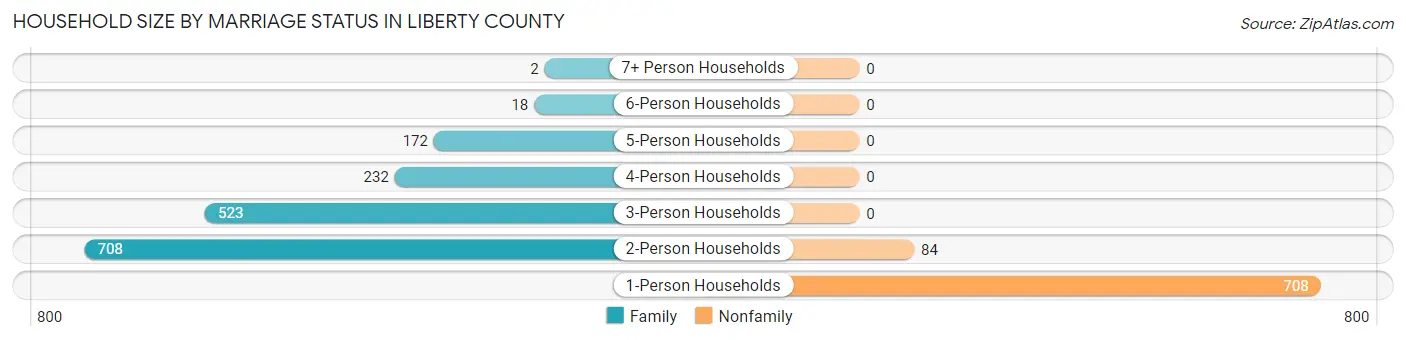
| Household Size | Family Households | Nonfamily Households |
| 1-Person Households | - | 708 (28.9%) |
| 2-Person Households | 708 (28.9%) | 84 (3.4%) |
| 3-Person Households | 523 (21.4%) | 0 (0.0%) |
| 4-Person Households | 232 (9.5%) | 0 (0.0%) |
| 5-Person Households | 172 (7.0%) | 0 (0.0%) |
| 6-Person Households | 18 (0.7%) | 0 (0.0%) |
| 7+ Person Households | 2 (0.1%) | 0 (0.0%) |
| Total | 1,655 (67.6%) | 792 (32.4%) |
Female Fertility in Liberty County
Fertility by Age in Liberty County
Average fertility rate in Liberty County is 21.0 births per 1,000 women. Women in the age bracket of 20 to 34 years have the highest fertility rate with 72.0 births per 1,000 women. Women in the age bracket of 20 to 34 years acount for 100.0% of all women with births.
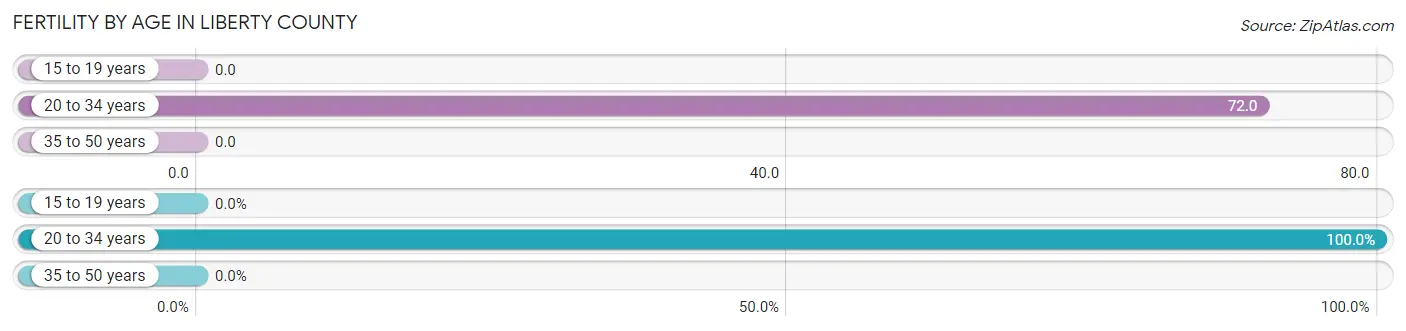
| Age Bracket | Women with Births | Births / 1,000 Women |
| 15 to 19 years | 0 (0.0%) | 0.0 |
| 20 to 34 years | 34 (100.0%) | 72.0 |
| 35 to 50 years | 0 (0.0%) | 0.0 |
| Total | 34 (100.0%) | 21.0 |
Fertility by Age by Marriage Status in Liberty County
52.9% of women with births (34) in Liberty County are married. The highest percentage of unmarried women with births falls into 20 to 34 years age bracket with 47.1% of them unmarried at the time of birth, while the lowest percentage of unmarried women with births belong to 20 to 34 years age bracket with 47.1% of them unmarried.
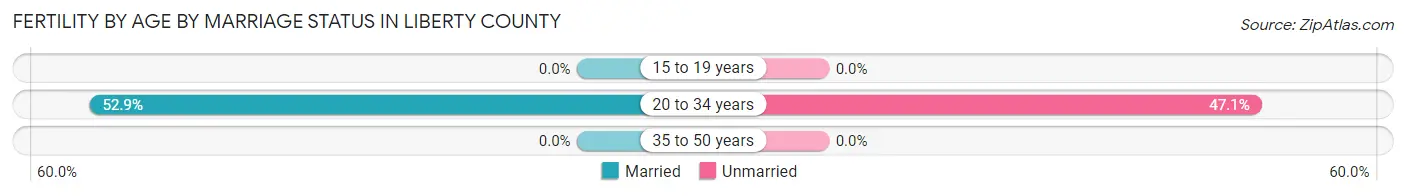
| Age Bracket | Married | Unmarried |
| 15 to 19 years | 0 (0.0%) | 0 (0.0%) |
| 20 to 34 years | 18 (52.9%) | 16 (47.1%) |
| 35 to 50 years | 0 (0.0%) | 0 (0.0%) |
| Total | 18 (52.9%) | 16 (47.1%) |
Fertility by Education in Liberty County
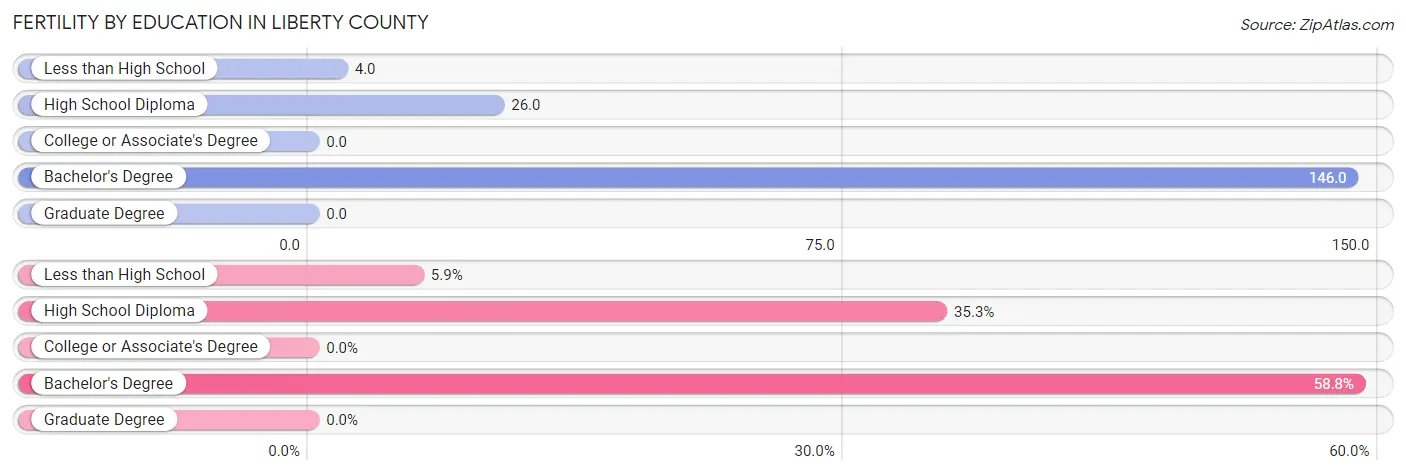
| Educational Attainment | Women with Births | Births / 1,000 Women |
| Less than High School | 2 (5.9%) | 4.0 |
| High School Diploma | 12 (35.3%) | 26.0 |
| College or Associate's Degree | 0 (0.0%) | 0.0 |
| Bachelor's Degree | 20 (58.8%) | 146.0 |
| Graduate Degree | 0 (0.0%) | 0.0 |
| Total | 34 (100.0%) | 21.0 |
Fertility by Education by Marriage Status in Liberty County
47.1% of women with births in Liberty County are unmarried. Women with the educational attainment of less than high school are most likely to be married with 100.0% of them married at childbirth, while women with the educational attainment of bachelor's degree are least likely to be married with 80.0% of them unmarried at childbirth.
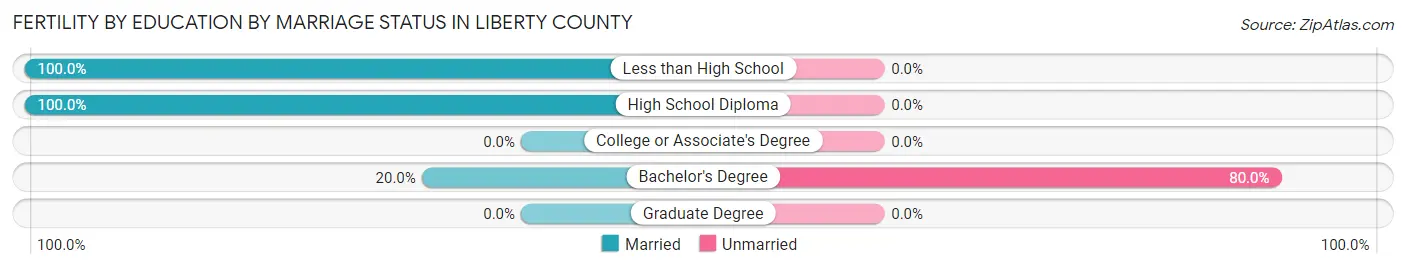
| Educational Attainment | Married | Unmarried |
| Less than High School | 2 (100.0%) | 0 (0.0%) |
| High School Diploma | 12 (100.0%) | 0 (0.0%) |
| College or Associate's Degree | 0 (0.0%) | 0 (0.0%) |
| Bachelor's Degree | 4 (20.0%) | 16 (80.0%) |
| Graduate Degree | 0 (0.0%) | 0 (0.0%) |
| Total | 18 (52.9%) | 16 (47.1%) |
Employment Characteristics in Liberty County
Employment by Class of Employer in Liberty County
Among the 2,492 employed individuals in Liberty County, private company employees (1,324 | 53.1%), state government employees (362 | 14.5%), and local government employees (356 | 14.3%) make up the most common classes of employment.
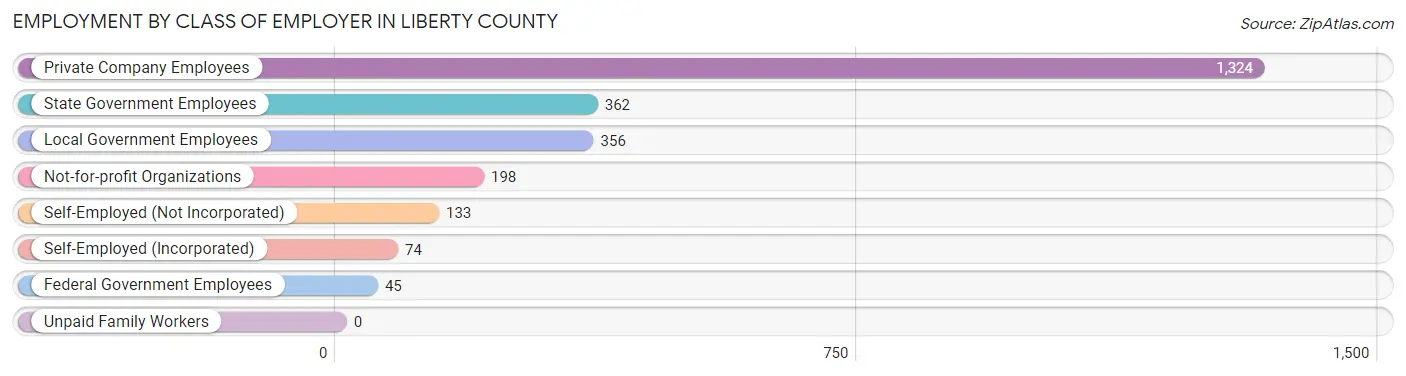
| Employer Class | # Employees | % Employees |
| Private Company Employees | 1,324 | 53.1% |
| Self-Employed (Incorporated) | 74 | 3.0% |
| Self-Employed (Not Incorporated) | 133 | 5.3% |
| Not-for-profit Organizations | 198 | 8.0% |
| Local Government Employees | 356 | 14.3% |
| State Government Employees | 362 | 14.5% |
| Federal Government Employees | 45 | 1.8% |
| Unpaid Family Workers | 0 | 0.0% |
| Total | 2,492 | 100.0% |
Employment Status by Age in Liberty County
According to the labor force statistics for Liberty County, out of the total population over 16 years of age (6,534), 42.4% or 2,770 individuals are in the labor force, with 8.2% or 227 of them unemployed. The age group with the highest labor force participation rate is 25 to 29 years, with 67.6% or 478 individuals in the labor force. Within the labor force, the 25 to 29 years age range has the highest percentage of unemployed individuals, with 25.1% or 120 of them being unemployed.
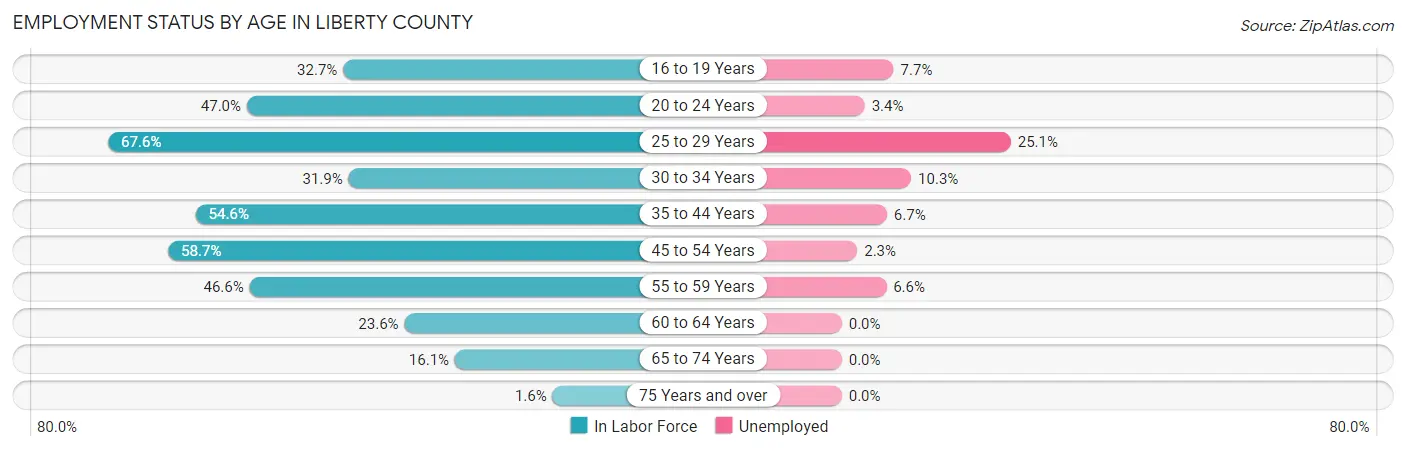
| Age Bracket | In Labor Force | Unemployed |
| 16 to 19 Years | 168 (32.7%) | 13 (7.7%) |
| 20 to 24 Years | 237 (47.0%) | 8 (3.4%) |
| 25 to 29 Years | 478 (67.6%) | 120 (25.1%) |
| 30 to 34 Years | 145 (31.9%) | 15 (10.3%) |
| 35 to 44 Years | 583 (54.6%) | 39 (6.7%) |
| 45 to 54 Years | 696 (58.7%) | 16 (2.3%) |
| 55 to 59 Years | 242 (46.6%) | 16 (6.6%) |
| 60 to 64 Years | 122 (23.6%) | 0 (0.0%) |
| 65 to 74 Years | 93 (16.1%) | 0 (0.0%) |
| 75 Years and over | 8 (1.6%) | 0 (0.0%) |
| Total | 2,770 (42.4%) | 227 (8.2%) |
Employment Status by Educational Attainment in Liberty County
According to labor force statistics for Liberty County, 50.9% of individuals (2,265) out of the total population between 25 and 64 years of age (4,450) are in the labor force, with 9.1% or 206 of them being unemployed. The group with the highest labor force participation rate are those with the educational attainment of bachelor's degree or higher, with 75.1% or 540 individuals in the labor force. Within the labor force, individuals with high school diploma education have the highest percentage of unemployment, with 17.4% or 127 of them being unemployed.

| Educational Attainment | In Labor Force | Unemployed |
| Less than High School | 366 (42.8%) | 128 (15.0%) |
| High School Diploma | 729 (38.4%) | 330 (17.4%) |
| College / Associate Degree | 630 (64.5%) | 37 (3.8%) |
| Bachelor's Degree or higher | 540 (75.1%) | 0 (0.0%) |
| Total | 2,265 (50.9%) | 405 (9.1%) |
Employment Occupations by Sex in Liberty County
Management, Business, Science and Arts Occupations
The most common Management, Business, Science and Arts occupations in Liberty County are Community & Social Service (281 | 11.0%), Education Instruction & Library (184 | 7.2%), Health Diagnosing & Treating (148 | 5.8%), Computers, Engineering & Science (122 | 4.8%), and Management (105 | 4.1%).
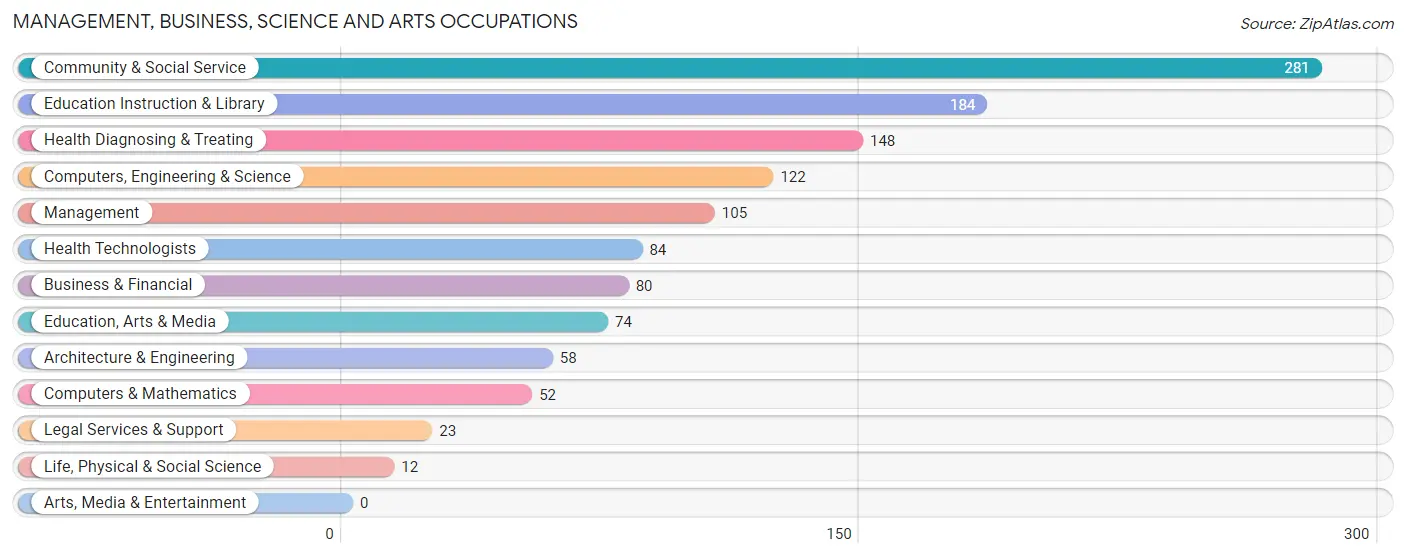
Management, Business, Science and Arts Occupations by Sex
Within the Management, Business, Science and Arts occupations in Liberty County, the most male-oriented occupations are Life, Physical & Social Science (100.0%), Architecture & Engineering (93.1%), and Legal Services & Support (91.3%), while the most female-oriented occupations are Health Technologists (92.9%), Health Diagnosing & Treating (90.5%), and Education Instruction & Library (87.0%).
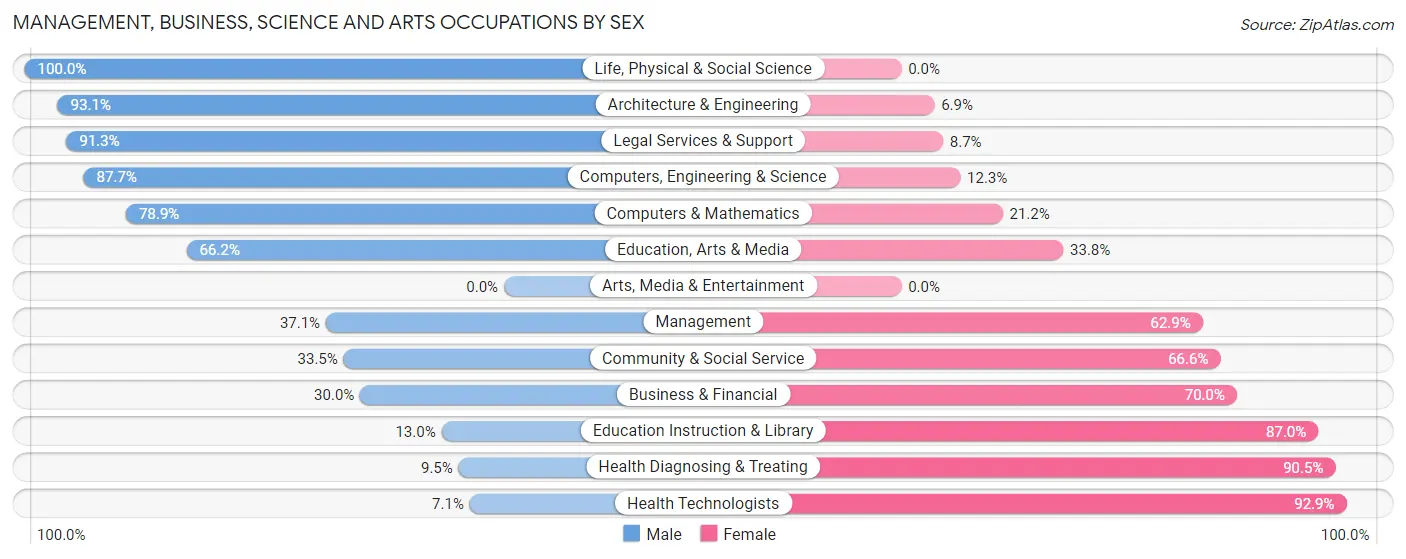
| Occupation | Male | Female |
| Management | 39 (37.1%) | 66 (62.9%) |
| Business & Financial | 24 (30.0%) | 56 (70.0%) |
| Computers, Engineering & Science | 107 (87.7%) | 15 (12.3%) |
| Computers & Mathematics | 41 (78.8%) | 11 (21.1%) |
| Architecture & Engineering | 54 (93.1%) | 4 (6.9%) |
| Life, Physical & Social Science | 12 (100.0%) | 0 (0.0%) |
| Community & Social Service | 94 (33.5%) | 187 (66.5%) |
| Education, Arts & Media | 49 (66.2%) | 25 (33.8%) |
| Legal Services & Support | 21 (91.3%) | 2 (8.7%) |
| Education Instruction & Library | 24 (13.0%) | 160 (87.0%) |
| Arts, Media & Entertainment | 0 (0.0%) | 0 (0.0%) |
| Health Diagnosing & Treating | 14 (9.5%) | 134 (90.5%) |
| Health Technologists | 6 (7.1%) | 78 (92.9%) |
| Total (Category) | 278 (37.8%) | 458 (62.2%) |
| Total (Overall) | 1,236 (48.6%) | 1,309 (51.4%) |
Services Occupations
The most common Services occupations in Liberty County are Security & Protection (177 | 7.0%), Food Preparation & Serving (149 | 5.9%), Cleaning & Maintenance (139 | 5.5%), Law Enforcement (121 | 4.8%), and Personal Care & Service (106 | 4.2%).
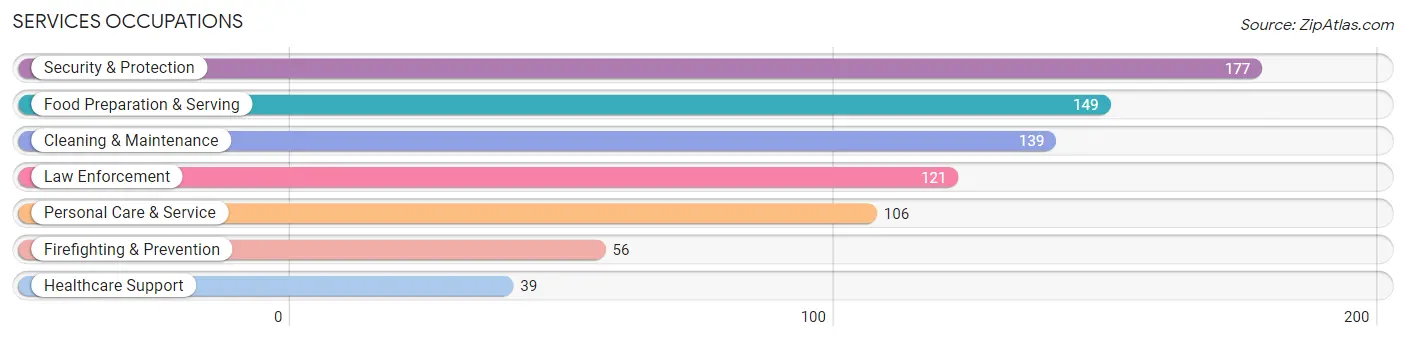
Services Occupations by Sex
Within the Services occupations in Liberty County, the most male-oriented occupations are Cleaning & Maintenance (72.7%), Firefighting & Prevention (60.7%), and Security & Protection (58.2%), while the most female-oriented occupations are Healthcare Support (89.7%), Food Preparation & Serving (79.9%), and Law Enforcement (43.0%).
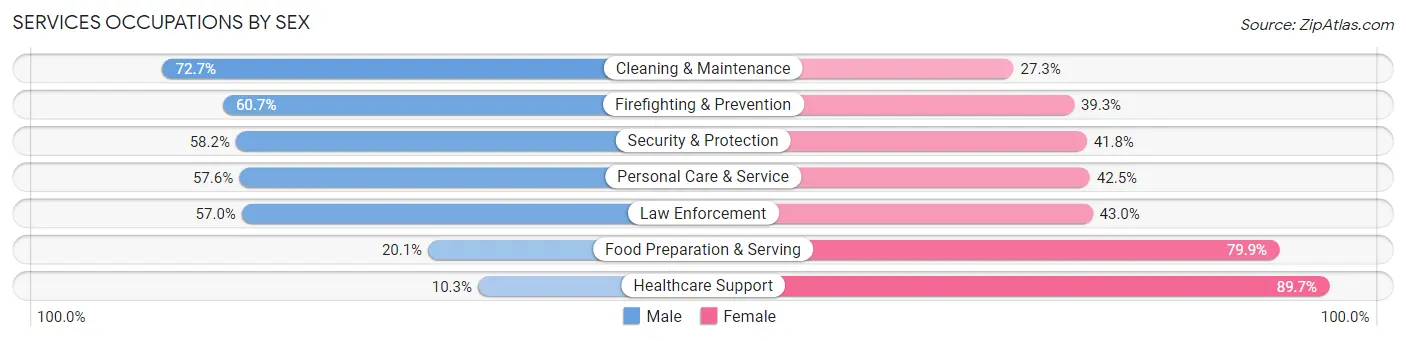
| Occupation | Male | Female |
| Healthcare Support | 4 (10.3%) | 35 (89.7%) |
| Security & Protection | 103 (58.2%) | 74 (41.8%) |
| Firefighting & Prevention | 34 (60.7%) | 22 (39.3%) |
| Law Enforcement | 69 (57.0%) | 52 (43.0%) |
| Food Preparation & Serving | 30 (20.1%) | 119 (79.9%) |
| Cleaning & Maintenance | 101 (72.7%) | 38 (27.3%) |
| Personal Care & Service | 61 (57.6%) | 45 (42.4%) |
| Total (Category) | 299 (49.0%) | 311 (51.0%) |
| Total (Overall) | 1,236 (48.6%) | 1,309 (51.4%) |
Sales and Office Occupations
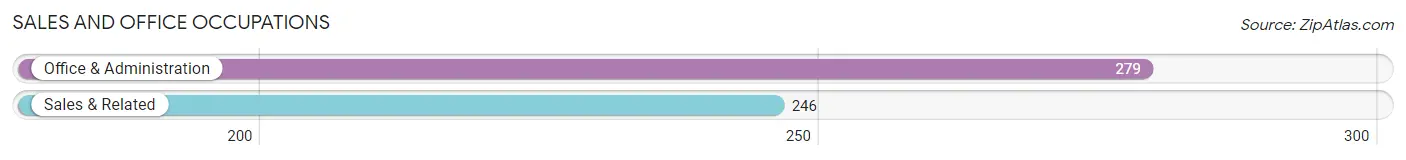
The most common Sales and Office occupations in Liberty County are Office & Administration (279 | 11.0%), and Sales & Related (246 | 9.7%).
Sales and Office Occupations by Sex
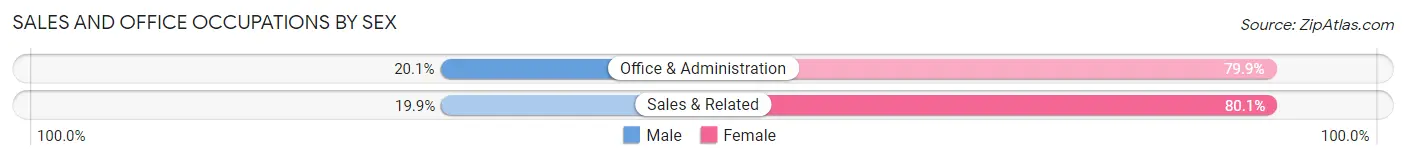
| Occupation | Male | Female |
| Sales & Related | 49 (19.9%) | 197 (80.1%) |
| Office & Administration | 56 (20.1%) | 223 (79.9%) |
| Total (Category) | 105 (20.0%) | 420 (80.0%) |
| Total (Overall) | 1,236 (48.6%) | 1,309 (51.4%) |
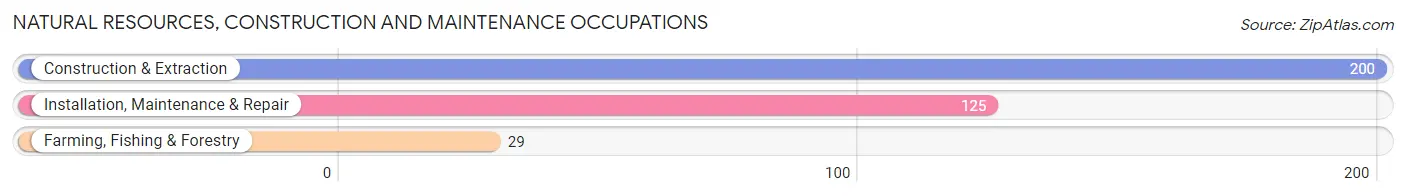
Natural Resources, Construction and Maintenance Occupations
The most common Natural Resources, Construction and Maintenance occupations in Liberty County are Construction & Extraction (200 | 7.9%), Installation, Maintenance & Repair (125 | 4.9%), and Farming, Fishing & Forestry (29 | 1.1%).
Natural Resources, Construction and Maintenance Occupations by Sex
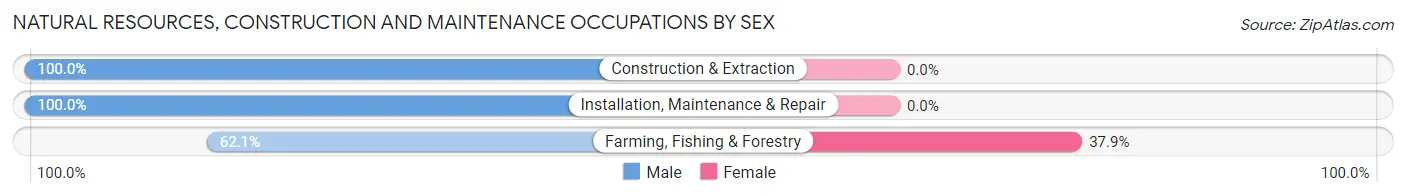
| Occupation | Male | Female |
| Farming, Fishing & Forestry | 18 (62.1%) | 11 (37.9%) |
| Construction & Extraction | 200 (100.0%) | 0 (0.0%) |
| Installation, Maintenance & Repair | 125 (100.0%) | 0 (0.0%) |
| Total (Category) | 343 (96.9%) | 11 (3.1%) |
| Total (Overall) | 1,236 (48.6%) | 1,309 (51.4%) |
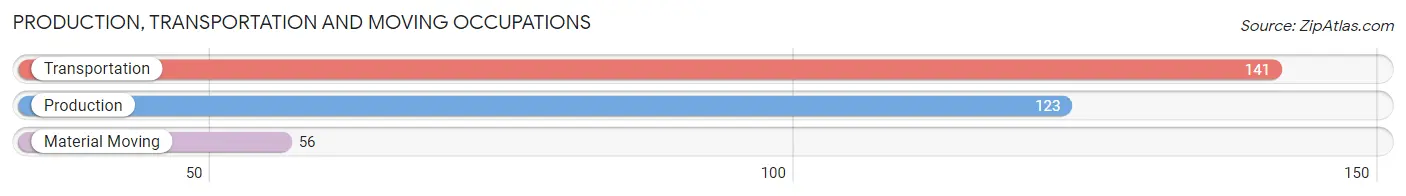
Production, Transportation and Moving Occupations
The most common Production, Transportation and Moving occupations in Liberty County are Transportation (141 | 5.5%), Production (123 | 4.8%), and Material Moving (56 | 2.2%).
Production, Transportation and Moving Occupations by Sex
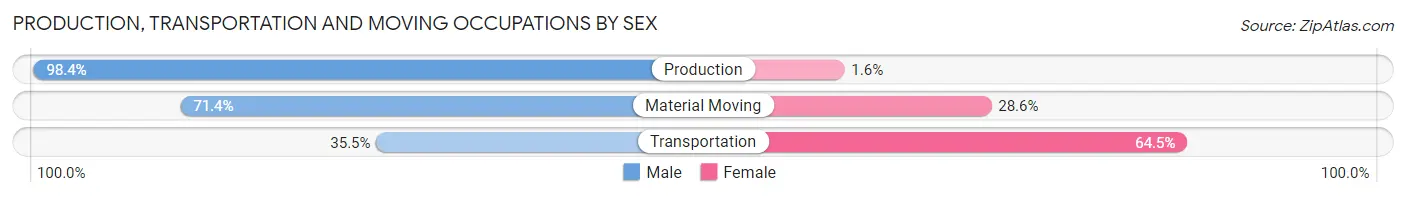
| Occupation | Male | Female |
| Production | 121 (98.4%) | 2 (1.6%) |
| Transportation | 50 (35.5%) | 91 (64.5%) |
| Material Moving | 40 (71.4%) | 16 (28.6%) |
| Total (Category) | 211 (65.9%) | 109 (34.1%) |
| Total (Overall) | 1,236 (48.6%) | 1,309 (51.4%) |
Employment Industries by Sex in Liberty County
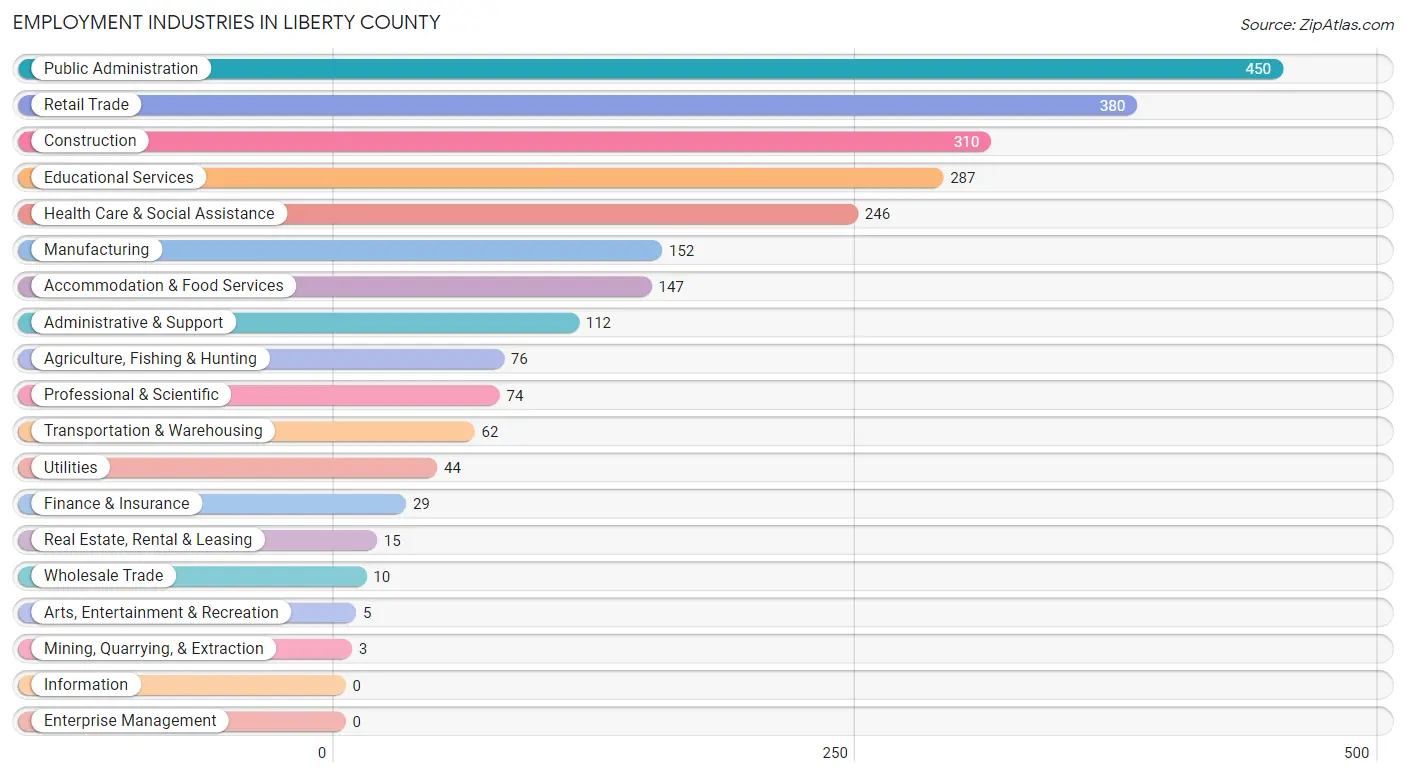
Employment Industries in Liberty County
The major employment industries in Liberty County include Public Administration (450 | 17.7%), Retail Trade (380 | 14.9%), Construction (310 | 12.2%), Educational Services (287 | 11.3%), and Health Care & Social Assistance (246 | 9.7%).
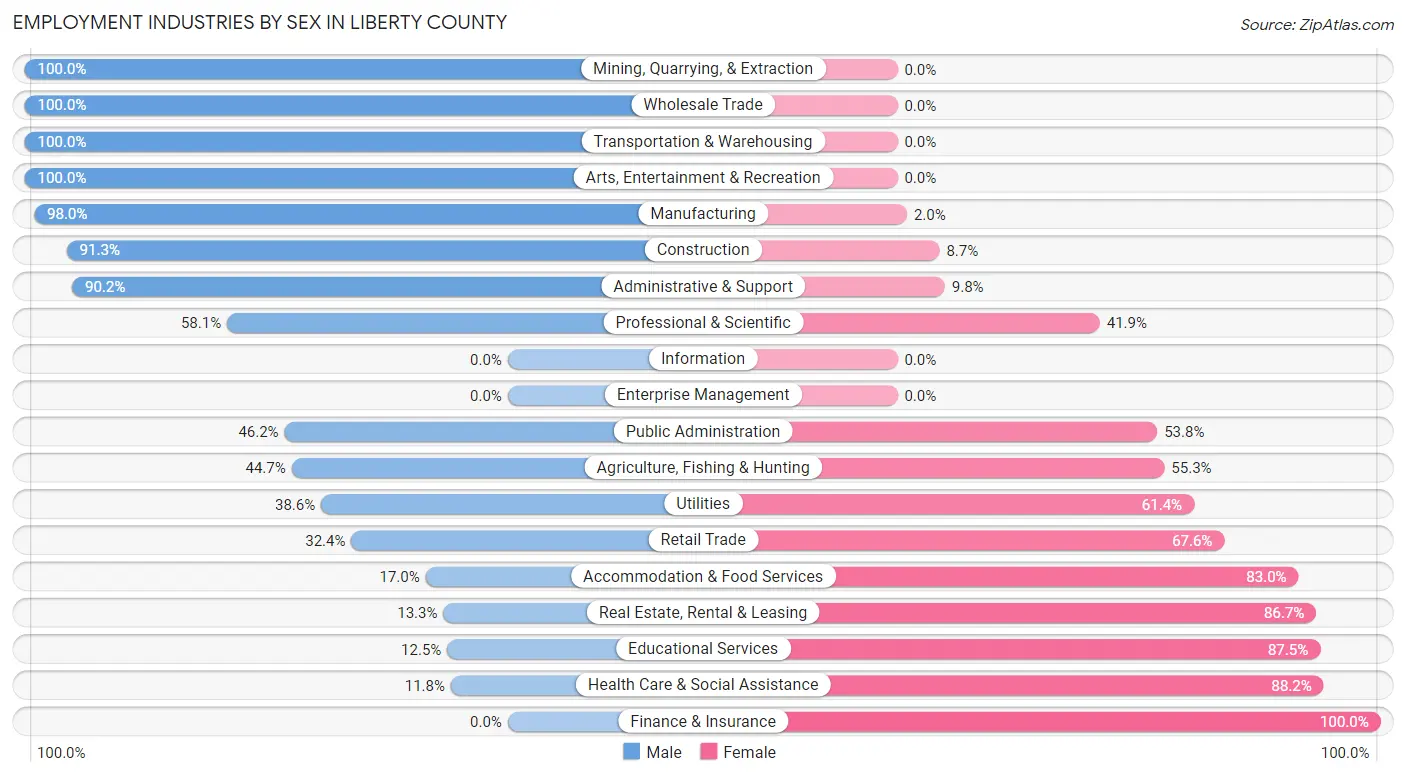
Employment Industries by Sex in Liberty County
The Liberty County industries that see more men than women are Mining, Quarrying, & Extraction (100.0%), Wholesale Trade (100.0%), and Transportation & Warehousing (100.0%), whereas the industries that tend to have a higher number of women are Finance & Insurance (100.0%), Health Care & Social Assistance (88.2%), and Educational Services (87.5%).
| Industry | Male | Female |
| Agriculture, Fishing & Hunting | 34 (44.7%) | 42 (55.3%) |
| Mining, Quarrying, & Extraction | 3 (100.0%) | 0 (0.0%) |
| Construction | 283 (91.3%) | 27 (8.7%) |
| Manufacturing | 149 (98.0%) | 3 (2.0%) |
| Wholesale Trade | 10 (100.0%) | 0 (0.0%) |
| Retail Trade | 123 (32.4%) | 257 (67.6%) |
| Transportation & Warehousing | 62 (100.0%) | 0 (0.0%) |
| Utilities | 17 (38.6%) | 27 (61.4%) |
| Information | 0 (0.0%) | 0 (0.0%) |
| Finance & Insurance | 0 (0.0%) | 29 (100.0%) |
| Real Estate, Rental & Leasing | 2 (13.3%) | 13 (86.7%) |
| Professional & Scientific | 43 (58.1%) | 31 (41.9%) |
| Enterprise Management | 0 (0.0%) | 0 (0.0%) |
| Administrative & Support | 101 (90.2%) | 11 (9.8%) |
| Educational Services | 36 (12.5%) | 251 (87.5%) |
| Health Care & Social Assistance | 29 (11.8%) | 217 (88.2%) |
| Arts, Entertainment & Recreation | 5 (100.0%) | 0 (0.0%) |
| Accommodation & Food Services | 25 (17.0%) | 122 (83.0%) |
| Public Administration | 208 (46.2%) | 242 (53.8%) |
| Total | 1,236 (48.6%) | 1,309 (51.4%) |
Education in Liberty County
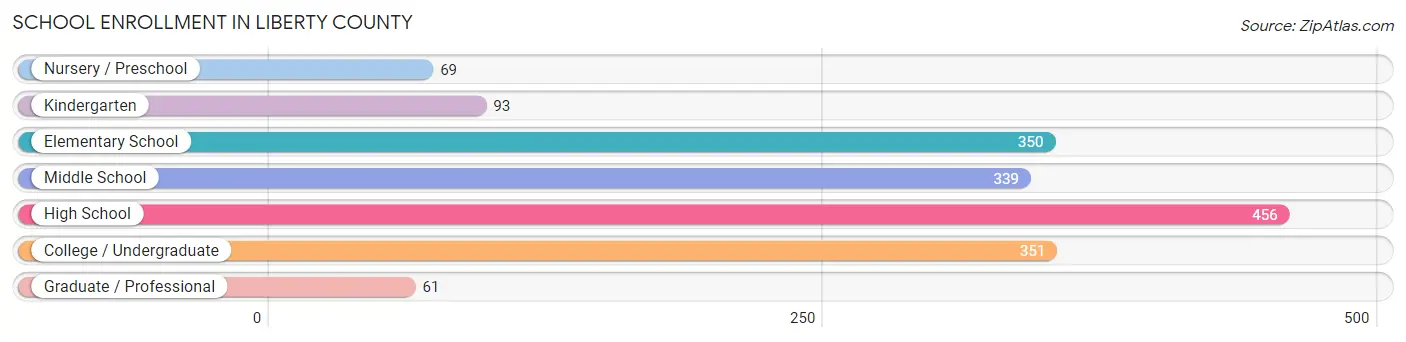
School Enrollment in Liberty County
The most common levels of schooling among the 1,719 students in Liberty County are high school (456 | 26.5%), college / undergraduate (351 | 20.4%), and elementary school (350 | 20.4%).
| School Level | # Students | % Students |
| Nursery / Preschool | 69 | 4.0% |
| Kindergarten | 93 | 5.4% |
| Elementary School | 350 | 20.4% |
| Middle School | 339 | 19.7% |
| High School | 456 | 26.5% |
| College / Undergraduate | 351 | 20.4% |
| Graduate / Professional | 61 | 3.5% |
| Total | 1,719 | 100.0% |
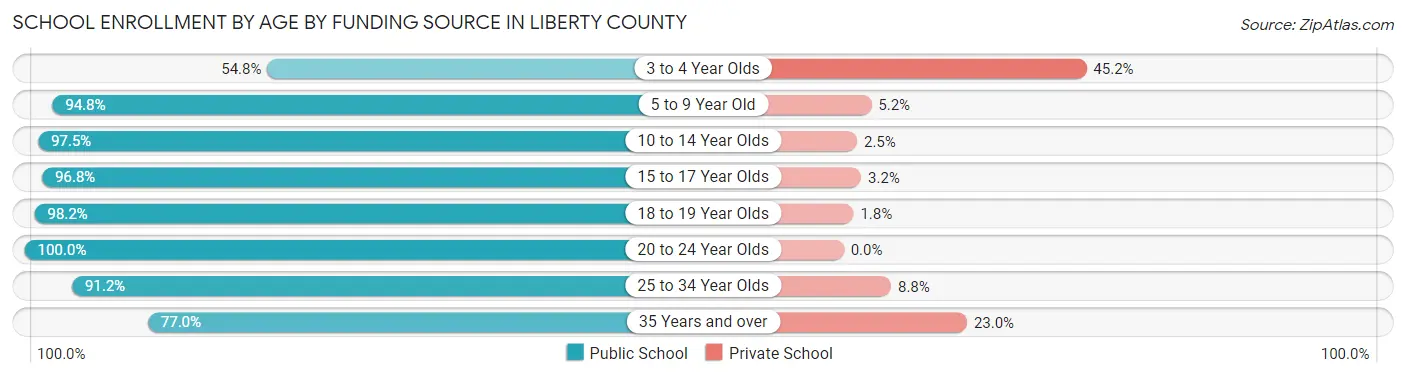
School Enrollment by Age by Funding Source in Liberty County
Out of a total of 1,719 students who are enrolled in schools in Liberty County, 112 (6.5%) attend a private institution, while the remaining 1,607 (93.5%) are enrolled in public schools. The age group of 3 to 4 year olds has the highest likelihood of being enrolled in private schools, with 33 (45.2% in the age bracket) enrolled. Conversely, the age group of 20 to 24 year olds has the lowest likelihood of being enrolled in a private school, with 174 (100.0% in the age bracket) attending a public institution.
| Age Bracket | Public School | Private School |
| 3 to 4 Year Olds | 40 (54.8%) | 33 (45.2%) |
| 5 to 9 Year Old | 349 (94.8%) | 19 (5.2%) |
| 10 to 14 Year Olds | 391 (97.5%) | 10 (2.5%) |
| 15 to 17 Year Olds | 358 (96.8%) | 12 (3.2%) |
| 18 to 19 Year Olds | 161 (98.2%) | 3 (1.8%) |
| 20 to 24 Year Olds | 174 (100.0%) | 0 (0.0%) |
| 25 to 34 Year Olds | 31 (91.2%) | 3 (8.8%) |
| 35 Years and over | 104 (77.0%) | 31 (23.0%) |
| Total | 1,607 (93.5%) | 112 (6.5%) |
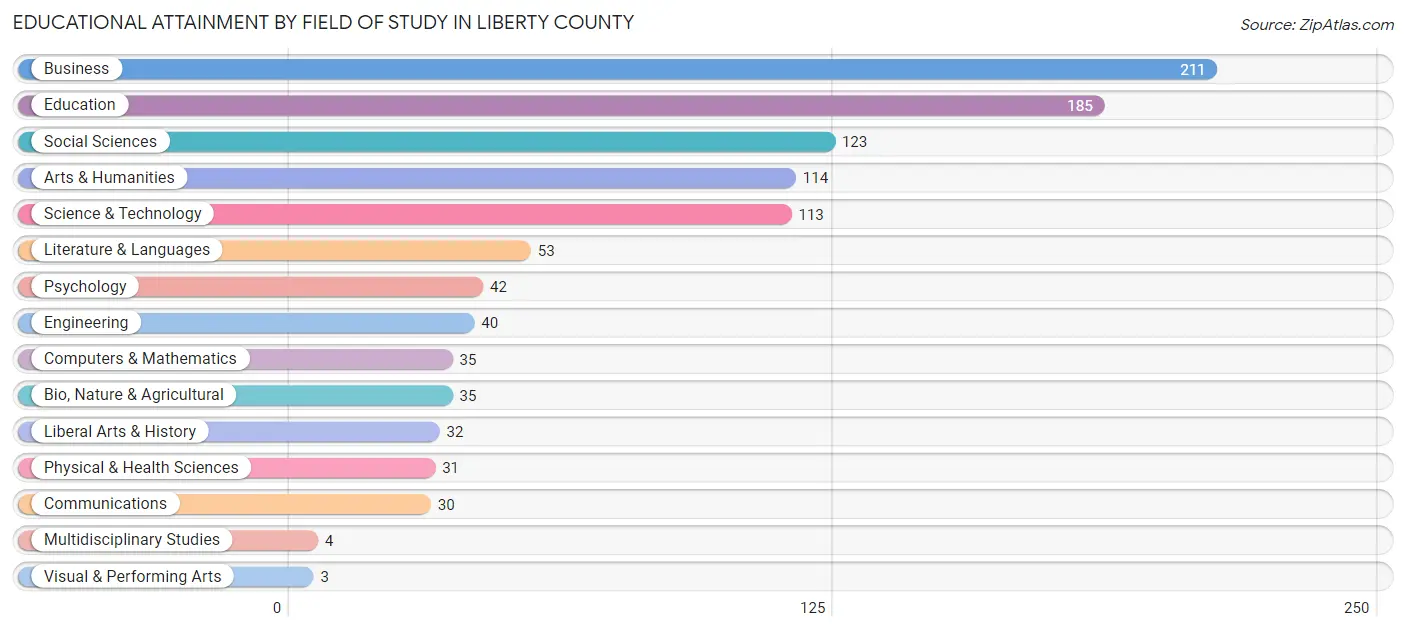
Educational Attainment by Field of Study in Liberty County
Business (211 | 20.1%), education (185 | 17.6%), social sciences (123 | 11.7%), arts & humanities (114 | 10.8%), and science & technology (113 | 10.7%) are the most common fields of study among 1,051 individuals in Liberty County who have obtained a bachelor's degree or higher.
| Field of Study | # Graduates | % Graduates |
| Computers & Mathematics | 35 | 3.3% |
| Bio, Nature & Agricultural | 35 | 3.3% |
| Physical & Health Sciences | 31 | 2.9% |
| Psychology | 42 | 4.0% |
| Social Sciences | 123 | 11.7% |
| Engineering | 40 | 3.8% |
| Multidisciplinary Studies | 4 | 0.4% |
| Science & Technology | 113 | 10.7% |
| Business | 211 | 20.1% |
| Education | 185 | 17.6% |
| Literature & Languages | 53 | 5.0% |
| Liberal Arts & History | 32 | 3.0% |
| Visual & Performing Arts | 3 | 0.3% |
| Communications | 30 | 2.9% |
| Arts & Humanities | 114 | 10.8% |
| Total | 1,051 | 100.0% |
Transportation & Commute in Liberty County
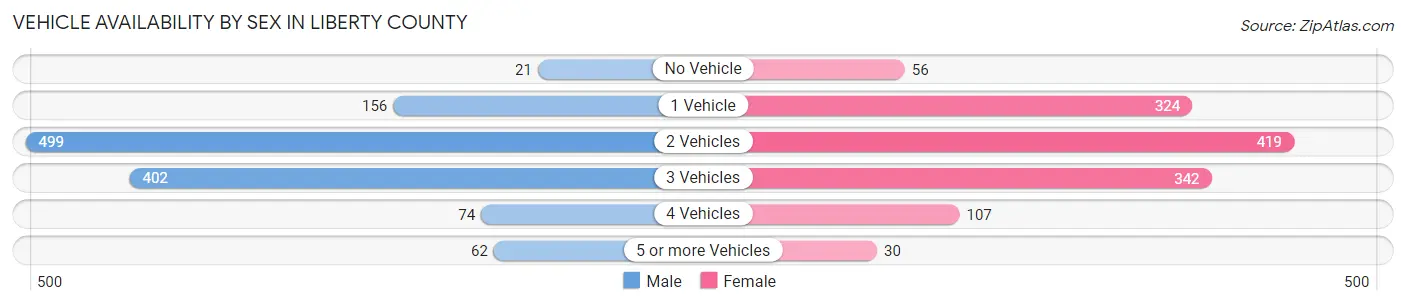
Vehicle Availability by Sex in Liberty County
The most prevalent vehicle ownership categories in Liberty County are males with 2 vehicles (499, accounting for 41.1%) and females with 2 vehicles (419, making up 39.1%).
| Vehicles Available | Male | Female |
| No Vehicle | 21 (1.7%) | 56 (4.4%) |
| 1 Vehicle | 156 (12.9%) | 324 (25.4%) |
| 2 Vehicles | 499 (41.1%) | 419 (32.8%) |
| 3 Vehicles | 402 (33.1%) | 342 (26.8%) |
| 4 Vehicles | 74 (6.1%) | 107 (8.4%) |
| 5 or more Vehicles | 62 (5.1%) | 30 (2.4%) |
| Total | 1,214 (100.0%) | 1,278 (100.0%) |
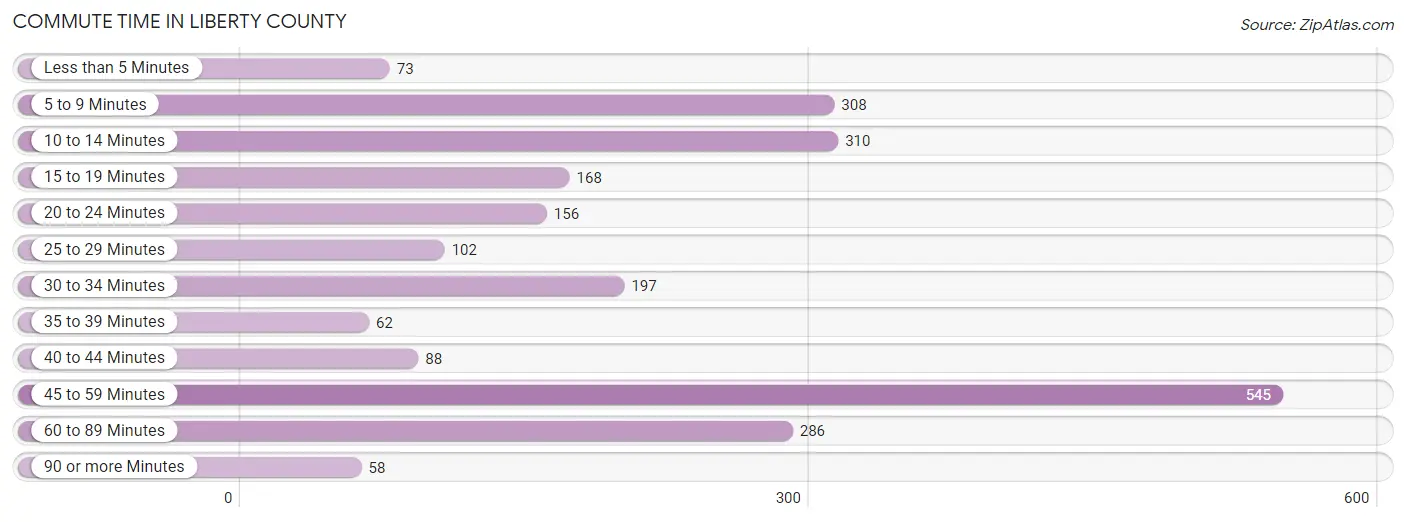
Commute Time in Liberty County
The most frequently occuring commute durations in Liberty County are 45 to 59 minutes (545 commuters, 23.2%), 10 to 14 minutes (310 commuters, 13.2%), and 5 to 9 minutes (308 commuters, 13.1%).
| Commute Time | # Commuters | % Commuters |
| Less than 5 Minutes | 73 | 3.1% |
| 5 to 9 Minutes | 308 | 13.1% |
| 10 to 14 Minutes | 310 | 13.2% |
| 15 to 19 Minutes | 168 | 7.1% |
| 20 to 24 Minutes | 156 | 6.6% |
| 25 to 29 Minutes | 102 | 4.3% |
| 30 to 34 Minutes | 197 | 8.4% |
| 35 to 39 Minutes | 62 | 2.6% |
| 40 to 44 Minutes | 88 | 3.7% |
| 45 to 59 Minutes | 545 | 23.2% |
| 60 to 89 Minutes | 286 | 12.1% |
| 90 or more Minutes | 58 | 2.5% |
Commute Time by Sex in Liberty County
The most common commute times in Liberty County are 45 to 59 minutes (262 commuters, 22.9%) for males and 45 to 59 minutes (283 commuters, 23.4%) for females.
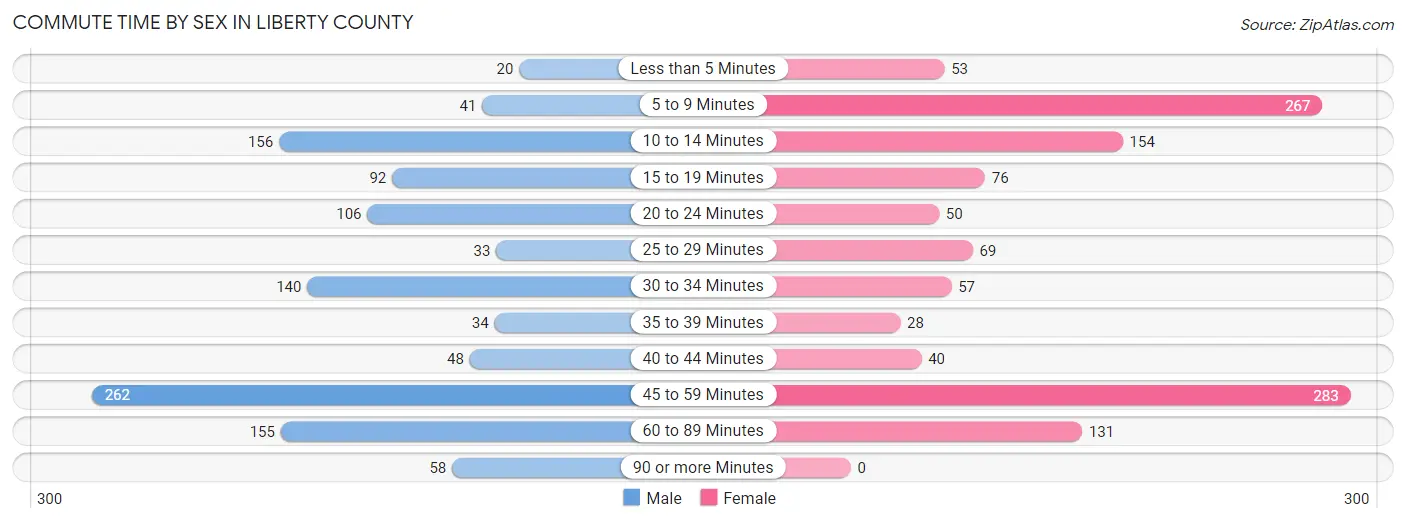
| Commute Time | Male | Female |
| Less than 5 Minutes | 20 (1.8%) | 53 (4.4%) |
| 5 to 9 Minutes | 41 (3.6%) | 267 (22.1%) |
| 10 to 14 Minutes | 156 (13.6%) | 154 (12.8%) |
| 15 to 19 Minutes | 92 (8.0%) | 76 (6.3%) |
| 20 to 24 Minutes | 106 (9.3%) | 50 (4.1%) |
| 25 to 29 Minutes | 33 (2.9%) | 69 (5.7%) |
| 30 to 34 Minutes | 140 (12.2%) | 57 (4.7%) |
| 35 to 39 Minutes | 34 (3.0%) | 28 (2.3%) |
| 40 to 44 Minutes | 48 (4.2%) | 40 (3.3%) |
| 45 to 59 Minutes | 262 (22.9%) | 283 (23.4%) |
| 60 to 89 Minutes | 155 (13.5%) | 131 (10.8%) |
| 90 or more Minutes | 58 (5.1%) | 0 (0.0%) |
Time of Departure to Work by Sex in Liberty County
The most frequent times of departure to work in Liberty County are 7:00 AM to 7:29 AM (266, 23.2%) for males and 7:00 AM to 7:29 AM (182, 15.1%) for females.
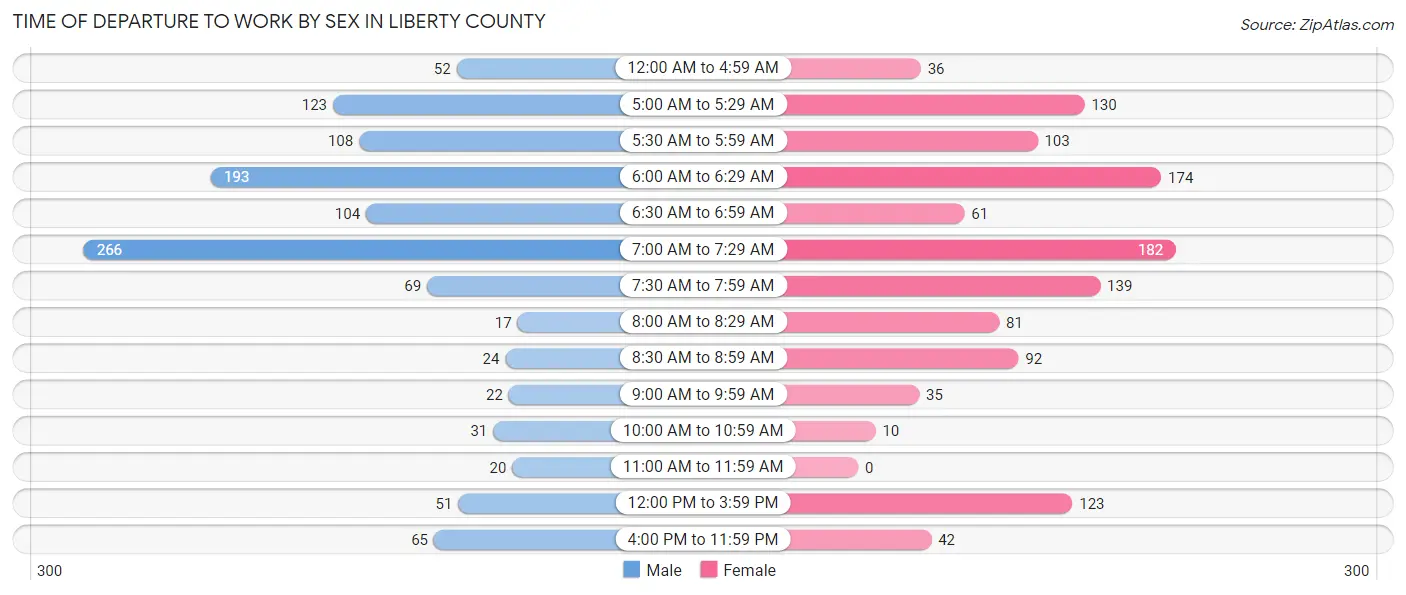
| Time of Departure | Male | Female |
| 12:00 AM to 4:59 AM | 52 (4.5%) | 36 (3.0%) |
| 5:00 AM to 5:29 AM | 123 (10.7%) | 130 (10.8%) |
| 5:30 AM to 5:59 AM | 108 (9.4%) | 103 (8.5%) |
| 6:00 AM to 6:29 AM | 193 (16.9%) | 174 (14.4%) |
| 6:30 AM to 6:59 AM | 104 (9.1%) | 61 (5.1%) |
| 7:00 AM to 7:29 AM | 266 (23.2%) | 182 (15.1%) |
| 7:30 AM to 7:59 AM | 69 (6.0%) | 139 (11.5%) |
| 8:00 AM to 8:29 AM | 17 (1.5%) | 81 (6.7%) |
| 8:30 AM to 8:59 AM | 24 (2.1%) | 92 (7.6%) |
| 9:00 AM to 9:59 AM | 22 (1.9%) | 35 (2.9%) |
| 10:00 AM to 10:59 AM | 31 (2.7%) | 10 (0.8%) |
| 11:00 AM to 11:59 AM | 20 (1.8%) | 0 (0.0%) |
| 12:00 PM to 3:59 PM | 51 (4.4%) | 123 (10.2%) |
| 4:00 PM to 11:59 PM | 65 (5.7%) | 42 (3.5%) |
| Total | 1,145 (100.0%) | 1,208 (100.0%) |
Housing Occupancy in Liberty County
Occupancy by Ownership in Liberty County
Of the total 2,447 dwellings in Liberty County, owner-occupied units account for 1,973 (80.6%), while renter-occupied units make up 474 (19.4%).
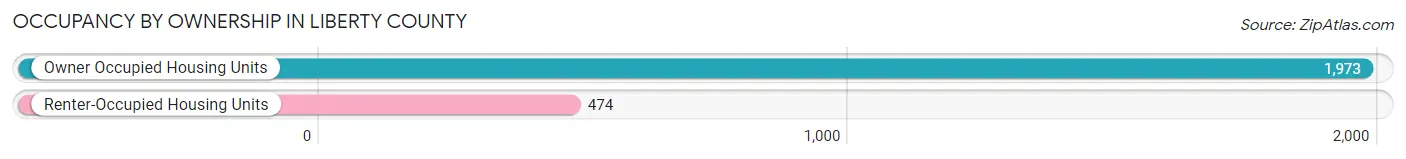
| Occupancy | # Housing Units | % Housing Units |
| Owner Occupied Housing Units | 1,973 | 80.6% |
| Renter-Occupied Housing Units | 474 | 19.4% |
| Total Occupied Housing Units | 2,447 | 100.0% |
Occupancy by Household Size in Liberty County
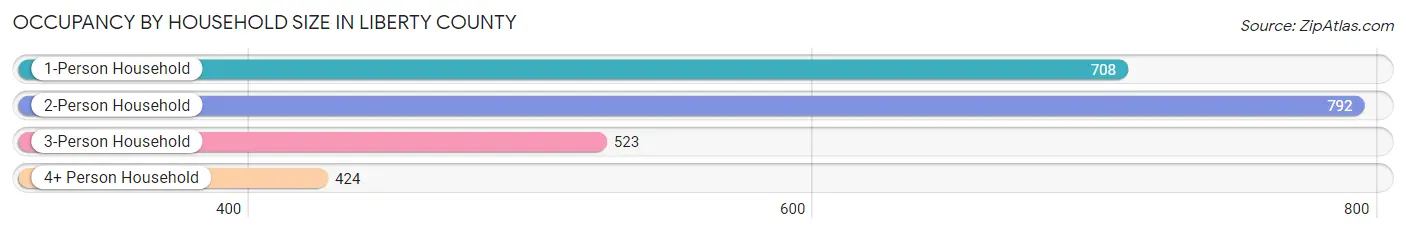
| Household Size | # Housing Units | % Housing Units |
| 1-Person Household | 708 | 28.9% |
| 2-Person Household | 792 | 32.4% |
| 3-Person Household | 523 | 21.4% |
| 4+ Person Household | 424 | 17.3% |
| Total Housing Units | 2,447 | 100.0% |
Occupancy by Ownership by Household Size in Liberty County
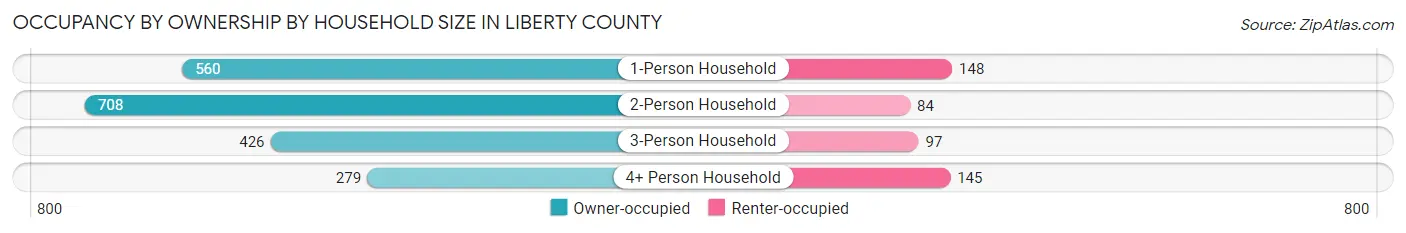
| Household Size | Owner-occupied | Renter-occupied |
| 1-Person Household | 560 (79.1%) | 148 (20.9%) |
| 2-Person Household | 708 (89.4%) | 84 (10.6%) |
| 3-Person Household | 426 (81.5%) | 97 (18.5%) |
| 4+ Person Household | 279 (65.8%) | 145 (34.2%) |
| Total Housing Units | 1,973 (80.6%) | 474 (19.4%) |
Occupancy by Educational Attainment in Liberty County
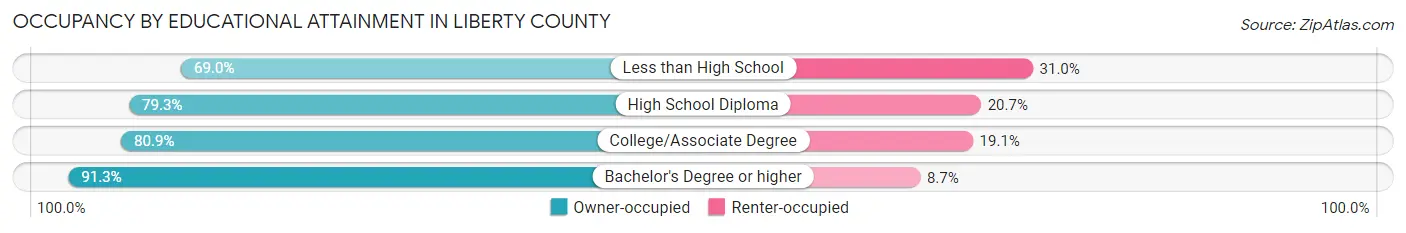
| Household Size | Owner-occupied | Renter-occupied |
| Less than High School | 258 (69.0%) | 116 (31.0%) |
| High School Diploma | 715 (79.3%) | 187 (20.7%) |
| College/Associate Degree | 537 (80.9%) | 127 (19.1%) |
| Bachelor's Degree or higher | 463 (91.3%) | 44 (8.7%) |
Occupancy by Age of Householder in Liberty County
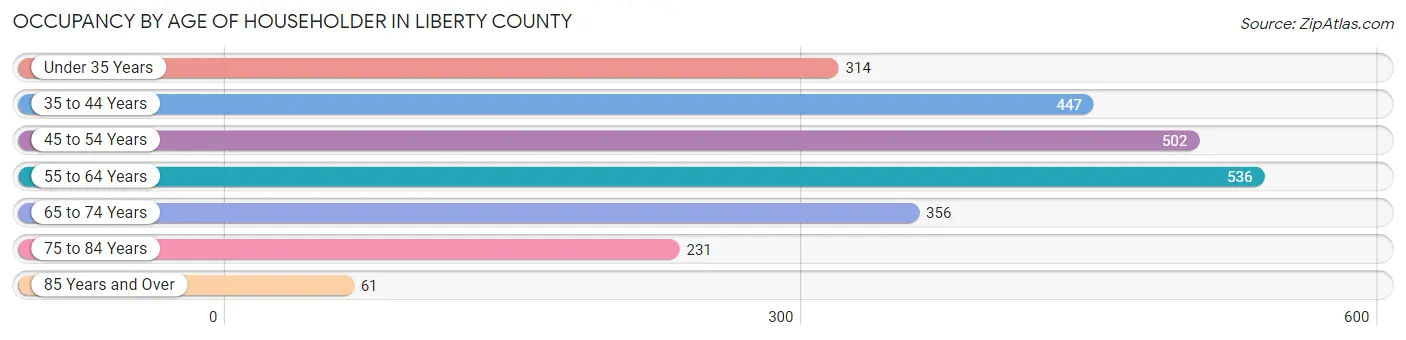
| Age Bracket | # Households | % Households |
| Under 35 Years | 314 | 12.8% |
| 35 to 44 Years | 447 | 18.3% |
| 45 to 54 Years | 502 | 20.5% |
| 55 to 64 Years | 536 | 21.9% |
| 65 to 74 Years | 356 | 14.5% |
| 75 to 84 Years | 231 | 9.4% |
| 85 Years and Over | 61 | 2.5% |
| Total | 2,447 | 100.0% |
Housing Finances in Liberty County
Median Income by Occupancy in Liberty County
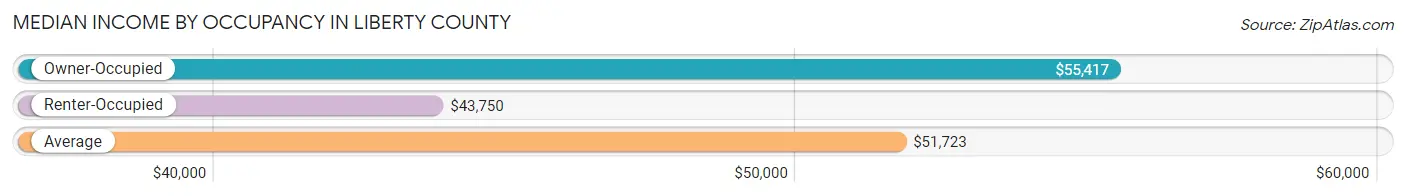
| Occupancy Type | # Households | Median Income |
| Owner-Occupied | 1,973 (80.6%) | $55,417 |
| Renter-Occupied | 474 (19.4%) | $43,750 |
| Average | 2,447 (100.0%) | $51,723 |
Occupancy by Householder Income Bracket in Liberty County
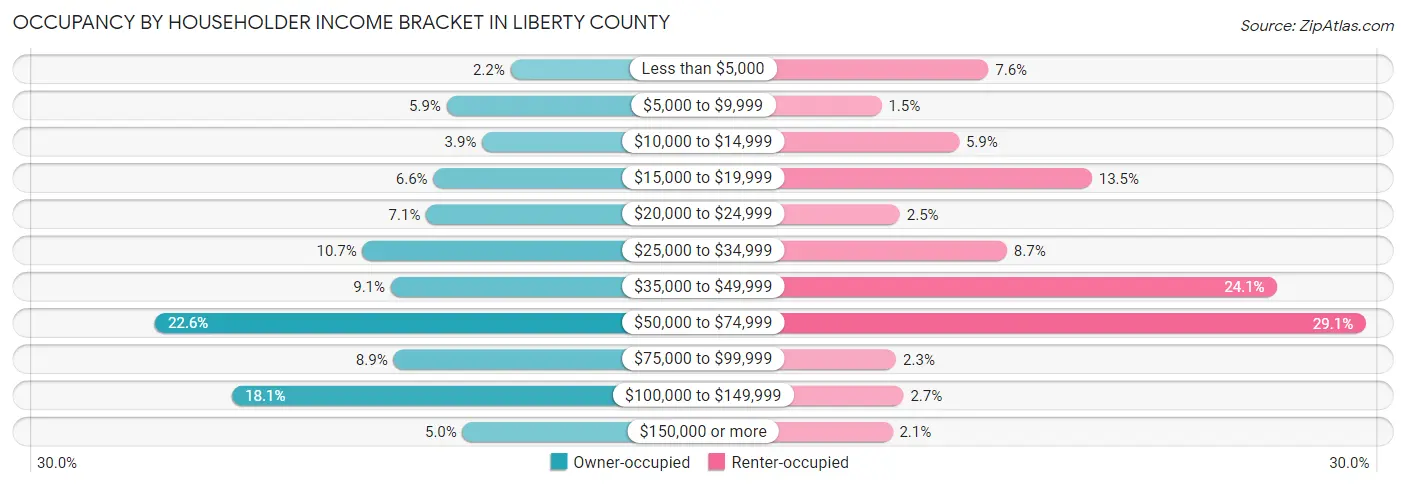
| Income Bracket | Owner-occupied | Renter-occupied |
| Less than $5,000 | 44 (2.2%) | 36 (7.6%) |
| $5,000 to $9,999 | 116 (5.9%) | 7 (1.5%) |
| $10,000 to $14,999 | 76 (3.8%) | 28 (5.9%) |
| $15,000 to $19,999 | 131 (6.6%) | 64 (13.5%) |
| $20,000 to $24,999 | 139 (7.0%) | 12 (2.5%) |
| $25,000 to $34,999 | 211 (10.7%) | 41 (8.6%) |
| $35,000 to $49,999 | 179 (9.1%) | 114 (24.0%) |
| $50,000 to $74,999 | 445 (22.6%) | 138 (29.1%) |
| $75,000 to $99,999 | 176 (8.9%) | 11 (2.3%) |
| $100,000 to $149,999 | 358 (18.1%) | 13 (2.7%) |
| $150,000 or more | 98 (5.0%) | 10 (2.1%) |
| Total | 1,973 (100.0%) | 474 (100.0%) |
Monthly Housing Cost Tiers in Liberty County
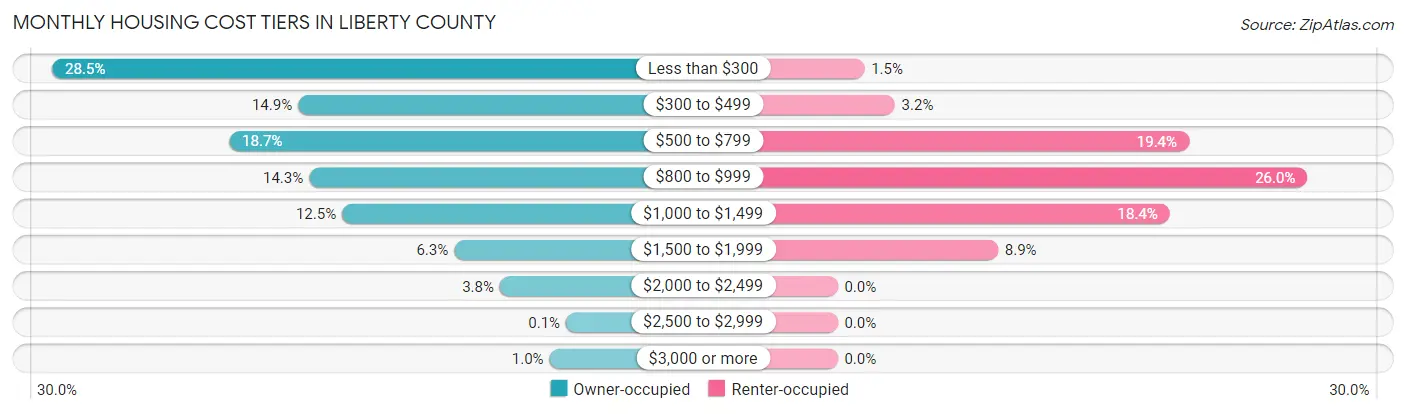
| Monthly Cost | Owner-occupied | Renter-occupied |
| Less than $300 | 562 (28.5%) | 7 (1.5%) |
| $300 to $499 | 294 (14.9%) | 15 (3.2%) |
| $500 to $799 | 369 (18.7%) | 92 (19.4%) |
| $800 to $999 | 282 (14.3%) | 123 (26.0%) |
| $1,000 to $1,499 | 246 (12.5%) | 87 (18.3%) |
| $1,500 to $1,999 | 124 (6.3%) | 42 (8.9%) |
| $2,000 to $2,499 | 74 (3.7%) | 0 (0.0%) |
| $2,500 to $2,999 | 2 (0.1%) | 0 (0.0%) |
| $3,000 or more | 20 (1.0%) | 0 (0.0%) |
| Total | 1,973 (100.0%) | 474 (100.0%) |
Physical Housing Characteristics in Liberty County
Housing Structures in Liberty County
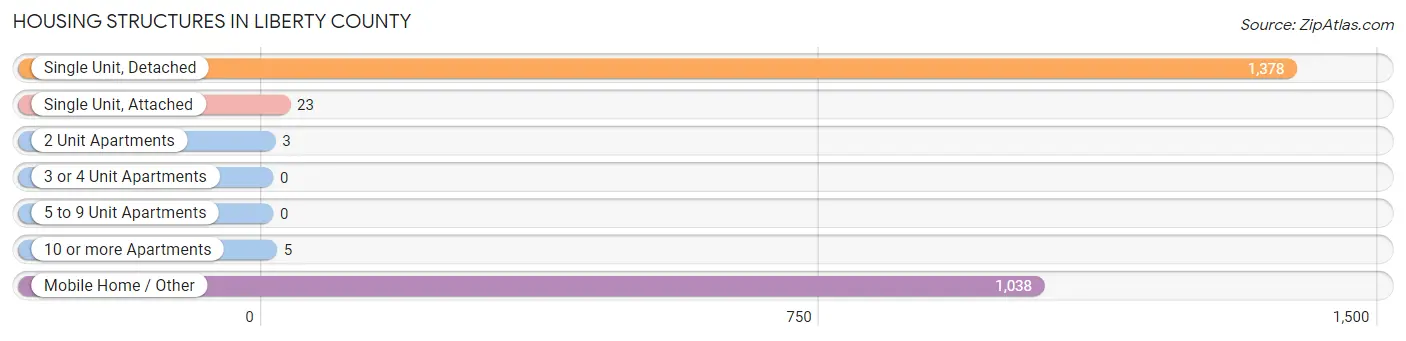
| Structure Type | # Housing Units | % Housing Units |
| Single Unit, Detached | 1,378 | 56.3% |
| Single Unit, Attached | 23 | 0.9% |
| 2 Unit Apartments | 3 | 0.1% |
| 3 or 4 Unit Apartments | 0 | 0.0% |
| 5 to 9 Unit Apartments | 0 | 0.0% |
| 10 or more Apartments | 5 | 0.2% |
| Mobile Home / Other | 1,038 | 42.4% |
| Total | 2,447 | 100.0% |
Housing Structures by Occupancy in Liberty County
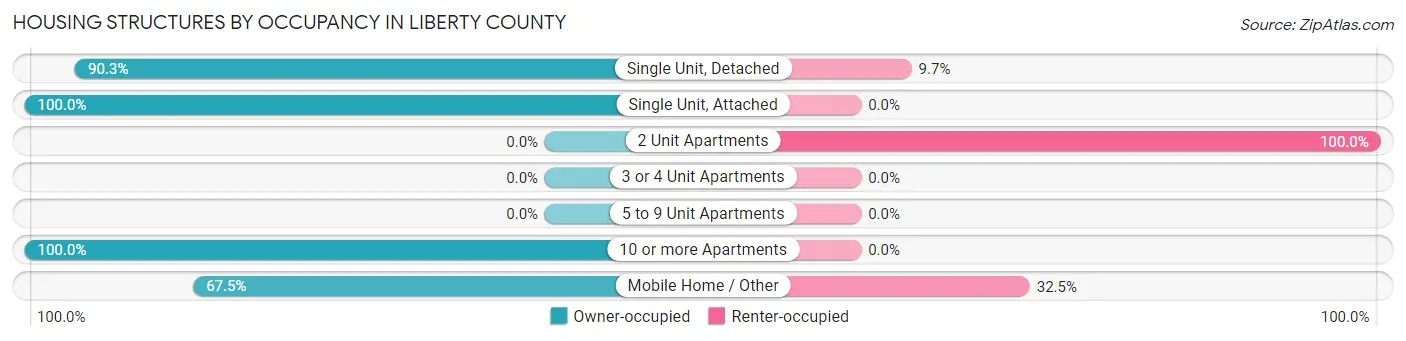
| Structure Type | Owner-occupied | Renter-occupied |
| Single Unit, Detached | 1,244 (90.3%) | 134 (9.7%) |
| Single Unit, Attached | 23 (100.0%) | 0 (0.0%) |
| 2 Unit Apartments | 0 (0.0%) | 3 (100.0%) |
| 3 or 4 Unit Apartments | 0 (0.0%) | 0 (0.0%) |
| 5 to 9 Unit Apartments | 0 (0.0%) | 0 (0.0%) |
| 10 or more Apartments | 5 (100.0%) | 0 (0.0%) |
| Mobile Home / Other | 701 (67.5%) | 337 (32.5%) |
| Total | 1,973 (80.6%) | 474 (19.4%) |
Housing Structures by Number of Rooms in Liberty County
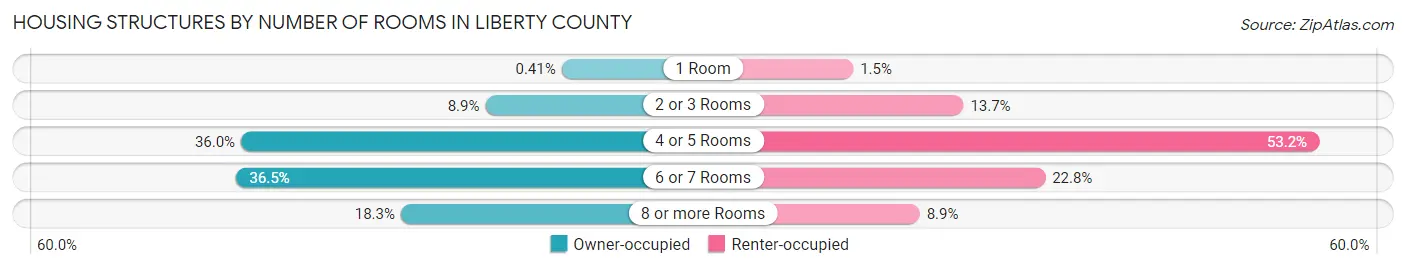
| Number of Rooms | Owner-occupied | Renter-occupied |
| 1 Room | 8 (0.4%) | 7 (1.5%) |
| 2 or 3 Rooms | 175 (8.9%) | 65 (13.7%) |
| 4 or 5 Rooms | 710 (36.0%) | 252 (53.2%) |
| 6 or 7 Rooms | 720 (36.5%) | 108 (22.8%) |
| 8 or more Rooms | 360 (18.2%) | 42 (8.9%) |
| Total | 1,973 (100.0%) | 474 (100.0%) |
Housing Structure by Heating Type in Liberty County
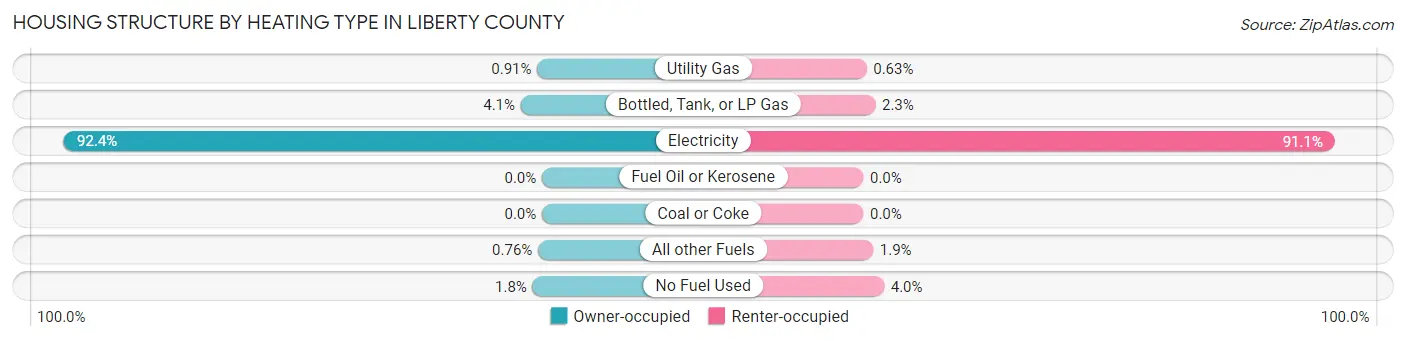
| Heating Type | Owner-occupied | Renter-occupied |
| Utility Gas | 18 (0.9%) | 3 (0.6%) |
| Bottled, Tank, or LP Gas | 81 (4.1%) | 11 (2.3%) |
| Electricity | 1,823 (92.4%) | 432 (91.1%) |
| Fuel Oil or Kerosene | 0 (0.0%) | 0 (0.0%) |
| Coal or Coke | 0 (0.0%) | 0 (0.0%) |
| All other Fuels | 15 (0.8%) | 9 (1.9%) |
| No Fuel Used | 36 (1.8%) | 19 (4.0%) |
| Total | 1,973 (100.0%) | 474 (100.0%) |
Household Vehicle Usage in Liberty County
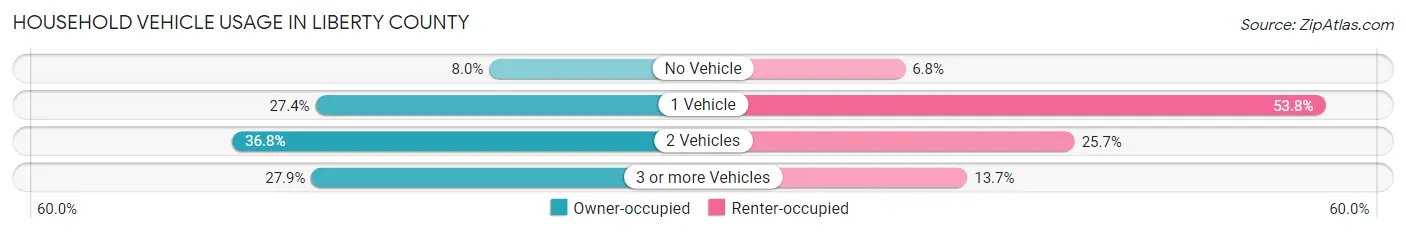
| Vehicles per Household | Owner-occupied | Renter-occupied |
| No Vehicle | 157 (8.0%) | 32 (6.8%) |
| 1 Vehicle | 541 (27.4%) | 255 (53.8%) |
| 2 Vehicles | 725 (36.7%) | 122 (25.7%) |
| 3 or more Vehicles | 550 (27.9%) | 65 (13.7%) |
| Total | 1,973 (100.0%) | 474 (100.0%) |
Real Estate & Mortgages in Liberty County
Real Estate and Mortgage Overview in Liberty County
| Characteristic | Without Mortgage | With Mortgage |
| Housing Units | 1,150 | 823 |
| Median Property Value | $96,400 | $146,700 |
| Median Household Income | $40,900 | $43 |
| Monthly Housing Costs | $310 | $20 |
| Real Estate Taxes | $698 | $129 |
Property Value by Mortgage Status in Liberty County
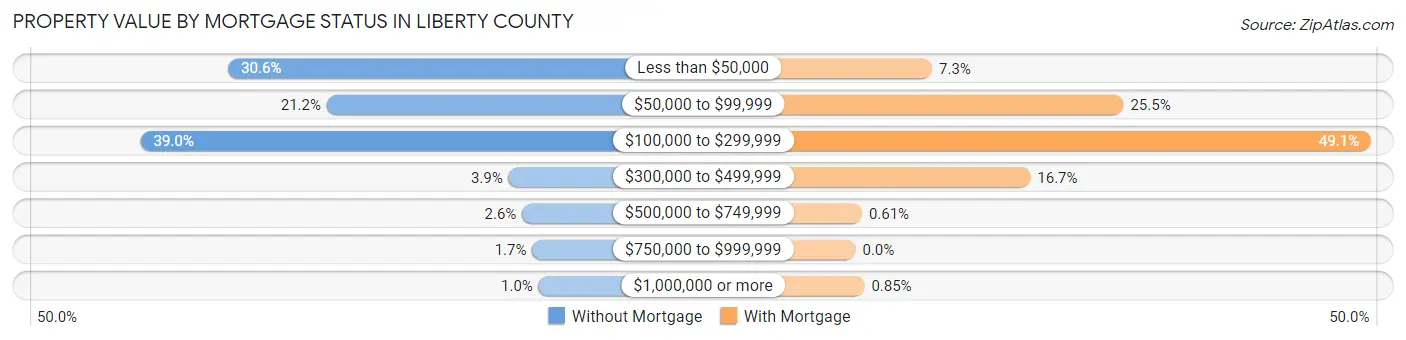
| Property Value | Without Mortgage | With Mortgage |
| Less than $50,000 | 352 (30.6%) | 60 (7.3%) |
| $50,000 to $99,999 | 244 (21.2%) | 210 (25.5%) |
| $100,000 to $299,999 | 448 (39.0%) | 404 (49.1%) |
| $300,000 to $499,999 | 45 (3.9%) | 137 (16.7%) |
| $500,000 to $749,999 | 30 (2.6%) | 5 (0.6%) |
| $750,000 to $999,999 | 19 (1.7%) | 0 (0.0%) |
| $1,000,000 or more | 12 (1.0%) | 7 (0.9%) |
| Total | 1,150 (100.0%) | 823 (100.0%) |
Household Income by Mortgage Status in Liberty County
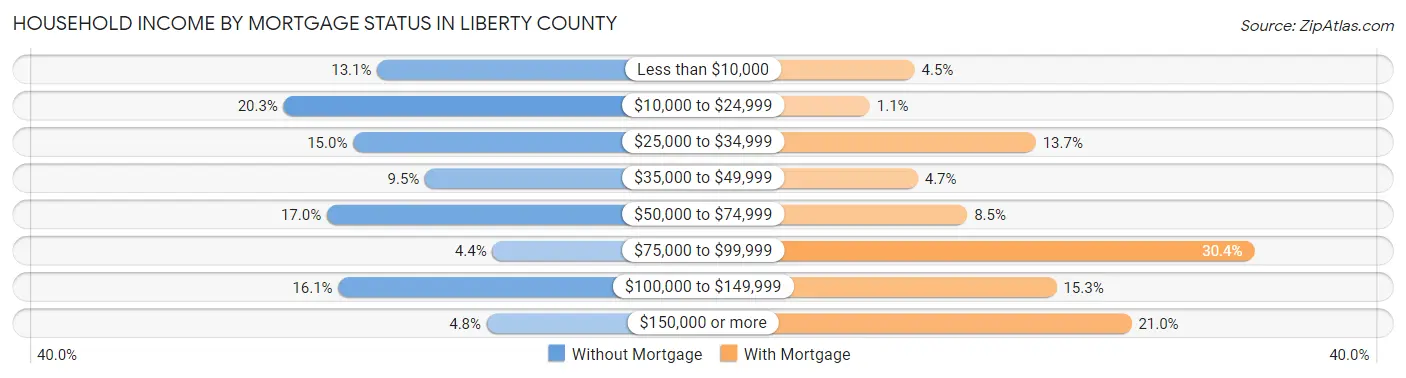
| Household Income | Without Mortgage | With Mortgage |
| Less than $10,000 | 151 (13.1%) | 37 (4.5%) |
| $10,000 to $24,999 | 233 (20.3%) | 9 (1.1%) |
| $25,000 to $34,999 | 172 (15.0%) | 113 (13.7%) |
| $35,000 to $49,999 | 109 (9.5%) | 39 (4.7%) |
| $50,000 to $74,999 | 195 (17.0%) | 70 (8.5%) |
| $75,000 to $99,999 | 50 (4.3%) | 250 (30.4%) |
| $100,000 to $149,999 | 185 (16.1%) | 126 (15.3%) |
| $150,000 or more | 55 (4.8%) | 173 (21.0%) |
| Total | 1,150 (100.0%) | 823 (100.0%) |
Property Value to Household Income Ratio in Liberty County
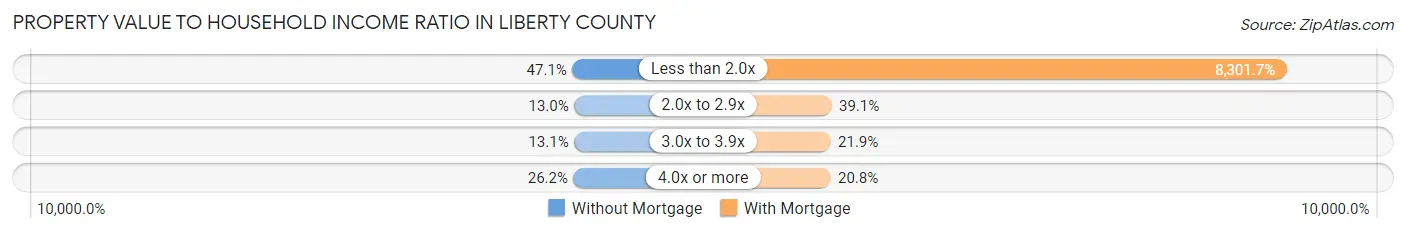
| Value-to-Income Ratio | Without Mortgage | With Mortgage |
| Less than 2.0x | 542 (47.1%) | 68,323 (8,301.7%) |
| 2.0x to 2.9x | 149 (13.0%) | 322 (39.1%) |
| 3.0x to 3.9x | 151 (13.1%) | 180 (21.9%) |
| 4.0x or more | 301 (26.2%) | 171 (20.8%) |
| Total | 1,150 (100.0%) | 823 (100.0%) |
Real Estate Taxes by Mortgage Status in Liberty County
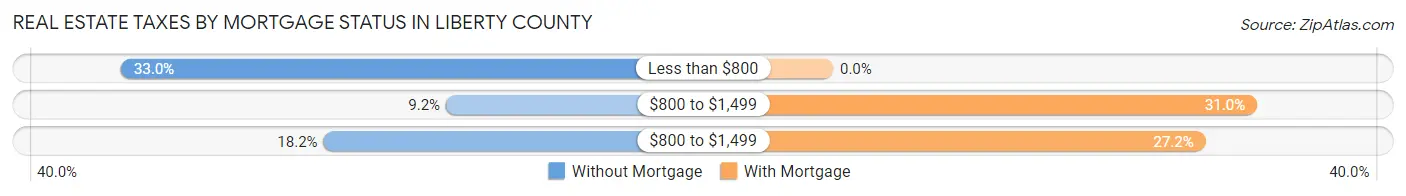
| Property Taxes | Without Mortgage | With Mortgage |
| Less than $800 | 379 (33.0%) | 0 (0.0%) |
| $800 to $1,499 | 106 (9.2%) | 255 (31.0%) |
| $800 to $1,499 | 209 (18.2%) | 224 (27.2%) |
| Total | 1,150 (100.0%) | 823 (100.0%) |
Health & Disability in Liberty County
Health Insurance Coverage by Age in Liberty County
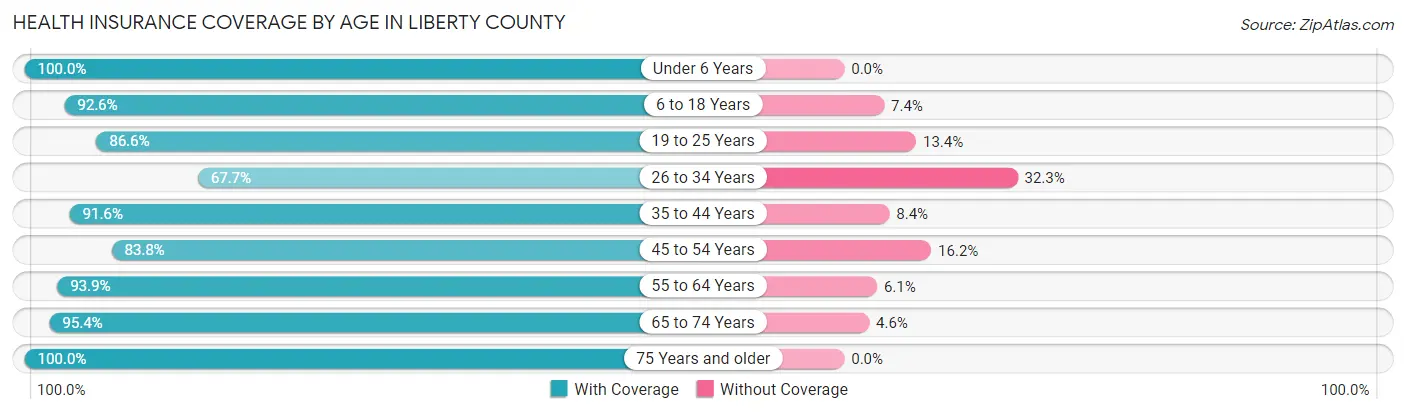
| Age Bracket | With Coverage | Without Coverage |
| Under 6 Years | 290 (100.0%) | 0 (0.0%) |
| 6 to 18 Years | 1,223 (92.6%) | 98 (7.4%) |
| 19 to 25 Years | 369 (86.6%) | 57 (13.4%) |
| 26 to 34 Years | 501 (67.7%) | 239 (32.3%) |
| 35 to 44 Years | 731 (91.6%) | 67 (8.4%) |
| 45 to 54 Years | 750 (83.8%) | 145 (16.2%) |
| 55 to 64 Years | 817 (93.9%) | 53 (6.1%) |
| 65 to 74 Years | 474 (95.4%) | 23 (4.6%) |
| 75 Years and older | 477 (100.0%) | 0 (0.0%) |
| Total | 5,632 (89.2%) | 682 (10.8%) |
Health Insurance Coverage by Citizenship Status in Liberty County
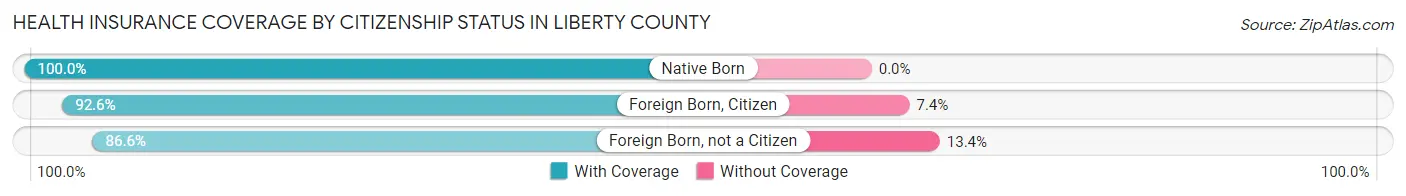
| Citizenship Status | With Coverage | Without Coverage |
| Native Born | 290 (100.0%) | 0 (0.0%) |
| Foreign Born, Citizen | 1,223 (92.6%) | 98 (7.4%) |
| Foreign Born, not a Citizen | 369 (86.6%) | 57 (13.4%) |
Health Insurance Coverage by Household Income in Liberty County
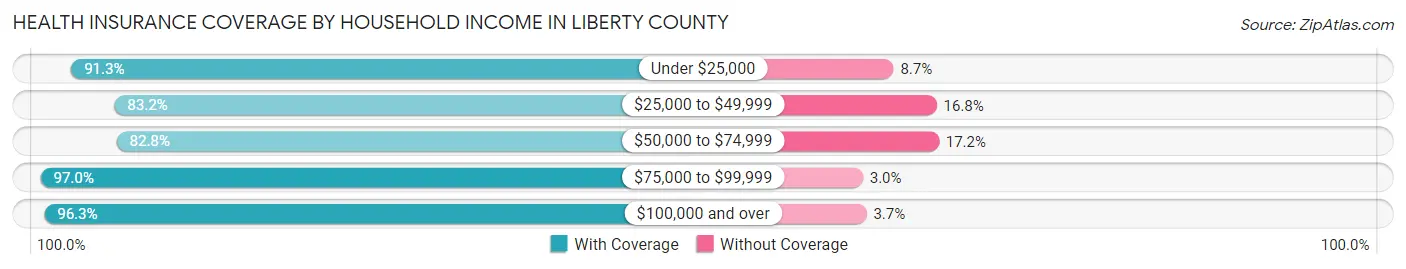
| Household Income | With Coverage | Without Coverage |
| Under $25,000 | 1,232 (91.3%) | 118 (8.7%) |
| $25,000 to $49,999 | 1,132 (83.2%) | 229 (16.8%) |
| $50,000 to $74,999 | 1,272 (82.8%) | 265 (17.2%) |
| $75,000 to $99,999 | 584 (97.0%) | 18 (3.0%) |
| $100,000 and over | 1,359 (96.3%) | 52 (3.7%) |
Public vs Private Health Insurance Coverage by Age in Liberty County
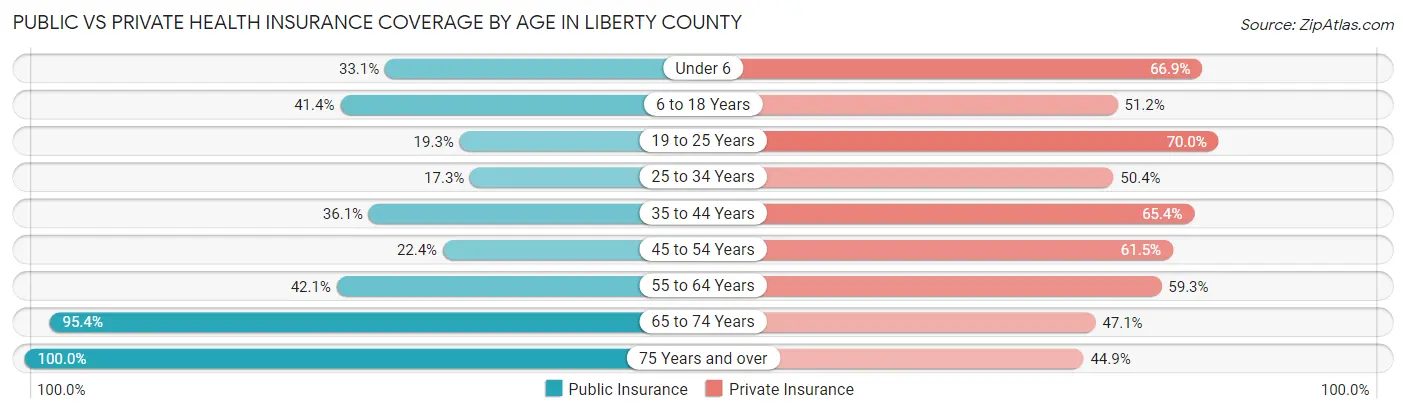
| Age Bracket | Public Insurance | Private Insurance |
| Under 6 | 96 (33.1%) | 194 (66.9%) |
| 6 to 18 Years | 547 (41.4%) | 676 (51.2%) |
| 19 to 25 Years | 82 (19.3%) | 298 (70.0%) |
| 25 to 34 Years | 128 (17.3%) | 373 (50.4%) |
| 35 to 44 Years | 288 (36.1%) | 522 (65.4%) |
| 45 to 54 Years | 200 (22.4%) | 550 (61.5%) |
| 55 to 64 Years | 366 (42.1%) | 516 (59.3%) |
| 65 to 74 Years | 474 (95.4%) | 234 (47.1%) |
| 75 Years and over | 477 (100.0%) | 214 (44.9%) |
| Total | 2,658 (42.1%) | 3,577 (56.7%) |
Disability Status by Sex by Age in Liberty County
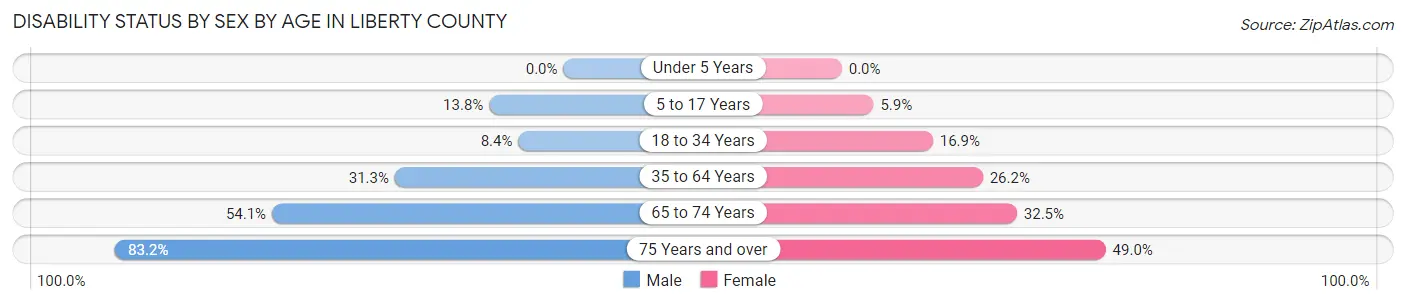
| Age Bracket | Male | Female |
| Under 5 Years | 0 (0.0%) | 0 (0.0%) |
| 5 to 17 Years | 73 (13.8%) | 41 (5.9%) |
| 18 to 34 Years | 60 (8.4%) | 103 (16.9%) |
| 35 to 64 Years | 345 (31.3%) | 382 (26.2%) |
| 65 to 74 Years | 119 (54.1%) | 90 (32.5%) |
| 75 Years and over | 193 (83.2%) | 120 (49.0%) |
Disability Class by Sex by Age in Liberty County
Disability Class: Hearing Difficulty
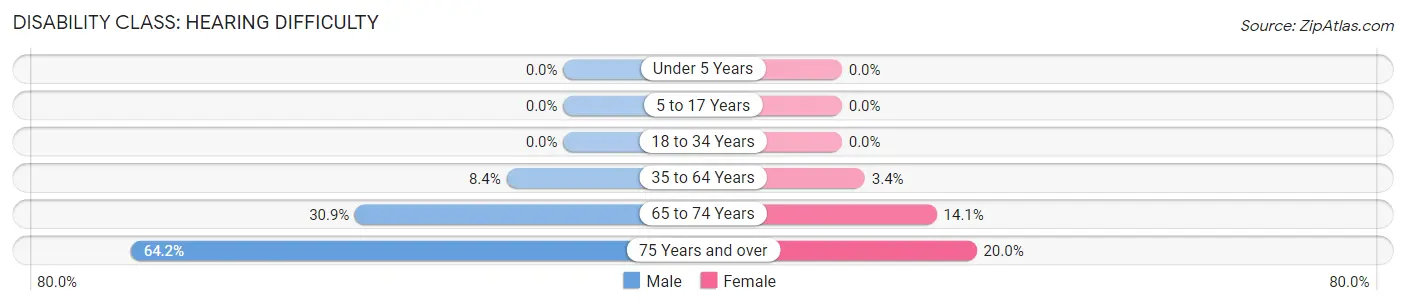
| Age Bracket | Male | Female |
| Under 5 Years | 0 (0.0%) | 0 (0.0%) |
| 5 to 17 Years | 0 (0.0%) | 0 (0.0%) |
| 18 to 34 Years | 0 (0.0%) | 0 (0.0%) |
| 35 to 64 Years | 93 (8.4%) | 50 (3.4%) |
| 65 to 74 Years | 68 (30.9%) | 39 (14.1%) |
| 75 Years and over | 149 (64.2%) | 49 (20.0%) |
Disability Class: Vision Difficulty
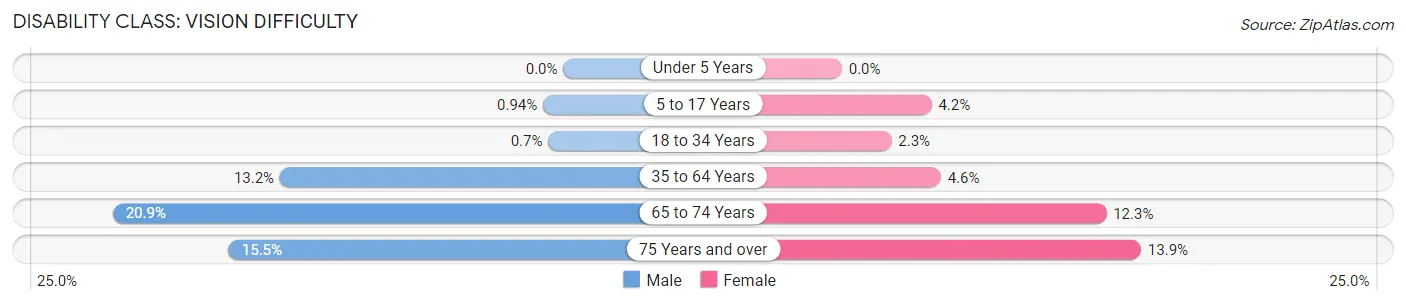
| Age Bracket | Male | Female |
| Under 5 Years | 0 (0.0%) | 0 (0.0%) |
| 5 to 17 Years | 5 (0.9%) | 29 (4.2%) |
| 18 to 34 Years | 5 (0.7%) | 14 (2.3%) |
| 35 to 64 Years | 145 (13.2%) | 67 (4.6%) |
| 65 to 74 Years | 46 (20.9%) | 34 (12.3%) |
| 75 Years and over | 36 (15.5%) | 34 (13.9%) |
Disability Class: Cognitive Difficulty
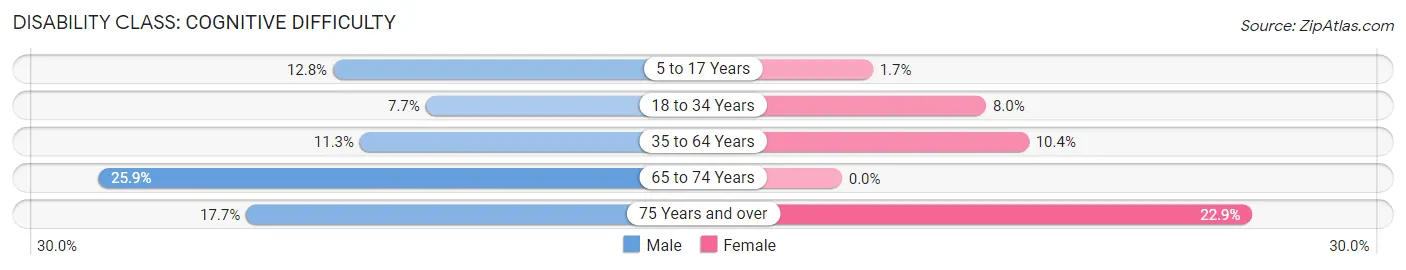
| Age Bracket | Male | Female |
| 5 to 17 Years | 68 (12.8%) | 12 (1.7%) |
| 18 to 34 Years | 55 (7.7%) | 49 (8.0%) |
| 35 to 64 Years | 125 (11.3%) | 152 (10.4%) |
| 65 to 74 Years | 57 (25.9%) | 0 (0.0%) |
| 75 Years and over | 41 (17.7%) | 56 (22.9%) |
Disability Class: Ambulatory Difficulty
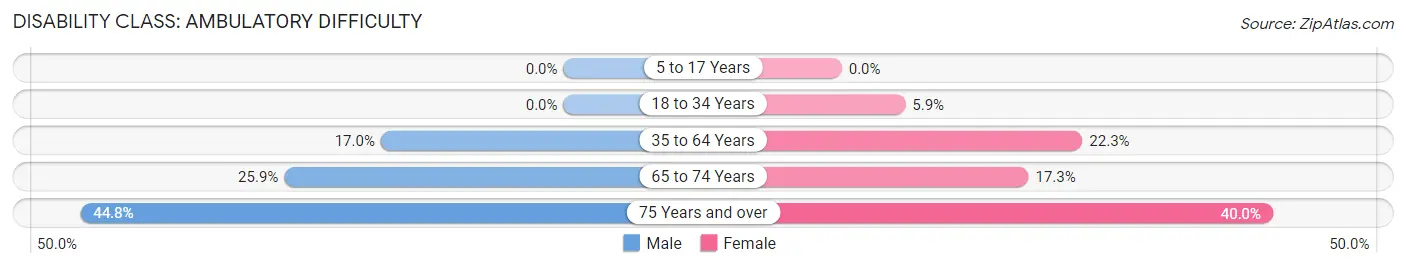
| Age Bracket | Male | Female |
| 5 to 17 Years | 0 (0.0%) | 0 (0.0%) |
| 18 to 34 Years | 0 (0.0%) | 36 (5.9%) |
| 35 to 64 Years | 187 (17.0%) | 326 (22.3%) |
| 65 to 74 Years | 57 (25.9%) | 48 (17.3%) |
| 75 Years and over | 104 (44.8%) | 98 (40.0%) |
Disability Class: Self-Care Difficulty
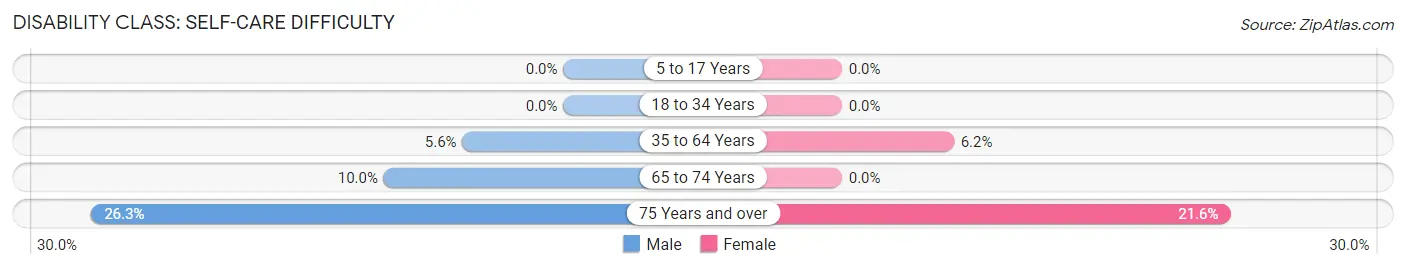
| Age Bracket | Male | Female |
| 5 to 17 Years | 0 (0.0%) | 0 (0.0%) |
| 18 to 34 Years | 0 (0.0%) | 0 (0.0%) |
| 35 to 64 Years | 62 (5.6%) | 91 (6.2%) |
| 65 to 74 Years | 22 (10.0%) | 0 (0.0%) |
| 75 Years and over | 61 (26.3%) | 53 (21.6%) |
Technology Access in Liberty County
Computing Device Access in Liberty County
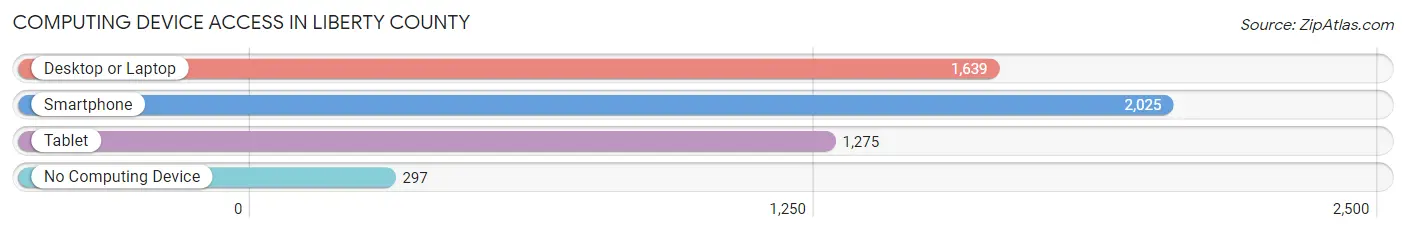
| Device Type | # Households | % Households |
| Desktop or Laptop | 1,639 | 67.0% |
| Smartphone | 2,025 | 82.8% |
| Tablet | 1,275 | 52.1% |
| No Computing Device | 297 | 12.1% |
| Total | 2,447 | 100.0% |
Internet Access in Liberty County
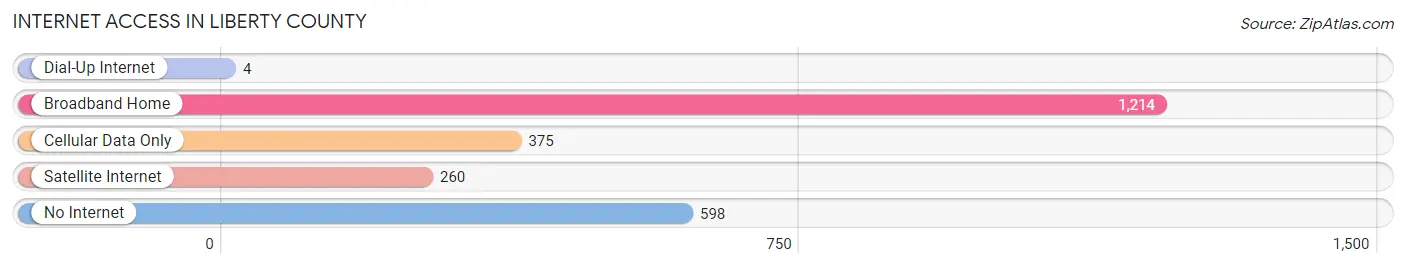
| Internet Type | # Households | % Households |
| Dial-Up Internet | 4 | 0.2% |
| Broadband Home | 1,214 | 49.6% |
| Cellular Data Only | 375 | 15.3% |
| Satellite Internet | 260 | 10.6% |
| No Internet | 598 | 24.4% |
| Total | 2,447 | 100.0% |
Liberty County Summary
Liberty County is a county located in the state of Florida in the United States. It is part of the Tallahassee, Florida Metropolitan Statistical Area. As of the 2010 census, the population was 8,365, making it the second-least populous county in Florida. The county seat is Bristol.
History
Liberty County was created in 1855 from a portion of Gadsden County. It was named for the concept of liberty. The county was originally part of the Apalachicola Territory, which was established in 1832. The county was later divided into Calhoun and Jackson counties in 1838.
Geography
Liberty County is located in the panhandle of Florida, bordered by the Apalachicola River to the west and the Gulf of Mexico to the south. It is approximately 30 miles east of Tallahassee, the state capital. The county has a total area of 545 square miles, of which 541 square miles is land and 4.2 square miles (0.8%) is water.
Economy
The economy of Liberty County is largely based on agriculture and timber. The county is home to several large timber companies, including Rayonier, which is the largest employer in the county. Other major employers include the Liberty County School District, the Liberty County Sheriff's Office, and the Liberty County Health Department.
The county also has a thriving tourism industry, with several popular attractions, including the Apalachicola National Forest, the Apalachicola River, and the St. Marks National Wildlife Refuge.
Demographics
As of the 2010 census, there were 8,365 people, 3,093 households, and 2,092 families residing in the county. The population density was 15.4 people per square mile. The racial makeup of the county was 79.2% White, 16.2% African American, 0.4% Native American, 0.3% Asian, 0.1% Pacific Islander, 2.2% from other races, and 1.7% from two or more races. Hispanic or Latino of any race were 4.7% of the population.
The median income for a household in the county was $30,917, and the median income for a family was $37,917. The per capita income for the county was $15,845. About 17.2% of families and 21.2% of the population were below the poverty line, including 28.2% of those under age 18 and 16.2% of those age 65 or over.
Conclusion
Liberty County is a rural county located in the panhandle of Florida. It has a population of 8,365 and is largely based on agriculture and timber. The county has a thriving tourism industry, with several popular attractions, including the Apalachicola National Forest, the Apalachicola River, and the St. Marks National Wildlife Refuge. The median income for a household in the county is $30,917, and the median income for a family is $37,917. The county has a diverse population, with 79.2% White, 16.2% African American, 0.4% Native American, 0.3% Asian, 0.1% Pacific Islander, 2.2% from other races, and 1.7% from two or more races.
Common Questions
What is Per Capita Income in Liberty County?
Per Capita income in Liberty County is $24,080.
What is the Median Family Income in Liberty County?
Median Family Income in Liberty County is $61,018.
What is the Median Household income in Liberty County?
Median Household Income in Liberty County is $51,723.
What is Income or Wage Gap in Liberty County?
Income or Wage Gap in Liberty County is 17.8%.
Women in Liberty County earn 82.2 cents for every dollar earned by a man.
What is Family Income Deficit in Liberty County?
Family Income Deficit in Liberty County is $10,018.
Families that are below poverty line in Liberty County earn $10,018 less on average than the poverty threshold level.
What is Inequality or Gini Index in Liberty County?
Inequality or Gini Index in Liberty County is 0.42.
What is the Total Population of Liberty County?
Total Population of Liberty County is 7,704.
What is the Total Male Population of Liberty County?
Total Male Population of Liberty County is 4,317.
What is the Total Female Population of Liberty County?
Total Female Population of Liberty County is 3,387.
What is the Ratio of Males per 100 Females in Liberty County?
There are 127.46 Males per 100 Females in Liberty County.
What is the Ratio of Females per 100 Males in Liberty County?
There are 78.46 Females per 100 Males in Liberty County.
What is the Median Population Age in Liberty County?
Median Population Age in Liberty County is 39.6 Years.
What is the Average Family Size in Liberty County
Average Family Size in Liberty County is 3.2 People.
What is the Average Household Size in Liberty County
Average Household Size in Liberty County is 2.6 People.
How Large is the Labor Force in Liberty County?
There are 2,770 People in the Labor Forcein in Liberty County.
What is the Percentage of People in the Labor Force in Liberty County?
42.4% of People are in the Labor Force in Liberty County.
What is the Unemployment Rate in Liberty County?
Unemployment Rate in Liberty County is 8.2%.