Levy County, FL Map & Demographics
Levy County Map
Levy County Overview
$29,042
PER CAPITA INCOME
$60,961
AVG FAMILY INCOME
$49,933
AVG HOUSEHOLD INCOME
24.2%
WAGE / INCOME GAP [ % ]
75.8¢/ $1
WAGE / INCOME GAP [ $ ]
$12,148
FAMILY INCOME DEFICIT
0.46
INEQUALITY / GINI INDEX
43,268
TOTAL POPULATION
21,126
MALE POPULATION
22,142
FEMALE POPULATION
95.41
MALES / 100 FEMALES
104.81
FEMALES / 100 MALES
47.3
MEDIAN AGE
2.9
AVG FAMILY SIZE
2.4
AVG HOUSEHOLD SIZE
18,005
LABOR FORCE [ PEOPLE ]
50.5%
PERCENT IN LABOR FORCE
4.4%
UNEMPLOYMENT RATE
Levy County Area Codes
Income in Levy County
Income Overview in Levy County
Per Capita Income in Levy County is $29,042, while median incomes of families and households are $60,961 and $49,933 respectively.
| Characteristic | Number | Measure |
| Per Capita Income | 43,268 | $29,042 |
| Median Family Income | 11,573 | $60,961 |
| Mean Family Income | 11,573 | $78,246 |
| Median Household Income | 17,843 | $49,933 |
| Mean Household Income | 17,843 | $67,318 |
| Income Deficit | 11,573 | $12,148 |
| Wage / Income Gap (%) | 43,268 | 24.15% |
| Wage / Income Gap ($) | 43,268 | 75.85¢ per $1 |
| Gini / Inequality Index | 43,268 | 0.46 |
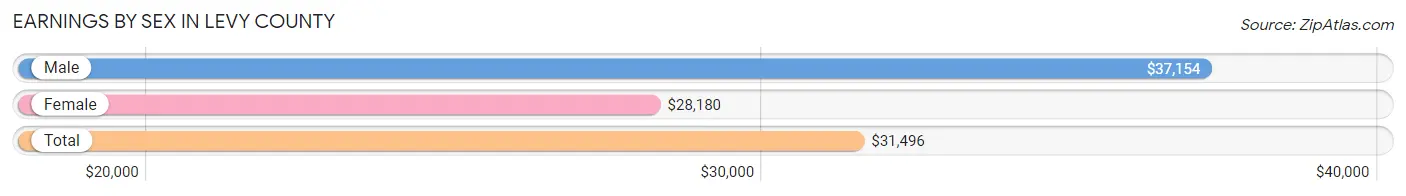
Earnings by Sex in Levy County
Average Earnings in Levy County are $31,496, $37,154 for men and $28,180 for women, a difference of 24.1%.
| Sex | Number | Average Earnings |
| Male | 9,472 (49.7%) | $37,154 |
| Female | 9,590 (50.3%) | $28,180 |
| Total | 19,062 (100.0%) | $31,496 |
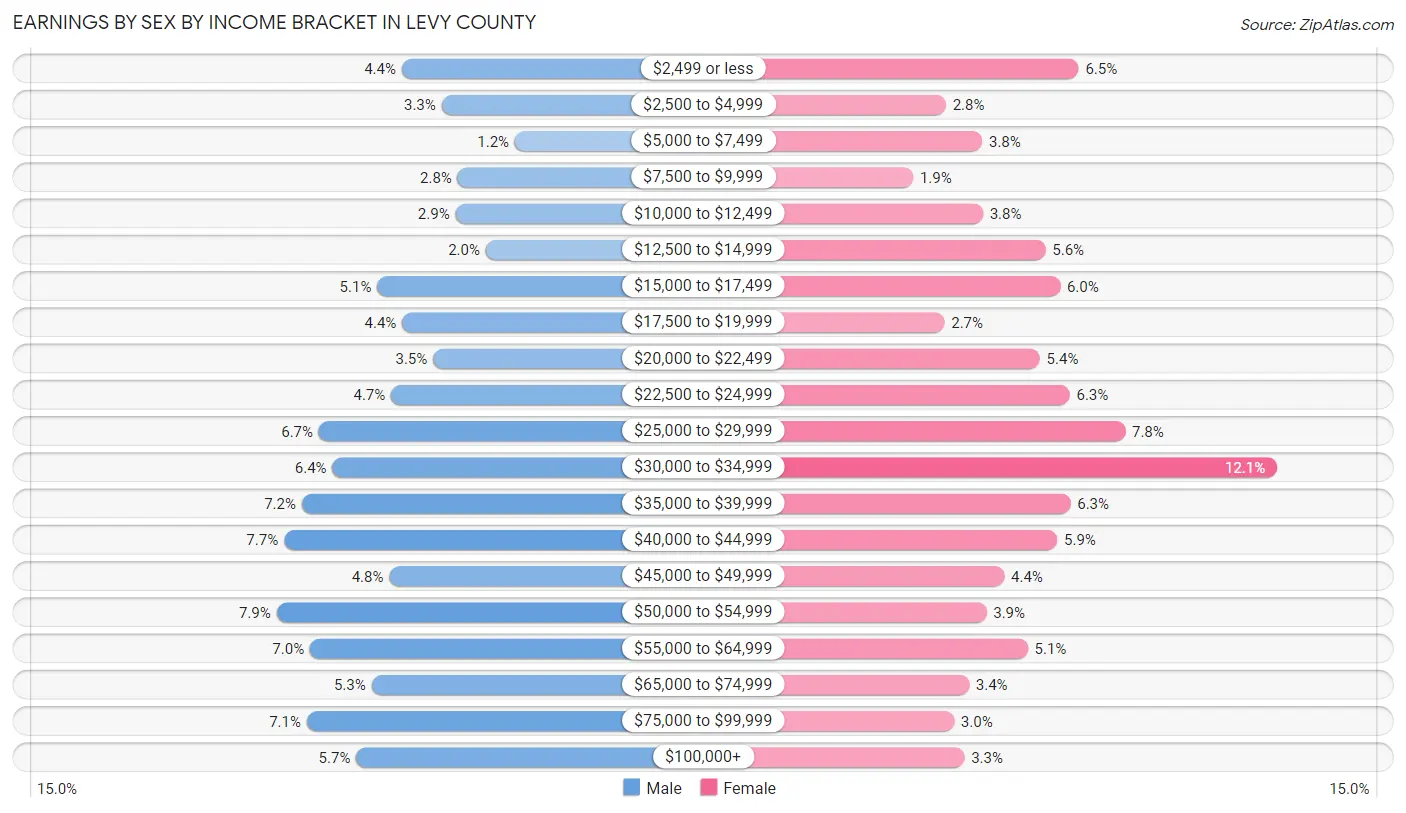
Earnings by Sex by Income Bracket in Levy County
The most common earnings brackets in Levy County are $50,000 to $54,999 for men (750 | 7.9%) and $30,000 to $34,999 for women (1,159 | 12.1%).
| Income | Male | Female |
| $2,499 or less | 417 (4.4%) | 624 (6.5%) |
| $2,500 to $4,999 | 311 (3.3%) | 267 (2.8%) |
| $5,000 to $7,499 | 116 (1.2%) | 364 (3.8%) |
| $7,500 to $9,999 | 268 (2.8%) | 178 (1.9%) |
| $10,000 to $12,499 | 274 (2.9%) | 366 (3.8%) |
| $12,500 to $14,999 | 193 (2.0%) | 535 (5.6%) |
| $15,000 to $17,499 | 482 (5.1%) | 574 (6.0%) |
| $17,500 to $19,999 | 416 (4.4%) | 263 (2.7%) |
| $20,000 to $22,499 | 333 (3.5%) | 520 (5.4%) |
| $22,500 to $24,999 | 445 (4.7%) | 600 (6.3%) |
| $25,000 to $29,999 | 637 (6.7%) | 750 (7.8%) |
| $30,000 to $34,999 | 601 (6.4%) | 1,159 (12.1%) |
| $35,000 to $39,999 | 683 (7.2%) | 602 (6.3%) |
| $40,000 to $44,999 | 730 (7.7%) | 567 (5.9%) |
| $45,000 to $49,999 | 450 (4.8%) | 424 (4.4%) |
| $50,000 to $54,999 | 750 (7.9%) | 376 (3.9%) |
| $55,000 to $64,999 | 661 (7.0%) | 487 (5.1%) |
| $65,000 to $74,999 | 497 (5.2%) | 329 (3.4%) |
| $75,000 to $99,999 | 670 (7.1%) | 289 (3.0%) |
| $100,000+ | 538 (5.7%) | 316 (3.3%) |
| Total | 9,472 (100.0%) | 9,590 (100.0%) |
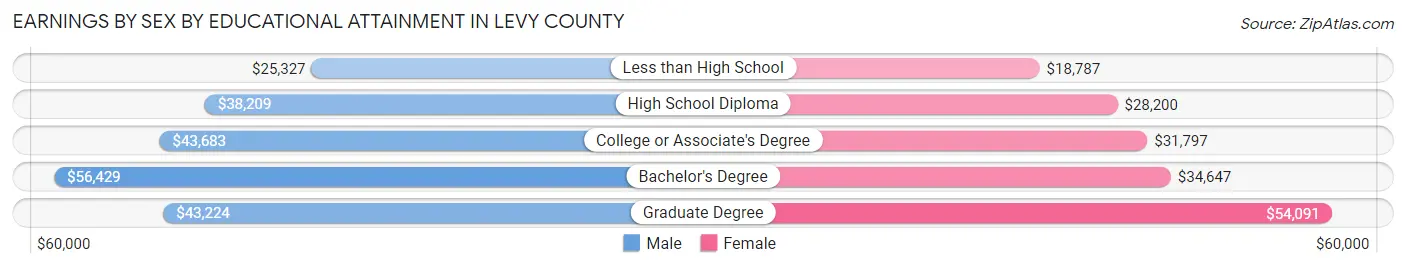
Earnings by Sex by Educational Attainment in Levy County
Average earnings in Levy County are $39,425 for men and $30,795 for women, a difference of 21.9%. Men with an educational attainment of bachelor's degree enjoy the highest average annual earnings of $56,429, while those with less than high school education earn the least with $25,327. Women with an educational attainment of graduate degree earn the most with the average annual earnings of $54,091, while those with less than high school education have the smallest earnings of $18,787.
| Educational Attainment | Male Income | Female Income |
| Less than High School | $25,327 | $18,787 |
| High School Diploma | $38,209 | $28,200 |
| College or Associate's Degree | $43,683 | $31,797 |
| Bachelor's Degree | $56,429 | $34,647 |
| Graduate Degree | $43,224 | $54,091 |
| Total | $39,425 | $30,795 |
Family Income in Levy County
Family Income Brackets in Levy County
According to the Levy County family income data, there are 2,801 families falling into the $50,000 to $74,999 income range, which is the most common income bracket and makes up 24.2% of all families. Conversely, the $10,000 to $14,999 income bracket is the least frequent group with only 289 families (2.5%) belonging to this category.
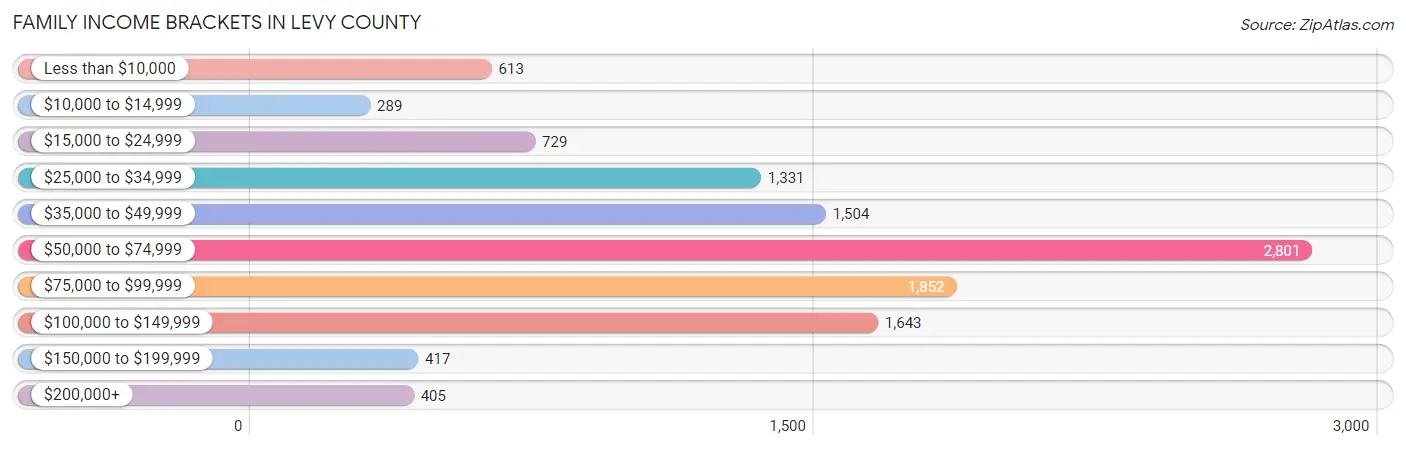
| Income Bracket | # Families | % Families |
| Less than $10,000 | 613 | 5.3% |
| $10,000 to $14,999 | 289 | 2.5% |
| $15,000 to $24,999 | 729 | 6.3% |
| $25,000 to $34,999 | 1,331 | 11.5% |
| $35,000 to $49,999 | 1,504 | 13.0% |
| $50,000 to $74,999 | 2,801 | 24.2% |
| $75,000 to $99,999 | 1,852 | 16.0% |
| $100,000 to $149,999 | 1,643 | 14.2% |
| $150,000 to $199,999 | 417 | 3.6% |
| $200,000+ | 405 | 3.5% |
Family Income by Famaliy Size in Levy County
7+ person families (215 | 1.9%) account for the highest median family income in Levy County with $97,650 per family, while 2-person families (6,428 | 55.5%) have the highest median income of $28,259 per family member.
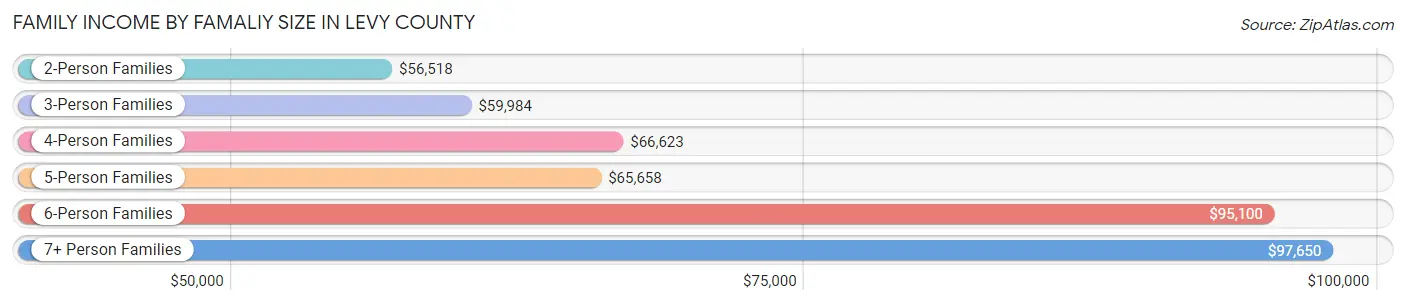
| Income Bracket | # Families | Median Income |
| 2-Person Families | 6,428 (55.5%) | $56,518 |
| 3-Person Families | 2,536 (21.9%) | $59,984 |
| 4-Person Families | 1,401 (12.1%) | $66,623 |
| 5-Person Families | 678 (5.9%) | $65,658 |
| 6-Person Families | 315 (2.7%) | $95,100 |
| 7+ Person Families | 215 (1.9%) | $97,650 |
| Total | 11,573 (100.0%) | $60,961 |
Family Income by Number of Earners in Levy County
The median family income in Levy County is $60,961, with families comprising 3+ earners (850) having the highest median family income of $96,364, while families with no earners (3,305) have the lowest median family income of $43,790, accounting for 7.3% and 28.6% of families, respectively.
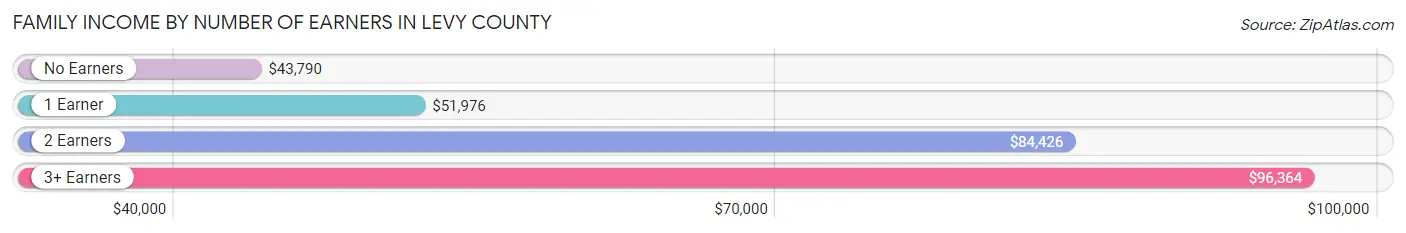
| Number of Earners | # Families | Median Income |
| No Earners | 3,305 (28.6%) | $43,790 |
| 1 Earner | 3,945 (34.1%) | $51,976 |
| 2 Earners | 3,473 (30.0%) | $84,426 |
| 3+ Earners | 850 (7.3%) | $96,364 |
| Total | 11,573 (100.0%) | $60,961 |
Household Income in Levy County
Household Income Brackets in Levy County
With 3,533 households falling in the category, the $50,000 to $74,999 income range is the most frequent in Levy County, accounting for 19.8% of all households. In contrast, only 517 households (2.9%) fall into the $200,000+ income bracket, making it the least populous group.
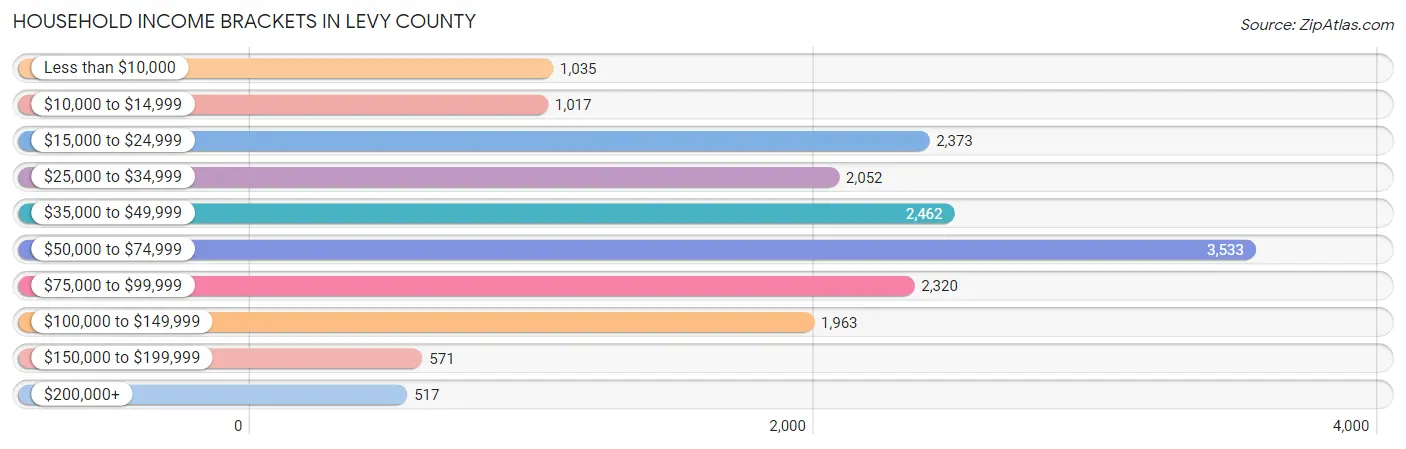
| Income Bracket | # Households | % Households |
| Less than $10,000 | 1,035 | 5.8% |
| $10,000 to $14,999 | 1,017 | 5.7% |
| $15,000 to $24,999 | 2,373 | 13.3% |
| $25,000 to $34,999 | 2,052 | 11.5% |
| $35,000 to $49,999 | 2,462 | 13.8% |
| $50,000 to $74,999 | 3,533 | 19.8% |
| $75,000 to $99,999 | 2,320 | 13.0% |
| $100,000 to $149,999 | 1,963 | 11.0% |
| $150,000 to $199,999 | 571 | 3.2% |
| $200,000+ | 517 | 2.9% |
Household Income by Householder Age in Levy County
The median household income in Levy County is $49,933, with the highest median household income of $65,396 found in the 25 to 44 years age bracket for the primary householder. A total of 4,190 households (23.5%) fall into this category. Meanwhile, the 15 to 24 years age bracket for the primary householder has the lowest median household income of $39,107, with 386 households (2.2%) in this group.
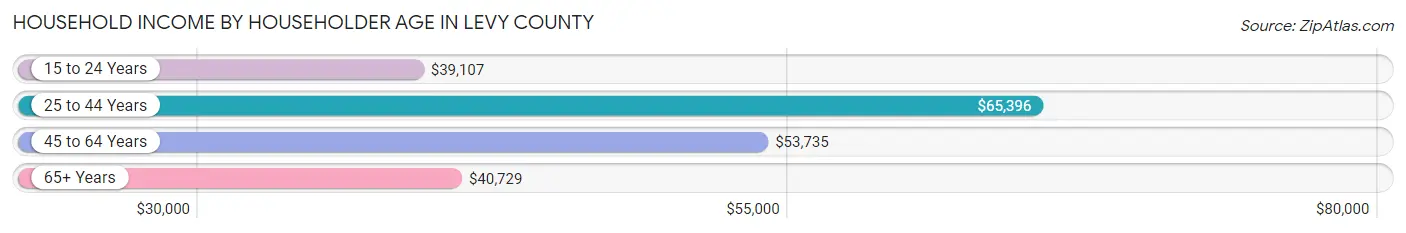
| Income Bracket | # Households | Median Income |
| 15 to 24 Years | 386 (2.2%) | $39,107 |
| 25 to 44 Years | 4,190 (23.5%) | $65,396 |
| 45 to 64 Years | 6,346 (35.6%) | $53,735 |
| 65+ Years | 6,921 (38.8%) | $40,729 |
| Total | 17,843 (100.0%) | $49,933 |
Poverty in Levy County
Income Below Poverty by Sex and Age in Levy County
With 14.8% poverty level for males and 16.5% for females among the residents of Levy County, 16 and 17 year old males and 5 year old females are the most vulnerable to poverty, with 104 males (32.2%) and 18 females (75.0%) in their respective age groups living below the poverty level.
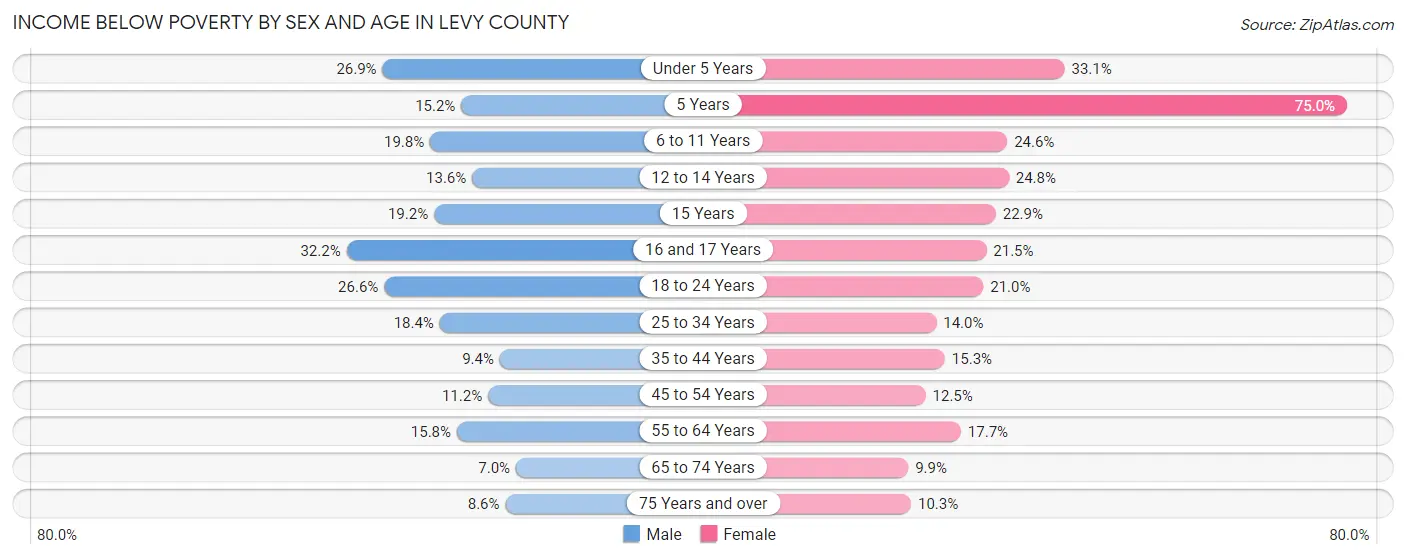
| Age Bracket | Male | Female |
| Under 5 Years | 260 (26.9%) | 397 (33.1%) |
| 5 Years | 22 (15.2%) | 18 (75.0%) |
| 6 to 11 Years | 316 (19.8%) | 360 (24.6%) |
| 12 to 14 Years | 106 (13.6%) | 185 (24.8%) |
| 15 Years | 63 (19.2%) | 67 (22.9%) |
| 16 and 17 Years | 104 (32.2%) | 105 (21.5%) |
| 18 to 24 Years | 434 (26.6%) | 286 (21.0%) |
| 25 to 34 Years | 414 (18.4%) | 335 (14.0%) |
| 35 to 44 Years | 185 (9.4%) | 362 (15.3%) |
| 45 to 54 Years | 285 (11.2%) | 330 (12.4%) |
| 55 to 64 Years | 506 (15.8%) | 638 (17.7%) |
| 65 to 74 Years | 212 (7.0%) | 313 (9.9%) |
| 75 Years and over | 189 (8.6%) | 226 (10.3%) |
| Total | 3,096 (14.8%) | 3,622 (16.5%) |
Income Above Poverty by Sex and Age in Levy County
According to the poverty statistics in Levy County, males aged 65 to 74 years and females aged 65 to 74 years are the age groups that are most secure financially, with 93.0% of males and 90.1% of females in these age groups living above the poverty line.
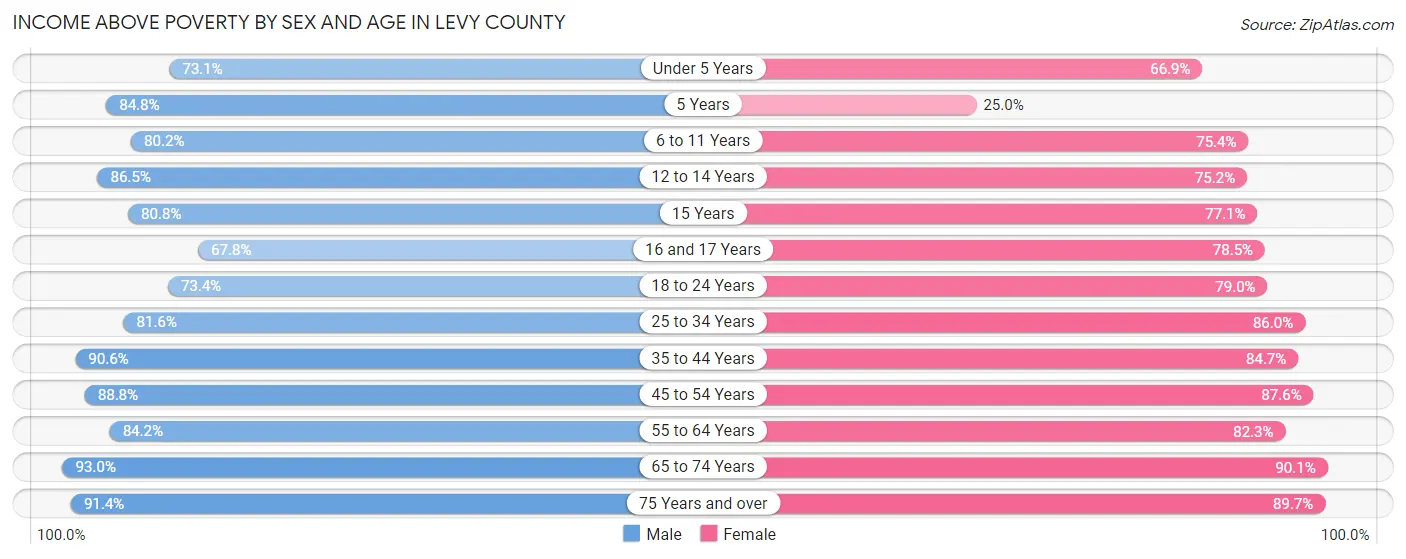
| Age Bracket | Male | Female |
| Under 5 Years | 708 (73.1%) | 803 (66.9%) |
| 5 Years | 123 (84.8%) | 6 (25.0%) |
| 6 to 11 Years | 1,281 (80.2%) | 1,106 (75.4%) |
| 12 to 14 Years | 676 (86.5%) | 561 (75.2%) |
| 15 Years | 265 (80.8%) | 226 (77.1%) |
| 16 and 17 Years | 219 (67.8%) | 384 (78.5%) |
| 18 to 24 Years | 1,197 (73.4%) | 1,075 (79.0%) |
| 25 to 34 Years | 1,841 (81.6%) | 2,053 (86.0%) |
| 35 to 44 Years | 1,775 (90.6%) | 2,003 (84.7%) |
| 45 to 54 Years | 2,261 (88.8%) | 2,320 (87.5%) |
| 55 to 64 Years | 2,695 (84.2%) | 2,969 (82.3%) |
| 65 to 74 Years | 2,799 (93.0%) | 2,862 (90.1%) |
| 75 Years and over | 2,005 (91.4%) | 1,970 (89.7%) |
| Total | 17,845 (85.2%) | 18,338 (83.5%) |
Income Below Poverty Among Married-Couple Families in Levy County
The poverty statistics for married-couple families in Levy County show that 4.8% or 401 of the total 8,277 families live below the poverty line. Families with 5 or more children have the highest poverty rate of 44.0%, comprising of 40 families. On the other hand, families with no children have the lowest poverty rate of 3.5%, which includes 204 families.
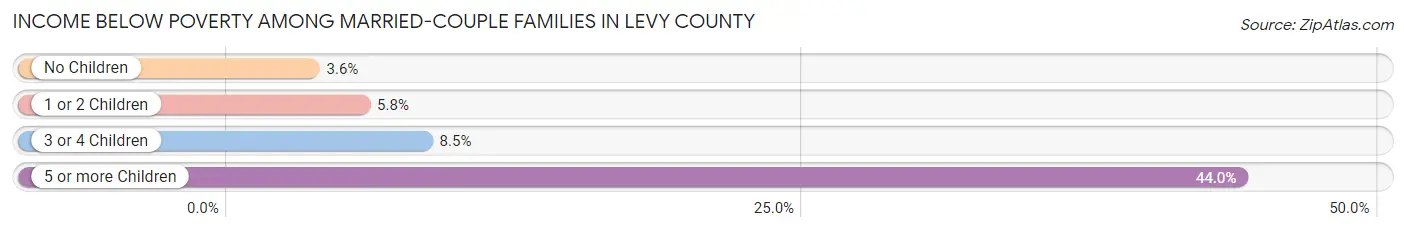
| Children | Above Poverty | Below Poverty |
| No Children | 5,543 (96.5%) | 204 (3.5%) |
| 1 or 2 Children | 1,720 (94.3%) | 105 (5.8%) |
| 3 or 4 Children | 562 (91.5%) | 52 (8.5%) |
| 5 or more Children | 51 (56.0%) | 40 (44.0%) |
| Total | 7,876 (95.2%) | 401 (4.8%) |
Income Below Poverty Among Single-Parent Households in Levy County
According to the poverty data in Levy County, 25.8% or 289 single-father households and 32.2% or 701 single-mother households are living below the poverty line. Among single-father households, those with 5 or more children have the highest poverty rate, with 11 households (100.0%) experiencing poverty. Likewise, among single-mother households, those with 3 or 4 children have the highest poverty rate, with 248 households (92.5%) falling below the poverty line.
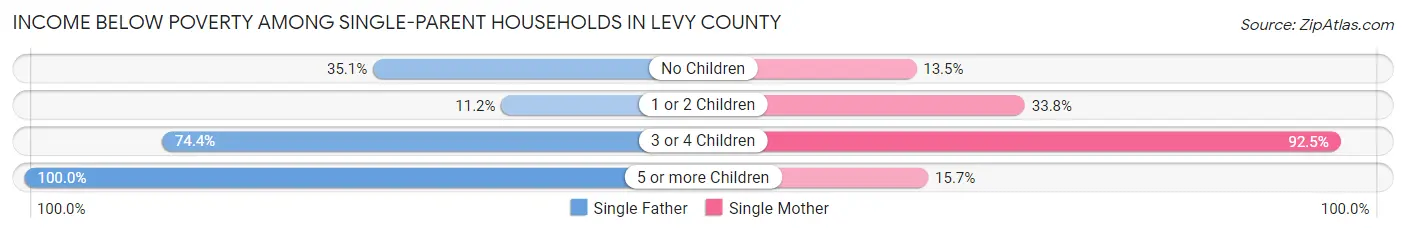
| Children | Single Father | Single Mother |
| No Children | 146 (35.1%) | 117 (13.5%) |
| 1 or 2 Children | 68 (11.2%) | 322 (33.8%) |
| 3 or 4 Children | 64 (74.4%) | 248 (92.5%) |
| 5 or more Children | 11 (100.0%) | 14 (15.7%) |
| Total | 289 (25.8%) | 701 (32.2%) |
Income Below Poverty Among Married-Couple vs Single-Parent Households in Levy County
The poverty data for Levy County shows that 401 of the married-couple family households (4.8%) and 990 of the single-parent households (30.0%) are living below the poverty level. Within the married-couple family households, those with 5 or more children have the highest poverty rate, with 40 households (44.0%) falling below the poverty line. Among the single-parent households, those with 3 or 4 children have the highest poverty rate, with 312 household (88.1%) living below poverty.
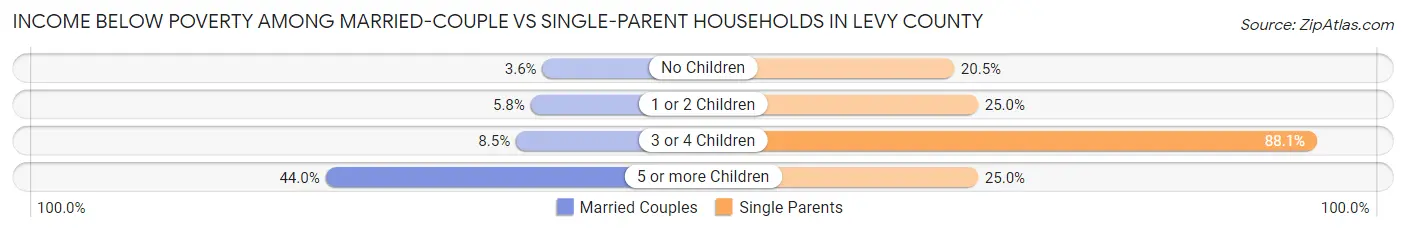
| Children | Married-Couple Families | Single-Parent Households |
| No Children | 204 (3.5%) | 263 (20.5%) |
| 1 or 2 Children | 105 (5.8%) | 390 (25.0%) |
| 3 or 4 Children | 52 (8.5%) | 312 (88.1%) |
| 5 or more Children | 40 (44.0%) | 25 (25.0%) |
| Total | 401 (4.8%) | 990 (30.0%) |
Race in Levy County
The most populous races in Levy County are White / Caucasian (36,022 | 83.3%), Hispanic or Latino (3,992 | 9.2%), and Black / African American (3,697 | 8.5%).
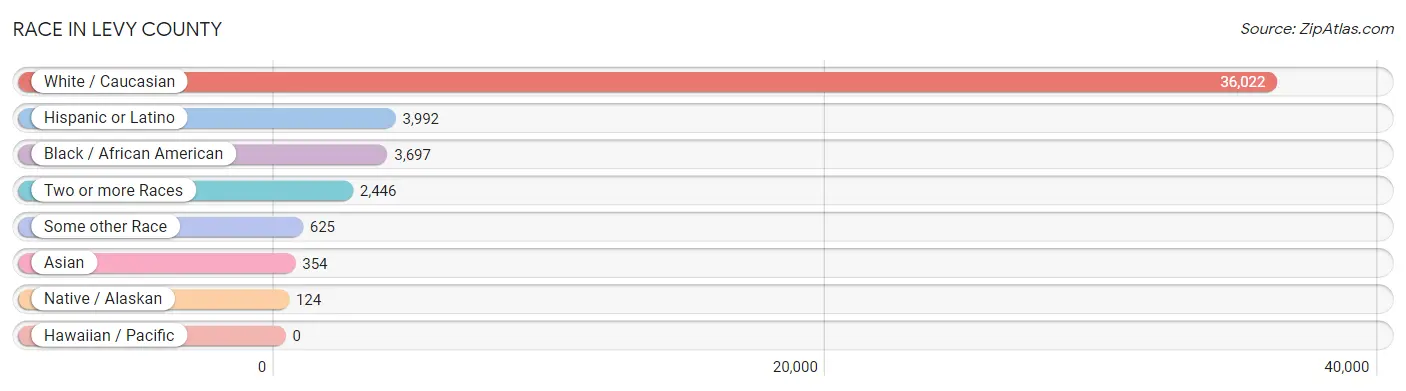
| Race | # Population | % Population |
| Asian | 354 | 0.8% |
| Black / African American | 3,697 | 8.5% |
| Hawaiian / Pacific | 0 | 0.0% |
| Hispanic or Latino | 3,992 | 9.2% |
| Native / Alaskan | 124 | 0.3% |
| White / Caucasian | 36,022 | 83.3% |
| Two or more Races | 2,446 | 5.7% |
| Some other Race | 625 | 1.4% |
| Total | 43,268 | 100.0% |
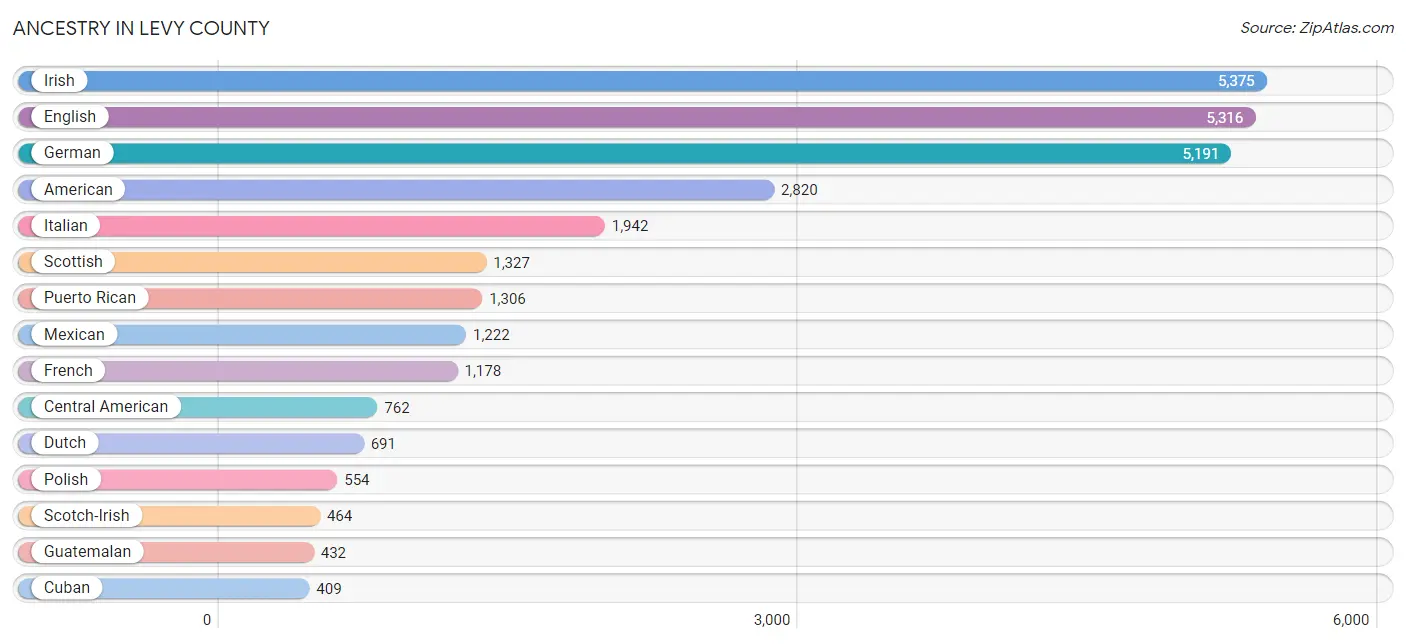
Ancestry in Levy County
The most populous ancestries reported in Levy County are Irish (5,375 | 12.4%), English (5,316 | 12.3%), German (5,191 | 12.0%), American (2,820 | 6.5%), and Italian (1,942 | 4.5%), together accounting for 47.7% of all Levy County residents.
| Ancestry | # Population | % Population |
| African | 204 | 0.5% |
| American | 2,820 | 6.5% |
| Apache | 7 | 0.0% |
| Arab | 47 | 0.1% |
| Argentinean | 74 | 0.2% |
| Austrian | 6 | 0.0% |
| Belgian | 29 | 0.1% |
| Belizean | 11 | 0.0% |
| Bermudan | 36 | 0.1% |
| Bhutanese | 84 | 0.2% |
| Blackfeet | 63 | 0.2% |
| British | 278 | 0.6% |
| Burmese | 7 | 0.0% |
| Canadian | 85 | 0.2% |
| Celtic | 12 | 0.0% |
| Central American | 762 | 1.8% |
| Central American Indian | 15 | 0.0% |
| Cherokee | 286 | 0.7% |
| Choctaw | 40 | 0.1% |
| Costa Rican | 15 | 0.0% |
| Creek | 4 | 0.0% |
| Croatian | 3 | 0.0% |
| Cuban | 409 | 0.9% |
| Czech | 46 | 0.1% |
| Czechoslovakian | 9 | 0.0% |
| Danish | 65 | 0.2% |
| Dominican | 10 | 0.0% |
| Dutch | 691 | 1.6% |
| Eastern European | 29 | 0.1% |
| English | 5,316 | 12.3% |
| European | 396 | 0.9% |
| Finnish | 20 | 0.1% |
| French | 1,178 | 2.7% |
| French Canadian | 326 | 0.7% |
| German | 5,191 | 12.0% |
| Greek | 216 | 0.5% |
| Guatemalan | 432 | 1.0% |
| Haitian | 10 | 0.0% |
| Honduran | 107 | 0.3% |
| Houma | 13 | 0.0% |
| Hungarian | 274 | 0.6% |
| Indian (Asian) | 87 | 0.2% |
| Irish | 5,375 | 12.4% |
| Italian | 1,942 | 4.5% |
| Jamaican | 64 | 0.2% |
| Japanese | 8 | 0.0% |
| Korean | 113 | 0.3% |
| Lebanese | 22 | 0.1% |
| Lithuanian | 14 | 0.0% |
| Mexican | 1,222 | 2.8% |
| Mexican American Indian | 44 | 0.1% |
| Moroccan | 18 | 0.0% |
| Native Hawaiian | 86 | 0.2% |
| Northern European | 5 | 0.0% |
| Norwegian | 275 | 0.6% |
| Pakistani | 6 | 0.0% |
| Panamanian | 109 | 0.3% |
| Pennsylvania German | 15 | 0.0% |
| Polish | 554 | 1.3% |
| Portuguese | 63 | 0.2% |
| Puerto Rican | 1,306 | 3.0% |
| Romanian | 4 | 0.0% |
| Russian | 210 | 0.5% |
| Salvadoran | 99 | 0.2% |
| Scandinavian | 41 | 0.1% |
| Scotch-Irish | 464 | 1.1% |
| Scottish | 1,327 | 3.1% |
| Seminole | 6 | 0.0% |
| Serbian | 3 | 0.0% |
| Slavic | 19 | 0.0% |
| Slovak | 57 | 0.1% |
| South American | 156 | 0.4% |
| Spaniard | 60 | 0.1% |
| Spanish | 24 | 0.1% |
| Subsaharan African | 204 | 0.5% |
| Swedish | 129 | 0.3% |
| Swiss | 45 | 0.1% |
| Thai | 108 | 0.3% |
| Trinidadian and Tobagonian | 14 | 0.0% |
| Ukrainian | 35 | 0.1% |
| Uruguayan | 27 | 0.1% |
| Venezuelan | 55 | 0.1% |
| Welsh | 294 | 0.7% |
| West Indian | 7 | 0.0% |
| Yugoslavian | 6 | 0.0% | View All 85 Rows |
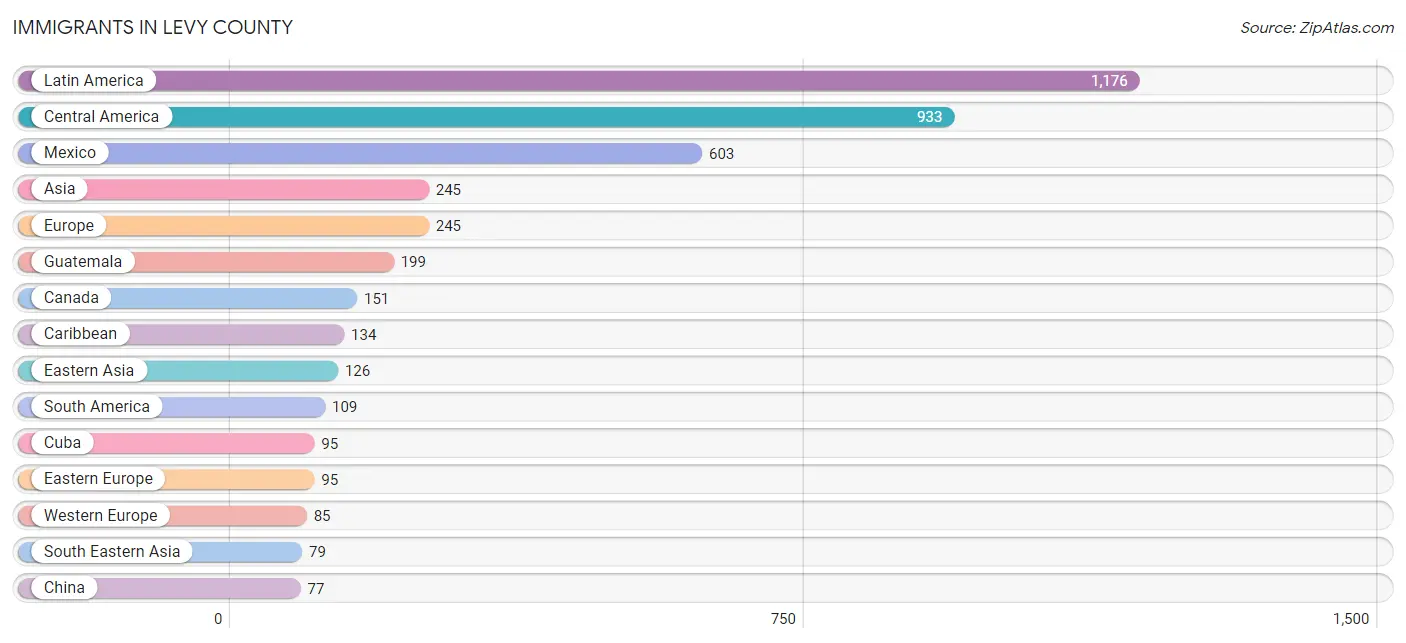
Immigrants in Levy County
The most numerous immigrant groups reported in Levy County came from Latin America (1,176 | 2.7%), Central America (933 | 2.2%), Mexico (603 | 1.4%), Asia (245 | 0.6%), and Europe (245 | 0.6%), together accounting for 7.4% of all Levy County residents.
| Immigration Origin | # Population | % Population |
| Africa | 20 | 0.1% |
| Argentina | 35 | 0.1% |
| Asia | 245 | 0.6% |
| Bahamas | 5 | 0.0% |
| Belarus | 13 | 0.0% |
| Canada | 151 | 0.4% |
| Caribbean | 134 | 0.3% |
| Central America | 933 | 2.2% |
| China | 77 | 0.2% |
| Costa Rica | 15 | 0.0% |
| Cuba | 95 | 0.2% |
| Dominican Republic | 13 | 0.0% |
| Eastern Asia | 126 | 0.3% |
| Eastern Europe | 95 | 0.2% |
| El Salvador | 49 | 0.1% |
| England | 24 | 0.1% |
| Europe | 245 | 0.6% |
| France | 4 | 0.0% |
| Germany | 72 | 0.2% |
| Guatemala | 199 | 0.5% |
| Honduras | 67 | 0.2% |
| Hungary | 6 | 0.0% |
| India | 40 | 0.1% |
| Japan | 42 | 0.1% |
| Korea | 7 | 0.0% |
| Latin America | 1,176 | 2.7% |
| Mexico | 603 | 1.4% |
| Middle Africa | 2 | 0.0% |
| Northern Europe | 45 | 0.1% |
| Philippines | 73 | 0.2% |
| Poland | 28 | 0.1% |
| Russia | 48 | 0.1% |
| Scotland | 2 | 0.0% |
| South America | 109 | 0.3% |
| South Central Asia | 40 | 0.1% |
| South Eastern Asia | 79 | 0.2% |
| Southern Europe | 20 | 0.1% |
| Spain | 20 | 0.1% |
| Switzerland | 9 | 0.0% |
| Thailand | 6 | 0.0% |
| Trinidad and Tobago | 14 | 0.0% |
| Uruguay | 27 | 0.1% |
| Venezuela | 47 | 0.1% |
| Western Europe | 85 | 0.2% |
| Zaire | 2 | 0.0% | View All 45 Rows |
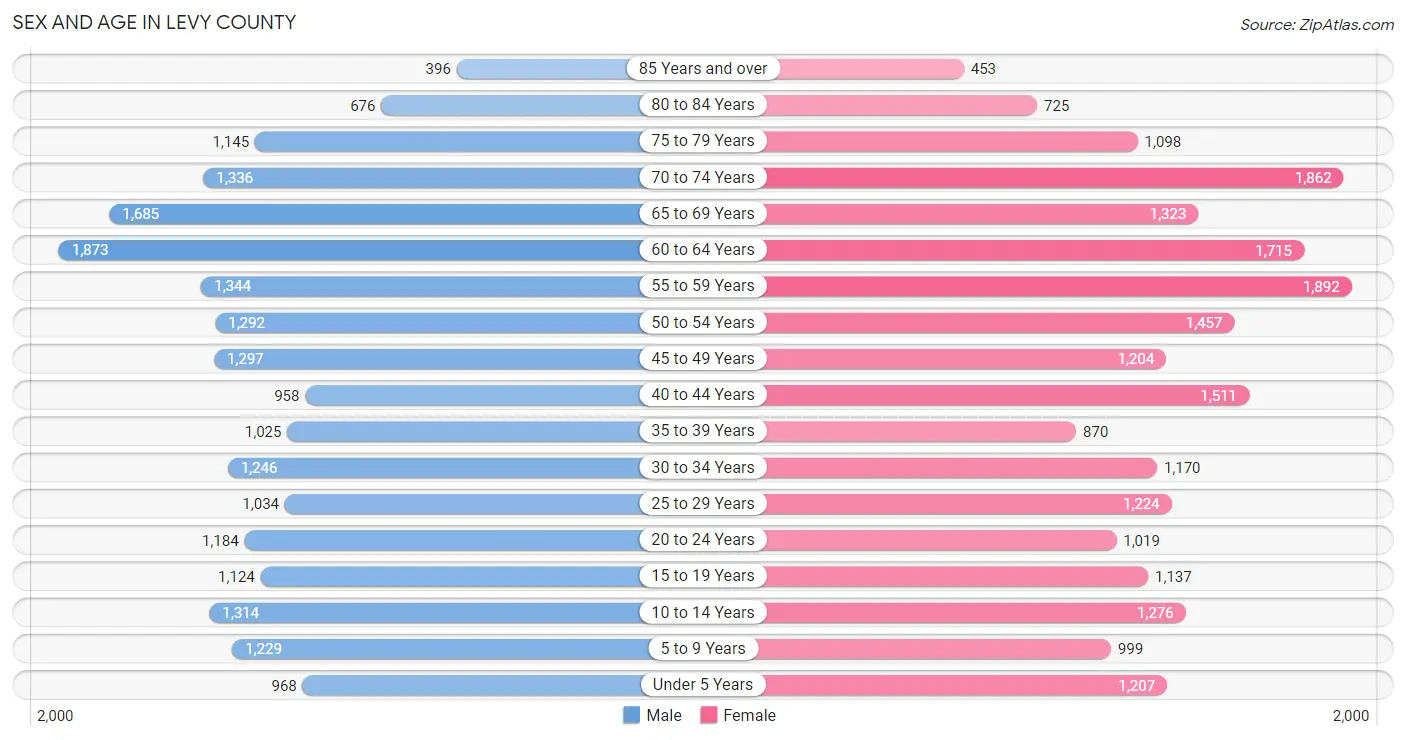
Sex and Age in Levy County
Sex and Age in Levy County
The most populous age groups in Levy County are 60 to 64 Years (1,873 | 8.9%) for men and 55 to 59 Years (1,892 | 8.5%) for women.
| Age Bracket | Male | Female |
| Under 5 Years | 968 (4.6%) | 1,207 (5.4%) |
| 5 to 9 Years | 1,229 (5.8%) | 999 (4.5%) |
| 10 to 14 Years | 1,314 (6.2%) | 1,276 (5.8%) |
| 15 to 19 Years | 1,124 (5.3%) | 1,137 (5.1%) |
| 20 to 24 Years | 1,184 (5.6%) | 1,019 (4.6%) |
| 25 to 29 Years | 1,034 (4.9%) | 1,224 (5.5%) |
| 30 to 34 Years | 1,246 (5.9%) | 1,170 (5.3%) |
| 35 to 39 Years | 1,025 (4.9%) | 870 (3.9%) |
| 40 to 44 Years | 958 (4.5%) | 1,511 (6.8%) |
| 45 to 49 Years | 1,297 (6.1%) | 1,204 (5.4%) |
| 50 to 54 Years | 1,292 (6.1%) | 1,457 (6.6%) |
| 55 to 59 Years | 1,344 (6.4%) | 1,892 (8.5%) |
| 60 to 64 Years | 1,873 (8.9%) | 1,715 (7.7%) |
| 65 to 69 Years | 1,685 (8.0%) | 1,323 (6.0%) |
| 70 to 74 Years | 1,336 (6.3%) | 1,862 (8.4%) |
| 75 to 79 Years | 1,145 (5.4%) | 1,098 (5.0%) |
| 80 to 84 Years | 676 (3.2%) | 725 (3.3%) |
| 85 Years and over | 396 (1.9%) | 453 (2.1%) |
| Total | 21,126 (100.0%) | 22,142 (100.0%) |
Families and Households in Levy County
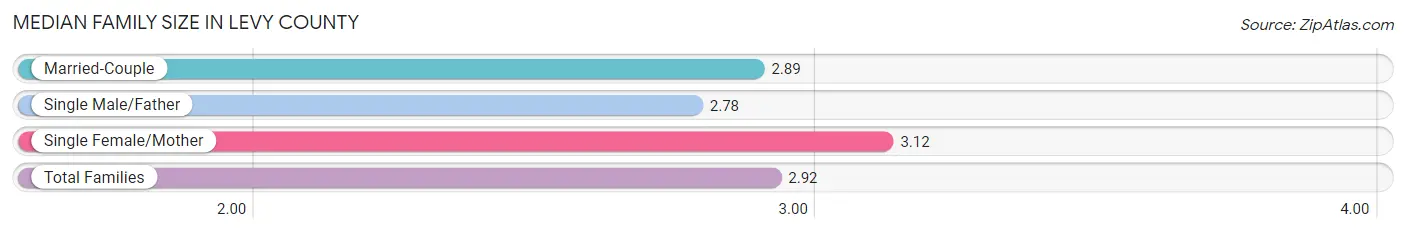
Median Family Size in Levy County
The median family size in Levy County is 2.92 persons per family, with single female/mother families (2,176 | 18.8%) accounting for the largest median family size of 3.12 persons per family. On the other hand, single male/father families (1,120 | 9.7%) represent the smallest median family size with 2.78 persons per family.
| Family Type | # Families | Family Size |
| Married-Couple | 8,277 (71.5%) | 2.89 |
| Single Male/Father | 1,120 (9.7%) | 2.78 |
| Single Female/Mother | 2,176 (18.8%) | 3.12 |
| Total Families | 11,573 (100.0%) | 2.92 |
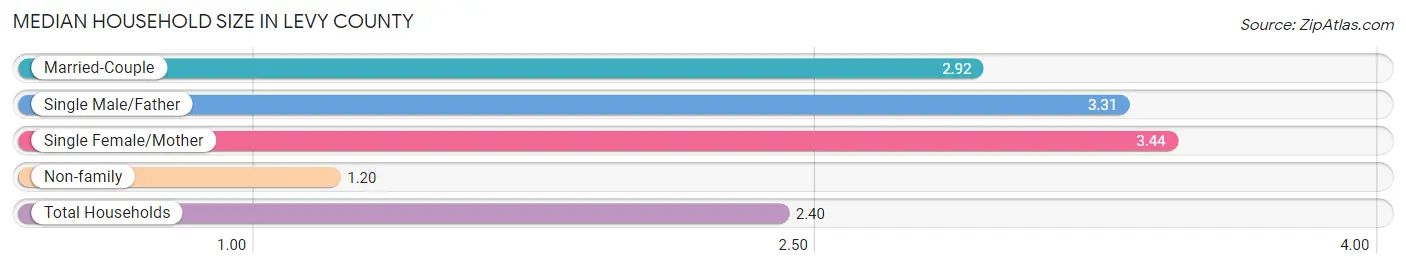
Median Household Size in Levy County
The median household size in Levy County is 2.40 persons per household, with single female/mother households (2,176 | 12.2%) accounting for the largest median household size of 3.44 persons per household. non-family households (6,270 | 35.1%) represent the smallest median household size with 1.20 persons per household.
| Household Type | # Households | Household Size |
| Married-Couple | 8,277 (46.4%) | 2.92 |
| Single Male/Father | 1,120 (6.3%) | 3.31 |
| Single Female/Mother | 2,176 (12.2%) | 3.44 |
| Non-family | 6,270 (35.1%) | 1.20 |
| Total Households | 17,843 (100.0%) | 2.40 |
Household Size by Marriage Status in Levy County
Out of a total of 17,843 households in Levy County, 11,573 (64.9%) are family households, while 6,270 (35.1%) are nonfamily households. The most numerous type of family households are 2-person households, comprising 5,936, and the most common type of nonfamily households are 1-person households, comprising 5,344.
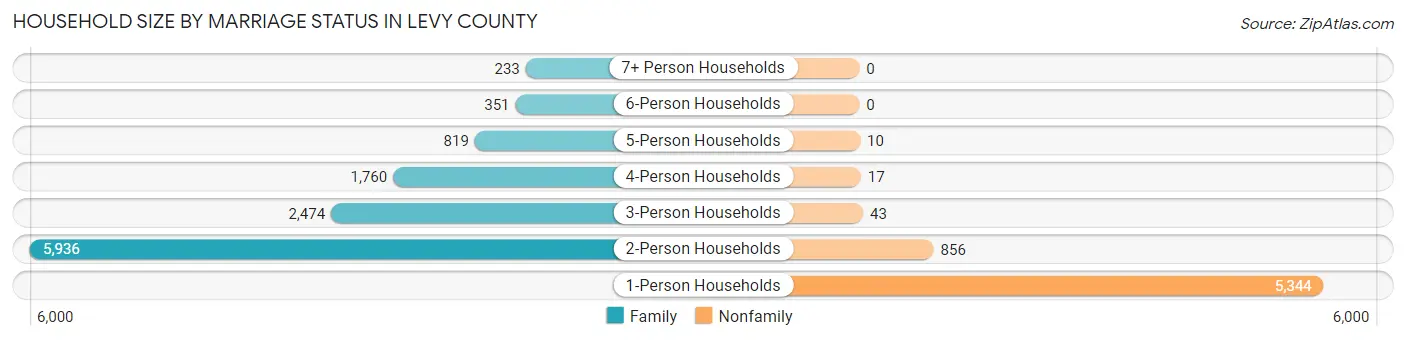
| Household Size | Family Households | Nonfamily Households |
| 1-Person Households | - | 5,344 (29.9%) |
| 2-Person Households | 5,936 (33.3%) | 856 (4.8%) |
| 3-Person Households | 2,474 (13.9%) | 43 (0.2%) |
| 4-Person Households | 1,760 (9.9%) | 17 (0.1%) |
| 5-Person Households | 819 (4.6%) | 10 (0.1%) |
| 6-Person Households | 351 (2.0%) | 0 (0.0%) |
| 7+ Person Households | 233 (1.3%) | 0 (0.0%) |
| Total | 11,573 (64.9%) | 6,270 (35.1%) |
Female Fertility in Levy County
Fertility by Age in Levy County
Average fertility rate in Levy County is 64.0 births per 1,000 women. Women in the age bracket of 20 to 34 years have the highest fertility rate with 109.0 births per 1,000 women. Women in the age bracket of 20 to 34 years acount for 68.4% of all women with births.
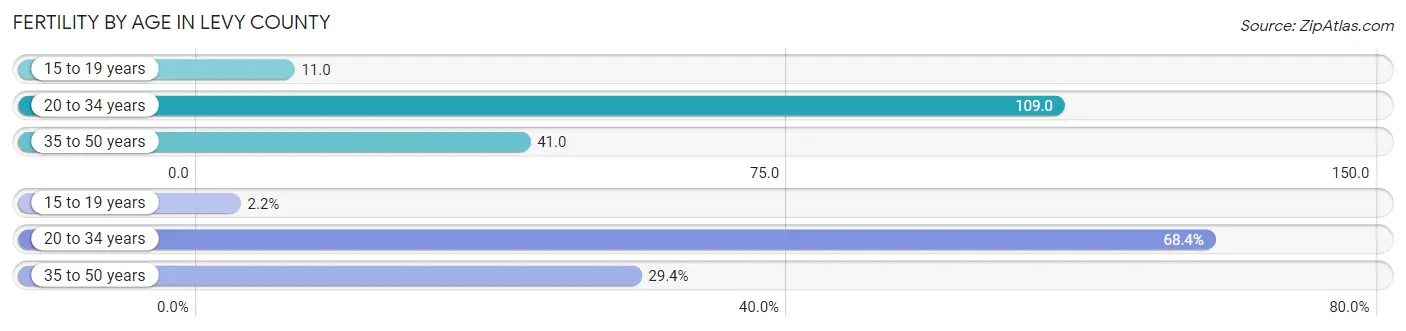
| Age Bracket | Women with Births | Births / 1,000 Women |
| 15 to 19 years | 12 (2.2%) | 11.0 |
| 20 to 34 years | 372 (68.4%) | 109.0 |
| 35 to 50 years | 160 (29.4%) | 41.0 |
| Total | 544 (100.0%) | 64.0 |
Fertility by Age by Marriage Status in Levy County
49.8% of women with births (544) in Levy County are married. The highest percentage of unmarried women with births falls into 15 to 19 years age bracket with 100.0% of them unmarried at the time of birth, while the lowest percentage of unmarried women with births belong to 35 to 50 years age bracket with 41.9% of them unmarried.
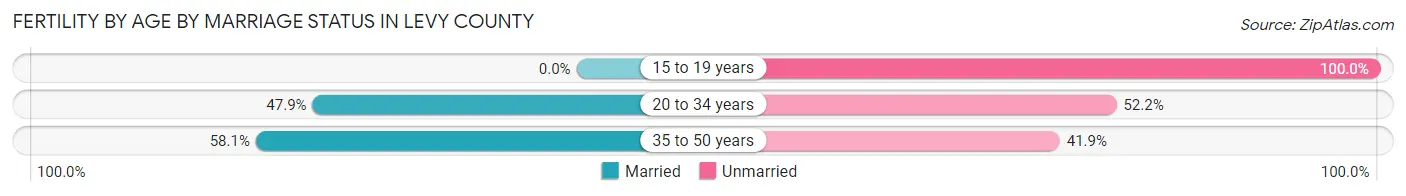
| Age Bracket | Married | Unmarried |
| 15 to 19 years | 0 (0.0%) | 12 (100.0%) |
| 20 to 34 years | 178 (47.8%) | 194 (52.1%) |
| 35 to 50 years | 93 (58.1%) | 67 (41.9%) |
| Total | 271 (49.8%) | 273 (50.2%) |
Fertility by Education in Levy County
Average fertility rate in Levy County is 64.0 births per 1,000 women. Women with the education attainment of graduate degree have the highest fertility rate of 115.0 births per 1,000 women, while women with the education attainment of college or associate's degree have the lowest fertility at 48.0 births per 1,000 women. Women with the education attainment of high school diploma represent 44.9% of all women with births.
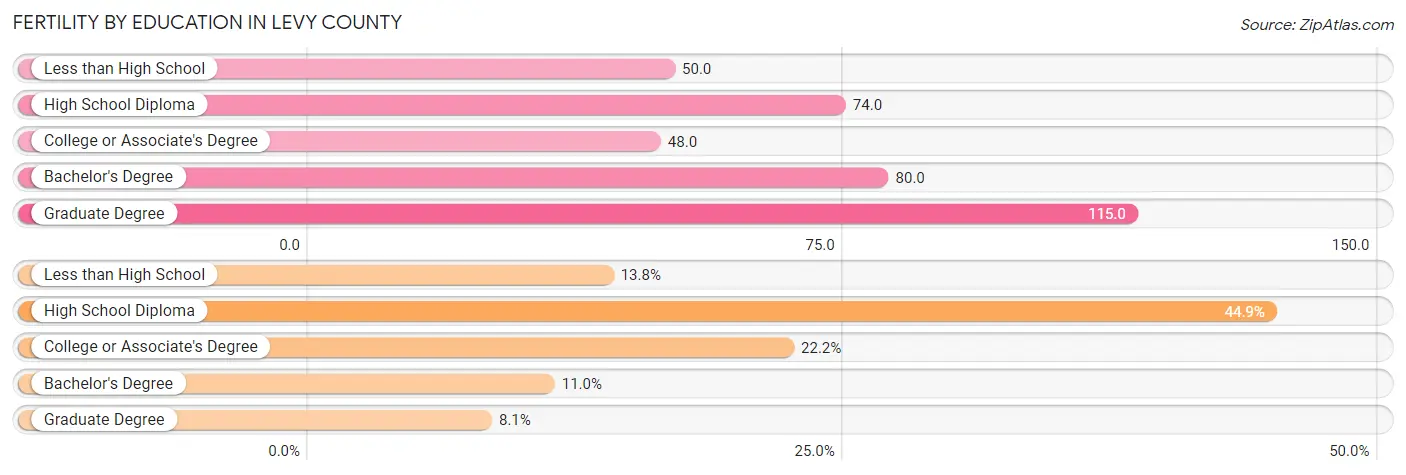
| Educational Attainment | Women with Births | Births / 1,000 Women |
| Less than High School | 75 (13.8%) | 50.0 |
| High School Diploma | 244 (44.9%) | 74.0 |
| College or Associate's Degree | 121 (22.2%) | 48.0 |
| Bachelor's Degree | 60 (11.0%) | 80.0 |
| Graduate Degree | 44 (8.1%) | 115.0 |
| Total | 544 (100.0%) | 64.0 |
Fertility by Education by Marriage Status in Levy County
50.2% of women with births in Levy County are unmarried. Women with the educational attainment of bachelor's degree are most likely to be married with 100.0% of them married at childbirth, while women with the educational attainment of less than high school are least likely to be married with 78.7% of them unmarried at childbirth.
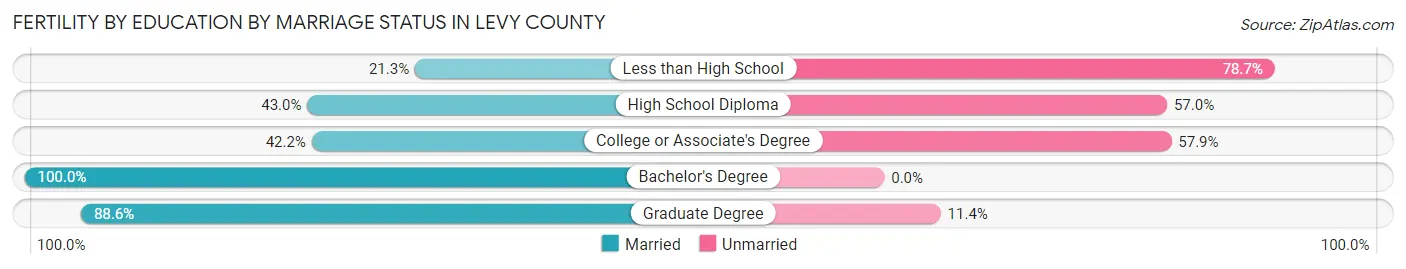
| Educational Attainment | Married | Unmarried |
| Less than High School | 16 (21.3%) | 59 (78.7%) |
| High School Diploma | 105 (43.0%) | 139 (57.0%) |
| College or Associate's Degree | 51 (42.1%) | 70 (57.9%) |
| Bachelor's Degree | 60 (100.0%) | 0 (0.0%) |
| Graduate Degree | 39 (88.6%) | 5 (11.4%) |
| Total | 271 (49.8%) | 273 (50.2%) |
Employment Characteristics in Levy County
Employment by Class of Employer in Levy County
Among the 16,885 employed individuals in Levy County, private company employees (10,536 | 62.4%), local government employees (1,732 | 10.3%), and self-employed (incorporated) (1,279 | 7.6%) make up the most common classes of employment.
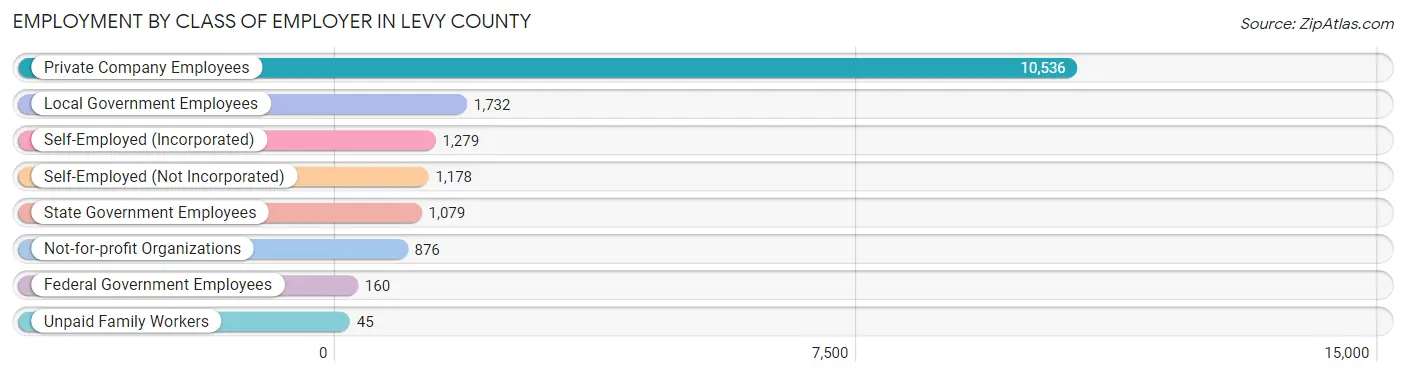
| Employer Class | # Employees | % Employees |
| Private Company Employees | 10,536 | 62.4% |
| Self-Employed (Incorporated) | 1,279 | 7.6% |
| Self-Employed (Not Incorporated) | 1,178 | 7.0% |
| Not-for-profit Organizations | 876 | 5.2% |
| Local Government Employees | 1,732 | 10.3% |
| State Government Employees | 1,079 | 6.4% |
| Federal Government Employees | 160 | 0.9% |
| Unpaid Family Workers | 45 | 0.3% |
| Total | 16,885 | 100.0% |
Employment Status by Age in Levy County
According to the labor force statistics for Levy County, out of the total population over 16 years of age (35,654), 50.5% or 18,005 individuals are in the labor force, with 4.4% or 792 of them unemployed. The age group with the highest labor force participation rate is 25 to 29 years, with 83.5% or 1,885 individuals in the labor force. Within the labor force, the 65 to 74 years age range has the highest percentage of unemployed individuals, with 8.6% or 96 of them being unemployed.
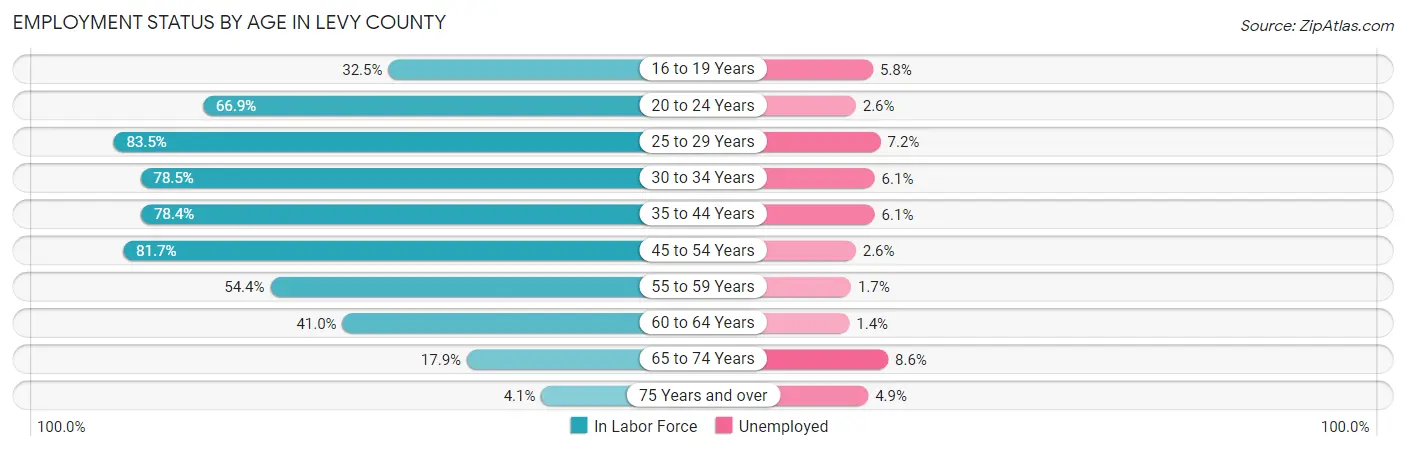
| Age Bracket | In Labor Force | Unemployed |
| 16 to 19 Years | 533 (32.5%) | 31 (5.8%) |
| 20 to 24 Years | 1,474 (66.9%) | 38 (2.6%) |
| 25 to 29 Years | 1,885 (83.5%) | 136 (7.2%) |
| 30 to 34 Years | 1,897 (78.5%) | 116 (6.1%) |
| 35 to 44 Years | 3,421 (78.4%) | 209 (6.1%) |
| 45 to 54 Years | 4,289 (81.7%) | 112 (2.6%) |
| 55 to 59 Years | 1,760 (54.4%) | 30 (1.7%) |
| 60 to 64 Years | 1,471 (41.0%) | 21 (1.4%) |
| 65 to 74 Years | 1,111 (17.9%) | 96 (8.6%) |
| 75 Years and over | 184 (4.1%) | 9 (4.9%) |
| Total | 18,005 (50.5%) | 792 (4.4%) |
Employment Status by Educational Attainment in Levy County
According to labor force statistics for Levy County, 69.7% of individuals (14,715) out of the total population between 25 and 64 years of age (21,112) are in the labor force, with 4.2% or 618 of them being unemployed. The group with the highest labor force participation rate are those with the educational attainment of bachelor's degree or higher, with 79.5% or 2,393 individuals in the labor force. Within the labor force, individuals with less than high school education have the highest percentage of unemployment, with 8.0% or 123 of them being unemployed.
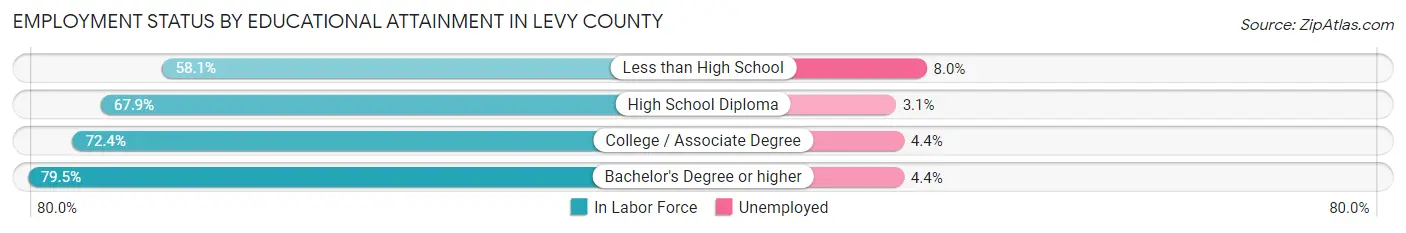
| Educational Attainment | In Labor Force | Unemployed |
| Less than High School | 1,538 (58.1%) | 212 (8.0%) |
| High School Diploma | 6,110 (67.9%) | 279 (3.1%) |
| College / Associate Degree | 4,675 (72.4%) | 284 (4.4%) |
| Bachelor's Degree or higher | 2,393 (79.5%) | 132 (4.4%) |
| Total | 14,715 (69.7%) | 887 (4.2%) |
Employment Occupations by Sex in Levy County
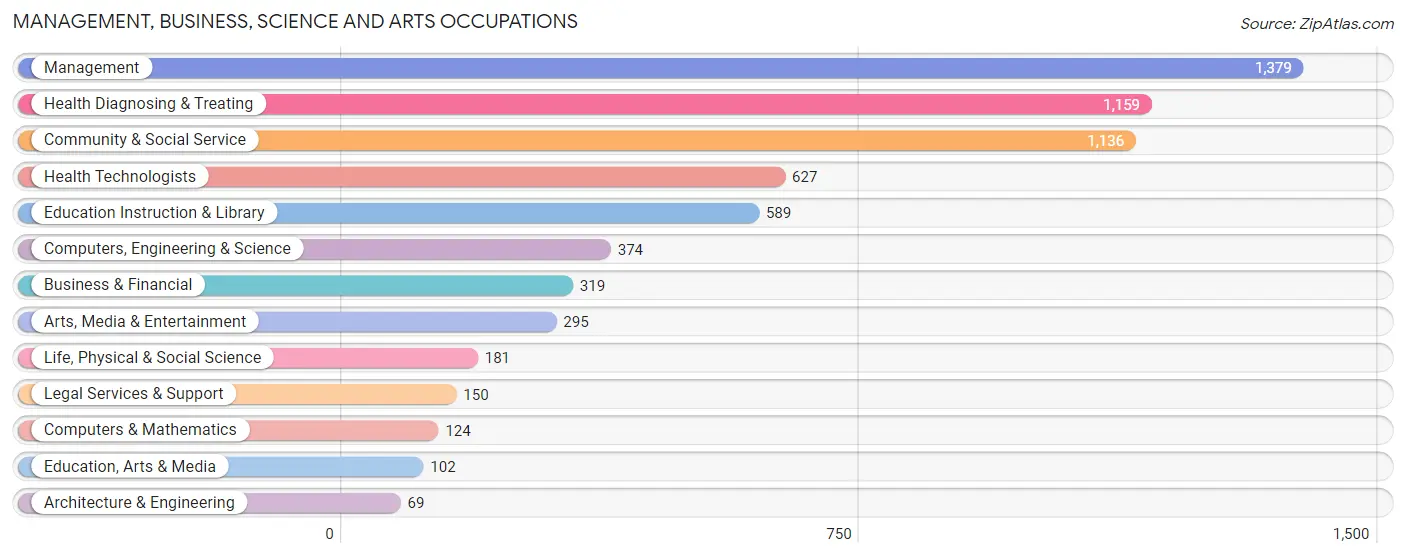
Management, Business, Science and Arts Occupations
The most common Management, Business, Science and Arts occupations in Levy County are Management (1,379 | 8.0%), Health Diagnosing & Treating (1,159 | 6.7%), Community & Social Service (1,136 | 6.6%), Health Technologists (627 | 3.6%), and Education Instruction & Library (589 | 3.4%).
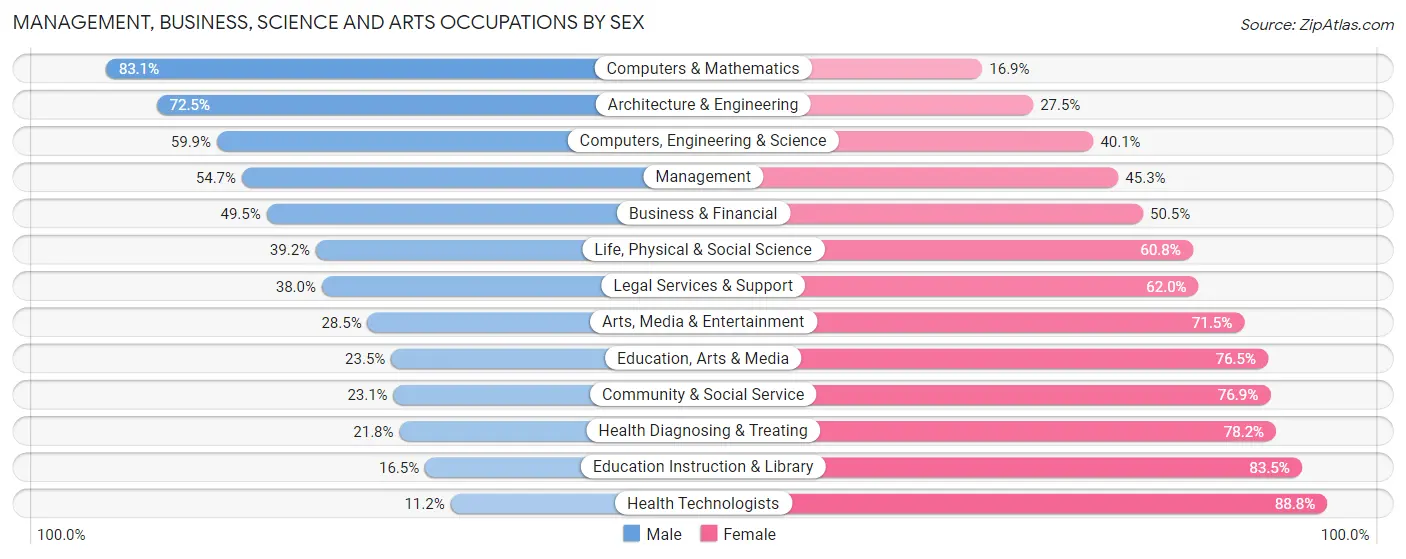
Management, Business, Science and Arts Occupations by Sex
Within the Management, Business, Science and Arts occupations in Levy County, the most male-oriented occupations are Computers & Mathematics (83.1%), Architecture & Engineering (72.5%), and Computers, Engineering & Science (59.9%), while the most female-oriented occupations are Health Technologists (88.8%), Education Instruction & Library (83.5%), and Health Diagnosing & Treating (78.2%).
| Occupation | Male | Female |
| Management | 754 (54.7%) | 625 (45.3%) |
| Business & Financial | 158 (49.5%) | 161 (50.5%) |
| Computers, Engineering & Science | 224 (59.9%) | 150 (40.1%) |
| Computers & Mathematics | 103 (83.1%) | 21 (16.9%) |
| Architecture & Engineering | 50 (72.5%) | 19 (27.5%) |
| Life, Physical & Social Science | 71 (39.2%) | 110 (60.8%) |
| Community & Social Service | 262 (23.1%) | 874 (76.9%) |
| Education, Arts & Media | 24 (23.5%) | 78 (76.5%) |
| Legal Services & Support | 57 (38.0%) | 93 (62.0%) |
| Education Instruction & Library | 97 (16.5%) | 492 (83.5%) |
| Arts, Media & Entertainment | 84 (28.5%) | 211 (71.5%) |
| Health Diagnosing & Treating | 253 (21.8%) | 906 (78.2%) |
| Health Technologists | 70 (11.2%) | 557 (88.8%) |
| Total (Category) | 1,651 (37.8%) | 2,716 (62.2%) |
| Total (Overall) | 8,768 (50.9%) | 8,454 (49.1%) |
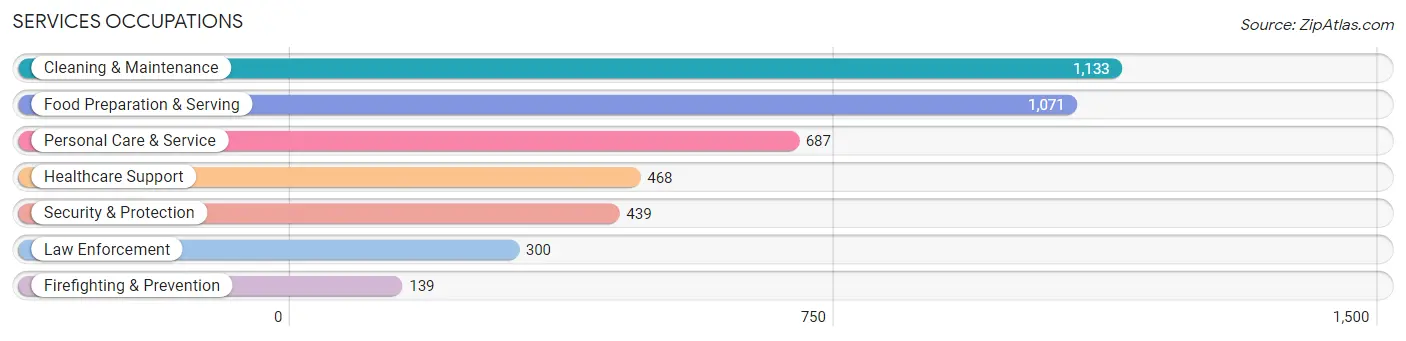
Services Occupations
The most common Services occupations in Levy County are Cleaning & Maintenance (1,133 | 6.6%), Food Preparation & Serving (1,071 | 6.2%), Personal Care & Service (687 | 4.0%), Healthcare Support (468 | 2.7%), and Security & Protection (439 | 2.5%).
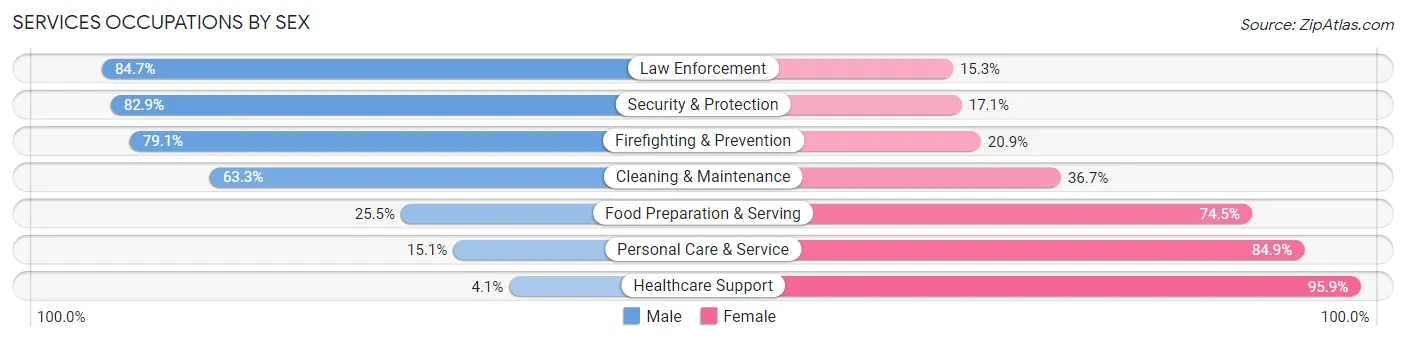
Services Occupations by Sex
Within the Services occupations in Levy County, the most male-oriented occupations are Law Enforcement (84.7%), Security & Protection (82.9%), and Firefighting & Prevention (79.1%), while the most female-oriented occupations are Healthcare Support (95.9%), Personal Care & Service (84.9%), and Food Preparation & Serving (74.5%).
| Occupation | Male | Female |
| Healthcare Support | 19 (4.1%) | 449 (95.9%) |
| Security & Protection | 364 (82.9%) | 75 (17.1%) |
| Firefighting & Prevention | 110 (79.1%) | 29 (20.9%) |
| Law Enforcement | 254 (84.7%) | 46 (15.3%) |
| Food Preparation & Serving | 273 (25.5%) | 798 (74.5%) |
| Cleaning & Maintenance | 717 (63.3%) | 416 (36.7%) |
| Personal Care & Service | 104 (15.1%) | 583 (84.9%) |
| Total (Category) | 1,477 (38.9%) | 2,321 (61.1%) |
| Total (Overall) | 8,768 (50.9%) | 8,454 (49.1%) |
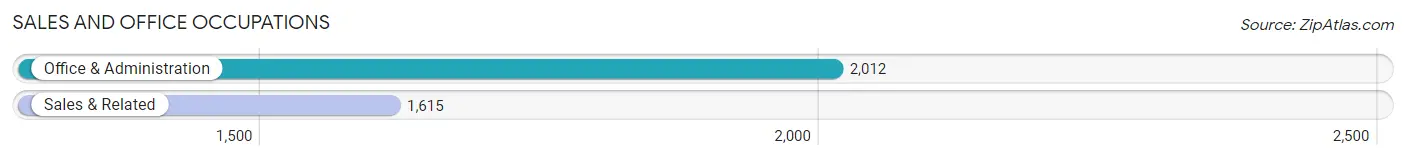
Sales and Office Occupations
The most common Sales and Office occupations in Levy County are Office & Administration (2,012 | 11.7%), and Sales & Related (1,615 | 9.4%).
Sales and Office Occupations by Sex
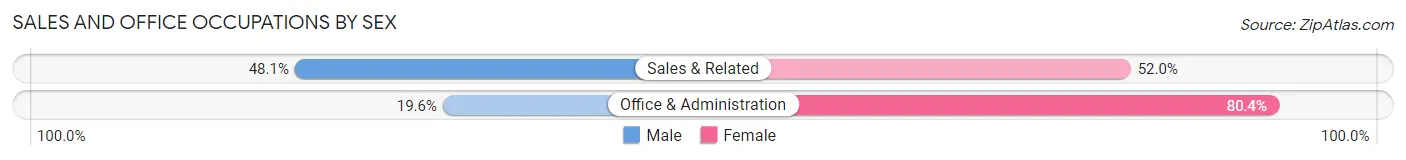
| Occupation | Male | Female |
| Sales & Related | 776 (48.0%) | 839 (51.9%) |
| Office & Administration | 394 (19.6%) | 1,618 (80.4%) |
| Total (Category) | 1,170 (32.3%) | 2,457 (67.7%) |
| Total (Overall) | 8,768 (50.9%) | 8,454 (49.1%) |
Natural Resources, Construction and Maintenance Occupations
The most common Natural Resources, Construction and Maintenance occupations in Levy County are Construction & Extraction (1,418 | 8.2%), Installation, Maintenance & Repair (1,136 | 6.6%), and Farming, Fishing & Forestry (464 | 2.7%).
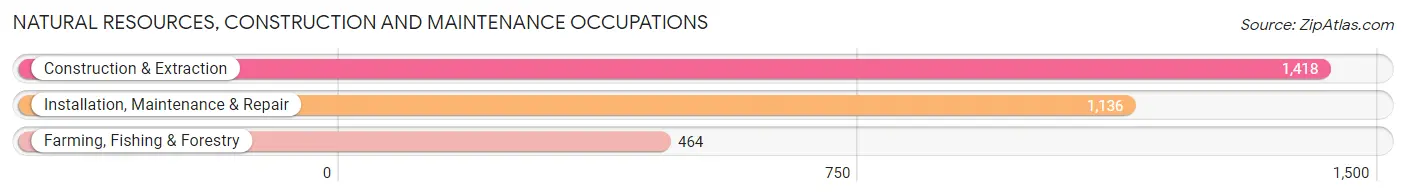
Natural Resources, Construction and Maintenance Occupations by Sex
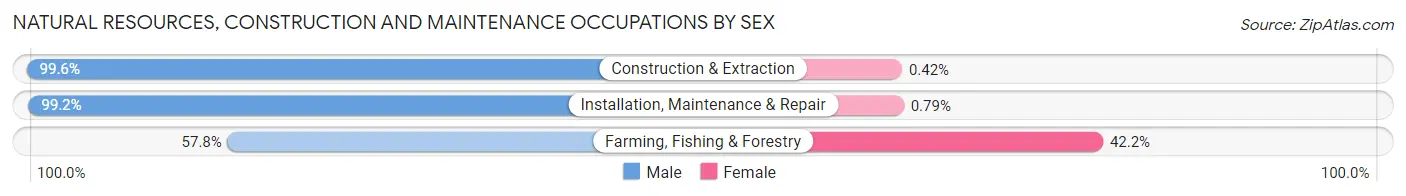
| Occupation | Male | Female |
| Farming, Fishing & Forestry | 268 (57.8%) | 196 (42.2%) |
| Construction & Extraction | 1,412 (99.6%) | 6 (0.4%) |
| Installation, Maintenance & Repair | 1,127 (99.2%) | 9 (0.8%) |
| Total (Category) | 2,807 (93.0%) | 211 (7.0%) |
| Total (Overall) | 8,768 (50.9%) | 8,454 (49.1%) |
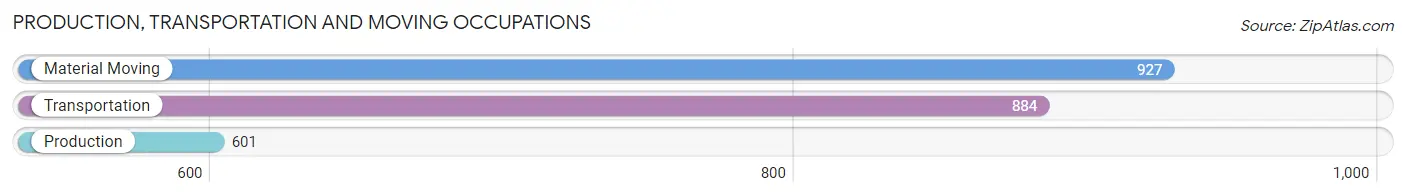
Production, Transportation and Moving Occupations
The most common Production, Transportation and Moving occupations in Levy County are Material Moving (927 | 5.4%), Transportation (884 | 5.1%), and Production (601 | 3.5%).
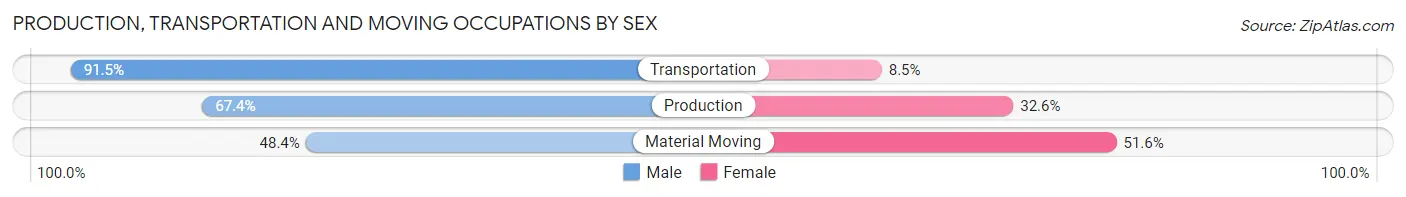
Production, Transportation and Moving Occupations by Sex
| Occupation | Male | Female |
| Production | 405 (67.4%) | 196 (32.6%) |
| Transportation | 809 (91.5%) | 75 (8.5%) |
| Material Moving | 449 (48.4%) | 478 (51.6%) |
| Total (Category) | 1,663 (69.0%) | 749 (31.0%) |
| Total (Overall) | 8,768 (50.9%) | 8,454 (49.1%) |
Employment Industries by Sex in Levy County
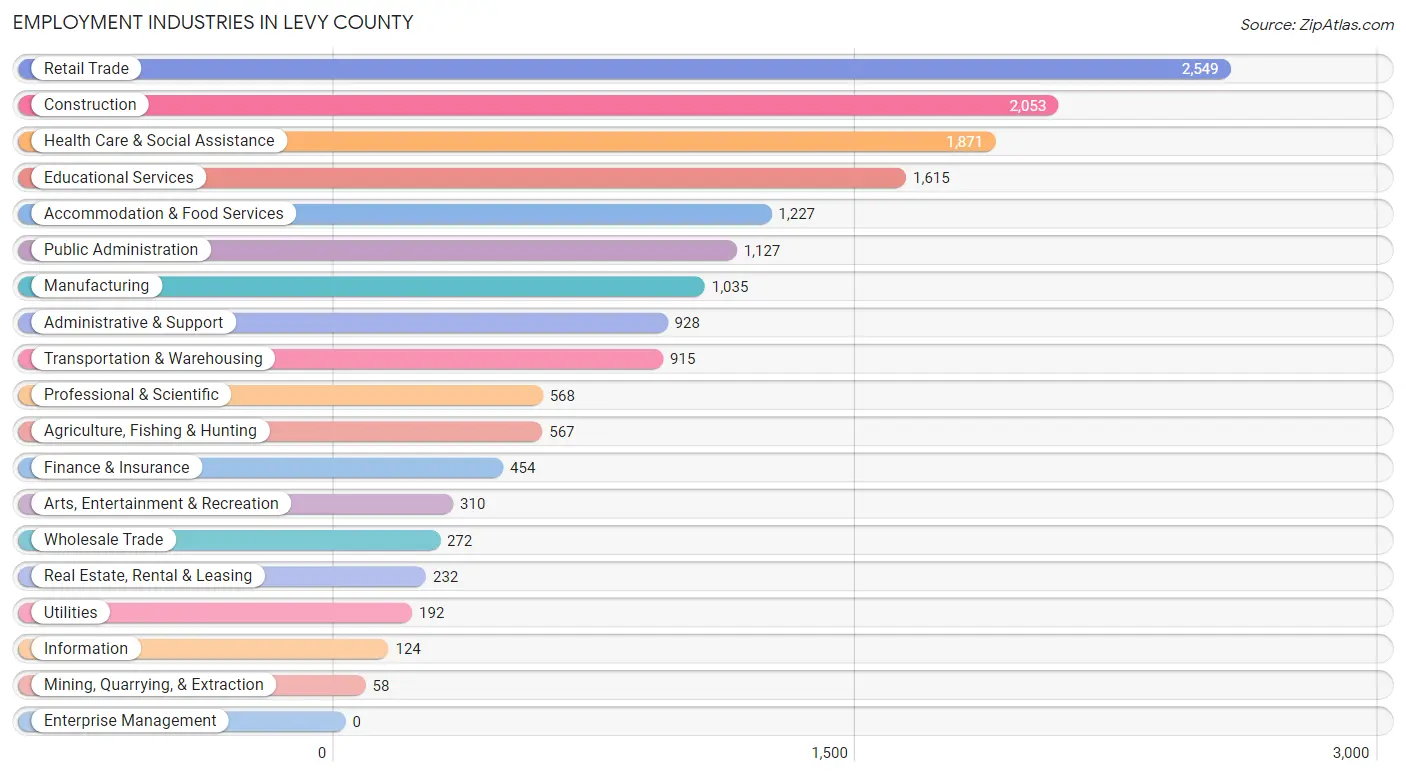
Employment Industries in Levy County
The major employment industries in Levy County include Retail Trade (2,549 | 14.8%), Construction (2,053 | 11.9%), Health Care & Social Assistance (1,871 | 10.9%), Educational Services (1,615 | 9.4%), and Accommodation & Food Services (1,227 | 7.1%).
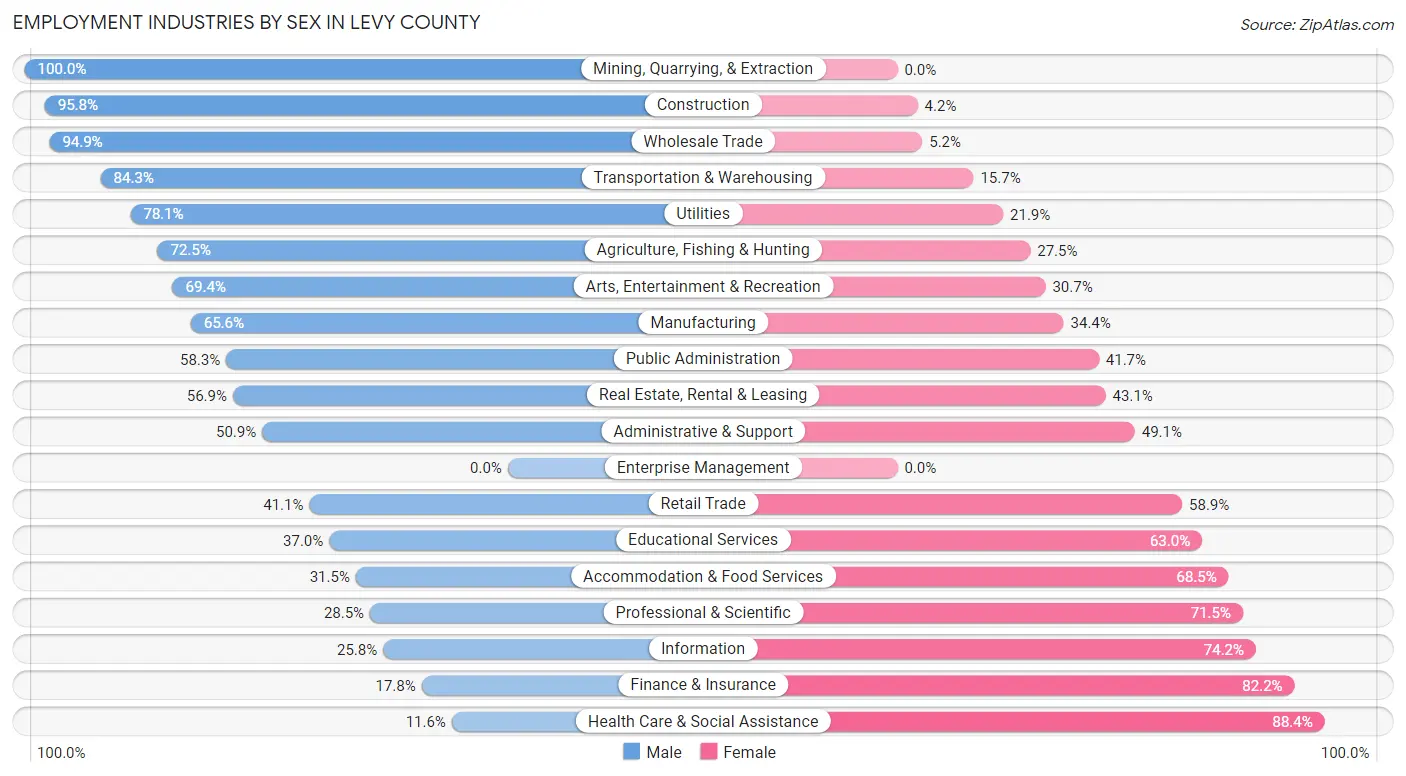
Employment Industries by Sex in Levy County
The Levy County industries that see more men than women are Mining, Quarrying, & Extraction (100.0%), Construction (95.8%), and Wholesale Trade (94.9%), whereas the industries that tend to have a higher number of women are Health Care & Social Assistance (88.4%), Finance & Insurance (82.2%), and Information (74.2%).
| Industry | Male | Female |
| Agriculture, Fishing & Hunting | 411 (72.5%) | 156 (27.5%) |
| Mining, Quarrying, & Extraction | 58 (100.0%) | 0 (0.0%) |
| Construction | 1,967 (95.8%) | 86 (4.2%) |
| Manufacturing | 679 (65.6%) | 356 (34.4%) |
| Wholesale Trade | 258 (94.9%) | 14 (5.1%) |
| Retail Trade | 1,047 (41.1%) | 1,502 (58.9%) |
| Transportation & Warehousing | 771 (84.3%) | 144 (15.7%) |
| Utilities | 150 (78.1%) | 42 (21.9%) |
| Information | 32 (25.8%) | 92 (74.2%) |
| Finance & Insurance | 81 (17.8%) | 373 (82.2%) |
| Real Estate, Rental & Leasing | 132 (56.9%) | 100 (43.1%) |
| Professional & Scientific | 162 (28.5%) | 406 (71.5%) |
| Enterprise Management | 0 (0.0%) | 0 (0.0%) |
| Administrative & Support | 472 (50.9%) | 456 (49.1%) |
| Educational Services | 597 (37.0%) | 1,018 (63.0%) |
| Health Care & Social Assistance | 217 (11.6%) | 1,654 (88.4%) |
| Arts, Entertainment & Recreation | 215 (69.4%) | 95 (30.6%) |
| Accommodation & Food Services | 386 (31.5%) | 841 (68.5%) |
| Public Administration | 657 (58.3%) | 470 (41.7%) |
| Total | 8,768 (50.9%) | 8,454 (49.1%) |
Education in Levy County
School Enrollment in Levy County
The most common levels of schooling among the 8,410 students in Levy County are middle school (2,170 | 25.8%), elementary school (2,087 | 24.8%), and high school (1,683 | 20.0%).
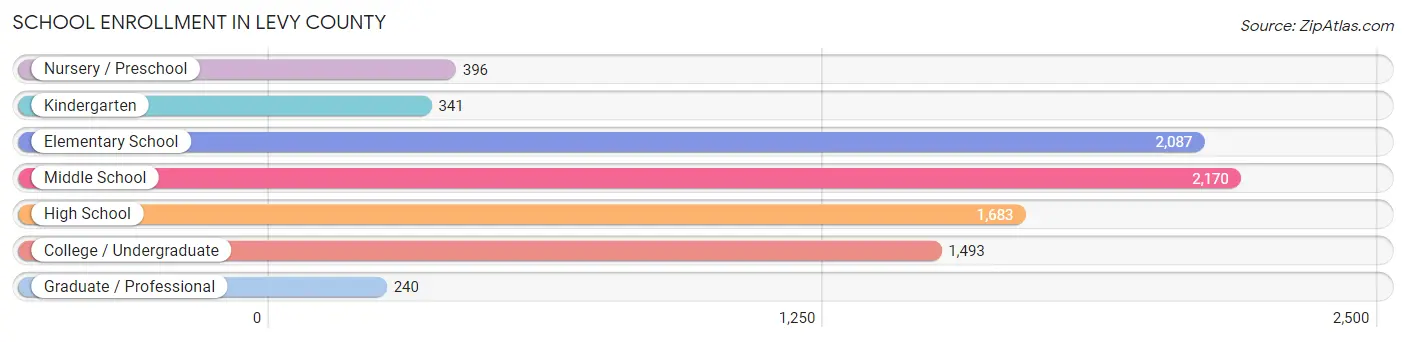
| School Level | # Students | % Students |
| Nursery / Preschool | 396 | 4.7% |
| Kindergarten | 341 | 4.1% |
| Elementary School | 2,087 | 24.8% |
| Middle School | 2,170 | 25.8% |
| High School | 1,683 | 20.0% |
| College / Undergraduate | 1,493 | 17.7% |
| Graduate / Professional | 240 | 2.9% |
| Total | 8,410 | 100.0% |
School Enrollment by Age by Funding Source in Levy County
Out of a total of 8,410 students who are enrolled in schools in Levy County, 1,228 (14.6%) attend a private institution, while the remaining 7,182 (85.4%) are enrolled in public schools. The age group of 3 to 4 year olds has the highest likelihood of being enrolled in private schools, with 89 (28.5% in the age bracket) enrolled. Conversely, the age group of 25 to 34 year olds has the lowest likelihood of being enrolled in a private school, with 367 (91.1% in the age bracket) attending a public institution.
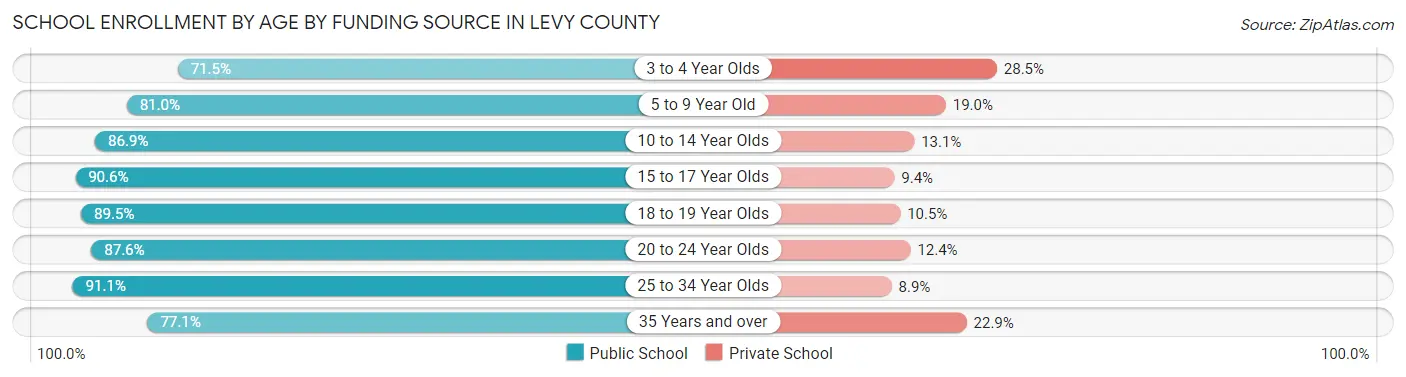
| Age Bracket | Public School | Private School |
| 3 to 4 Year Olds | 223 (71.5%) | 89 (28.5%) |
| 5 to 9 Year Old | 1,757 (81.0%) | 413 (19.0%) |
| 10 to 14 Year Olds | 2,241 (86.9%) | 339 (13.1%) |
| 15 to 17 Year Olds | 1,219 (90.6%) | 127 (9.4%) |
| 18 to 19 Year Olds | 561 (89.5%) | 66 (10.5%) |
| 20 to 24 Year Olds | 507 (87.6%) | 72 (12.4%) |
| 25 to 34 Year Olds | 367 (91.1%) | 36 (8.9%) |
| 35 Years and over | 303 (77.1%) | 90 (22.9%) |
| Total | 7,182 (85.4%) | 1,228 (14.6%) |
Educational Attainment by Field of Study in Levy County
Business (974 | 18.1%), education (754 | 14.1%), bio, nature & agricultural (651 | 12.1%), science & technology (533 | 9.9%), and social sciences (423 | 7.9%) are the most common fields of study among 5,366 individuals in Levy County who have obtained a bachelor's degree or higher.
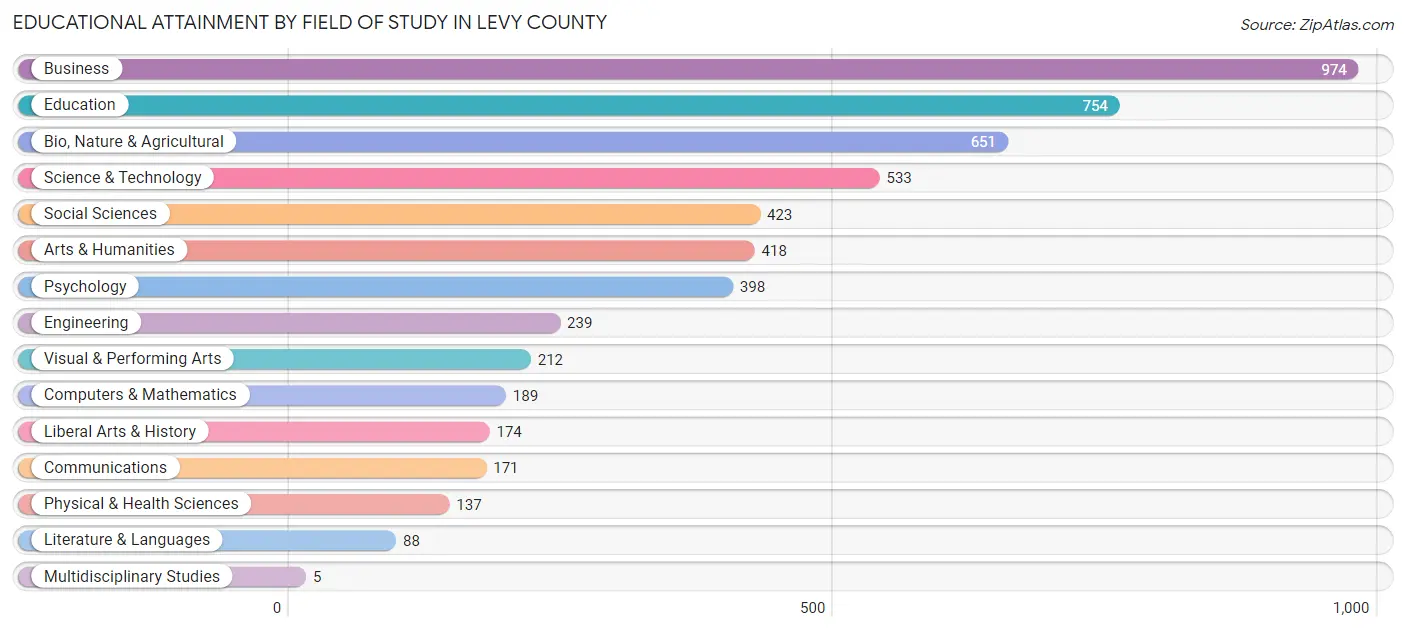
| Field of Study | # Graduates | % Graduates |
| Computers & Mathematics | 189 | 3.5% |
| Bio, Nature & Agricultural | 651 | 12.1% |
| Physical & Health Sciences | 137 | 2.5% |
| Psychology | 398 | 7.4% |
| Social Sciences | 423 | 7.9% |
| Engineering | 239 | 4.4% |
| Multidisciplinary Studies | 5 | 0.1% |
| Science & Technology | 533 | 9.9% |
| Business | 974 | 18.1% |
| Education | 754 | 14.1% |
| Literature & Languages | 88 | 1.6% |
| Liberal Arts & History | 174 | 3.2% |
| Visual & Performing Arts | 212 | 4.0% |
| Communications | 171 | 3.2% |
| Arts & Humanities | 418 | 7.8% |
| Total | 5,366 | 100.0% |
Transportation & Commute in Levy County
Vehicle Availability by Sex in Levy County
The most prevalent vehicle ownership categories in Levy County are males with 2 vehicles (3,633, accounting for 42.0%) and females with 2 vehicles (2,963, making up 44.3%).
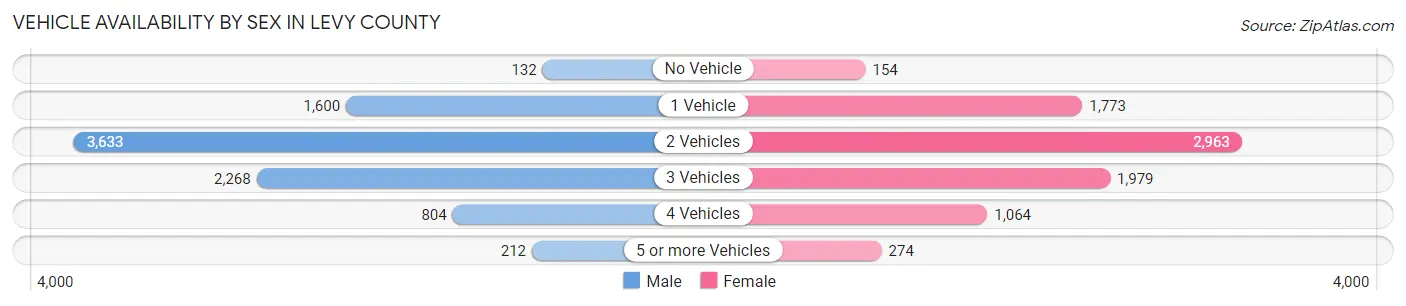
| Vehicles Available | Male | Female |
| No Vehicle | 132 (1.5%) | 154 (1.9%) |
| 1 Vehicle | 1,600 (18.5%) | 1,773 (21.6%) |
| 2 Vehicles | 3,633 (42.0%) | 2,963 (36.1%) |
| 3 Vehicles | 2,268 (26.2%) | 1,979 (24.1%) |
| 4 Vehicles | 804 (9.3%) | 1,064 (13.0%) |
| 5 or more Vehicles | 212 (2.5%) | 274 (3.3%) |
| Total | 8,649 (100.0%) | 8,207 (100.0%) |
Commute Time in Levy County
The most frequently occuring commute durations in Levy County are 30 to 34 minutes (2,196 commuters, 14.0%), 45 to 59 minutes (2,189 commuters, 13.9%), and 10 to 14 minutes (1,750 commuters, 11.2%).
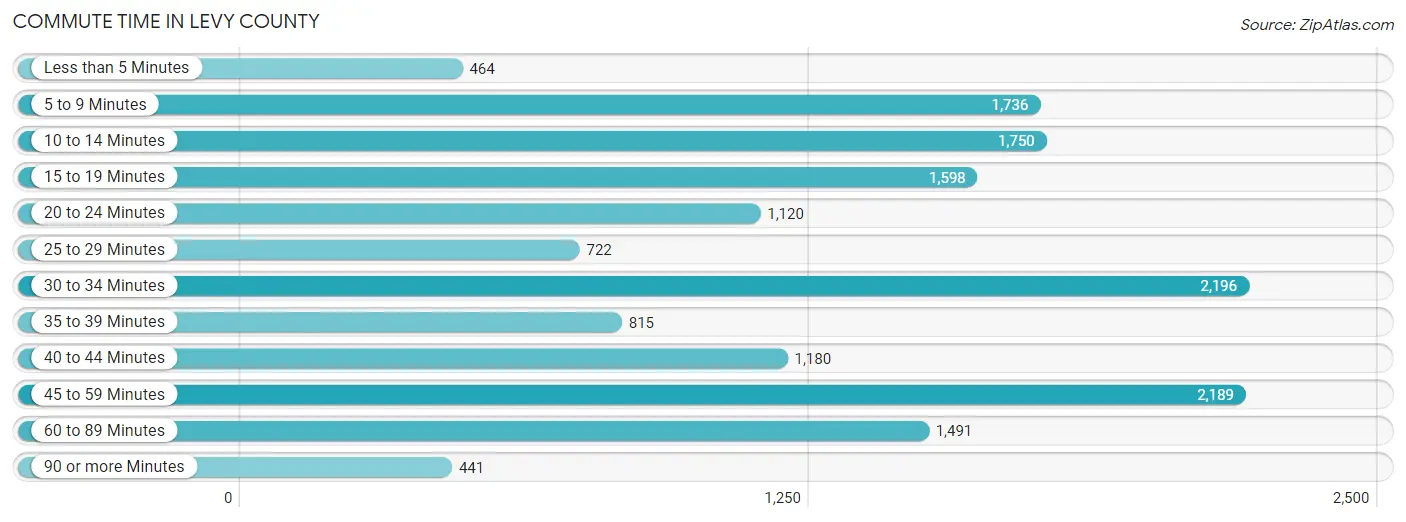
| Commute Time | # Commuters | % Commuters |
| Less than 5 Minutes | 464 | 3.0% |
| 5 to 9 Minutes | 1,736 | 11.1% |
| 10 to 14 Minutes | 1,750 | 11.2% |
| 15 to 19 Minutes | 1,598 | 10.2% |
| 20 to 24 Minutes | 1,120 | 7.1% |
| 25 to 29 Minutes | 722 | 4.6% |
| 30 to 34 Minutes | 2,196 | 14.0% |
| 35 to 39 Minutes | 815 | 5.2% |
| 40 to 44 Minutes | 1,180 | 7.5% |
| 45 to 59 Minutes | 2,189 | 13.9% |
| 60 to 89 Minutes | 1,491 | 9.5% |
| 90 or more Minutes | 441 | 2.8% |
Commute Time by Sex in Levy County
The most common commute times in Levy County are 45 to 59 minutes (1,362 commuters, 16.7%) for males and 30 to 34 minutes (1,063 commuters, 14.1%) for females.
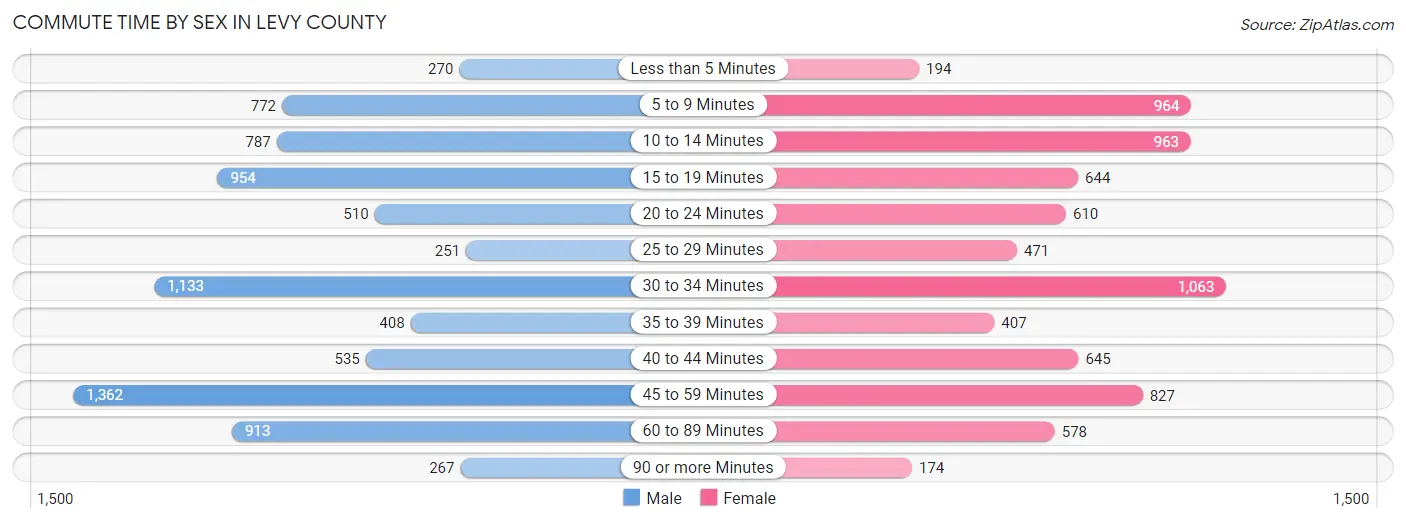
| Commute Time | Male | Female |
| Less than 5 Minutes | 270 (3.3%) | 194 (2.6%) |
| 5 to 9 Minutes | 772 (9.5%) | 964 (12.8%) |
| 10 to 14 Minutes | 787 (9.6%) | 963 (12.8%) |
| 15 to 19 Minutes | 954 (11.7%) | 644 (8.5%) |
| 20 to 24 Minutes | 510 (6.2%) | 610 (8.1%) |
| 25 to 29 Minutes | 251 (3.1%) | 471 (6.2%) |
| 30 to 34 Minutes | 1,133 (13.9%) | 1,063 (14.1%) |
| 35 to 39 Minutes | 408 (5.0%) | 407 (5.4%) |
| 40 to 44 Minutes | 535 (6.6%) | 645 (8.6%) |
| 45 to 59 Minutes | 1,362 (16.7%) | 827 (11.0%) |
| 60 to 89 Minutes | 913 (11.2%) | 578 (7.7%) |
| 90 or more Minutes | 267 (3.3%) | 174 (2.3%) |
Time of Departure to Work by Sex in Levy County
The most frequent times of departure to work in Levy County are 7:00 AM to 7:29 AM (1,458, 17.9%) for males and 7:00 AM to 7:29 AM (1,526, 20.2%) for females.
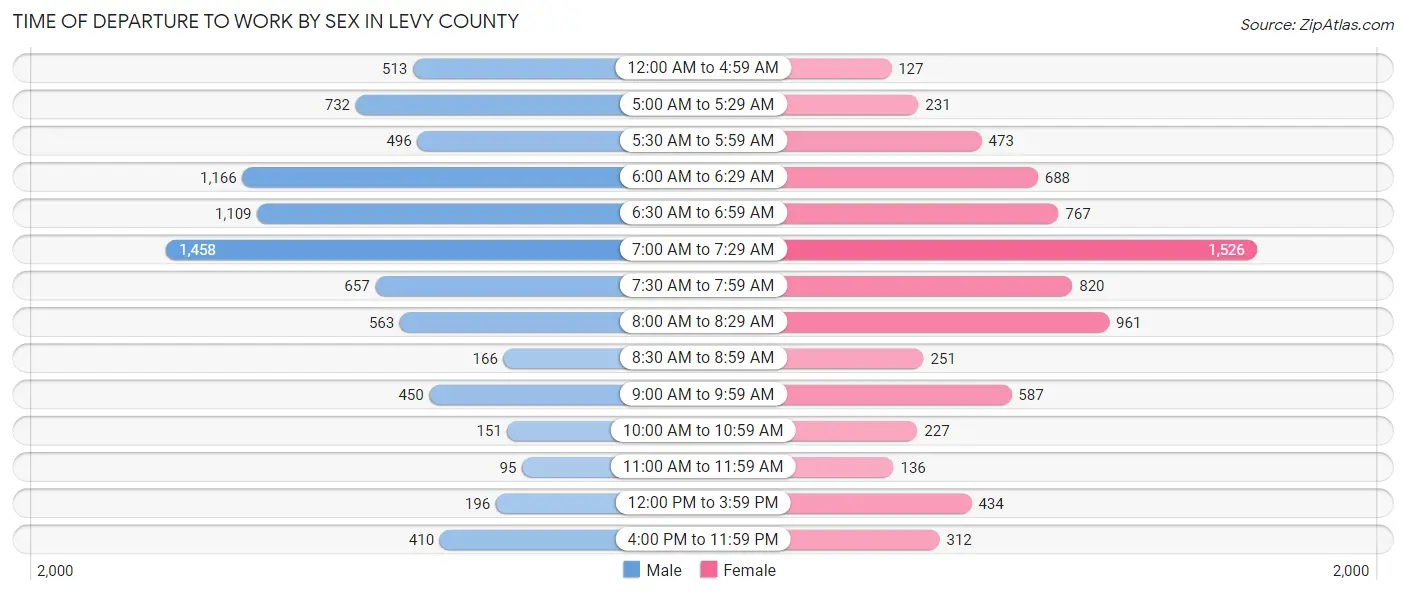
| Time of Departure | Male | Female |
| 12:00 AM to 4:59 AM | 513 (6.3%) | 127 (1.7%) |
| 5:00 AM to 5:29 AM | 732 (9.0%) | 231 (3.1%) |
| 5:30 AM to 5:59 AM | 496 (6.1%) | 473 (6.3%) |
| 6:00 AM to 6:29 AM | 1,166 (14.3%) | 688 (9.1%) |
| 6:30 AM to 6:59 AM | 1,109 (13.6%) | 767 (10.2%) |
| 7:00 AM to 7:29 AM | 1,458 (17.9%) | 1,526 (20.2%) |
| 7:30 AM to 7:59 AM | 657 (8.1%) | 820 (10.9%) |
| 8:00 AM to 8:29 AM | 563 (6.9%) | 961 (12.8%) |
| 8:30 AM to 8:59 AM | 166 (2.0%) | 251 (3.3%) |
| 9:00 AM to 9:59 AM | 450 (5.5%) | 587 (7.8%) |
| 10:00 AM to 10:59 AM | 151 (1.8%) | 227 (3.0%) |
| 11:00 AM to 11:59 AM | 95 (1.2%) | 136 (1.8%) |
| 12:00 PM to 3:59 PM | 196 (2.4%) | 434 (5.8%) |
| 4:00 PM to 11:59 PM | 410 (5.0%) | 312 (4.1%) |
| Total | 8,162 (100.0%) | 7,540 (100.0%) |
Housing Occupancy in Levy County
Occupancy by Ownership in Levy County
Of the total 17,843 dwellings in Levy County, owner-occupied units account for 14,207 (79.6%), while renter-occupied units make up 3,636 (20.4%).
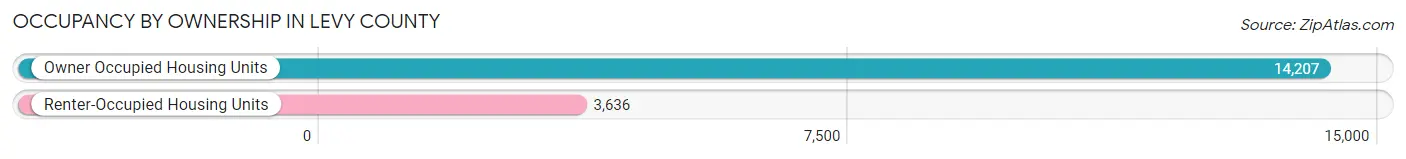
| Occupancy | # Housing Units | % Housing Units |
| Owner Occupied Housing Units | 14,207 | 79.6% |
| Renter-Occupied Housing Units | 3,636 | 20.4% |
| Total Occupied Housing Units | 17,843 | 100.0% |
Occupancy by Household Size in Levy County
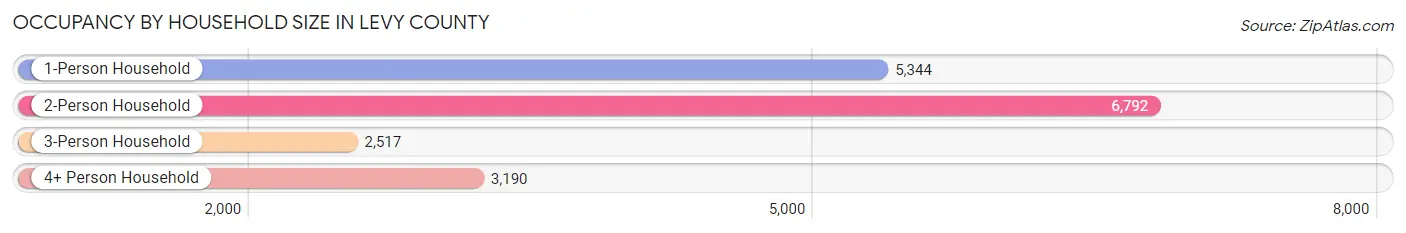
| Household Size | # Housing Units | % Housing Units |
| 1-Person Household | 5,344 | 29.9% |
| 2-Person Household | 6,792 | 38.1% |
| 3-Person Household | 2,517 | 14.1% |
| 4+ Person Household | 3,190 | 17.9% |
| Total Housing Units | 17,843 | 100.0% |
Occupancy by Ownership by Household Size in Levy County
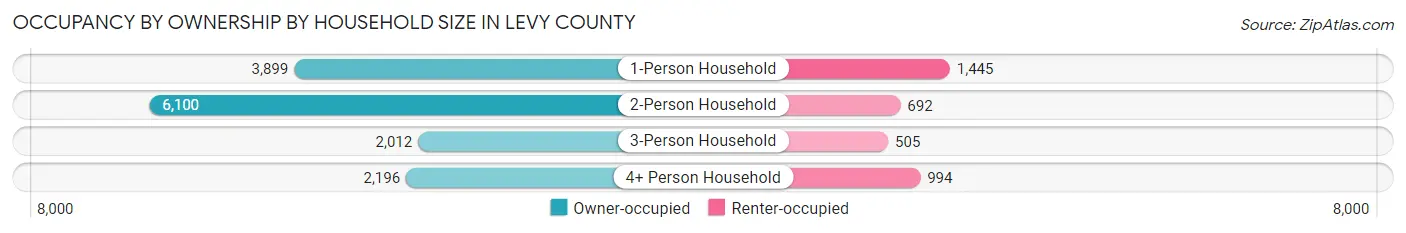
| Household Size | Owner-occupied | Renter-occupied |
| 1-Person Household | 3,899 (73.0%) | 1,445 (27.0%) |
| 2-Person Household | 6,100 (89.8%) | 692 (10.2%) |
| 3-Person Household | 2,012 (79.9%) | 505 (20.1%) |
| 4+ Person Household | 2,196 (68.8%) | 994 (31.2%) |
| Total Housing Units | 14,207 (79.6%) | 3,636 (20.4%) |
Occupancy by Educational Attainment in Levy County
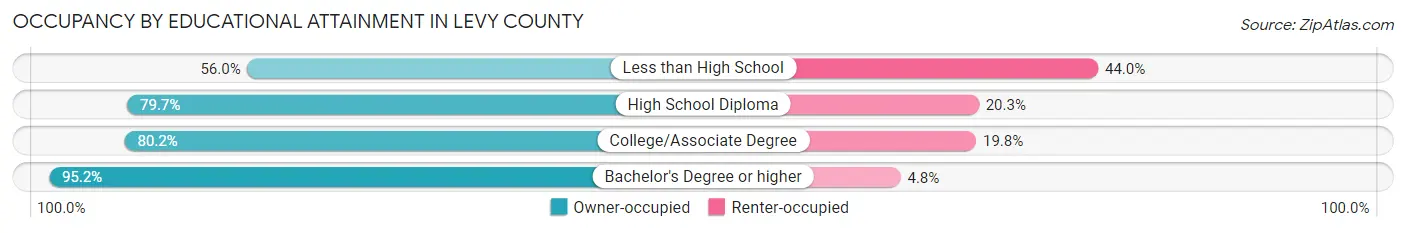
| Household Size | Owner-occupied | Renter-occupied |
| Less than High School | 1,282 (56.0%) | 1,007 (44.0%) |
| High School Diploma | 5,523 (79.7%) | 1,409 (20.3%) |
| College/Associate Degree | 4,306 (80.2%) | 1,063 (19.8%) |
| Bachelor's Degree or higher | 3,096 (95.2%) | 157 (4.8%) |
Occupancy by Age of Householder in Levy County
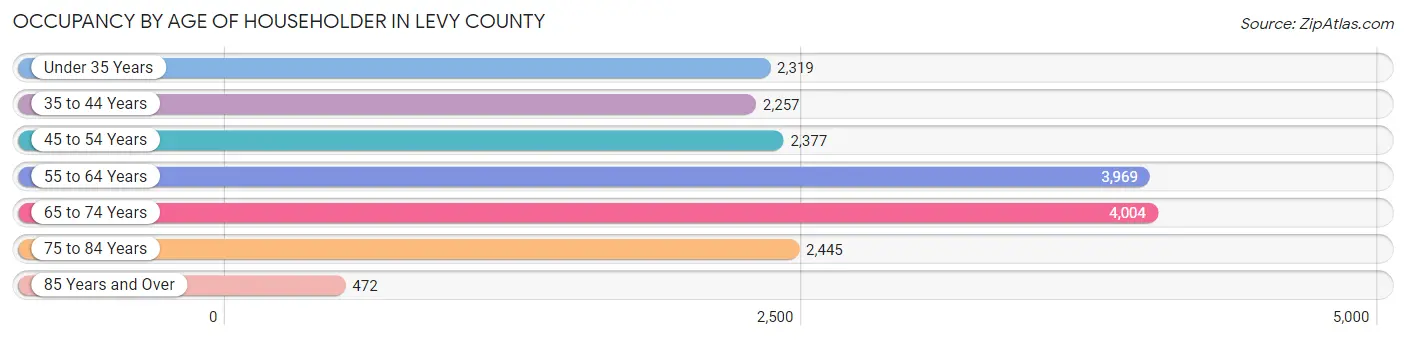
| Age Bracket | # Households | % Households |
| Under 35 Years | 2,319 | 13.0% |
| 35 to 44 Years | 2,257 | 12.7% |
| 45 to 54 Years | 2,377 | 13.3% |
| 55 to 64 Years | 3,969 | 22.2% |
| 65 to 74 Years | 4,004 | 22.4% |
| 75 to 84 Years | 2,445 | 13.7% |
| 85 Years and Over | 472 | 2.6% |
| Total | 17,843 | 100.0% |
Housing Finances in Levy County
Median Income by Occupancy in Levy County
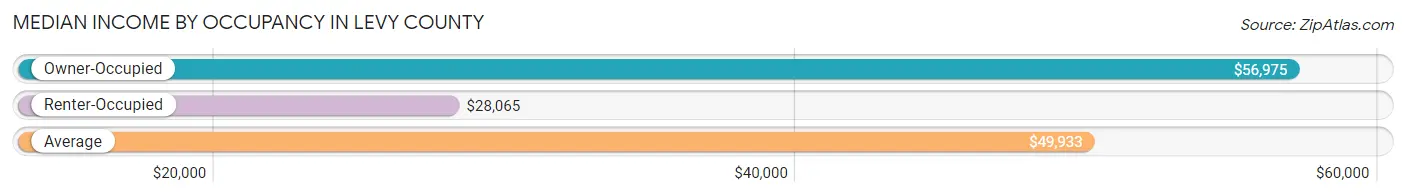
| Occupancy Type | # Households | Median Income |
| Owner-Occupied | 14,207 (79.6%) | $56,975 |
| Renter-Occupied | 3,636 (20.4%) | $28,065 |
| Average | 17,843 (100.0%) | $49,933 |
Occupancy by Householder Income Bracket in Levy County
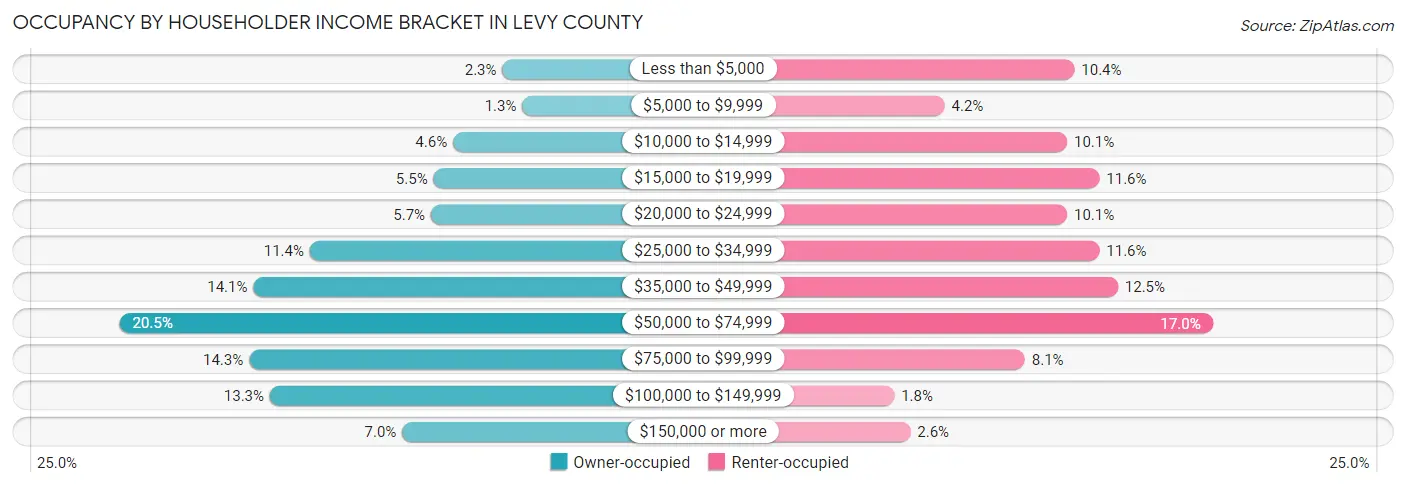
| Income Bracket | Owner-occupied | Renter-occupied |
| Less than $5,000 | 320 (2.2%) | 379 (10.4%) |
| $5,000 to $9,999 | 185 (1.3%) | 154 (4.2%) |
| $10,000 to $14,999 | 654 (4.6%) | 366 (10.1%) |
| $15,000 to $19,999 | 786 (5.5%) | 422 (11.6%) |
| $20,000 to $24,999 | 802 (5.7%) | 366 (10.1%) |
| $25,000 to $34,999 | 1,622 (11.4%) | 422 (11.6%) |
| $35,000 to $49,999 | 2,004 (14.1%) | 454 (12.5%) |
| $50,000 to $74,999 | 2,910 (20.5%) | 618 (17.0%) |
| $75,000 to $99,999 | 2,033 (14.3%) | 293 (8.1%) |
| $100,000 to $149,999 | 1,893 (13.3%) | 67 (1.8%) |
| $150,000 or more | 998 (7.0%) | 95 (2.6%) |
| Total | 14,207 (100.0%) | 3,636 (100.0%) |
Monthly Housing Cost Tiers in Levy County
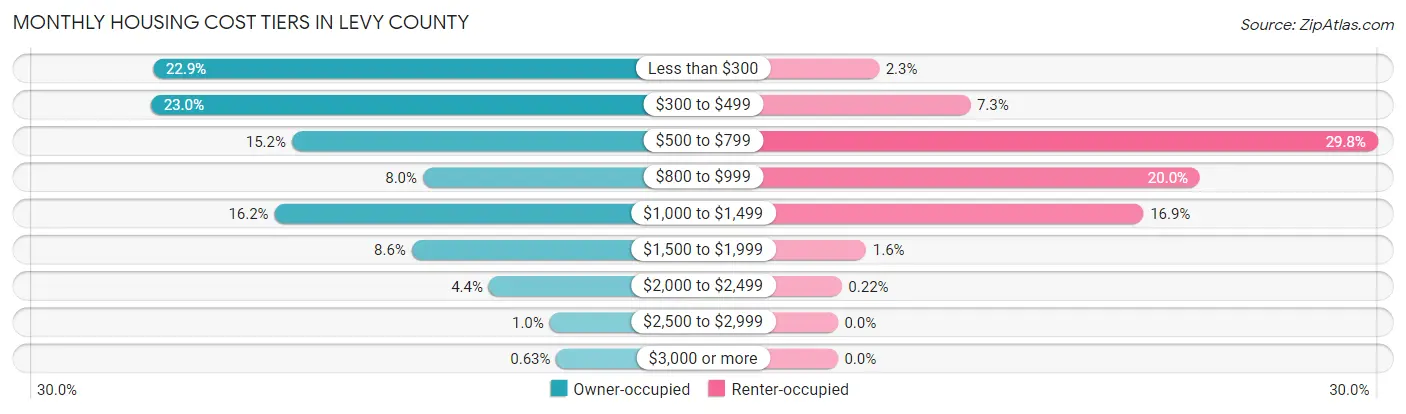
| Monthly Cost | Owner-occupied | Renter-occupied |
| Less than $300 | 3,255 (22.9%) | 83 (2.3%) |
| $300 to $499 | 3,272 (23.0%) | 266 (7.3%) |
| $500 to $799 | 2,165 (15.2%) | 1,085 (29.8%) |
| $800 to $999 | 1,136 (8.0%) | 728 (20.0%) |
| $1,000 to $1,499 | 2,302 (16.2%) | 614 (16.9%) |
| $1,500 to $1,999 | 1,225 (8.6%) | 57 (1.6%) |
| $2,000 to $2,499 | 620 (4.4%) | 8 (0.2%) |
| $2,500 to $2,999 | 142 (1.0%) | 0 (0.0%) |
| $3,000 or more | 90 (0.6%) | 0 (0.0%) |
| Total | 14,207 (100.0%) | 3,636 (100.0%) |
Physical Housing Characteristics in Levy County
Housing Structures in Levy County
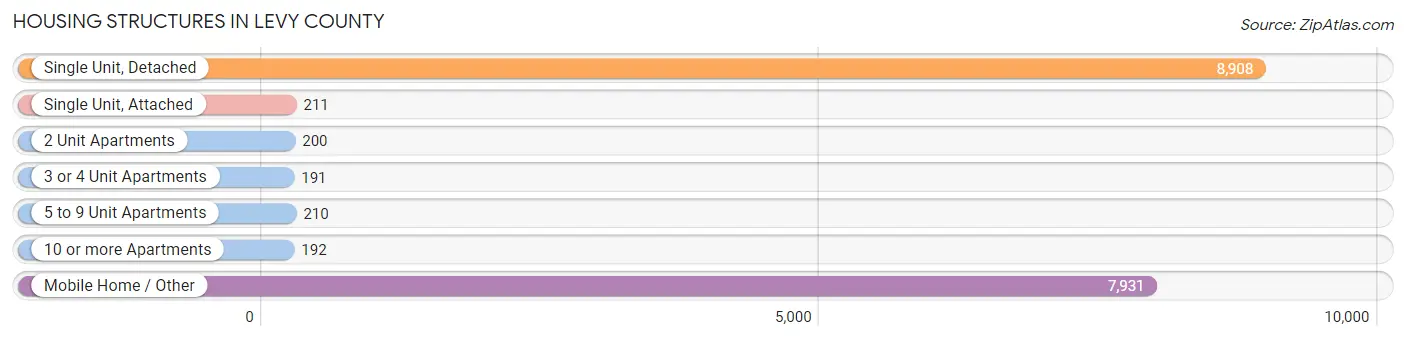
| Structure Type | # Housing Units | % Housing Units |
| Single Unit, Detached | 8,908 | 49.9% |
| Single Unit, Attached | 211 | 1.2% |
| 2 Unit Apartments | 200 | 1.1% |
| 3 or 4 Unit Apartments | 191 | 1.1% |
| 5 to 9 Unit Apartments | 210 | 1.2% |
| 10 or more Apartments | 192 | 1.1% |
| Mobile Home / Other | 7,931 | 44.5% |
| Total | 17,843 | 100.0% |
Housing Structures by Occupancy in Levy County
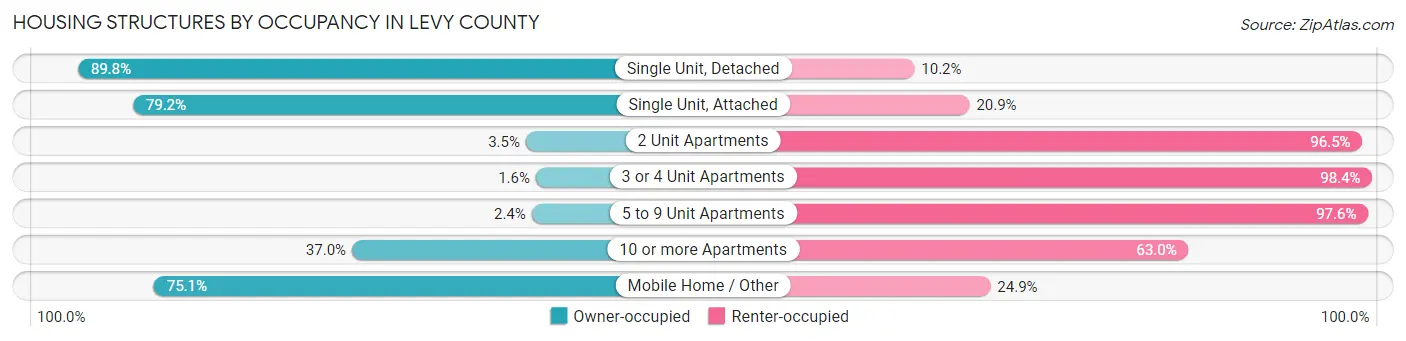
| Structure Type | Owner-occupied | Renter-occupied |
| Single Unit, Detached | 7,996 (89.8%) | 912 (10.2%) |
| Single Unit, Attached | 167 (79.1%) | 44 (20.8%) |
| 2 Unit Apartments | 7 (3.5%) | 193 (96.5%) |
| 3 or 4 Unit Apartments | 3 (1.6%) | 188 (98.4%) |
| 5 to 9 Unit Apartments | 5 (2.4%) | 205 (97.6%) |
| 10 or more Apartments | 71 (37.0%) | 121 (63.0%) |
| Mobile Home / Other | 5,958 (75.1%) | 1,973 (24.9%) |
| Total | 14,207 (79.6%) | 3,636 (20.4%) |
Housing Structures by Number of Rooms in Levy County
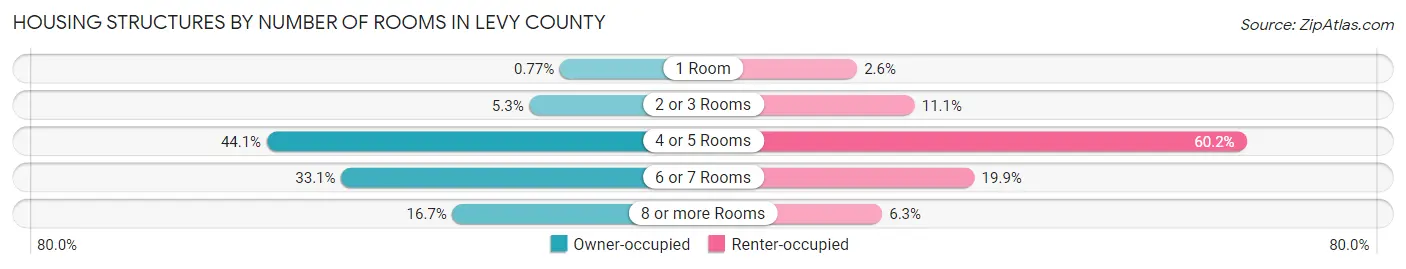
| Number of Rooms | Owner-occupied | Renter-occupied |
| 1 Room | 110 (0.8%) | 93 (2.6%) |
| 2 or 3 Rooms | 752 (5.3%) | 403 (11.1%) |
| 4 or 5 Rooms | 6,271 (44.1%) | 2,187 (60.2%) |
| 6 or 7 Rooms | 4,707 (33.1%) | 725 (19.9%) |
| 8 or more Rooms | 2,367 (16.7%) | 228 (6.3%) |
| Total | 14,207 (100.0%) | 3,636 (100.0%) |
Housing Structure by Heating Type in Levy County
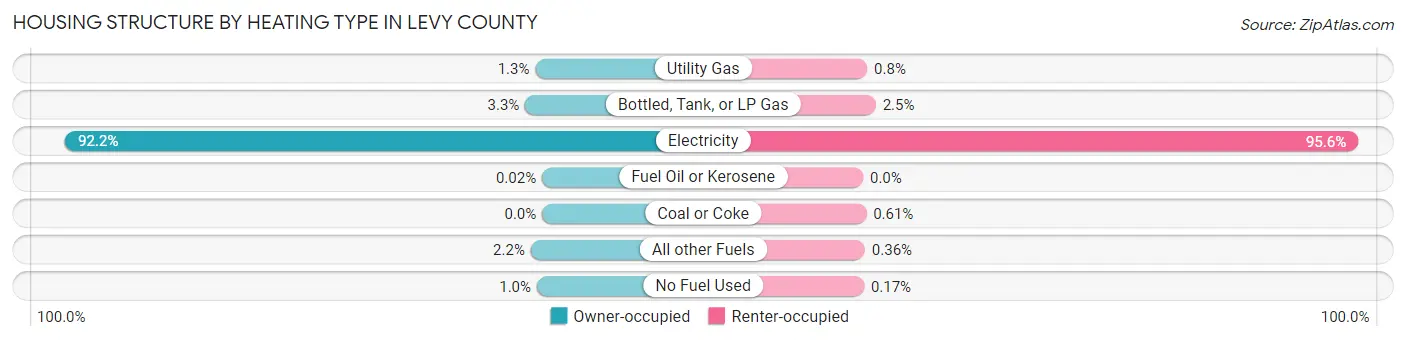
| Heating Type | Owner-occupied | Renter-occupied |
| Utility Gas | 186 (1.3%) | 29 (0.8%) |
| Bottled, Tank, or LP Gas | 464 (3.3%) | 89 (2.5%) |
| Electricity | 13,097 (92.2%) | 3,477 (95.6%) |
| Fuel Oil or Kerosene | 3 (0.0%) | 0 (0.0%) |
| Coal or Coke | 0 (0.0%) | 22 (0.6%) |
| All other Fuels | 313 (2.2%) | 13 (0.4%) |
| No Fuel Used | 144 (1.0%) | 6 (0.2%) |
| Total | 14,207 (100.0%) | 3,636 (100.0%) |
Household Vehicle Usage in Levy County
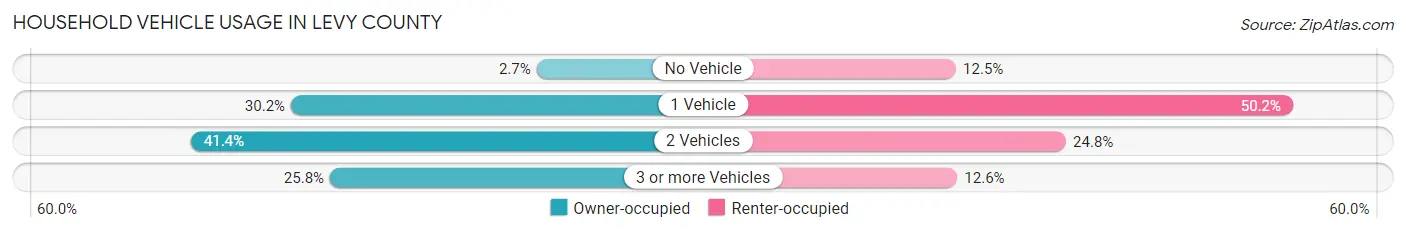
| Vehicles per Household | Owner-occupied | Renter-occupied |
| No Vehicle | 377 (2.6%) | 453 (12.5%) |
| 1 Vehicle | 4,286 (30.2%) | 1,824 (50.2%) |
| 2 Vehicles | 5,878 (41.4%) | 901 (24.8%) |
| 3 or more Vehicles | 3,666 (25.8%) | 458 (12.6%) |
| Total | 14,207 (100.0%) | 3,636 (100.0%) |
Real Estate & Mortgages in Levy County
Real Estate and Mortgage Overview in Levy County
| Characteristic | Without Mortgage | With Mortgage |
| Housing Units | 8,042 | 6,165 |
| Median Property Value | $124,800 | $169,700 |
| Median Household Income | $48,743 | $595 |
| Monthly Housing Costs | $338 | $90 |
| Real Estate Taxes | $944 | $237 |
Property Value by Mortgage Status in Levy County
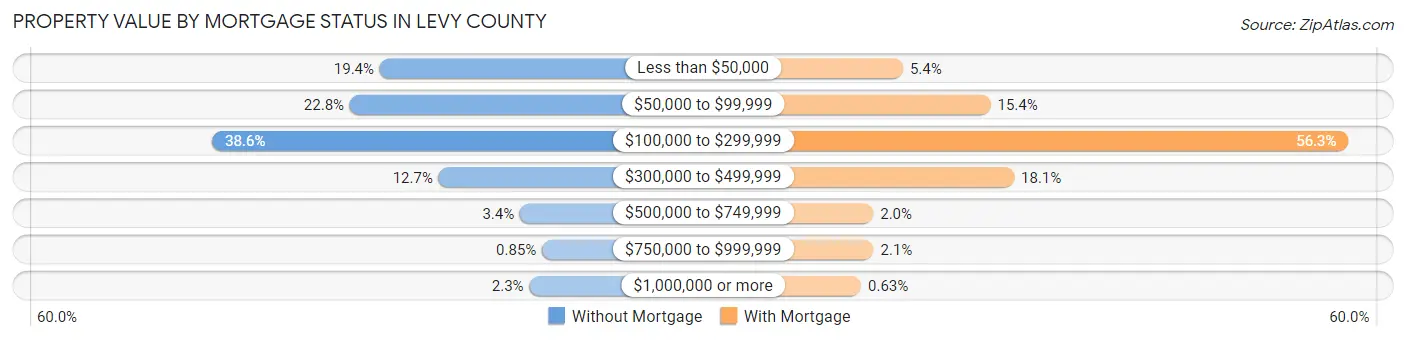
| Property Value | Without Mortgage | With Mortgage |
| Less than $50,000 | 1,560 (19.4%) | 334 (5.4%) |
| $50,000 to $99,999 | 1,835 (22.8%) | 951 (15.4%) |
| $100,000 to $299,999 | 3,102 (38.6%) | 3,472 (56.3%) |
| $300,000 to $499,999 | 1,019 (12.7%) | 1,117 (18.1%) |
| $500,000 to $749,999 | 272 (3.4%) | 125 (2.0%) |
| $750,000 to $999,999 | 68 (0.9%) | 127 (2.1%) |
| $1,000,000 or more | 186 (2.3%) | 39 (0.6%) |
| Total | 8,042 (100.0%) | 6,165 (100.0%) |
Household Income by Mortgage Status in Levy County
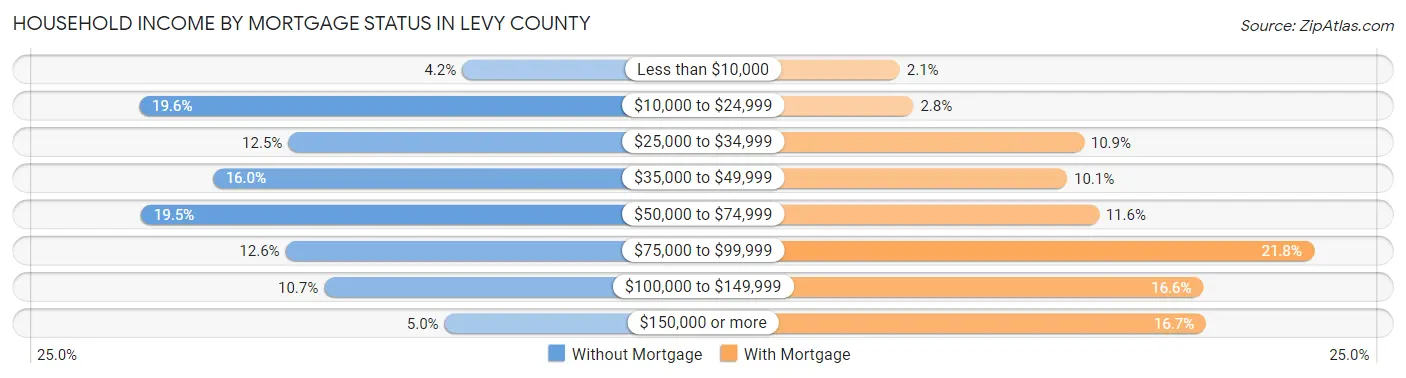
| Household Income | Without Mortgage | With Mortgage |
| Less than $10,000 | 335 (4.2%) | 130 (2.1%) |
| $10,000 to $24,999 | 1,572 (19.6%) | 170 (2.8%) |
| $25,000 to $34,999 | 1,001 (12.4%) | 670 (10.9%) |
| $35,000 to $49,999 | 1,290 (16.0%) | 621 (10.1%) |
| $50,000 to $74,999 | 1,565 (19.5%) | 714 (11.6%) |
| $75,000 to $99,999 | 1,012 (12.6%) | 1,345 (21.8%) |
| $100,000 to $149,999 | 864 (10.7%) | 1,021 (16.6%) |
| $150,000 or more | 403 (5.0%) | 1,029 (16.7%) |
| Total | 8,042 (100.0%) | 6,165 (100.0%) |
Property Value to Household Income Ratio in Levy County
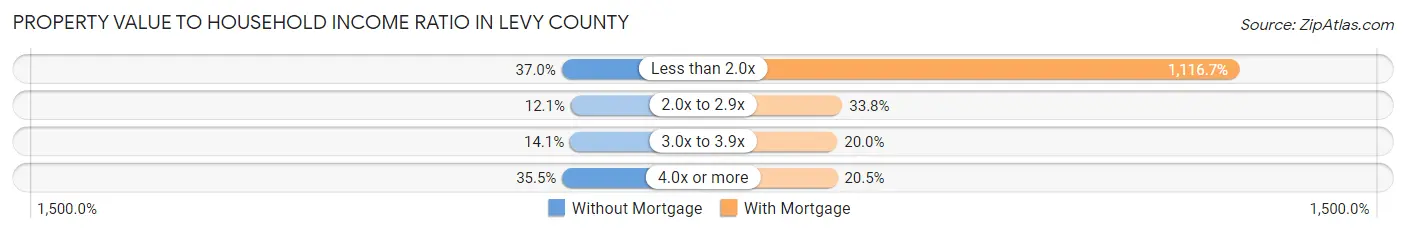
| Value-to-Income Ratio | Without Mortgage | With Mortgage |
| Less than 2.0x | 2,979 (37.0%) | 68,847 (1,116.7%) |
| 2.0x to 2.9x | 972 (12.1%) | 2,086 (33.8%) |
| 3.0x to 3.9x | 1,132 (14.1%) | 1,235 (20.0%) |
| 4.0x or more | 2,858 (35.5%) | 1,265 (20.5%) |
| Total | 8,042 (100.0%) | 6,165 (100.0%) |
Real Estate Taxes by Mortgage Status in Levy County
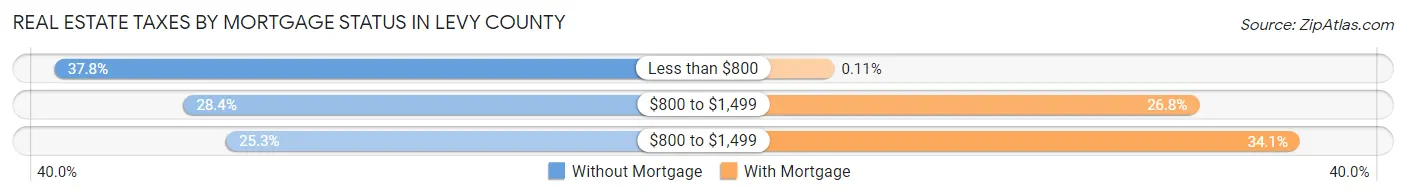
| Property Taxes | Without Mortgage | With Mortgage |
| Less than $800 | 3,039 (37.8%) | 7 (0.1%) |
| $800 to $1,499 | 2,283 (28.4%) | 1,649 (26.8%) |
| $800 to $1,499 | 2,032 (25.3%) | 2,102 (34.1%) |
| Total | 8,042 (100.0%) | 6,165 (100.0%) |
Health & Disability in Levy County
Health Insurance Coverage by Age in Levy County
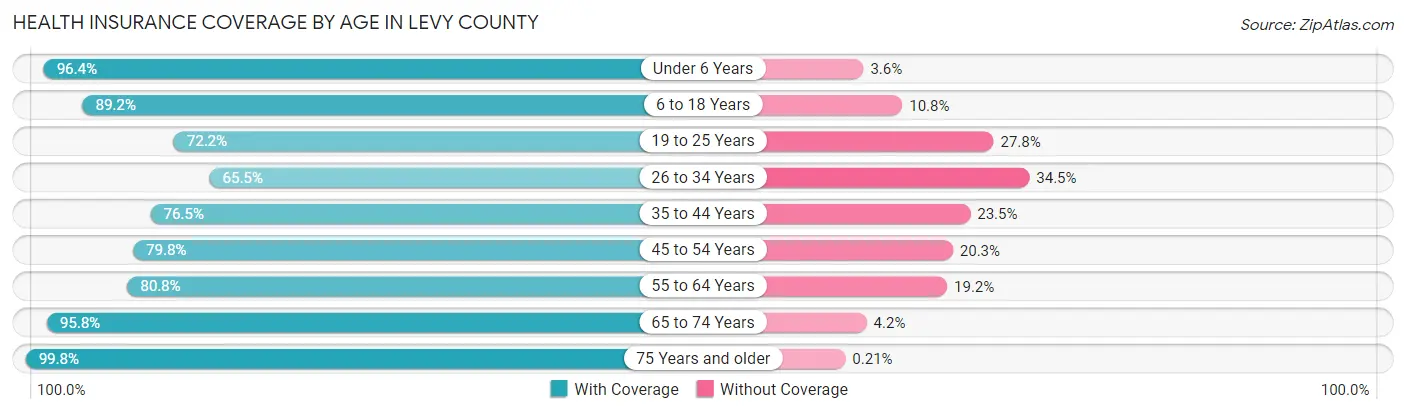
| Age Bracket | With Coverage | Without Coverage |
| Under 6 Years | 2,263 (96.4%) | 84 (3.6%) |
| 6 to 18 Years | 5,935 (89.2%) | 720 (10.8%) |
| 19 to 25 Years | 1,998 (72.2%) | 771 (27.8%) |
| 26 to 34 Years | 2,822 (65.5%) | 1,487 (34.5%) |
| 35 to 44 Years | 3,309 (76.5%) | 1,016 (23.5%) |
| 45 to 54 Years | 4,144 (79.7%) | 1,052 (20.3%) |
| 55 to 64 Years | 5,503 (80.8%) | 1,305 (19.2%) |
| 65 to 74 Years | 5,928 (95.8%) | 258 (4.2%) |
| 75 Years and older | 4,381 (99.8%) | 9 (0.2%) |
| Total | 36,283 (84.4%) | 6,702 (15.6%) |
Health Insurance Coverage by Citizenship Status in Levy County
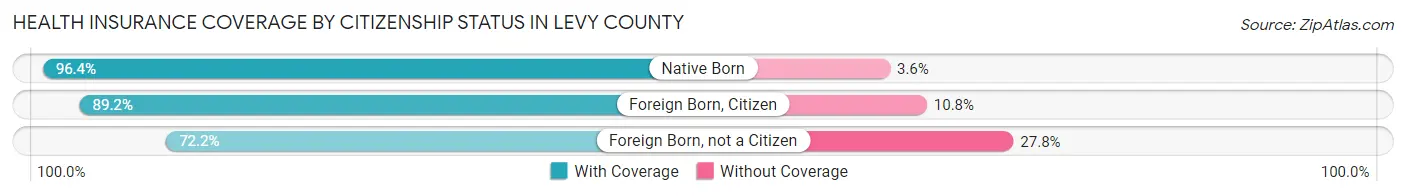
| Citizenship Status | With Coverage | Without Coverage |
| Native Born | 2,263 (96.4%) | 84 (3.6%) |
| Foreign Born, Citizen | 5,935 (89.2%) | 720 (10.8%) |
| Foreign Born, not a Citizen | 1,998 (72.2%) | 771 (27.8%) |
Health Insurance Coverage by Household Income in Levy County
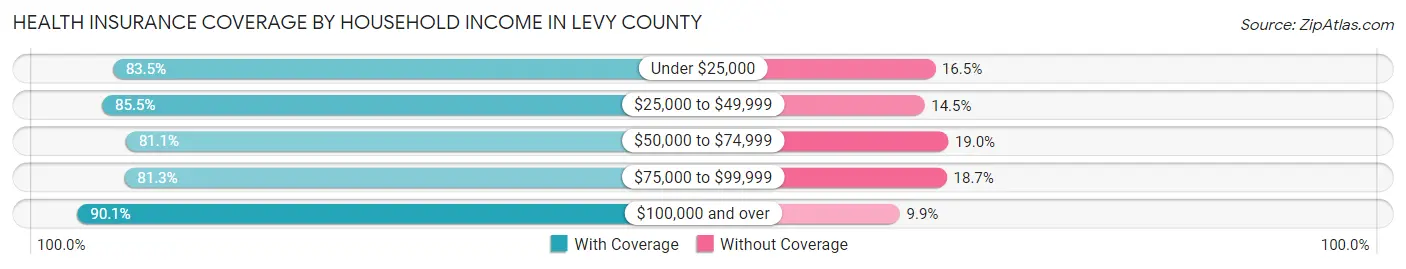
| Household Income | With Coverage | Without Coverage |
| Under $25,000 | 5,767 (83.5%) | 1,141 (16.5%) |
| $25,000 to $49,999 | 8,600 (85.5%) | 1,461 (14.5%) |
| $50,000 to $74,999 | 7,472 (81.0%) | 1,747 (19.0%) |
| $75,000 to $99,999 | 6,165 (81.3%) | 1,418 (18.7%) |
| $100,000 and over | 8,212 (90.1%) | 901 (9.9%) |
Public vs Private Health Insurance Coverage by Age in Levy County
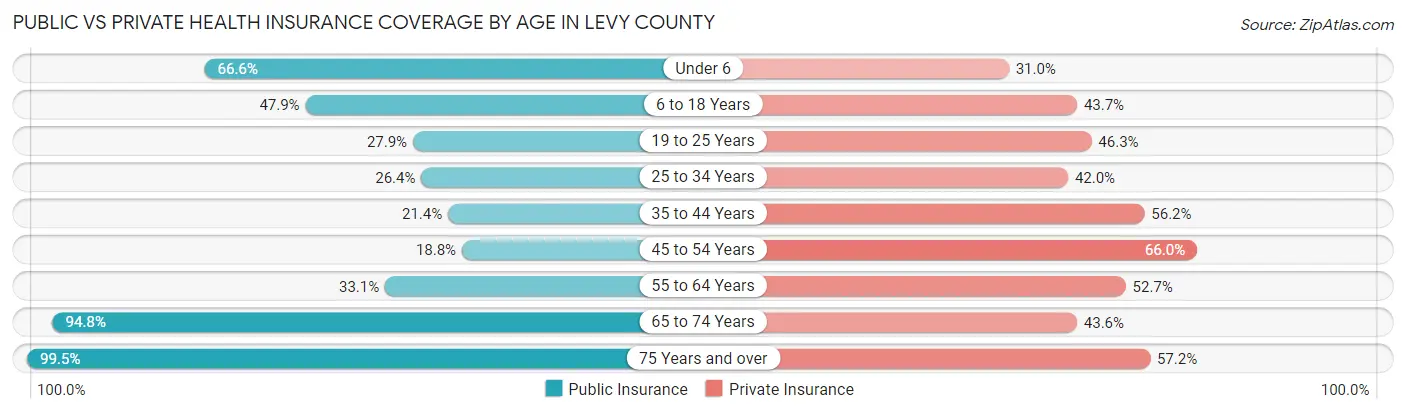
| Age Bracket | Public Insurance | Private Insurance |
| Under 6 | 1,563 (66.6%) | 727 (31.0%) |
| 6 to 18 Years | 3,186 (47.9%) | 2,905 (43.6%) |
| 19 to 25 Years | 773 (27.9%) | 1,283 (46.3%) |
| 25 to 34 Years | 1,136 (26.4%) | 1,809 (42.0%) |
| 35 to 44 Years | 926 (21.4%) | 2,429 (56.2%) |
| 45 to 54 Years | 978 (18.8%) | 3,427 (65.9%) |
| 55 to 64 Years | 2,253 (33.1%) | 3,587 (52.7%) |
| 65 to 74 Years | 5,865 (94.8%) | 2,699 (43.6%) |
| 75 Years and over | 4,370 (99.5%) | 2,511 (57.2%) |
| Total | 21,050 (49.0%) | 21,377 (49.7%) |
Disability Status by Sex by Age in Levy County
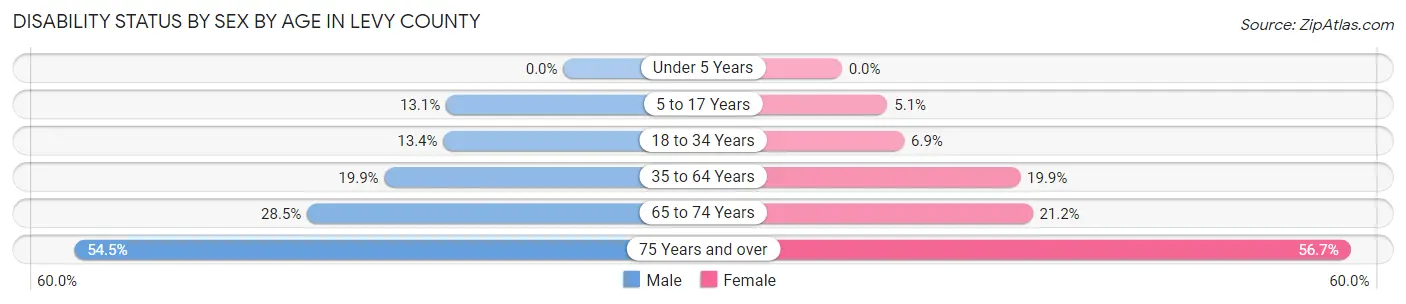
| Age Bracket | Male | Female |
| Under 5 Years | 0 (0.0%) | 0 (0.0%) |
| 5 to 17 Years | 417 (13.1%) | 155 (5.1%) |
| 18 to 34 Years | 520 (13.4%) | 261 (6.9%) |
| 35 to 64 Years | 1,536 (19.9%) | 1,712 (19.9%) |
| 65 to 74 Years | 859 (28.5%) | 674 (21.2%) |
| 75 Years and over | 1,195 (54.5%) | 1,244 (56.7%) |
Disability Class by Sex by Age in Levy County
Disability Class: Hearing Difficulty
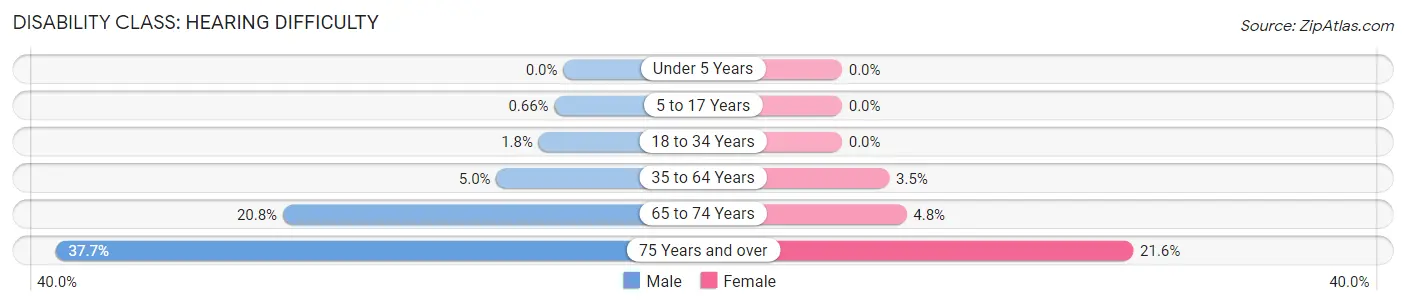
| Age Bracket | Male | Female |
| Under 5 Years | 0 (0.0%) | 0 (0.0%) |
| 5 to 17 Years | 21 (0.7%) | 0 (0.0%) |
| 18 to 34 Years | 71 (1.8%) | 0 (0.0%) |
| 35 to 64 Years | 383 (5.0%) | 303 (3.5%) |
| 65 to 74 Years | 627 (20.8%) | 152 (4.8%) |
| 75 Years and over | 827 (37.7%) | 475 (21.6%) |
Disability Class: Vision Difficulty
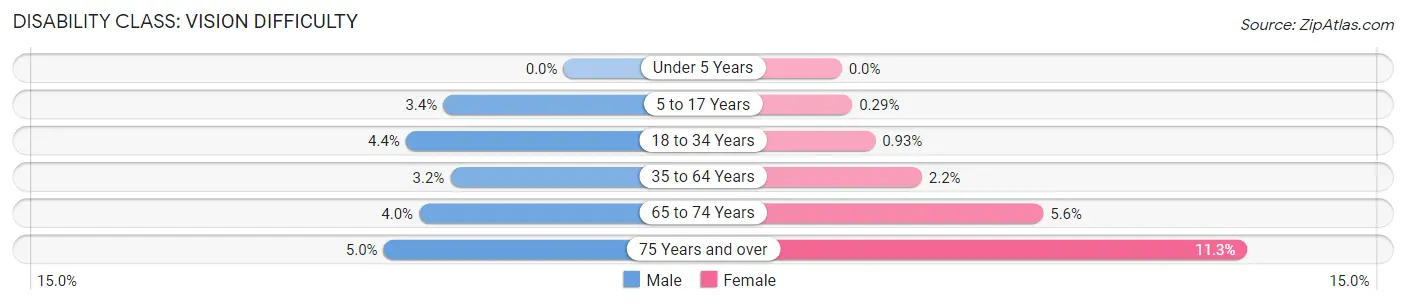
| Age Bracket | Male | Female |
| Under 5 Years | 0 (0.0%) | 0 (0.0%) |
| 5 to 17 Years | 107 (3.4%) | 9 (0.3%) |
| 18 to 34 Years | 171 (4.4%) | 35 (0.9%) |
| 35 to 64 Years | 243 (3.2%) | 192 (2.2%) |
| 65 to 74 Years | 121 (4.0%) | 178 (5.6%) |
| 75 Years and over | 110 (5.0%) | 248 (11.3%) |
Disability Class: Cognitive Difficulty
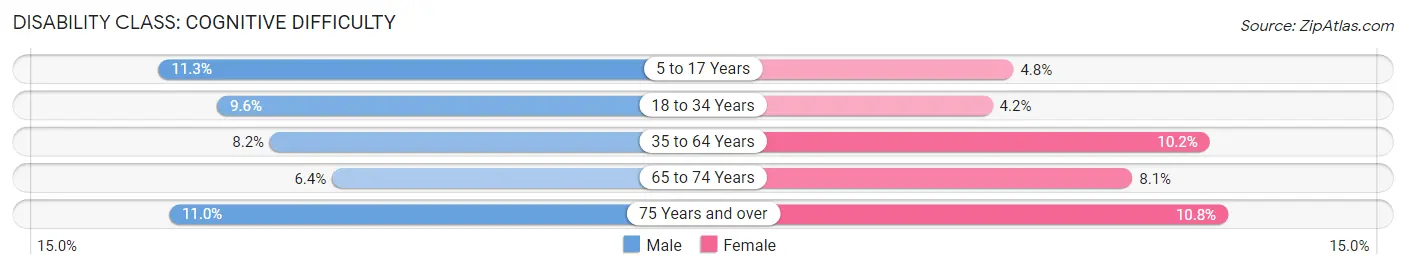
| Age Bracket | Male | Female |
| 5 to 17 Years | 360 (11.3%) | 146 (4.8%) |
| 18 to 34 Years | 375 (9.6%) | 158 (4.2%) |
| 35 to 64 Years | 630 (8.2%) | 883 (10.2%) |
| 65 to 74 Years | 194 (6.4%) | 257 (8.1%) |
| 75 Years and over | 241 (11.0%) | 236 (10.7%) |
Disability Class: Ambulatory Difficulty
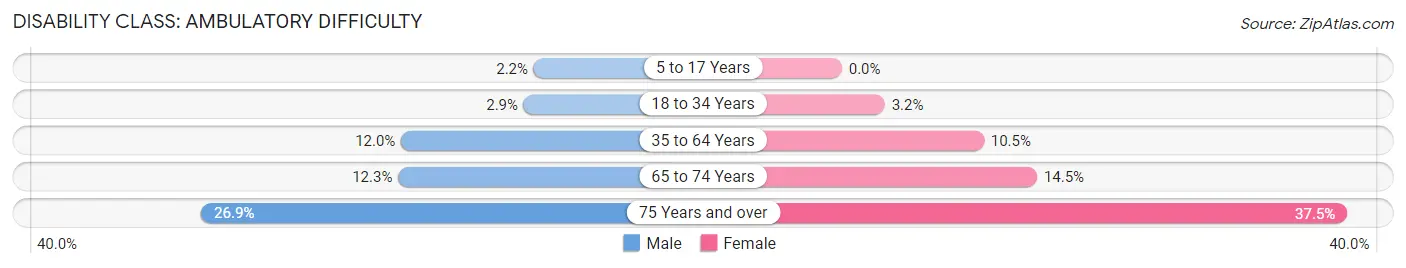
| Age Bracket | Male | Female |
| 5 to 17 Years | 70 (2.2%) | 0 (0.0%) |
| 18 to 34 Years | 114 (2.9%) | 120 (3.2%) |
| 35 to 64 Years | 928 (12.0%) | 909 (10.5%) |
| 65 to 74 Years | 369 (12.3%) | 460 (14.5%) |
| 75 Years and over | 590 (26.9%) | 824 (37.5%) |
Disability Class: Self-Care Difficulty
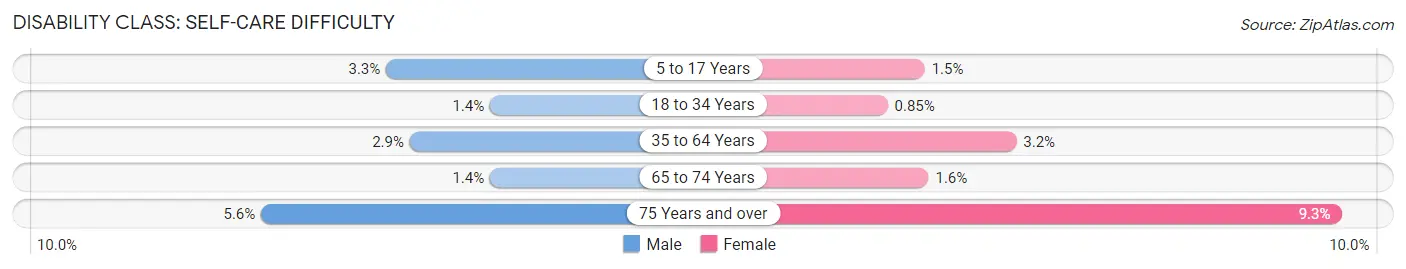
| Age Bracket | Male | Female |
| 5 to 17 Years | 105 (3.3%) | 47 (1.5%) |
| 18 to 34 Years | 53 (1.4%) | 32 (0.9%) |
| 35 to 64 Years | 220 (2.9%) | 279 (3.2%) |
| 65 to 74 Years | 41 (1.4%) | 51 (1.6%) |
| 75 Years and over | 123 (5.6%) | 204 (9.3%) |
Technology Access in Levy County
Computing Device Access in Levy County
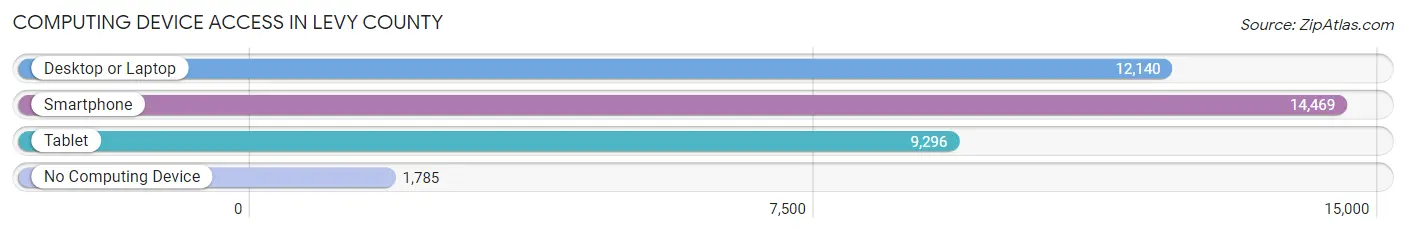
| Device Type | # Households | % Households |
| Desktop or Laptop | 12,140 | 68.0% |
| Smartphone | 14,469 | 81.1% |
| Tablet | 9,296 | 52.1% |
| No Computing Device | 1,785 | 10.0% |
| Total | 17,843 | 100.0% |
Internet Access in Levy County
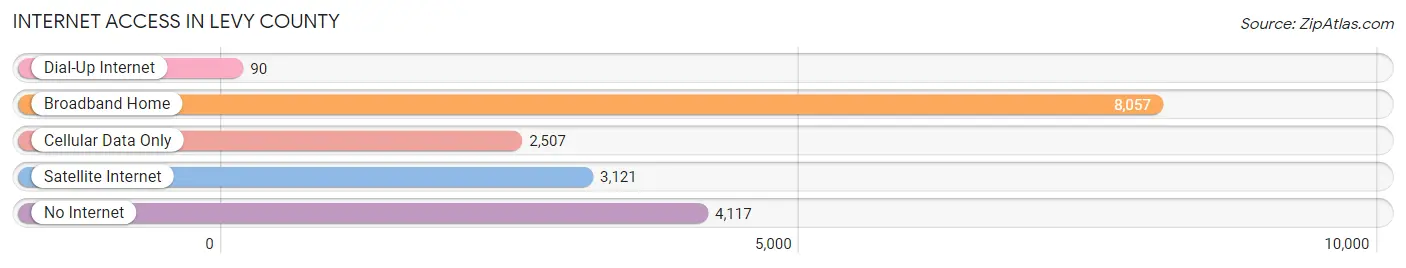
| Internet Type | # Households | % Households |
| Dial-Up Internet | 90 | 0.5% |
| Broadband Home | 8,057 | 45.2% |
| Cellular Data Only | 2,507 | 14.1% |
| Satellite Internet | 3,121 | 17.5% |
| No Internet | 4,117 | 23.1% |
| Total | 17,843 | 100.0% |
Levy County Summary
Levy County is located in the north-central part of the state of Florida, and is part of the Nature Coast region. It is bordered by Alachua, Gilchrist, Dixie, and Citrus counties. The county seat is Bronson, and the largest city is Chiefland. The county was created in 1845 and named for David Levy Yulee, a United States Senator from Florida.
Geography
Levy County covers an area of 1,413 square miles, making it the fifth-largest county in Florida. It is mostly rural, with the majority of the land being used for agriculture and forestry. The terrain is mostly flat, with some rolling hills in the northern part of the county. The highest point in the county is the summit of Rosewood Hill, which has an elevation of 140 feet.
The county is home to several rivers, including the Suwannee, Withlacoochee, and Waccasassa. There are also numerous lakes, including Lake Panasoffkee, Lake Rousseau, and Lake Tsala Apopka. The Gulf of Mexico is located to the west of the county, and the Atlantic Ocean is located to the east.
Economy
The economy of Levy County is largely based on agriculture and forestry. The county is home to several large farms, which produce a variety of crops, including corn, soybeans, cotton, and peanuts. The county is also home to several timber companies, which harvest pine and cypress trees for use in the lumber industry.
In addition to agriculture and forestry, Levy County is home to several manufacturing companies. These companies produce a variety of products, including furniture, paper products, and plastic products. The county is also home to several retail stores, restaurants, and other businesses.
Demographics
As of the 2010 census, the population of Levy County was 40,801. The population has grown steadily since the 2000 census, when it was 38,919. The population is mostly white (83.3%), with smaller percentages of African Americans (10.2%), Hispanics (4.2%), and Asians (1.2%).
The median household income in Levy County is $41,945, and the median family income is $50,945. The per capita income is $21,945. The unemployment rate is 6.2%, which is slightly higher than the national average of 5.2%.
Conclusion
Levy County is a rural county located in the north-central part of Florida. It is home to several rivers and lakes, and is largely agricultural and forestry-based. The population is mostly white, with smaller percentages of African Americans, Hispanics, and Asians. The median household income is slightly lower than the national average, and the unemployment rate is slightly higher.
Common Questions
What is Per Capita Income in Levy County?
Per Capita income in Levy County is $29,042.
What is the Median Family Income in Levy County?
Median Family Income in Levy County is $60,961.
What is the Median Household income in Levy County?
Median Household Income in Levy County is $49,933.
What is Income or Wage Gap in Levy County?
Income or Wage Gap in Levy County is 24.2%.
Women in Levy County earn 75.8 cents for every dollar earned by a man.
What is Family Income Deficit in Levy County?
Family Income Deficit in Levy County is $12,148.
Families that are below poverty line in Levy County earn $12,148 less on average than the poverty threshold level.
What is Inequality or Gini Index in Levy County?
Inequality or Gini Index in Levy County is 0.46.
What is the Total Population of Levy County?
Total Population of Levy County is 43,268.
What is the Total Male Population of Levy County?
Total Male Population of Levy County is 21,126.
What is the Total Female Population of Levy County?
Total Female Population of Levy County is 22,142.
What is the Ratio of Males per 100 Females in Levy County?
There are 95.41 Males per 100 Females in Levy County.
What is the Ratio of Females per 100 Males in Levy County?
There are 104.81 Females per 100 Males in Levy County.
What is the Median Population Age in Levy County?
Median Population Age in Levy County is 47.3 Years.
What is the Average Family Size in Levy County
Average Family Size in Levy County is 2.9 People.
What is the Average Household Size in Levy County
Average Household Size in Levy County is 2.4 People.
How Large is the Labor Force in Levy County?
There are 18,005 People in the Labor Forcein in Levy County.
What is the Percentage of People in the Labor Force in Levy County?
50.5% of People are in the Labor Force in Levy County.
What is the Unemployment Rate in Levy County?
Unemployment Rate in Levy County is 4.4%.