Jefferson County, FL Map & Demographics
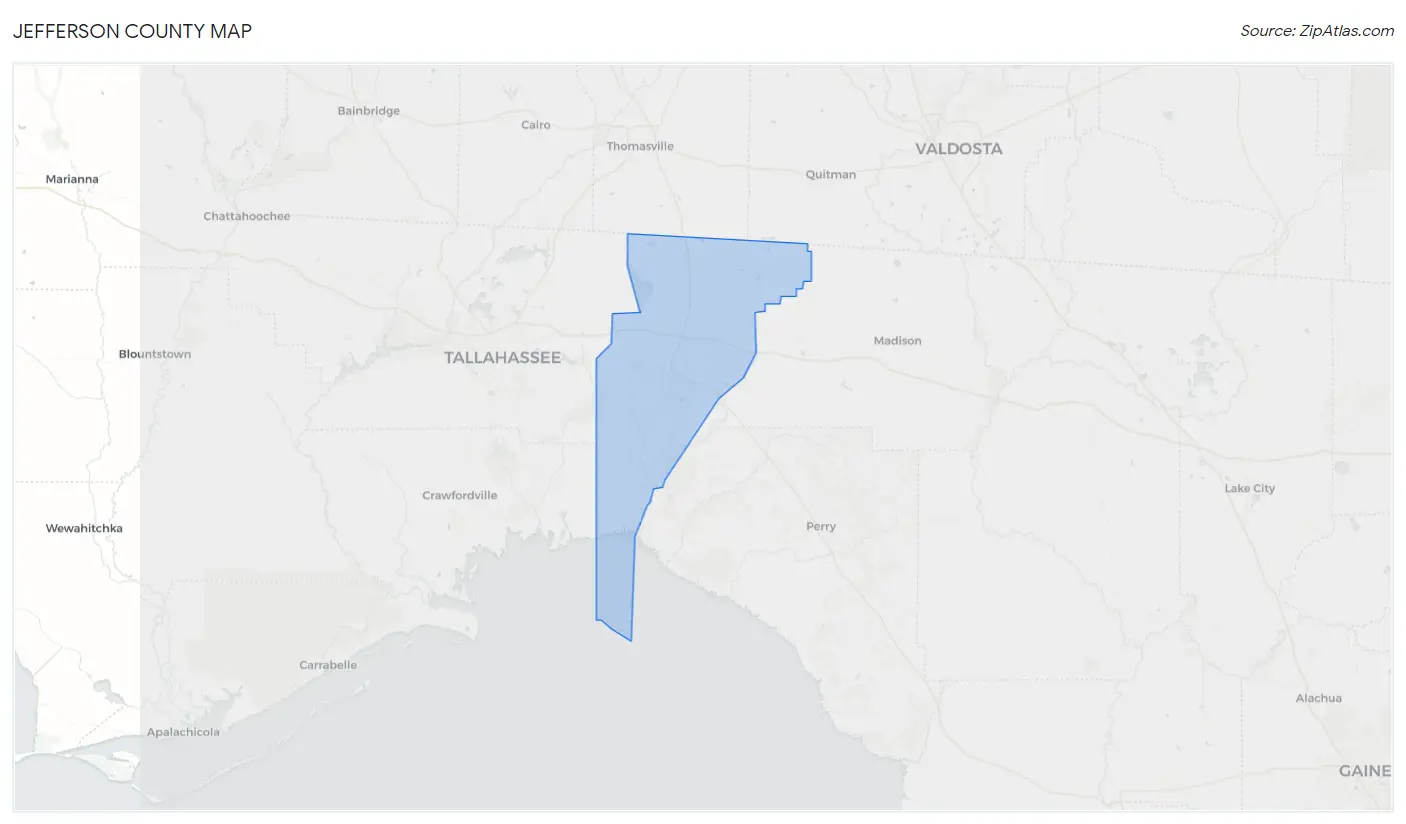
Jefferson County Map
Jefferson County Overview
$29,189
PER CAPITA INCOME
$69,690
AVG FAMILY INCOME
$51,573
AVG HOUSEHOLD INCOME
24.6%
WAGE / INCOME GAP [ % ]
75.4¢/ $1
WAGE / INCOME GAP [ $ ]
$9,755
FAMILY INCOME DEFICIT
0.47
INEQUALITY / GINI INDEX
14,458
TOTAL POPULATION
7,453
MALE POPULATION
7,005
FEMALE POPULATION
106.40
MALES / 100 FEMALES
93.99
FEMALES / 100 MALES
47.8
MEDIAN AGE
2.9
AVG FAMILY SIZE
2.4
AVG HOUSEHOLD SIZE
6,408
LABOR FORCE [ PEOPLE ]
52.2%
PERCENT IN LABOR FORCE
6.7%
UNEMPLOYMENT RATE
Jefferson County Area Codes
Income in Jefferson County
Income Overview in Jefferson County
Per Capita Income in Jefferson County is $29,189, while median incomes of families and households are $69,690 and $51,573 respectively.
| Characteristic | Number | Measure |
| Per Capita Income | 14,458 | $29,189 |
| Median Family Income | 3,739 | $69,690 |
| Mean Family Income | 3,739 | $88,283 |
| Median Household Income | 5,519 | $51,573 |
| Mean Household Income | 5,519 | $73,704 |
| Income Deficit | 3,739 | $9,755 |
| Wage / Income Gap (%) | 14,458 | 24.60% |
| Wage / Income Gap ($) | 14,458 | 75.40¢ per $1 |
| Gini / Inequality Index | 14,458 | 0.47 |
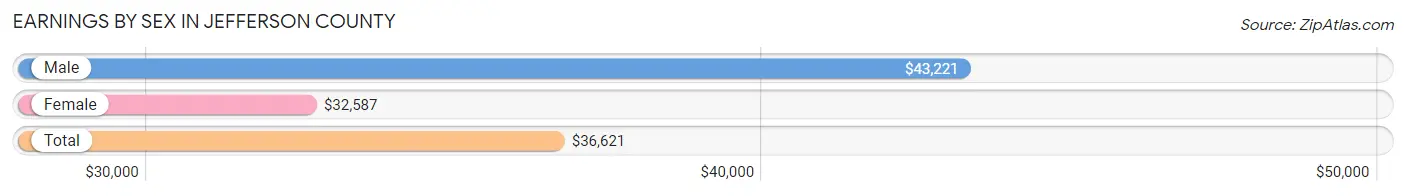
Earnings by Sex in Jefferson County
Average Earnings in Jefferson County are $36,621, $43,221 for men and $32,587 for women, a difference of 24.6%.
| Sex | Number | Average Earnings |
| Male | 3,101 (49.1%) | $43,221 |
| Female | 3,213 (50.9%) | $32,587 |
| Total | 6,314 (100.0%) | $36,621 |
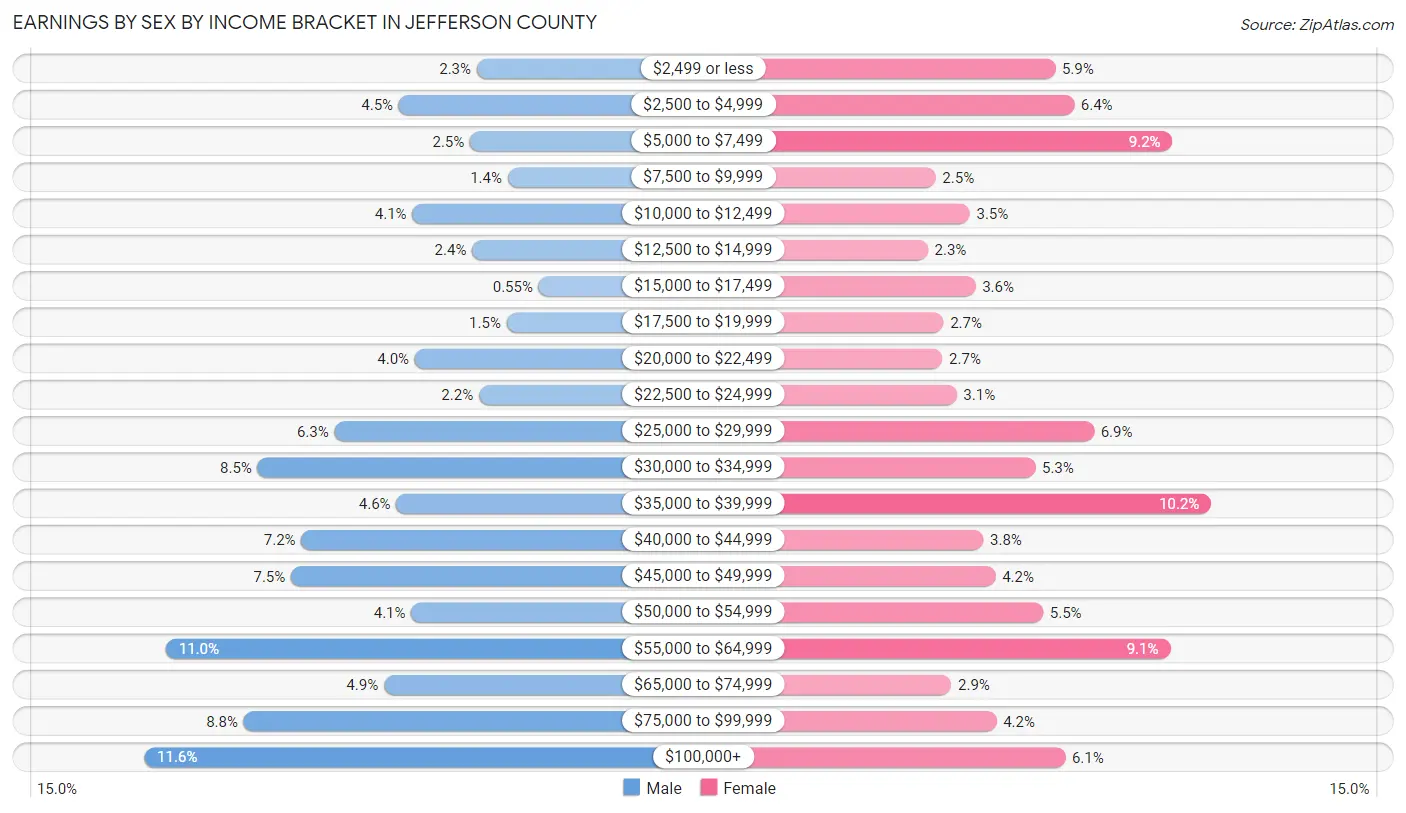
Earnings by Sex by Income Bracket in Jefferson County
The most common earnings brackets in Jefferson County are $100,000+ for men (361 | 11.6%) and $35,000 to $39,999 for women (329 | 10.2%).
| Income | Male | Female |
| $2,499 or less | 71 (2.3%) | 188 (5.9%) |
| $2,500 to $4,999 | 139 (4.5%) | 205 (6.4%) |
| $5,000 to $7,499 | 77 (2.5%) | 294 (9.1%) |
| $7,500 to $9,999 | 44 (1.4%) | 80 (2.5%) |
| $10,000 to $12,499 | 127 (4.1%) | 111 (3.5%) |
| $12,500 to $14,999 | 75 (2.4%) | 73 (2.3%) |
| $15,000 to $17,499 | 17 (0.5%) | 116 (3.6%) |
| $17,500 to $19,999 | 45 (1.5%) | 87 (2.7%) |
| $20,000 to $22,499 | 125 (4.0%) | 86 (2.7%) |
| $22,500 to $24,999 | 69 (2.2%) | 99 (3.1%) |
| $25,000 to $29,999 | 195 (6.3%) | 223 (6.9%) |
| $30,000 to $34,999 | 262 (8.5%) | 170 (5.3%) |
| $35,000 to $39,999 | 141 (4.5%) | 329 (10.2%) |
| $40,000 to $44,999 | 224 (7.2%) | 123 (3.8%) |
| $45,000 to $49,999 | 233 (7.5%) | 134 (4.2%) |
| $50,000 to $54,999 | 128 (4.1%) | 177 (5.5%) |
| $55,000 to $64,999 | 342 (11.0%) | 292 (9.1%) |
| $65,000 to $74,999 | 152 (4.9%) | 94 (2.9%) |
| $75,000 to $99,999 | 274 (8.8%) | 135 (4.2%) |
| $100,000+ | 361 (11.6%) | 197 (6.1%) |
| Total | 3,101 (100.0%) | 3,213 (100.0%) |
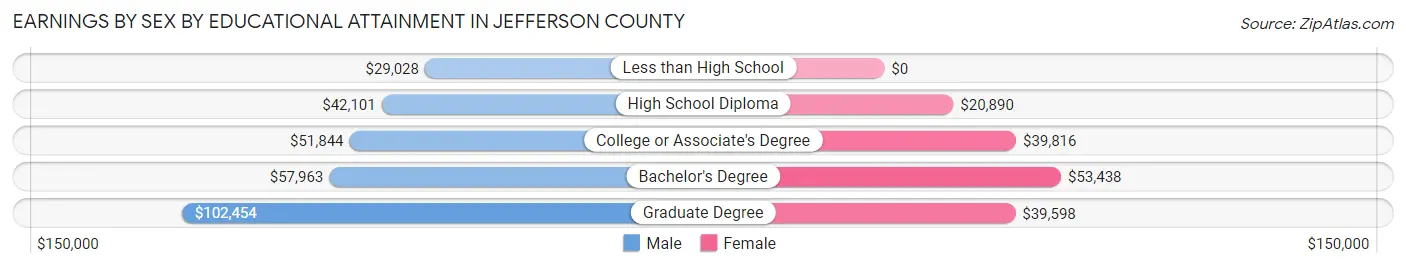
Earnings by Sex by Educational Attainment in Jefferson County
Average earnings in Jefferson County are $46,995 for men and $35,989 for women, a difference of 23.4%. Men with an educational attainment of graduate degree enjoy the highest average annual earnings of $102,454, while those with less than high school education earn the least with $29,028. Women with an educational attainment of bachelor's degree earn the most with the average annual earnings of $53,438, while those with high school diploma education have the smallest earnings of $20,890.
| Educational Attainment | Male Income | Female Income |
| Less than High School | $29,028 | $0 |
| High School Diploma | $42,101 | $20,890 |
| College or Associate's Degree | $51,844 | $39,816 |
| Bachelor's Degree | $57,963 | $53,438 |
| Graduate Degree | $102,454 | $39,598 |
| Total | $46,995 | $35,989 |
Family Income in Jefferson County
Family Income Brackets in Jefferson County
According to the Jefferson County family income data, there are 699 families falling into the $100,000 to $149,999 income range, which is the most common income bracket and makes up 18.7% of all families. Conversely, the less than $10,000 income bracket is the least frequent group with only 131 families (3.5%) belonging to this category.
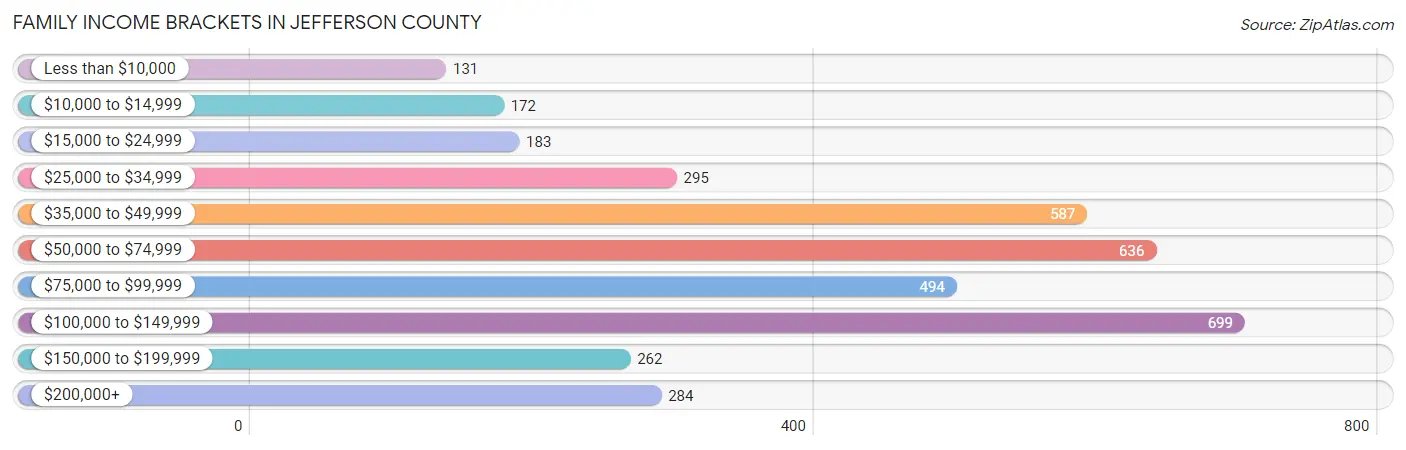
| Income Bracket | # Families | % Families |
| Less than $10,000 | 131 | 3.5% |
| $10,000 to $14,999 | 172 | 4.6% |
| $15,000 to $24,999 | 183 | 4.9% |
| $25,000 to $34,999 | 295 | 7.9% |
| $35,000 to $49,999 | 587 | 15.7% |
| $50,000 to $74,999 | 636 | 17.0% |
| $75,000 to $99,999 | 494 | 13.2% |
| $100,000 to $149,999 | 699 | 18.7% |
| $150,000 to $199,999 | 262 | 7.0% |
| $200,000+ | 284 | 7.6% |
Family Income by Famaliy Size in Jefferson County
6-person families (127 | 3.4%) account for the highest median family income in Jefferson County with $91,635 per family, while 2-person families (2,073 | 55.4%) have the highest median income of $33,677 per family member.
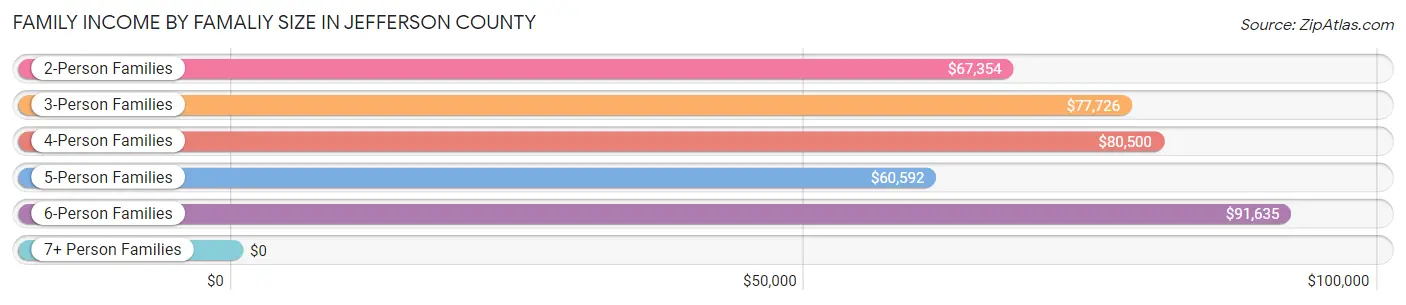
| Income Bracket | # Families | Median Income |
| 2-Person Families | 2,073 (55.4%) | $67,354 |
| 3-Person Families | 895 (23.9%) | $77,726 |
| 4-Person Families | 492 (13.2%) | $80,500 |
| 5-Person Families | 133 (3.6%) | $60,592 |
| 6-Person Families | 127 (3.4%) | $91,635 |
| 7+ Person Families | 19 (0.5%) | $0 |
| Total | 3,739 (100.0%) | $69,690 |
Family Income by Number of Earners in Jefferson County
The median family income in Jefferson County is $69,690, with families comprising 3+ earners (338) having the highest median family income of $109,057, while families with no earners (911) have the lowest median family income of $42,813, accounting for 9.0% and 24.4% of families, respectively.
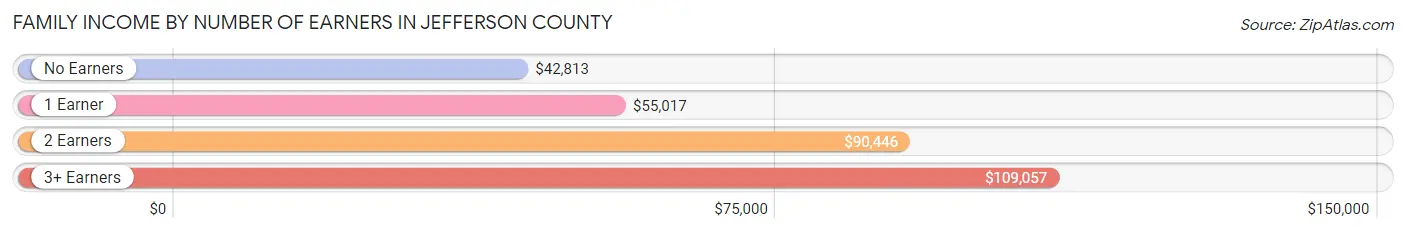
| Number of Earners | # Families | Median Income |
| No Earners | 911 (24.4%) | $42,813 |
| 1 Earner | 1,141 (30.5%) | $55,017 |
| 2 Earners | 1,349 (36.1%) | $90,446 |
| 3+ Earners | 338 (9.0%) | $109,057 |
| Total | 3,739 (100.0%) | $69,690 |
Household Income in Jefferson County
Household Income Brackets in Jefferson County
With 944 households falling in the category, the $35,000 to $49,999 income range is the most frequent in Jefferson County, accounting for 17.1% of all households. In contrast, only 320 households (5.8%) fall into the $200,000+ income bracket, making it the least populous group.
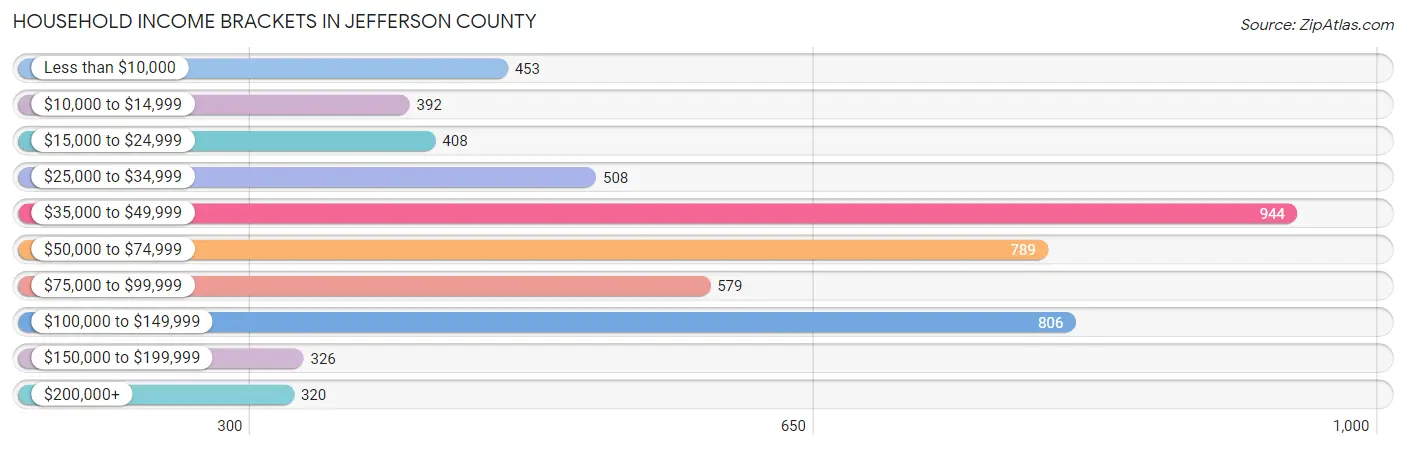
| Income Bracket | # Households | % Households |
| Less than $10,000 | 453 | 8.2% |
| $10,000 to $14,999 | 392 | 7.1% |
| $15,000 to $24,999 | 408 | 7.4% |
| $25,000 to $34,999 | 508 | 9.2% |
| $35,000 to $49,999 | 944 | 17.1% |
| $50,000 to $74,999 | 789 | 14.3% |
| $75,000 to $99,999 | 579 | 10.5% |
| $100,000 to $149,999 | 806 | 14.6% |
| $150,000 to $199,999 | 326 | 5.9% |
| $200,000+ | 320 | 5.8% |
Household Income by Householder Age in Jefferson County
The median household income in Jefferson County is $51,573, with the highest median household income of $60,781 found in the 45 to 64 years age bracket for the primary householder. A total of 2,402 households (43.5%) fall into this category. Meanwhile, the 15 to 24 years age bracket for the primary householder has the lowest median household income of $0, with 81 households (1.5%) in this group.
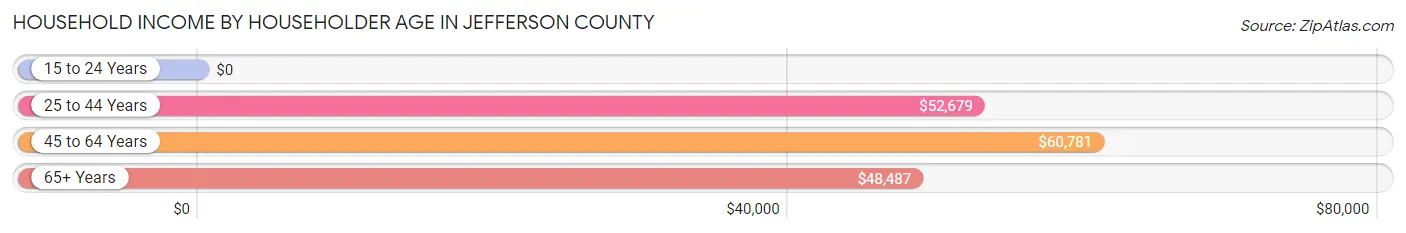
| Income Bracket | # Households | Median Income |
| 15 to 24 Years | 81 (1.5%) | $0 |
| 25 to 44 Years | 1,165 (21.1%) | $52,679 |
| 45 to 64 Years | 2,402 (43.5%) | $60,781 |
| 65+ Years | 1,871 (33.9%) | $48,487 |
| Total | 5,519 (100.0%) | $51,573 |
Poverty in Jefferson County
Income Below Poverty by Sex and Age in Jefferson County
With 15.0% poverty level for males and 21.4% for females among the residents of Jefferson County, 18 to 24 year old males and 15 year old females are the most vulnerable to poverty, with 184 males (34.4%) and 94 females (70.7%) in their respective age groups living below the poverty level.
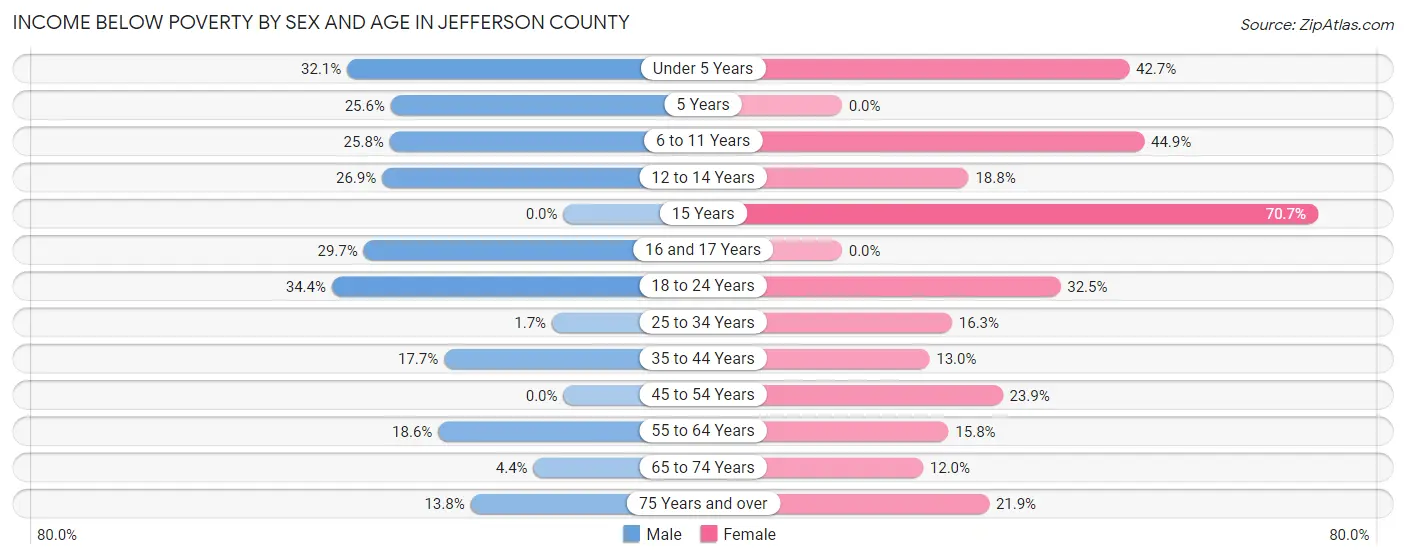
| Age Bracket | Male | Female |
| Under 5 Years | 96 (32.1%) | 116 (42.6%) |
| 5 Years | 20 (25.6%) | 0 (0.0%) |
| 6 to 11 Years | 106 (25.8%) | 149 (44.9%) |
| 12 to 14 Years | 56 (26.9%) | 38 (18.8%) |
| 15 Years | 0 (0.0%) | 94 (70.7%) |
| 16 and 17 Years | 62 (29.7%) | 0 (0.0%) |
| 18 to 24 Years | 184 (34.4%) | 183 (32.5%) |
| 25 to 34 Years | 11 (1.7%) | 99 (16.3%) |
| 35 to 44 Years | 109 (17.7%) | 90 (13.0%) |
| 45 to 54 Years | 0 (0.0%) | 224 (23.9%) |
| 55 to 64 Years | 187 (18.6%) | 183 (15.8%) |
| 65 to 74 Years | 40 (4.4%) | 122 (12.0%) |
| 75 Years and over | 80 (13.8%) | 165 (21.8%) |
| Total | 951 (15.0%) | 1,463 (21.4%) |
Income Above Poverty by Sex and Age in Jefferson County
According to the poverty statistics in Jefferson County, males aged 15 years and females aged 5 years are the age groups that are most secure financially, with 100.0% of males and 100.0% of females in these age groups living above the poverty line.
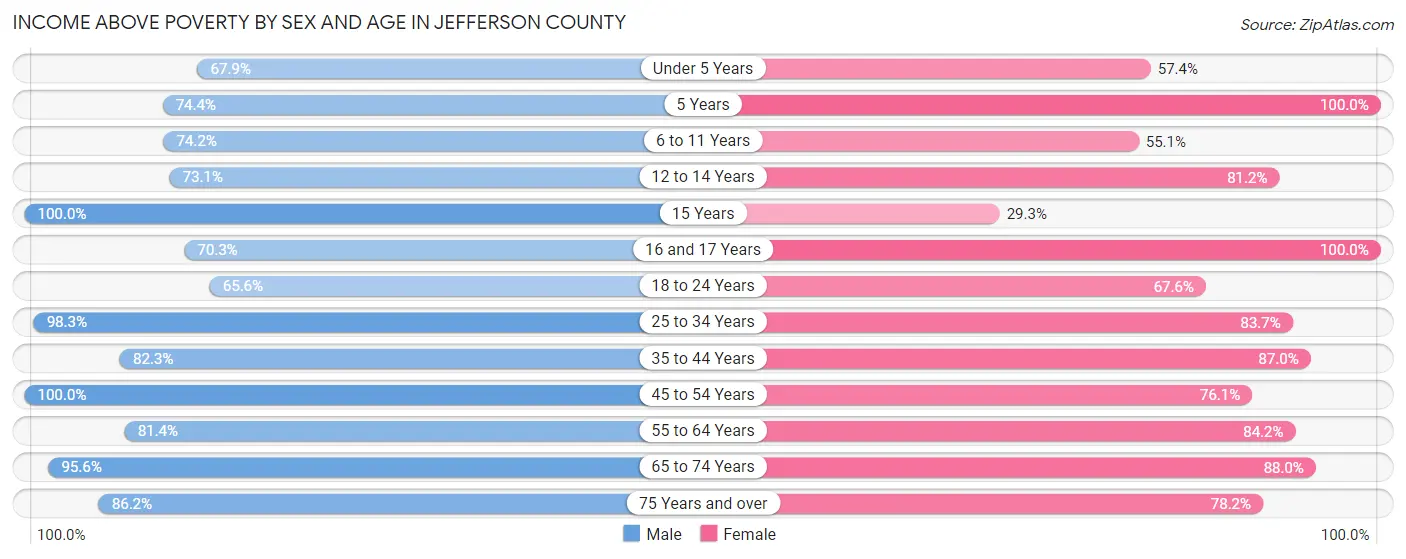
| Age Bracket | Male | Female |
| Under 5 Years | 203 (67.9%) | 156 (57.4%) |
| 5 Years | 58 (74.4%) | 76 (100.0%) |
| 6 to 11 Years | 305 (74.2%) | 183 (55.1%) |
| 12 to 14 Years | 152 (73.1%) | 164 (81.2%) |
| 15 Years | 72 (100.0%) | 39 (29.3%) |
| 16 and 17 Years | 147 (70.3%) | 88 (100.0%) |
| 18 to 24 Years | 351 (65.6%) | 381 (67.5%) |
| 25 to 34 Years | 636 (98.3%) | 507 (83.7%) |
| 35 to 44 Years | 506 (82.3%) | 603 (87.0%) |
| 45 to 54 Years | 779 (100.0%) | 715 (76.1%) |
| 55 to 64 Years | 819 (81.4%) | 973 (84.2%) |
| 65 to 74 Years | 860 (95.6%) | 891 (88.0%) |
| 75 Years and over | 500 (86.2%) | 590 (78.1%) |
| Total | 5,388 (85.0%) | 5,366 (78.6%) |
Income Below Poverty Among Married-Couple Families in Jefferson County
The poverty statistics for married-couple families in Jefferson County show that 3.8% or 101 of the total 2,623 families live below the poverty line. Families with 5 or more children have the highest poverty rate of 100.0%, comprising of 13 families. On the other hand, families with no children have the lowest poverty rate of 1.5%, which includes 28 families.
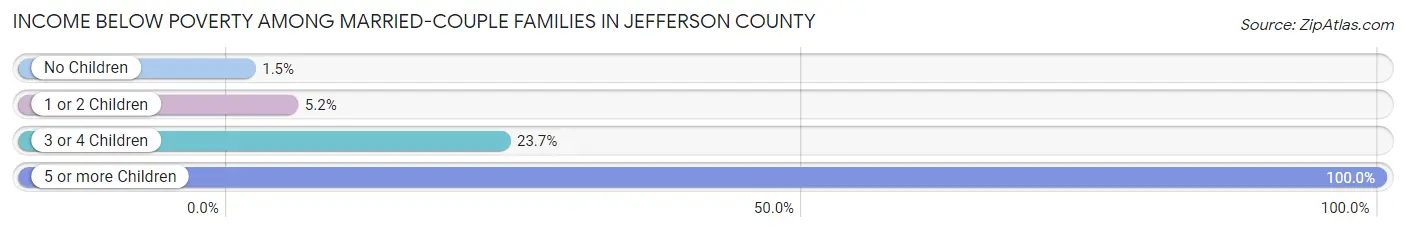
| Children | Above Poverty | Below Poverty |
| No Children | 1,835 (98.5%) | 28 (1.5%) |
| 1 or 2 Children | 600 (94.8%) | 33 (5.2%) |
| 3 or 4 Children | 87 (76.3%) | 27 (23.7%) |
| 5 or more Children | 0 (0.0%) | 13 (100.0%) |
| Total | 2,522 (96.2%) | 101 (3.8%) |
Income Below Poverty Among Single-Parent Households in Jefferson County
According to the poverty data in Jefferson County, 29.2% or 64 single-father households and 33.2% or 298 single-mother households are living below the poverty line. Among single-father households, those with no children have the highest poverty rate, with 64 households (48.8%) experiencing poverty. Likewise, among single-mother households, those with 3 or 4 children have the highest poverty rate, with 58 households (100.0%) falling below the poverty line.
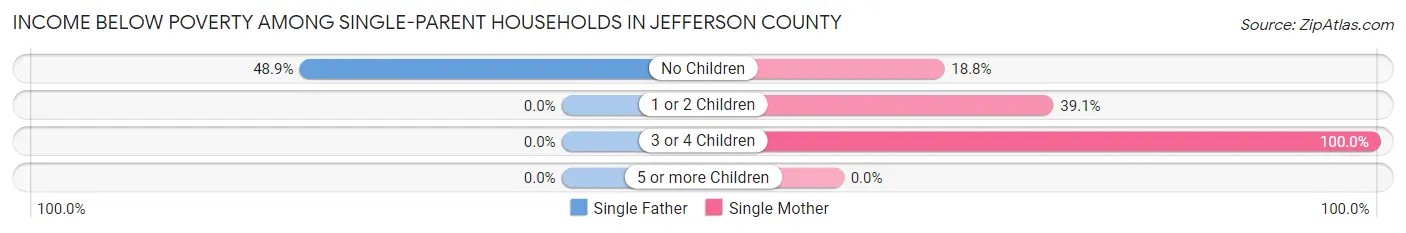
| Children | Single Father | Single Mother |
| No Children | 64 (48.8%) | 81 (18.8%) |
| 1 or 2 Children | 0 (0.0%) | 159 (39.1%) |
| 3 or 4 Children | 0 (0.0%) | 58 (100.0%) |
| 5 or more Children | 0 (0.0%) | 0 (0.0%) |
| Total | 64 (29.2%) | 298 (33.2%) |
Income Below Poverty Among Married-Couple vs Single-Parent Households in Jefferson County
The poverty data for Jefferson County shows that 101 of the married-couple family households (3.8%) and 362 of the single-parent households (32.4%) are living below the poverty level. Within the married-couple family households, those with 5 or more children have the highest poverty rate, with 13 households (100.0%) falling below the poverty line. Among the single-parent households, those with 3 or 4 children have the highest poverty rate, with 58 household (100.0%) living below poverty.
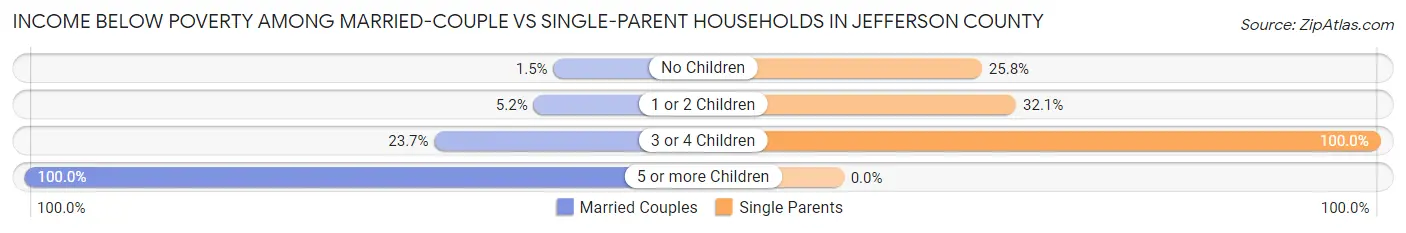
| Children | Married-Couple Families | Single-Parent Households |
| No Children | 28 (1.5%) | 145 (25.8%) |
| 1 or 2 Children | 33 (5.2%) | 159 (32.1%) |
| 3 or 4 Children | 27 (23.7%) | 58 (100.0%) |
| 5 or more Children | 13 (100.0%) | 0 (0.0%) |
| Total | 101 (3.8%) | 362 (32.4%) |
Race in Jefferson County
The most populous races in Jefferson County are White / Caucasian (9,179 | 63.5%), Black / African American (4,647 | 32.1%), and Hispanic or Latino (646 | 4.5%).
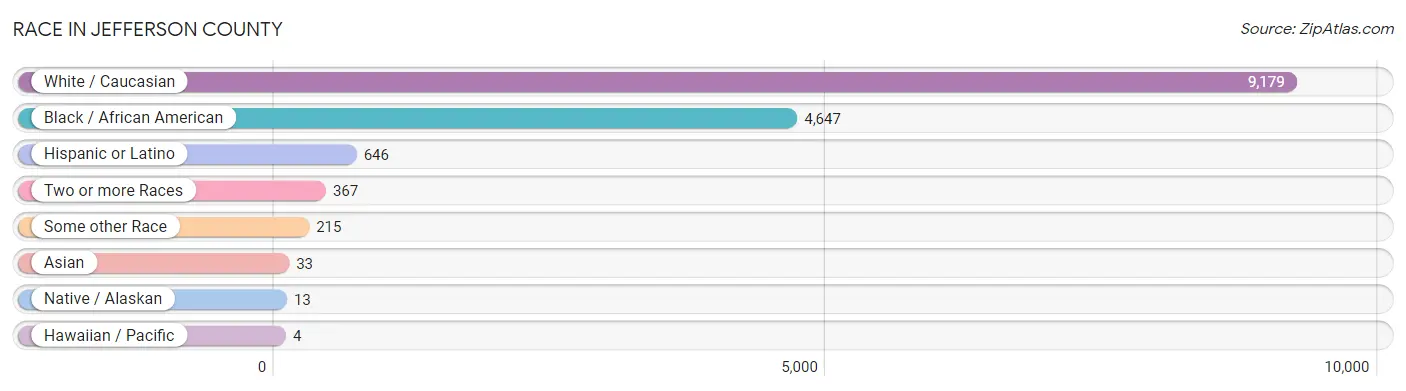
| Race | # Population | % Population |
| Asian | 33 | 0.2% |
| Black / African American | 4,647 | 32.1% |
| Hawaiian / Pacific | 4 | 0.0% |
| Hispanic or Latino | 646 | 4.5% |
| Native / Alaskan | 13 | 0.1% |
| White / Caucasian | 9,179 | 63.5% |
| Two or more Races | 367 | 2.5% |
| Some other Race | 215 | 1.5% |
| Total | 14,458 | 100.0% |
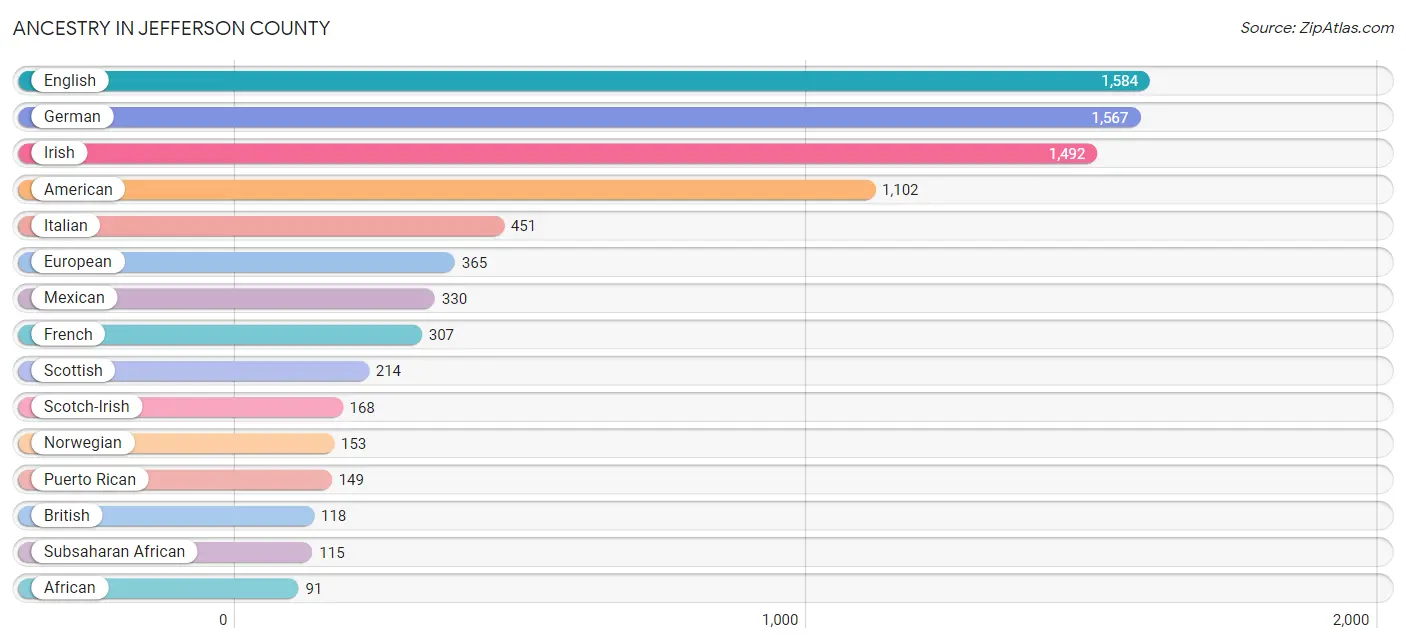
Ancestry in Jefferson County
The most populous ancestries reported in Jefferson County are English (1,584 | 11.0%), German (1,567 | 10.8%), Irish (1,492 | 10.3%), American (1,102 | 7.6%), and Italian (451 | 3.1%), together accounting for 42.9% of all Jefferson County residents.
| Ancestry | # Population | % Population |
| African | 91 | 0.6% |
| Albanian | 6 | 0.0% |
| American | 1,102 | 7.6% |
| Apache | 2 | 0.0% |
| Argentinean | 3 | 0.0% |
| Australian | 36 | 0.3% |
| Austrian | 21 | 0.2% |
| Bahamian | 24 | 0.2% |
| Belgian | 6 | 0.0% |
| Bhutanese | 28 | 0.2% |
| Blackfeet | 1 | 0.0% |
| British | 118 | 0.8% |
| British West Indian | 7 | 0.1% |
| Central American | 7 | 0.1% |
| Cherokee | 42 | 0.3% |
| Creek | 6 | 0.0% |
| Cuban | 66 | 0.5% |
| Czech | 39 | 0.3% |
| Dutch | 32 | 0.2% |
| Eastern European | 22 | 0.2% |
| English | 1,584 | 11.0% |
| European | 365 | 2.5% |
| Finnish | 6 | 0.0% |
| French | 307 | 2.1% |
| French Canadian | 12 | 0.1% |
| German | 1,567 | 10.8% |
| Greek | 32 | 0.2% |
| Haitian | 38 | 0.3% |
| Honduran | 5 | 0.0% |
| Hungarian | 35 | 0.2% |
| Irish | 1,492 | 10.3% |
| Italian | 451 | 3.1% |
| Jamaican | 4 | 0.0% |
| Korean | 32 | 0.2% |
| Lithuanian | 15 | 0.1% |
| Mexican | 330 | 2.3% |
| Native Hawaiian | 4 | 0.0% |
| Nicaraguan | 2 | 0.0% |
| Nigerian | 20 | 0.1% |
| Northern European | 33 | 0.2% |
| Norwegian | 153 | 1.1% |
| Peruvian | 14 | 0.1% |
| Polish | 87 | 0.6% |
| Portuguese | 16 | 0.1% |
| Puerto Rican | 149 | 1.0% |
| Russian | 34 | 0.2% |
| Scandinavian | 57 | 0.4% |
| Scotch-Irish | 168 | 1.2% |
| Scottish | 214 | 1.5% |
| Seminole | 15 | 0.1% |
| Serbian | 45 | 0.3% |
| Slavic | 13 | 0.1% |
| Slovak | 39 | 0.3% |
| South American | 29 | 0.2% |
| Spaniard | 55 | 0.4% |
| Subsaharan African | 115 | 0.8% |
| Swedish | 5 | 0.0% |
| Swiss | 4 | 0.0% |
| Thai | 4 | 0.0% |
| Trinidadian and Tobagonian | 3 | 0.0% |
| Venezuelan | 12 | 0.1% |
| Welsh | 52 | 0.4% | View All 62 Rows |
Immigrants in Jefferson County
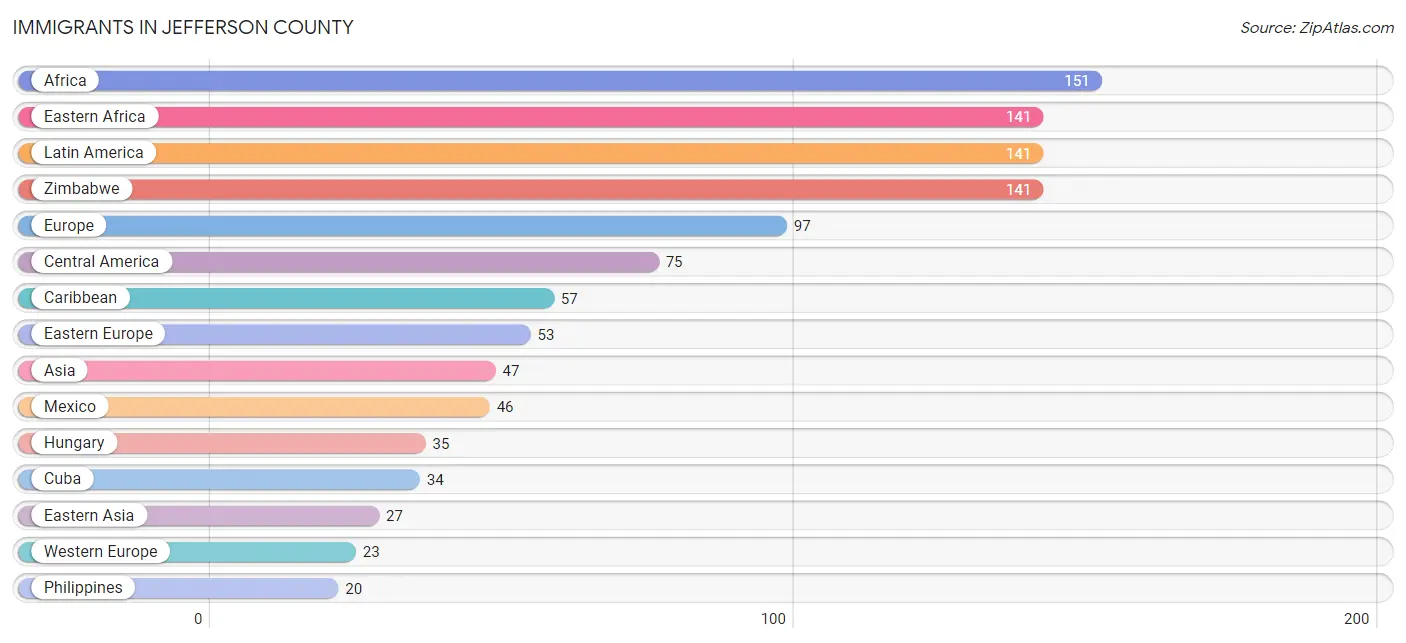
The most numerous immigrant groups reported in Jefferson County came from Africa (151 | 1.0%), Eastern Africa (141 | 1.0%), Latin America (141 | 1.0%), Zimbabwe (141 | 1.0%), and Europe (97 | 0.7%), together accounting for 4.6% of all Jefferson County residents.
| Immigration Origin | # Population | % Population |
| Africa | 151 | 1.0% |
| Asia | 47 | 0.3% |
| Bahamas | 12 | 0.1% |
| Brazil | 9 | 0.1% |
| Cameroon | 4 | 0.0% |
| Canada | 4 | 0.0% |
| Caribbean | 57 | 0.4% |
| Central America | 75 | 0.5% |
| China | 13 | 0.1% |
| Cuba | 34 | 0.2% |
| Eastern Africa | 141 | 1.0% |
| Eastern Asia | 27 | 0.2% |
| Eastern Europe | 53 | 0.4% |
| El Salvador | 3 | 0.0% |
| England | 15 | 0.1% |
| Europe | 97 | 0.7% |
| France | 10 | 0.1% |
| Germany | 13 | 0.1% |
| Greece | 3 | 0.0% |
| Guatemala | 13 | 0.1% |
| Haiti | 11 | 0.1% |
| Honduras | 11 | 0.1% |
| Hungary | 35 | 0.2% |
| Japan | 14 | 0.1% |
| Latin America | 141 | 1.0% |
| Lithuania | 10 | 0.1% |
| Mexico | 46 | 0.3% |
| Middle Africa | 4 | 0.0% |
| Morocco | 6 | 0.0% |
| Nicaragua | 2 | 0.0% |
| Northern Africa | 6 | 0.0% |
| Northern Europe | 18 | 0.1% |
| Oceania | 6 | 0.0% |
| Philippines | 20 | 0.1% |
| Serbia | 8 | 0.1% |
| South America | 9 | 0.1% |
| South Eastern Asia | 20 | 0.1% |
| Southern Europe | 3 | 0.0% |
| Taiwan | 13 | 0.1% |
| Western Europe | 23 | 0.2% |
| Zimbabwe | 141 | 1.0% | View All 41 Rows |
Sex and Age in Jefferson County
Sex and Age in Jefferson County
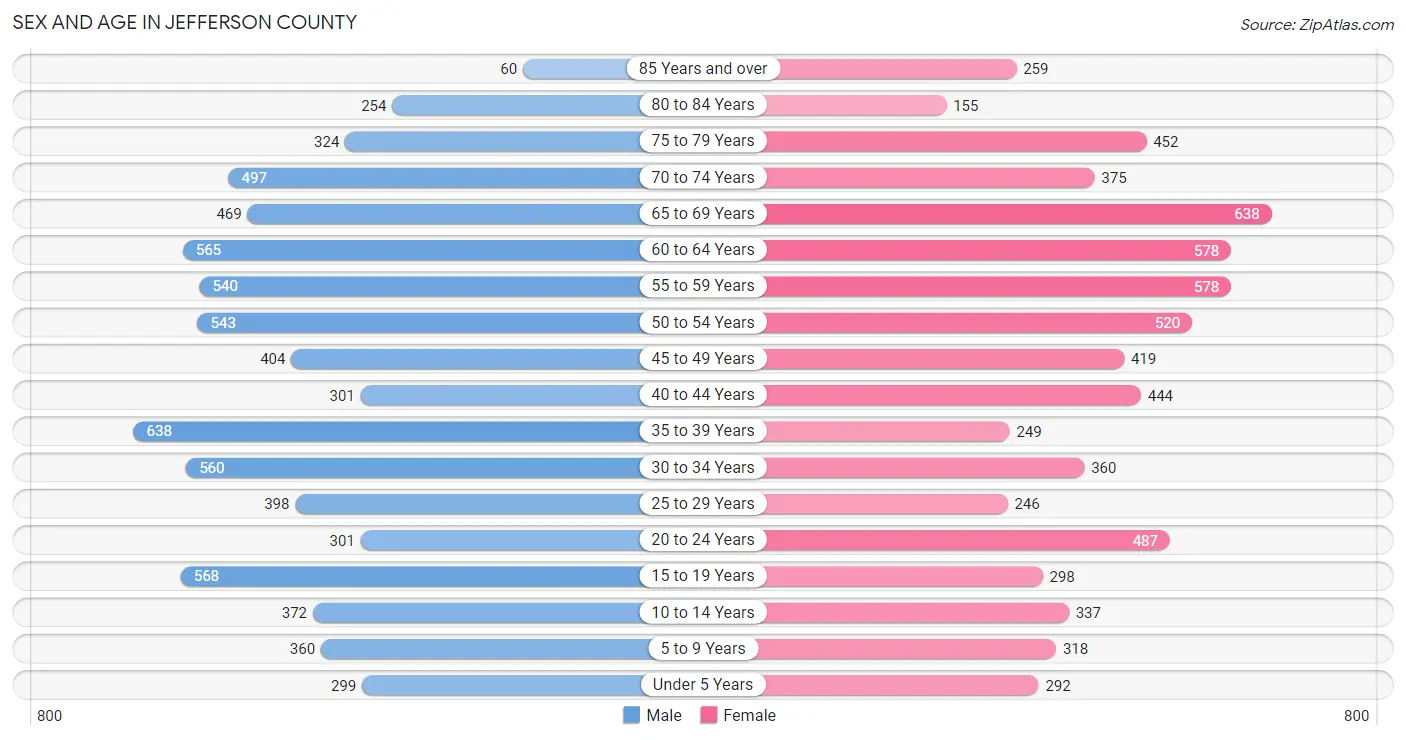
The most populous age groups in Jefferson County are 35 to 39 Years (638 | 8.6%) for men and 65 to 69 Years (638 | 9.1%) for women.
| Age Bracket | Male | Female |
| Under 5 Years | 299 (4.0%) | 292 (4.2%) |
| 5 to 9 Years | 360 (4.8%) | 318 (4.5%) |
| 10 to 14 Years | 372 (5.0%) | 337 (4.8%) |
| 15 to 19 Years | 568 (7.6%) | 298 (4.3%) |
| 20 to 24 Years | 301 (4.0%) | 487 (7.0%) |
| 25 to 29 Years | 398 (5.3%) | 246 (3.5%) |
| 30 to 34 Years | 560 (7.5%) | 360 (5.1%) |
| 35 to 39 Years | 638 (8.6%) | 249 (3.5%) |
| 40 to 44 Years | 301 (4.0%) | 444 (6.3%) |
| 45 to 49 Years | 404 (5.4%) | 419 (6.0%) |
| 50 to 54 Years | 543 (7.3%) | 520 (7.4%) |
| 55 to 59 Years | 540 (7.2%) | 578 (8.3%) |
| 60 to 64 Years | 565 (7.6%) | 578 (8.3%) |
| 65 to 69 Years | 469 (6.3%) | 638 (9.1%) |
| 70 to 74 Years | 497 (6.7%) | 375 (5.3%) |
| 75 to 79 Years | 324 (4.3%) | 452 (6.5%) |
| 80 to 84 Years | 254 (3.4%) | 155 (2.2%) |
| 85 Years and over | 60 (0.8%) | 259 (3.7%) |
| Total | 7,453 (100.0%) | 7,005 (100.0%) |
Families and Households in Jefferson County
Median Family Size in Jefferson County
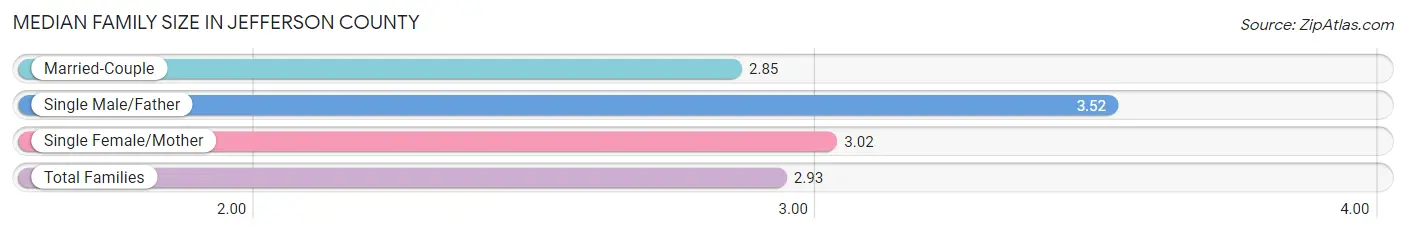
The median family size in Jefferson County is 2.93 persons per family, with single male/father families (219 | 5.9%) accounting for the largest median family size of 3.52 persons per family. On the other hand, married-couple families (2,623 | 70.2%) represent the smallest median family size with 2.85 persons per family.
| Family Type | # Families | Family Size |
| Married-Couple | 2,623 (70.2%) | 2.85 |
| Single Male/Father | 219 (5.9%) | 3.52 |
| Single Female/Mother | 897 (24.0%) | 3.02 |
| Total Families | 3,739 (100.0%) | 2.93 |
Median Household Size in Jefferson County
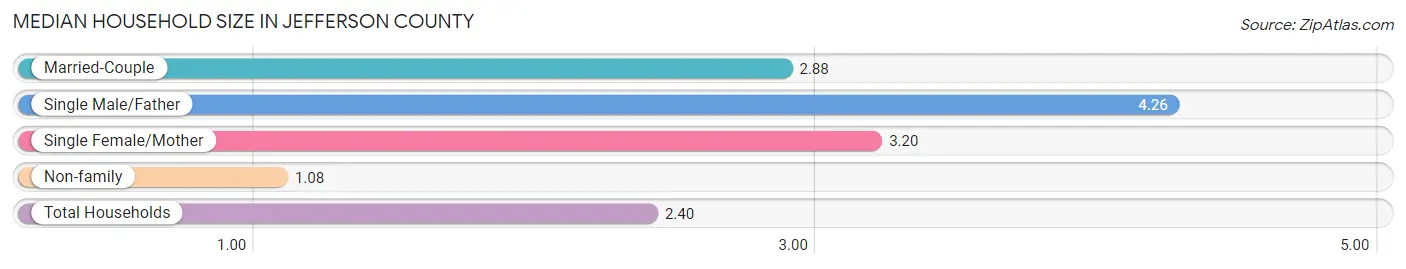
The median household size in Jefferson County is 2.40 persons per household, with single male/father households (219 | 4.0%) accounting for the largest median household size of 4.26 persons per household. non-family households (1,780 | 32.3%) represent the smallest median household size with 1.08 persons per household.
| Household Type | # Households | Household Size |
| Married-Couple | 2,623 (47.5%) | 2.88 |
| Single Male/Father | 219 (4.0%) | 4.26 |
| Single Female/Mother | 897 (16.3%) | 3.20 |
| Non-family | 1,780 (32.3%) | 1.08 |
| Total Households | 5,519 (100.0%) | 2.40 |
Household Size by Marriage Status in Jefferson County
Out of a total of 5,519 households in Jefferson County, 3,739 (67.7%) are family households, while 1,780 (32.3%) are nonfamily households. The most numerous type of family households are 2-person households, comprising 1,941, and the most common type of nonfamily households are 1-person households, comprising 1,655.
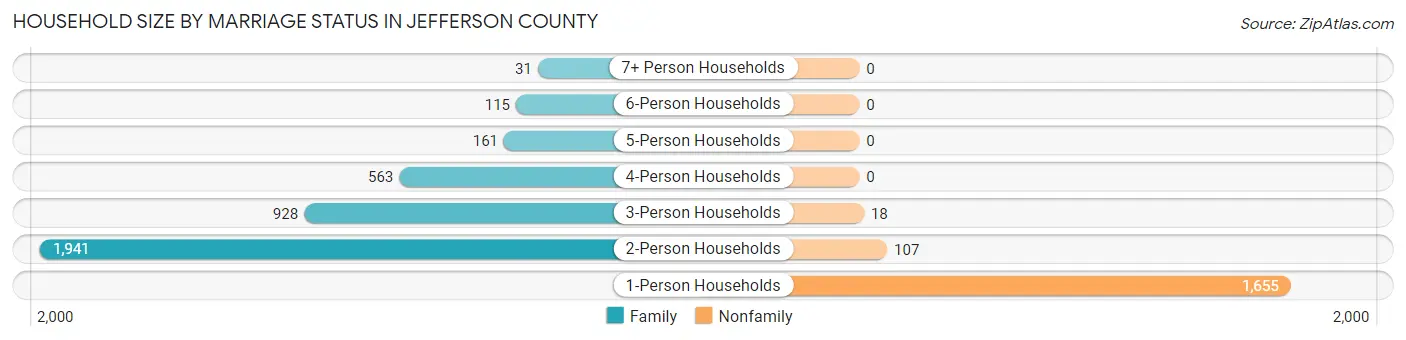
| Household Size | Family Households | Nonfamily Households |
| 1-Person Households | - | 1,655 (30.0%) |
| 2-Person Households | 1,941 (35.2%) | 107 (1.9%) |
| 3-Person Households | 928 (16.8%) | 18 (0.3%) |
| 4-Person Households | 563 (10.2%) | 0 (0.0%) |
| 5-Person Households | 161 (2.9%) | 0 (0.0%) |
| 6-Person Households | 115 (2.1%) | 0 (0.0%) |
| 7+ Person Households | 31 (0.6%) | 0 (0.0%) |
| Total | 3,739 (67.7%) | 1,780 (32.3%) |
Female Fertility in Jefferson County
Fertility by Age in Jefferson County
Average fertility rate in Jefferson County is 54.0 births per 1,000 women. Women in the age bracket of 20 to 34 years have the highest fertility rate with 119.0 births per 1,000 women. Women in the age bracket of 20 to 34 years acount for 91.5% of all women with births.
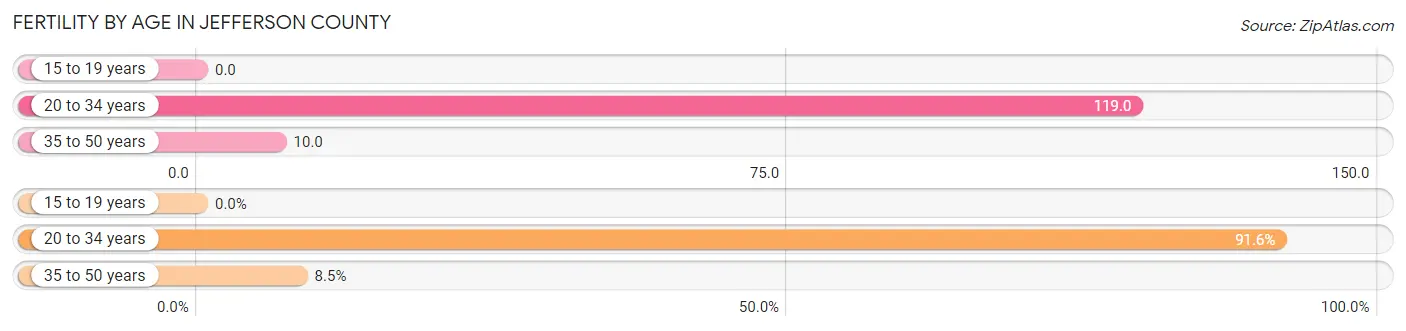
| Age Bracket | Women with Births | Births / 1,000 Women |
| 15 to 19 years | 0 (0.0%) | 0.0 |
| 20 to 34 years | 130 (91.5%) | 119.0 |
| 35 to 50 years | 12 (8.5%) | 10.0 |
| Total | 142 (100.0%) | 54.0 |
Fertility by Age by Marriage Status in Jefferson County
77.5% of women with births (142) in Jefferson County are married. The highest percentage of unmarried women with births falls into 20 to 34 years age bracket with 24.6% of them unmarried at the time of birth, while the lowest percentage of unmarried women with births belong to 35 to 50 years age bracket with 0.0% of them unmarried.
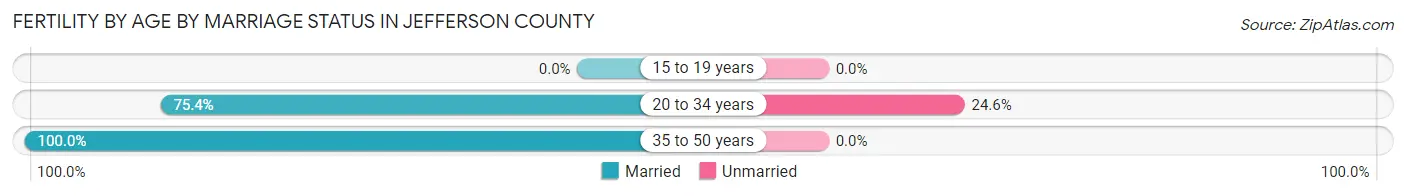
| Age Bracket | Married | Unmarried |
| 15 to 19 years | 0 (0.0%) | 0 (0.0%) |
| 20 to 34 years | 98 (75.4%) | 32 (24.6%) |
| 35 to 50 years | 12 (100.0%) | 0 (0.0%) |
| Total | 110 (77.5%) | 32 (22.5%) |
Fertility by Education in Jefferson County
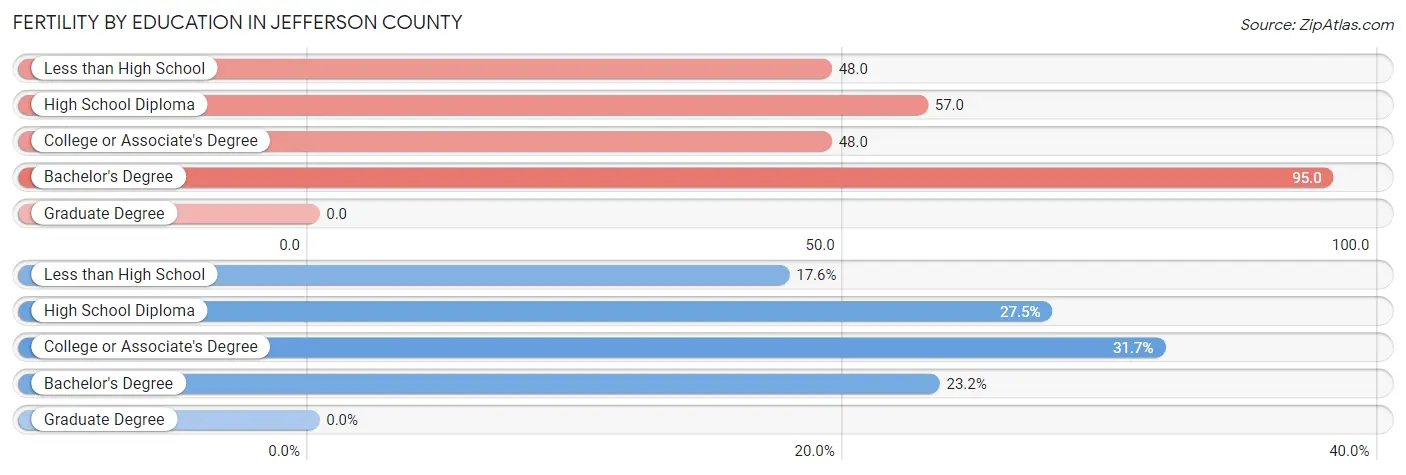
| Educational Attainment | Women with Births | Births / 1,000 Women |
| Less than High School | 25 (17.6%) | 48.0 |
| High School Diploma | 39 (27.5%) | 57.0 |
| College or Associate's Degree | 45 (31.7%) | 48.0 |
| Bachelor's Degree | 33 (23.2%) | 95.0 |
| Graduate Degree | 0 (0.0%) | 0.0 |
| Total | 142 (100.0%) | 54.0 |
Fertility by Education by Marriage Status in Jefferson County
22.5% of women with births in Jefferson County are unmarried. Women with the educational attainment of college or associate's degree are most likely to be married with 100.0% of them married at childbirth, while women with the educational attainment of less than high school are least likely to be married with 52.0% of them unmarried at childbirth.
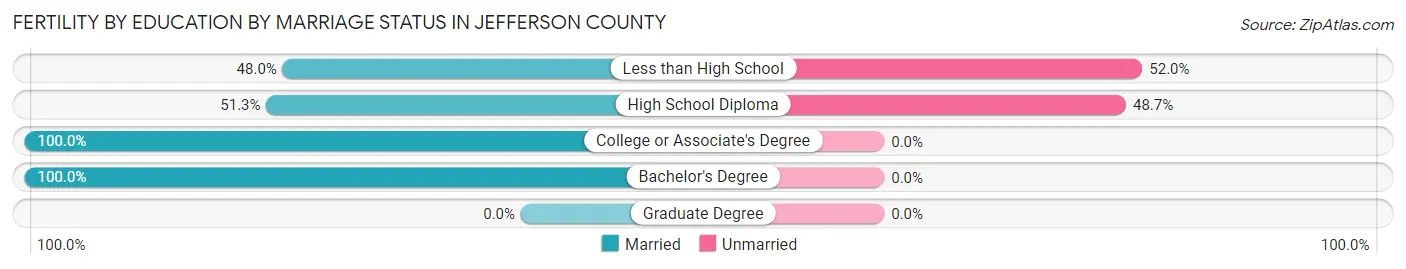
| Educational Attainment | Married | Unmarried |
| Less than High School | 12 (48.0%) | 13 (52.0%) |
| High School Diploma | 20 (51.3%) | 19 (48.7%) |
| College or Associate's Degree | 45 (100.0%) | 0 (0.0%) |
| Bachelor's Degree | 33 (100.0%) | 0 (0.0%) |
| Graduate Degree | 0 (0.0%) | 0 (0.0%) |
| Total | 110 (77.5%) | 32 (22.5%) |
Employment Characteristics in Jefferson County
Employment by Class of Employer in Jefferson County
Among the 5,936 employed individuals in Jefferson County, private company employees (3,118 | 52.5%), state government employees (919 | 15.5%), and not-for-profit organizations (676 | 11.4%) make up the most common classes of employment.
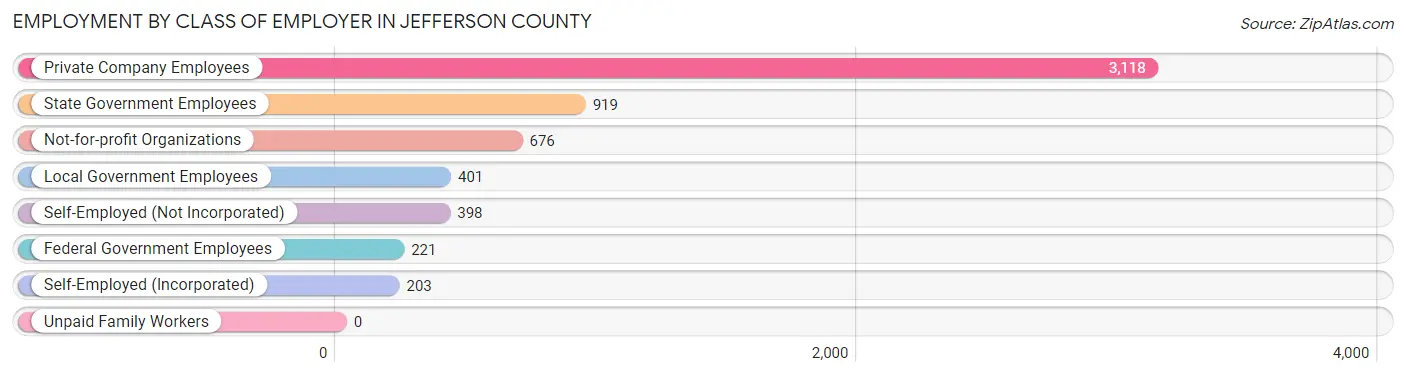
| Employer Class | # Employees | % Employees |
| Private Company Employees | 3,118 | 52.5% |
| Self-Employed (Incorporated) | 203 | 3.4% |
| Self-Employed (Not Incorporated) | 398 | 6.7% |
| Not-for-profit Organizations | 676 | 11.4% |
| Local Government Employees | 401 | 6.8% |
| State Government Employees | 919 | 15.5% |
| Federal Government Employees | 221 | 3.7% |
| Unpaid Family Workers | 0 | 0.0% |
| Total | 5,936 | 100.0% |
Employment Status by Age in Jefferson County
According to the labor force statistics for Jefferson County, out of the total population over 16 years of age (12,275), 52.2% or 6,408 individuals are in the labor force, with 6.7% or 429 of them unemployed. The age group with the highest labor force participation rate is 45 to 54 years, with 81.5% or 1,537 individuals in the labor force. Within the labor force, the 16 to 19 years age range has the highest percentage of unemployed individuals, with 22.8% or 44 of them being unemployed.
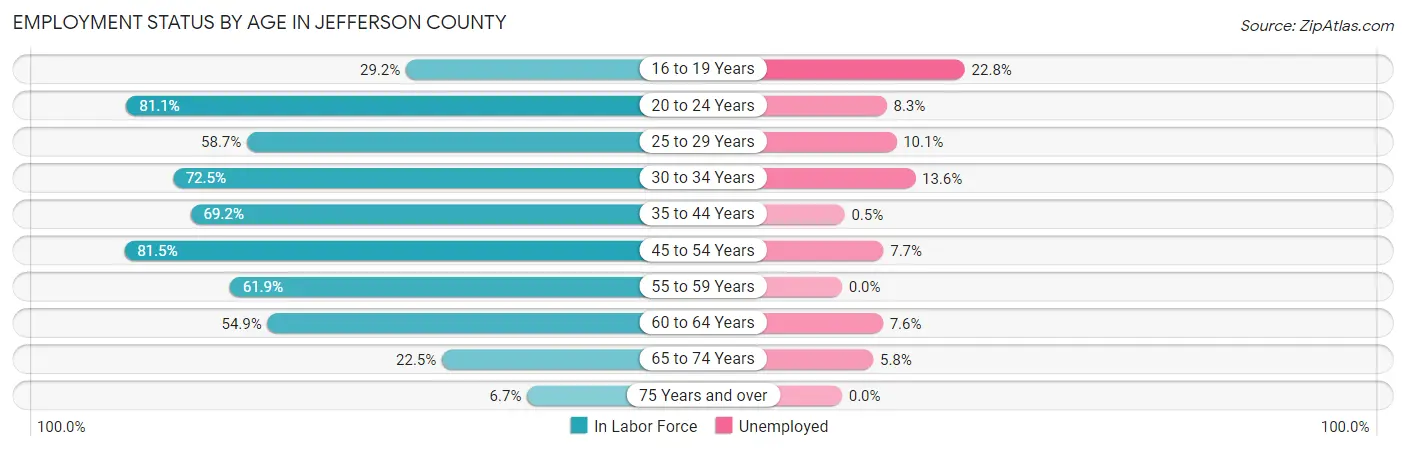
| Age Bracket | In Labor Force | Unemployed |
| 16 to 19 Years | 193 (29.2%) | 44 (22.8%) |
| 20 to 24 Years | 639 (81.1%) | 53 (8.3%) |
| 25 to 29 Years | 378 (58.7%) | 38 (10.1%) |
| 30 to 34 Years | 667 (72.5%) | 91 (13.6%) |
| 35 to 44 Years | 1,129 (69.2%) | 6 (0.5%) |
| 45 to 54 Years | 1,537 (81.5%) | 118 (7.7%) |
| 55 to 59 Years | 692 (61.9%) | 0 (0.0%) |
| 60 to 64 Years | 628 (54.9%) | 48 (7.6%) |
| 65 to 74 Years | 445 (22.5%) | 26 (5.8%) |
| 75 Years and over | 101 (6.7%) | 0 (0.0%) |
| Total | 6,408 (52.2%) | 429 (6.7%) |
Employment Status by Educational Attainment in Jefferson County
According to labor force statistics for Jefferson County, 68.5% of individuals (5,030) out of the total population between 25 and 64 years of age (7,343) are in the labor force, with 6.0% or 302 of them being unemployed. The group with the highest labor force participation rate are those with the educational attainment of bachelor's degree or higher, with 80.9% or 1,040 individuals in the labor force. Within the labor force, individuals with less than high school education have the highest percentage of unemployment, with 21.8% or 86 of them being unemployed.
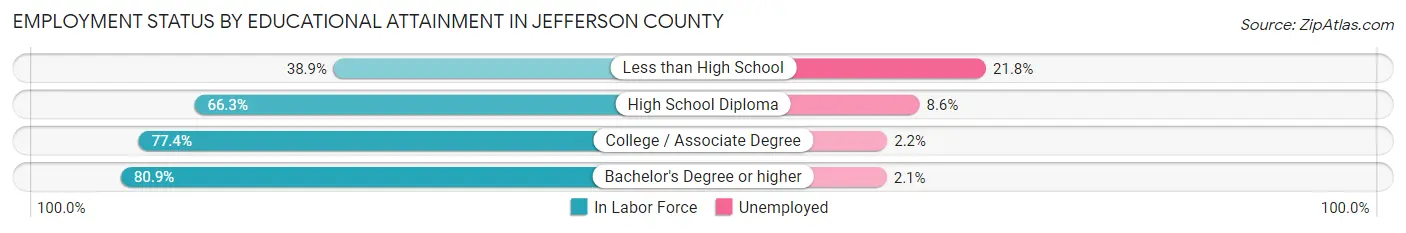
| Educational Attainment | In Labor Force | Unemployed |
| Less than High School | 395 (38.9%) | 221 (21.8%) |
| High School Diploma | 1,830 (66.3%) | 237 (8.6%) |
| College / Associate Degree | 1,766 (77.4%) | 50 (2.2%) |
| Bachelor's Degree or higher | 1,040 (80.9%) | 27 (2.1%) |
| Total | 5,030 (68.5%) | 441 (6.0%) |
Employment Occupations by Sex in Jefferson County
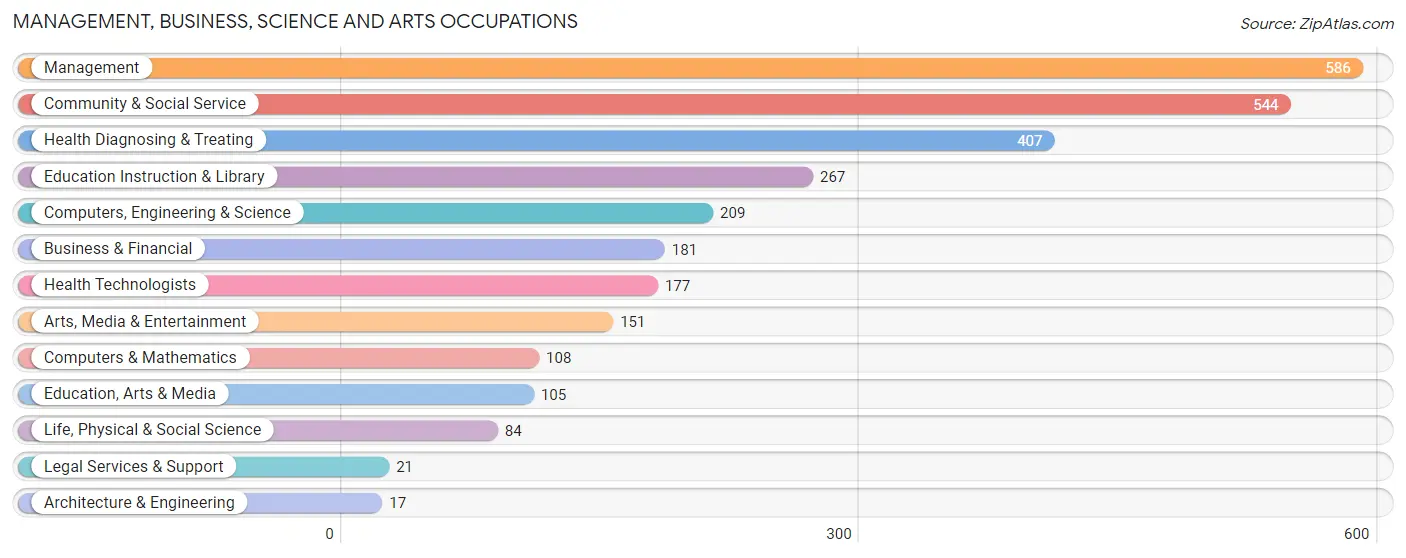
Management, Business, Science and Arts Occupations
The most common Management, Business, Science and Arts occupations in Jefferson County are Management (586 | 9.9%), Community & Social Service (544 | 9.1%), Health Diagnosing & Treating (407 | 6.8%), Education Instruction & Library (267 | 4.5%), and Computers, Engineering & Science (209 | 3.5%).
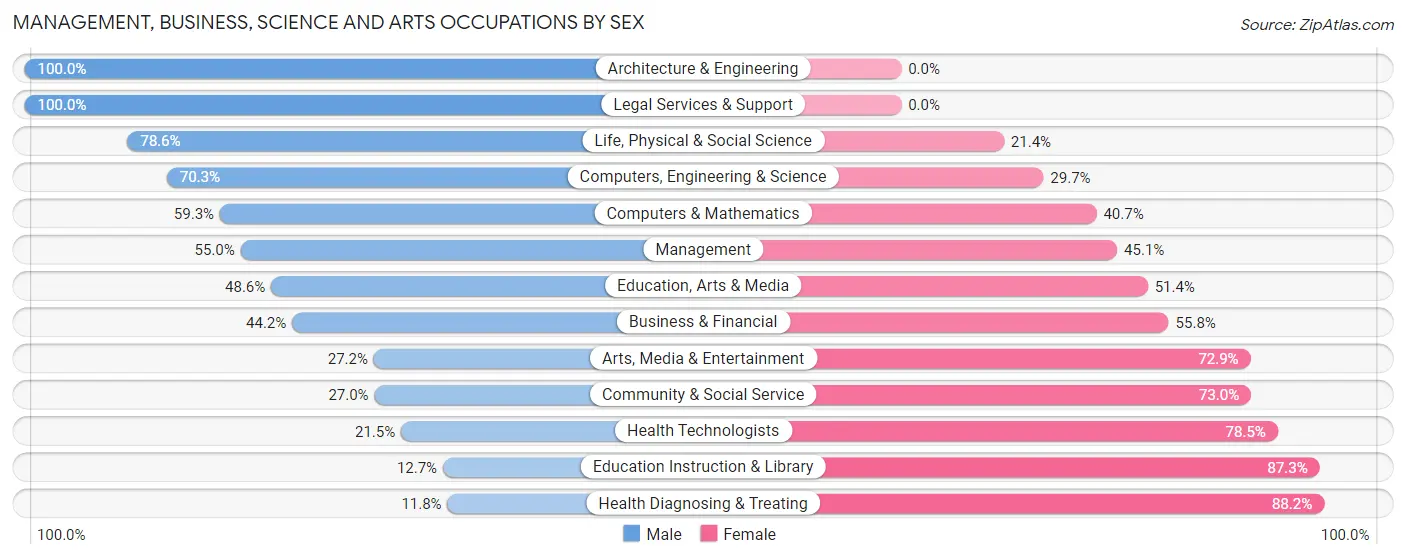
Management, Business, Science and Arts Occupations by Sex
Within the Management, Business, Science and Arts occupations in Jefferson County, the most male-oriented occupations are Architecture & Engineering (100.0%), Legal Services & Support (100.0%), and Life, Physical & Social Science (78.6%), while the most female-oriented occupations are Health Diagnosing & Treating (88.2%), Education Instruction & Library (87.3%), and Health Technologists (78.5%).
| Occupation | Male | Female |
| Management | 322 (54.9%) | 264 (45.1%) |
| Business & Financial | 80 (44.2%) | 101 (55.8%) |
| Computers, Engineering & Science | 147 (70.3%) | 62 (29.7%) |
| Computers & Mathematics | 64 (59.3%) | 44 (40.7%) |
| Architecture & Engineering | 17 (100.0%) | 0 (0.0%) |
| Life, Physical & Social Science | 66 (78.6%) | 18 (21.4%) |
| Community & Social Service | 147 (27.0%) | 397 (73.0%) |
| Education, Arts & Media | 51 (48.6%) | 54 (51.4%) |
| Legal Services & Support | 21 (100.0%) | 0 (0.0%) |
| Education Instruction & Library | 34 (12.7%) | 233 (87.3%) |
| Arts, Media & Entertainment | 41 (27.2%) | 110 (72.9%) |
| Health Diagnosing & Treating | 48 (11.8%) | 359 (88.2%) |
| Health Technologists | 38 (21.5%) | 139 (78.5%) |
| Total (Category) | 744 (38.6%) | 1,183 (61.4%) |
| Total (Overall) | 2,877 (48.3%) | 3,074 (51.7%) |
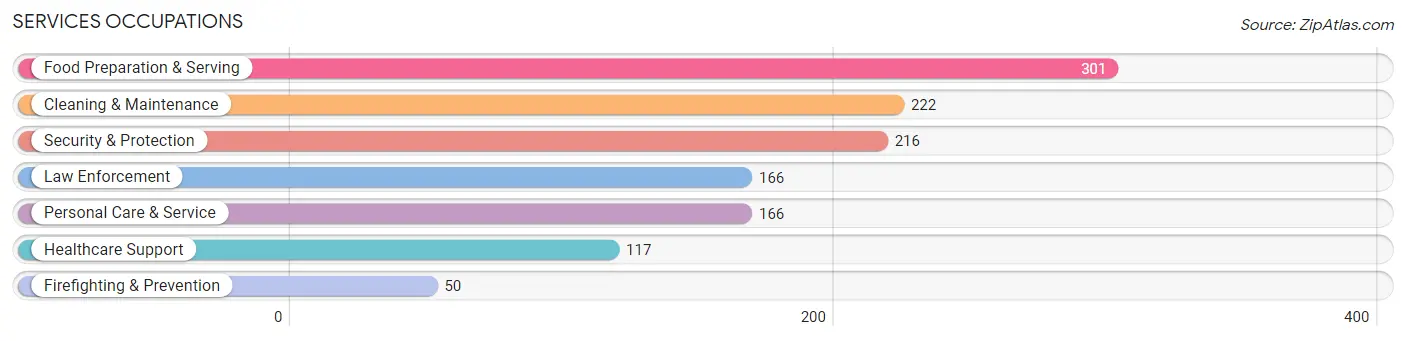
Services Occupations
The most common Services occupations in Jefferson County are Food Preparation & Serving (301 | 5.1%), Cleaning & Maintenance (222 | 3.7%), Security & Protection (216 | 3.6%), Law Enforcement (166 | 2.8%), and Personal Care & Service (166 | 2.8%).
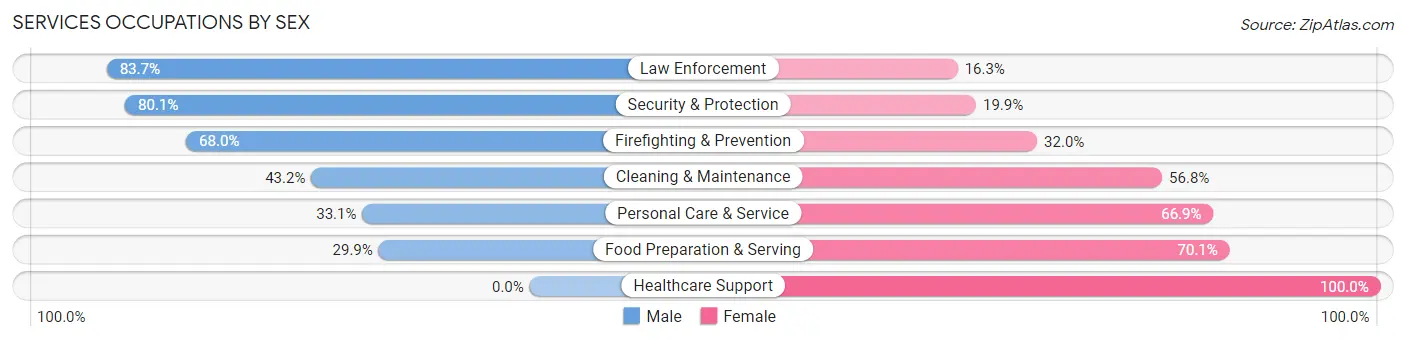
Services Occupations by Sex
Within the Services occupations in Jefferson County, the most male-oriented occupations are Law Enforcement (83.7%), Security & Protection (80.1%), and Firefighting & Prevention (68.0%), while the most female-oriented occupations are Healthcare Support (100.0%), Food Preparation & Serving (70.1%), and Personal Care & Service (66.9%).
| Occupation | Male | Female |
| Healthcare Support | 0 (0.0%) | 117 (100.0%) |
| Security & Protection | 173 (80.1%) | 43 (19.9%) |
| Firefighting & Prevention | 34 (68.0%) | 16 (32.0%) |
| Law Enforcement | 139 (83.7%) | 27 (16.3%) |
| Food Preparation & Serving | 90 (29.9%) | 211 (70.1%) |
| Cleaning & Maintenance | 96 (43.2%) | 126 (56.8%) |
| Personal Care & Service | 55 (33.1%) | 111 (66.9%) |
| Total (Category) | 414 (40.5%) | 608 (59.5%) |
| Total (Overall) | 2,877 (48.3%) | 3,074 (51.7%) |
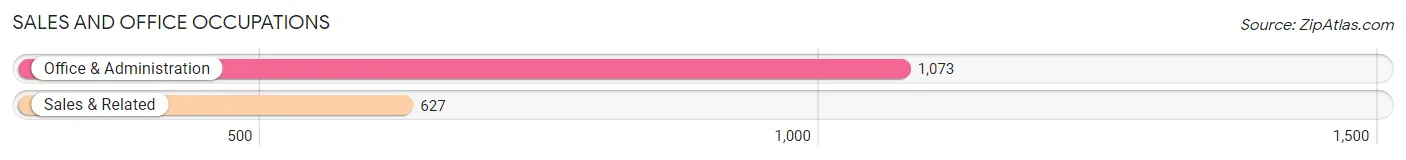
Sales and Office Occupations
The most common Sales and Office occupations in Jefferson County are Office & Administration (1,073 | 18.0%), and Sales & Related (627 | 10.5%).
Sales and Office Occupations by Sex
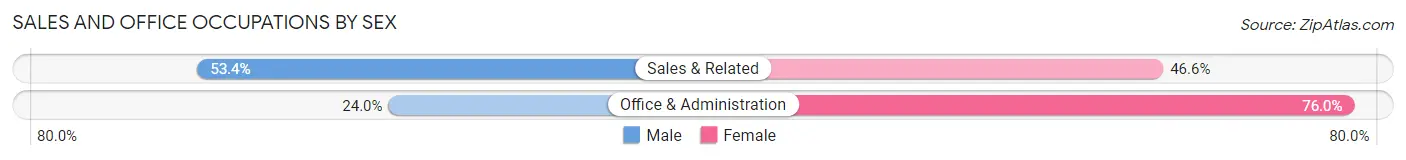
| Occupation | Male | Female |
| Sales & Related | 335 (53.4%) | 292 (46.6%) |
| Office & Administration | 258 (24.0%) | 815 (76.0%) |
| Total (Category) | 593 (34.9%) | 1,107 (65.1%) |
| Total (Overall) | 2,877 (48.3%) | 3,074 (51.7%) |
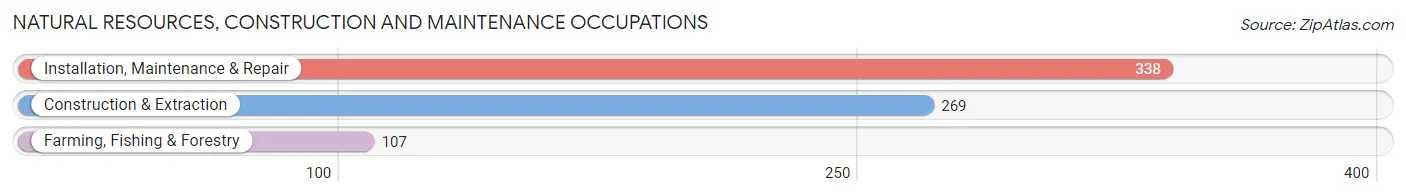
Natural Resources, Construction and Maintenance Occupations
The most common Natural Resources, Construction and Maintenance occupations in Jefferson County are Installation, Maintenance & Repair (338 | 5.7%), Construction & Extraction (269 | 4.5%), and Farming, Fishing & Forestry (107 | 1.8%).
Natural Resources, Construction and Maintenance Occupations by Sex
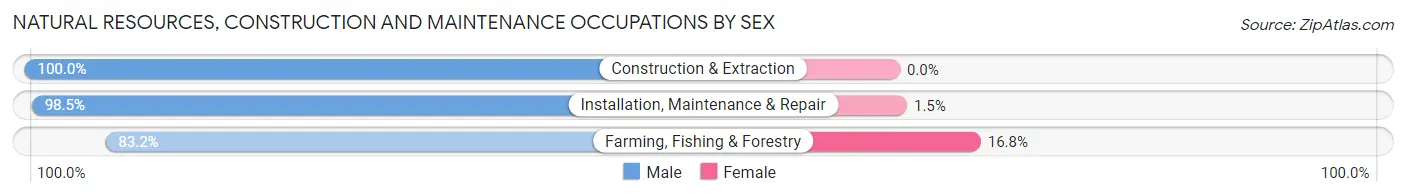
| Occupation | Male | Female |
| Farming, Fishing & Forestry | 89 (83.2%) | 18 (16.8%) |
| Construction & Extraction | 269 (100.0%) | 0 (0.0%) |
| Installation, Maintenance & Repair | 333 (98.5%) | 5 (1.5%) |
| Total (Category) | 691 (96.8%) | 23 (3.2%) |
| Total (Overall) | 2,877 (48.3%) | 3,074 (51.7%) |
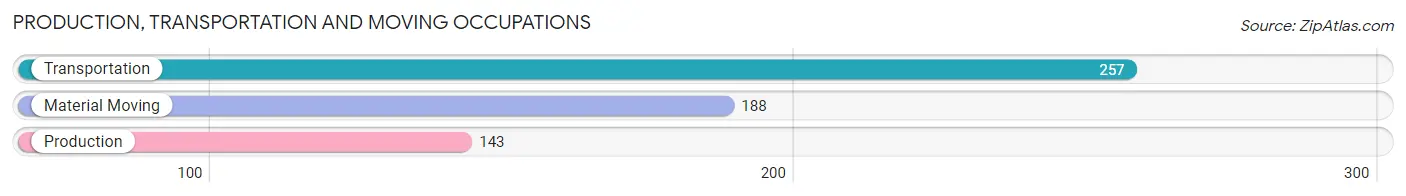
Production, Transportation and Moving Occupations
The most common Production, Transportation and Moving occupations in Jefferson County are Transportation (257 | 4.3%), Material Moving (188 | 3.2%), and Production (143 | 2.4%).
Production, Transportation and Moving Occupations by Sex
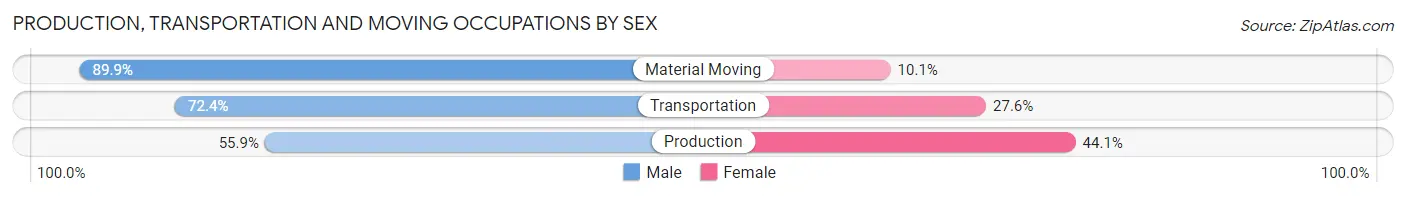
| Occupation | Male | Female |
| Production | 80 (55.9%) | 63 (44.1%) |
| Transportation | 186 (72.4%) | 71 (27.6%) |
| Material Moving | 169 (89.9%) | 19 (10.1%) |
| Total (Category) | 435 (74.0%) | 153 (26.0%) |
| Total (Overall) | 2,877 (48.3%) | 3,074 (51.7%) |
Employment Industries by Sex in Jefferson County
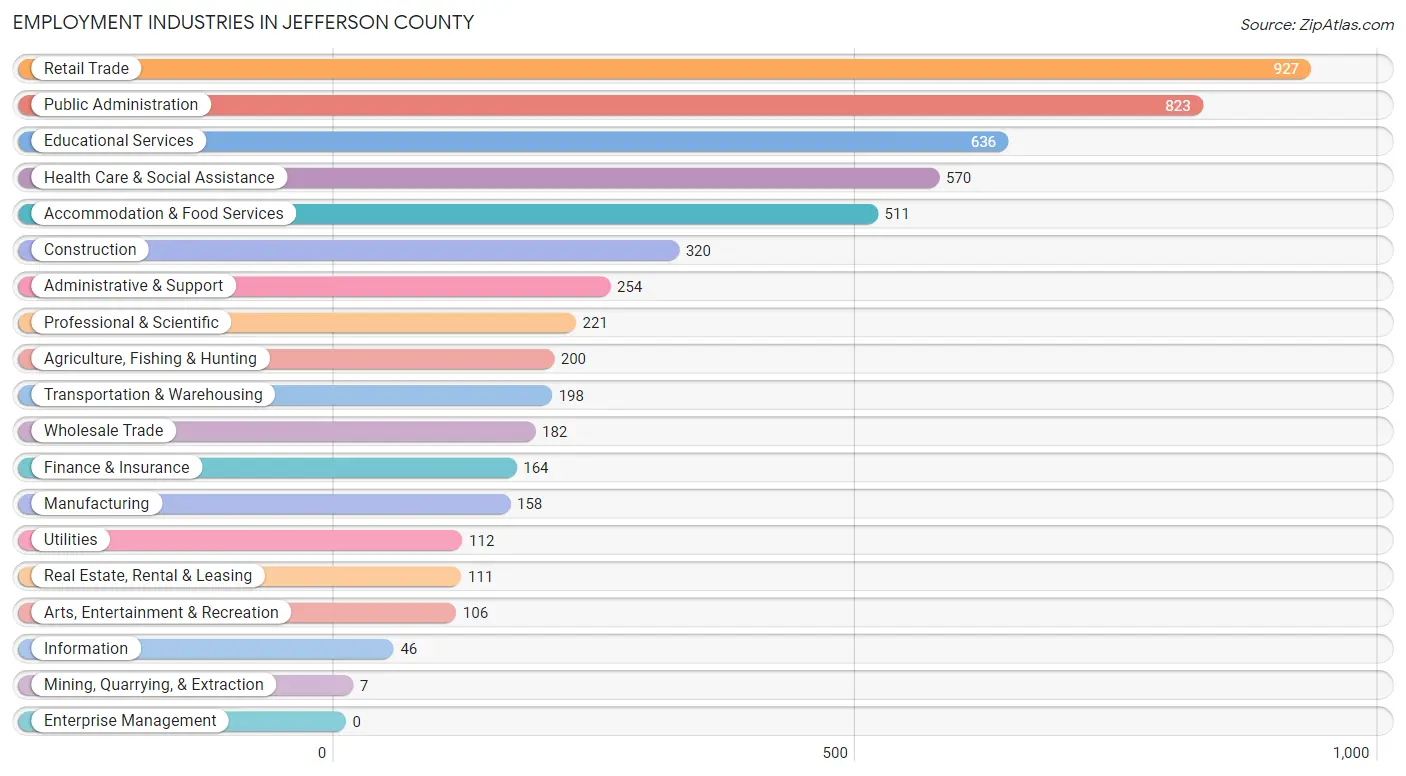
Employment Industries in Jefferson County
The major employment industries in Jefferson County include Retail Trade (927 | 15.6%), Public Administration (823 | 13.8%), Educational Services (636 | 10.7%), Health Care & Social Assistance (570 | 9.6%), and Accommodation & Food Services (511 | 8.6%).
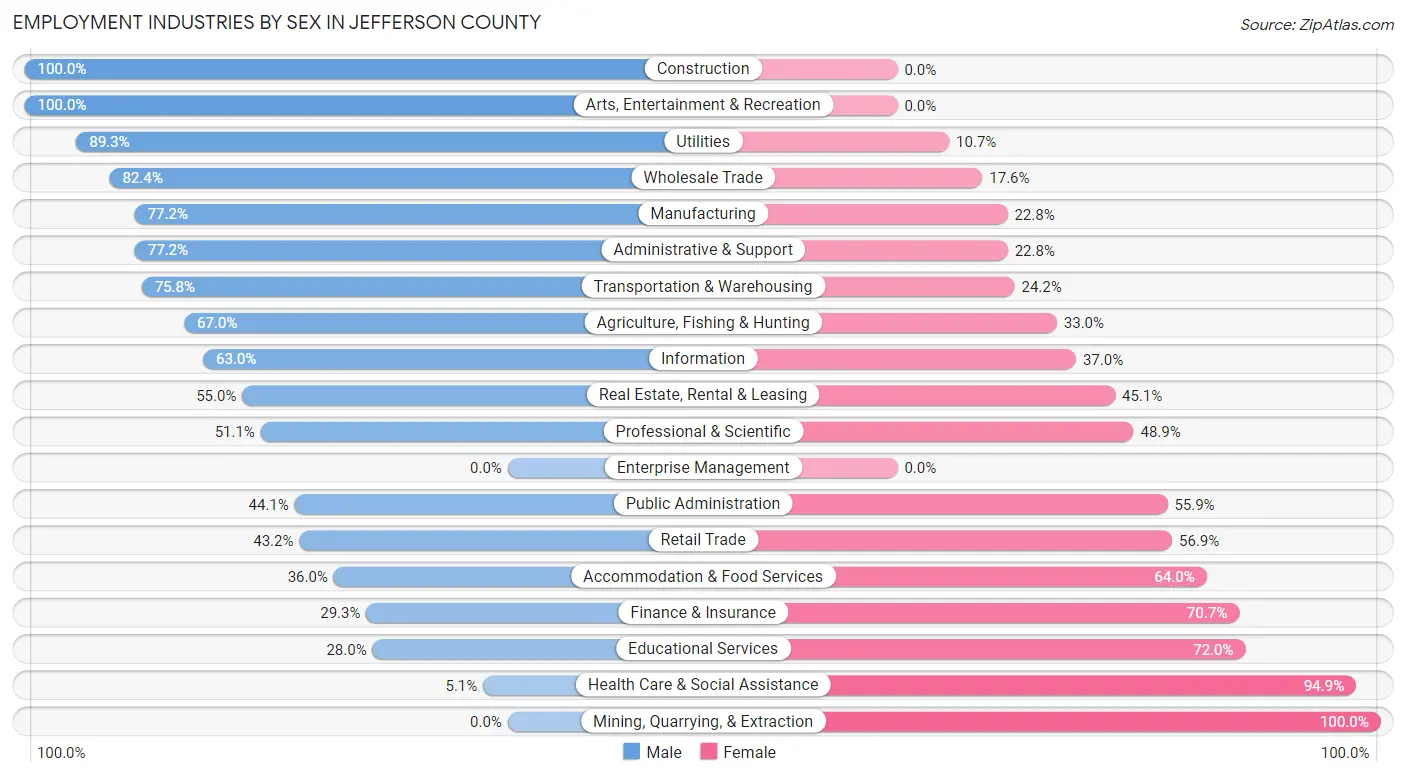
Employment Industries by Sex in Jefferson County
The Jefferson County industries that see more men than women are Construction (100.0%), Arts, Entertainment & Recreation (100.0%), and Utilities (89.3%), whereas the industries that tend to have a higher number of women are Mining, Quarrying, & Extraction (100.0%), Health Care & Social Assistance (94.9%), and Educational Services (72.0%).
| Industry | Male | Female |
| Agriculture, Fishing & Hunting | 134 (67.0%) | 66 (33.0%) |
| Mining, Quarrying, & Extraction | 0 (0.0%) | 7 (100.0%) |
| Construction | 320 (100.0%) | 0 (0.0%) |
| Manufacturing | 122 (77.2%) | 36 (22.8%) |
| Wholesale Trade | 150 (82.4%) | 32 (17.6%) |
| Retail Trade | 400 (43.1%) | 527 (56.9%) |
| Transportation & Warehousing | 150 (75.8%) | 48 (24.2%) |
| Utilities | 100 (89.3%) | 12 (10.7%) |
| Information | 29 (63.0%) | 17 (37.0%) |
| Finance & Insurance | 48 (29.3%) | 116 (70.7%) |
| Real Estate, Rental & Leasing | 61 (54.9%) | 50 (45.1%) |
| Professional & Scientific | 113 (51.1%) | 108 (48.9%) |
| Enterprise Management | 0 (0.0%) | 0 (0.0%) |
| Administrative & Support | 196 (77.2%) | 58 (22.8%) |
| Educational Services | 178 (28.0%) | 458 (72.0%) |
| Health Care & Social Assistance | 29 (5.1%) | 541 (94.9%) |
| Arts, Entertainment & Recreation | 106 (100.0%) | 0 (0.0%) |
| Accommodation & Food Services | 184 (36.0%) | 327 (64.0%) |
| Public Administration | 363 (44.1%) | 460 (55.9%) |
| Total | 2,877 (48.3%) | 3,074 (51.7%) |
Education in Jefferson County
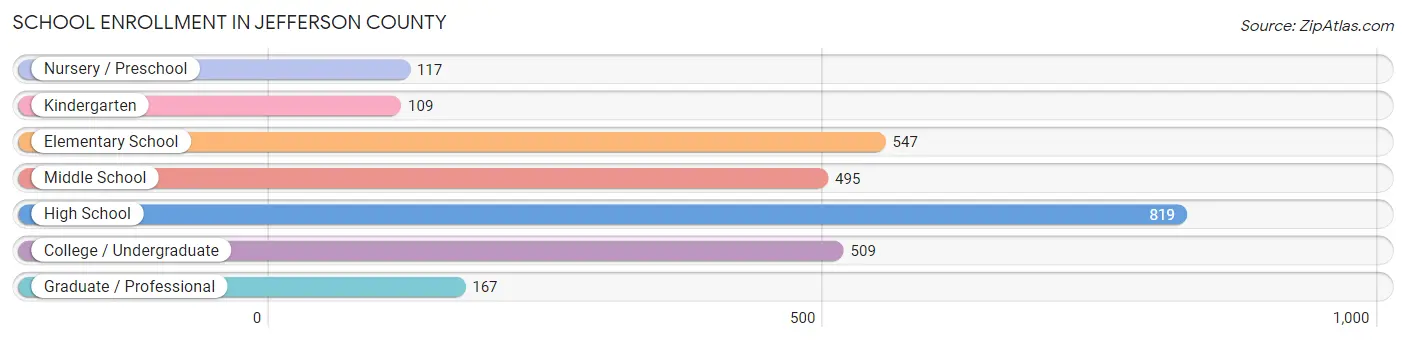
School Enrollment in Jefferson County
The most common levels of schooling among the 2,763 students in Jefferson County are high school (819 | 29.6%), elementary school (547 | 19.8%), and college / undergraduate (509 | 18.4%).
| School Level | # Students | % Students |
| Nursery / Preschool | 117 | 4.2% |
| Kindergarten | 109 | 3.9% |
| Elementary School | 547 | 19.8% |
| Middle School | 495 | 17.9% |
| High School | 819 | 29.6% |
| College / Undergraduate | 509 | 18.4% |
| Graduate / Professional | 167 | 6.0% |
| Total | 2,763 | 100.0% |
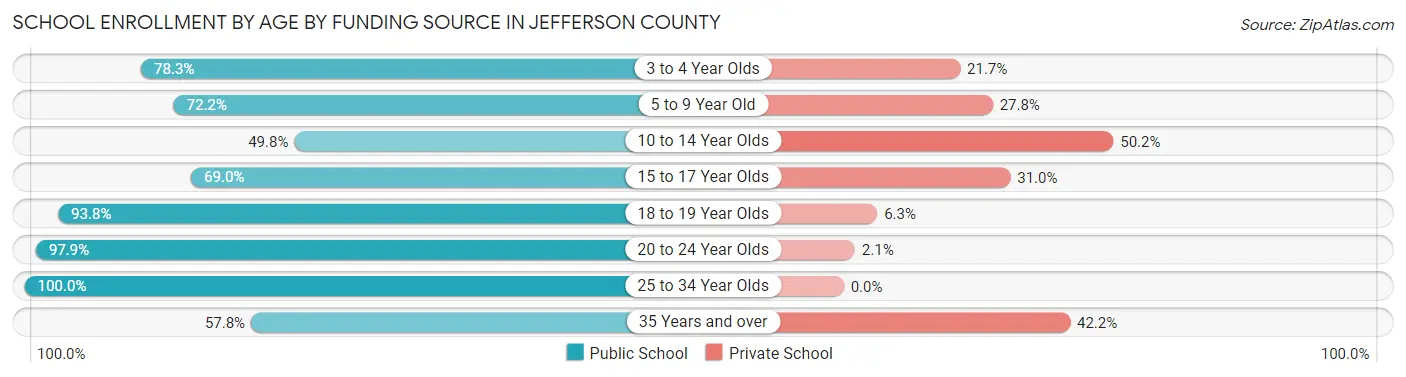
School Enrollment by Age by Funding Source in Jefferson County
Out of a total of 2,763 students who are enrolled in schools in Jefferson County, 743 (26.9%) attend a private institution, while the remaining 2,020 (73.1%) are enrolled in public schools. The age group of 10 to 14 year olds has the highest likelihood of being enrolled in private schools, with 335 (50.2% in the age bracket) enrolled. Conversely, the age group of 25 to 34 year olds has the lowest likelihood of being enrolled in a private school, with 164 (100.0% in the age bracket) attending a public institution.
| Age Bracket | Public School | Private School |
| 3 to 4 Year Olds | 65 (78.3%) | 18 (21.7%) |
| 5 to 9 Year Old | 445 (72.2%) | 171 (27.8%) |
| 10 to 14 Year Olds | 332 (49.8%) | 335 (50.2%) |
| 15 to 17 Year Olds | 340 (69.0%) | 153 (31.0%) |
| 18 to 19 Year Olds | 195 (93.8%) | 13 (6.2%) |
| 20 to 24 Year Olds | 421 (97.9%) | 9 (2.1%) |
| 25 to 34 Year Olds | 164 (100.0%) | 0 (0.0%) |
| 35 Years and over | 59 (57.8%) | 43 (42.2%) |
| Total | 2,020 (73.1%) | 743 (26.9%) |
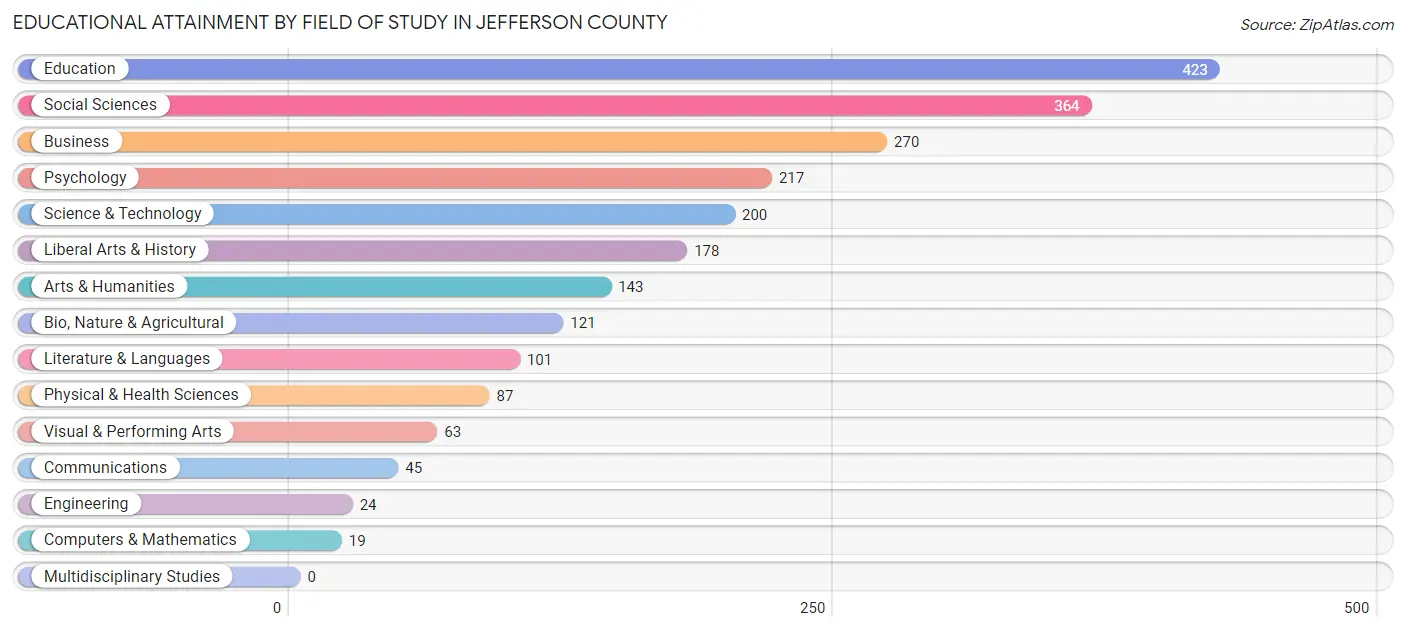
Educational Attainment by Field of Study in Jefferson County
Education (423 | 18.8%), social sciences (364 | 16.1%), business (270 | 12.0%), psychology (217 | 9.6%), and science & technology (200 | 8.9%) are the most common fields of study among 2,255 individuals in Jefferson County who have obtained a bachelor's degree or higher.
| Field of Study | # Graduates | % Graduates |
| Computers & Mathematics | 19 | 0.8% |
| Bio, Nature & Agricultural | 121 | 5.4% |
| Physical & Health Sciences | 87 | 3.9% |
| Psychology | 217 | 9.6% |
| Social Sciences | 364 | 16.1% |
| Engineering | 24 | 1.1% |
| Multidisciplinary Studies | 0 | 0.0% |
| Science & Technology | 200 | 8.9% |
| Business | 270 | 12.0% |
| Education | 423 | 18.8% |
| Literature & Languages | 101 | 4.5% |
| Liberal Arts & History | 178 | 7.9% |
| Visual & Performing Arts | 63 | 2.8% |
| Communications | 45 | 2.0% |
| Arts & Humanities | 143 | 6.3% |
| Total | 2,255 | 100.0% |
Transportation & Commute in Jefferson County
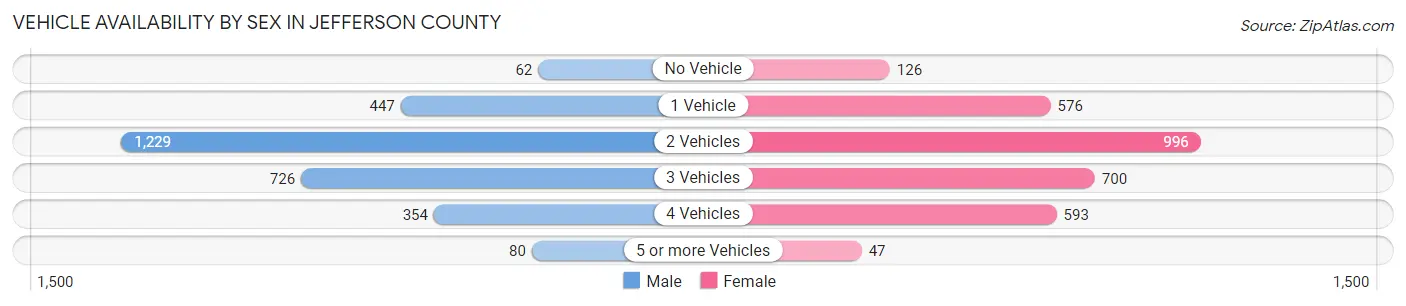
Vehicle Availability by Sex in Jefferson County
The most prevalent vehicle ownership categories in Jefferson County are males with 2 vehicles (1,229, accounting for 42.4%) and females with 2 vehicles (996, making up 40.5%).
| Vehicles Available | Male | Female |
| No Vehicle | 62 (2.1%) | 126 (4.2%) |
| 1 Vehicle | 447 (15.4%) | 576 (19.0%) |
| 2 Vehicles | 1,229 (42.4%) | 996 (32.8%) |
| 3 Vehicles | 726 (25.1%) | 700 (23.0%) |
| 4 Vehicles | 354 (12.2%) | 593 (19.5%) |
| 5 or more Vehicles | 80 (2.8%) | 47 (1.5%) |
| Total | 2,898 (100.0%) | 3,038 (100.0%) |
Commute Time in Jefferson County
The most frequently occuring commute durations in Jefferson County are 45 to 59 minutes (1,071 commuters, 19.0%), 30 to 34 minutes (919 commuters, 16.3%), and 25 to 29 minutes (563 commuters, 10.0%).
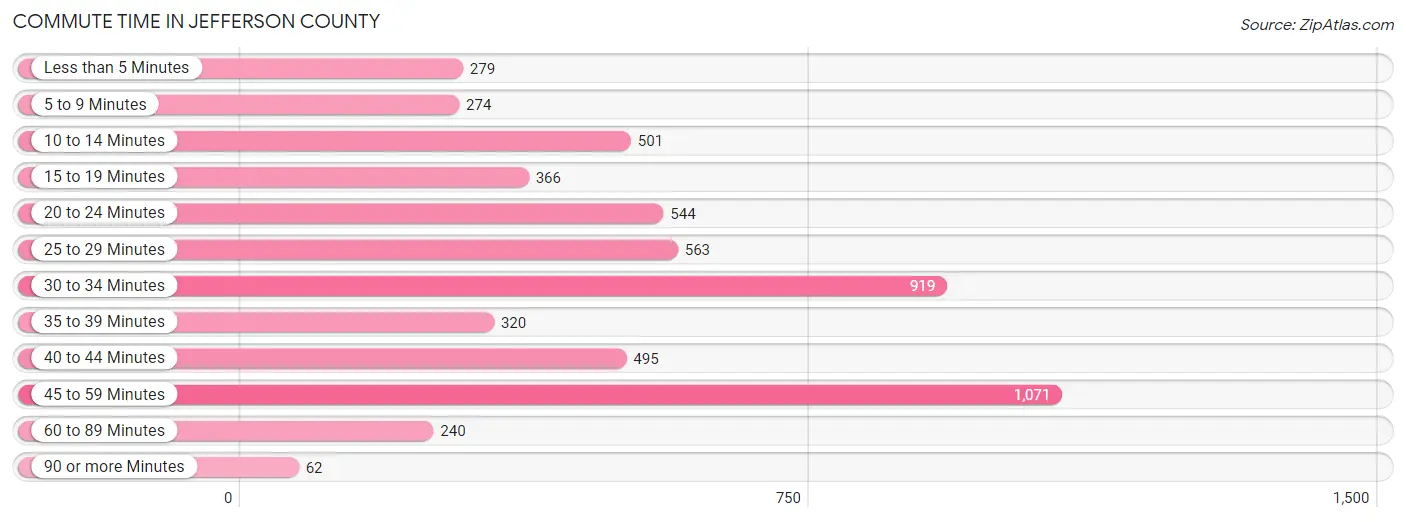
| Commute Time | # Commuters | % Commuters |
| Less than 5 Minutes | 279 | 5.0% |
| 5 to 9 Minutes | 274 | 4.9% |
| 10 to 14 Minutes | 501 | 8.9% |
| 15 to 19 Minutes | 366 | 6.5% |
| 20 to 24 Minutes | 544 | 9.7% |
| 25 to 29 Minutes | 563 | 10.0% |
| 30 to 34 Minutes | 919 | 16.3% |
| 35 to 39 Minutes | 320 | 5.7% |
| 40 to 44 Minutes | 495 | 8.8% |
| 45 to 59 Minutes | 1,071 | 19.0% |
| 60 to 89 Minutes | 240 | 4.3% |
| 90 or more Minutes | 62 | 1.1% |
Commute Time by Sex in Jefferson County
The most common commute times in Jefferson County are 45 to 59 minutes (549 commuters, 19.9%) for males and 30 to 34 minutes (630 commuters, 21.9%) for females.
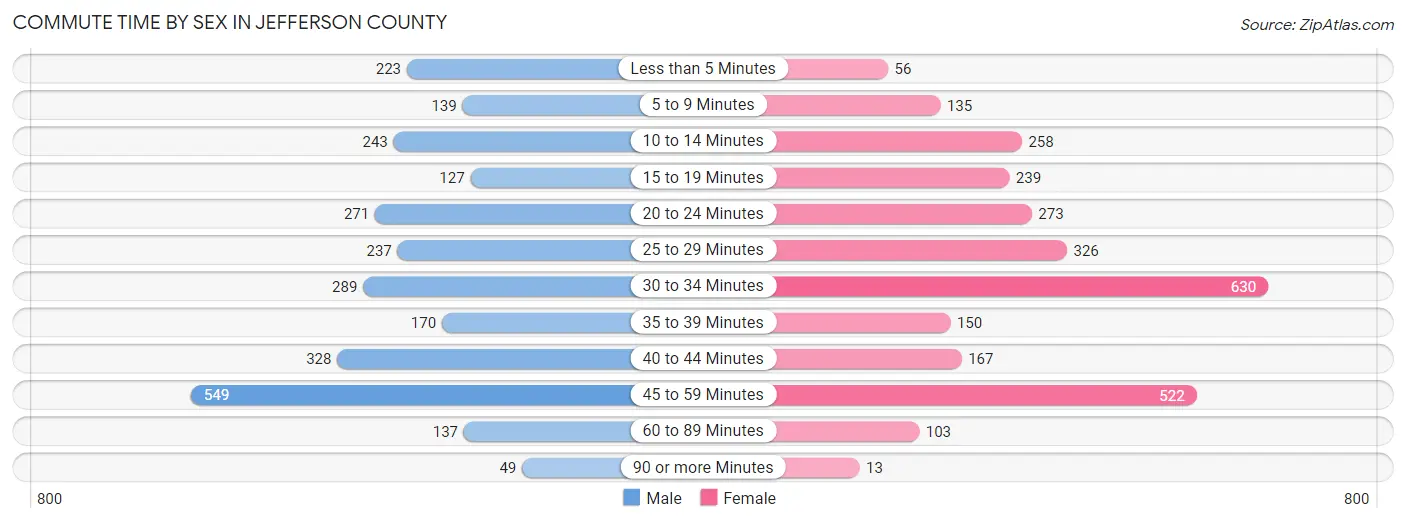
| Commute Time | Male | Female |
| Less than 5 Minutes | 223 (8.1%) | 56 (1.9%) |
| 5 to 9 Minutes | 139 (5.0%) | 135 (4.7%) |
| 10 to 14 Minutes | 243 (8.8%) | 258 (9.0%) |
| 15 to 19 Minutes | 127 (4.6%) | 239 (8.3%) |
| 20 to 24 Minutes | 271 (9.8%) | 273 (9.5%) |
| 25 to 29 Minutes | 237 (8.6%) | 326 (11.4%) |
| 30 to 34 Minutes | 289 (10.5%) | 630 (21.9%) |
| 35 to 39 Minutes | 170 (6.1%) | 150 (5.2%) |
| 40 to 44 Minutes | 328 (11.9%) | 167 (5.8%) |
| 45 to 59 Minutes | 549 (19.9%) | 522 (18.2%) |
| 60 to 89 Minutes | 137 (5.0%) | 103 (3.6%) |
| 90 or more Minutes | 49 (1.8%) | 13 (0.4%) |
Time of Departure to Work by Sex in Jefferson County
The most frequent times of departure to work in Jefferson County are 7:00 AM to 7:29 AM (586, 21.2%) for males and 7:00 AM to 7:29 AM (772, 26.9%) for females.
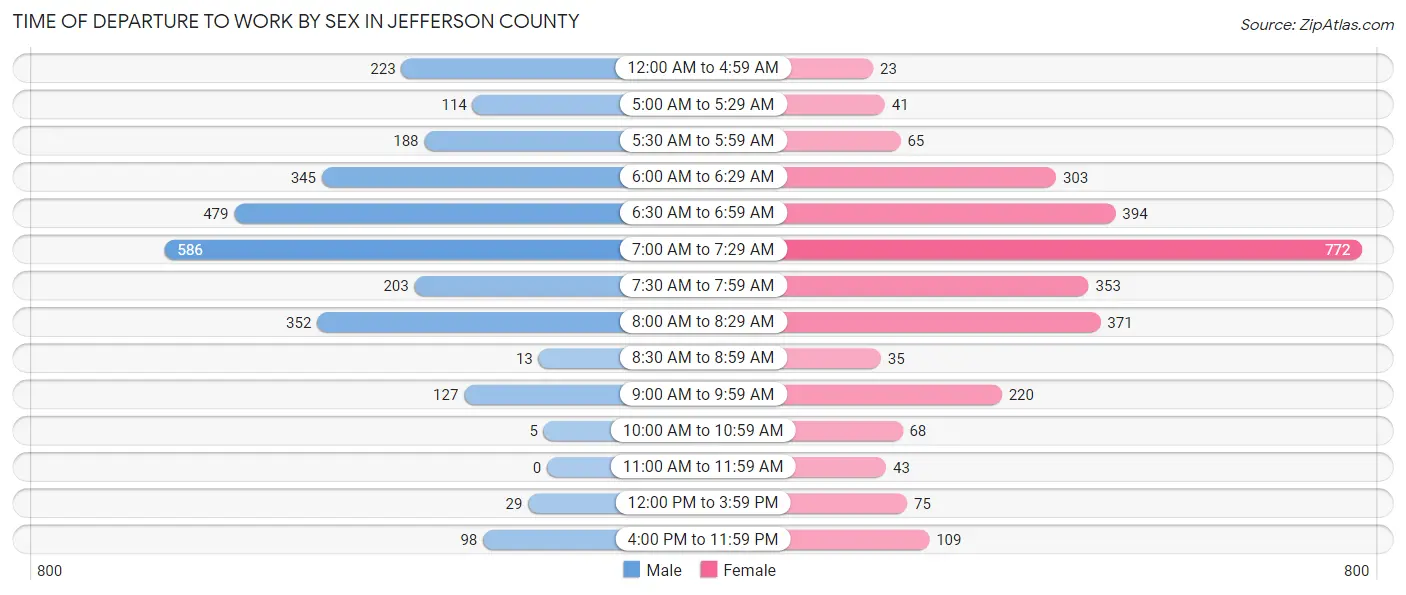
| Time of Departure | Male | Female |
| 12:00 AM to 4:59 AM | 223 (8.1%) | 23 (0.8%) |
| 5:00 AM to 5:29 AM | 114 (4.1%) | 41 (1.4%) |
| 5:30 AM to 5:59 AM | 188 (6.8%) | 65 (2.3%) |
| 6:00 AM to 6:29 AM | 345 (12.5%) | 303 (10.5%) |
| 6:30 AM to 6:59 AM | 479 (17.3%) | 394 (13.7%) |
| 7:00 AM to 7:29 AM | 586 (21.2%) | 772 (26.9%) |
| 7:30 AM to 7:59 AM | 203 (7.3%) | 353 (12.3%) |
| 8:00 AM to 8:29 AM | 352 (12.7%) | 371 (12.9%) |
| 8:30 AM to 8:59 AM | 13 (0.5%) | 35 (1.2%) |
| 9:00 AM to 9:59 AM | 127 (4.6%) | 220 (7.7%) |
| 10:00 AM to 10:59 AM | 5 (0.2%) | 68 (2.4%) |
| 11:00 AM to 11:59 AM | 0 (0.0%) | 43 (1.5%) |
| 12:00 PM to 3:59 PM | 29 (1.1%) | 75 (2.6%) |
| 4:00 PM to 11:59 PM | 98 (3.5%) | 109 (3.8%) |
| Total | 2,762 (100.0%) | 2,872 (100.0%) |
Housing Occupancy in Jefferson County
Occupancy by Ownership in Jefferson County
Of the total 5,519 dwellings in Jefferson County, owner-occupied units account for 4,136 (74.9%), while renter-occupied units make up 1,383 (25.1%).
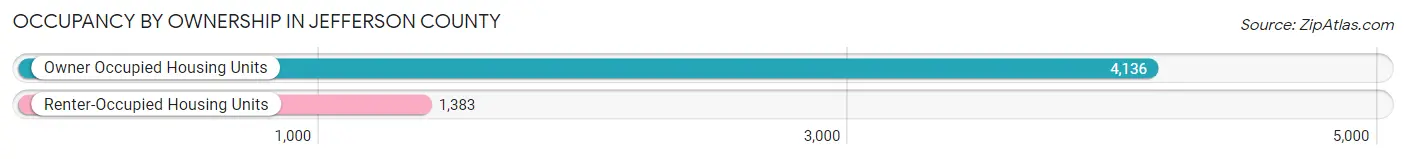
| Occupancy | # Housing Units | % Housing Units |
| Owner Occupied Housing Units | 4,136 | 74.9% |
| Renter-Occupied Housing Units | 1,383 | 25.1% |
| Total Occupied Housing Units | 5,519 | 100.0% |
Occupancy by Household Size in Jefferson County
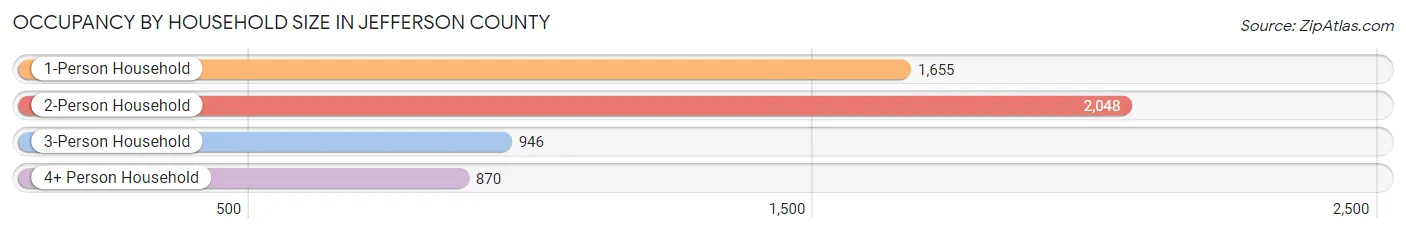
| Household Size | # Housing Units | % Housing Units |
| 1-Person Household | 1,655 | 30.0% |
| 2-Person Household | 2,048 | 37.1% |
| 3-Person Household | 946 | 17.1% |
| 4+ Person Household | 870 | 15.8% |
| Total Housing Units | 5,519 | 100.0% |
Occupancy by Ownership by Household Size in Jefferson County
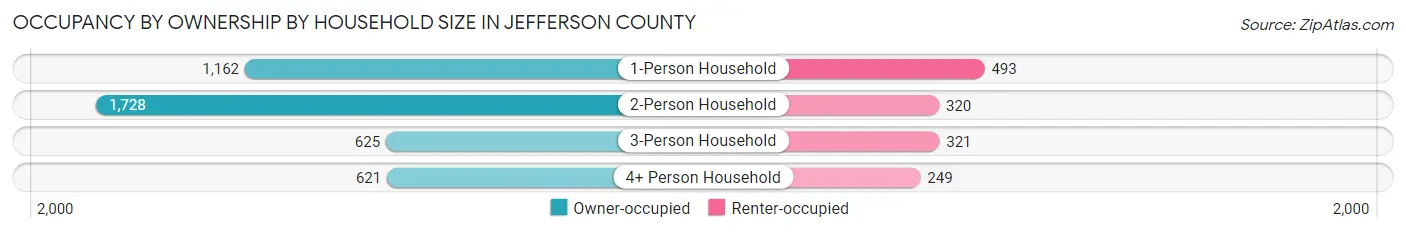
| Household Size | Owner-occupied | Renter-occupied |
| 1-Person Household | 1,162 (70.2%) | 493 (29.8%) |
| 2-Person Household | 1,728 (84.4%) | 320 (15.6%) |
| 3-Person Household | 625 (66.1%) | 321 (33.9%) |
| 4+ Person Household | 621 (71.4%) | 249 (28.6%) |
| Total Housing Units | 4,136 (74.9%) | 1,383 (25.1%) |
Occupancy by Educational Attainment in Jefferson County
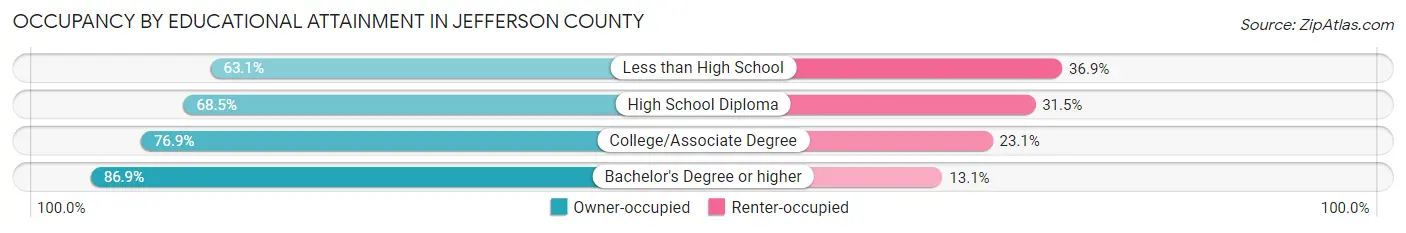
| Household Size | Owner-occupied | Renter-occupied |
| Less than High School | 411 (63.1%) | 240 (36.9%) |
| High School Diploma | 1,214 (68.5%) | 559 (31.5%) |
| College/Associate Degree | 1,373 (76.9%) | 412 (23.1%) |
| Bachelor's Degree or higher | 1,138 (86.9%) | 172 (13.1%) |
Occupancy by Age of Householder in Jefferson County
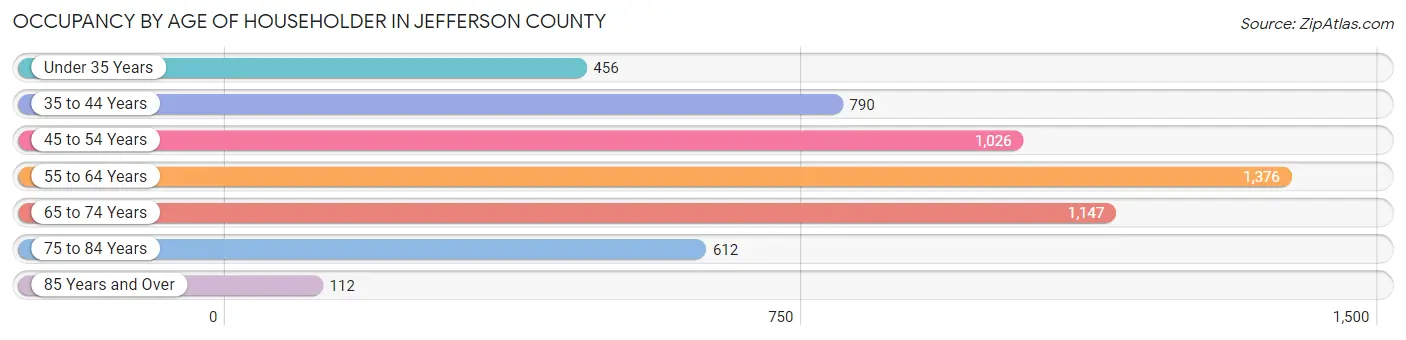
| Age Bracket | # Households | % Households |
| Under 35 Years | 456 | 8.3% |
| 35 to 44 Years | 790 | 14.3% |
| 45 to 54 Years | 1,026 | 18.6% |
| 55 to 64 Years | 1,376 | 24.9% |
| 65 to 74 Years | 1,147 | 20.8% |
| 75 to 84 Years | 612 | 11.1% |
| 85 Years and Over | 112 | 2.0% |
| Total | 5,519 | 100.0% |
Housing Finances in Jefferson County
Median Income by Occupancy in Jefferson County
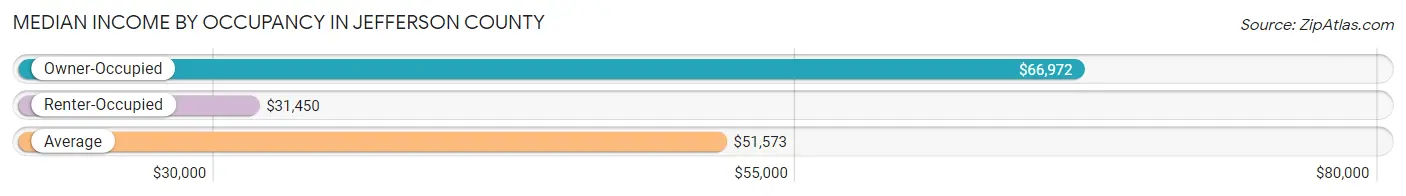
| Occupancy Type | # Households | Median Income |
| Owner-Occupied | 4,136 (74.9%) | $66,972 |
| Renter-Occupied | 1,383 (25.1%) | $31,450 |
| Average | 5,519 (100.0%) | $51,573 |
Occupancy by Householder Income Bracket in Jefferson County
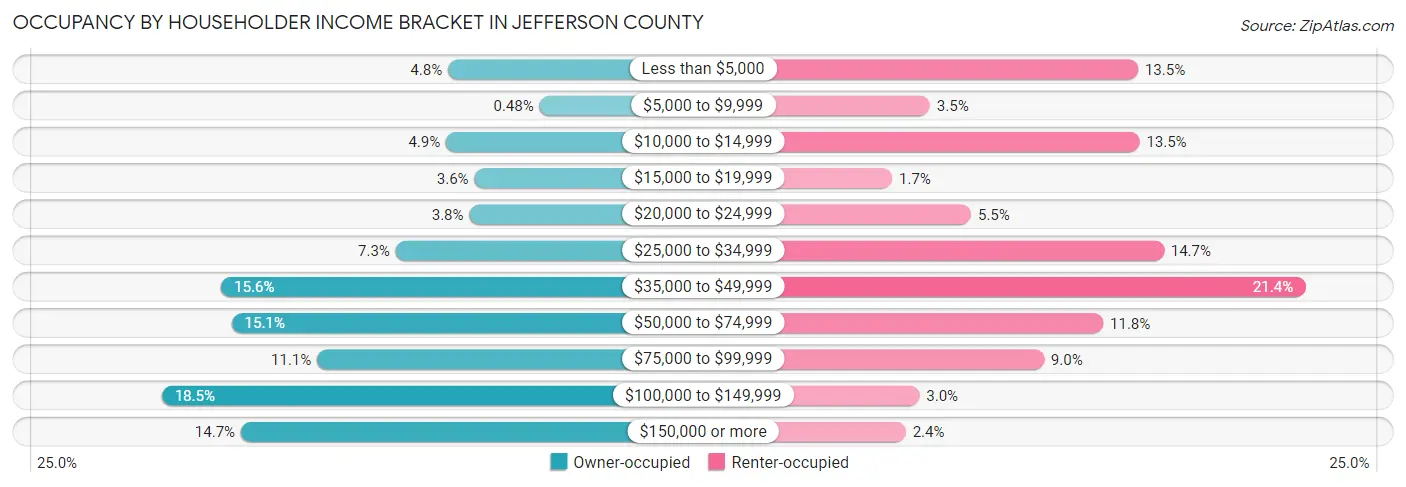
| Income Bracket | Owner-occupied | Renter-occupied |
| Less than $5,000 | 200 (4.8%) | 186 (13.5%) |
| $5,000 to $9,999 | 20 (0.5%) | 49 (3.5%) |
| $10,000 to $14,999 | 204 (4.9%) | 187 (13.5%) |
| $15,000 to $19,999 | 148 (3.6%) | 24 (1.7%) |
| $20,000 to $24,999 | 158 (3.8%) | 76 (5.5%) |
| $25,000 to $34,999 | 303 (7.3%) | 203 (14.7%) |
| $35,000 to $49,999 | 647 (15.6%) | 296 (21.4%) |
| $50,000 to $74,999 | 626 (15.1%) | 163 (11.8%) |
| $75,000 to $99,999 | 458 (11.1%) | 124 (9.0%) |
| $100,000 to $149,999 | 764 (18.5%) | 42 (3.0%) |
| $150,000 or more | 608 (14.7%) | 33 (2.4%) |
| Total | 4,136 (100.0%) | 1,383 (100.0%) |
Monthly Housing Cost Tiers in Jefferson County
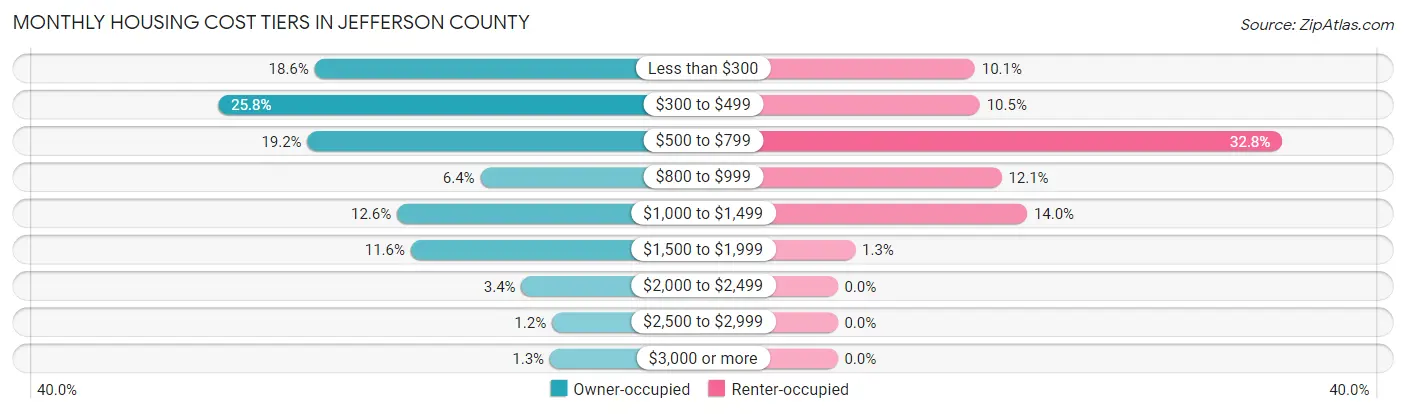
| Monthly Cost | Owner-occupied | Renter-occupied |
| Less than $300 | 771 (18.6%) | 140 (10.1%) |
| $300 to $499 | 1,065 (25.8%) | 145 (10.5%) |
| $500 to $799 | 793 (19.2%) | 453 (32.8%) |
| $800 to $999 | 266 (6.4%) | 167 (12.1%) |
| $1,000 to $1,499 | 520 (12.6%) | 193 (14.0%) |
| $1,500 to $1,999 | 478 (11.6%) | 18 (1.3%) |
| $2,000 to $2,499 | 141 (3.4%) | 0 (0.0%) |
| $2,500 to $2,999 | 48 (1.2%) | 0 (0.0%) |
| $3,000 or more | 54 (1.3%) | 0 (0.0%) |
| Total | 4,136 (100.0%) | 1,383 (100.0%) |
Physical Housing Characteristics in Jefferson County
Housing Structures in Jefferson County
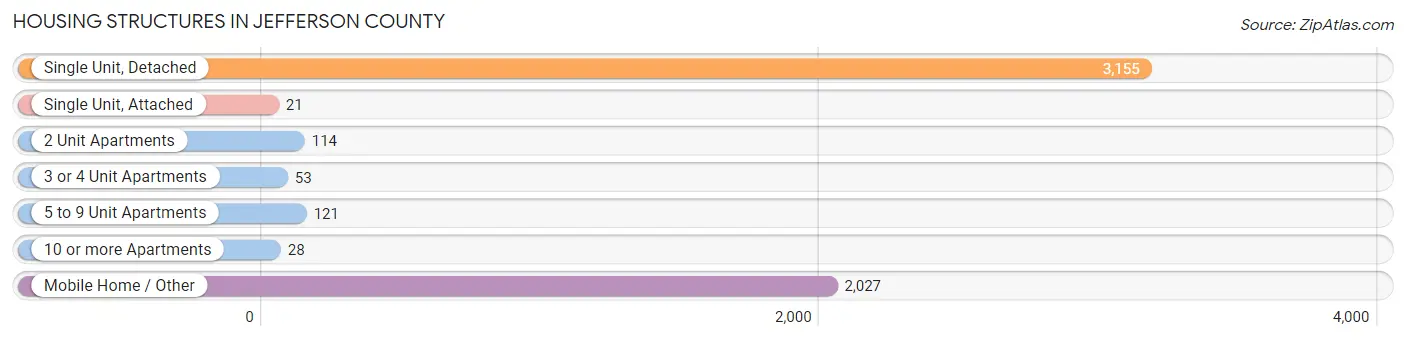
| Structure Type | # Housing Units | % Housing Units |
| Single Unit, Detached | 3,155 | 57.2% |
| Single Unit, Attached | 21 | 0.4% |
| 2 Unit Apartments | 114 | 2.1% |
| 3 or 4 Unit Apartments | 53 | 1.0% |
| 5 to 9 Unit Apartments | 121 | 2.2% |
| 10 or more Apartments | 28 | 0.5% |
| Mobile Home / Other | 2,027 | 36.7% |
| Total | 5,519 | 100.0% |
Housing Structures by Occupancy in Jefferson County
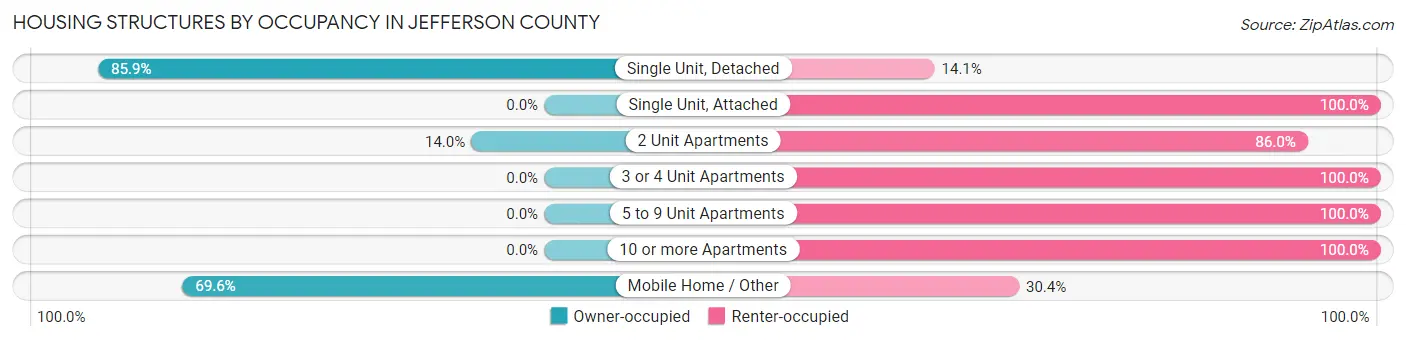
| Structure Type | Owner-occupied | Renter-occupied |
| Single Unit, Detached | 2,709 (85.9%) | 446 (14.1%) |
| Single Unit, Attached | 0 (0.0%) | 21 (100.0%) |
| 2 Unit Apartments | 16 (14.0%) | 98 (86.0%) |
| 3 or 4 Unit Apartments | 0 (0.0%) | 53 (100.0%) |
| 5 to 9 Unit Apartments | 0 (0.0%) | 121 (100.0%) |
| 10 or more Apartments | 0 (0.0%) | 28 (100.0%) |
| Mobile Home / Other | 1,411 (69.6%) | 616 (30.4%) |
| Total | 4,136 (74.9%) | 1,383 (25.1%) |
Housing Structures by Number of Rooms in Jefferson County
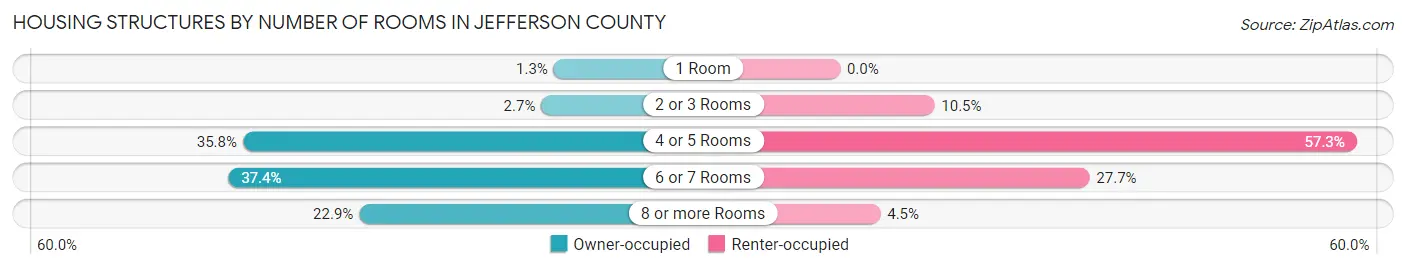
| Number of Rooms | Owner-occupied | Renter-occupied |
| 1 Room | 53 (1.3%) | 0 (0.0%) |
| 2 or 3 Rooms | 110 (2.7%) | 145 (10.5%) |
| 4 or 5 Rooms | 1,480 (35.8%) | 793 (57.3%) |
| 6 or 7 Rooms | 1,547 (37.4%) | 383 (27.7%) |
| 8 or more Rooms | 946 (22.9%) | 62 (4.5%) |
| Total | 4,136 (100.0%) | 1,383 (100.0%) |
Housing Structure by Heating Type in Jefferson County
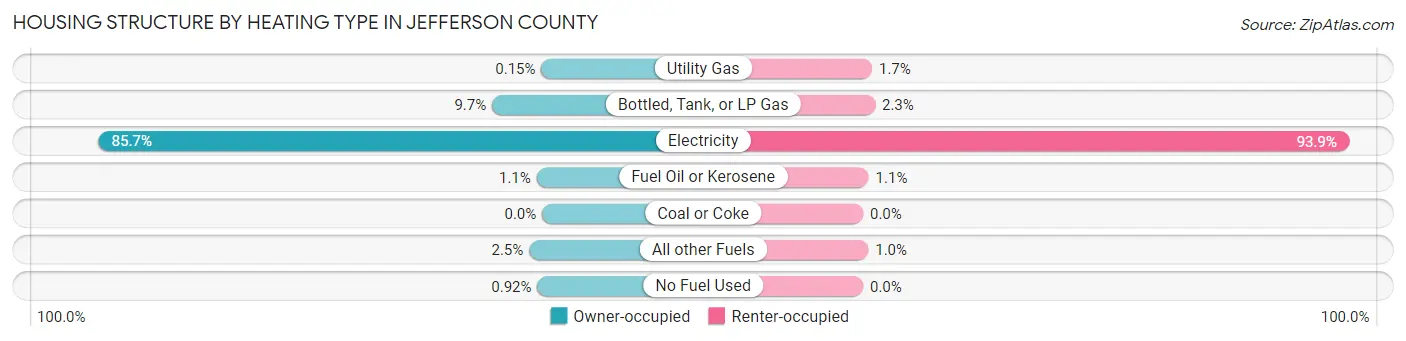
| Heating Type | Owner-occupied | Renter-occupied |
| Utility Gas | 6 (0.2%) | 24 (1.7%) |
| Bottled, Tank, or LP Gas | 400 (9.7%) | 32 (2.3%) |
| Electricity | 3,544 (85.7%) | 1,298 (93.9%) |
| Fuel Oil or Kerosene | 44 (1.1%) | 15 (1.1%) |
| Coal or Coke | 0 (0.0%) | 0 (0.0%) |
| All other Fuels | 104 (2.5%) | 14 (1.0%) |
| No Fuel Used | 38 (0.9%) | 0 (0.0%) |
| Total | 4,136 (100.0%) | 1,383 (100.0%) |
Household Vehicle Usage in Jefferson County
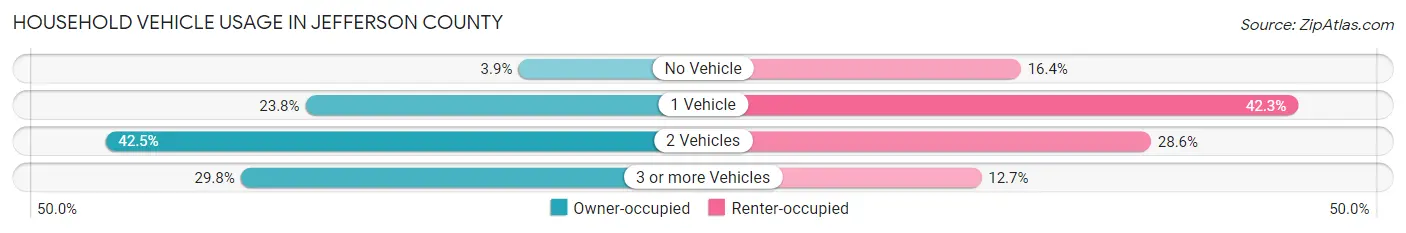
| Vehicles per Household | Owner-occupied | Renter-occupied |
| No Vehicle | 162 (3.9%) | 227 (16.4%) |
| 1 Vehicle | 984 (23.8%) | 585 (42.3%) |
| 2 Vehicles | 1,756 (42.5%) | 395 (28.6%) |
| 3 or more Vehicles | 1,234 (29.8%) | 176 (12.7%) |
| Total | 4,136 (100.0%) | 1,383 (100.0%) |
Real Estate & Mortgages in Jefferson County
Real Estate and Mortgage Overview in Jefferson County
| Characteristic | Without Mortgage | With Mortgage |
| Housing Units | 2,641 | 1,495 |
| Median Property Value | $145,800 | $199,900 |
| Median Household Income | $57,159 | $335 |
| Monthly Housing Costs | $424 | $54 |
| Real Estate Taxes | $1,167 | $54 |
Property Value by Mortgage Status in Jefferson County
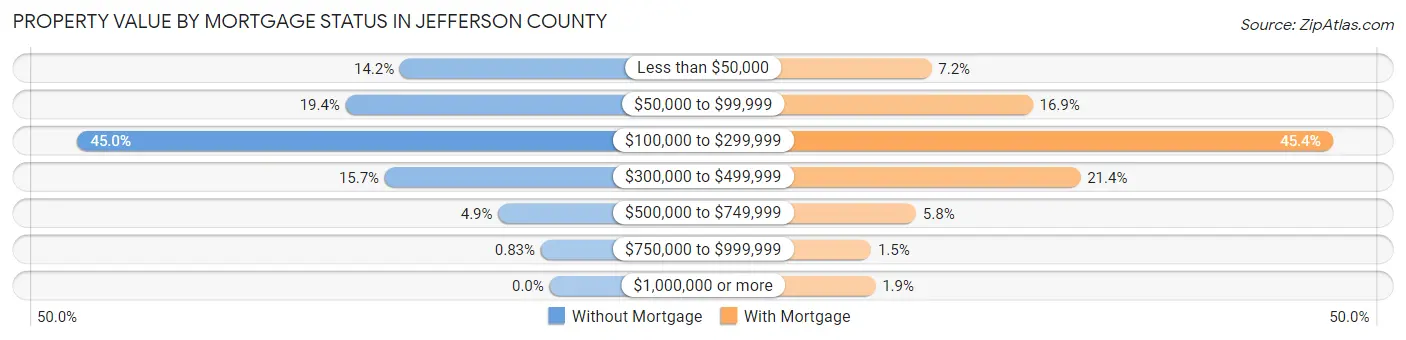
| Property Value | Without Mortgage | With Mortgage |
| Less than $50,000 | 376 (14.2%) | 108 (7.2%) |
| $50,000 to $99,999 | 513 (19.4%) | 252 (16.9%) |
| $100,000 to $299,999 | 1,187 (45.0%) | 679 (45.4%) |
| $300,000 to $499,999 | 414 (15.7%) | 320 (21.4%) |
| $500,000 to $749,999 | 129 (4.9%) | 86 (5.8%) |
| $750,000 to $999,999 | 22 (0.8%) | 22 (1.5%) |
| $1,000,000 or more | 0 (0.0%) | 28 (1.9%) |
| Total | 2,641 (100.0%) | 1,495 (100.0%) |
Household Income by Mortgage Status in Jefferson County
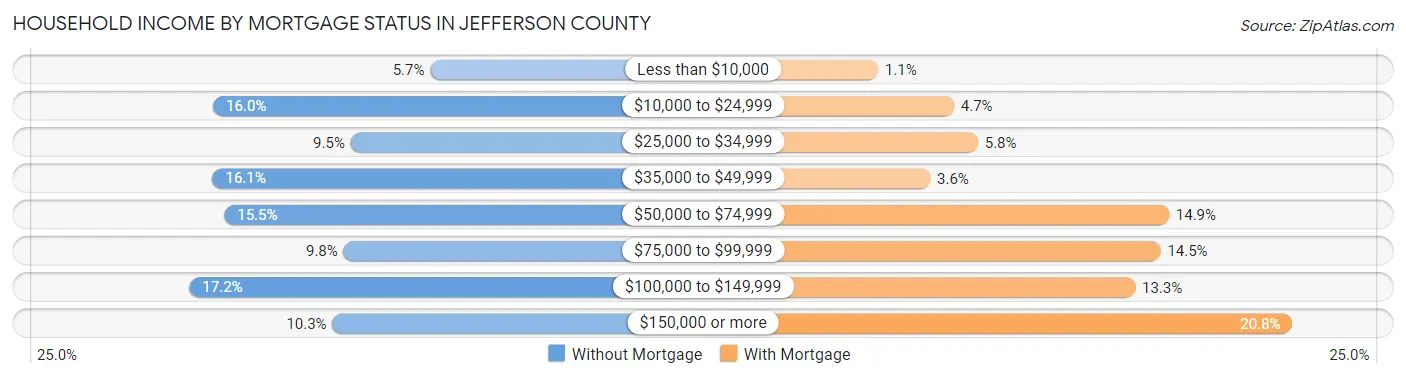
| Household Income | Without Mortgage | With Mortgage |
| Less than $10,000 | 150 (5.7%) | 16 (1.1%) |
| $10,000 to $24,999 | 423 (16.0%) | 70 (4.7%) |
| $25,000 to $34,999 | 250 (9.5%) | 87 (5.8%) |
| $35,000 to $49,999 | 424 (16.1%) | 53 (3.5%) |
| $50,000 to $74,999 | 409 (15.5%) | 223 (14.9%) |
| $75,000 to $99,999 | 259 (9.8%) | 217 (14.5%) |
| $100,000 to $149,999 | 453 (17.2%) | 199 (13.3%) |
| $150,000 or more | 273 (10.3%) | 311 (20.8%) |
| Total | 2,641 (100.0%) | 1,495 (100.0%) |
Property Value to Household Income Ratio in Jefferson County
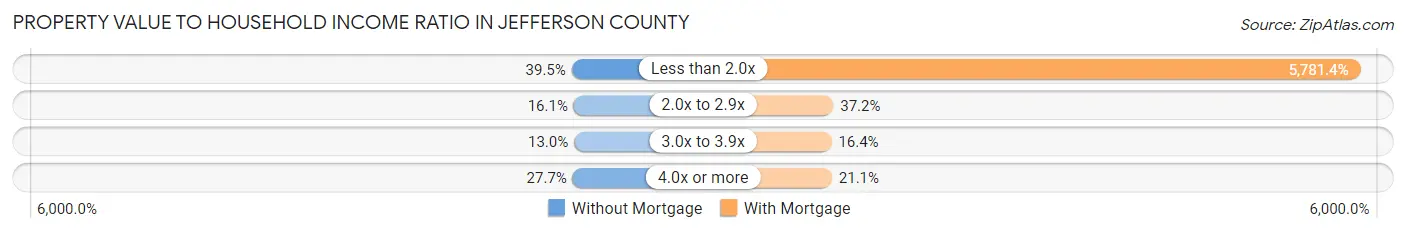
| Value-to-Income Ratio | Without Mortgage | With Mortgage |
| Less than 2.0x | 1,043 (39.5%) | 86,432 (5,781.4%) |
| 2.0x to 2.9x | 426 (16.1%) | 556 (37.2%) |
| 3.0x to 3.9x | 342 (13.0%) | 245 (16.4%) |
| 4.0x or more | 731 (27.7%) | 315 (21.1%) |
| Total | 2,641 (100.0%) | 1,495 (100.0%) |
Real Estate Taxes by Mortgage Status in Jefferson County
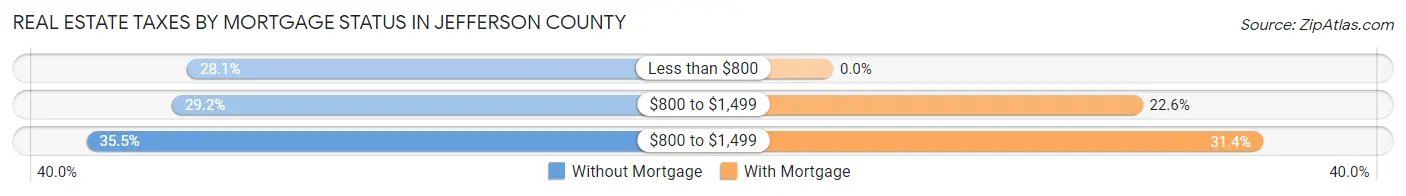
| Property Taxes | Without Mortgage | With Mortgage |
| Less than $800 | 743 (28.1%) | 0 (0.0%) |
| $800 to $1,499 | 772 (29.2%) | 338 (22.6%) |
| $800 to $1,499 | 937 (35.5%) | 469 (31.4%) |
| Total | 2,641 (100.0%) | 1,495 (100.0%) |
Health & Disability in Jefferson County
Health Insurance Coverage by Age in Jefferson County
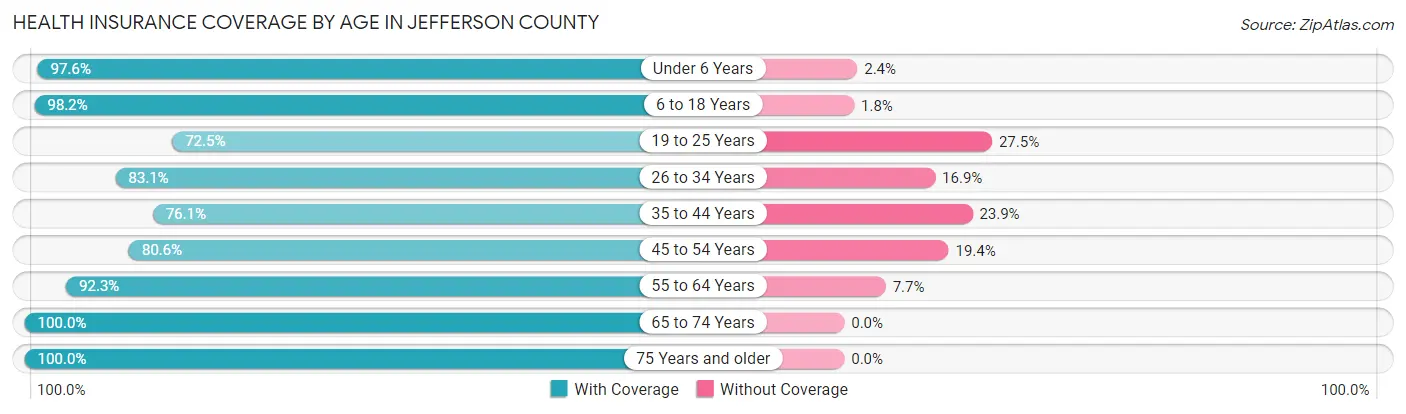
| Age Bracket | With Coverage | Without Coverage |
| Under 6 Years | 727 (97.6%) | 18 (2.4%) |
| 6 to 18 Years | 1,927 (98.2%) | 36 (1.8%) |
| 19 to 25 Years | 705 (72.5%) | 268 (27.5%) |
| 26 to 34 Years | 956 (83.1%) | 195 (16.9%) |
| 35 to 44 Years | 968 (76.1%) | 304 (23.9%) |
| 45 to 54 Years | 1,384 (80.6%) | 334 (19.4%) |
| 55 to 64 Years | 1,995 (92.3%) | 167 (7.7%) |
| 65 to 74 Years | 1,913 (100.0%) | 0 (0.0%) |
| 75 Years and older | 1,335 (100.0%) | 0 (0.0%) |
| Total | 11,910 (90.0%) | 1,322 (10.0%) |
Health Insurance Coverage by Citizenship Status in Jefferson County
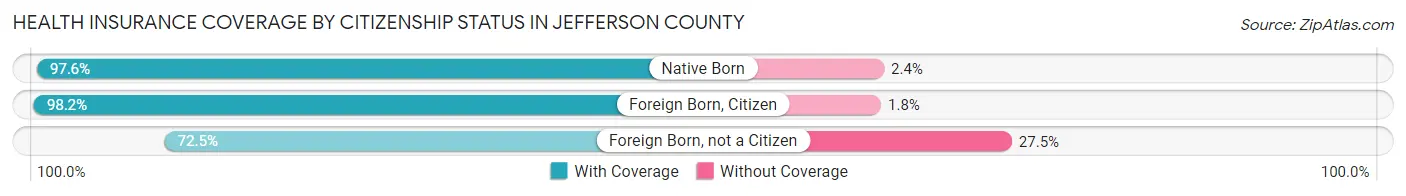
| Citizenship Status | With Coverage | Without Coverage |
| Native Born | 727 (97.6%) | 18 (2.4%) |
| Foreign Born, Citizen | 1,927 (98.2%) | 36 (1.8%) |
| Foreign Born, not a Citizen | 705 (72.5%) | 268 (27.5%) |
Health Insurance Coverage by Household Income in Jefferson County
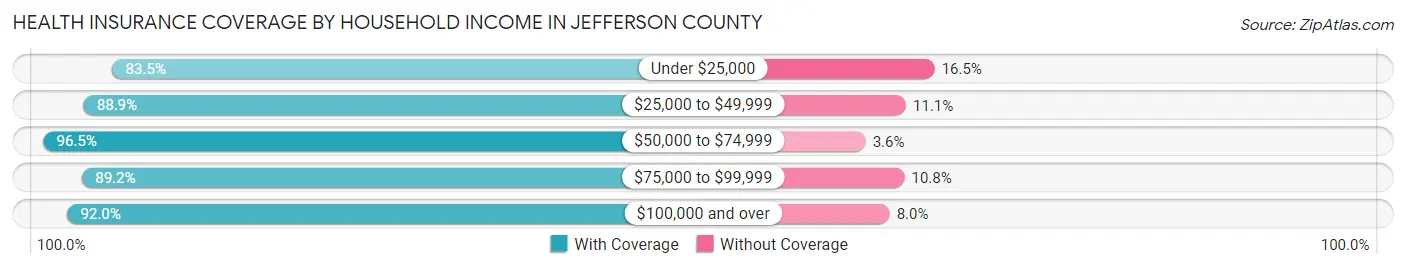
| Household Income | With Coverage | Without Coverage |
| Under $25,000 | 1,937 (83.5%) | 382 (16.5%) |
| $25,000 to $49,999 | 2,841 (88.9%) | 355 (11.1%) |
| $50,000 to $74,999 | 1,845 (96.5%) | 68 (3.5%) |
| $75,000 to $99,999 | 1,599 (89.2%) | 194 (10.8%) |
| $100,000 and over | 3,684 (92.0%) | 322 (8.0%) |
Public vs Private Health Insurance Coverage by Age in Jefferson County
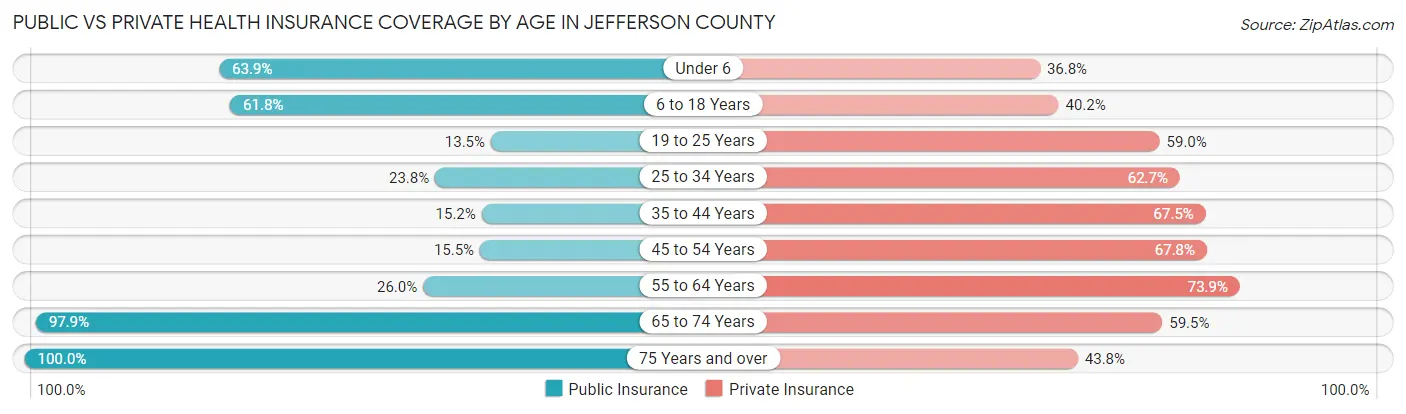
| Age Bracket | Public Insurance | Private Insurance |
| Under 6 | 476 (63.9%) | 274 (36.8%) |
| 6 to 18 Years | 1,214 (61.8%) | 790 (40.2%) |
| 19 to 25 Years | 131 (13.5%) | 574 (59.0%) |
| 25 to 34 Years | 274 (23.8%) | 722 (62.7%) |
| 35 to 44 Years | 193 (15.2%) | 859 (67.5%) |
| 45 to 54 Years | 266 (15.5%) | 1,164 (67.7%) |
| 55 to 64 Years | 563 (26.0%) | 1,597 (73.9%) |
| 65 to 74 Years | 1,873 (97.9%) | 1,138 (59.5%) |
| 75 Years and over | 1,335 (100.0%) | 585 (43.8%) |
| Total | 6,325 (47.8%) | 7,703 (58.2%) |
Disability Status by Sex by Age in Jefferson County
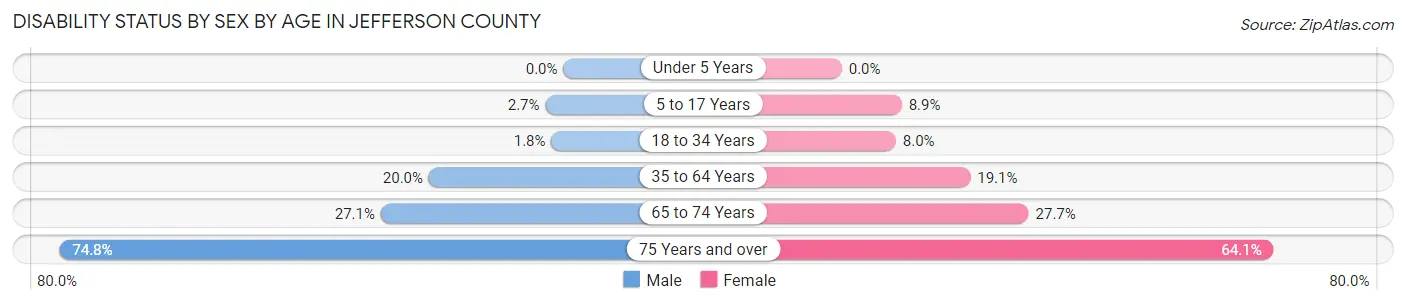
| Age Bracket | Male | Female |
| Under 5 Years | 0 (0.0%) | 0 (0.0%) |
| 5 to 17 Years | 27 (2.7%) | 78 (8.9%) |
| 18 to 34 Years | 21 (1.8%) | 94 (8.0%) |
| 35 to 64 Years | 472 (20.0%) | 532 (19.1%) |
| 65 to 74 Years | 244 (27.1%) | 281 (27.7%) |
| 75 Years and over | 434 (74.8%) | 484 (64.1%) |
Disability Class by Sex by Age in Jefferson County
Disability Class: Hearing Difficulty
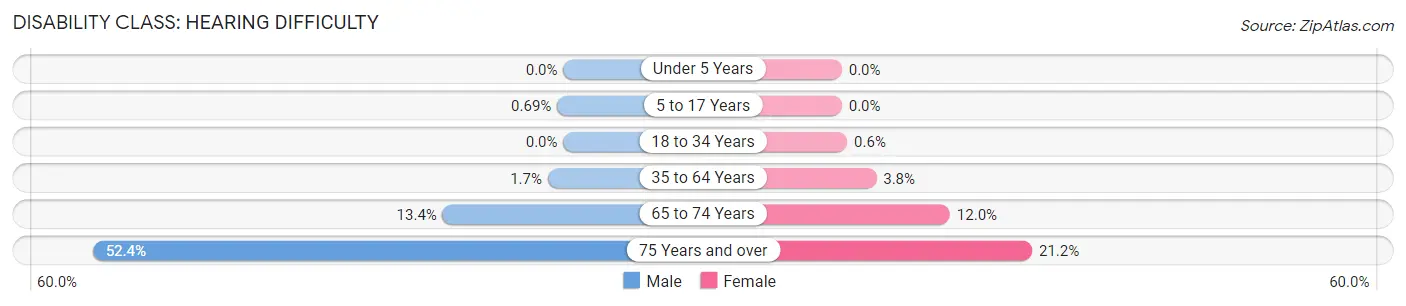
| Age Bracket | Male | Female |
| Under 5 Years | 0 (0.0%) | 0 (0.0%) |
| 5 to 17 Years | 7 (0.7%) | 0 (0.0%) |
| 18 to 34 Years | 0 (0.0%) | 7 (0.6%) |
| 35 to 64 Years | 41 (1.7%) | 107 (3.8%) |
| 65 to 74 Years | 121 (13.4%) | 122 (12.0%) |
| 75 Years and over | 304 (52.4%) | 160 (21.2%) |
Disability Class: Vision Difficulty
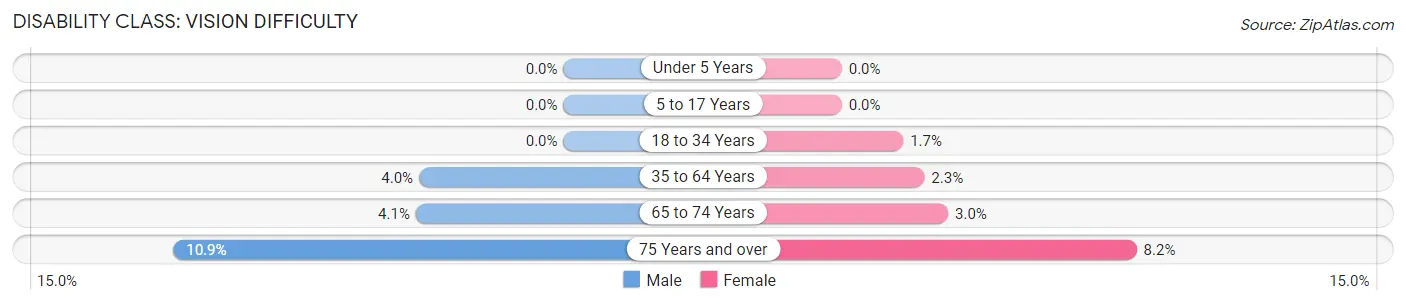
| Age Bracket | Male | Female |
| Under 5 Years | 0 (0.0%) | 0 (0.0%) |
| 5 to 17 Years | 0 (0.0%) | 0 (0.0%) |
| 18 to 34 Years | 0 (0.0%) | 20 (1.7%) |
| 35 to 64 Years | 95 (4.0%) | 64 (2.3%) |
| 65 to 74 Years | 37 (4.1%) | 30 (3.0%) |
| 75 Years and over | 63 (10.9%) | 62 (8.2%) |
Disability Class: Cognitive Difficulty
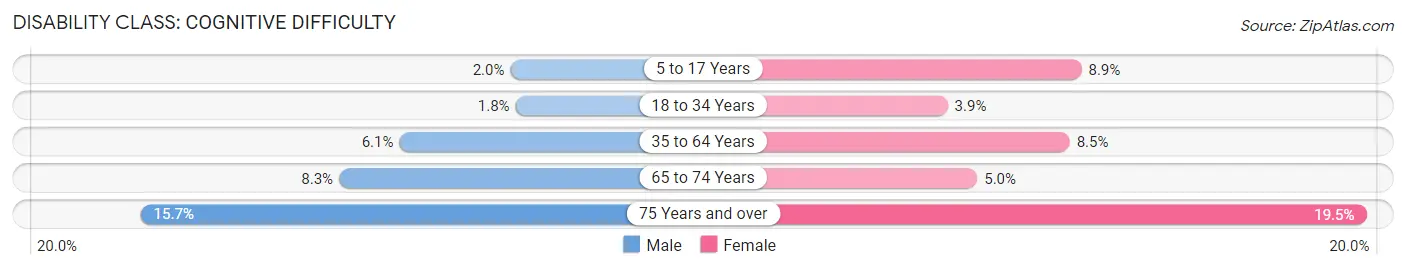
| Age Bracket | Male | Female |
| 5 to 17 Years | 20 (2.0%) | 78 (8.9%) |
| 18 to 34 Years | 21 (1.8%) | 46 (3.9%) |
| 35 to 64 Years | 144 (6.1%) | 236 (8.5%) |
| 65 to 74 Years | 75 (8.3%) | 51 (5.0%) |
| 75 Years and over | 91 (15.7%) | 147 (19.5%) |
Disability Class: Ambulatory Difficulty
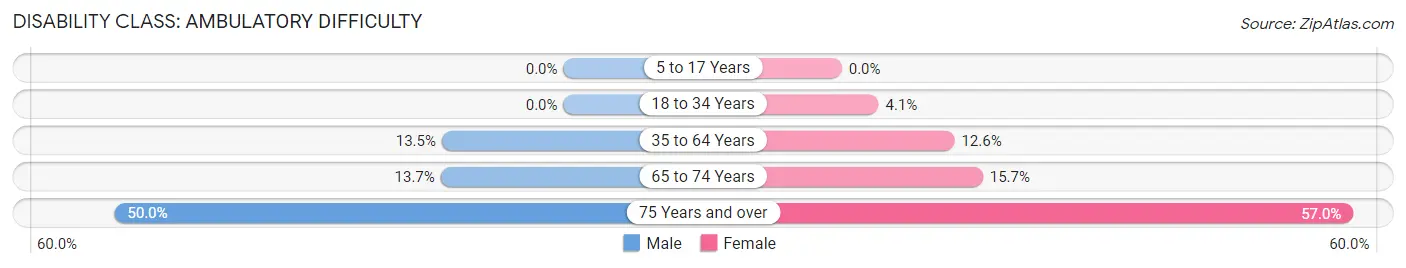
| Age Bracket | Male | Female |
| 5 to 17 Years | 0 (0.0%) | 0 (0.0%) |
| 18 to 34 Years | 0 (0.0%) | 48 (4.1%) |
| 35 to 64 Years | 320 (13.5%) | 350 (12.6%) |
| 65 to 74 Years | 123 (13.7%) | 159 (15.7%) |
| 75 Years and over | 290 (50.0%) | 430 (57.0%) |
Disability Class: Self-Care Difficulty
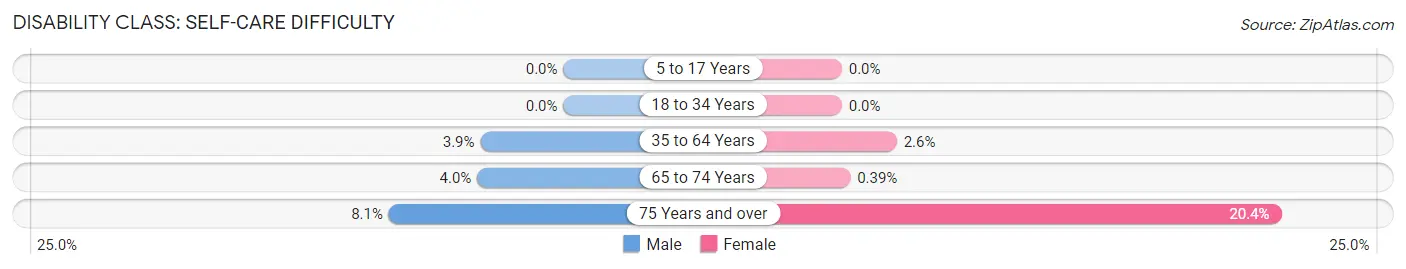
| Age Bracket | Male | Female |
| 5 to 17 Years | 0 (0.0%) | 0 (0.0%) |
| 18 to 34 Years | 0 (0.0%) | 0 (0.0%) |
| 35 to 64 Years | 91 (3.8%) | 71 (2.5%) |
| 65 to 74 Years | 36 (4.0%) | 4 (0.4%) |
| 75 Years and over | 47 (8.1%) | 154 (20.4%) |
Technology Access in Jefferson County
Computing Device Access in Jefferson County
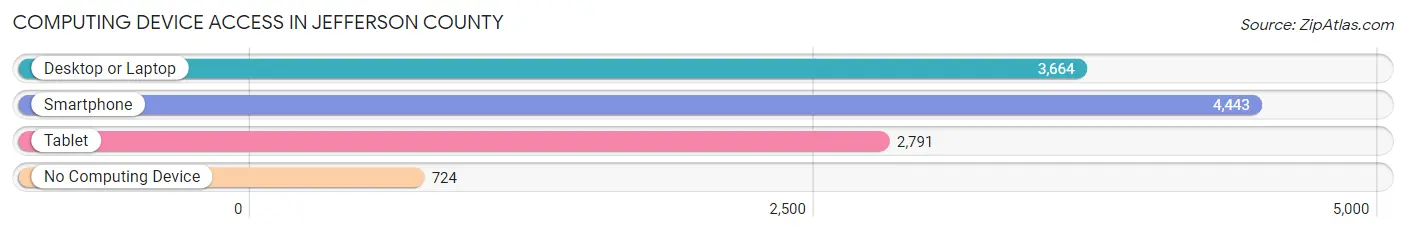
| Device Type | # Households | % Households |
| Desktop or Laptop | 3,664 | 66.4% |
| Smartphone | 4,443 | 80.5% |
| Tablet | 2,791 | 50.6% |
| No Computing Device | 724 | 13.1% |
| Total | 5,519 | 100.0% |
Internet Access in Jefferson County
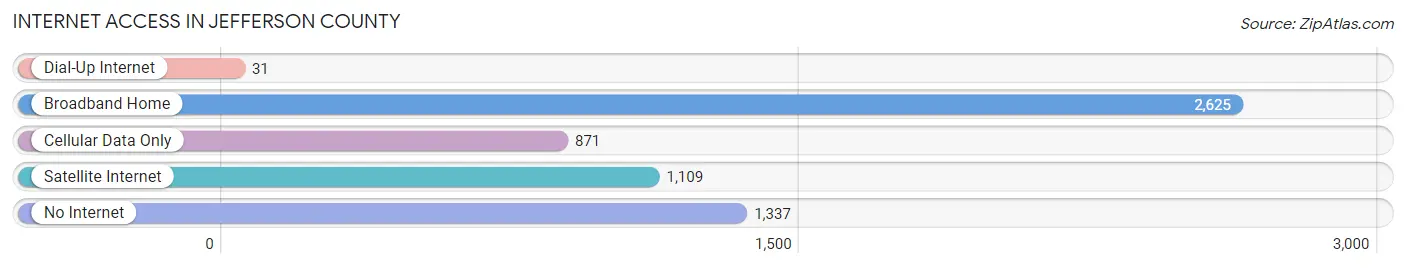
| Internet Type | # Households | % Households |
| Dial-Up Internet | 31 | 0.6% |
| Broadband Home | 2,625 | 47.6% |
| Cellular Data Only | 871 | 15.8% |
| Satellite Internet | 1,109 | 20.1% |
| No Internet | 1,337 | 24.2% |
| Total | 5,519 | 100.0% |
Jefferson County Summary
Jefferson County is located in the panhandle of Florida, and is bordered by Leon County to the north, Wakulla County to the east, and Gadsden County to the south. The county seat is Monticello, and the county is named after Thomas Jefferson, the third president of the United States. The county has a total area of 576 square miles, and a population of 14,761 as of the 2010 census.
History
Jefferson County was created in 1827 from a portion of Escambia County. The county was named after Thomas Jefferson, the third president of the United States. The county seat was originally located in the town of Waukeenah, but was moved to Monticello in 1828.
In the early 19th century, the county was largely agricultural, with cotton, corn, and tobacco being the main crops. The county also had a thriving timber industry, with the Apalachicola River providing access to the Gulf of Mexico.
In the late 19th century, the county began to develop a tourism industry, with the opening of several resorts and hotels. The county also became a popular destination for hunters and fishermen.
In the early 20th century, the county began to develop a manufacturing industry, with the opening of several factories. The county also became a popular destination for retirees, with the opening of several retirement communities.
Geography
Jefferson County is located in the panhandle of Florida, and is bordered by Leon County to the north, Wakulla County to the east, and Gadsden County to the south. The county has a total area of 576 square miles, and is mostly flat, with some rolling hills in the northern part of the county. The Apalachicola River forms the western border of the county, and the Aucilla River forms the eastern border.
The county is home to several state parks, including Torreya State Park, which is located on the Apalachicola River, and Edward Ball Wakulla Springs State Park, which is located on the Wakulla River. The county also has several lakes, including Lake Miccosukee, Lake Talquin, and Lake Iamonia.
Economy
The economy of Jefferson County is largely based on agriculture, with cotton, corn, and tobacco being the main crops. The county also has a thriving timber industry, with the Apalachicola River providing access to the Gulf of Mexico.
The county also has a growing tourism industry, with several resorts and hotels located in the county. The county is also a popular destination for hunters and fishermen, and is home to several state parks.
The county also has a growing manufacturing industry, with several factories located in the county. The county is also home to several retirement communities, making it a popular destination for retirees.
Demographics
As of the 2010 census, the population of Jefferson County was 14,761. The racial makeup of the county was 68.3% White, 28.2% African American, 0.4% Native American, 0.7% Asian, 0.1% Pacific Islander, 0.7% from other races, and 1.6% from two or more races. Hispanic or Latino of any race were 2.7% of the population.
The median income for a household in the county was $35,945, and the median income for a family was $41,945. The per capita income for the county was $17,945. About 17.3% of the population was below the poverty line.
Common Questions
What is Per Capita Income in Jefferson County?
Per Capita income in Jefferson County is $29,189.
What is the Median Family Income in Jefferson County?
Median Family Income in Jefferson County is $69,690.
What is the Median Household income in Jefferson County?
Median Household Income in Jefferson County is $51,573.
What is Income or Wage Gap in Jefferson County?
Income or Wage Gap in Jefferson County is 24.6%.
Women in Jefferson County earn 75.4 cents for every dollar earned by a man.
What is Family Income Deficit in Jefferson County?
Family Income Deficit in Jefferson County is $9,755.
Families that are below poverty line in Jefferson County earn $9,755 less on average than the poverty threshold level.
What is Inequality or Gini Index in Jefferson County?
Inequality or Gini Index in Jefferson County is 0.47.
What is the Total Population of Jefferson County?
Total Population of Jefferson County is 14,458.
What is the Total Male Population of Jefferson County?
Total Male Population of Jefferson County is 7,453.
What is the Total Female Population of Jefferson County?
Total Female Population of Jefferson County is 7,005.
What is the Ratio of Males per 100 Females in Jefferson County?
There are 106.40 Males per 100 Females in Jefferson County.
What is the Ratio of Females per 100 Males in Jefferson County?
There are 93.99 Females per 100 Males in Jefferson County.
What is the Median Population Age in Jefferson County?
Median Population Age in Jefferson County is 47.8 Years.
What is the Average Family Size in Jefferson County
Average Family Size in Jefferson County is 2.9 People.
What is the Average Household Size in Jefferson County
Average Household Size in Jefferson County is 2.4 People.
How Large is the Labor Force in Jefferson County?
There are 6,408 People in the Labor Forcein in Jefferson County.
What is the Percentage of People in the Labor Force in Jefferson County?
52.2% of People are in the Labor Force in Jefferson County.
What is the Unemployment Rate in Jefferson County?
Unemployment Rate in Jefferson County is 6.7%.