Jackson County, FL Map & Demographics
Jackson County Map
Jackson County Overview
$23,210
PER CAPITA INCOME
$58,273
AVG FAMILY INCOME
$46,144
AVG HOUSEHOLD INCOME
14.9%
WAGE / INCOME GAP [ % ]
85.1¢/ $1
WAGE / INCOME GAP [ $ ]
$10,246
FAMILY INCOME DEFICIT
0.46
INEQUALITY / GINI INDEX
47,704
TOTAL POPULATION
25,869
MALE POPULATION
21,835
FEMALE POPULATION
118.47
MALES / 100 FEMALES
84.41
FEMALES / 100 MALES
42.9
MEDIAN AGE
3.0
AVG FAMILY SIZE
2.4
AVG HOUSEHOLD SIZE
16,995
LABOR FORCE [ PEOPLE ]
42.5%
PERCENT IN LABOR FORCE
4.7%
UNEMPLOYMENT RATE
Jackson County Area Codes
Income in Jackson County
Income Overview in Jackson County
Per Capita Income in Jackson County is $23,210, while median incomes of families and households are $58,273 and $46,144 respectively.
| Characteristic | Number | Measure |
| Per Capita Income | 47,704 | $23,210 |
| Median Family Income | 10,837 | $58,273 |
| Mean Family Income | 10,837 | $76,149 |
| Median Household Income | 16,880 | $46,144 |
| Mean Household Income | 16,880 | $62,374 |
| Income Deficit | 10,837 | $10,246 |
| Wage / Income Gap (%) | 47,704 | 14.88% |
| Wage / Income Gap ($) | 47,704 | 85.12¢ per $1 |
| Gini / Inequality Index | 47,704 | 0.46 |
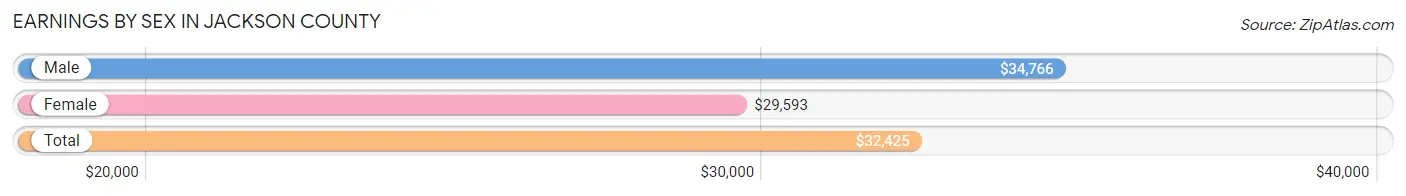
Earnings by Sex in Jackson County
Average Earnings in Jackson County are $32,425, $34,766 for men and $29,593 for women, a difference of 14.9%.
| Sex | Number | Average Earnings |
| Male | 9,292 (51.9%) | $34,766 |
| Female | 8,620 (48.1%) | $29,593 |
| Total | 17,912 (100.0%) | $32,425 |
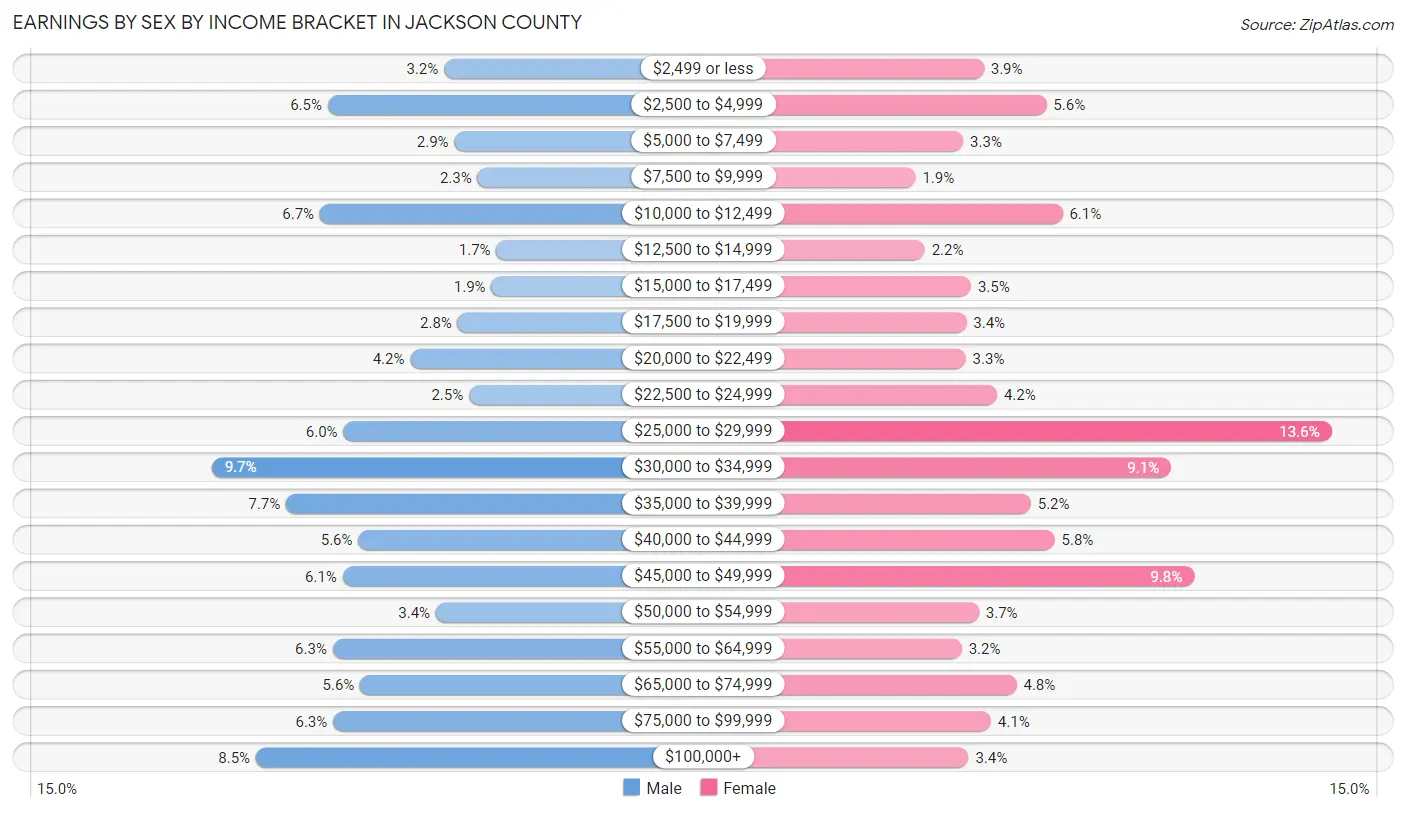
Earnings by Sex by Income Bracket in Jackson County
The most common earnings brackets in Jackson County are $30,000 to $34,999 for men (905 | 9.7%) and $25,000 to $29,999 for women (1,174 | 13.6%).
| Income | Male | Female |
| $2,499 or less | 298 (3.2%) | 332 (3.8%) |
| $2,500 to $4,999 | 602 (6.5%) | 484 (5.6%) |
| $5,000 to $7,499 | 271 (2.9%) | 282 (3.3%) |
| $7,500 to $9,999 | 211 (2.3%) | 166 (1.9%) |
| $10,000 to $12,499 | 623 (6.7%) | 522 (6.1%) |
| $12,500 to $14,999 | 162 (1.7%) | 189 (2.2%) |
| $15,000 to $17,499 | 175 (1.9%) | 301 (3.5%) |
| $17,500 to $19,999 | 263 (2.8%) | 290 (3.4%) |
| $20,000 to $22,499 | 387 (4.2%) | 288 (3.3%) |
| $22,500 to $24,999 | 233 (2.5%) | 364 (4.2%) |
| $25,000 to $29,999 | 561 (6.0%) | 1,174 (13.6%) |
| $30,000 to $34,999 | 905 (9.7%) | 785 (9.1%) |
| $35,000 to $39,999 | 711 (7.6%) | 446 (5.2%) |
| $40,000 to $44,999 | 522 (5.6%) | 503 (5.8%) |
| $45,000 to $49,999 | 563 (6.1%) | 841 (9.8%) |
| $50,000 to $54,999 | 320 (3.4%) | 320 (3.7%) |
| $55,000 to $64,999 | 589 (6.3%) | 278 (3.2%) |
| $65,000 to $74,999 | 518 (5.6%) | 411 (4.8%) |
| $75,000 to $99,999 | 588 (6.3%) | 349 (4.1%) |
| $100,000+ | 790 (8.5%) | 295 (3.4%) |
| Total | 9,292 (100.0%) | 8,620 (100.0%) |
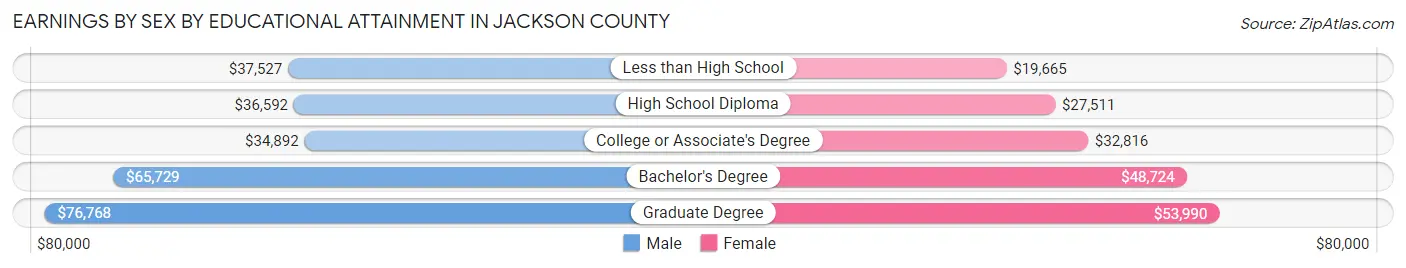
Earnings by Sex by Educational Attainment in Jackson County
Average earnings in Jackson County are $38,368 for men and $32,656 for women, a difference of 14.9%. Men with an educational attainment of graduate degree enjoy the highest average annual earnings of $76,768, while those with college or associate's degree education earn the least with $34,892. Women with an educational attainment of graduate degree earn the most with the average annual earnings of $53,990, while those with less than high school education have the smallest earnings of $19,665.
| Educational Attainment | Male Income | Female Income |
| Less than High School | $37,527 | $19,665 |
| High School Diploma | $36,592 | $27,511 |
| College or Associate's Degree | $34,892 | $32,816 |
| Bachelor's Degree | $65,729 | $48,724 |
| Graduate Degree | $76,768 | $53,990 |
| Total | $38,368 | $32,656 |
Family Income in Jackson County
Family Income Brackets in Jackson County
According to the Jackson County family income data, there are 1,994 families falling into the $50,000 to $74,999 income range, which is the most common income bracket and makes up 18.4% of all families. Conversely, the $10,000 to $14,999 income bracket is the least frequent group with only 238 families (2.2%) belonging to this category.
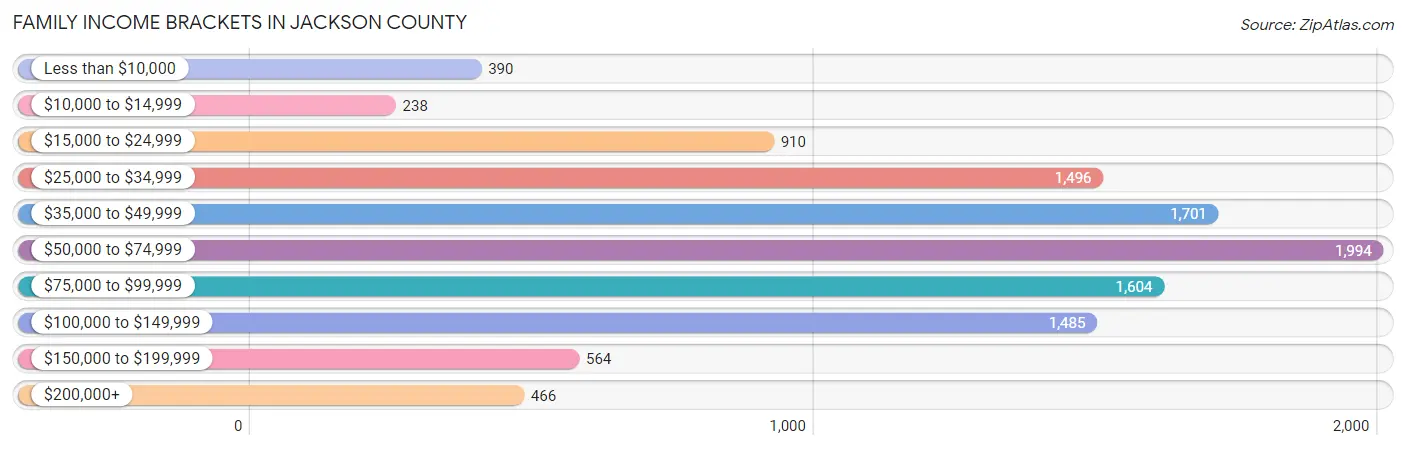
| Income Bracket | # Families | % Families |
| Less than $10,000 | 390 | 3.6% |
| $10,000 to $14,999 | 238 | 2.2% |
| $15,000 to $24,999 | 910 | 8.4% |
| $25,000 to $34,999 | 1,496 | 13.8% |
| $35,000 to $49,999 | 1,701 | 15.7% |
| $50,000 to $74,999 | 1,994 | 18.4% |
| $75,000 to $99,999 | 1,604 | 14.8% |
| $100,000 to $149,999 | 1,485 | 13.7% |
| $150,000 to $199,999 | 564 | 5.2% |
| $200,000+ | 466 | 4.3% |
Family Income by Famaliy Size in Jackson County
6-person families (111 | 1.0%) account for the highest median family income in Jackson County with $80,625 per family, while 2-person families (5,826 | 53.8%) have the highest median income of $25,782 per family member.
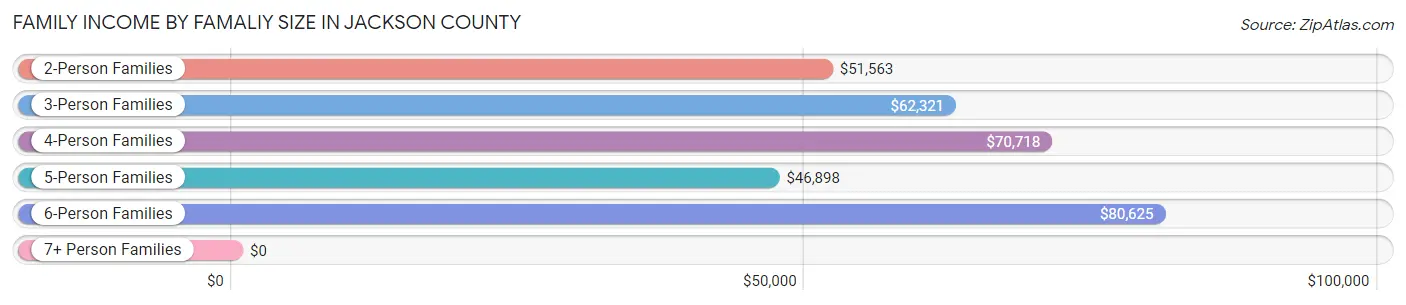
| Income Bracket | # Families | Median Income |
| 2-Person Families | 5,826 (53.8%) | $51,563 |
| 3-Person Families | 2,424 (22.4%) | $62,321 |
| 4-Person Families | 1,583 (14.6%) | $70,718 |
| 5-Person Families | 743 (6.9%) | $46,898 |
| 6-Person Families | 111 (1.0%) | $80,625 |
| 7+ Person Families | 150 (1.4%) | $0 |
| Total | 10,837 (100.0%) | $58,273 |
Family Income by Number of Earners in Jackson County
The median family income in Jackson County is $58,273, with families comprising 3+ earners (874) having the highest median family income of $132,827, while families with no earners (3,029) have the lowest median family income of $36,031, accounting for 8.1% and 28.0% of families, respectively.
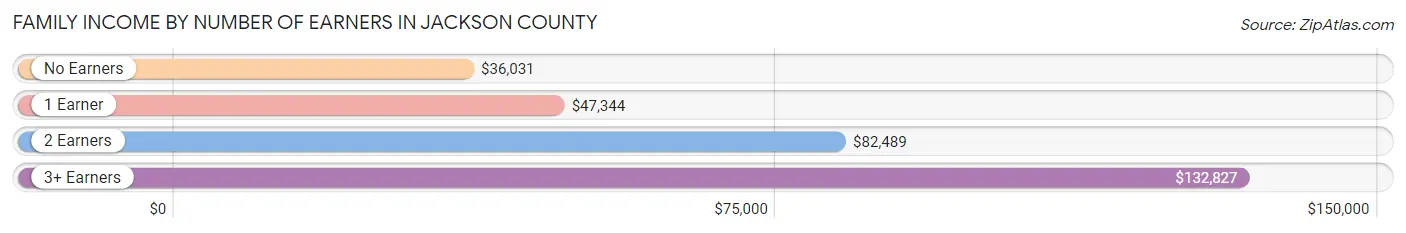
| Number of Earners | # Families | Median Income |
| No Earners | 3,029 (28.0%) | $36,031 |
| 1 Earner | 3,765 (34.7%) | $47,344 |
| 2 Earners | 3,169 (29.2%) | $82,489 |
| 3+ Earners | 874 (8.1%) | $132,827 |
| Total | 10,837 (100.0%) | $58,273 |
Household Income in Jackson County
Household Income Brackets in Jackson County
With 2,650 households falling in the category, the $50,000 to $74,999 income range is the most frequent in Jackson County, accounting for 15.7% of all households. In contrast, only 490 households (2.9%) fall into the $200,000+ income bracket, making it the least populous group.
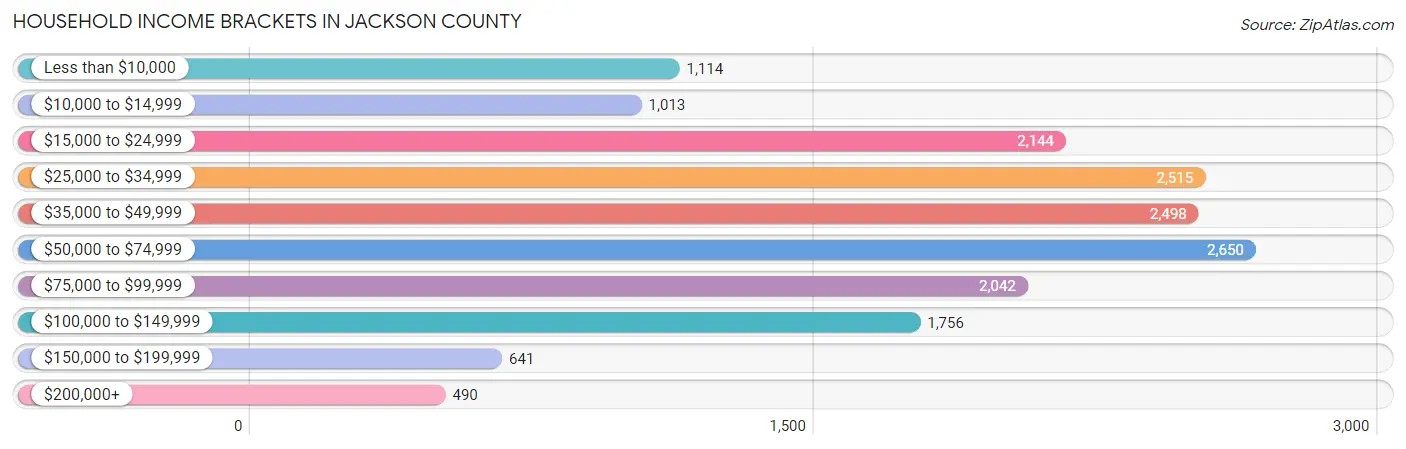
| Income Bracket | # Households | % Households |
| Less than $10,000 | 1,114 | 6.6% |
| $10,000 to $14,999 | 1,013 | 6.0% |
| $15,000 to $24,999 | 2,144 | 12.7% |
| $25,000 to $34,999 | 2,515 | 14.9% |
| $35,000 to $49,999 | 2,498 | 14.8% |
| $50,000 to $74,999 | 2,650 | 15.7% |
| $75,000 to $99,999 | 2,042 | 12.1% |
| $100,000 to $149,999 | 1,756 | 10.4% |
| $150,000 to $199,999 | 641 | 3.8% |
| $200,000+ | 490 | 2.9% |
Household Income by Householder Age in Jackson County
The median household income in Jackson County is $46,144, with the highest median household income of $58,631 found in the 45 to 64 years age bracket for the primary householder. A total of 5,597 households (33.2%) fall into this category. Meanwhile, the 15 to 24 years age bracket for the primary householder has the lowest median household income of $30,469, with 500 households (3.0%) in this group.
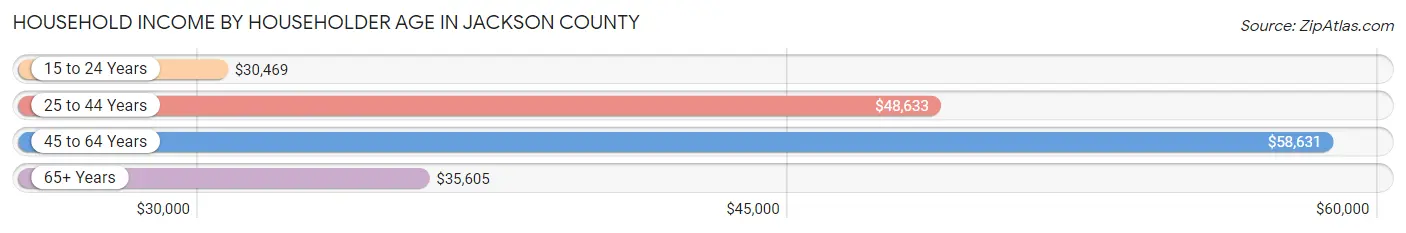
| Income Bracket | # Households | Median Income |
| 15 to 24 Years | 500 (3.0%) | $30,469 |
| 25 to 44 Years | 4,447 (26.3%) | $48,633 |
| 45 to 64 Years | 5,597 (33.2%) | $58,631 |
| 65+ Years | 6,336 (37.5%) | $35,605 |
| Total | 16,880 (100.0%) | $46,144 |
Poverty in Jackson County
Income Below Poverty by Sex and Age in Jackson County
With 17.2% poverty level for males and 21.1% for females among the residents of Jackson County, 15 year old males and 15 year old females are the most vulnerable to poverty, with 64 males (48.8%) and 168 females (76.7%) in their respective age groups living below the poverty level.
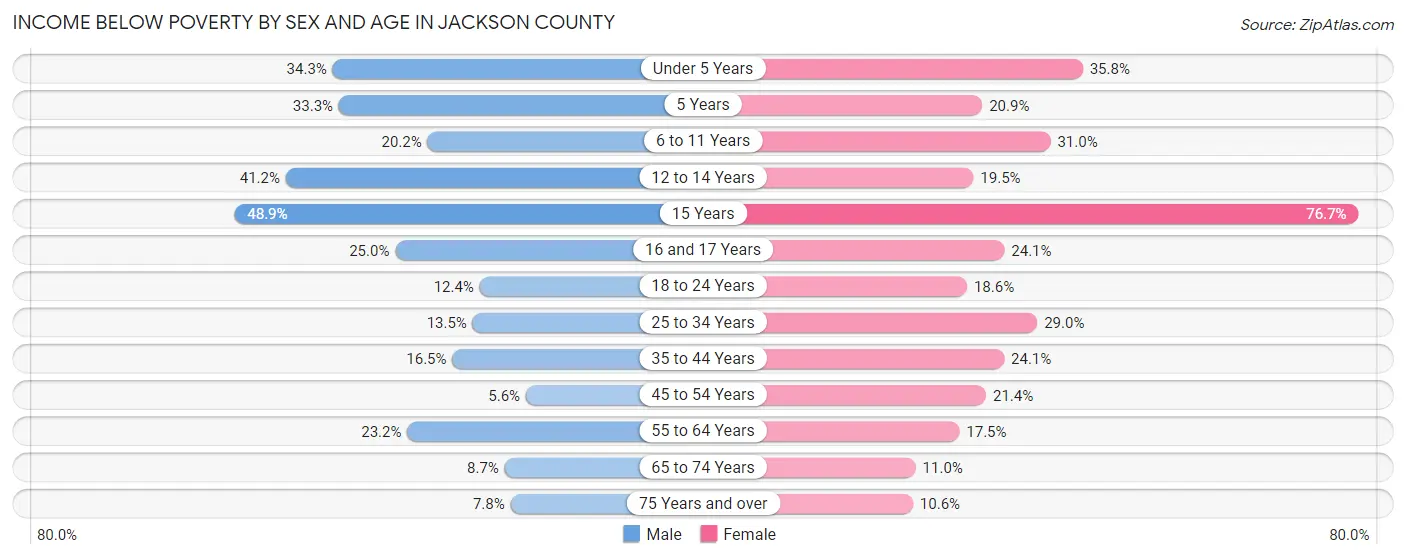
| Age Bracket | Male | Female |
| Under 5 Years | 442 (34.3%) | 410 (35.8%) |
| 5 Years | 108 (33.3%) | 54 (20.8%) |
| 6 to 11 Years | 248 (20.2%) | 388 (31.0%) |
| 12 to 14 Years | 417 (41.2%) | 135 (19.5%) |
| 15 Years | 64 (48.8%) | 168 (76.7%) |
| 16 and 17 Years | 153 (25.0%) | 127 (24.1%) |
| 18 to 24 Years | 203 (12.4%) | 229 (18.6%) |
| 25 to 34 Years | 267 (13.5%) | 642 (29.0%) |
| 35 to 44 Years | 414 (16.5%) | 652 (24.1%) |
| 45 to 54 Years | 125 (5.6%) | 542 (21.4%) |
| 55 to 64 Years | 572 (23.2%) | 523 (17.5%) |
| 65 to 74 Years | 213 (8.7%) | 313 (11.0%) |
| 75 Years and over | 125 (7.8%) | 253 (10.6%) |
| Total | 3,351 (17.2%) | 4,436 (21.1%) |
Income Above Poverty by Sex and Age in Jackson County
According to the poverty statistics in Jackson County, males aged 45 to 54 years and females aged 75 years and over are the age groups that are most secure financially, with 94.4% of males and 89.4% of females in these age groups living above the poverty line.
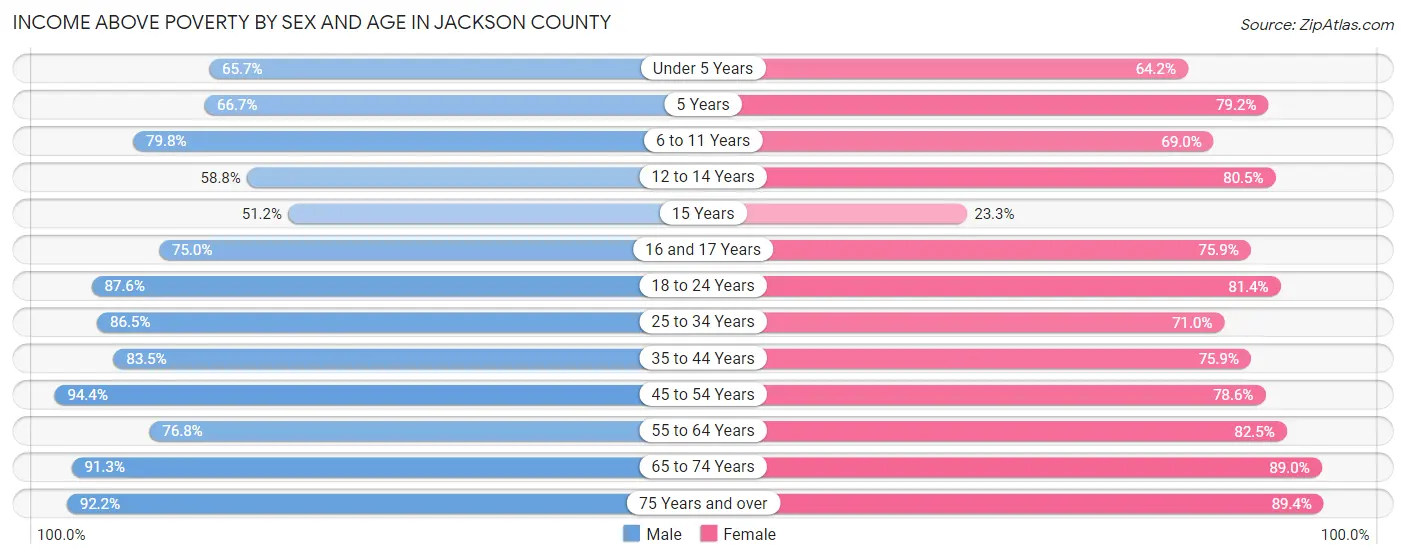
| Age Bracket | Male | Female |
| Under 5 Years | 848 (65.7%) | 736 (64.2%) |
| 5 Years | 216 (66.7%) | 205 (79.1%) |
| 6 to 11 Years | 982 (79.8%) | 864 (69.0%) |
| 12 to 14 Years | 595 (58.8%) | 556 (80.5%) |
| 15 Years | 67 (51.1%) | 51 (23.3%) |
| 16 and 17 Years | 460 (75.0%) | 399 (75.9%) |
| 18 to 24 Years | 1,432 (87.6%) | 1,003 (81.4%) |
| 25 to 34 Years | 1,716 (86.5%) | 1,570 (71.0%) |
| 35 to 44 Years | 2,098 (83.5%) | 2,053 (75.9%) |
| 45 to 54 Years | 2,125 (94.4%) | 1,988 (78.6%) |
| 55 to 64 Years | 1,897 (76.8%) | 2,473 (82.5%) |
| 65 to 74 Years | 2,233 (91.3%) | 2,539 (89.0%) |
| 75 Years and over | 1,469 (92.2%) | 2,142 (89.4%) |
| Total | 16,138 (82.8%) | 16,579 (78.9%) |
Income Below Poverty Among Married-Couple Families in Jackson County
The poverty statistics for married-couple families in Jackson County show that 7.8% or 593 of the total 7,578 families live below the poverty line. Families with 5 or more children have the highest poverty rate of 87.3%, comprising of 62 families. On the other hand, families with no children have the lowest poverty rate of 2.6%, which includes 128 families.
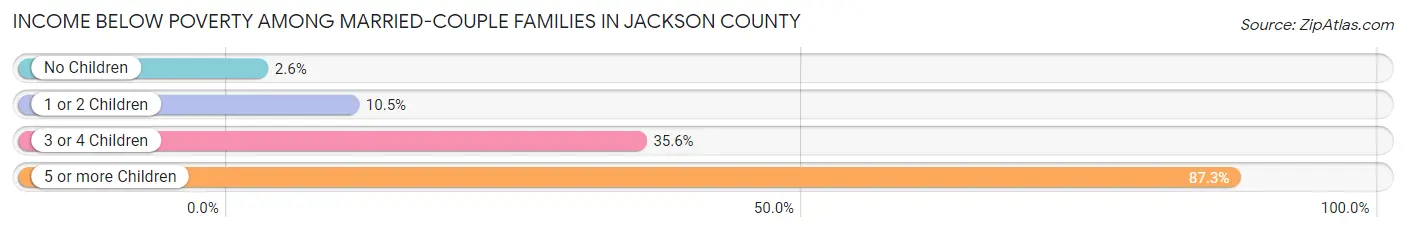
| Children | Above Poverty | Below Poverty |
| No Children | 4,799 (97.4%) | 128 (2.6%) |
| 1 or 2 Children | 1,838 (89.5%) | 216 (10.5%) |
| 3 or 4 Children | 339 (64.4%) | 187 (35.5%) |
| 5 or more Children | 9 (12.7%) | 62 (87.3%) |
| Total | 6,985 (92.2%) | 593 (7.8%) |
Income Below Poverty Among Single-Parent Households in Jackson County
According to the poverty data in Jackson County, 25.9% or 195 single-father households and 27.9% or 700 single-mother households are living below the poverty line. Among single-father households, those with 3 or 4 children have the highest poverty rate, with 12 households (57.1%) experiencing poverty. Likewise, among single-mother households, those with 5 or more children have the highest poverty rate, with 11 households (100.0%) falling below the poverty line.
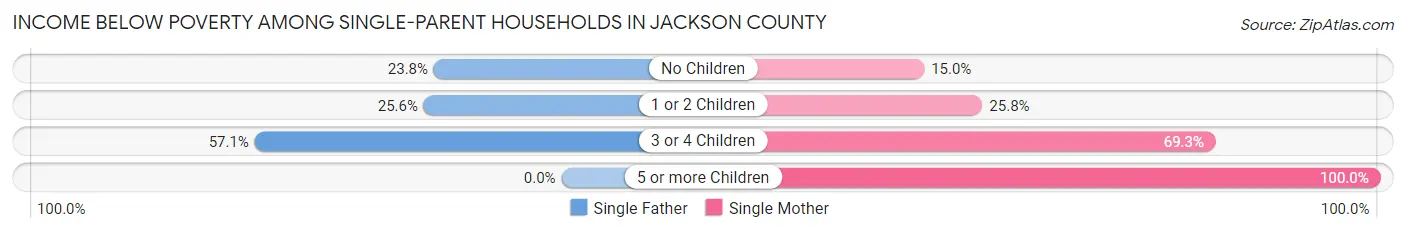
| Children | Single Father | Single Mother |
| No Children | 63 (23.8%) | 144 (15.0%) |
| 1 or 2 Children | 120 (25.6%) | 308 (25.8%) |
| 3 or 4 Children | 12 (57.1%) | 237 (69.3%) |
| 5 or more Children | 0 (0.0%) | 11 (100.0%) |
| Total | 195 (25.9%) | 700 (27.9%) |
Income Below Poverty Among Married-Couple vs Single-Parent Households in Jackson County
The poverty data for Jackson County shows that 593 of the married-couple family households (7.8%) and 895 of the single-parent households (27.5%) are living below the poverty level. Within the married-couple family households, those with 5 or more children have the highest poverty rate, with 62 households (87.3%) falling below the poverty line. Among the single-parent households, those with 5 or more children have the highest poverty rate, with 11 household (100.0%) living below poverty.
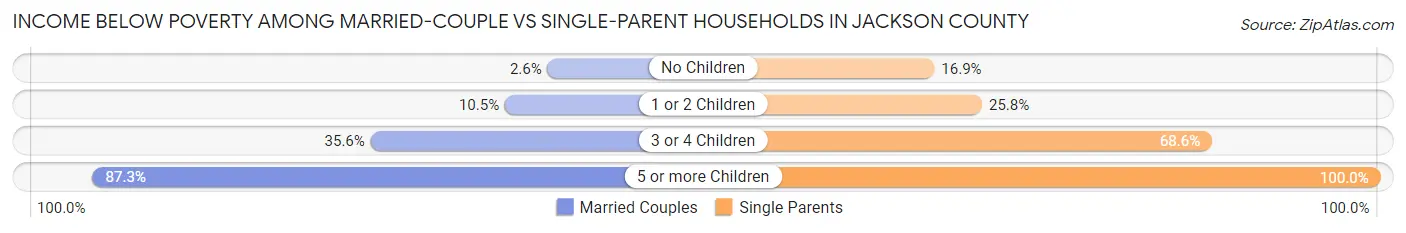
| Children | Married-Couple Families | Single-Parent Households |
| No Children | 128 (2.6%) | 207 (16.9%) |
| 1 or 2 Children | 216 (10.5%) | 428 (25.8%) |
| 3 or 4 Children | 187 (35.5%) | 249 (68.6%) |
| 5 or more Children | 62 (87.3%) | 11 (100.0%) |
| Total | 593 (7.8%) | 895 (27.5%) |
Race in Jackson County
The most populous races in Jackson County are White / Caucasian (32,107 | 67.3%), Black / African American (12,298 | 25.8%), and Hispanic or Latino (2,457 | 5.1%).
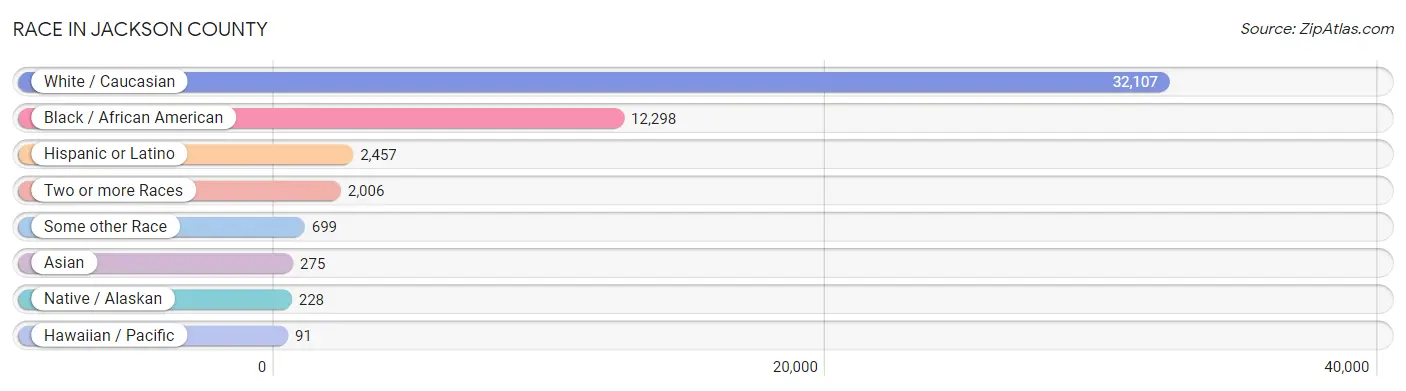
| Race | # Population | % Population |
| Asian | 275 | 0.6% |
| Black / African American | 12,298 | 25.8% |
| Hawaiian / Pacific | 91 | 0.2% |
| Hispanic or Latino | 2,457 | 5.1% |
| Native / Alaskan | 228 | 0.5% |
| White / Caucasian | 32,107 | 67.3% |
| Two or more Races | 2,006 | 4.2% |
| Some other Race | 699 | 1.5% |
| Total | 47,704 | 100.0% |
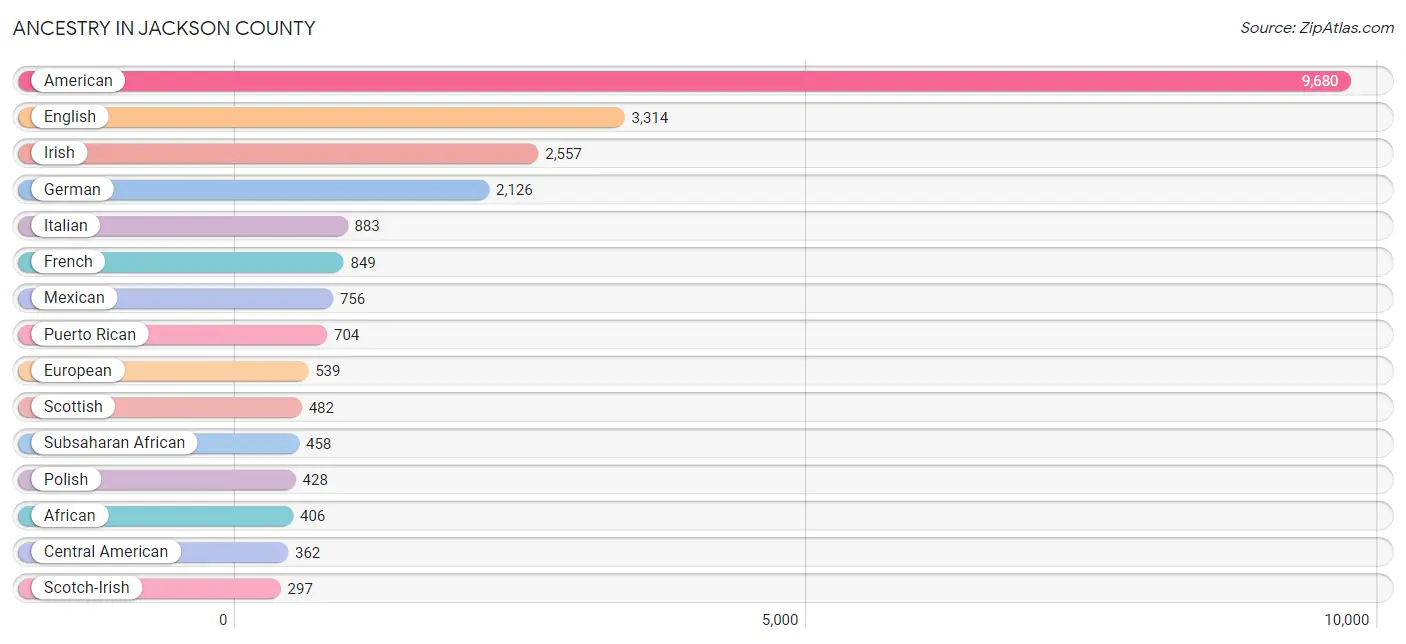
Ancestry in Jackson County
The most populous ancestries reported in Jackson County are American (9,680 | 20.3%), English (3,314 | 7.0%), Irish (2,557 | 5.4%), German (2,126 | 4.5%), and Italian (883 | 1.8%), together accounting for 38.9% of all Jackson County residents.
| Ancestry | # Population | % Population |
| African | 406 | 0.9% |
| Albanian | 11 | 0.0% |
| American | 9,680 | 20.3% |
| Arab | 66 | 0.1% |
| Argentinean | 16 | 0.0% |
| Austrian | 33 | 0.1% |
| Bahamian | 5 | 0.0% |
| Belgian | 10 | 0.0% |
| Bhutanese | 40 | 0.1% |
| Blackfeet | 30 | 0.1% |
| Brazilian | 17 | 0.0% |
| British | 173 | 0.4% |
| British West Indian | 9 | 0.0% |
| Burmese | 5 | 0.0% |
| Cajun | 26 | 0.1% |
| Canadian | 118 | 0.3% |
| Central American | 362 | 0.8% |
| Central American Indian | 20 | 0.0% |
| Cherokee | 277 | 0.6% |
| Chilean | 27 | 0.1% |
| Chippewa | 6 | 0.0% |
| Colombian | 97 | 0.2% |
| Costa Rican | 4 | 0.0% |
| Creek | 97 | 0.2% |
| Cuban | 261 | 0.5% |
| Czech | 4 | 0.0% |
| Czechoslovakian | 10 | 0.0% |
| Danish | 24 | 0.1% |
| Dominican | 20 | 0.0% |
| Dutch | 84 | 0.2% |
| Eastern European | 21 | 0.0% |
| Ecuadorian | 14 | 0.0% |
| English | 3,314 | 7.0% |
| European | 539 | 1.1% |
| Finnish | 18 | 0.0% |
| French | 849 | 1.8% |
| French Canadian | 140 | 0.3% |
| German | 2,126 | 4.5% |
| Greek | 20 | 0.0% |
| Guamanian / Chamorro | 36 | 0.1% |
| Guatemalan | 174 | 0.4% |
| Haitian | 245 | 0.5% |
| Honduran | 40 | 0.1% |
| Houma | 20 | 0.0% |
| Hungarian | 43 | 0.1% |
| Irish | 2,557 | 5.4% |
| Israeli | 6 | 0.0% |
| Italian | 883 | 1.8% |
| Jamaican | 143 | 0.3% |
| Japanese | 14 | 0.0% |
| Korean | 138 | 0.3% |
| Lebanese | 6 | 0.0% |
| Lithuanian | 36 | 0.1% |
| Mexican | 756 | 1.6% |
| Mexican American Indian | 5 | 0.0% |
| Moroccan | 60 | 0.1% |
| Native Hawaiian | 3 | 0.0% |
| Nicaraguan | 14 | 0.0% |
| Northern European | 12 | 0.0% |
| Norwegian | 147 | 0.3% |
| Pakistani | 77 | 0.2% |
| Panamanian | 3 | 0.0% |
| Polish | 428 | 0.9% |
| Portuguese | 17 | 0.0% |
| Puerto Rican | 704 | 1.5% |
| Romanian | 118 | 0.3% |
| Russian | 66 | 0.1% |
| Salvadoran | 127 | 0.3% |
| Samoan | 52 | 0.1% |
| Scandinavian | 93 | 0.2% |
| Scotch-Irish | 297 | 0.6% |
| Scottish | 482 | 1.0% |
| Slavic | 2 | 0.0% |
| Slovak | 3 | 0.0% |
| Somali | 52 | 0.1% |
| South American | 160 | 0.3% |
| South American Indian | 4 | 0.0% |
| Spaniard | 18 | 0.0% |
| Spanish | 10 | 0.0% |
| Subsaharan African | 458 | 1.0% |
| Swedish | 43 | 0.1% |
| Swiss | 16 | 0.0% |
| Thai | 227 | 0.5% |
| Trinidadian and Tobagonian | 8 | 0.0% |
| Ukrainian | 13 | 0.0% |
| Venezuelan | 6 | 0.0% |
| Welsh | 53 | 0.1% |
| West Indian | 17 | 0.0% |
| Yugoslavian | 5 | 0.0% | View All 89 Rows |
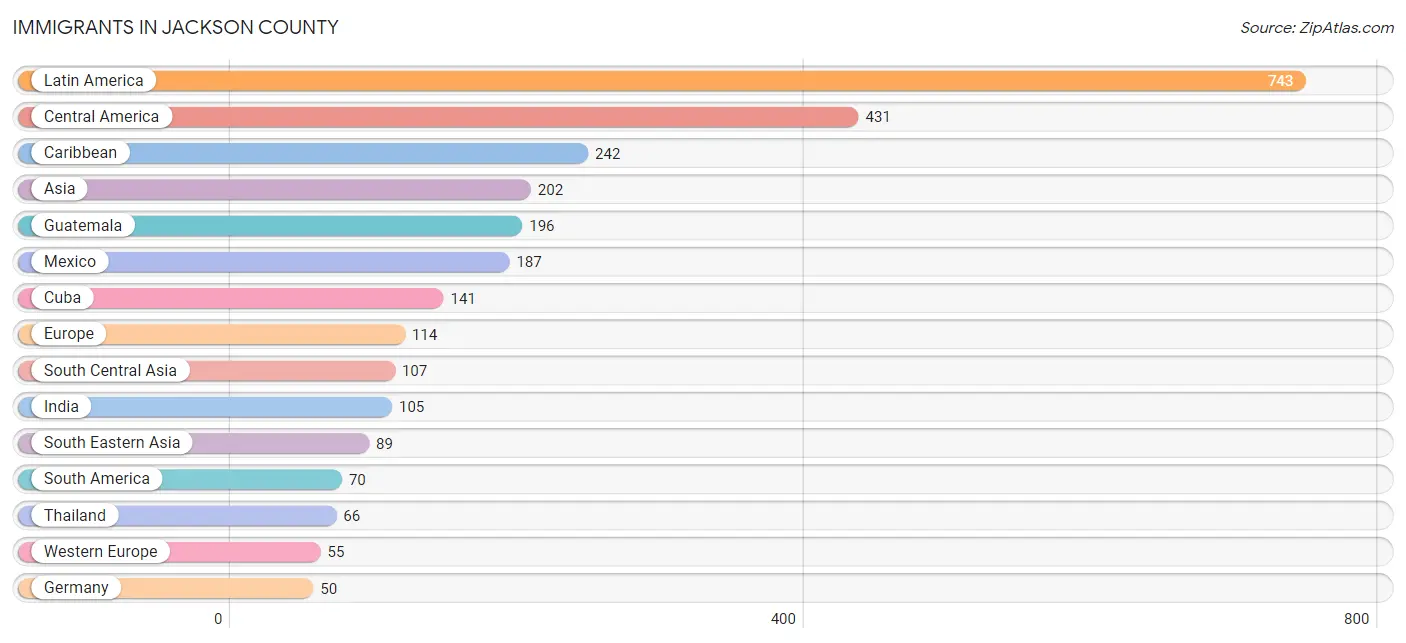
Immigrants in Jackson County
The most numerous immigrant groups reported in Jackson County came from Latin America (743 | 1.6%), Central America (431 | 0.9%), Caribbean (242 | 0.5%), Asia (202 | 0.4%), and Guatemala (196 | 0.4%), together accounting for 3.8% of all Jackson County residents.
| Immigration Origin | # Population | % Population |
| Argentina | 4 | 0.0% |
| Asia | 202 | 0.4% |
| Belgium | 5 | 0.0% |
| Brazil | 8 | 0.0% |
| Canada | 47 | 0.1% |
| Caribbean | 242 | 0.5% |
| Central America | 431 | 0.9% |
| Chile | 27 | 0.1% |
| Colombia | 4 | 0.0% |
| Costa Rica | 4 | 0.0% |
| Cuba | 141 | 0.3% |
| Denmark | 8 | 0.0% |
| Eastern Asia | 5 | 0.0% |
| Eastern Europe | 21 | 0.0% |
| Ecuador | 12 | 0.0% |
| El Salvador | 24 | 0.1% |
| England | 25 | 0.1% |
| Europe | 114 | 0.2% |
| Germany | 50 | 0.1% |
| Guatemala | 196 | 0.4% |
| Haiti | 44 | 0.1% |
| Honduras | 15 | 0.0% |
| India | 105 | 0.2% |
| Israel | 1 | 0.0% |
| Italy | 5 | 0.0% |
| Jamaica | 43 | 0.1% |
| Kazakhstan | 2 | 0.0% |
| Korea | 5 | 0.0% |
| Latin America | 743 | 1.6% |
| Mexico | 187 | 0.4% |
| Northern Europe | 33 | 0.1% |
| Philippines | 23 | 0.1% |
| Russia | 10 | 0.0% |
| South America | 70 | 0.2% |
| South Central Asia | 107 | 0.2% |
| South Eastern Asia | 89 | 0.2% |
| Southern Europe | 5 | 0.0% |
| Thailand | 66 | 0.1% |
| Trinidad and Tobago | 14 | 0.0% |
| Venezuela | 15 | 0.0% |
| Western Asia | 1 | 0.0% |
| Western Europe | 55 | 0.1% | View All 42 Rows |
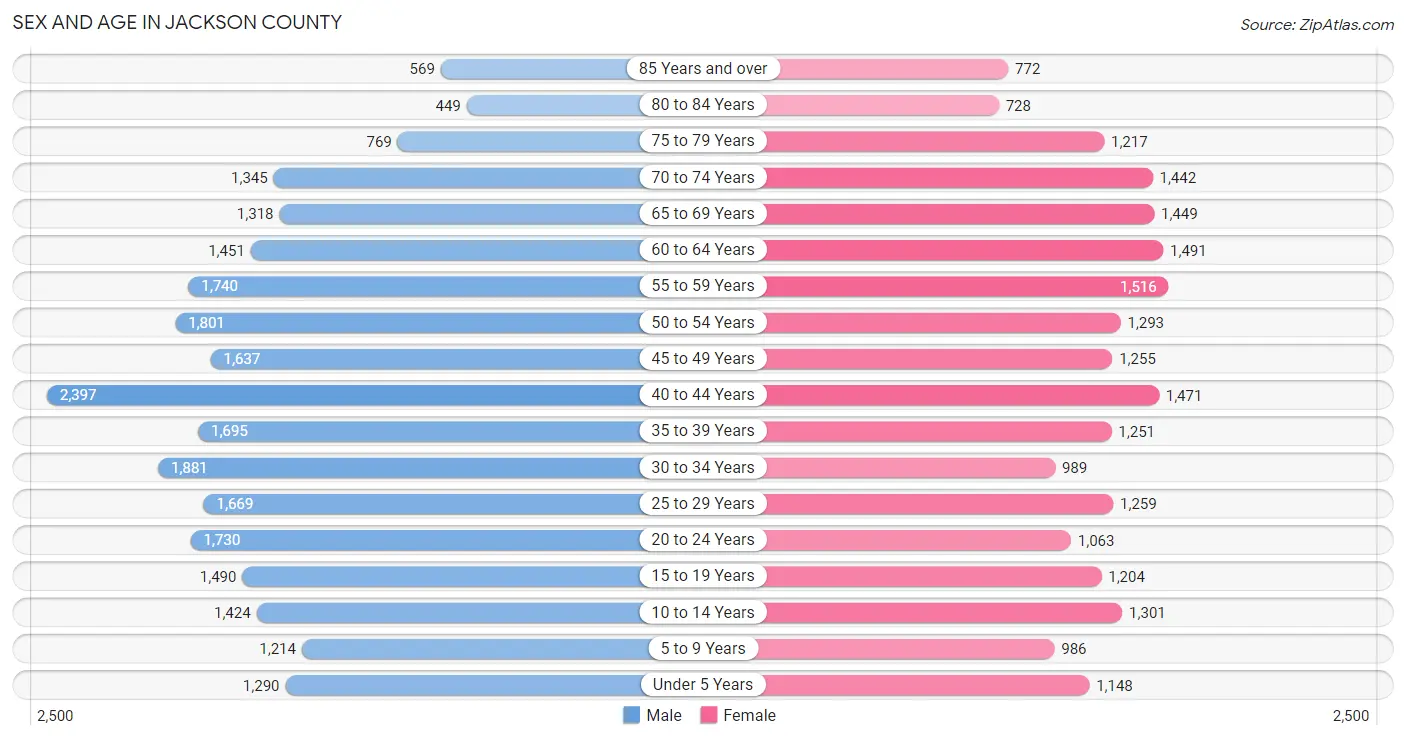
Sex and Age in Jackson County
Sex and Age in Jackson County
The most populous age groups in Jackson County are 40 to 44 Years (2,397 | 9.3%) for men and 55 to 59 Years (1,516 | 6.9%) for women.
| Age Bracket | Male | Female |
| Under 5 Years | 1,290 (5.0%) | 1,148 (5.3%) |
| 5 to 9 Years | 1,214 (4.7%) | 986 (4.5%) |
| 10 to 14 Years | 1,424 (5.5%) | 1,301 (6.0%) |
| 15 to 19 Years | 1,490 (5.8%) | 1,204 (5.5%) |
| 20 to 24 Years | 1,730 (6.7%) | 1,063 (4.9%) |
| 25 to 29 Years | 1,669 (6.5%) | 1,259 (5.8%) |
| 30 to 34 Years | 1,881 (7.3%) | 989 (4.5%) |
| 35 to 39 Years | 1,695 (6.6%) | 1,251 (5.7%) |
| 40 to 44 Years | 2,397 (9.3%) | 1,471 (6.7%) |
| 45 to 49 Years | 1,637 (6.3%) | 1,255 (5.8%) |
| 50 to 54 Years | 1,801 (7.0%) | 1,293 (5.9%) |
| 55 to 59 Years | 1,740 (6.7%) | 1,516 (6.9%) |
| 60 to 64 Years | 1,451 (5.6%) | 1,491 (6.8%) |
| 65 to 69 Years | 1,318 (5.1%) | 1,449 (6.6%) |
| 70 to 74 Years | 1,345 (5.2%) | 1,442 (6.6%) |
| 75 to 79 Years | 769 (3.0%) | 1,217 (5.6%) |
| 80 to 84 Years | 449 (1.7%) | 728 (3.3%) |
| 85 Years and over | 569 (2.2%) | 772 (3.5%) |
| Total | 25,869 (100.0%) | 21,835 (100.0%) |
Families and Households in Jackson County
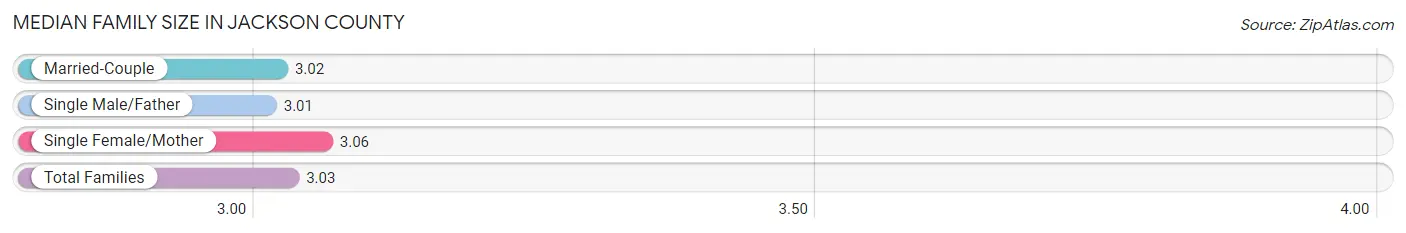
Median Family Size in Jackson County
The median family size in Jackson County is 3.03 persons per family, with single female/mother families (2,505 | 23.1%) accounting for the largest median family size of 3.06 persons per family. On the other hand, single male/father families (754 | 7.0%) represent the smallest median family size with 3.01 persons per family.
| Family Type | # Families | Family Size |
| Married-Couple | 7,578 (69.9%) | 3.02 |
| Single Male/Father | 754 (7.0%) | 3.01 |
| Single Female/Mother | 2,505 (23.1%) | 3.06 |
| Total Families | 10,837 (100.0%) | 3.03 |
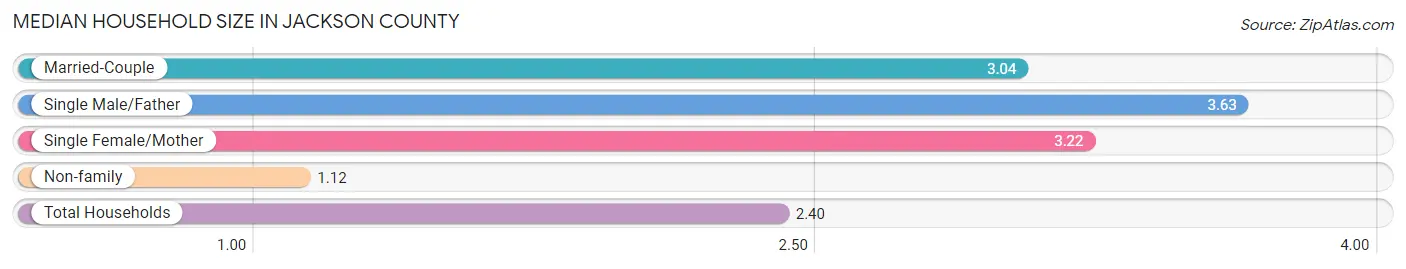
Median Household Size in Jackson County
The median household size in Jackson County is 2.40 persons per household, with single male/father households (754 | 4.5%) accounting for the largest median household size of 3.63 persons per household. non-family households (6,043 | 35.8%) represent the smallest median household size with 1.12 persons per household.
| Household Type | # Households | Household Size |
| Married-Couple | 7,578 (44.9%) | 3.04 |
| Single Male/Father | 754 (4.5%) | 3.63 |
| Single Female/Mother | 2,505 (14.8%) | 3.22 |
| Non-family | 6,043 (35.8%) | 1.12 |
| Total Households | 16,880 (100.0%) | 2.40 |
Household Size by Marriage Status in Jackson County
Out of a total of 16,880 households in Jackson County, 10,837 (64.2%) are family households, while 6,043 (35.8%) are nonfamily households. The most numerous type of family households are 2-person households, comprising 5,555, and the most common type of nonfamily households are 1-person households, comprising 5,354.
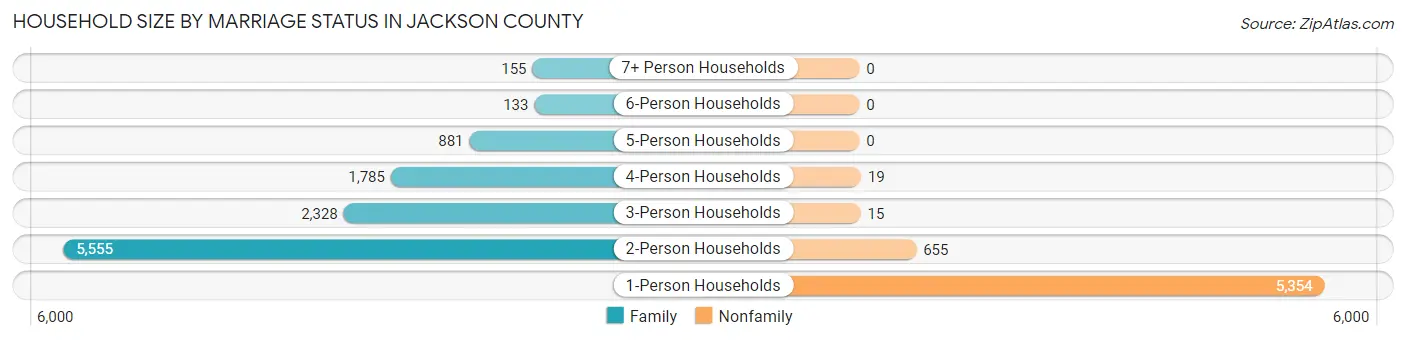
| Household Size | Family Households | Nonfamily Households |
| 1-Person Households | - | 5,354 (31.7%) |
| 2-Person Households | 5,555 (32.9%) | 655 (3.9%) |
| 3-Person Households | 2,328 (13.8%) | 15 (0.1%) |
| 4-Person Households | 1,785 (10.6%) | 19 (0.1%) |
| 5-Person Households | 881 (5.2%) | 0 (0.0%) |
| 6-Person Households | 133 (0.8%) | 0 (0.0%) |
| 7+ Person Households | 155 (0.9%) | 0 (0.0%) |
| Total | 10,837 (64.2%) | 6,043 (35.8%) |
Female Fertility in Jackson County
Fertility by Age in Jackson County
Average fertility rate in Jackson County is 68.0 births per 1,000 women. Women in the age bracket of 20 to 34 years have the highest fertility rate with 144.0 births per 1,000 women. Women in the age bracket of 20 to 34 years acount for 80.4% of all women with births.
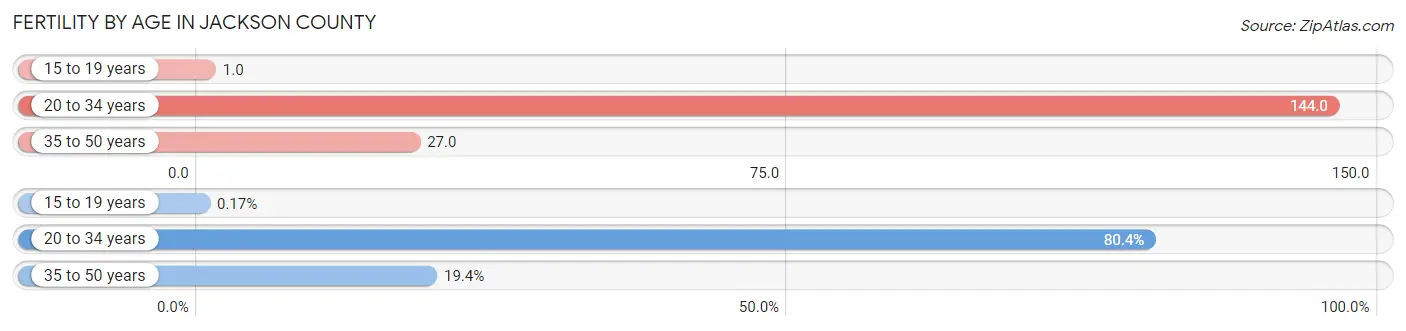
| Age Bracket | Women with Births | Births / 1,000 Women |
| 15 to 19 years | 1 (0.2%) | 1.0 |
| 20 to 34 years | 476 (80.4%) | 144.0 |
| 35 to 50 years | 115 (19.4%) | 27.0 |
| Total | 592 (100.0%) | 68.0 |
Fertility by Age by Marriage Status in Jackson County
37.3% of women with births (592) in Jackson County are married. The highest percentage of unmarried women with births falls into 15 to 19 years age bracket with 100.0% of them unmarried at the time of birth, while the lowest percentage of unmarried women with births belong to 35 to 50 years age bracket with 50.4% of them unmarried.
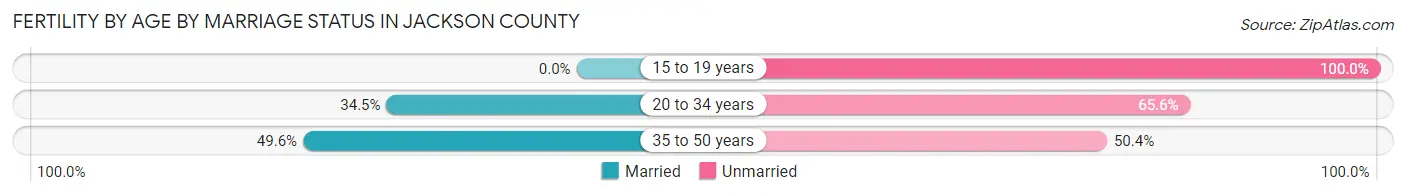
| Age Bracket | Married | Unmarried |
| 15 to 19 years | 0 (0.0%) | 1 (100.0%) |
| 20 to 34 years | 164 (34.4%) | 312 (65.5%) |
| 35 to 50 years | 57 (49.6%) | 58 (50.4%) |
| Total | 221 (37.3%) | 371 (62.7%) |
Fertility by Education in Jackson County
Average fertility rate in Jackson County is 68.0 births per 1,000 women. Women with the education attainment of high school diploma have the highest fertility rate of 102.0 births per 1,000 women, while women with the education attainment of bachelor's degree have the lowest fertility at 27.0 births per 1,000 women. Women with the education attainment of high school diploma represent 46.3% of all women with births.
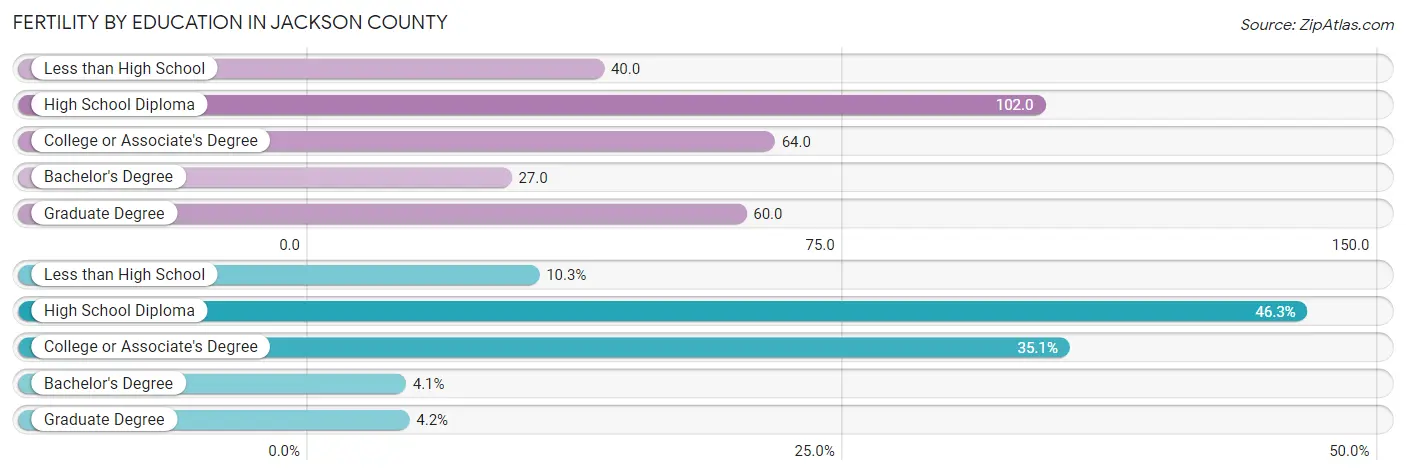
| Educational Attainment | Women with Births | Births / 1,000 Women |
| Less than High School | 61 (10.3%) | 40.0 |
| High School Diploma | 274 (46.3%) | 102.0 |
| College or Associate's Degree | 208 (35.1%) | 64.0 |
| Bachelor's Degree | 24 (4.1%) | 27.0 |
| Graduate Degree | 25 (4.2%) | 60.0 |
| Total | 592 (100.0%) | 68.0 |
Fertility by Education by Marriage Status in Jackson County
62.7% of women with births in Jackson County are unmarried. Women with the educational attainment of bachelor's degree are most likely to be married with 58.3% of them married at childbirth, while women with the educational attainment of college or associate's degree are least likely to be married with 67.3% of them unmarried at childbirth.
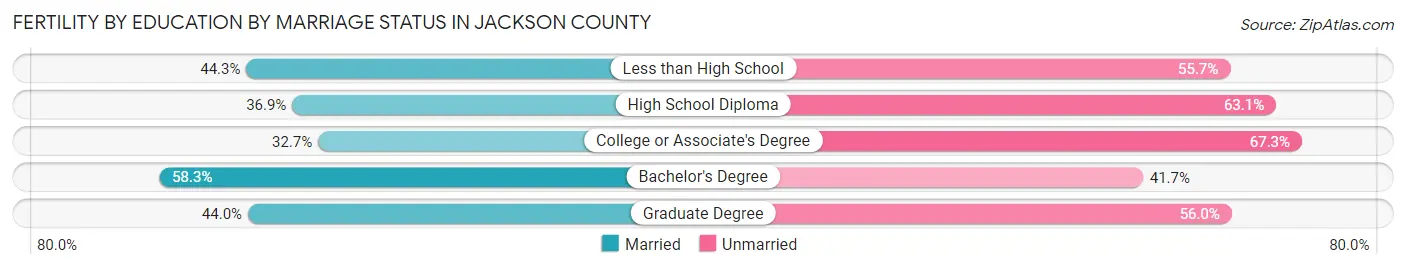
| Educational Attainment | Married | Unmarried |
| Less than High School | 27 (44.3%) | 34 (55.7%) |
| High School Diploma | 101 (36.9%) | 173 (63.1%) |
| College or Associate's Degree | 68 (32.7%) | 140 (67.3%) |
| Bachelor's Degree | 14 (58.3%) | 10 (41.7%) |
| Graduate Degree | 11 (44.0%) | 14 (56.0%) |
| Total | 221 (37.3%) | 371 (62.7%) |
Employment Characteristics in Jackson County
Employment by Class of Employer in Jackson County
Among the 16,059 employed individuals in Jackson County, private company employees (8,923 | 55.6%), state government employees (2,752 | 17.1%), and not-for-profit organizations (1,259 | 7.8%) make up the most common classes of employment.
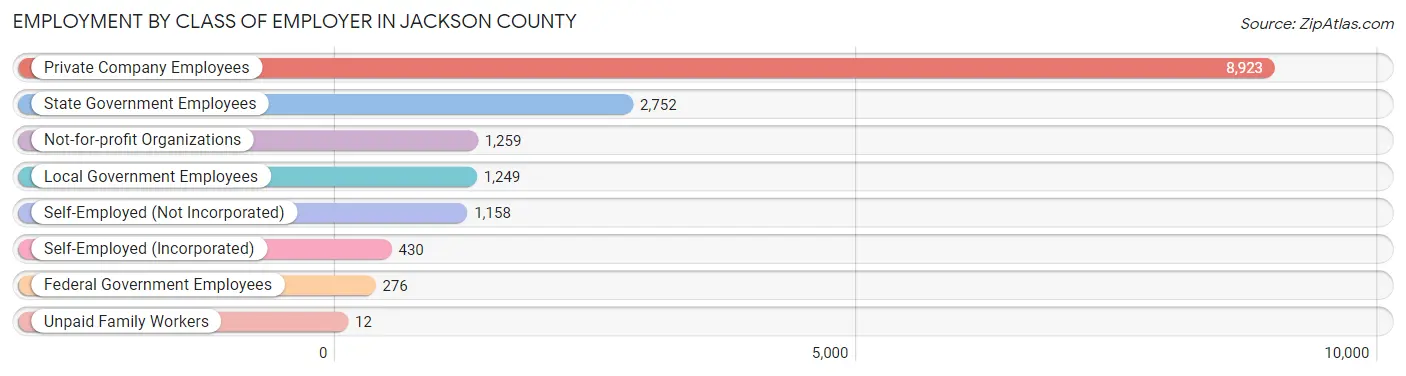
| Employer Class | # Employees | % Employees |
| Private Company Employees | 8,923 | 55.6% |
| Self-Employed (Incorporated) | 430 | 2.7% |
| Self-Employed (Not Incorporated) | 1,158 | 7.2% |
| Not-for-profit Organizations | 1,259 | 7.8% |
| Local Government Employees | 1,249 | 7.8% |
| State Government Employees | 2,752 | 17.1% |
| Federal Government Employees | 276 | 1.7% |
| Unpaid Family Workers | 12 | 0.1% |
| Total | 16,059 | 100.0% |
Employment Status by Age in Jackson County
According to the labor force statistics for Jackson County, out of the total population over 16 years of age (39,988), 42.5% or 16,995 individuals are in the labor force, with 4.7% or 799 of them unemployed. The age group with the highest labor force participation rate is 20 to 24 years, with 68.2% or 1,905 individuals in the labor force. Within the labor force, the 30 to 34 years age range has the highest percentage of unemployed individuals, with 10.2% or 168 of them being unemployed.
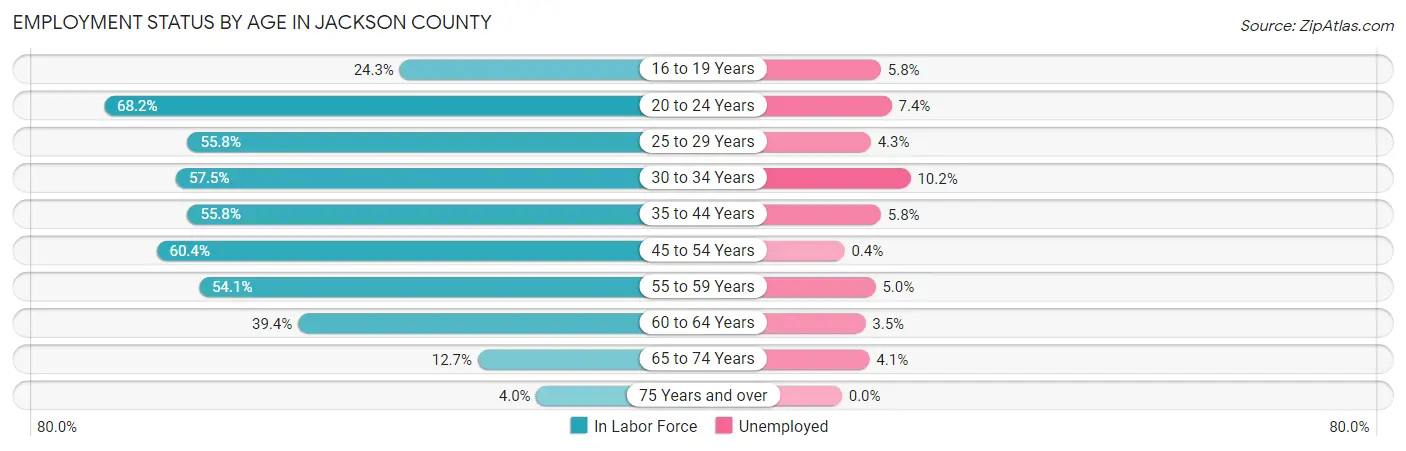
| Age Bracket | In Labor Force | Unemployed |
| 16 to 19 Years | 569 (24.3%) | 33 (5.8%) |
| 20 to 24 Years | 1,905 (68.2%) | 141 (7.4%) |
| 25 to 29 Years | 1,634 (55.8%) | 70 (4.3%) |
| 30 to 34 Years | 1,650 (57.5%) | 168 (10.2%) |
| 35 to 44 Years | 3,802 (55.8%) | 221 (5.8%) |
| 45 to 54 Years | 3,616 (60.4%) | 14 (0.4%) |
| 55 to 59 Years | 1,761 (54.1%) | 88 (5.0%) |
| 60 to 64 Years | 1,159 (39.4%) | 41 (3.5%) |
| 65 to 74 Years | 705 (12.7%) | 29 (4.1%) |
| 75 Years and over | 180 (4.0%) | 0 (0.0%) |
| Total | 16,995 (42.5%) | 799 (4.7%) |
Employment Status by Educational Attainment in Jackson County
According to labor force statistics for Jackson County, 54.9% of individuals (13,613) out of the total population between 25 and 64 years of age (24,796) are in the labor force, with 4.4% or 599 of them being unemployed. The group with the highest labor force participation rate are those with the educational attainment of bachelor's degree or higher, with 73.0% or 2,271 individuals in the labor force. Within the labor force, individuals with less than high school education have the highest percentage of unemployment, with 12.6% or 114 of them being unemployed.
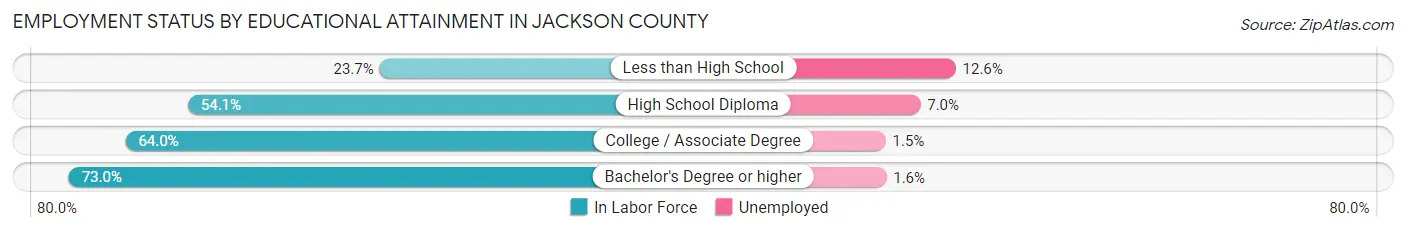
| Educational Attainment | In Labor Force | Unemployed |
| Less than High School | 901 (23.7%) | 479 (12.6%) |
| High School Diploma | 5,447 (54.1%) | 705 (7.0%) |
| College / Associate Degree | 5,001 (64.0%) | 117 (1.5%) |
| Bachelor's Degree or higher | 2,271 (73.0%) | 50 (1.6%) |
| Total | 13,613 (54.9%) | 1,091 (4.4%) |
Employment Occupations by Sex in Jackson County
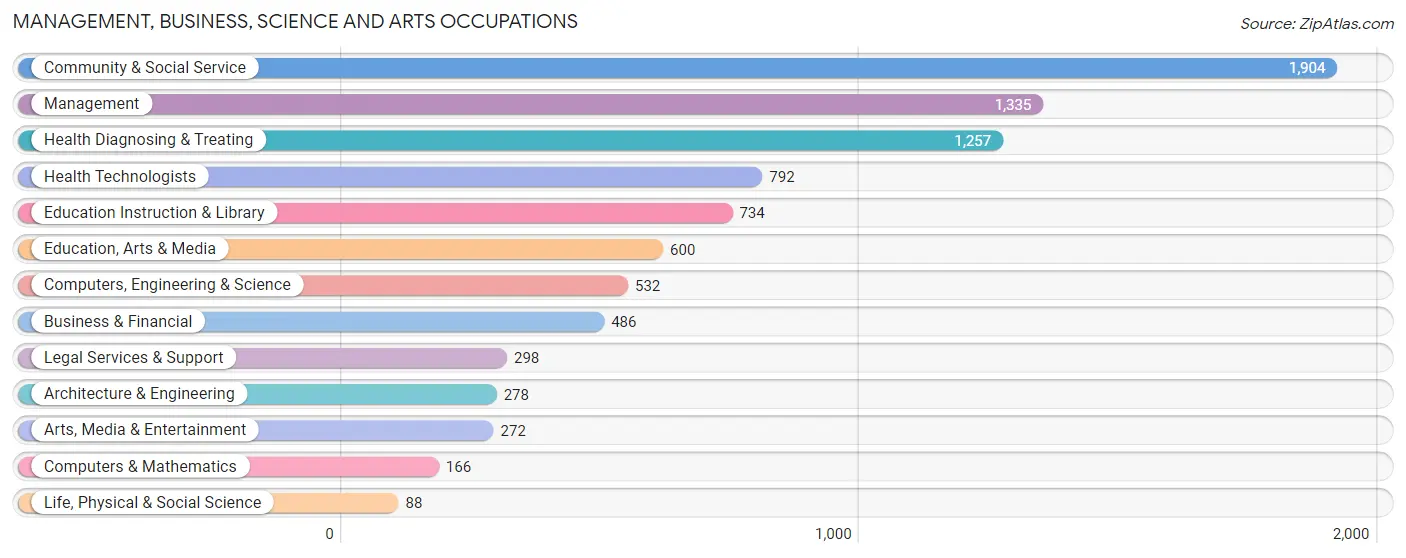
Management, Business, Science and Arts Occupations
The most common Management, Business, Science and Arts occupations in Jackson County are Community & Social Service (1,904 | 11.8%), Management (1,335 | 8.3%), Health Diagnosing & Treating (1,257 | 7.8%), Health Technologists (792 | 4.9%), and Education Instruction & Library (734 | 4.5%).
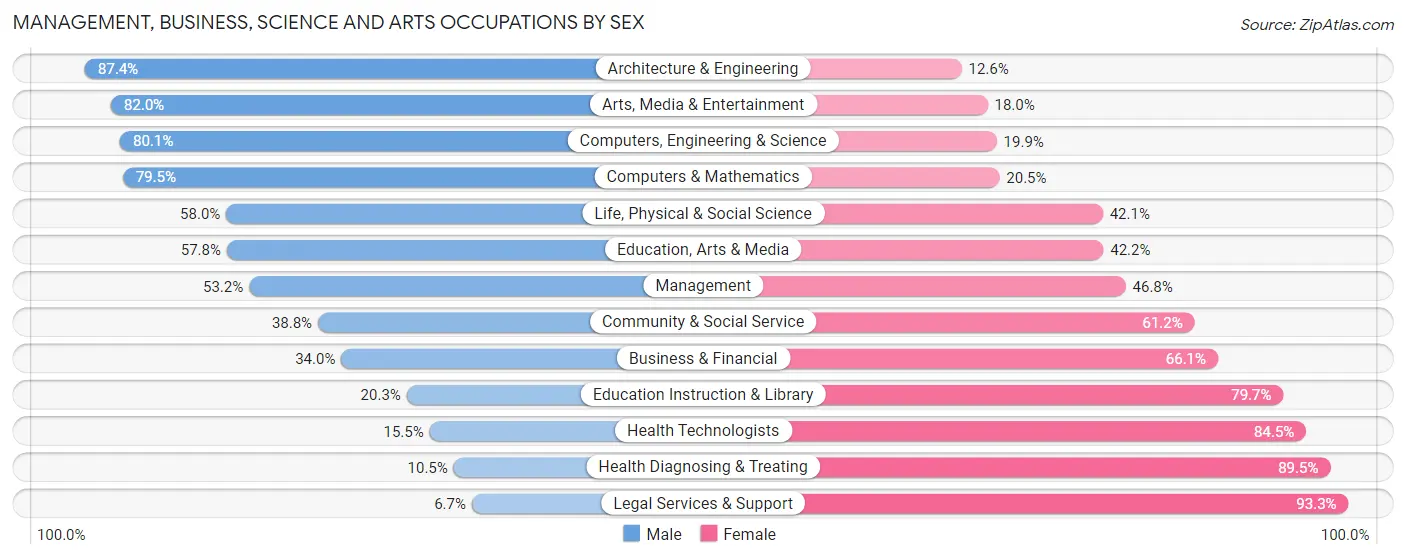
Management, Business, Science and Arts Occupations by Sex
Within the Management, Business, Science and Arts occupations in Jackson County, the most male-oriented occupations are Architecture & Engineering (87.4%), Arts, Media & Entertainment (82.0%), and Computers, Engineering & Science (80.1%), while the most female-oriented occupations are Legal Services & Support (93.3%), Health Diagnosing & Treating (89.5%), and Health Technologists (84.5%).
| Occupation | Male | Female |
| Management | 710 (53.2%) | 625 (46.8%) |
| Business & Financial | 165 (34.0%) | 321 (66.0%) |
| Computers, Engineering & Science | 426 (80.1%) | 106 (19.9%) |
| Computers & Mathematics | 132 (79.5%) | 34 (20.5%) |
| Architecture & Engineering | 243 (87.4%) | 35 (12.6%) |
| Life, Physical & Social Science | 51 (58.0%) | 37 (42.0%) |
| Community & Social Service | 739 (38.8%) | 1,165 (61.2%) |
| Education, Arts & Media | 347 (57.8%) | 253 (42.2%) |
| Legal Services & Support | 20 (6.7%) | 278 (93.3%) |
| Education Instruction & Library | 149 (20.3%) | 585 (79.7%) |
| Arts, Media & Entertainment | 223 (82.0%) | 49 (18.0%) |
| Health Diagnosing & Treating | 132 (10.5%) | 1,125 (89.5%) |
| Health Technologists | 123 (15.5%) | 669 (84.5%) |
| Total (Category) | 2,172 (39.4%) | 3,342 (60.6%) |
| Total (Overall) | 8,214 (50.9%) | 7,912 (49.1%) |
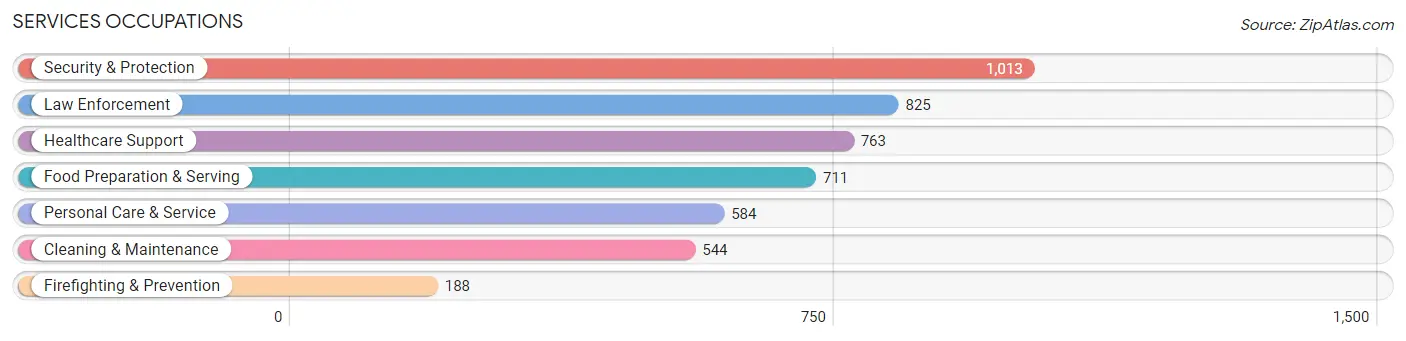
Services Occupations
The most common Services occupations in Jackson County are Security & Protection (1,013 | 6.3%), Law Enforcement (825 | 5.1%), Healthcare Support (763 | 4.7%), Food Preparation & Serving (711 | 4.4%), and Personal Care & Service (584 | 3.6%).
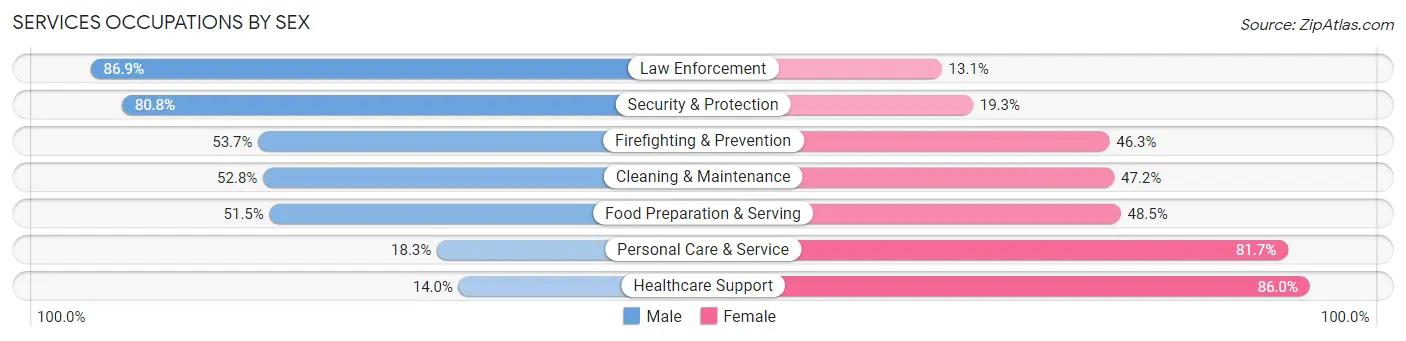
Services Occupations by Sex
Within the Services occupations in Jackson County, the most male-oriented occupations are Law Enforcement (86.9%), Security & Protection (80.7%), and Firefighting & Prevention (53.7%), while the most female-oriented occupations are Healthcare Support (86.0%), Personal Care & Service (81.7%), and Food Preparation & Serving (48.5%).
| Occupation | Male | Female |
| Healthcare Support | 107 (14.0%) | 656 (86.0%) |
| Security & Protection | 818 (80.7%) | 195 (19.3%) |
| Firefighting & Prevention | 101 (53.7%) | 87 (46.3%) |
| Law Enforcement | 717 (86.9%) | 108 (13.1%) |
| Food Preparation & Serving | 366 (51.5%) | 345 (48.5%) |
| Cleaning & Maintenance | 287 (52.8%) | 257 (47.2%) |
| Personal Care & Service | 107 (18.3%) | 477 (81.7%) |
| Total (Category) | 1,685 (46.6%) | 1,930 (53.4%) |
| Total (Overall) | 8,214 (50.9%) | 7,912 (49.1%) |
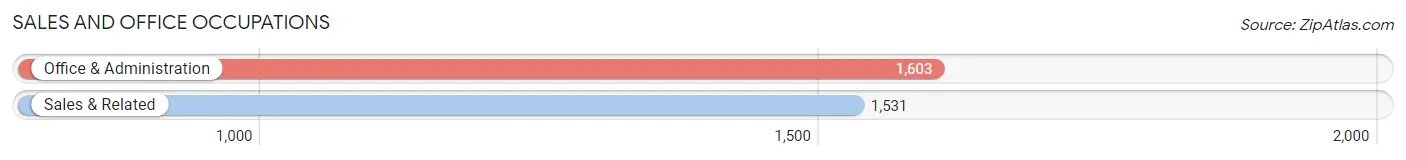
Sales and Office Occupations
The most common Sales and Office occupations in Jackson County are Office & Administration (1,603 | 9.9%), and Sales & Related (1,531 | 9.5%).
Sales and Office Occupations by Sex
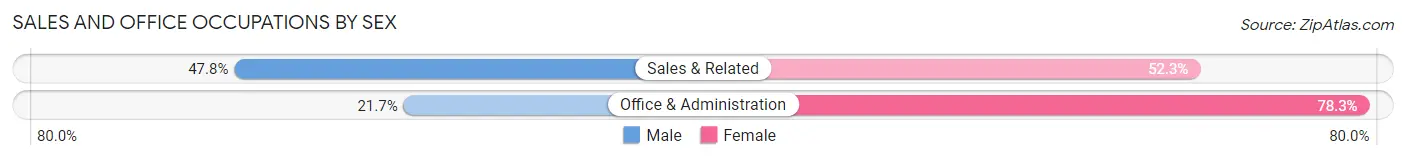
| Occupation | Male | Female |
| Sales & Related | 731 (47.7%) | 800 (52.2%) |
| Office & Administration | 348 (21.7%) | 1,255 (78.3%) |
| Total (Category) | 1,079 (34.4%) | 2,055 (65.6%) |
| Total (Overall) | 8,214 (50.9%) | 7,912 (49.1%) |
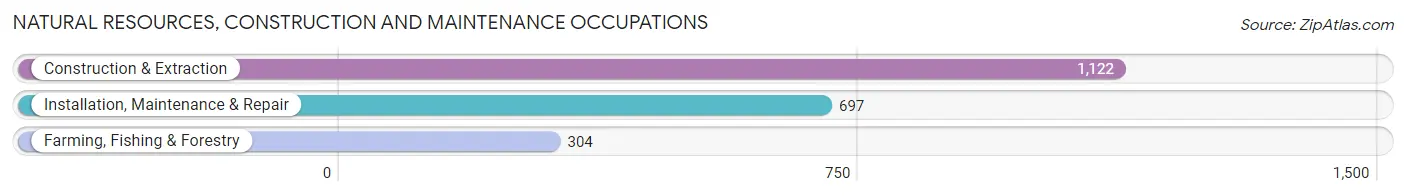
Natural Resources, Construction and Maintenance Occupations
The most common Natural Resources, Construction and Maintenance occupations in Jackson County are Construction & Extraction (1,122 | 7.0%), Installation, Maintenance & Repair (697 | 4.3%), and Farming, Fishing & Forestry (304 | 1.9%).
Natural Resources, Construction and Maintenance Occupations by Sex
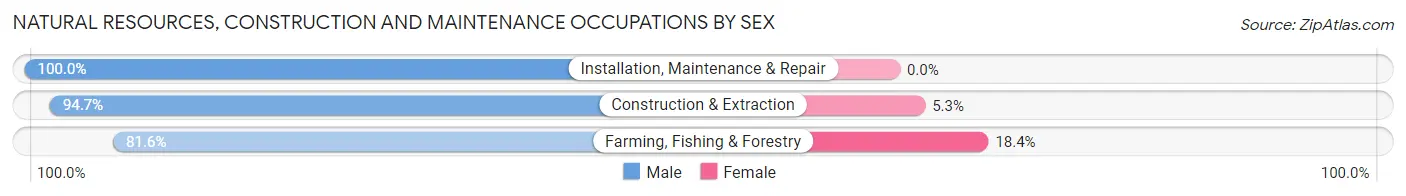
| Occupation | Male | Female |
| Farming, Fishing & Forestry | 248 (81.6%) | 56 (18.4%) |
| Construction & Extraction | 1,063 (94.7%) | 59 (5.3%) |
| Installation, Maintenance & Repair | 697 (100.0%) | 0 (0.0%) |
| Total (Category) | 2,008 (94.6%) | 115 (5.4%) |
| Total (Overall) | 8,214 (50.9%) | 7,912 (49.1%) |
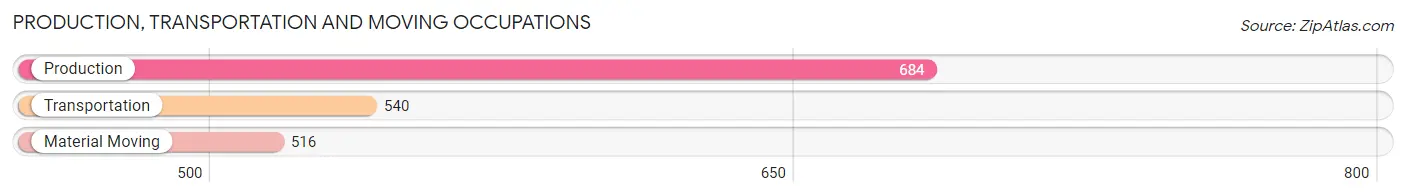
Production, Transportation and Moving Occupations
The most common Production, Transportation and Moving occupations in Jackson County are Production (684 | 4.2%), Transportation (540 | 3.4%), and Material Moving (516 | 3.2%).
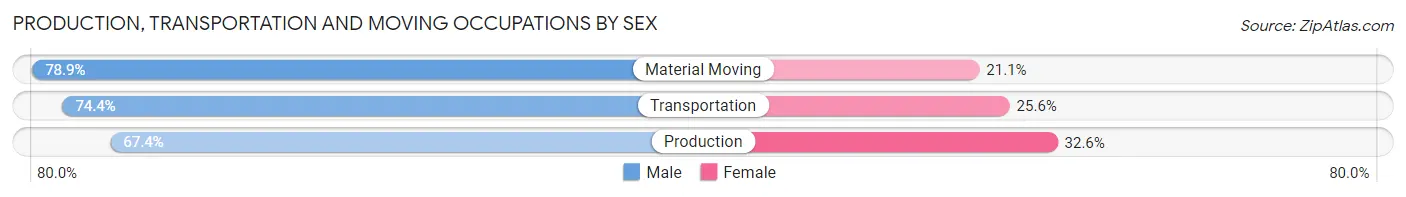
Production, Transportation and Moving Occupations by Sex
| Occupation | Male | Female |
| Production | 461 (67.4%) | 223 (32.6%) |
| Transportation | 402 (74.4%) | 138 (25.6%) |
| Material Moving | 407 (78.9%) | 109 (21.1%) |
| Total (Category) | 1,270 (73.0%) | 470 (27.0%) |
| Total (Overall) | 8,214 (50.9%) | 7,912 (49.1%) |
Employment Industries by Sex in Jackson County
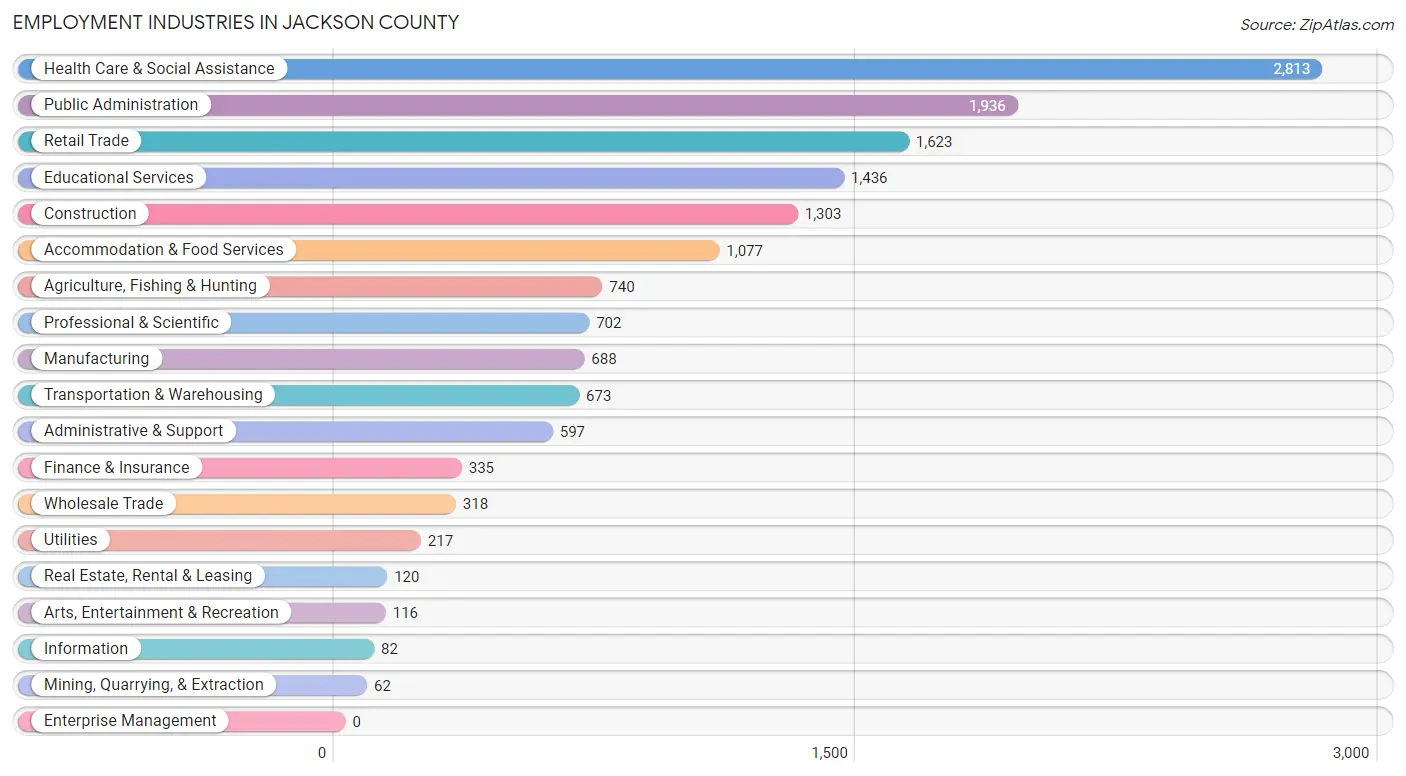
Employment Industries in Jackson County
The major employment industries in Jackson County include Health Care & Social Assistance (2,813 | 17.4%), Public Administration (1,936 | 12.0%), Retail Trade (1,623 | 10.1%), Educational Services (1,436 | 8.9%), and Construction (1,303 | 8.1%).
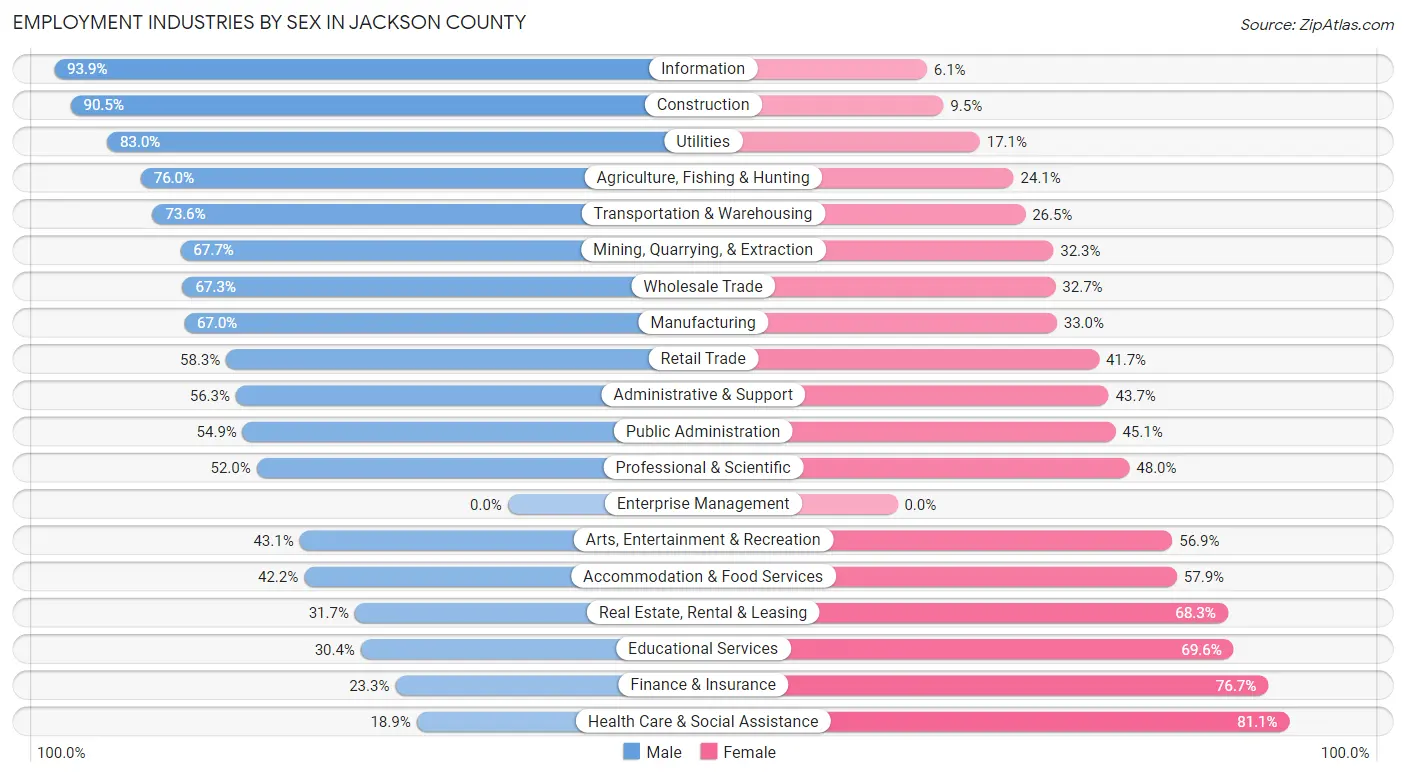
Employment Industries by Sex in Jackson County
The Jackson County industries that see more men than women are Information (93.9%), Construction (90.5%), and Utilities (83.0%), whereas the industries that tend to have a higher number of women are Health Care & Social Assistance (81.1%), Finance & Insurance (76.7%), and Educational Services (69.6%).
| Industry | Male | Female |
| Agriculture, Fishing & Hunting | 562 (75.9%) | 178 (24.0%) |
| Mining, Quarrying, & Extraction | 42 (67.7%) | 20 (32.3%) |
| Construction | 1,179 (90.5%) | 124 (9.5%) |
| Manufacturing | 461 (67.0%) | 227 (33.0%) |
| Wholesale Trade | 214 (67.3%) | 104 (32.7%) |
| Retail Trade | 946 (58.3%) | 677 (41.7%) |
| Transportation & Warehousing | 495 (73.6%) | 178 (26.5%) |
| Utilities | 180 (83.0%) | 37 (17.1%) |
| Information | 77 (93.9%) | 5 (6.1%) |
| Finance & Insurance | 78 (23.3%) | 257 (76.7%) |
| Real Estate, Rental & Leasing | 38 (31.7%) | 82 (68.3%) |
| Professional & Scientific | 365 (52.0%) | 337 (48.0%) |
| Enterprise Management | 0 (0.0%) | 0 (0.0%) |
| Administrative & Support | 336 (56.3%) | 261 (43.7%) |
| Educational Services | 437 (30.4%) | 999 (69.6%) |
| Health Care & Social Assistance | 531 (18.9%) | 2,282 (81.1%) |
| Arts, Entertainment & Recreation | 50 (43.1%) | 66 (56.9%) |
| Accommodation & Food Services | 454 (42.1%) | 623 (57.9%) |
| Public Administration | 1,062 (54.9%) | 874 (45.1%) |
| Total | 8,214 (50.9%) | 7,912 (49.1%) |
Education in Jackson County
School Enrollment in Jackson County
The most common levels of schooling among the 9,346 students in Jackson County are high school (2,245 | 24.0%), middle school (2,029 | 21.7%), and elementary school (1,800 | 19.3%).
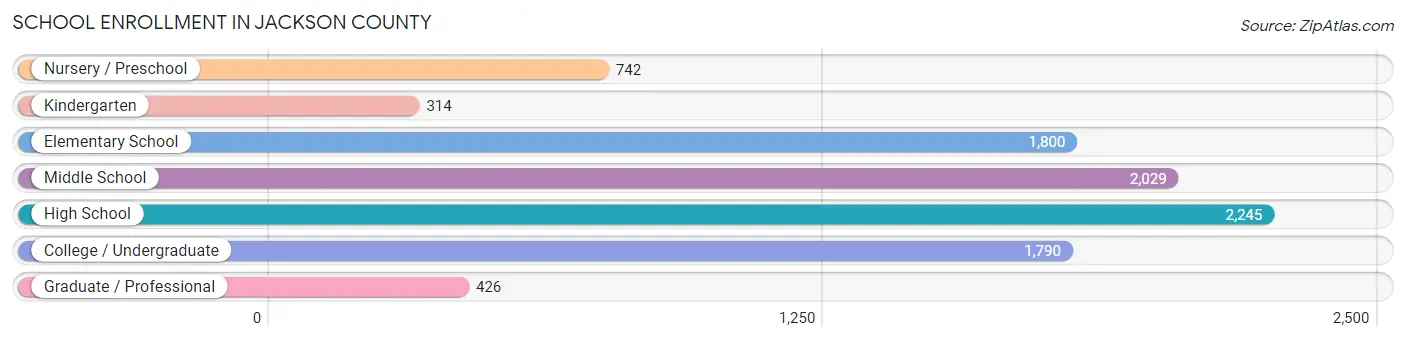
| School Level | # Students | % Students |
| Nursery / Preschool | 742 | 7.9% |
| Kindergarten | 314 | 3.4% |
| Elementary School | 1,800 | 19.3% |
| Middle School | 2,029 | 21.7% |
| High School | 2,245 | 24.0% |
| College / Undergraduate | 1,790 | 19.2% |
| Graduate / Professional | 426 | 4.6% |
| Total | 9,346 | 100.0% |
School Enrollment by Age by Funding Source in Jackson County
Out of a total of 9,346 students who are enrolled in schools in Jackson County, 1,636 (17.5%) attend a private institution, while the remaining 7,710 (82.5%) are enrolled in public schools. The age group of 35 years and over has the highest likelihood of being enrolled in private schools, with 242 (38.1% in the age bracket) enrolled. Conversely, the age group of 15 to 17 year olds has the lowest likelihood of being enrolled in a private school, with 1,272 (89.4% in the age bracket) attending a public institution.
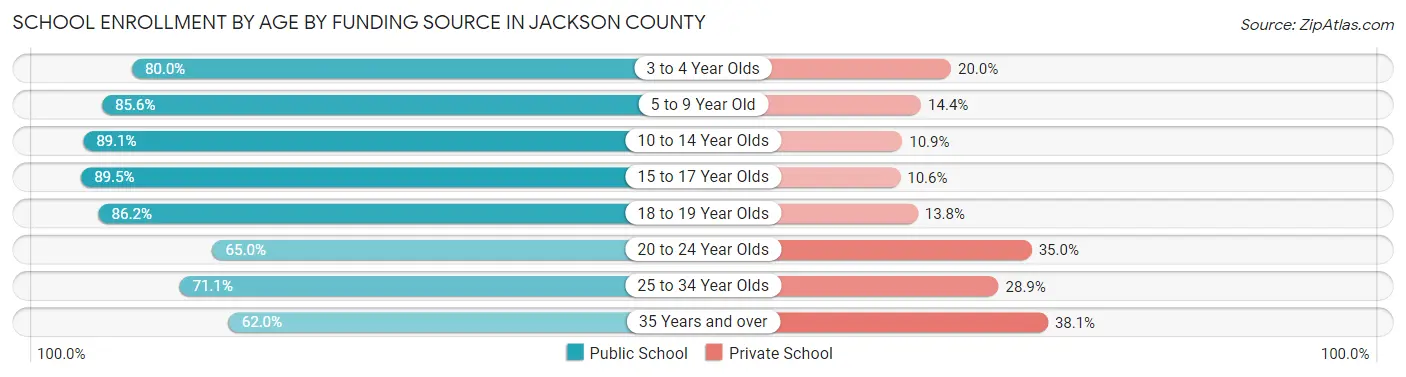
| Age Bracket | Public School | Private School |
| 3 to 4 Year Olds | 420 (80.0%) | 105 (20.0%) |
| 5 to 9 Year Old | 1,750 (85.6%) | 295 (14.4%) |
| 10 to 14 Year Olds | 2,244 (89.1%) | 275 (10.9%) |
| 15 to 17 Year Olds | 1,272 (89.4%) | 150 (10.5%) |
| 18 to 19 Year Olds | 706 (86.2%) | 113 (13.8%) |
| 20 to 24 Year Olds | 640 (65.0%) | 345 (35.0%) |
| 25 to 34 Year Olds | 281 (71.1%) | 114 (28.9%) |
| 35 Years and over | 394 (62.0%) | 242 (38.1%) |
| Total | 7,710 (82.5%) | 1,636 (17.5%) |
Educational Attainment by Field of Study in Jackson County
Education (1,021 | 20.3%), business (780 | 15.5%), science & technology (650 | 12.9%), arts & humanities (491 | 9.8%), and engineering (471 | 9.4%) are the most common fields of study among 5,028 individuals in Jackson County who have obtained a bachelor's degree or higher.
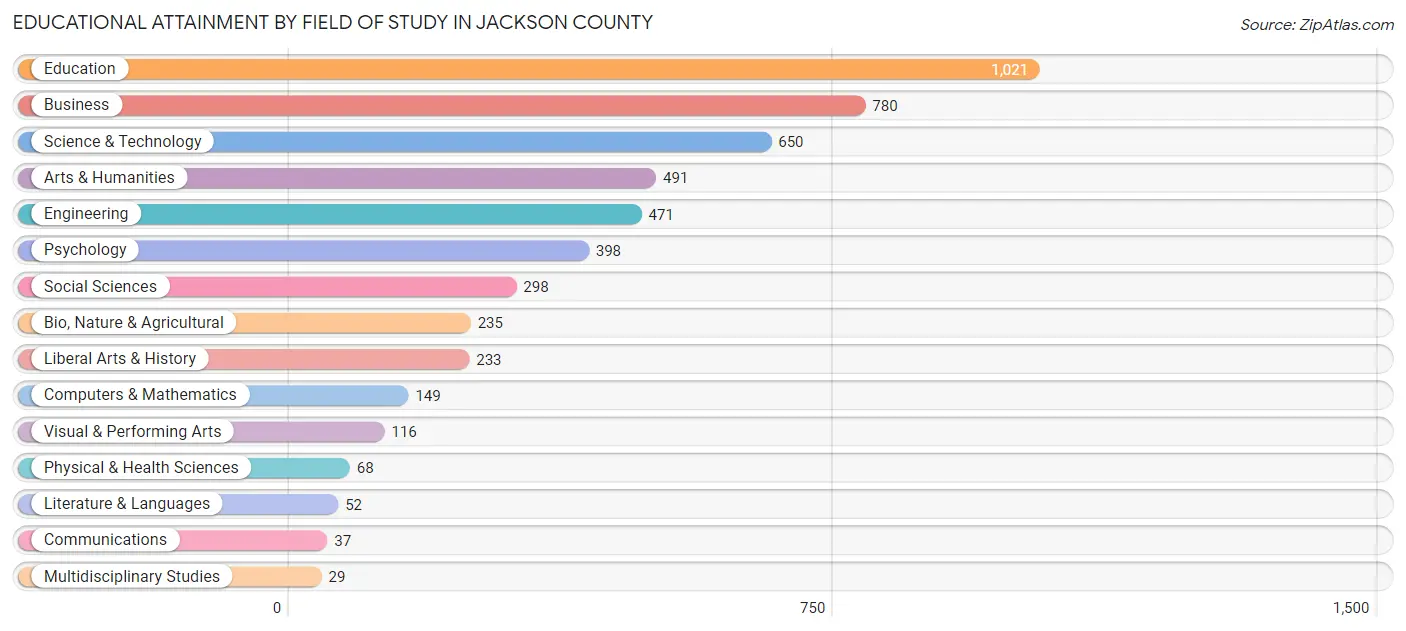
| Field of Study | # Graduates | % Graduates |
| Computers & Mathematics | 149 | 3.0% |
| Bio, Nature & Agricultural | 235 | 4.7% |
| Physical & Health Sciences | 68 | 1.3% |
| Psychology | 398 | 7.9% |
| Social Sciences | 298 | 5.9% |
| Engineering | 471 | 9.4% |
| Multidisciplinary Studies | 29 | 0.6% |
| Science & Technology | 650 | 12.9% |
| Business | 780 | 15.5% |
| Education | 1,021 | 20.3% |
| Literature & Languages | 52 | 1.0% |
| Liberal Arts & History | 233 | 4.6% |
| Visual & Performing Arts | 116 | 2.3% |
| Communications | 37 | 0.7% |
| Arts & Humanities | 491 | 9.8% |
| Total | 5,028 | 100.0% |
Transportation & Commute in Jackson County
Vehicle Availability by Sex in Jackson County
The most prevalent vehicle ownership categories in Jackson County are males with 2 vehicles (2,634, accounting for 33.0%) and females with 2 vehicles (2,635, making up 34.3%).
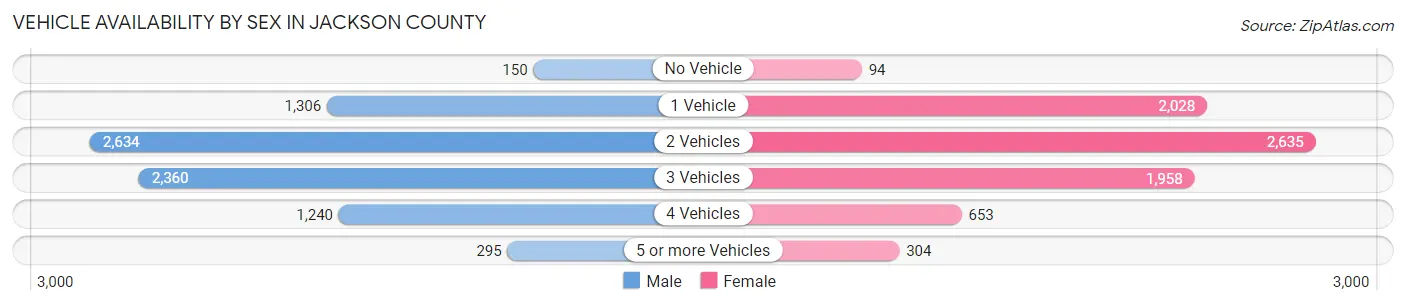
| Vehicles Available | Male | Female |
| No Vehicle | 150 (1.9%) | 94 (1.2%) |
| 1 Vehicle | 1,306 (16.4%) | 2,028 (26.4%) |
| 2 Vehicles | 2,634 (33.0%) | 2,635 (34.4%) |
| 3 Vehicles | 2,360 (29.6%) | 1,958 (25.5%) |
| 4 Vehicles | 1,240 (15.5%) | 653 (8.5%) |
| 5 or more Vehicles | 295 (3.7%) | 304 (4.0%) |
| Total | 7,985 (100.0%) | 7,672 (100.0%) |
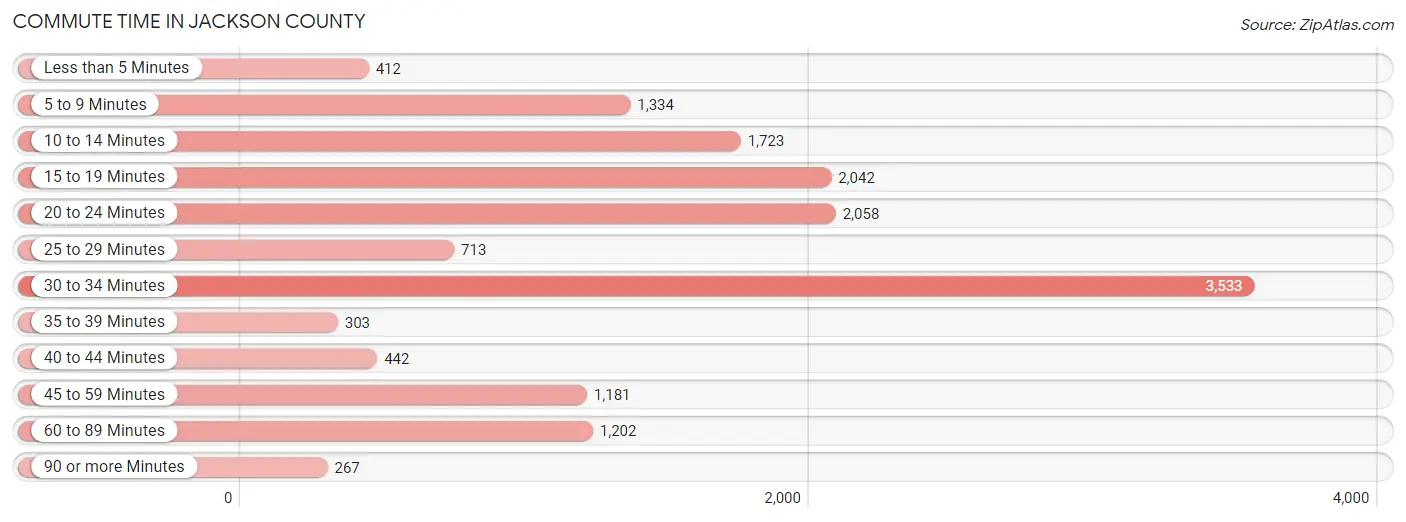
Commute Time in Jackson County
The most frequently occuring commute durations in Jackson County are 30 to 34 minutes (3,533 commuters, 23.2%), 20 to 24 minutes (2,058 commuters, 13.5%), and 15 to 19 minutes (2,042 commuters, 13.4%).
| Commute Time | # Commuters | % Commuters |
| Less than 5 Minutes | 412 | 2.7% |
| 5 to 9 Minutes | 1,334 | 8.8% |
| 10 to 14 Minutes | 1,723 | 11.3% |
| 15 to 19 Minutes | 2,042 | 13.4% |
| 20 to 24 Minutes | 2,058 | 13.5% |
| 25 to 29 Minutes | 713 | 4.7% |
| 30 to 34 Minutes | 3,533 | 23.2% |
| 35 to 39 Minutes | 303 | 2.0% |
| 40 to 44 Minutes | 442 | 2.9% |
| 45 to 59 Minutes | 1,181 | 7.8% |
| 60 to 89 Minutes | 1,202 | 7.9% |
| 90 or more Minutes | 267 | 1.8% |
Commute Time by Sex in Jackson County
The most common commute times in Jackson County are 30 to 34 minutes (1,853 commuters, 23.8%) for males and 30 to 34 minutes (1,680 commuters, 22.6%) for females.
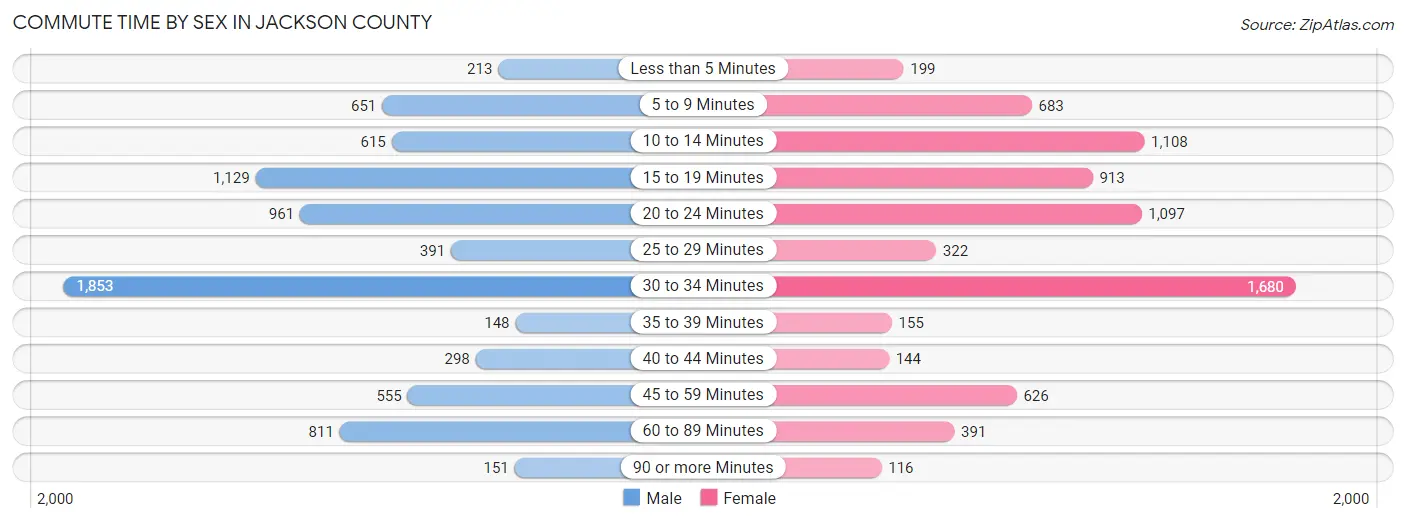
| Commute Time | Male | Female |
| Less than 5 Minutes | 213 (2.7%) | 199 (2.7%) |
| 5 to 9 Minutes | 651 (8.4%) | 683 (9.2%) |
| 10 to 14 Minutes | 615 (7.9%) | 1,108 (14.9%) |
| 15 to 19 Minutes | 1,129 (14.5%) | 913 (12.3%) |
| 20 to 24 Minutes | 961 (12.4%) | 1,097 (14.8%) |
| 25 to 29 Minutes | 391 (5.0%) | 322 (4.3%) |
| 30 to 34 Minutes | 1,853 (23.8%) | 1,680 (22.6%) |
| 35 to 39 Minutes | 148 (1.9%) | 155 (2.1%) |
| 40 to 44 Minutes | 298 (3.8%) | 144 (1.9%) |
| 45 to 59 Minutes | 555 (7.1%) | 626 (8.4%) |
| 60 to 89 Minutes | 811 (10.4%) | 391 (5.3%) |
| 90 or more Minutes | 151 (1.9%) | 116 (1.6%) |
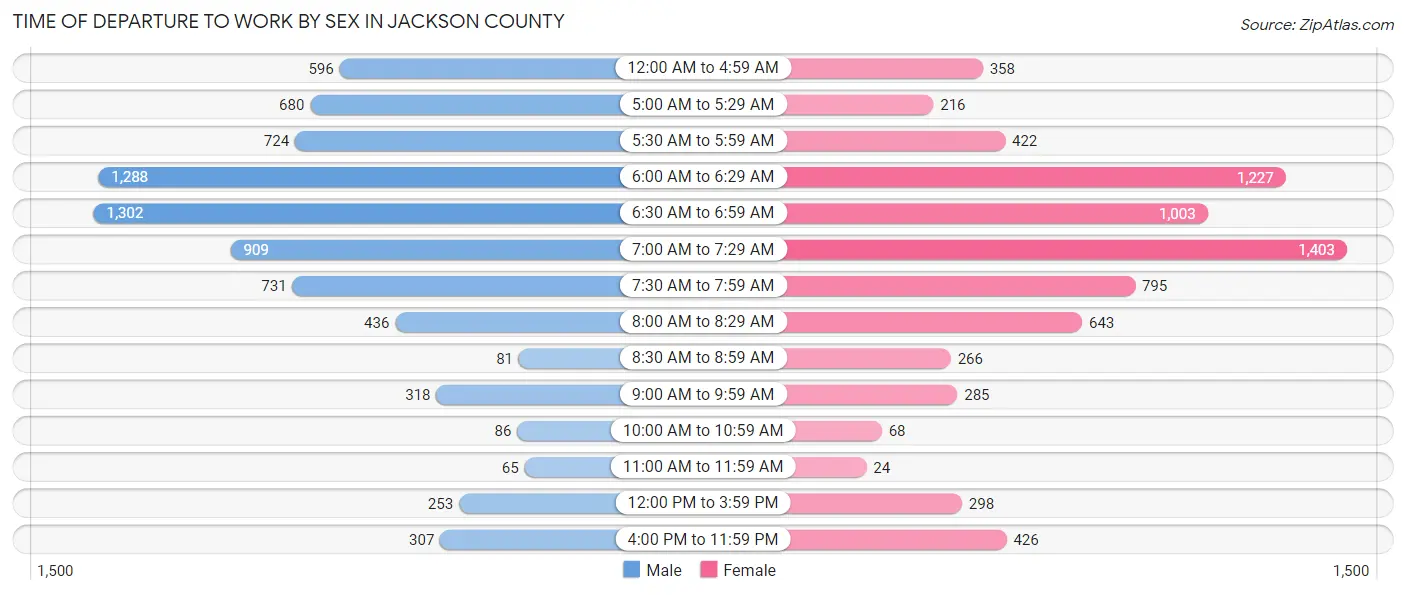
Time of Departure to Work by Sex in Jackson County
The most frequent times of departure to work in Jackson County are 6:30 AM to 6:59 AM (1,302, 16.7%) for males and 7:00 AM to 7:29 AM (1,403, 18.9%) for females.
| Time of Departure | Male | Female |
| 12:00 AM to 4:59 AM | 596 (7.7%) | 358 (4.8%) |
| 5:00 AM to 5:29 AM | 680 (8.7%) | 216 (2.9%) |
| 5:30 AM to 5:59 AM | 724 (9.3%) | 422 (5.7%) |
| 6:00 AM to 6:29 AM | 1,288 (16.6%) | 1,227 (16.5%) |
| 6:30 AM to 6:59 AM | 1,302 (16.7%) | 1,003 (13.5%) |
| 7:00 AM to 7:29 AM | 909 (11.7%) | 1,403 (18.9%) |
| 7:30 AM to 7:59 AM | 731 (9.4%) | 795 (10.7%) |
| 8:00 AM to 8:29 AM | 436 (5.6%) | 643 (8.6%) |
| 8:30 AM to 8:59 AM | 81 (1.0%) | 266 (3.6%) |
| 9:00 AM to 9:59 AM | 318 (4.1%) | 285 (3.8%) |
| 10:00 AM to 10:59 AM | 86 (1.1%) | 68 (0.9%) |
| 11:00 AM to 11:59 AM | 65 (0.8%) | 24 (0.3%) |
| 12:00 PM to 3:59 PM | 253 (3.3%) | 298 (4.0%) |
| 4:00 PM to 11:59 PM | 307 (4.0%) | 426 (5.7%) |
| Total | 7,776 (100.0%) | 7,434 (100.0%) |
Housing Occupancy in Jackson County
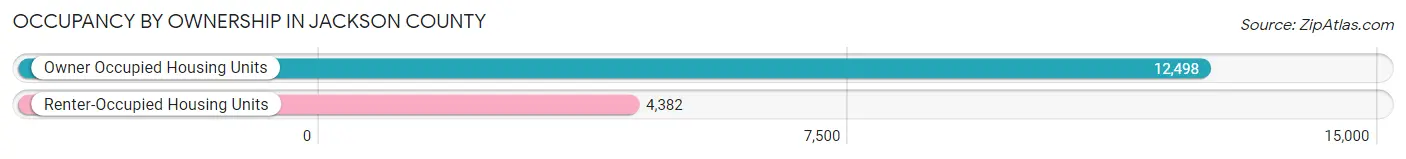
Occupancy by Ownership in Jackson County
Of the total 16,880 dwellings in Jackson County, owner-occupied units account for 12,498 (74.0%), while renter-occupied units make up 4,382 (26.0%).
| Occupancy | # Housing Units | % Housing Units |
| Owner Occupied Housing Units | 12,498 | 74.0% |
| Renter-Occupied Housing Units | 4,382 | 26.0% |
| Total Occupied Housing Units | 16,880 | 100.0% |
Occupancy by Household Size in Jackson County
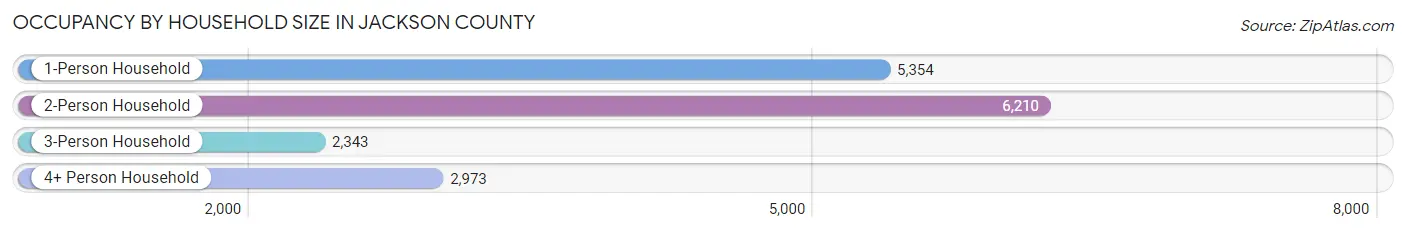
| Household Size | # Housing Units | % Housing Units |
| 1-Person Household | 5,354 | 31.7% |
| 2-Person Household | 6,210 | 36.8% |
| 3-Person Household | 2,343 | 13.9% |
| 4+ Person Household | 2,973 | 17.6% |
| Total Housing Units | 16,880 | 100.0% |
Occupancy by Ownership by Household Size in Jackson County
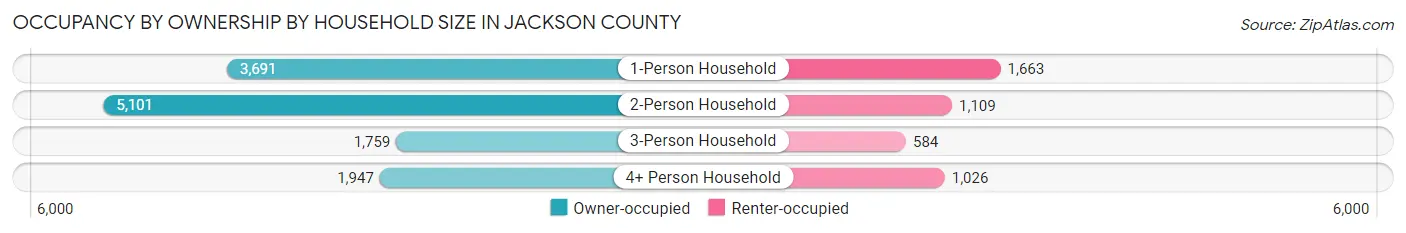
| Household Size | Owner-occupied | Renter-occupied |
| 1-Person Household | 3,691 (68.9%) | 1,663 (31.1%) |
| 2-Person Household | 5,101 (82.1%) | 1,109 (17.9%) |
| 3-Person Household | 1,759 (75.1%) | 584 (24.9%) |
| 4+ Person Household | 1,947 (65.5%) | 1,026 (34.5%) |
| Total Housing Units | 12,498 (74.0%) | 4,382 (26.0%) |
Occupancy by Educational Attainment in Jackson County
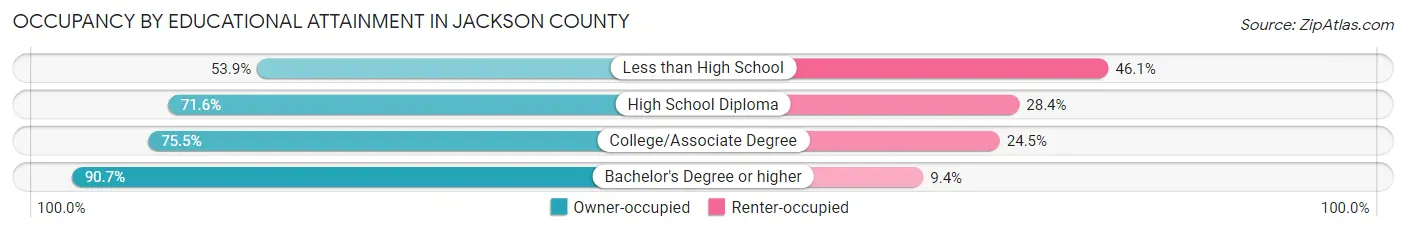
| Household Size | Owner-occupied | Renter-occupied |
| Less than High School | 1,028 (53.9%) | 878 (46.1%) |
| High School Diploma | 4,406 (71.6%) | 1,747 (28.4%) |
| College/Associate Degree | 4,639 (75.5%) | 1,507 (24.5%) |
| Bachelor's Degree or higher | 2,425 (90.6%) | 250 (9.3%) |
Occupancy by Age of Householder in Jackson County
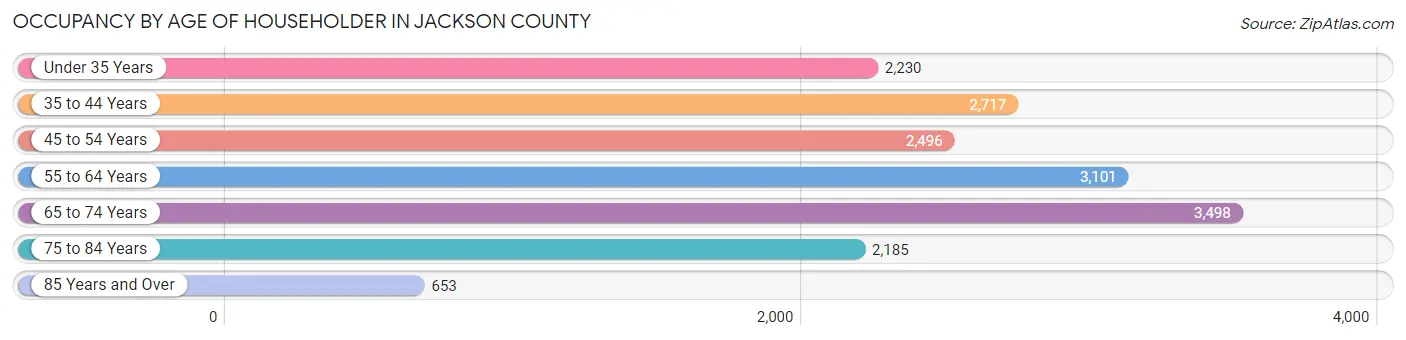
| Age Bracket | # Households | % Households |
| Under 35 Years | 2,230 | 13.2% |
| 35 to 44 Years | 2,717 | 16.1% |
| 45 to 54 Years | 2,496 | 14.8% |
| 55 to 64 Years | 3,101 | 18.4% |
| 65 to 74 Years | 3,498 | 20.7% |
| 75 to 84 Years | 2,185 | 12.9% |
| 85 Years and Over | 653 | 3.9% |
| Total | 16,880 | 100.0% |
Housing Finances in Jackson County
Median Income by Occupancy in Jackson County
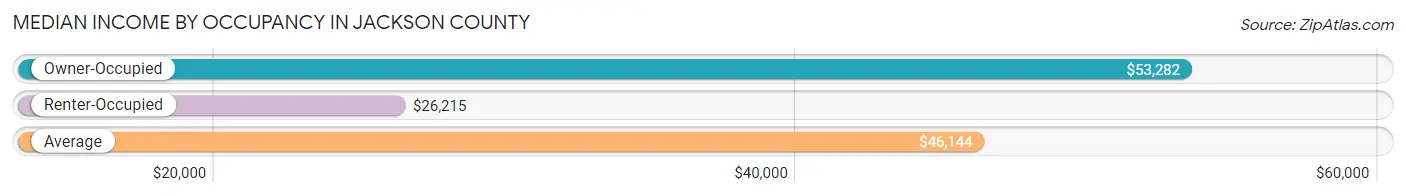
| Occupancy Type | # Households | Median Income |
| Owner-Occupied | 12,498 (74.0%) | $53,282 |
| Renter-Occupied | 4,382 (26.0%) | $26,215 |
| Average | 16,880 (100.0%) | $46,144 |
Occupancy by Householder Income Bracket in Jackson County
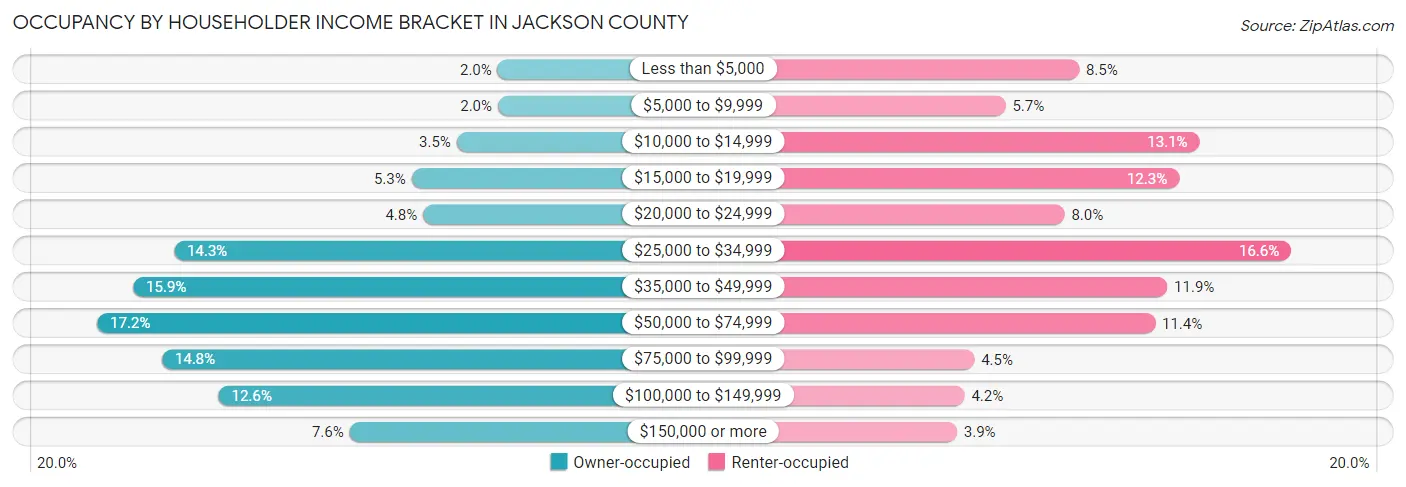
| Income Bracket | Owner-occupied | Renter-occupied |
| Less than $5,000 | 248 (2.0%) | 373 (8.5%) |
| $5,000 to $9,999 | 246 (2.0%) | 250 (5.7%) |
| $10,000 to $14,999 | 443 (3.5%) | 574 (13.1%) |
| $15,000 to $19,999 | 658 (5.3%) | 540 (12.3%) |
| $20,000 to $24,999 | 602 (4.8%) | 349 (8.0%) |
| $25,000 to $34,999 | 1,789 (14.3%) | 727 (16.6%) |
| $35,000 to $49,999 | 1,983 (15.9%) | 520 (11.9%) |
| $50,000 to $74,999 | 2,155 (17.2%) | 500 (11.4%) |
| $75,000 to $99,999 | 1,846 (14.8%) | 198 (4.5%) |
| $100,000 to $149,999 | 1,576 (12.6%) | 182 (4.2%) |
| $150,000 or more | 952 (7.6%) | 169 (3.9%) |
| Total | 12,498 (100.0%) | 4,382 (100.0%) |
Monthly Housing Cost Tiers in Jackson County
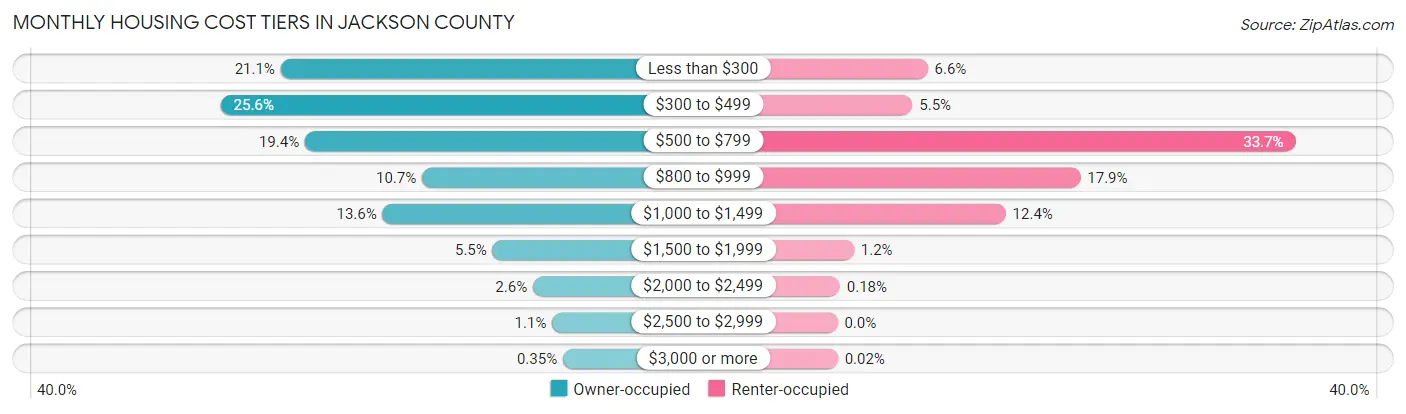
| Monthly Cost | Owner-occupied | Renter-occupied |
| Less than $300 | 2,642 (21.1%) | 291 (6.6%) |
| $300 to $499 | 3,195 (25.6%) | 242 (5.5%) |
| $500 to $799 | 2,418 (19.4%) | 1,478 (33.7%) |
| $800 to $999 | 1,341 (10.7%) | 784 (17.9%) |
| $1,000 to $1,499 | 1,705 (13.6%) | 543 (12.4%) |
| $1,500 to $1,999 | 691 (5.5%) | 53 (1.2%) |
| $2,000 to $2,499 | 320 (2.6%) | 8 (0.2%) |
| $2,500 to $2,999 | 142 (1.1%) | 0 (0.0%) |
| $3,000 or more | 44 (0.4%) | 1 (0.0%) |
| Total | 12,498 (100.0%) | 4,382 (100.0%) |
Physical Housing Characteristics in Jackson County
Housing Structures in Jackson County
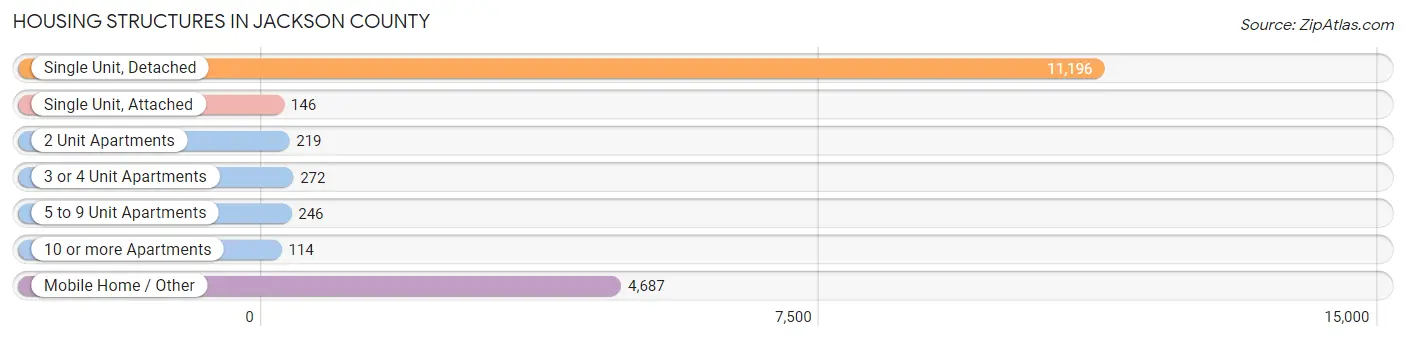
| Structure Type | # Housing Units | % Housing Units |
| Single Unit, Detached | 11,196 | 66.3% |
| Single Unit, Attached | 146 | 0.9% |
| 2 Unit Apartments | 219 | 1.3% |
| 3 or 4 Unit Apartments | 272 | 1.6% |
| 5 to 9 Unit Apartments | 246 | 1.5% |
| 10 or more Apartments | 114 | 0.7% |
| Mobile Home / Other | 4,687 | 27.8% |
| Total | 16,880 | 100.0% |
Housing Structures by Occupancy in Jackson County
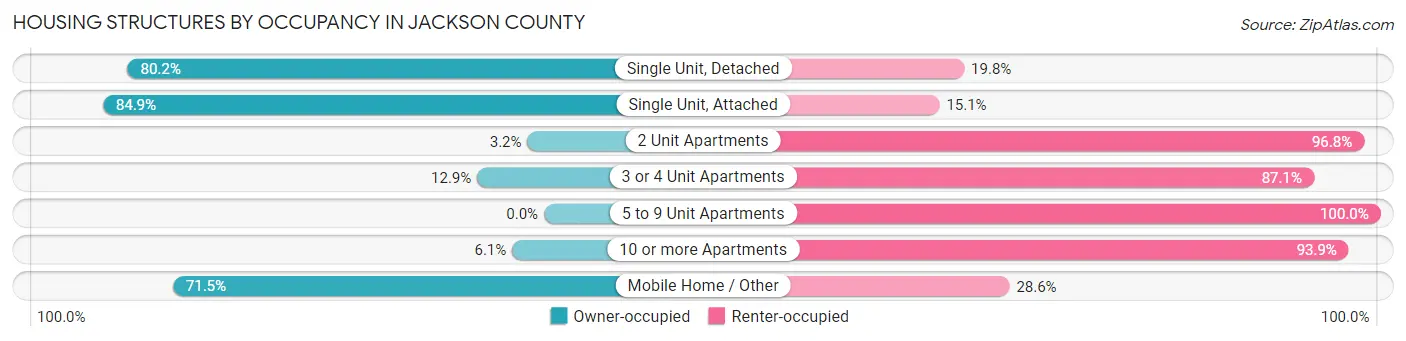
| Structure Type | Owner-occupied | Renter-occupied |
| Single Unit, Detached | 8,976 (80.2%) | 2,220 (19.8%) |
| Single Unit, Attached | 124 (84.9%) | 22 (15.1%) |
| 2 Unit Apartments | 7 (3.2%) | 212 (96.8%) |
| 3 or 4 Unit Apartments | 35 (12.9%) | 237 (87.1%) |
| 5 to 9 Unit Apartments | 0 (0.0%) | 246 (100.0%) |
| 10 or more Apartments | 7 (6.1%) | 107 (93.9%) |
| Mobile Home / Other | 3,349 (71.5%) | 1,338 (28.5%) |
| Total | 12,498 (74.0%) | 4,382 (26.0%) |
Housing Structures by Number of Rooms in Jackson County
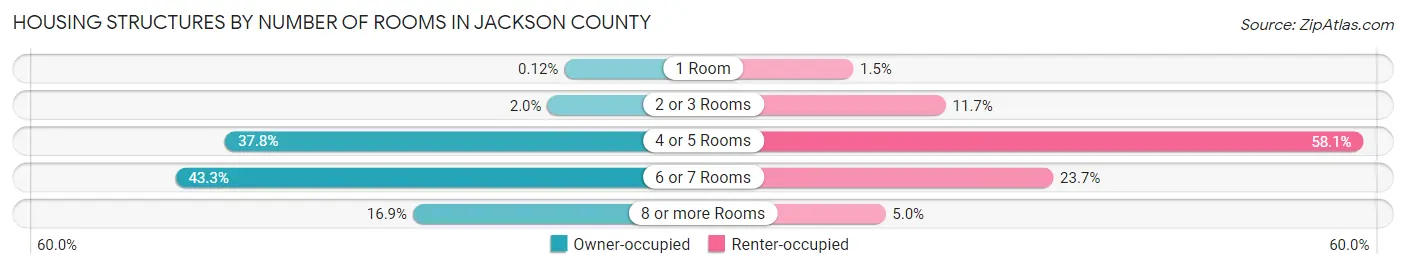
| Number of Rooms | Owner-occupied | Renter-occupied |
| 1 Room | 15 (0.1%) | 64 (1.5%) |
| 2 or 3 Rooms | 247 (2.0%) | 514 (11.7%) |
| 4 or 5 Rooms | 4,718 (37.8%) | 2,546 (58.1%) |
| 6 or 7 Rooms | 5,405 (43.2%) | 1,037 (23.7%) |
| 8 or more Rooms | 2,113 (16.9%) | 221 (5.0%) |
| Total | 12,498 (100.0%) | 4,382 (100.0%) |
Housing Structure by Heating Type in Jackson County
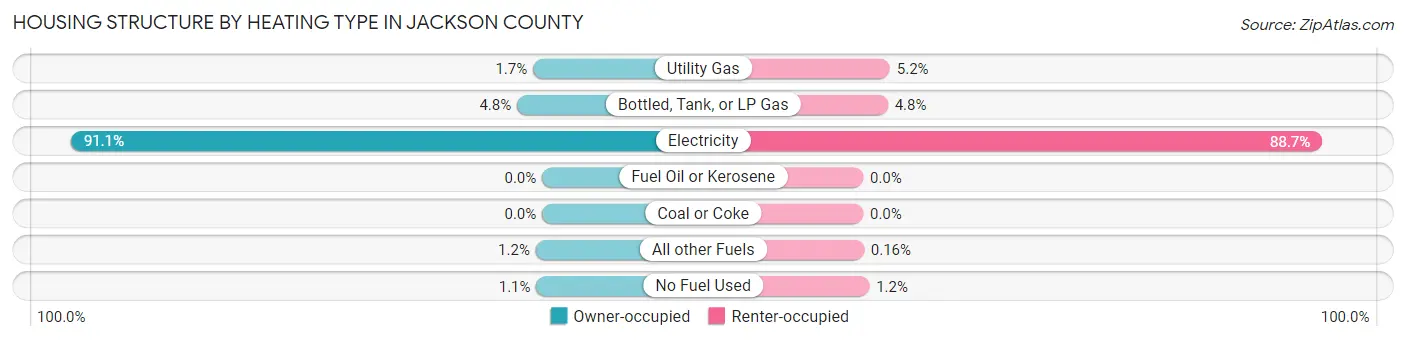
| Heating Type | Owner-occupied | Renter-occupied |
| Utility Gas | 218 (1.7%) | 227 (5.2%) |
| Bottled, Tank, or LP Gas | 605 (4.8%) | 209 (4.8%) |
| Electricity | 11,382 (91.1%) | 3,887 (88.7%) |
| Fuel Oil or Kerosene | 0 (0.0%) | 0 (0.0%) |
| Coal or Coke | 0 (0.0%) | 0 (0.0%) |
| All other Fuels | 154 (1.2%) | 7 (0.2%) |
| No Fuel Used | 139 (1.1%) | 52 (1.2%) |
| Total | 12,498 (100.0%) | 4,382 (100.0%) |
Household Vehicle Usage in Jackson County
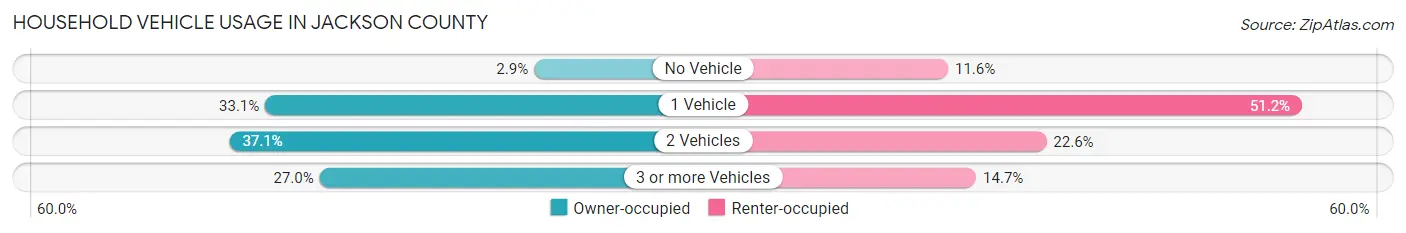
| Vehicles per Household | Owner-occupied | Renter-occupied |
| No Vehicle | 367 (2.9%) | 506 (11.6%) |
| 1 Vehicle | 4,132 (33.1%) | 2,243 (51.2%) |
| 2 Vehicles | 4,630 (37.0%) | 989 (22.6%) |
| 3 or more Vehicles | 3,369 (27.0%) | 644 (14.7%) |
| Total | 12,498 (100.0%) | 4,382 (100.0%) |
Real Estate & Mortgages in Jackson County
Real Estate and Mortgage Overview in Jackson County
| Characteristic | Without Mortgage | With Mortgage |
| Housing Units | 7,454 | 5,044 |
| Median Property Value | $102,700 | $135,000 |
| Median Household Income | $47,508 | $555 |
| Monthly Housing Costs | $361 | $44 |
| Real Estate Taxes | $546 | $359 |
Property Value by Mortgage Status in Jackson County
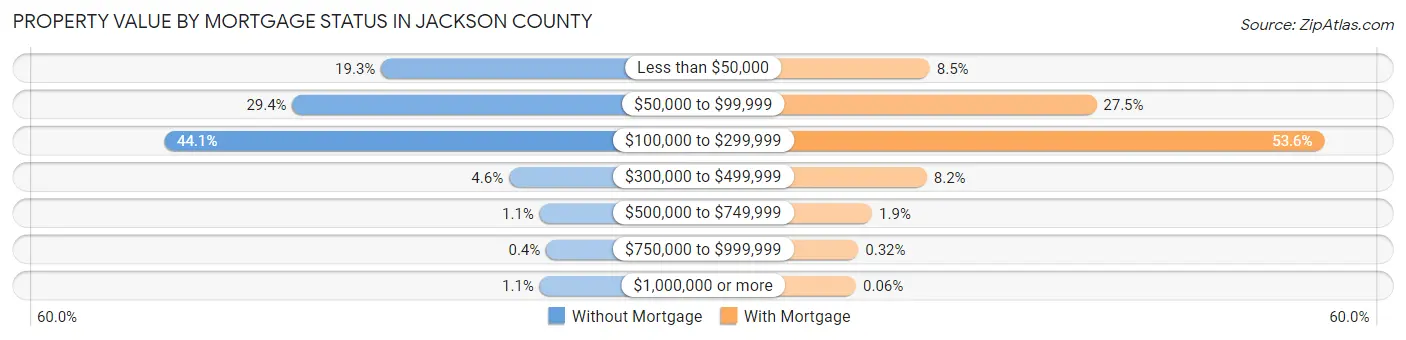
| Property Value | Without Mortgage | With Mortgage |
| Less than $50,000 | 1,435 (19.3%) | 428 (8.5%) |
| $50,000 to $99,999 | 2,191 (29.4%) | 1,388 (27.5%) |
| $100,000 to $299,999 | 3,284 (44.1%) | 2,702 (53.6%) |
| $300,000 to $499,999 | 346 (4.6%) | 411 (8.2%) |
| $500,000 to $749,999 | 84 (1.1%) | 96 (1.9%) |
| $750,000 to $999,999 | 30 (0.4%) | 16 (0.3%) |
| $1,000,000 or more | 84 (1.1%) | 3 (0.1%) |
| Total | 7,454 (100.0%) | 5,044 (100.0%) |
Household Income by Mortgage Status in Jackson County
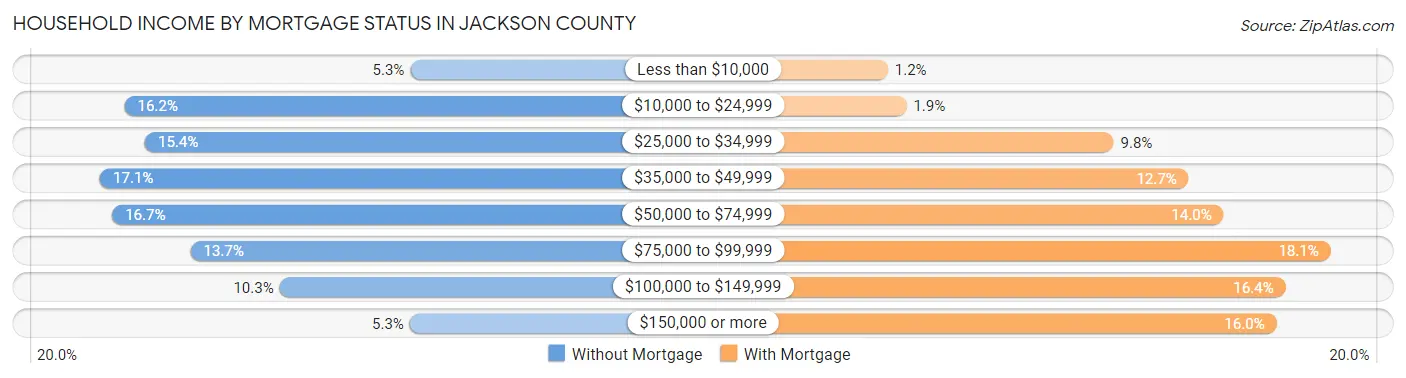
| Household Income | Without Mortgage | With Mortgage |
| Less than $10,000 | 396 (5.3%) | 62 (1.2%) |
| $10,000 to $24,999 | 1,207 (16.2%) | 98 (1.9%) |
| $25,000 to $34,999 | 1,149 (15.4%) | 496 (9.8%) |
| $35,000 to $49,999 | 1,276 (17.1%) | 640 (12.7%) |
| $50,000 to $74,999 | 1,242 (16.7%) | 707 (14.0%) |
| $75,000 to $99,999 | 1,020 (13.7%) | 913 (18.1%) |
| $100,000 to $149,999 | 767 (10.3%) | 826 (16.4%) |
| $150,000 or more | 397 (5.3%) | 809 (16.0%) |
| Total | 7,454 (100.0%) | 5,044 (100.0%) |
Property Value to Household Income Ratio in Jackson County
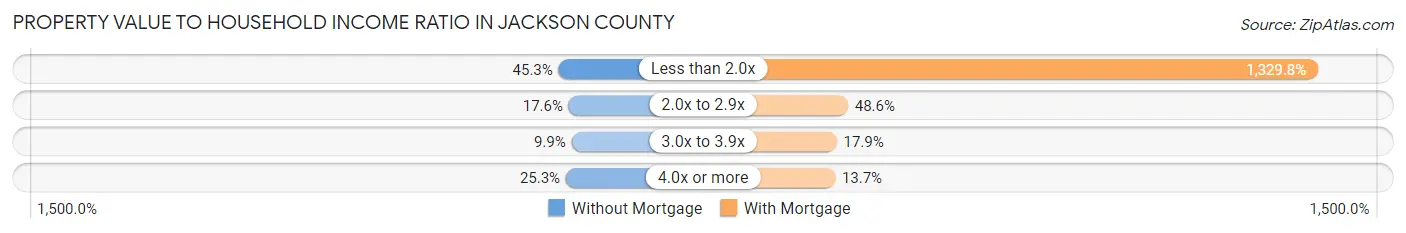
| Value-to-Income Ratio | Without Mortgage | With Mortgage |
| Less than 2.0x | 3,379 (45.3%) | 67,075 (1,329.8%) |
| 2.0x to 2.9x | 1,311 (17.6%) | 2,451 (48.6%) |
| 3.0x to 3.9x | 741 (9.9%) | 905 (17.9%) |
| 4.0x or more | 1,884 (25.3%) | 689 (13.7%) |
| Total | 7,454 (100.0%) | 5,044 (100.0%) |
Real Estate Taxes by Mortgage Status in Jackson County
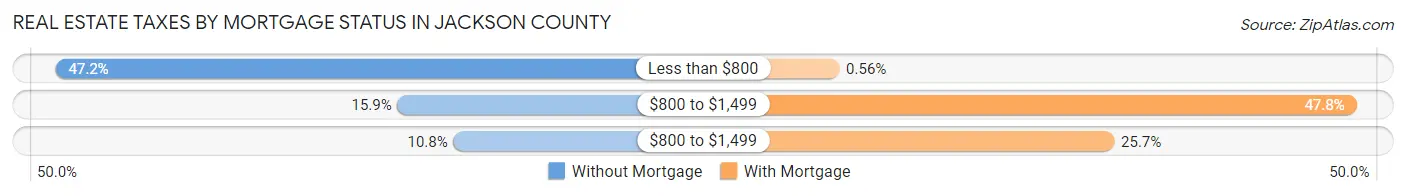
| Property Taxes | Without Mortgage | With Mortgage |
| Less than $800 | 3,517 (47.2%) | 28 (0.6%) |
| $800 to $1,499 | 1,188 (15.9%) | 2,412 (47.8%) |
| $800 to $1,499 | 807 (10.8%) | 1,295 (25.7%) |
| Total | 7,454 (100.0%) | 5,044 (100.0%) |
Health & Disability in Jackson County
Health Insurance Coverage by Age in Jackson County
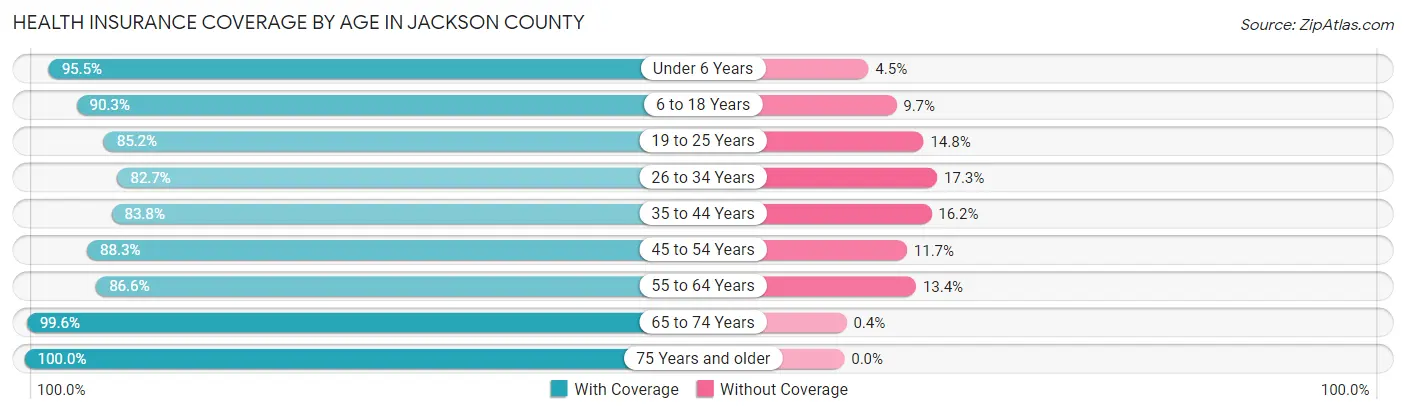
| Age Bracket | With Coverage | Without Coverage |
| Under 6 Years | 2,887 (95.5%) | 136 (4.5%) |
| 6 to 18 Years | 5,938 (90.3%) | 637 (9.7%) |
| 19 to 25 Years | 2,741 (85.2%) | 475 (14.8%) |
| 26 to 34 Years | 3,038 (82.7%) | 636 (17.3%) |
| 35 to 44 Years | 4,371 (83.8%) | 846 (16.2%) |
| 45 to 54 Years | 4,210 (88.3%) | 556 (11.7%) |
| 55 to 64 Years | 4,735 (86.6%) | 730 (13.4%) |
| 65 to 74 Years | 5,277 (99.6%) | 21 (0.4%) |
| 75 Years and older | 3,989 (100.0%) | 0 (0.0%) |
| Total | 37,186 (90.2%) | 4,037 (9.8%) |
Health Insurance Coverage by Citizenship Status in Jackson County
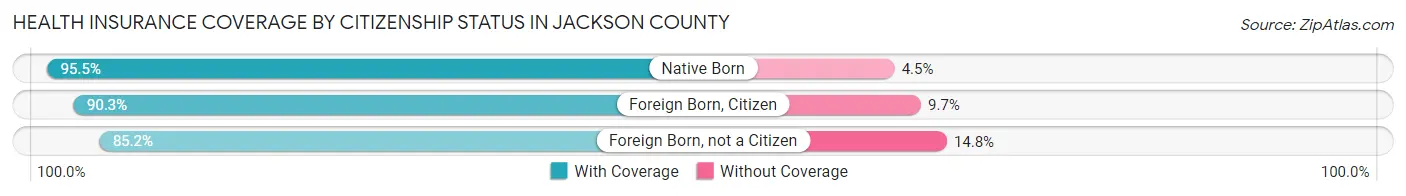
| Citizenship Status | With Coverage | Without Coverage |
| Native Born | 2,887 (95.5%) | 136 (4.5%) |
| Foreign Born, Citizen | 5,938 (90.3%) | 637 (9.7%) |
| Foreign Born, not a Citizen | 2,741 (85.2%) | 475 (14.8%) |
Health Insurance Coverage by Household Income in Jackson County
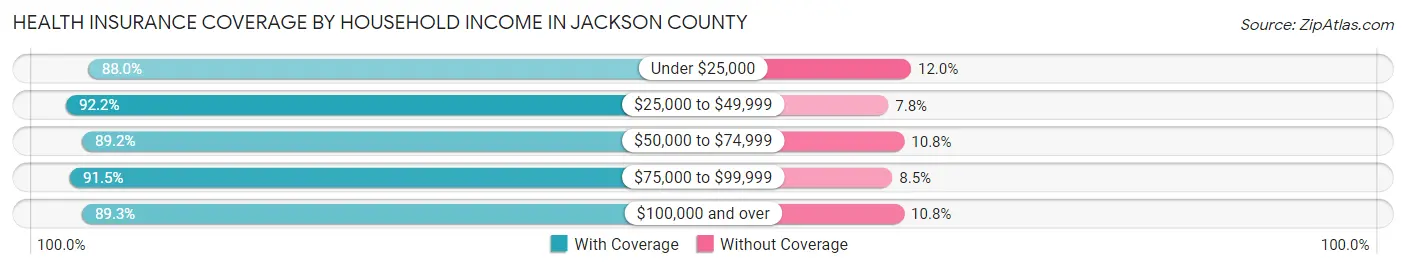
| Household Income | With Coverage | Without Coverage |
| Under $25,000 | 6,508 (88.0%) | 891 (12.0%) |
| $25,000 to $49,999 | 10,177 (92.2%) | 859 (7.8%) |
| $50,000 to $74,999 | 6,161 (89.2%) | 745 (10.8%) |
| $75,000 to $99,999 | 5,410 (91.5%) | 505 (8.5%) |
| $100,000 and over | 8,290 (89.2%) | 998 (10.7%) |
Public vs Private Health Insurance Coverage by Age in Jackson County
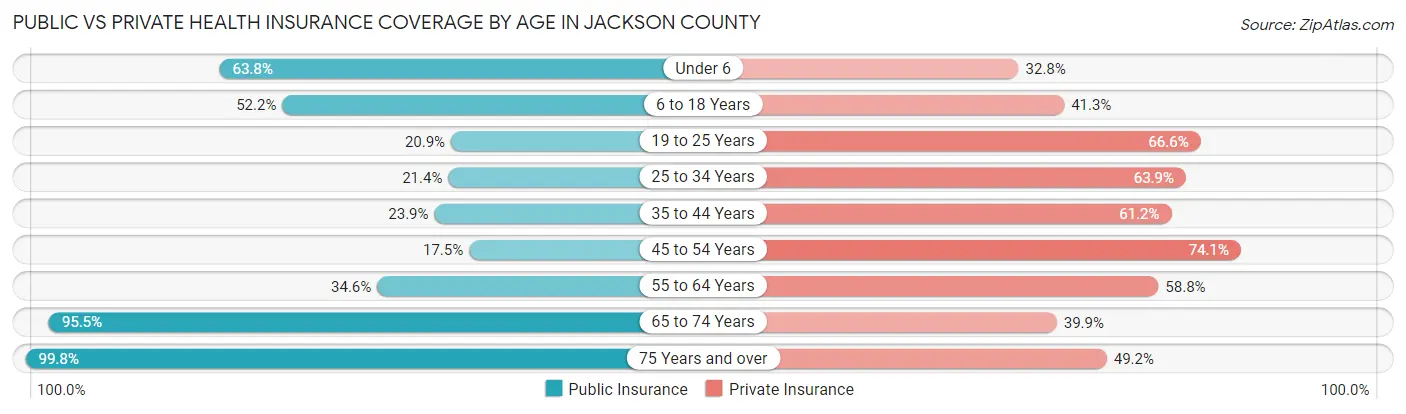
| Age Bracket | Public Insurance | Private Insurance |
| Under 6 | 1,929 (63.8%) | 992 (32.8%) |
| 6 to 18 Years | 3,431 (52.2%) | 2,714 (41.3%) |
| 19 to 25 Years | 671 (20.9%) | 2,141 (66.6%) |
| 25 to 34 Years | 785 (21.4%) | 2,346 (63.8%) |
| 35 to 44 Years | 1,249 (23.9%) | 3,190 (61.2%) |
| 45 to 54 Years | 834 (17.5%) | 3,529 (74.1%) |
| 55 to 64 Years | 1,889 (34.6%) | 3,212 (58.8%) |
| 65 to 74 Years | 5,059 (95.5%) | 2,114 (39.9%) |
| 75 Years and over | 3,982 (99.8%) | 1,962 (49.2%) |
| Total | 19,829 (48.1%) | 22,200 (53.8%) |
Disability Status by Sex by Age in Jackson County
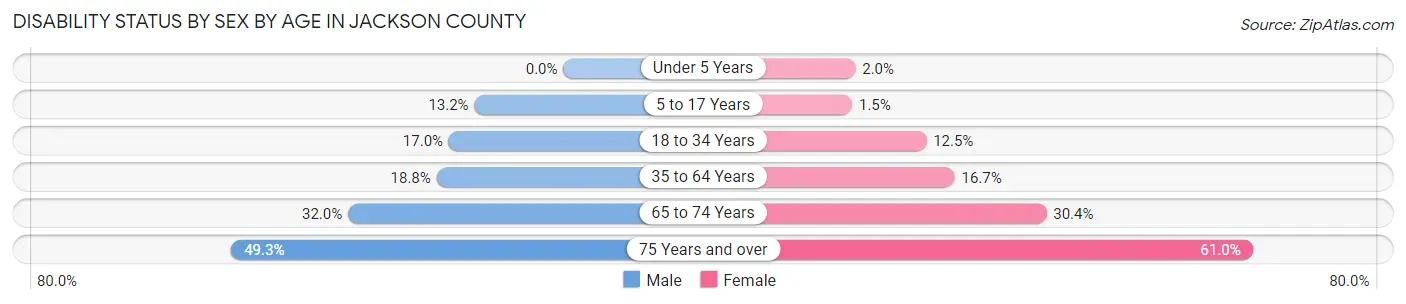
| Age Bracket | Male | Female |
| Under 5 Years | 0 (0.0%) | 23 (2.0%) |
| 5 to 17 Years | 448 (13.2%) | 46 (1.5%) |
| 18 to 34 Years | 661 (17.0%) | 468 (12.5%) |
| 35 to 64 Years | 1,358 (18.8%) | 1,378 (16.7%) |
| 65 to 74 Years | 782 (32.0%) | 866 (30.4%) |
| 75 Years and over | 786 (49.3%) | 1,461 (61.0%) |
Disability Class by Sex by Age in Jackson County
Disability Class: Hearing Difficulty
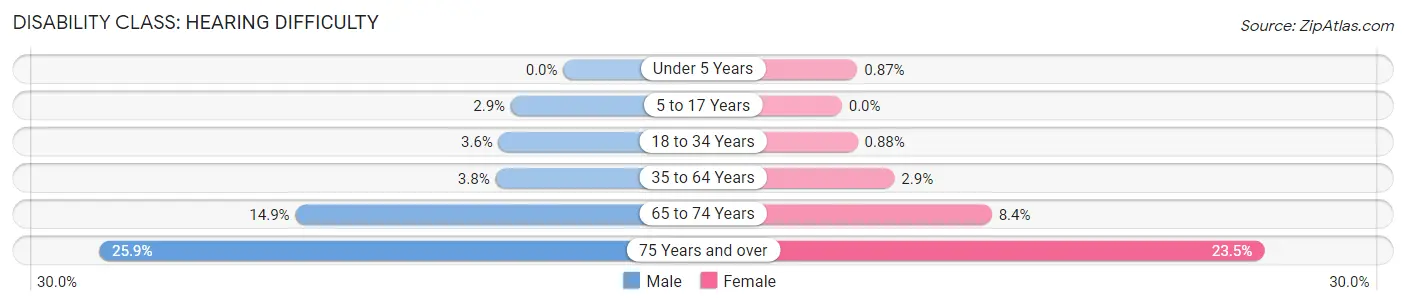
| Age Bracket | Male | Female |
| Under 5 Years | 0 (0.0%) | 10 (0.9%) |
| 5 to 17 Years | 99 (2.9%) | 0 (0.0%) |
| 18 to 34 Years | 140 (3.6%) | 33 (0.9%) |
| 35 to 64 Years | 273 (3.8%) | 241 (2.9%) |
| 65 to 74 Years | 365 (14.9%) | 238 (8.4%) |
| 75 Years and over | 412 (25.9%) | 563 (23.5%) |
Disability Class: Vision Difficulty
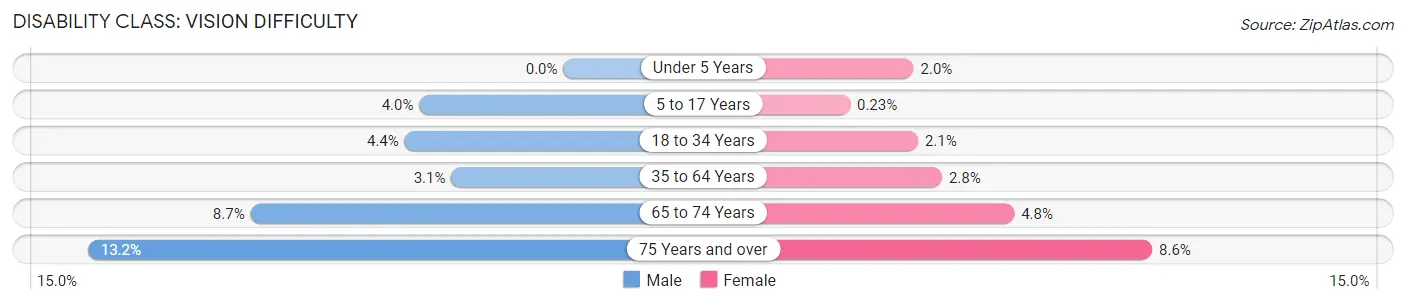
| Age Bracket | Male | Female |
| Under 5 Years | 0 (0.0%) | 23 (2.0%) |
| 5 to 17 Years | 136 (4.0%) | 7 (0.2%) |
| 18 to 34 Years | 172 (4.4%) | 79 (2.1%) |
| 35 to 64 Years | 225 (3.1%) | 230 (2.8%) |
| 65 to 74 Years | 213 (8.7%) | 137 (4.8%) |
| 75 Years and over | 211 (13.2%) | 207 (8.6%) |
Disability Class: Cognitive Difficulty
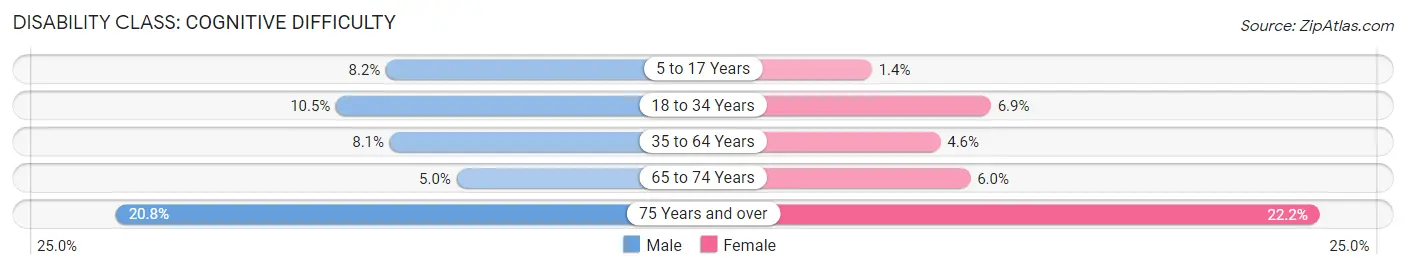
| Age Bracket | Male | Female |
| 5 to 17 Years | 279 (8.2%) | 42 (1.4%) |
| 18 to 34 Years | 410 (10.5%) | 258 (6.9%) |
| 35 to 64 Years | 581 (8.1%) | 376 (4.6%) |
| 65 to 74 Years | 121 (5.0%) | 170 (6.0%) |
| 75 Years and over | 331 (20.8%) | 531 (22.2%) |
Disability Class: Ambulatory Difficulty
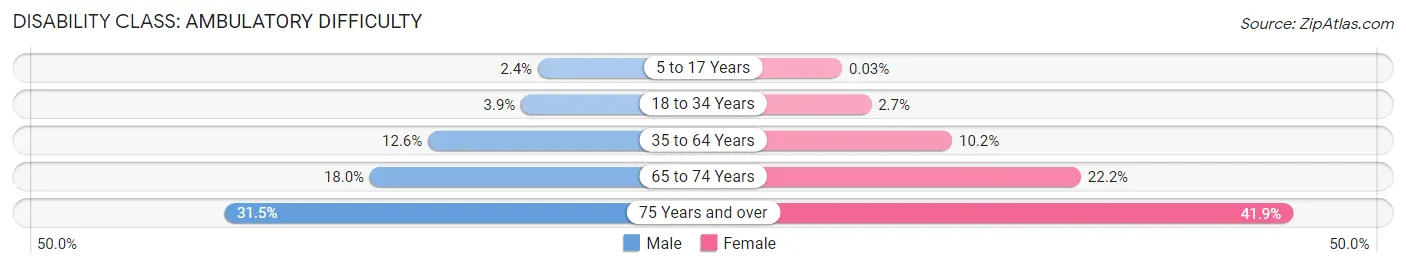
| Age Bracket | Male | Female |
| 5 to 17 Years | 80 (2.4%) | 1 (0.0%) |
| 18 to 34 Years | 152 (3.9%) | 102 (2.7%) |
| 35 to 64 Years | 906 (12.6%) | 842 (10.2%) |
| 65 to 74 Years | 439 (17.9%) | 633 (22.2%) |
| 75 Years and over | 502 (31.5%) | 1,003 (41.9%) |
Disability Class: Self-Care Difficulty
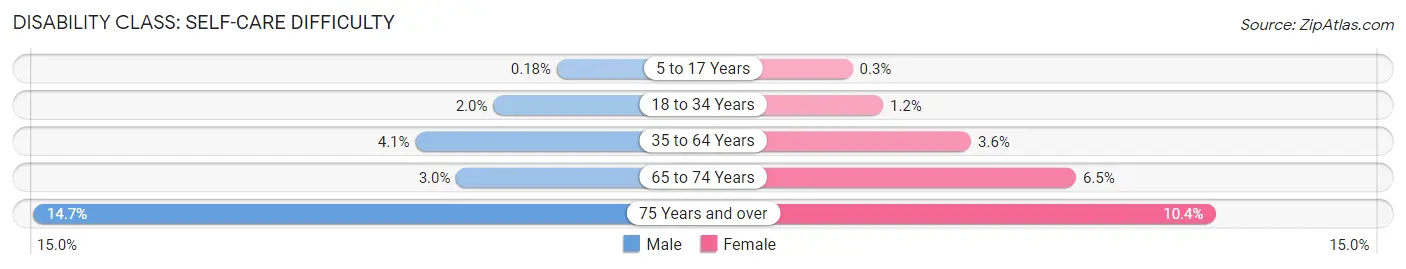
| Age Bracket | Male | Female |
| 5 to 17 Years | 6 (0.2%) | 9 (0.3%) |
| 18 to 34 Years | 76 (1.9%) | 43 (1.1%) |
| 35 to 64 Years | 297 (4.1%) | 296 (3.6%) |
| 65 to 74 Years | 73 (3.0%) | 186 (6.5%) |
| 75 Years and over | 235 (14.7%) | 249 (10.4%) |
Technology Access in Jackson County
Computing Device Access in Jackson County
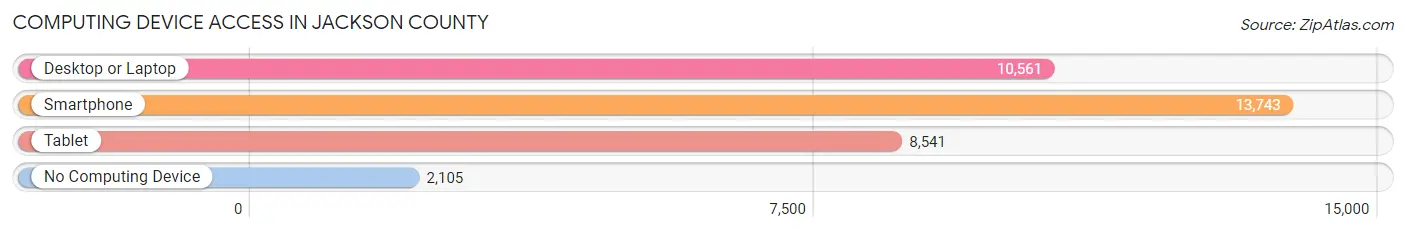
| Device Type | # Households | % Households |
| Desktop or Laptop | 10,561 | 62.6% |
| Smartphone | 13,743 | 81.4% |
| Tablet | 8,541 | 50.6% |
| No Computing Device | 2,105 | 12.5% |
| Total | 16,880 | 100.0% |
Internet Access in Jackson County
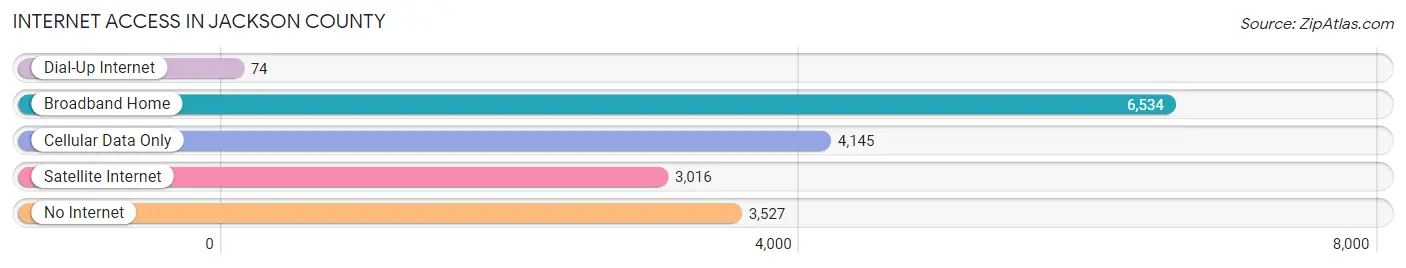
| Internet Type | # Households | % Households |
| Dial-Up Internet | 74 | 0.4% |
| Broadband Home | 6,534 | 38.7% |
| Cellular Data Only | 4,145 | 24.6% |
| Satellite Internet | 3,016 | 17.9% |
| No Internet | 3,527 | 20.9% |
| Total | 16,880 | 100.0% |
Jackson County Summary
Jackson County is located in the Florida Panhandle, in the northwest corner of the state. It is bordered by Washington County to the north, Holmes County to the east, Calhoun County to the south, and Gulf County to the west. The county seat is Marianna, and the largest city is Graceville. The county was created in 1822 and named for Andrew Jackson, the seventh president of the United States.
Geography
Jackson County covers an area of 868 square miles, making it the fourth-largest county in Florida. The terrain is mostly flat, with some rolling hills in the northern part of the county. The highest point in the county is a hill in the northwest corner, at an elevation of 200 feet. The county is drained by the Chipola River, which flows through the center of the county from north to south. The county is also home to several lakes, including Lake Seminole, Lake Iamonia, and Lake Talquin.
The climate of Jackson County is humid subtropical, with hot, humid summers and mild winters. The average annual temperature is 68°F, and the average annual precipitation is 54 inches.
Economy
Agriculture is the main economic activity in Jackson County. The county is a major producer of peanuts, cotton, corn, and soybeans. Other crops grown in the county include hay, wheat, and vegetables. Livestock production is also important, with cattle, hogs, and poultry being the main animals raised.
The county is also home to several manufacturing companies, including a paper mill, a wood products plant, and a plastics factory. Tourism is also an important part of the economy, with visitors coming to the county to enjoy its natural beauty and outdoor activities.
Demographics
As of the 2010 census, Jackson County had a population of 49,746. The racial makeup of the county was 75.3% White, 19.2% African American, 0.5% Native American, 0.7% Asian, 0.1% Pacific Islander, 2.7% from other races, and 1.5% from two or more races. Hispanic or Latino of any race were 5.3% of the population.
The median household income in the county was $37,845, and the median family income was $45,890. The per capita income was $19,845. About 17.3% of the population was below the poverty line.
Education
Jackson County is served by the Jackson County School District, which operates 16 elementary schools, five middle schools, and four high schools. The county is also home to Chipola College, a two-year public college.
Conclusion
Jackson County is a rural county in the Florida Panhandle, with a population of just under 50,000. The economy is largely based on agriculture, with peanuts, cotton, corn, and soybeans being the main crops. Manufacturing and tourism are also important to the economy. The county is served by the Jackson County School District, and is home to Chipola College.
Common Questions
What is Per Capita Income in Jackson County?
Per Capita income in Jackson County is $23,210.
What is the Median Family Income in Jackson County?
Median Family Income in Jackson County is $58,273.
What is the Median Household income in Jackson County?
Median Household Income in Jackson County is $46,144.
What is Income or Wage Gap in Jackson County?
Income or Wage Gap in Jackson County is 14.9%.
Women in Jackson County earn 85.1 cents for every dollar earned by a man.
What is Family Income Deficit in Jackson County?
Family Income Deficit in Jackson County is $10,246.
Families that are below poverty line in Jackson County earn $10,246 less on average than the poverty threshold level.
What is Inequality or Gini Index in Jackson County?
Inequality or Gini Index in Jackson County is 0.46.
What is the Total Population of Jackson County?
Total Population of Jackson County is 47,704.
What is the Total Male Population of Jackson County?
Total Male Population of Jackson County is 25,869.
What is the Total Female Population of Jackson County?
Total Female Population of Jackson County is 21,835.
What is the Ratio of Males per 100 Females in Jackson County?
There are 118.47 Males per 100 Females in Jackson County.
What is the Ratio of Females per 100 Males in Jackson County?
There are 84.41 Females per 100 Males in Jackson County.
What is the Median Population Age in Jackson County?
Median Population Age in Jackson County is 42.9 Years.
What is the Average Family Size in Jackson County
Average Family Size in Jackson County is 3.0 People.
What is the Average Household Size in Jackson County
Average Household Size in Jackson County is 2.4 People.
How Large is the Labor Force in Jackson County?
There are 16,995 People in the Labor Forcein in Jackson County.
What is the Percentage of People in the Labor Force in Jackson County?
42.5% of People are in the Labor Force in Jackson County.
What is the Unemployment Rate in Jackson County?
Unemployment Rate in Jackson County is 4.7%.