Holmes County, FL Map & Demographics
Holmes County Map
Holmes County Overview
$22,860
PER CAPITA INCOME
$55,802
AVG FAMILY INCOME
$46,063
AVG HOUSEHOLD INCOME
13.3%
WAGE / INCOME GAP [ % ]
86.7¢/ $1
WAGE / INCOME GAP [ $ ]
$9,229
FAMILY INCOME DEFICIT
0.43
INEQUALITY / GINI INDEX
19,529
TOTAL POPULATION
10,451
MALE POPULATION
9,078
FEMALE POPULATION
115.12
MALES / 100 FEMALES
86.86
FEMALES / 100 MALES
41.0
MEDIAN AGE
3.1
AVG FAMILY SIZE
2.5
AVG HOUSEHOLD SIZE
7,940
LABOR FORCE [ PEOPLE ]
49.3%
PERCENT IN LABOR FORCE
4.7%
UNEMPLOYMENT RATE
Holmes County Area Codes
Income in Holmes County
Income Overview in Holmes County
Per Capita Income in Holmes County is $22,860, while median incomes of families and households are $55,802 and $46,063 respectively.
| Characteristic | Number | Measure |
| Per Capita Income | 19,529 | $22,860 |
| Median Family Income | 4,636 | $55,802 |
| Mean Family Income | 4,636 | $70,695 |
| Median Household Income | 7,069 | $46,063 |
| Mean Household Income | 7,069 | $58,649 |
| Income Deficit | 4,636 | $9,229 |
| Wage / Income Gap (%) | 19,529 | 13.31% |
| Wage / Income Gap ($) | 19,529 | 86.69¢ per $1 |
| Gini / Inequality Index | 19,529 | 0.43 |
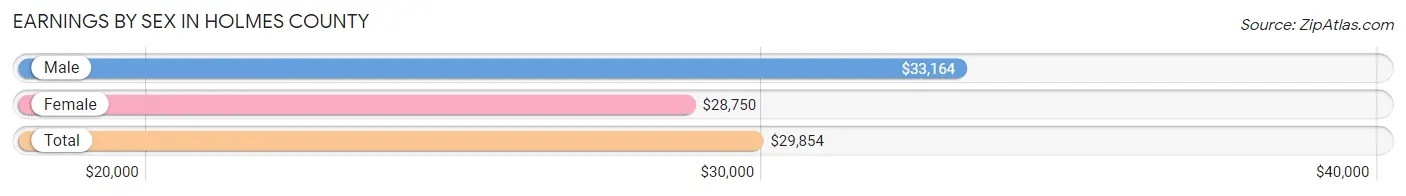
Earnings by Sex in Holmes County
Average Earnings in Holmes County are $29,854, $33,164 for men and $28,750 for women, a difference of 13.3%.
| Sex | Number | Average Earnings |
| Male | 4,466 (54.1%) | $33,164 |
| Female | 3,784 (45.9%) | $28,750 |
| Total | 8,250 (100.0%) | $29,854 |
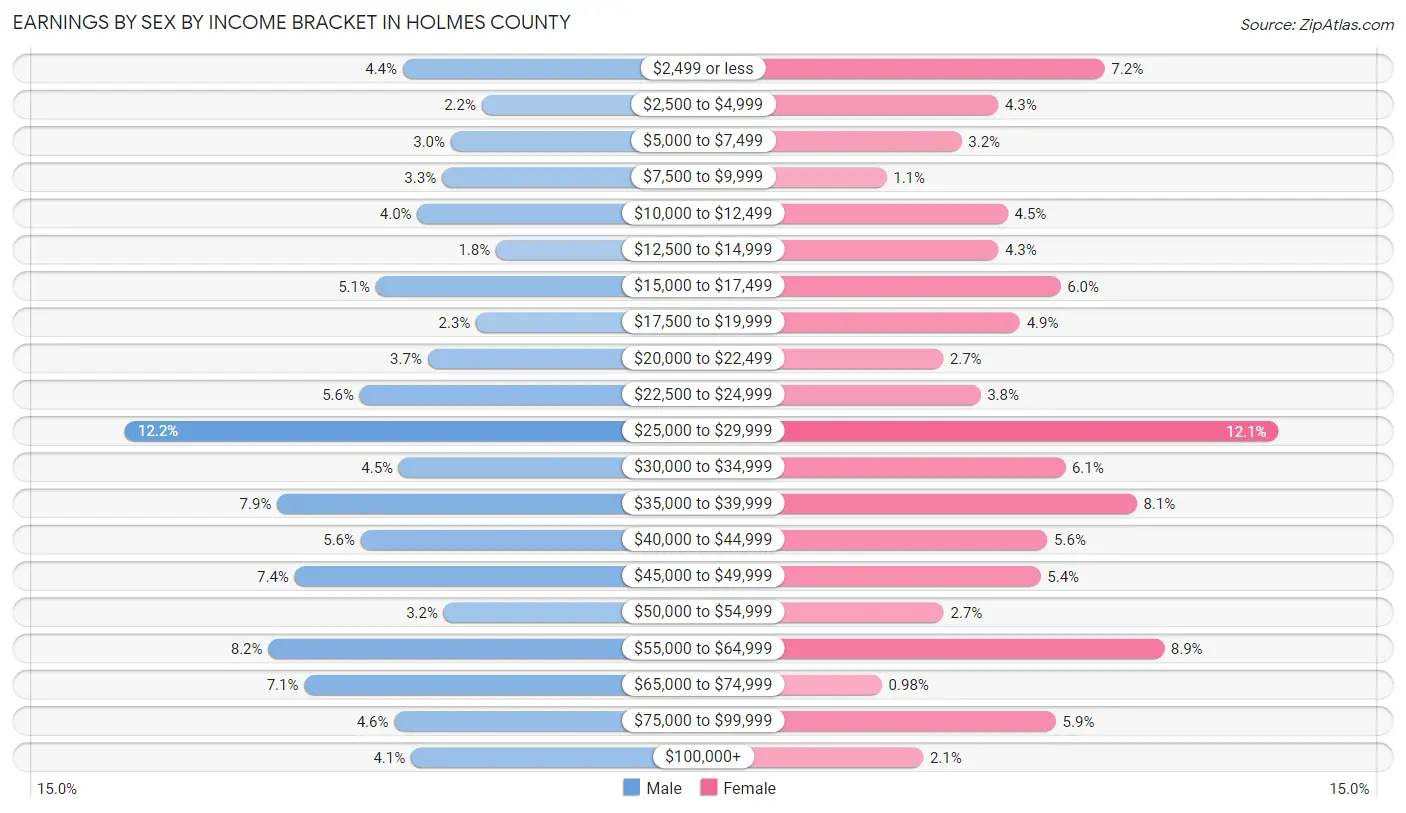
Earnings by Sex by Income Bracket in Holmes County
The most common earnings brackets in Holmes County are $25,000 to $29,999 for men (544 | 12.2%) and $25,000 to $29,999 for women (459 | 12.1%).
| Income | Male | Female |
| $2,499 or less | 195 (4.4%) | 274 (7.2%) |
| $2,500 to $4,999 | 96 (2.1%) | 161 (4.3%) |
| $5,000 to $7,499 | 135 (3.0%) | 122 (3.2%) |
| $7,500 to $9,999 | 146 (3.3%) | 42 (1.1%) |
| $10,000 to $12,499 | 177 (4.0%) | 171 (4.5%) |
| $12,500 to $14,999 | 78 (1.8%) | 161 (4.3%) |
| $15,000 to $17,499 | 229 (5.1%) | 227 (6.0%) |
| $17,500 to $19,999 | 103 (2.3%) | 184 (4.9%) |
| $20,000 to $22,499 | 164 (3.7%) | 102 (2.7%) |
| $22,500 to $24,999 | 249 (5.6%) | 142 (3.7%) |
| $25,000 to $29,999 | 544 (12.2%) | 459 (12.1%) |
| $30,000 to $34,999 | 200 (4.5%) | 232 (6.1%) |
| $35,000 to $39,999 | 353 (7.9%) | 308 (8.1%) |
| $40,000 to $44,999 | 248 (5.6%) | 213 (5.6%) |
| $45,000 to $49,999 | 331 (7.4%) | 206 (5.4%) |
| $50,000 to $54,999 | 144 (3.2%) | 103 (2.7%) |
| $55,000 to $64,999 | 364 (8.2%) | 337 (8.9%) |
| $65,000 to $74,999 | 319 (7.1%) | 37 (1.0%) |
| $75,000 to $99,999 | 206 (4.6%) | 222 (5.9%) |
| $100,000+ | 185 (4.1%) | 81 (2.1%) |
| Total | 4,466 (100.0%) | 3,784 (100.0%) |
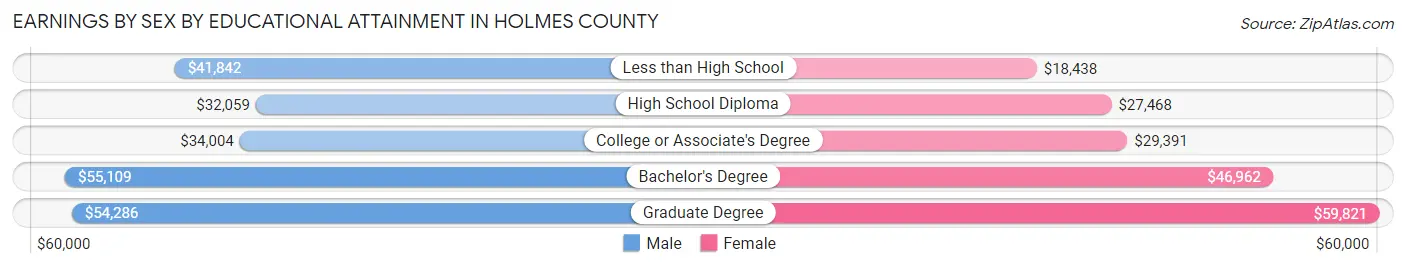
Earnings by Sex by Educational Attainment in Holmes County
Average earnings in Holmes County are $36,680 for men and $30,333 for women, a difference of 17.3%. Men with an educational attainment of bachelor's degree enjoy the highest average annual earnings of $55,109, while those with high school diploma education earn the least with $32,059. Women with an educational attainment of graduate degree earn the most with the average annual earnings of $59,821, while those with less than high school education have the smallest earnings of $18,438.
| Educational Attainment | Male Income | Female Income |
| Less than High School | $41,842 | $18,438 |
| High School Diploma | $32,059 | $27,468 |
| College or Associate's Degree | $34,004 | $29,391 |
| Bachelor's Degree | $55,109 | $46,962 |
| Graduate Degree | $54,286 | $59,821 |
| Total | $36,680 | $30,333 |
Family Income in Holmes County
Family Income Brackets in Holmes County
According to the Holmes County family income data, there are 1,099 families falling into the $50,000 to $74,999 income range, which is the most common income bracket and makes up 23.7% of all families. Conversely, the $10,000 to $14,999 income bracket is the least frequent group with only 93 families (2.0%) belonging to this category.
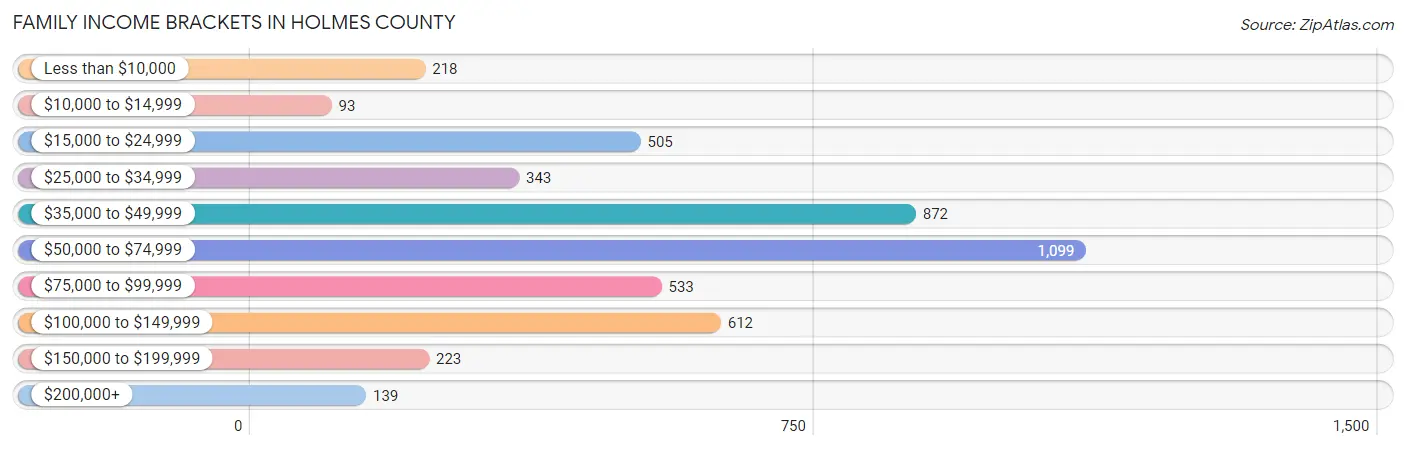
| Income Bracket | # Families | % Families |
| Less than $10,000 | 218 | 4.7% |
| $10,000 to $14,999 | 93 | 2.0% |
| $15,000 to $24,999 | 505 | 10.9% |
| $25,000 to $34,999 | 343 | 7.4% |
| $35,000 to $49,999 | 872 | 18.8% |
| $50,000 to $74,999 | 1,099 | 23.7% |
| $75,000 to $99,999 | 533 | 11.5% |
| $100,000 to $149,999 | 612 | 13.2% |
| $150,000 to $199,999 | 223 | 4.8% |
| $200,000+ | 139 | 3.0% |
Family Income by Famaliy Size in Holmes County
5-person families (432 | 9.3%) account for the highest median family income in Holmes County with $101,793 per family, while 3-person families (857 | 18.5%) have the highest median income of $24,846 per family member.
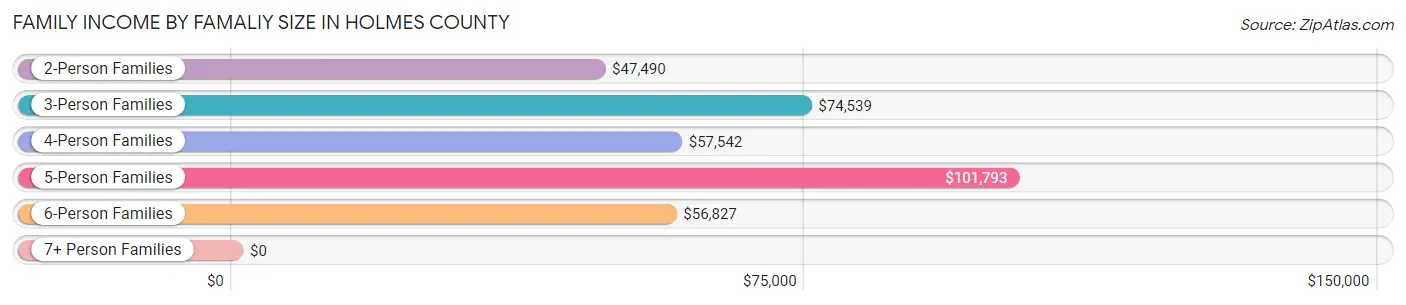
| Income Bracket | # Families | Median Income |
| 2-Person Families | 2,315 (49.9%) | $47,490 |
| 3-Person Families | 857 (18.5%) | $74,539 |
| 4-Person Families | 747 (16.1%) | $57,542 |
| 5-Person Families | 432 (9.3%) | $101,793 |
| 6-Person Families | 197 (4.3%) | $56,827 |
| 7+ Person Families | 88 (1.9%) | $0 |
| Total | 4,636 (100.0%) | $55,802 |
Family Income by Number of Earners in Holmes County
The median family income in Holmes County is $55,802, with families comprising 3+ earners (567) having the highest median family income of $119,438, while families with no earners (1,052) have the lowest median family income of $30,038, accounting for 12.2% and 22.7% of families, respectively.
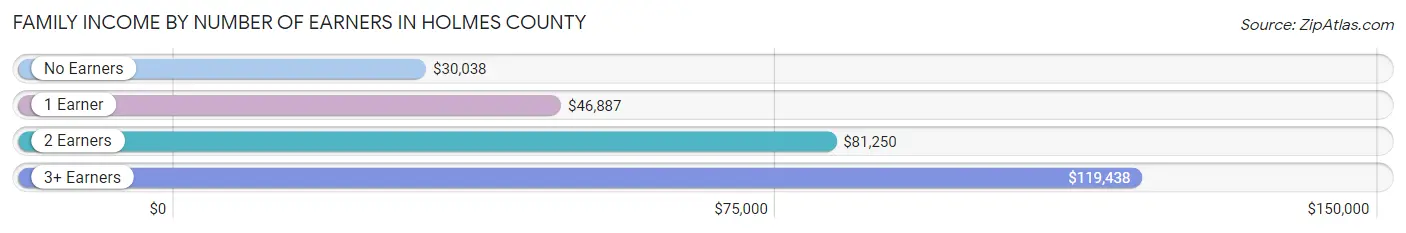
| Number of Earners | # Families | Median Income |
| No Earners | 1,052 (22.7%) | $30,038 |
| 1 Earner | 1,686 (36.4%) | $46,887 |
| 2 Earners | 1,331 (28.7%) | $81,250 |
| 3+ Earners | 567 (12.2%) | $119,438 |
| Total | 4,636 (100.0%) | $55,802 |
Household Income in Holmes County
Household Income Brackets in Holmes County
With 1,456 households falling in the category, the $50,000 to $74,999 income range is the most frequent in Holmes County, accounting for 20.6% of all households. In contrast, only 141 households (2.0%) fall into the $200,000+ income bracket, making it the least populous group.
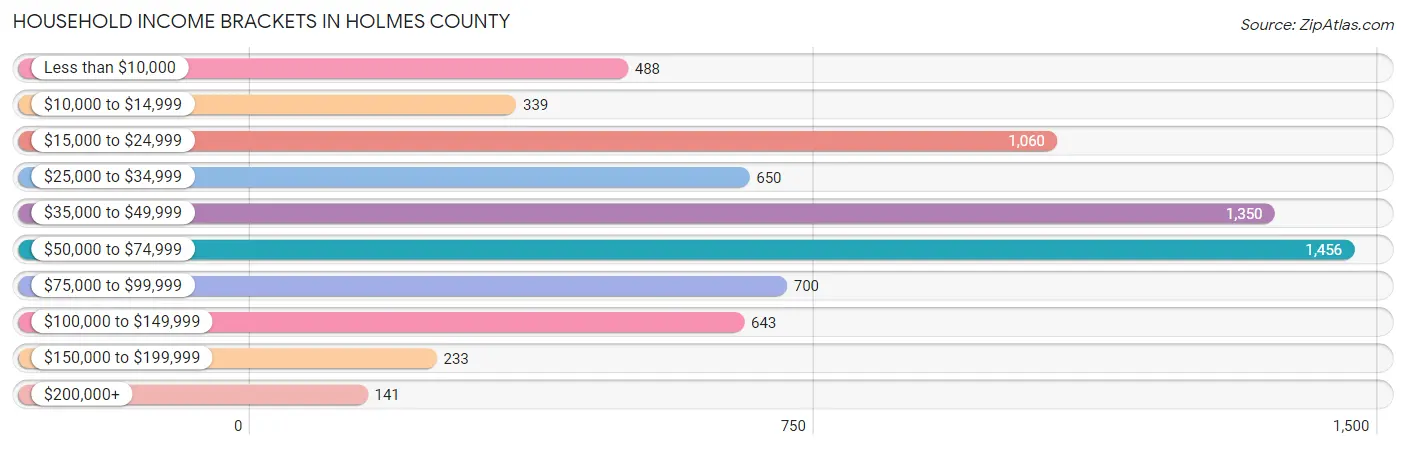
| Income Bracket | # Households | % Households |
| Less than $10,000 | 488 | 6.9% |
| $10,000 to $14,999 | 339 | 4.8% |
| $15,000 to $24,999 | 1,060 | 15.0% |
| $25,000 to $34,999 | 650 | 9.2% |
| $35,000 to $49,999 | 1,350 | 19.1% |
| $50,000 to $74,999 | 1,456 | 20.6% |
| $75,000 to $99,999 | 700 | 9.9% |
| $100,000 to $149,999 | 643 | 9.1% |
| $150,000 to $199,999 | 233 | 3.3% |
| $200,000+ | 141 | 2.0% |
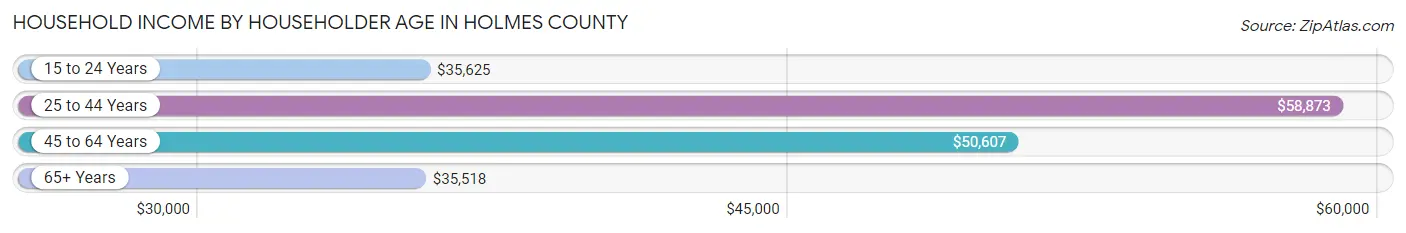
Household Income by Householder Age in Holmes County
The median household income in Holmes County is $46,063, with the highest median household income of $58,873 found in the 25 to 44 years age bracket for the primary householder. A total of 1,499 households (21.2%) fall into this category. Meanwhile, the 65+ years age bracket for the primary householder has the lowest median household income of $35,518, with 2,457 households (34.8%) in this group.
| Income Bracket | # Households | Median Income |
| 15 to 24 Years | 202 (2.9%) | $35,625 |
| 25 to 44 Years | 1,499 (21.2%) | $58,873 |
| 45 to 64 Years | 2,911 (41.2%) | $50,607 |
| 65+ Years | 2,457 (34.8%) | $35,518 |
| Total | 7,069 (100.0%) | $46,063 |
Poverty in Holmes County
Income Below Poverty by Sex and Age in Holmes County
With 14.6% poverty level for males and 18.6% for females among the residents of Holmes County, 15 year old males and 15 year old females are the most vulnerable to poverty, with 46 males (36.8%) and 23 females (46.9%) in their respective age groups living below the poverty level.
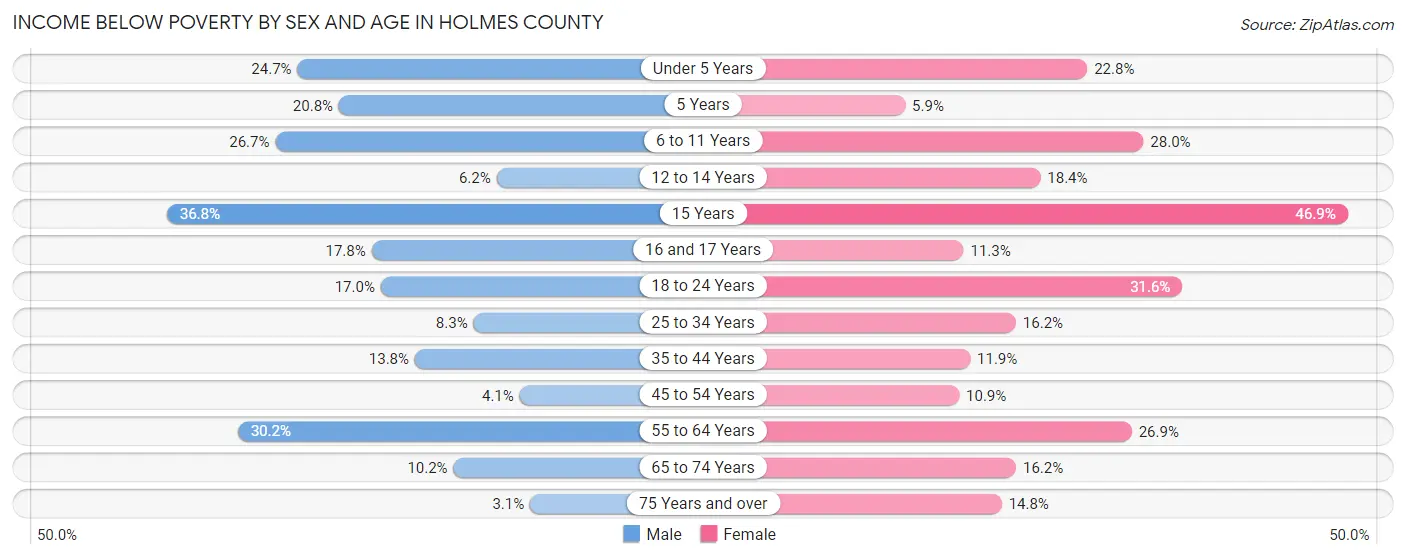
| Age Bracket | Male | Female |
| Under 5 Years | 114 (24.7%) | 105 (22.8%) |
| 5 Years | 25 (20.8%) | 4 (5.9%) |
| 6 to 11 Years | 166 (26.7%) | 164 (28.0%) |
| 12 to 14 Years | 23 (6.2%) | 87 (18.4%) |
| 15 Years | 46 (36.8%) | 23 (46.9%) |
| 16 and 17 Years | 47 (17.8%) | 34 (11.3%) |
| 18 to 24 Years | 121 (17.0%) | 175 (31.6%) |
| 25 to 34 Years | 91 (8.3%) | 165 (16.2%) |
| 35 to 44 Years | 117 (13.8%) | 118 (11.9%) |
| 45 to 54 Years | 50 (4.1%) | 126 (10.9%) |
| 55 to 64 Years | 366 (30.2%) | 348 (26.9%) |
| 65 to 74 Years | 105 (10.2%) | 179 (16.2%) |
| 75 Years and over | 23 (3.1%) | 127 (14.8%) |
| Total | 1,294 (14.6%) | 1,655 (18.6%) |
Income Above Poverty by Sex and Age in Holmes County
According to the poverty statistics in Holmes County, males aged 75 years and over and females aged 5 years are the age groups that are most secure financially, with 96.9% of males and 94.1% of females in these age groups living above the poverty line.
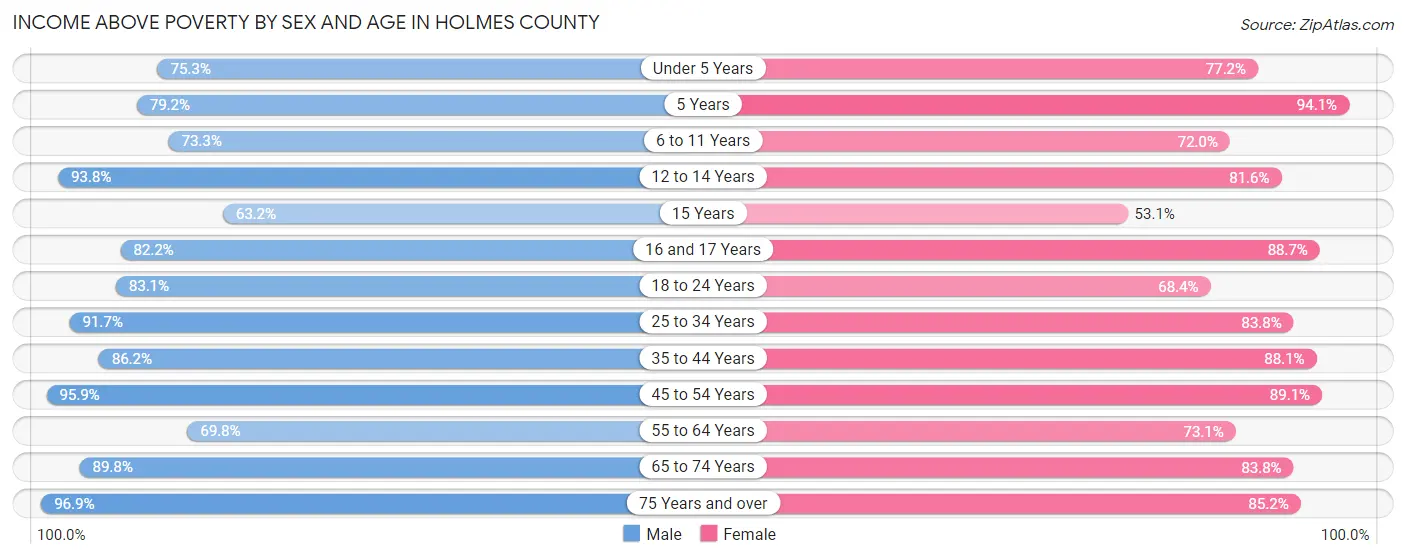
| Age Bracket | Male | Female |
| Under 5 Years | 348 (75.3%) | 356 (77.2%) |
| 5 Years | 95 (79.2%) | 64 (94.1%) |
| 6 to 11 Years | 455 (73.3%) | 422 (72.0%) |
| 12 to 14 Years | 348 (93.8%) | 385 (81.6%) |
| 15 Years | 79 (63.2%) | 26 (53.1%) |
| 16 and 17 Years | 217 (82.2%) | 267 (88.7%) |
| 18 to 24 Years | 593 (83.1%) | 379 (68.4%) |
| 25 to 34 Years | 1,000 (91.7%) | 856 (83.8%) |
| 35 to 44 Years | 732 (86.2%) | 873 (88.1%) |
| 45 to 54 Years | 1,183 (95.9%) | 1,031 (89.1%) |
| 55 to 64 Years | 845 (69.8%) | 945 (73.1%) |
| 65 to 74 Years | 924 (89.8%) | 928 (83.8%) |
| 75 Years and over | 721 (96.9%) | 729 (85.2%) |
| Total | 7,540 (85.4%) | 7,261 (81.4%) |
Income Below Poverty Among Married-Couple Families in Holmes County
The poverty statistics for married-couple families in Holmes County show that 11.8% or 380 of the total 3,224 families live below the poverty line. Families with 5 or more children have the highest poverty rate of 100.0%, comprising of 12 families. On the other hand, families with 1 or 2 children have the lowest poverty rate of 6.0%, which includes 52 families.
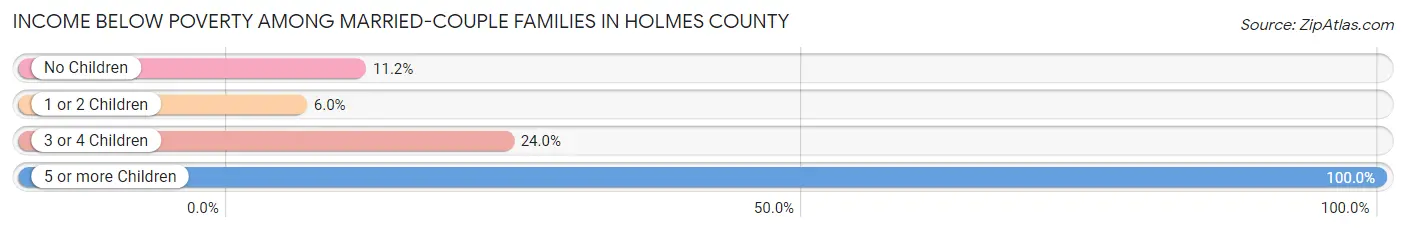
| Children | Above Poverty | Below Poverty |
| No Children | 1,705 (88.8%) | 214 (11.2%) |
| 1 or 2 Children | 816 (94.0%) | 52 (6.0%) |
| 3 or 4 Children | 323 (76.0%) | 102 (24.0%) |
| 5 or more Children | 0 (0.0%) | 12 (100.0%) |
| Total | 2,844 (88.2%) | 380 (11.8%) |
Income Below Poverty Among Single-Parent Households in Holmes County
According to the poverty data in Holmes County, 11.9% or 58 single-father households and 27.2% or 252 single-mother households are living below the poverty line. Among single-father households, those with no children have the highest poverty rate, with 38 households (18.4%) experiencing poverty. Likewise, among single-mother households, those with 3 or 4 children have the highest poverty rate, with 69 households (79.3%) falling below the poverty line.
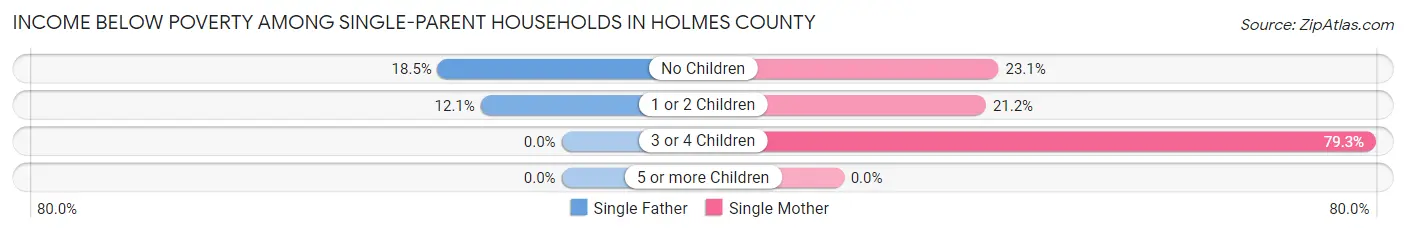
| Children | Single Father | Single Mother |
| No Children | 38 (18.4%) | 63 (23.1%) |
| 1 or 2 Children | 20 (12.0%) | 120 (21.2%) |
| 3 or 4 Children | 0 (0.0%) | 69 (79.3%) |
| 5 or more Children | 0 (0.0%) | 0 (0.0%) |
| Total | 58 (11.9%) | 252 (27.2%) |
Income Below Poverty Among Married-Couple vs Single-Parent Households in Holmes County
The poverty data for Holmes County shows that 380 of the married-couple family households (11.8%) and 310 of the single-parent households (22.0%) are living below the poverty level. Within the married-couple family households, those with 5 or more children have the highest poverty rate, with 12 households (100.0%) falling below the poverty line. Among the single-parent households, those with 3 or 4 children have the highest poverty rate, with 69 household (34.3%) living below poverty.
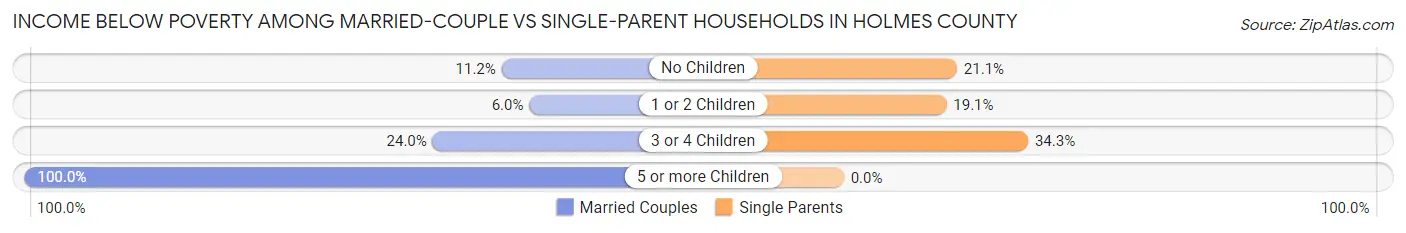
| Children | Married-Couple Families | Single-Parent Households |
| No Children | 214 (11.2%) | 101 (21.1%) |
| 1 or 2 Children | 52 (6.0%) | 140 (19.1%) |
| 3 or 4 Children | 102 (24.0%) | 69 (34.3%) |
| 5 or more Children | 12 (100.0%) | 0 (0.0%) |
| Total | 380 (11.8%) | 310 (22.0%) |
Race in Holmes County
The most populous races in Holmes County are White / Caucasian (16,816 | 86.1%), Black / African American (1,283 | 6.6%), and Two or more Races (811 | 4.2%).
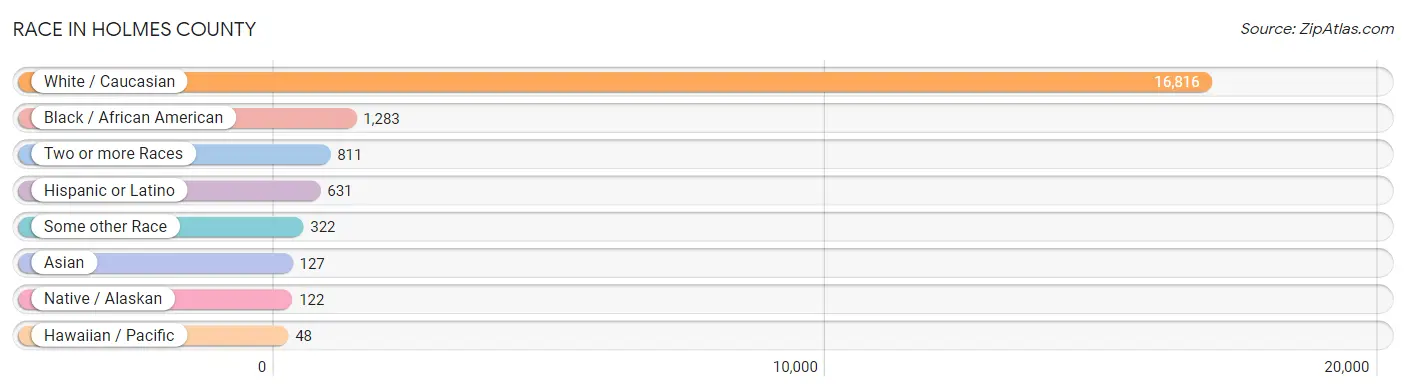
| Race | # Population | % Population |
| Asian | 127 | 0.6% |
| Black / African American | 1,283 | 6.6% |
| Hawaiian / Pacific | 48 | 0.3% |
| Hispanic or Latino | 631 | 3.2% |
| Native / Alaskan | 122 | 0.6% |
| White / Caucasian | 16,816 | 86.1% |
| Two or more Races | 811 | 4.2% |
| Some other Race | 322 | 1.7% |
| Total | 19,529 | 100.0% |
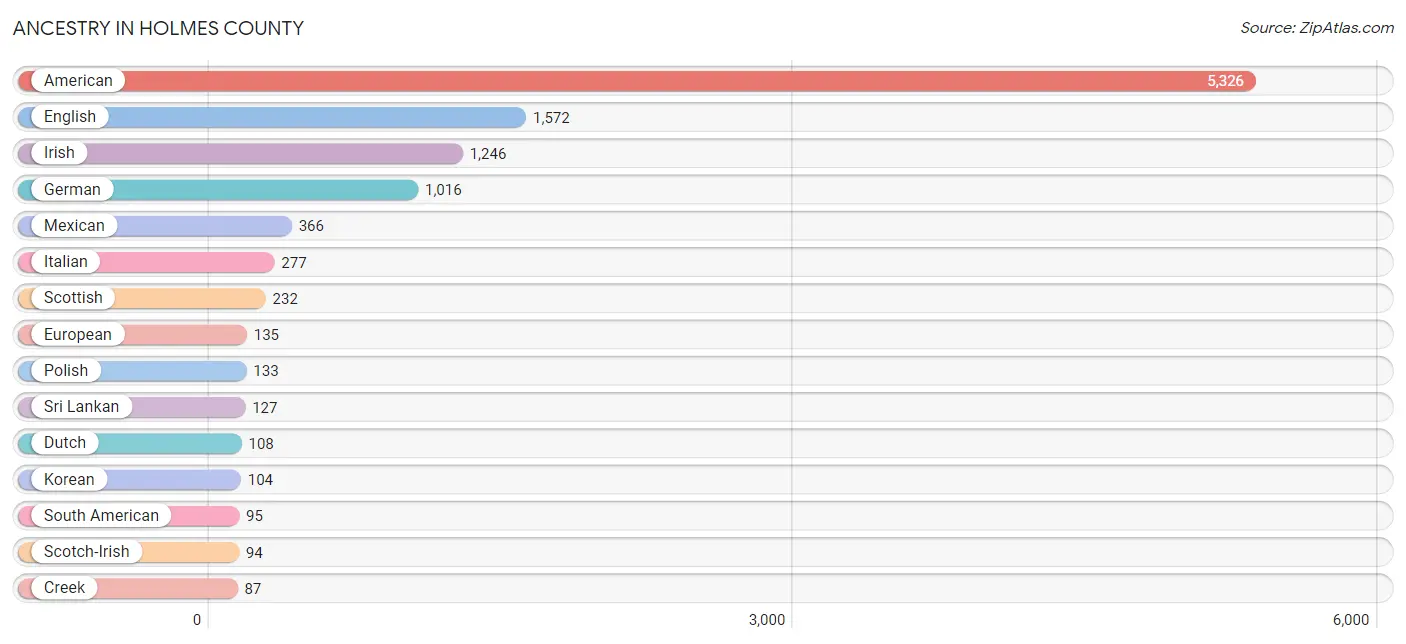
Ancestry in Holmes County
The most populous ancestries reported in Holmes County are American (5,326 | 27.3%), English (1,572 | 8.1%), Irish (1,246 | 6.4%), German (1,016 | 5.2%), and Mexican (366 | 1.9%), together accounting for 48.8% of all Holmes County residents.
| Ancestry | # Population | % Population |
| African | 29 | 0.2% |
| American | 5,326 | 27.3% |
| Apache | 13 | 0.1% |
| Arab | 3 | 0.0% |
| Brazilian | 2 | 0.0% |
| British | 76 | 0.4% |
| Burmese | 5 | 0.0% |
| Cajun | 16 | 0.1% |
| Canadian | 10 | 0.1% |
| Central American | 42 | 0.2% |
| Cherokee | 42 | 0.2% |
| Cheyenne | 19 | 0.1% |
| Colombian | 13 | 0.1% |
| Creek | 87 | 0.4% |
| Cuban | 31 | 0.2% |
| Czech | 1 | 0.0% |
| Dominican | 5 | 0.0% |
| Dutch | 108 | 0.5% |
| Eastern European | 21 | 0.1% |
| Egyptian | 3 | 0.0% |
| English | 1,572 | 8.1% |
| European | 135 | 0.7% |
| French | 67 | 0.3% |
| French American Indian | 1 | 0.0% |
| French Canadian | 3 | 0.0% |
| German | 1,016 | 5.2% |
| Greek | 5 | 0.0% |
| Guamanian / Chamorro | 12 | 0.1% |
| Guatemalan | 6 | 0.0% |
| Haitian | 31 | 0.2% |
| Honduran | 29 | 0.2% |
| Hungarian | 7 | 0.0% |
| Icelander | 22 | 0.1% |
| Indian (Asian) | 44 | 0.2% |
| Irish | 1,246 | 6.4% |
| Iroquois | 15 | 0.1% |
| Israeli | 10 | 0.1% |
| Italian | 277 | 1.4% |
| Jamaican | 72 | 0.4% |
| Korean | 104 | 0.5% |
| Mexican | 366 | 1.9% |
| Native Hawaiian | 28 | 0.1% |
| Northern European | 30 | 0.2% |
| Norwegian | 55 | 0.3% |
| Pakistani | 7 | 0.0% |
| Panamanian | 7 | 0.0% |
| Pennsylvania German | 3 | 0.0% |
| Peruvian | 8 | 0.0% |
| Polish | 133 | 0.7% |
| Portuguese | 35 | 0.2% |
| Puerto Rican | 76 | 0.4% |
| Russian | 8 | 0.0% |
| Scandinavian | 69 | 0.4% |
| Scotch-Irish | 94 | 0.5% |
| Scottish | 232 | 1.2% |
| Slavic | 1 | 0.0% |
| South American | 95 | 0.5% |
| Sri Lankan | 127 | 0.6% |
| Subsaharan African | 29 | 0.2% |
| Swedish | 15 | 0.1% |
| Ukrainian | 7 | 0.0% |
| Uruguayan | 70 | 0.4% |
| Venezuelan | 4 | 0.0% |
| Welsh | 55 | 0.3% | View All 64 Rows |
Immigrants in Holmes County
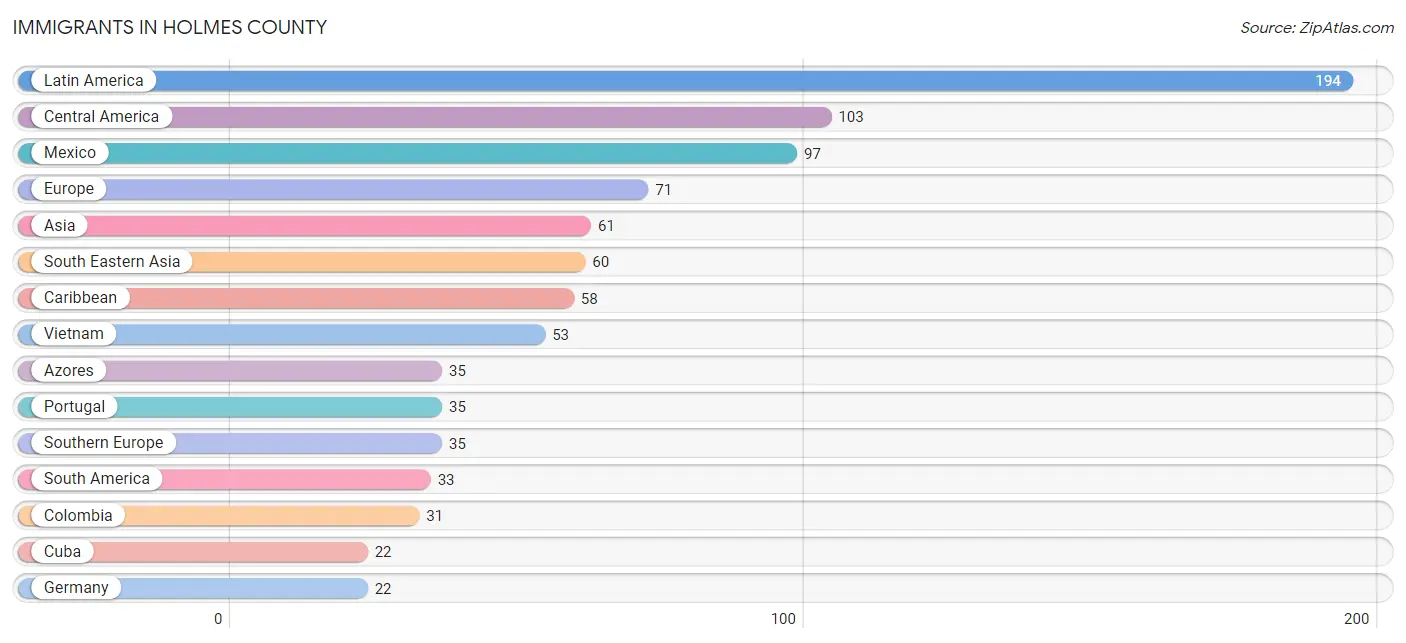
The most numerous immigrant groups reported in Holmes County came from Latin America (194 | 1.0%), Central America (103 | 0.5%), Mexico (97 | 0.5%), Europe (71 | 0.4%), and Asia (61 | 0.3%), together accounting for 2.7% of all Holmes County residents.
| Immigration Origin | # Population | % Population |
| Africa | 3 | 0.0% |
| Asia | 61 | 0.3% |
| Australia | 5 | 0.0% |
| Azores | 35 | 0.2% |
| Belarus | 14 | 0.1% |
| Brazil | 2 | 0.0% |
| Canada | 5 | 0.0% |
| Caribbean | 58 | 0.3% |
| Central America | 103 | 0.5% |
| Colombia | 31 | 0.2% |
| Cuba | 22 | 0.1% |
| Eastern Europe | 14 | 0.1% |
| Egypt | 3 | 0.0% |
| Europe | 71 | 0.4% |
| Germany | 22 | 0.1% |
| Guatemala | 6 | 0.0% |
| Haiti | 11 | 0.1% |
| Jamaica | 17 | 0.1% |
| Latin America | 194 | 1.0% |
| Mexico | 97 | 0.5% |
| Northern Africa | 3 | 0.0% |
| Oceania | 5 | 0.0% |
| Pakistan | 1 | 0.0% |
| Portugal | 35 | 0.2% |
| South America | 33 | 0.2% |
| South Central Asia | 1 | 0.0% |
| South Eastern Asia | 60 | 0.3% |
| Southern Europe | 35 | 0.2% |
| Thailand | 7 | 0.0% |
| Trinidad and Tobago | 8 | 0.0% |
| Vietnam | 53 | 0.3% |
| Western Europe | 22 | 0.1% | View All 32 Rows |
Sex and Age in Holmes County
Sex and Age in Holmes County
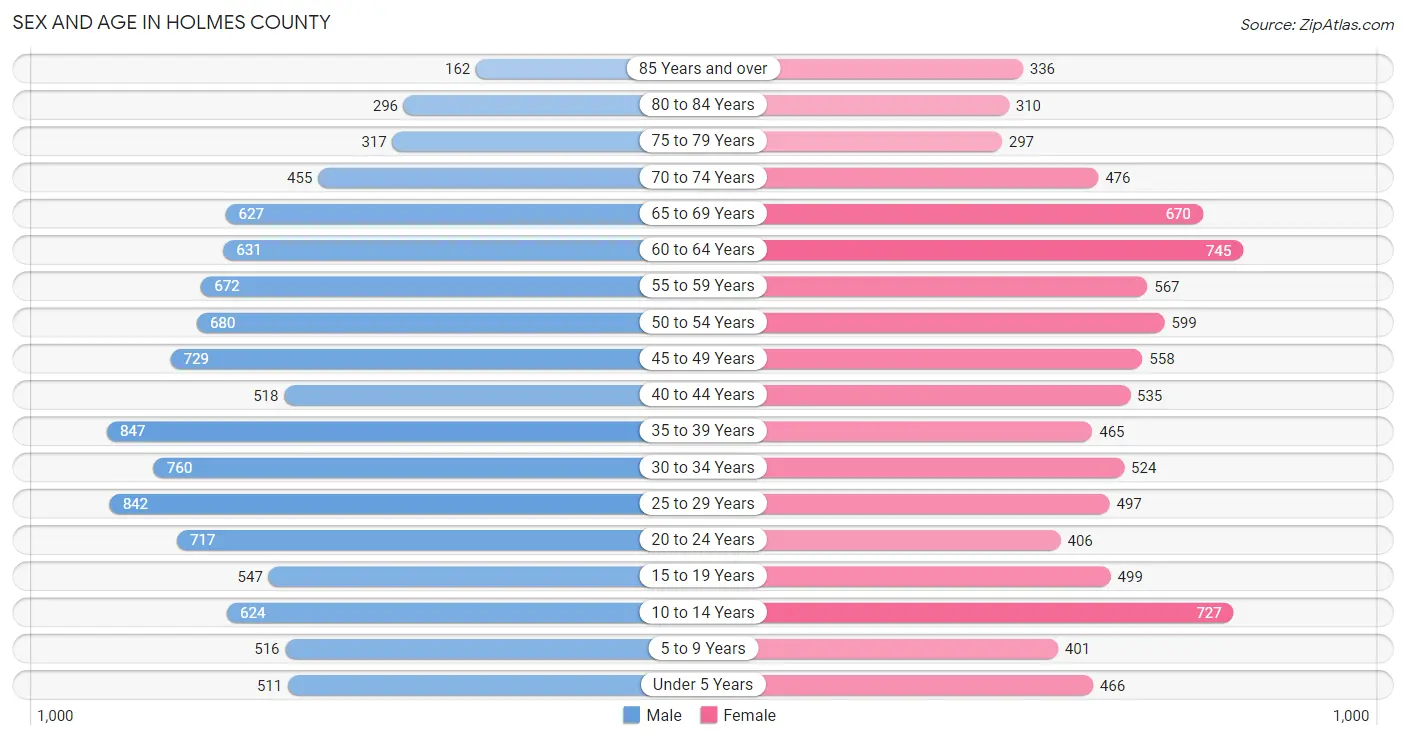
The most populous age groups in Holmes County are 35 to 39 Years (847 | 8.1%) for men and 60 to 64 Years (745 | 8.2%) for women.
| Age Bracket | Male | Female |
| Under 5 Years | 511 (4.9%) | 466 (5.1%) |
| 5 to 9 Years | 516 (4.9%) | 401 (4.4%) |
| 10 to 14 Years | 624 (6.0%) | 727 (8.0%) |
| 15 to 19 Years | 547 (5.2%) | 499 (5.5%) |
| 20 to 24 Years | 717 (6.9%) | 406 (4.5%) |
| 25 to 29 Years | 842 (8.1%) | 497 (5.5%) |
| 30 to 34 Years | 760 (7.3%) | 524 (5.8%) |
| 35 to 39 Years | 847 (8.1%) | 465 (5.1%) |
| 40 to 44 Years | 518 (5.0%) | 535 (5.9%) |
| 45 to 49 Years | 729 (7.0%) | 558 (6.1%) |
| 50 to 54 Years | 680 (6.5%) | 599 (6.6%) |
| 55 to 59 Years | 672 (6.4%) | 567 (6.2%) |
| 60 to 64 Years | 631 (6.0%) | 745 (8.2%) |
| 65 to 69 Years | 627 (6.0%) | 670 (7.4%) |
| 70 to 74 Years | 455 (4.3%) | 476 (5.2%) |
| 75 to 79 Years | 317 (3.0%) | 297 (3.3%) |
| 80 to 84 Years | 296 (2.8%) | 310 (3.4%) |
| 85 Years and over | 162 (1.5%) | 336 (3.7%) |
| Total | 10,451 (100.0%) | 9,078 (100.0%) |
Families and Households in Holmes County
Median Family Size in Holmes County
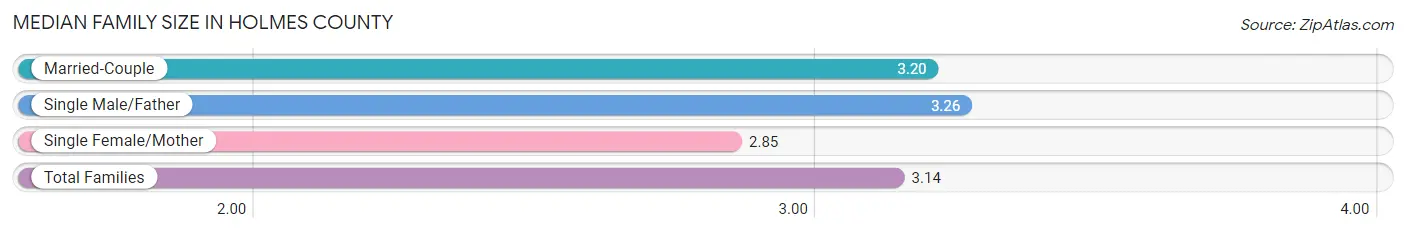
The median family size in Holmes County is 3.14 persons per family, with single male/father families (486 | 10.5%) accounting for the largest median family size of 3.26 persons per family. On the other hand, single female/mother families (926 | 20.0%) represent the smallest median family size with 2.85 persons per family.
| Family Type | # Families | Family Size |
| Married-Couple | 3,224 (69.5%) | 3.20 |
| Single Male/Father | 486 (10.5%) | 3.26 |
| Single Female/Mother | 926 (20.0%) | 2.85 |
| Total Families | 4,636 (100.0%) | 3.14 |
Median Household Size in Holmes County
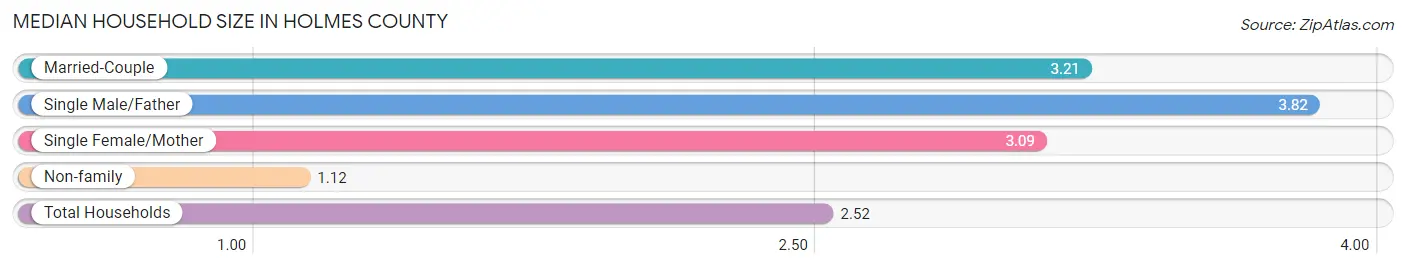
The median household size in Holmes County is 2.52 persons per household, with single male/father households (486 | 6.9%) accounting for the largest median household size of 3.82 persons per household. non-family households (2,433 | 34.4%) represent the smallest median household size with 1.12 persons per household.
| Household Type | # Households | Household Size |
| Married-Couple | 3,224 (45.6%) | 3.21 |
| Single Male/Father | 486 (6.9%) | 3.82 |
| Single Female/Mother | 926 (13.1%) | 3.09 |
| Non-family | 2,433 (34.4%) | 1.12 |
| Total Households | 7,069 (100.0%) | 2.52 |
Household Size by Marriage Status in Holmes County
Out of a total of 7,069 households in Holmes County, 4,636 (65.6%) are family households, while 2,433 (34.4%) are nonfamily households. The most numerous type of family households are 2-person households, comprising 2,190, and the most common type of nonfamily households are 1-person households, comprising 2,198.
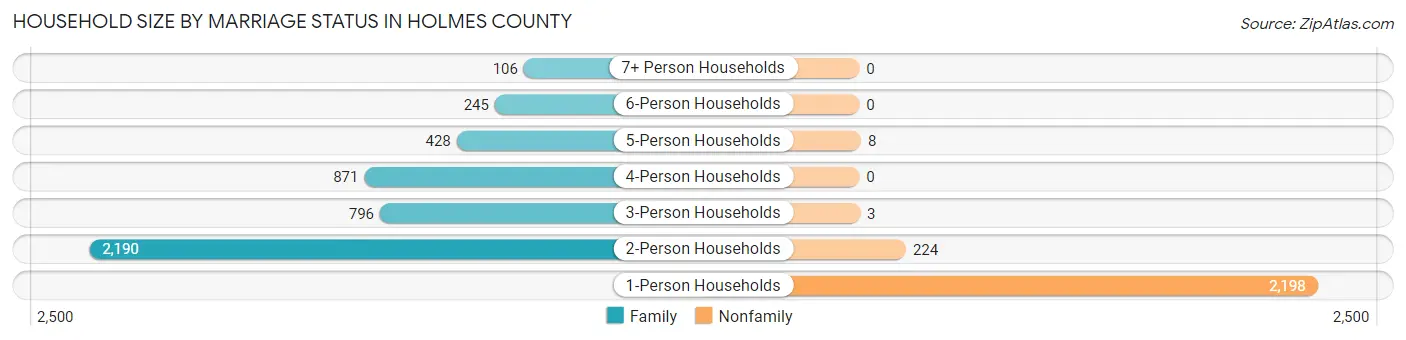
| Household Size | Family Households | Nonfamily Households |
| 1-Person Households | - | 2,198 (31.1%) |
| 2-Person Households | 2,190 (31.0%) | 224 (3.2%) |
| 3-Person Households | 796 (11.3%) | 3 (0.0%) |
| 4-Person Households | 871 (12.3%) | 0 (0.0%) |
| 5-Person Households | 428 (6.0%) | 8 (0.1%) |
| 6-Person Households | 245 (3.5%) | 0 (0.0%) |
| 7+ Person Households | 106 (1.5%) | 0 (0.0%) |
| Total | 4,636 (65.6%) | 2,433 (34.4%) |
Female Fertility in Holmes County
Fertility by Age in Holmes County
Average fertility rate in Holmes County is 137.0 births per 1,000 women. Women in the age bracket of 35 to 50 years have the highest fertility rate with 163.0 births per 1,000 women. Women in the age bracket of 35 to 50 years acount for 54.0% of all women with births.
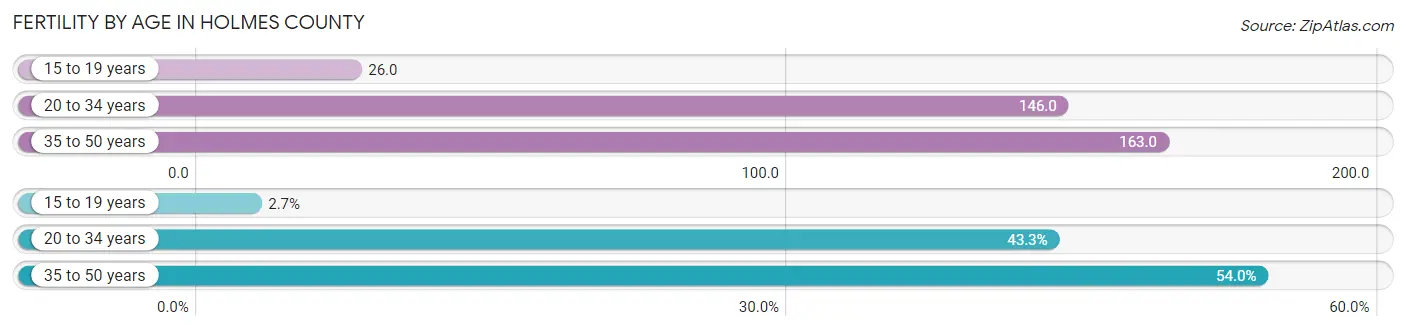
| Age Bracket | Women with Births | Births / 1,000 Women |
| 15 to 19 years | 13 (2.7%) | 26.0 |
| 20 to 34 years | 208 (43.3%) | 146.0 |
| 35 to 50 years | 259 (54.0%) | 163.0 |
| Total | 480 (100.0%) | 137.0 |
Fertility by Age by Marriage Status in Holmes County
53.3% of women with births (480) in Holmes County are married. The highest percentage of unmarried women with births falls into 35 to 50 years age bracket with 68.3% of them unmarried at the time of birth, while the lowest percentage of unmarried women with births belong to 15 to 19 years age bracket with 0.0% of them unmarried.
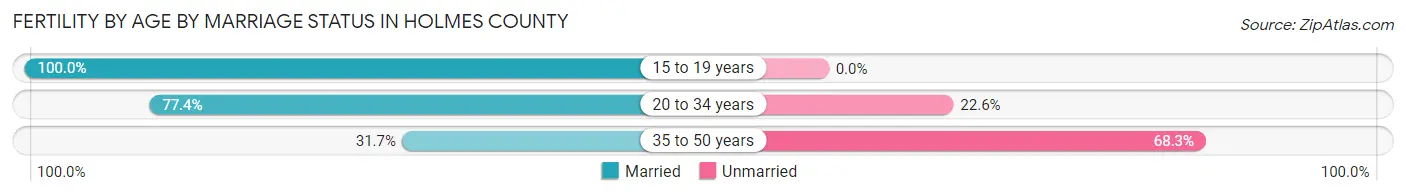
| Age Bracket | Married | Unmarried |
| 15 to 19 years | 13 (100.0%) | 0 (0.0%) |
| 20 to 34 years | 161 (77.4%) | 47 (22.6%) |
| 35 to 50 years | 82 (31.7%) | 177 (68.3%) |
| Total | 256 (53.3%) | 224 (46.7%) |
Fertility by Education in Holmes County
Average fertility rate in Holmes County is 137.0 births per 1,000 women. Women with the education attainment of bachelor's degree have the highest fertility rate of 300.0 births per 1,000 women, while women with the education attainment of less than high school have the lowest fertility at 51.0 births per 1,000 women. Women with the education attainment of high school diploma represent 57.7% of all women with births.
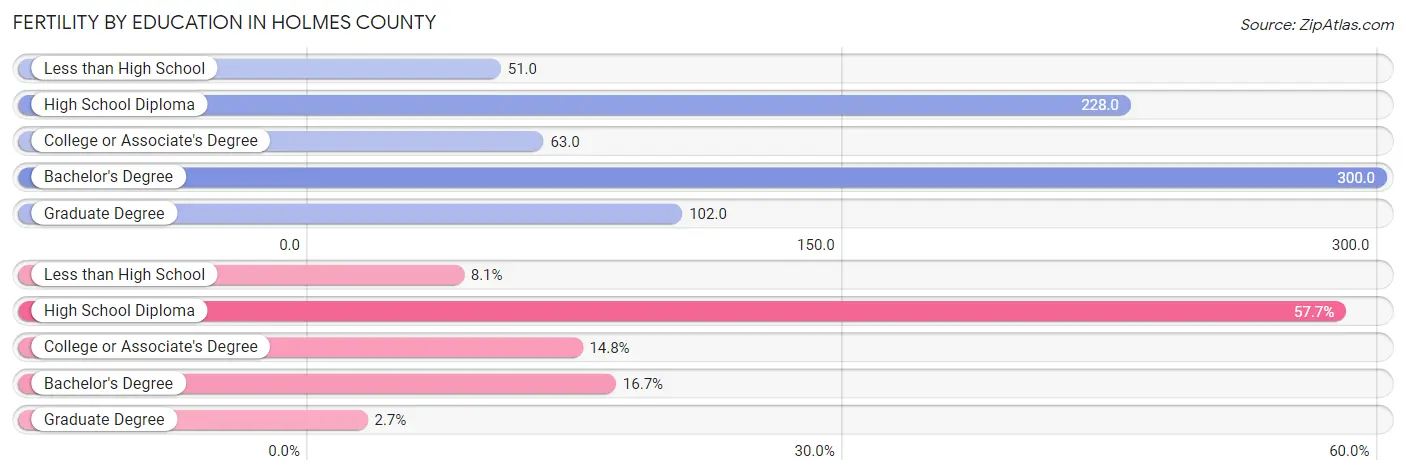
| Educational Attainment | Women with Births | Births / 1,000 Women |
| Less than High School | 39 (8.1%) | 51.0 |
| High School Diploma | 277 (57.7%) | 228.0 |
| College or Associate's Degree | 71 (14.8%) | 63.0 |
| Bachelor's Degree | 80 (16.7%) | 300.0 |
| Graduate Degree | 13 (2.7%) | 102.0 |
| Total | 480 (100.0%) | 137.0 |
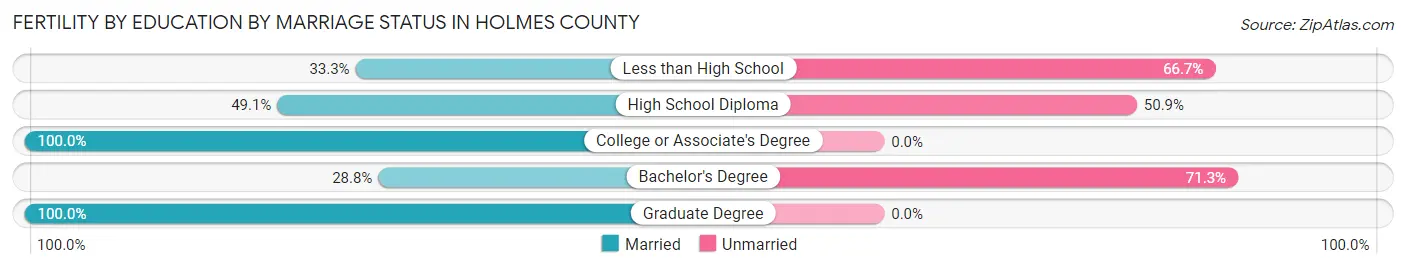
Fertility by Education by Marriage Status in Holmes County
46.7% of women with births in Holmes County are unmarried. Women with the educational attainment of college or associate's degree are most likely to be married with 100.0% of them married at childbirth, while women with the educational attainment of bachelor's degree are least likely to be married with 71.3% of them unmarried at childbirth.
| Educational Attainment | Married | Unmarried |
| Less than High School | 13 (33.3%) | 26 (66.7%) |
| High School Diploma | 136 (49.1%) | 141 (50.9%) |
| College or Associate's Degree | 71 (100.0%) | 0 (0.0%) |
| Bachelor's Degree | 23 (28.7%) | 57 (71.3%) |
| Graduate Degree | 13 (100.0%) | 0 (0.0%) |
| Total | 256 (53.3%) | 224 (46.7%) |
Employment Characteristics in Holmes County
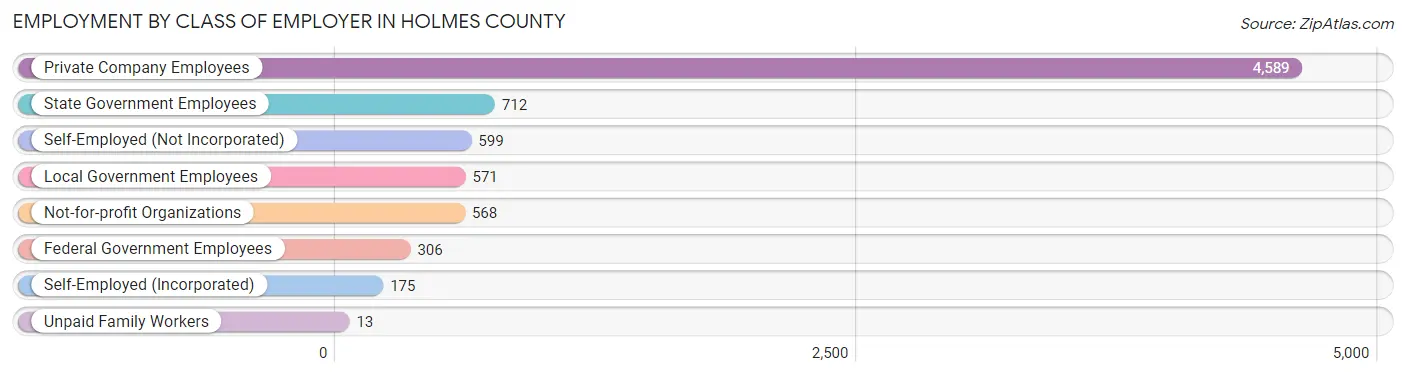
Employment by Class of Employer in Holmes County
Among the 7,533 employed individuals in Holmes County, private company employees (4,589 | 60.9%), state government employees (712 | 9.5%), and self-employed (not incorporated) (599 | 8.0%) make up the most common classes of employment.
| Employer Class | # Employees | % Employees |
| Private Company Employees | 4,589 | 60.9% |
| Self-Employed (Incorporated) | 175 | 2.3% |
| Self-Employed (Not Incorporated) | 599 | 8.0% |
| Not-for-profit Organizations | 568 | 7.5% |
| Local Government Employees | 571 | 7.6% |
| State Government Employees | 712 | 9.5% |
| Federal Government Employees | 306 | 4.1% |
| Unpaid Family Workers | 13 | 0.2% |
| Total | 7,533 | 100.0% |
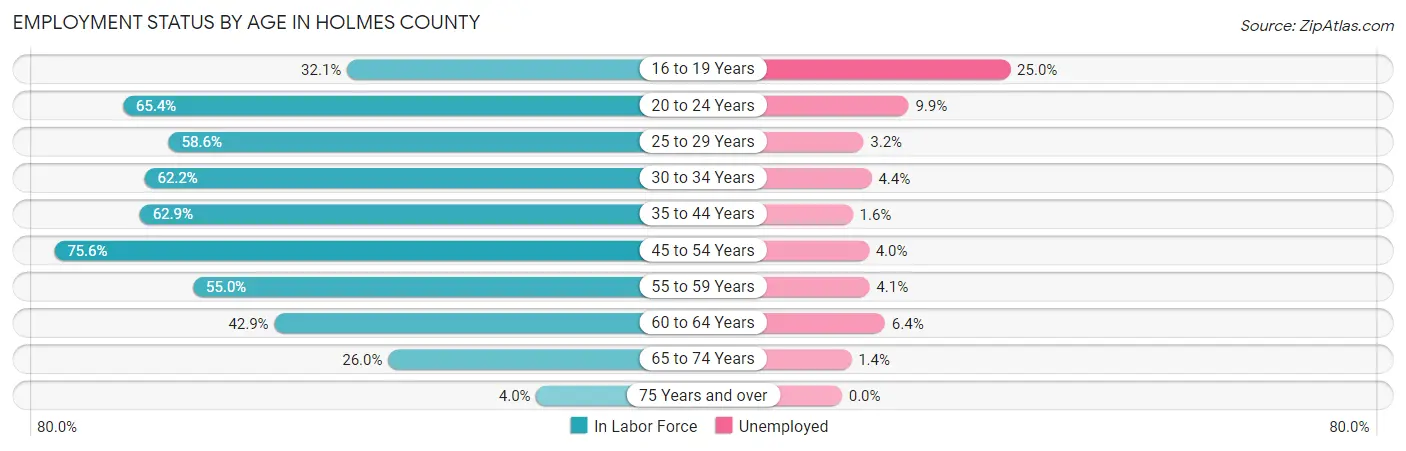
Employment Status by Age in Holmes County
According to the labor force statistics for Holmes County, out of the total population over 16 years of age (16,106), 49.3% or 7,940 individuals are in the labor force, with 4.7% or 373 of them unemployed. The age group with the highest labor force participation rate is 45 to 54 years, with 75.6% or 1,940 individuals in the labor force. Within the labor force, the 16 to 19 years age range has the highest percentage of unemployed individuals, with 25.0% or 70 of them being unemployed.
| Age Bracket | In Labor Force | Unemployed |
| 16 to 19 Years | 279 (32.1%) | 70 (25.0%) |
| 20 to 24 Years | 734 (65.4%) | 73 (9.9%) |
| 25 to 29 Years | 785 (58.6%) | 25 (3.2%) |
| 30 to 34 Years | 799 (62.2%) | 35 (4.4%) |
| 35 to 44 Years | 1,488 (62.9%) | 24 (1.6%) |
| 45 to 54 Years | 1,940 (75.6%) | 78 (4.0%) |
| 55 to 59 Years | 681 (55.0%) | 28 (4.1%) |
| 60 to 64 Years | 590 (42.9%) | 38 (6.4%) |
| 65 to 74 Years | 579 (26.0%) | 8 (1.4%) |
| 75 Years and over | 69 (4.0%) | 0 (0.0%) |
| Total | 7,940 (49.3%) | 373 (4.7%) |
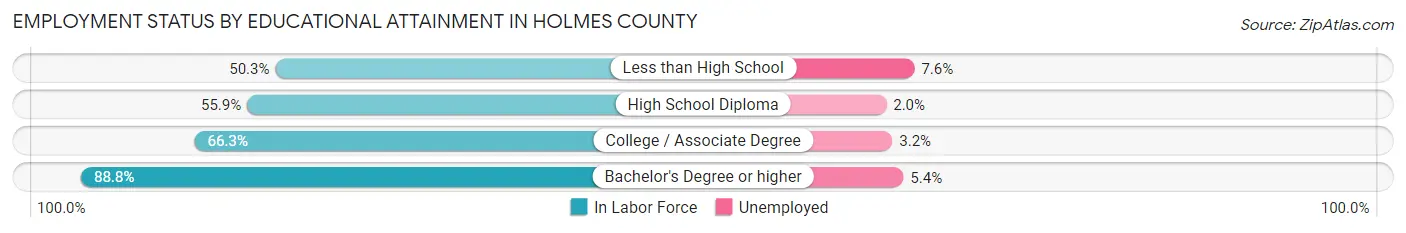
Employment Status by Educational Attainment in Holmes County
According to labor force statistics for Holmes County, 61.8% of individuals (6,284) out of the total population between 25 and 64 years of age (10,169) are in the labor force, with 3.6% or 226 of them being unemployed. The group with the highest labor force participation rate are those with the educational attainment of bachelor's degree or higher, with 88.8% or 1,070 individuals in the labor force. Within the labor force, individuals with less than high school education have the highest percentage of unemployment, with 7.6% or 59 of them being unemployed.
| Educational Attainment | In Labor Force | Unemployed |
| Less than High School | 777 (50.3%) | 117 (7.6%) |
| High School Diploma | 2,588 (55.9%) | 93 (2.0%) |
| College / Associate Degree | 1,849 (66.3%) | 89 (3.2%) |
| Bachelor's Degree or higher | 1,070 (88.8%) | 65 (5.4%) |
| Total | 6,284 (61.8%) | 366 (3.6%) |
Employment Occupations by Sex in Holmes County
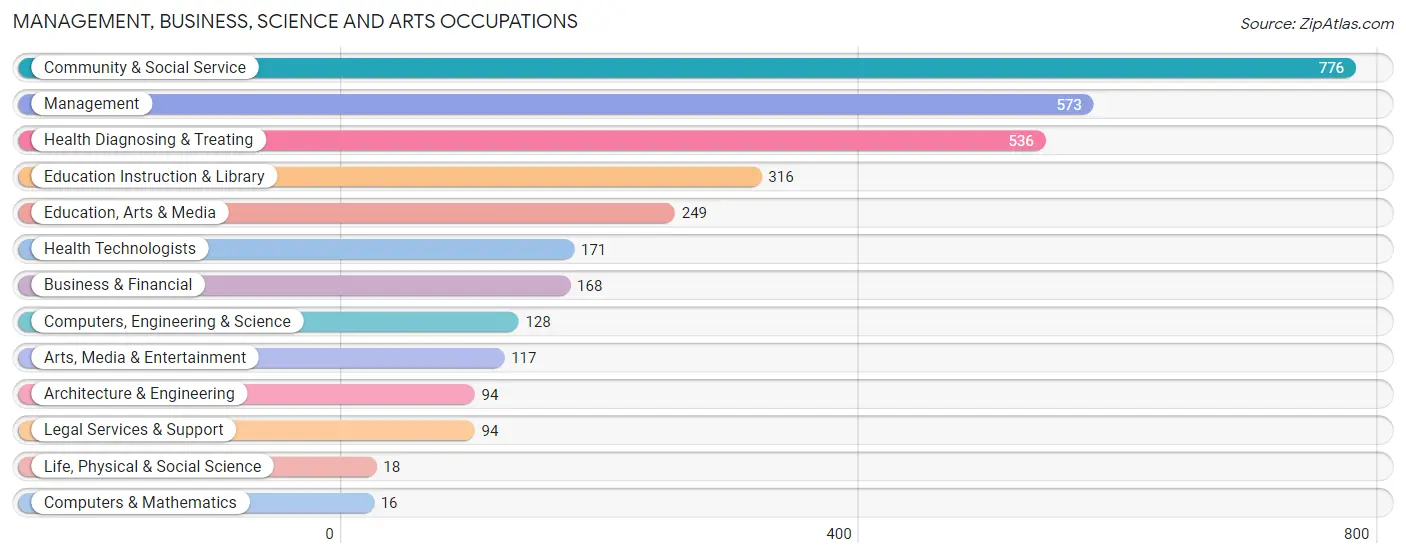
Management, Business, Science and Arts Occupations
The most common Management, Business, Science and Arts occupations in Holmes County are Community & Social Service (776 | 10.3%), Management (573 | 7.6%), Health Diagnosing & Treating (536 | 7.1%), Education Instruction & Library (316 | 4.2%), and Education, Arts & Media (249 | 3.3%).
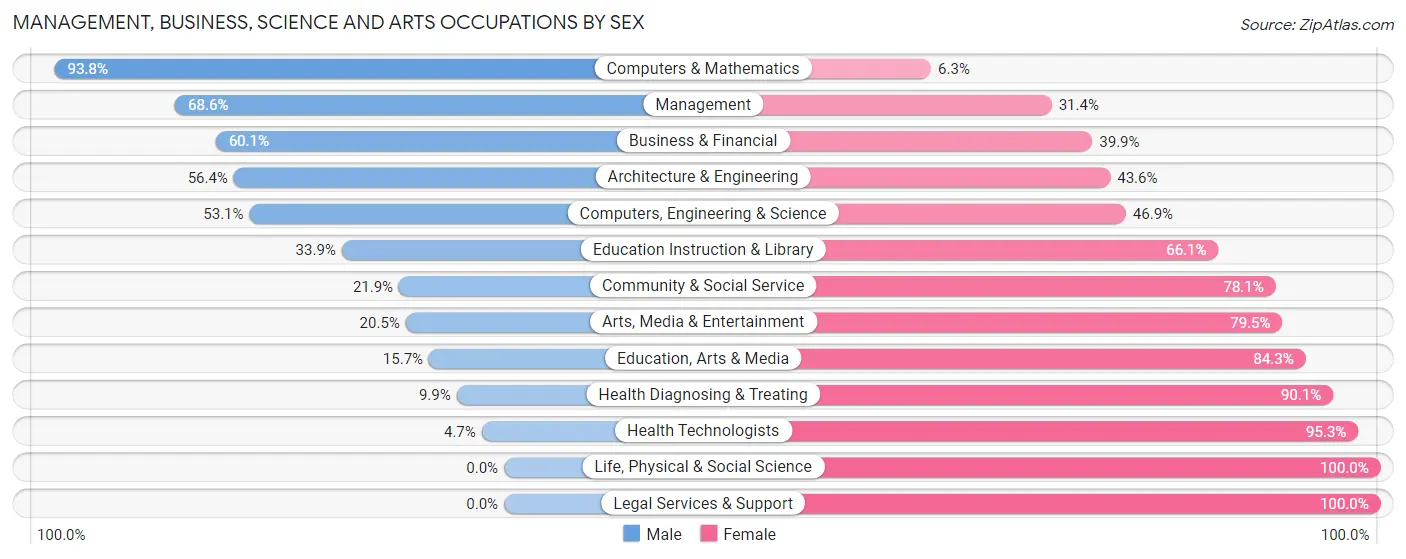
Management, Business, Science and Arts Occupations by Sex
Within the Management, Business, Science and Arts occupations in Holmes County, the most male-oriented occupations are Computers & Mathematics (93.8%), Management (68.6%), and Business & Financial (60.1%), while the most female-oriented occupations are Life, Physical & Social Science (100.0%), Legal Services & Support (100.0%), and Health Technologists (95.3%).
| Occupation | Male | Female |
| Management | 393 (68.6%) | 180 (31.4%) |
| Business & Financial | 101 (60.1%) | 67 (39.9%) |
| Computers, Engineering & Science | 68 (53.1%) | 60 (46.9%) |
| Computers & Mathematics | 15 (93.8%) | 1 (6.2%) |
| Architecture & Engineering | 53 (56.4%) | 41 (43.6%) |
| Life, Physical & Social Science | 0 (0.0%) | 18 (100.0%) |
| Community & Social Service | 170 (21.9%) | 606 (78.1%) |
| Education, Arts & Media | 39 (15.7%) | 210 (84.3%) |
| Legal Services & Support | 0 (0.0%) | 94 (100.0%) |
| Education Instruction & Library | 107 (33.9%) | 209 (66.1%) |
| Arts, Media & Entertainment | 24 (20.5%) | 93 (79.5%) |
| Health Diagnosing & Treating | 53 (9.9%) | 483 (90.1%) |
| Health Technologists | 8 (4.7%) | 163 (95.3%) |
| Total (Category) | 785 (36.0%) | 1,396 (64.0%) |
| Total (Overall) | 4,023 (53.5%) | 3,498 (46.5%) |
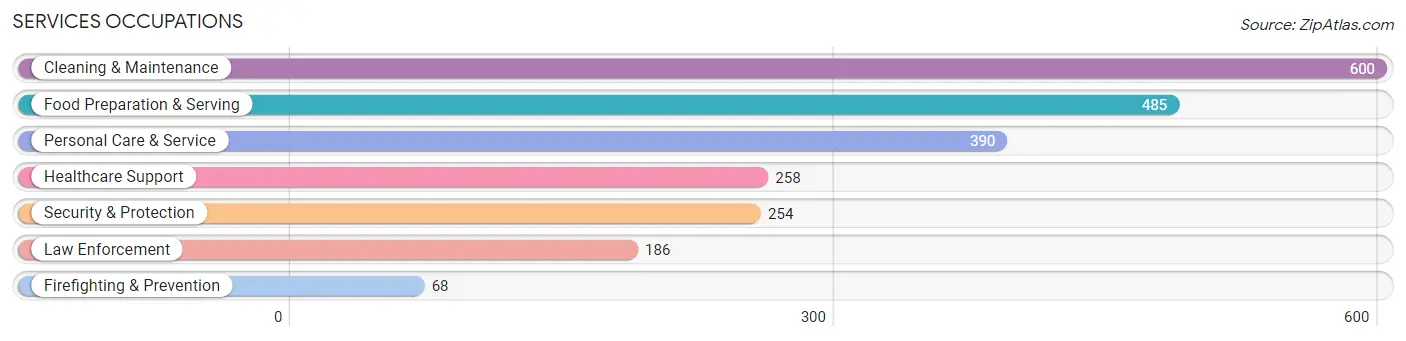
Services Occupations
The most common Services occupations in Holmes County are Cleaning & Maintenance (600 | 8.0%), Food Preparation & Serving (485 | 6.5%), Personal Care & Service (390 | 5.2%), Healthcare Support (258 | 3.4%), and Security & Protection (254 | 3.4%).
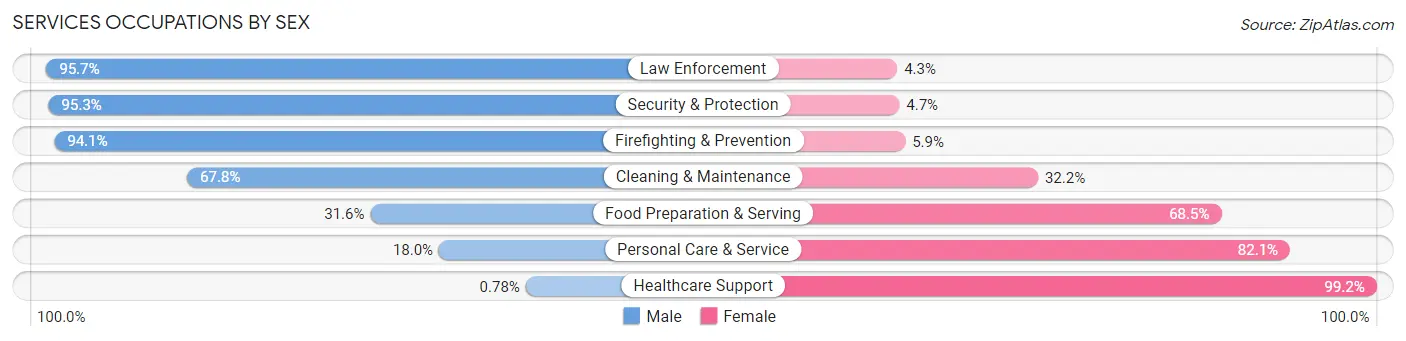
Services Occupations by Sex
Within the Services occupations in Holmes County, the most male-oriented occupations are Law Enforcement (95.7%), Security & Protection (95.3%), and Firefighting & Prevention (94.1%), while the most female-oriented occupations are Healthcare Support (99.2%), Personal Care & Service (82.1%), and Food Preparation & Serving (68.4%).
| Occupation | Male | Female |
| Healthcare Support | 2 (0.8%) | 256 (99.2%) |
| Security & Protection | 242 (95.3%) | 12 (4.7%) |
| Firefighting & Prevention | 64 (94.1%) | 4 (5.9%) |
| Law Enforcement | 178 (95.7%) | 8 (4.3%) |
| Food Preparation & Serving | 153 (31.6%) | 332 (68.4%) |
| Cleaning & Maintenance | 407 (67.8%) | 193 (32.2%) |
| Personal Care & Service | 70 (17.9%) | 320 (82.1%) |
| Total (Category) | 874 (44.0%) | 1,113 (56.0%) |
| Total (Overall) | 4,023 (53.5%) | 3,498 (46.5%) |
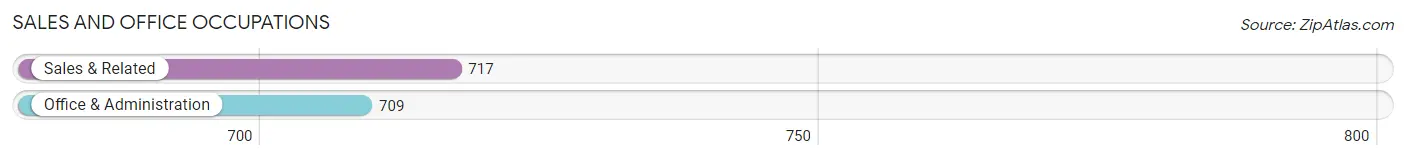
Sales and Office Occupations
The most common Sales and Office occupations in Holmes County are Sales & Related (717 | 9.5%), and Office & Administration (709 | 9.4%).
Sales and Office Occupations by Sex
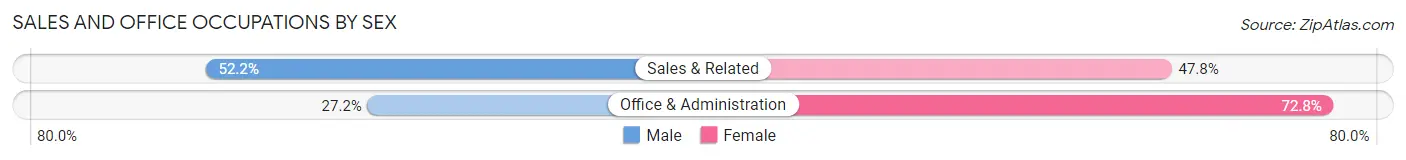
| Occupation | Male | Female |
| Sales & Related | 374 (52.2%) | 343 (47.8%) |
| Office & Administration | 193 (27.2%) | 516 (72.8%) |
| Total (Category) | 567 (39.8%) | 859 (60.2%) |
| Total (Overall) | 4,023 (53.5%) | 3,498 (46.5%) |
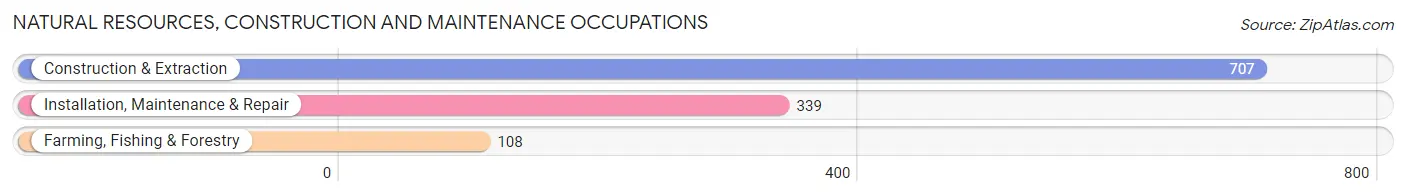
Natural Resources, Construction and Maintenance Occupations
The most common Natural Resources, Construction and Maintenance occupations in Holmes County are Construction & Extraction (707 | 9.4%), Installation, Maintenance & Repair (339 | 4.5%), and Farming, Fishing & Forestry (108 | 1.4%).
Natural Resources, Construction and Maintenance Occupations by Sex
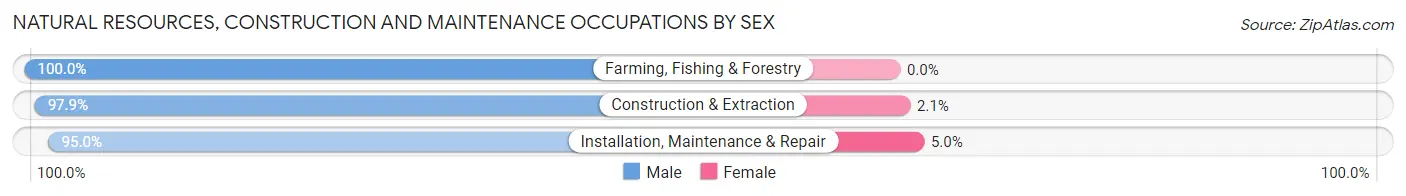
| Occupation | Male | Female |
| Farming, Fishing & Forestry | 108 (100.0%) | 0 (0.0%) |
| Construction & Extraction | 692 (97.9%) | 15 (2.1%) |
| Installation, Maintenance & Repair | 322 (95.0%) | 17 (5.0%) |
| Total (Category) | 1,122 (97.2%) | 32 (2.8%) |
| Total (Overall) | 4,023 (53.5%) | 3,498 (46.5%) |
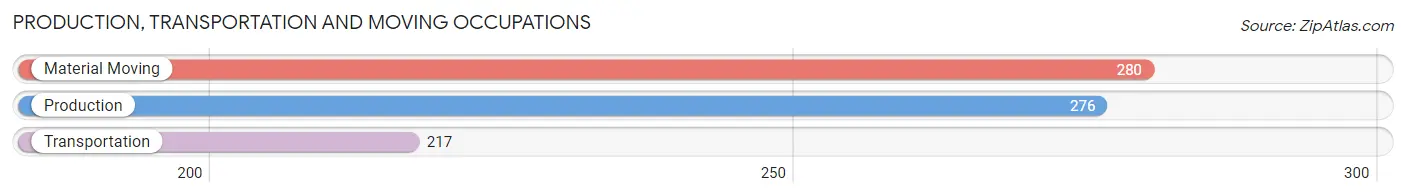
Production, Transportation and Moving Occupations
The most common Production, Transportation and Moving occupations in Holmes County are Material Moving (280 | 3.7%), Production (276 | 3.7%), and Transportation (217 | 2.9%).
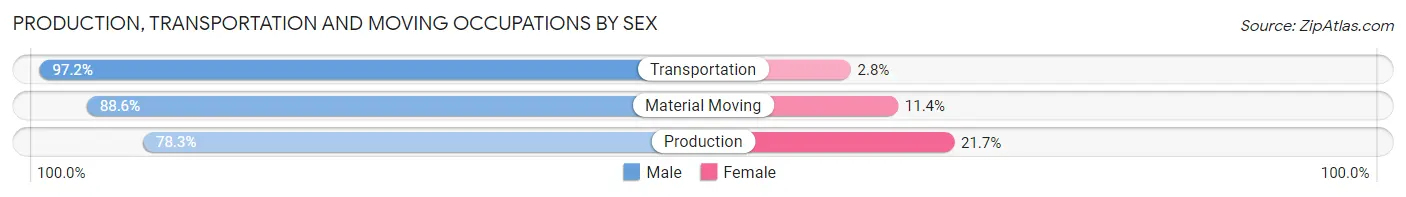
Production, Transportation and Moving Occupations by Sex
| Occupation | Male | Female |
| Production | 216 (78.3%) | 60 (21.7%) |
| Transportation | 211 (97.2%) | 6 (2.8%) |
| Material Moving | 248 (88.6%) | 32 (11.4%) |
| Total (Category) | 675 (87.3%) | 98 (12.7%) |
| Total (Overall) | 4,023 (53.5%) | 3,498 (46.5%) |
Employment Industries by Sex in Holmes County
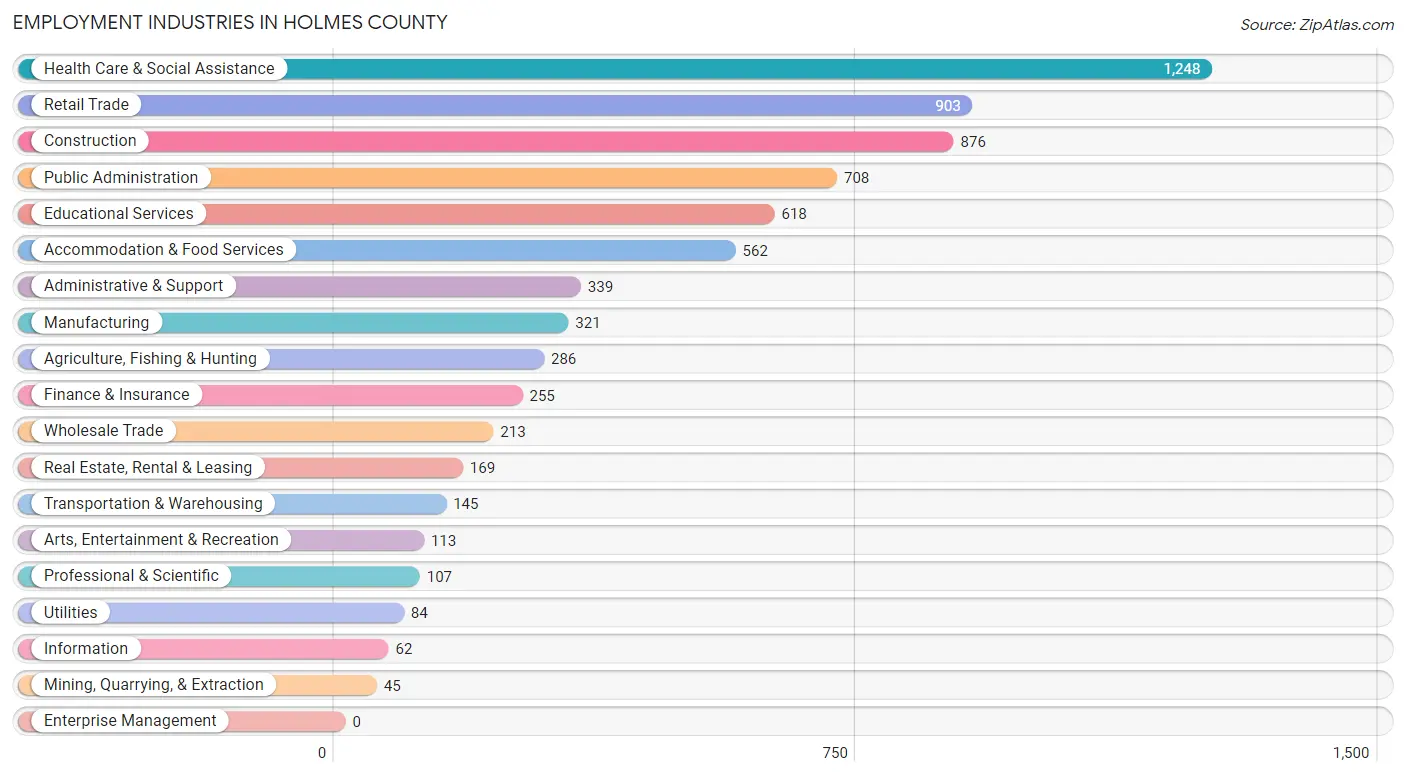
Employment Industries in Holmes County
The major employment industries in Holmes County include Health Care & Social Assistance (1,248 | 16.6%), Retail Trade (903 | 12.0%), Construction (876 | 11.7%), Public Administration (708 | 9.4%), and Educational Services (618 | 8.2%).
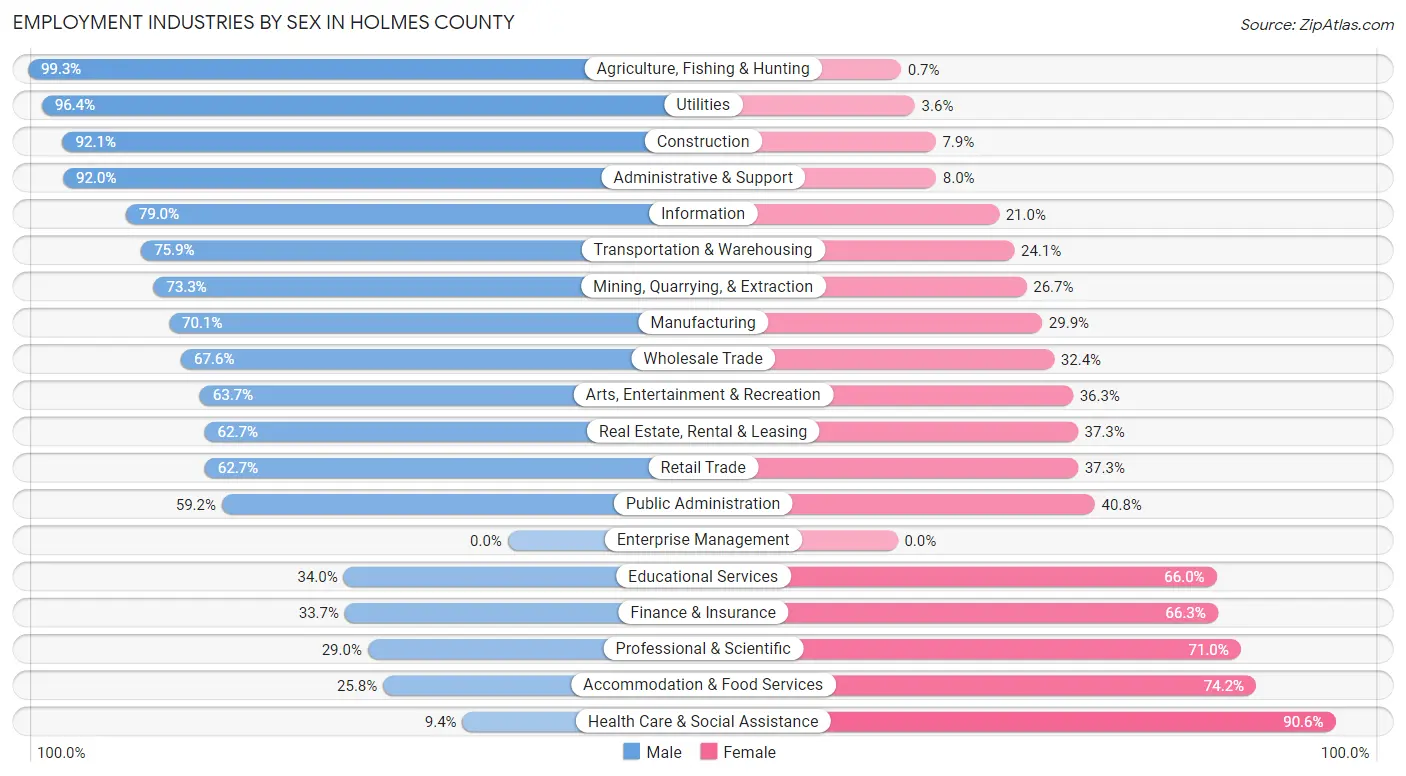
Employment Industries by Sex in Holmes County
The Holmes County industries that see more men than women are Agriculture, Fishing & Hunting (99.3%), Utilities (96.4%), and Construction (92.1%), whereas the industries that tend to have a higher number of women are Health Care & Social Assistance (90.6%), Accommodation & Food Services (74.2%), and Professional & Scientific (71.0%).
| Industry | Male | Female |
| Agriculture, Fishing & Hunting | 284 (99.3%) | 2 (0.7%) |
| Mining, Quarrying, & Extraction | 33 (73.3%) | 12 (26.7%) |
| Construction | 807 (92.1%) | 69 (7.9%) |
| Manufacturing | 225 (70.1%) | 96 (29.9%) |
| Wholesale Trade | 144 (67.6%) | 69 (32.4%) |
| Retail Trade | 566 (62.7%) | 337 (37.3%) |
| Transportation & Warehousing | 110 (75.9%) | 35 (24.1%) |
| Utilities | 81 (96.4%) | 3 (3.6%) |
| Information | 49 (79.0%) | 13 (21.0%) |
| Finance & Insurance | 86 (33.7%) | 169 (66.3%) |
| Real Estate, Rental & Leasing | 106 (62.7%) | 63 (37.3%) |
| Professional & Scientific | 31 (29.0%) | 76 (71.0%) |
| Enterprise Management | 0 (0.0%) | 0 (0.0%) |
| Administrative & Support | 312 (92.0%) | 27 (8.0%) |
| Educational Services | 210 (34.0%) | 408 (66.0%) |
| Health Care & Social Assistance | 117 (9.4%) | 1,131 (90.6%) |
| Arts, Entertainment & Recreation | 72 (63.7%) | 41 (36.3%) |
| Accommodation & Food Services | 145 (25.8%) | 417 (74.2%) |
| Public Administration | 419 (59.2%) | 289 (40.8%) |
| Total | 4,023 (53.5%) | 3,498 (46.5%) |
Education in Holmes County
School Enrollment in Holmes County
The most common levels of schooling among the 3,773 students in Holmes County are middle school (1,078 | 28.6%), high school (999 | 26.5%), and elementary school (658 | 17.4%).
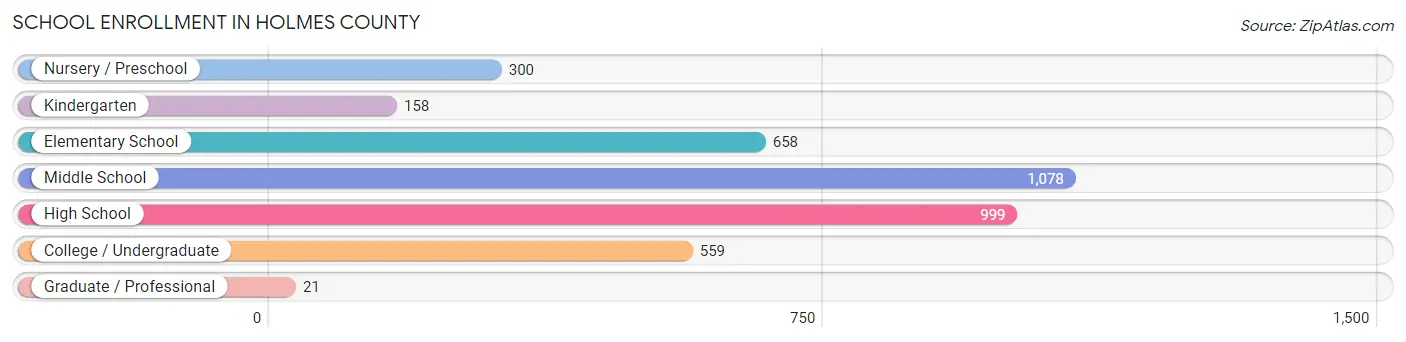
| School Level | # Students | % Students |
| Nursery / Preschool | 300 | 8.0% |
| Kindergarten | 158 | 4.2% |
| Elementary School | 658 | 17.4% |
| Middle School | 1,078 | 28.6% |
| High School | 999 | 26.5% |
| College / Undergraduate | 559 | 14.8% |
| Graduate / Professional | 21 | 0.6% |
| Total | 3,773 | 100.0% |
School Enrollment by Age by Funding Source in Holmes County
Out of a total of 3,773 students who are enrolled in schools in Holmes County, 396 (10.5%) attend a private institution, while the remaining 3,377 (89.5%) are enrolled in public schools. The age group of 35 years and over has the highest likelihood of being enrolled in private schools, with 41 (48.2% in the age bracket) enrolled. Conversely, the age group of 20 to 24 year olds has the lowest likelihood of being enrolled in a private school, with 309 (98.7% in the age bracket) attending a public institution.
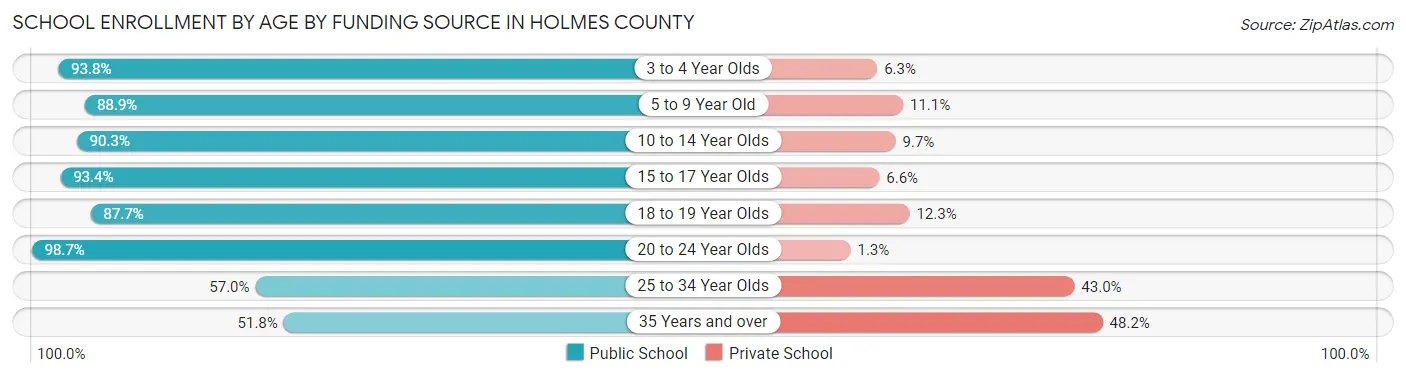
| Age Bracket | Public School | Private School |
| 3 to 4 Year Olds | 225 (93.8%) | 15 (6.2%) |
| 5 to 9 Year Old | 724 (88.9%) | 90 (11.1%) |
| 10 to 14 Year Olds | 1,149 (90.3%) | 123 (9.7%) |
| 15 to 17 Year Olds | 675 (93.4%) | 48 (6.6%) |
| 18 to 19 Year Olds | 186 (87.7%) | 26 (12.3%) |
| 20 to 24 Year Olds | 309 (98.7%) | 4 (1.3%) |
| 25 to 34 Year Olds | 65 (57.0%) | 49 (43.0%) |
| 35 Years and over | 44 (51.8%) | 41 (48.2%) |
| Total | 3,377 (89.5%) | 396 (10.5%) |
Educational Attainment by Field of Study in Holmes County
Education (512 | 31.3%), business (287 | 17.5%), arts & humanities (162 | 9.9%), science & technology (161 | 9.8%), and social sciences (102 | 6.2%) are the most common fields of study among 1,637 individuals in Holmes County who have obtained a bachelor's degree or higher.
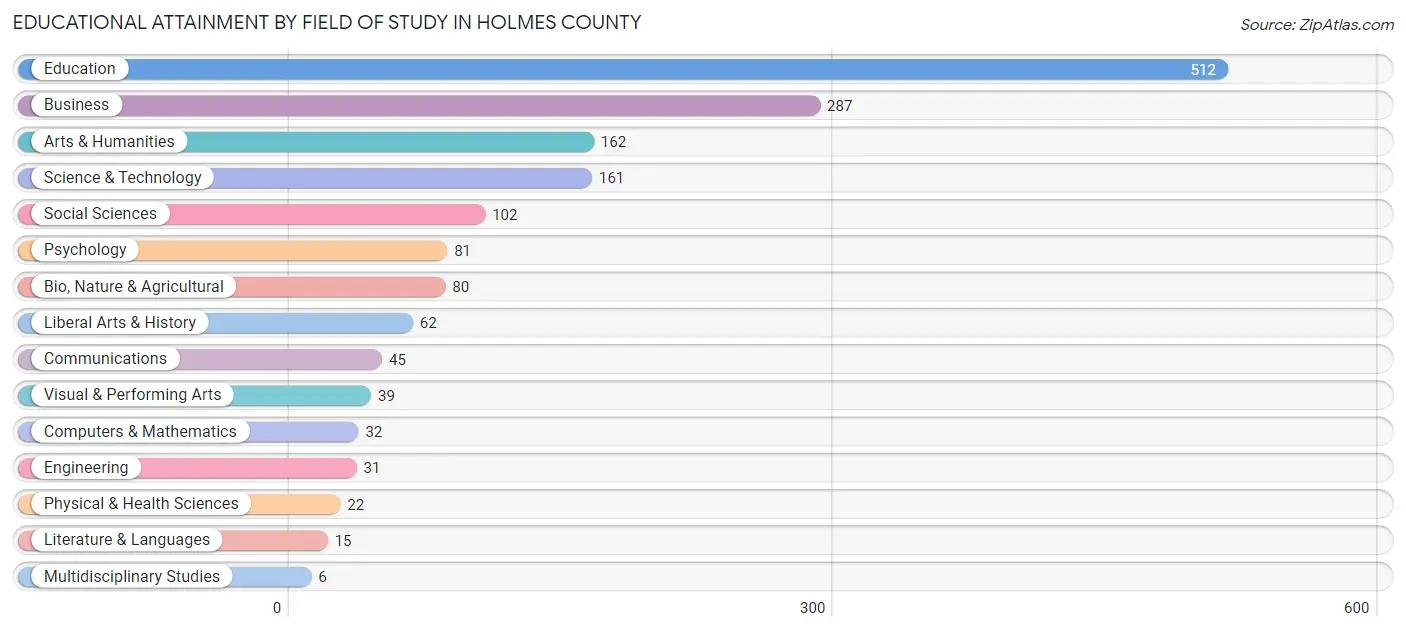
| Field of Study | # Graduates | % Graduates |
| Computers & Mathematics | 32 | 1.9% |
| Bio, Nature & Agricultural | 80 | 4.9% |
| Physical & Health Sciences | 22 | 1.3% |
| Psychology | 81 | 5.0% |
| Social Sciences | 102 | 6.2% |
| Engineering | 31 | 1.9% |
| Multidisciplinary Studies | 6 | 0.4% |
| Science & Technology | 161 | 9.8% |
| Business | 287 | 17.5% |
| Education | 512 | 31.3% |
| Literature & Languages | 15 | 0.9% |
| Liberal Arts & History | 62 | 3.8% |
| Visual & Performing Arts | 39 | 2.4% |
| Communications | 45 | 2.8% |
| Arts & Humanities | 162 | 9.9% |
| Total | 1,637 | 100.0% |
Transportation & Commute in Holmes County
Vehicle Availability by Sex in Holmes County
The most prevalent vehicle ownership categories in Holmes County are males with 2 vehicles (1,489, accounting for 36.8%) and females with 2 vehicles (1,036, making up 43.0%).
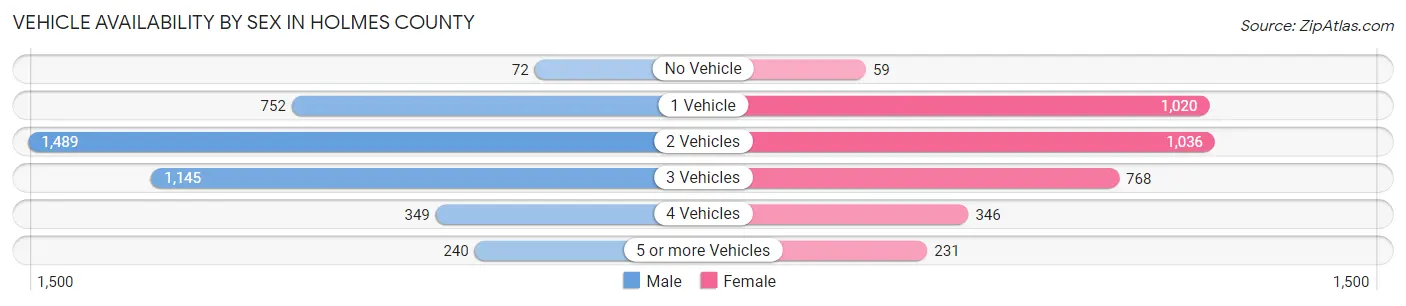
| Vehicles Available | Male | Female |
| No Vehicle | 72 (1.8%) | 59 (1.7%) |
| 1 Vehicle | 752 (18.6%) | 1,020 (29.5%) |
| 2 Vehicles | 1,489 (36.8%) | 1,036 (29.9%) |
| 3 Vehicles | 1,145 (28.3%) | 768 (22.2%) |
| 4 Vehicles | 349 (8.6%) | 346 (10.0%) |
| 5 or more Vehicles | 240 (5.9%) | 231 (6.7%) |
| Total | 4,047 (100.0%) | 3,460 (100.0%) |
Commute Time in Holmes County
The most frequently occuring commute durations in Holmes County are 30 to 34 minutes (1,678 commuters, 23.6%), 20 to 24 minutes (818 commuters, 11.5%), and 60 to 89 minutes (799 commuters, 11.3%).
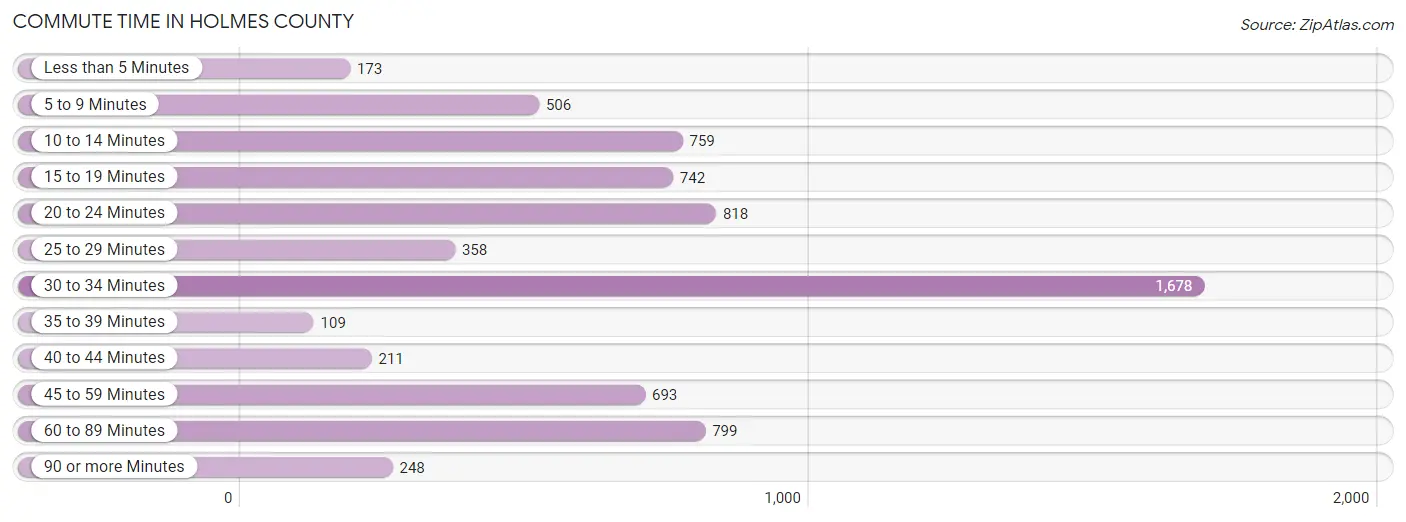
| Commute Time | # Commuters | % Commuters |
| Less than 5 Minutes | 173 | 2.4% |
| 5 to 9 Minutes | 506 | 7.1% |
| 10 to 14 Minutes | 759 | 10.7% |
| 15 to 19 Minutes | 742 | 10.5% |
| 20 to 24 Minutes | 818 | 11.5% |
| 25 to 29 Minutes | 358 | 5.1% |
| 30 to 34 Minutes | 1,678 | 23.6% |
| 35 to 39 Minutes | 109 | 1.5% |
| 40 to 44 Minutes | 211 | 3.0% |
| 45 to 59 Minutes | 693 | 9.8% |
| 60 to 89 Minutes | 799 | 11.3% |
| 90 or more Minutes | 248 | 3.5% |
Commute Time by Sex in Holmes County
The most common commute times in Holmes County are 30 to 34 minutes (977 commuters, 25.4%) for males and 30 to 34 minutes (701 commuters, 21.6%) for females.
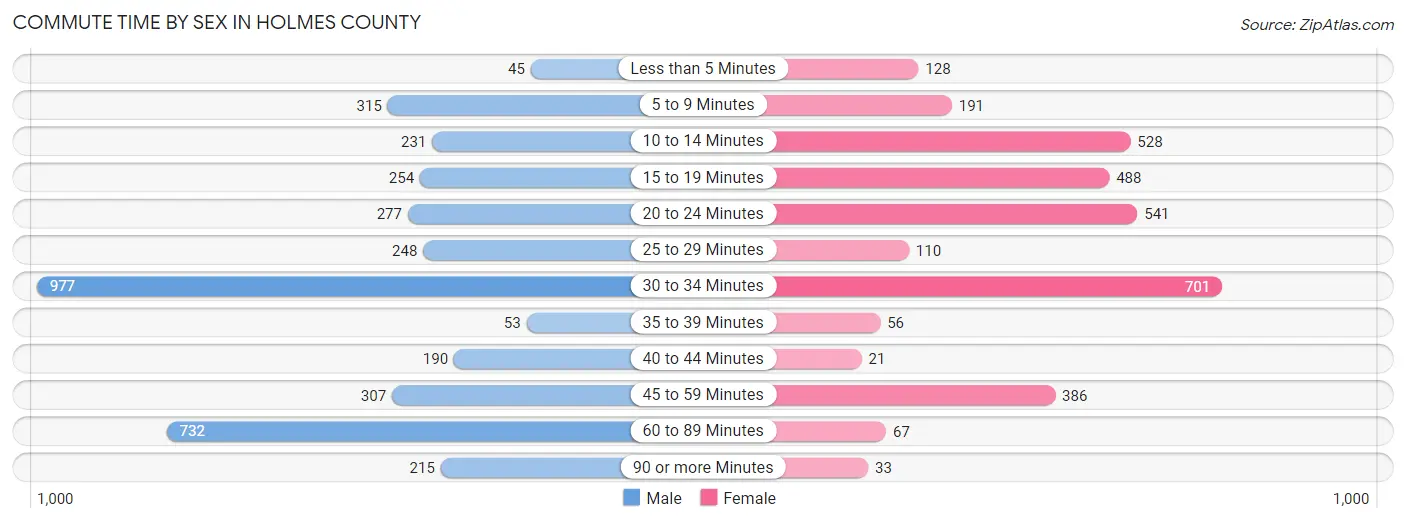
| Commute Time | Male | Female |
| Less than 5 Minutes | 45 (1.2%) | 128 (3.9%) |
| 5 to 9 Minutes | 315 (8.2%) | 191 (5.9%) |
| 10 to 14 Minutes | 231 (6.0%) | 528 (16.3%) |
| 15 to 19 Minutes | 254 (6.6%) | 488 (15.0%) |
| 20 to 24 Minutes | 277 (7.2%) | 541 (16.7%) |
| 25 to 29 Minutes | 248 (6.5%) | 110 (3.4%) |
| 30 to 34 Minutes | 977 (25.4%) | 701 (21.6%) |
| 35 to 39 Minutes | 53 (1.4%) | 56 (1.7%) |
| 40 to 44 Minutes | 190 (4.9%) | 21 (0.6%) |
| 45 to 59 Minutes | 307 (8.0%) | 386 (11.9%) |
| 60 to 89 Minutes | 732 (19.0%) | 67 (2.1%) |
| 90 or more Minutes | 215 (5.6%) | 33 (1.0%) |
Time of Departure to Work by Sex in Holmes County
The most frequent times of departure to work in Holmes County are 6:00 AM to 6:29 AM (1,086, 28.2%) for males and 6:30 AM to 6:59 AM (682, 21.0%) for females.
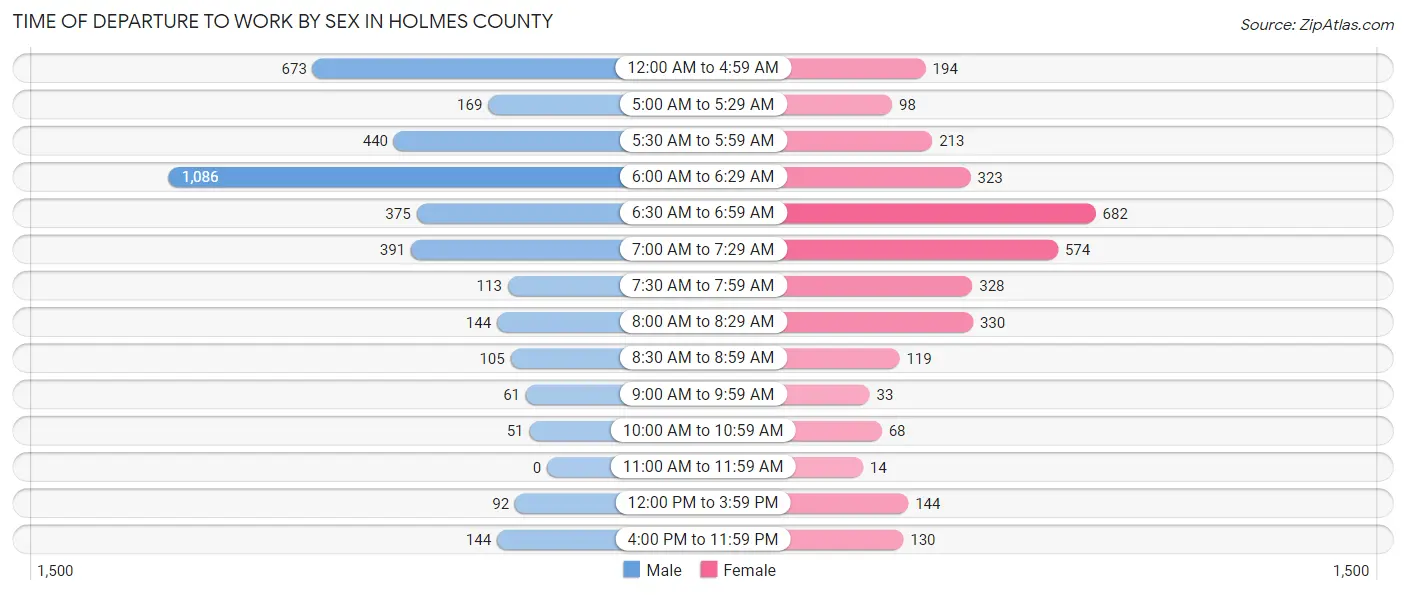
| Time of Departure | Male | Female |
| 12:00 AM to 4:59 AM | 673 (17.5%) | 194 (6.0%) |
| 5:00 AM to 5:29 AM | 169 (4.4%) | 98 (3.0%) |
| 5:30 AM to 5:59 AM | 440 (11.5%) | 213 (6.6%) |
| 6:00 AM to 6:29 AM | 1,086 (28.2%) | 323 (9.9%) |
| 6:30 AM to 6:59 AM | 375 (9.8%) | 682 (21.0%) |
| 7:00 AM to 7:29 AM | 391 (10.2%) | 574 (17.7%) |
| 7:30 AM to 7:59 AM | 113 (2.9%) | 328 (10.1%) |
| 8:00 AM to 8:29 AM | 144 (3.7%) | 330 (10.2%) |
| 8:30 AM to 8:59 AM | 105 (2.7%) | 119 (3.7%) |
| 9:00 AM to 9:59 AM | 61 (1.6%) | 33 (1.0%) |
| 10:00 AM to 10:59 AM | 51 (1.3%) | 68 (2.1%) |
| 11:00 AM to 11:59 AM | 0 (0.0%) | 14 (0.4%) |
| 12:00 PM to 3:59 PM | 92 (2.4%) | 144 (4.4%) |
| 4:00 PM to 11:59 PM | 144 (3.7%) | 130 (4.0%) |
| Total | 3,844 (100.0%) | 3,250 (100.0%) |
Housing Occupancy in Holmes County
Occupancy by Ownership in Holmes County
Of the total 7,069 dwellings in Holmes County, owner-occupied units account for 5,409 (76.5%), while renter-occupied units make up 1,660 (23.5%).
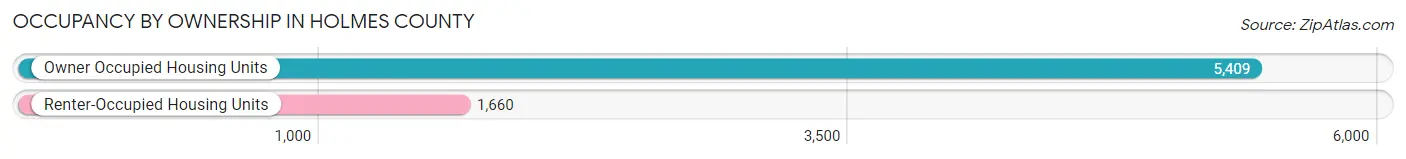
| Occupancy | # Housing Units | % Housing Units |
| Owner Occupied Housing Units | 5,409 | 76.5% |
| Renter-Occupied Housing Units | 1,660 | 23.5% |
| Total Occupied Housing Units | 7,069 | 100.0% |
Occupancy by Household Size in Holmes County
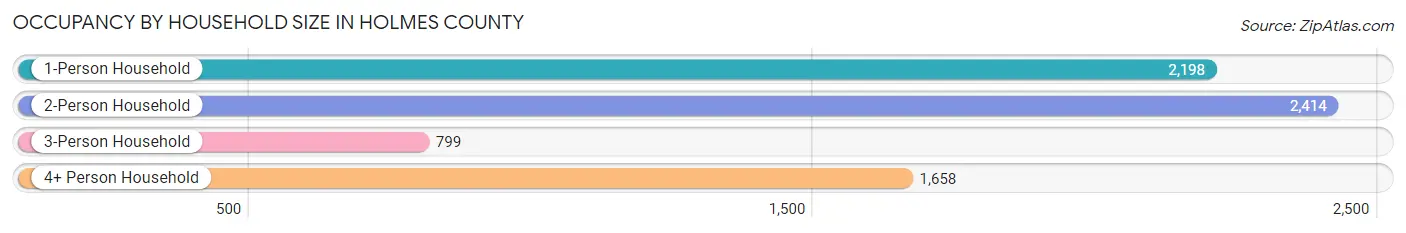
| Household Size | # Housing Units | % Housing Units |
| 1-Person Household | 2,198 | 31.1% |
| 2-Person Household | 2,414 | 34.2% |
| 3-Person Household | 799 | 11.3% |
| 4+ Person Household | 1,658 | 23.4% |
| Total Housing Units | 7,069 | 100.0% |
Occupancy by Ownership by Household Size in Holmes County
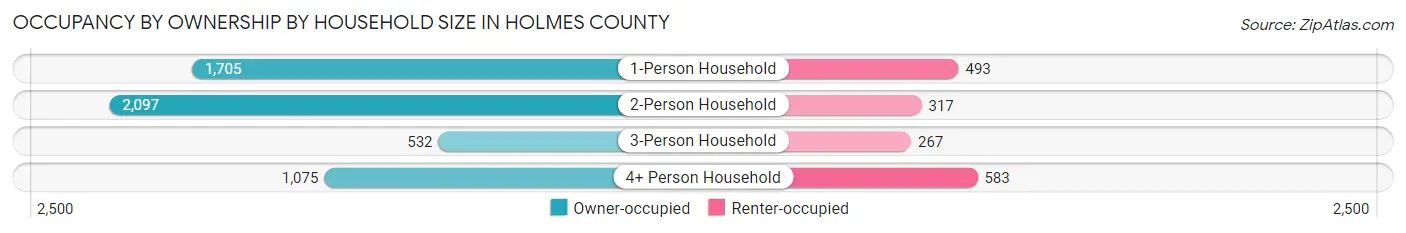
| Household Size | Owner-occupied | Renter-occupied |
| 1-Person Household | 1,705 (77.6%) | 493 (22.4%) |
| 2-Person Household | 2,097 (86.9%) | 317 (13.1%) |
| 3-Person Household | 532 (66.6%) | 267 (33.4%) |
| 4+ Person Household | 1,075 (64.8%) | 583 (35.2%) |
| Total Housing Units | 5,409 (76.5%) | 1,660 (23.5%) |
Occupancy by Educational Attainment in Holmes County
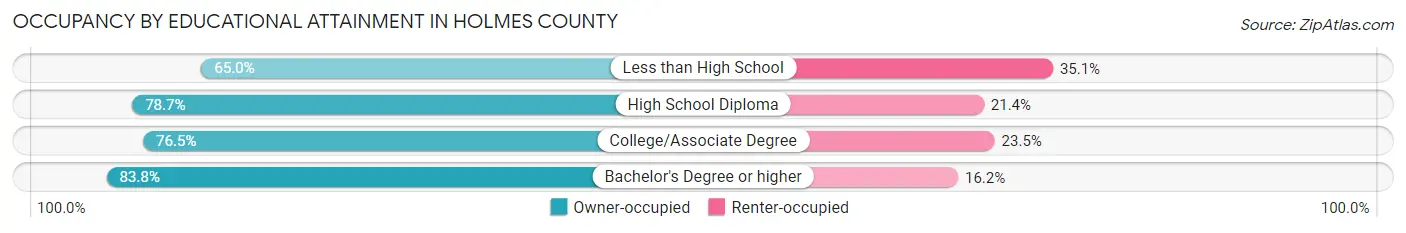
| Household Size | Owner-occupied | Renter-occupied |
| Less than High School | 743 (64.9%) | 401 (35.0%) |
| High School Diploma | 2,273 (78.6%) | 617 (21.3%) |
| College/Associate Degree | 1,573 (76.5%) | 483 (23.5%) |
| Bachelor's Degree or higher | 820 (83.8%) | 159 (16.2%) |
Occupancy by Age of Householder in Holmes County
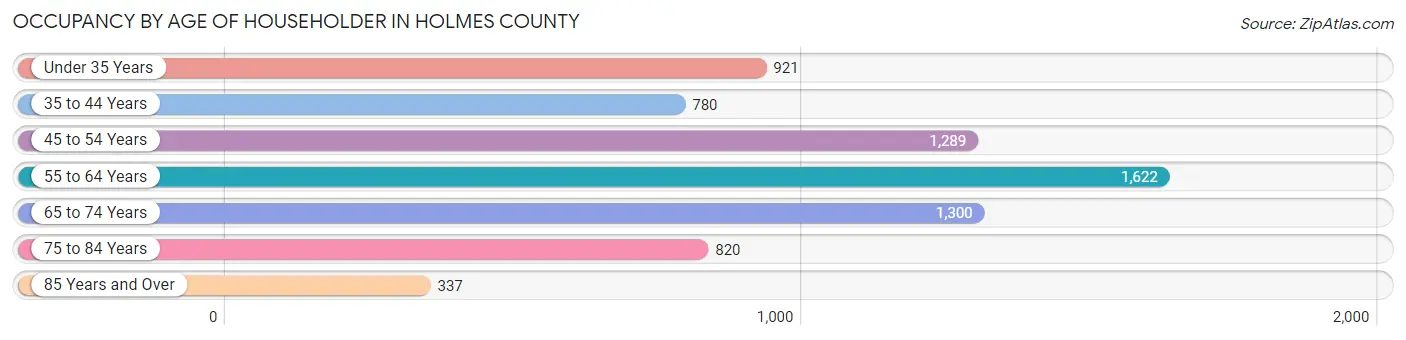
| Age Bracket | # Households | % Households |
| Under 35 Years | 921 | 13.0% |
| 35 to 44 Years | 780 | 11.0% |
| 45 to 54 Years | 1,289 | 18.2% |
| 55 to 64 Years | 1,622 | 23.0% |
| 65 to 74 Years | 1,300 | 18.4% |
| 75 to 84 Years | 820 | 11.6% |
| 85 Years and Over | 337 | 4.8% |
| Total | 7,069 | 100.0% |
Housing Finances in Holmes County
Median Income by Occupancy in Holmes County
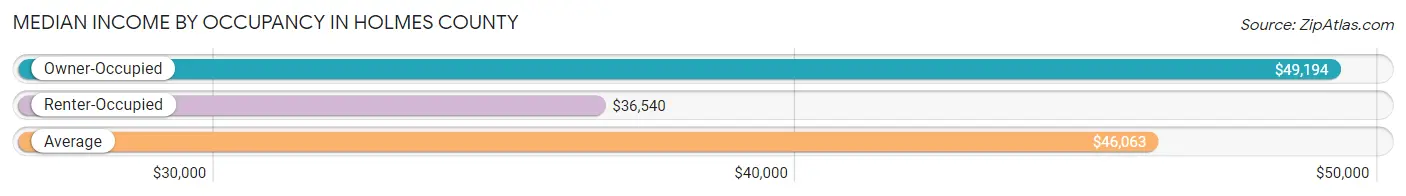
| Occupancy Type | # Households | Median Income |
| Owner-Occupied | 5,409 (76.5%) | $49,194 |
| Renter-Occupied | 1,660 (23.5%) | $36,540 |
| Average | 7,069 (100.0%) | $46,063 |
Occupancy by Householder Income Bracket in Holmes County
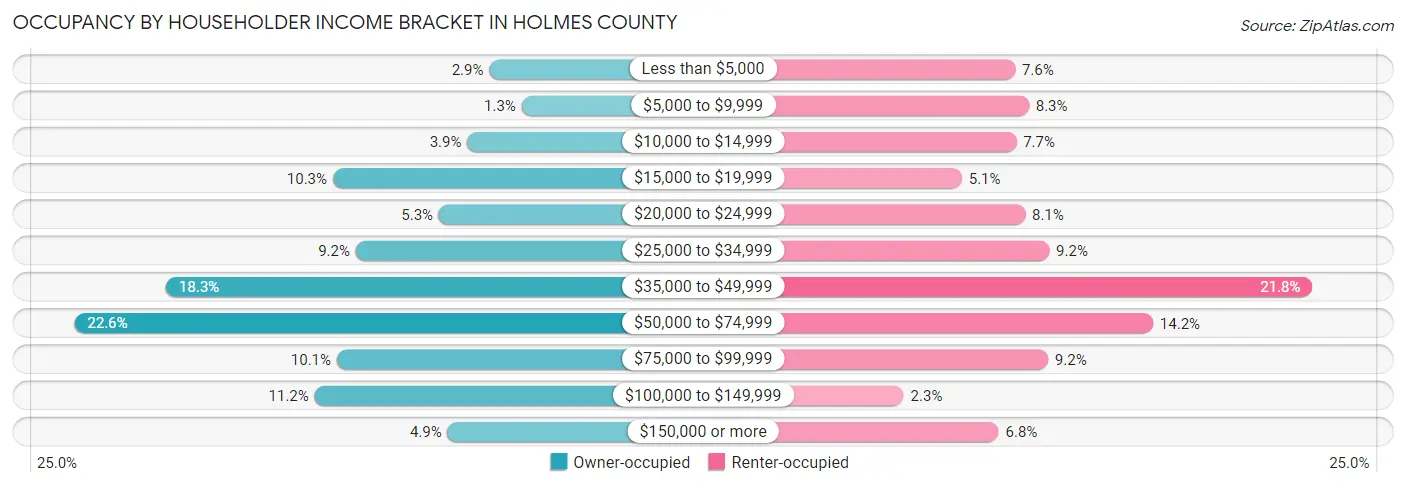
| Income Bracket | Owner-occupied | Renter-occupied |
| Less than $5,000 | 155 (2.9%) | 126 (7.6%) |
| $5,000 to $9,999 | 72 (1.3%) | 137 (8.3%) |
| $10,000 to $14,999 | 212 (3.9%) | 127 (7.6%) |
| $15,000 to $19,999 | 558 (10.3%) | 84 (5.1%) |
| $20,000 to $24,999 | 285 (5.3%) | 134 (8.1%) |
| $25,000 to $34,999 | 499 (9.2%) | 153 (9.2%) |
| $35,000 to $49,999 | 988 (18.3%) | 361 (21.7%) |
| $50,000 to $74,999 | 1,224 (22.6%) | 235 (14.2%) |
| $75,000 to $99,999 | 548 (10.1%) | 152 (9.2%) |
| $100,000 to $149,999 | 605 (11.2%) | 38 (2.3%) |
| $150,000 or more | 263 (4.9%) | 113 (6.8%) |
| Total | 5,409 (100.0%) | 1,660 (100.0%) |
Monthly Housing Cost Tiers in Holmes County
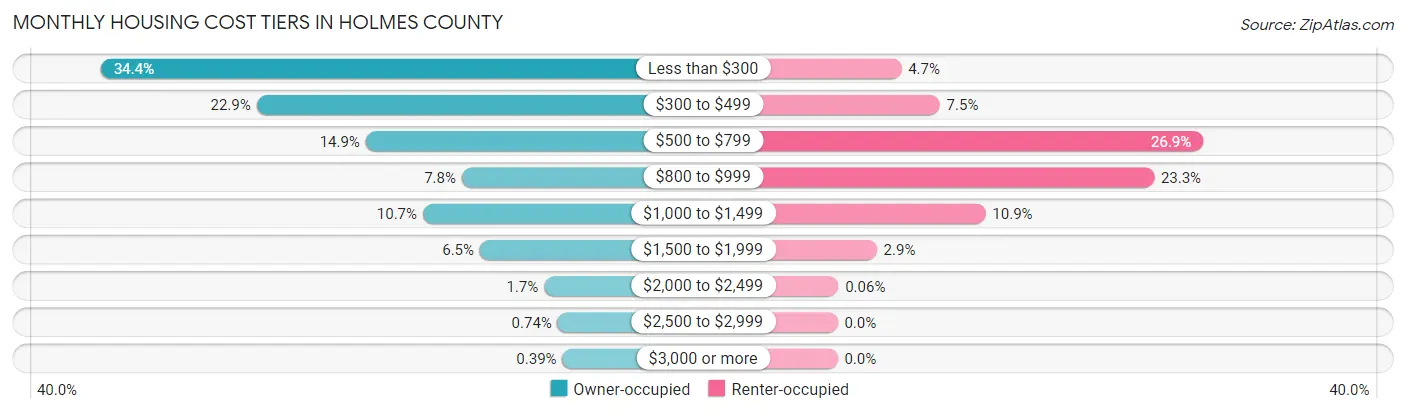
| Monthly Cost | Owner-occupied | Renter-occupied |
| Less than $300 | 1,860 (34.4%) | 78 (4.7%) |
| $300 to $499 | 1,240 (22.9%) | 125 (7.5%) |
| $500 to $799 | 805 (14.9%) | 447 (26.9%) |
| $800 to $999 | 422 (7.8%) | 387 (23.3%) |
| $1,000 to $1,499 | 577 (10.7%) | 181 (10.9%) |
| $1,500 to $1,999 | 350 (6.5%) | 48 (2.9%) |
| $2,000 to $2,499 | 94 (1.7%) | 1 (0.1%) |
| $2,500 to $2,999 | 40 (0.7%) | 0 (0.0%) |
| $3,000 or more | 21 (0.4%) | 0 (0.0%) |
| Total | 5,409 (100.0%) | 1,660 (100.0%) |
Physical Housing Characteristics in Holmes County
Housing Structures in Holmes County
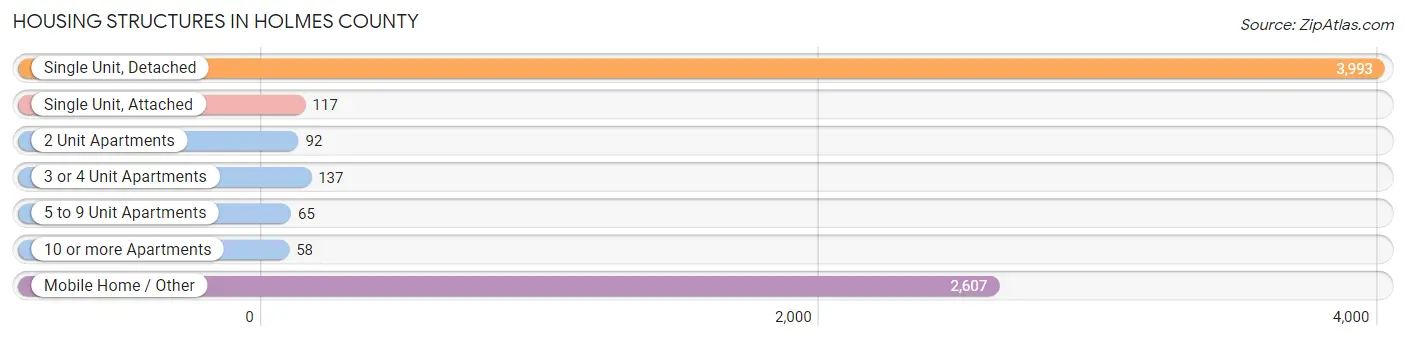
| Structure Type | # Housing Units | % Housing Units |
| Single Unit, Detached | 3,993 | 56.5% |
| Single Unit, Attached | 117 | 1.7% |
| 2 Unit Apartments | 92 | 1.3% |
| 3 or 4 Unit Apartments | 137 | 1.9% |
| 5 to 9 Unit Apartments | 65 | 0.9% |
| 10 or more Apartments | 58 | 0.8% |
| Mobile Home / Other | 2,607 | 36.9% |
| Total | 7,069 | 100.0% |
Housing Structures by Occupancy in Holmes County
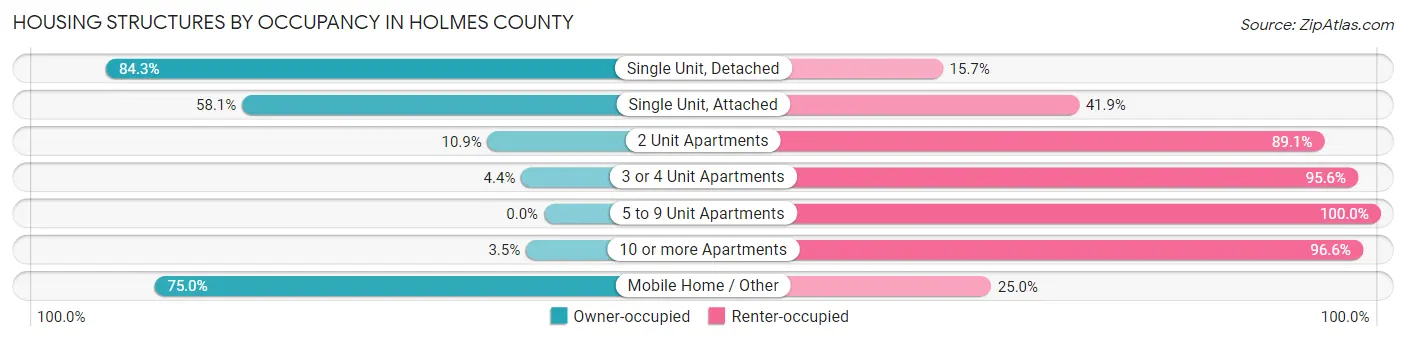
| Structure Type | Owner-occupied | Renter-occupied |
| Single Unit, Detached | 3,367 (84.3%) | 626 (15.7%) |
| Single Unit, Attached | 68 (58.1%) | 49 (41.9%) |
| 2 Unit Apartments | 10 (10.9%) | 82 (89.1%) |
| 3 or 4 Unit Apartments | 6 (4.4%) | 131 (95.6%) |
| 5 to 9 Unit Apartments | 0 (0.0%) | 65 (100.0%) |
| 10 or more Apartments | 2 (3.5%) | 56 (96.6%) |
| Mobile Home / Other | 1,956 (75.0%) | 651 (25.0%) |
| Total | 5,409 (76.5%) | 1,660 (23.5%) |
Housing Structures by Number of Rooms in Holmes County
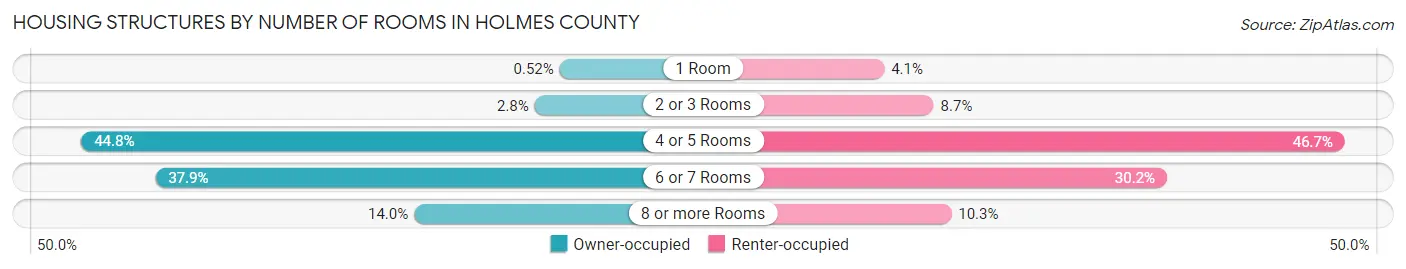
| Number of Rooms | Owner-occupied | Renter-occupied |
| 1 Room | 28 (0.5%) | 68 (4.1%) |
| 2 or 3 Rooms | 153 (2.8%) | 144 (8.7%) |
| 4 or 5 Rooms | 2,421 (44.8%) | 775 (46.7%) |
| 6 or 7 Rooms | 2,051 (37.9%) | 502 (30.2%) |
| 8 or more Rooms | 756 (14.0%) | 171 (10.3%) |
| Total | 5,409 (100.0%) | 1,660 (100.0%) |
Housing Structure by Heating Type in Holmes County
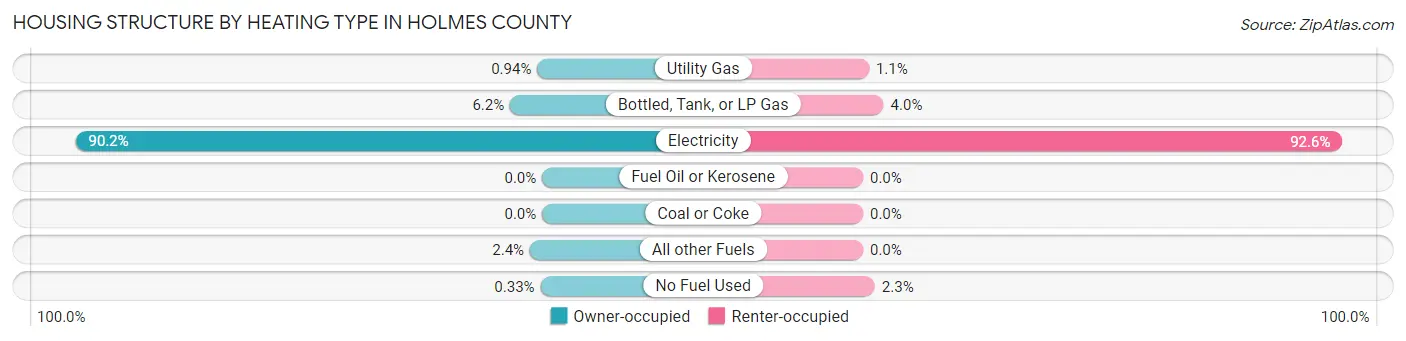
| Heating Type | Owner-occupied | Renter-occupied |
| Utility Gas | 51 (0.9%) | 19 (1.1%) |
| Bottled, Tank, or LP Gas | 335 (6.2%) | 66 (4.0%) |
| Electricity | 4,878 (90.2%) | 1,537 (92.6%) |
| Fuel Oil or Kerosene | 0 (0.0%) | 0 (0.0%) |
| Coal or Coke | 0 (0.0%) | 0 (0.0%) |
| All other Fuels | 127 (2.4%) | 0 (0.0%) |
| No Fuel Used | 18 (0.3%) | 38 (2.3%) |
| Total | 5,409 (100.0%) | 1,660 (100.0%) |
Household Vehicle Usage in Holmes County
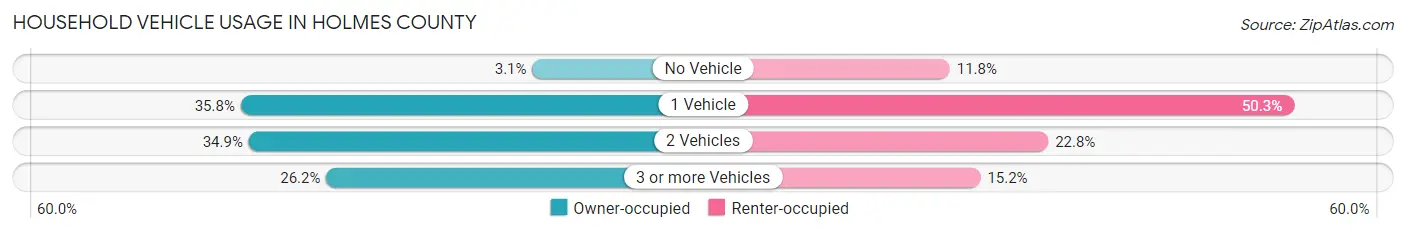
| Vehicles per Household | Owner-occupied | Renter-occupied |
| No Vehicle | 169 (3.1%) | 195 (11.7%) |
| 1 Vehicle | 1,936 (35.8%) | 835 (50.3%) |
| 2 Vehicles | 1,887 (34.9%) | 378 (22.8%) |
| 3 or more Vehicles | 1,417 (26.2%) | 252 (15.2%) |
| Total | 5,409 (100.0%) | 1,660 (100.0%) |
Real Estate & Mortgages in Holmes County
Real Estate and Mortgage Overview in Holmes County
| Characteristic | Without Mortgage | With Mortgage |
| Housing Units | 3,631 | 1,778 |
| Median Property Value | $80,100 | $140,200 |
| Median Household Income | $41,867 | $97 |
| Monthly Housing Costs | $295 | $19 |
| Real Estate Taxes | $451 | $296 |
Property Value by Mortgage Status in Holmes County
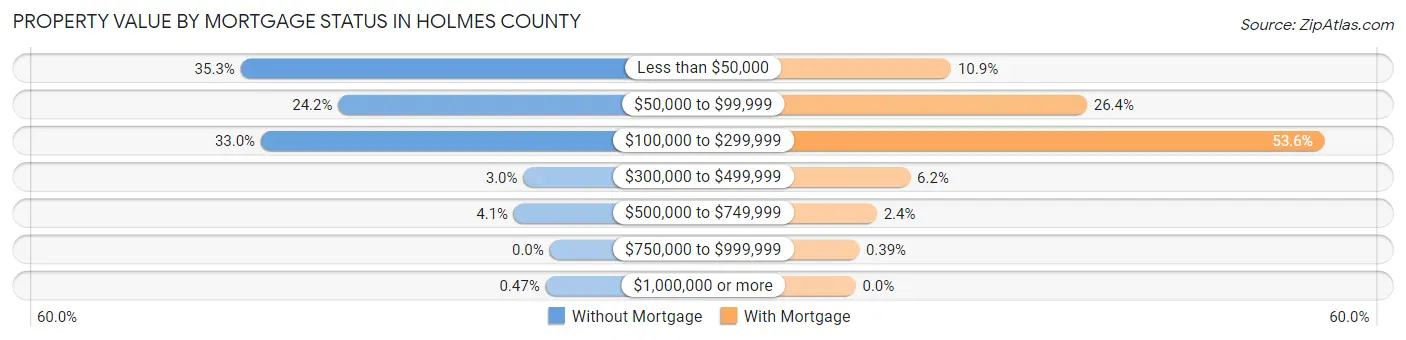
| Property Value | Without Mortgage | With Mortgage |
| Less than $50,000 | 1,282 (35.3%) | 194 (10.9%) |
| $50,000 to $99,999 | 877 (24.1%) | 470 (26.4%) |
| $100,000 to $299,999 | 1,198 (33.0%) | 953 (53.6%) |
| $300,000 to $499,999 | 109 (3.0%) | 111 (6.2%) |
| $500,000 to $749,999 | 148 (4.1%) | 43 (2.4%) |
| $750,000 to $999,999 | 0 (0.0%) | 7 (0.4%) |
| $1,000,000 or more | 17 (0.5%) | 0 (0.0%) |
| Total | 3,631 (100.0%) | 1,778 (100.0%) |
Household Income by Mortgage Status in Holmes County
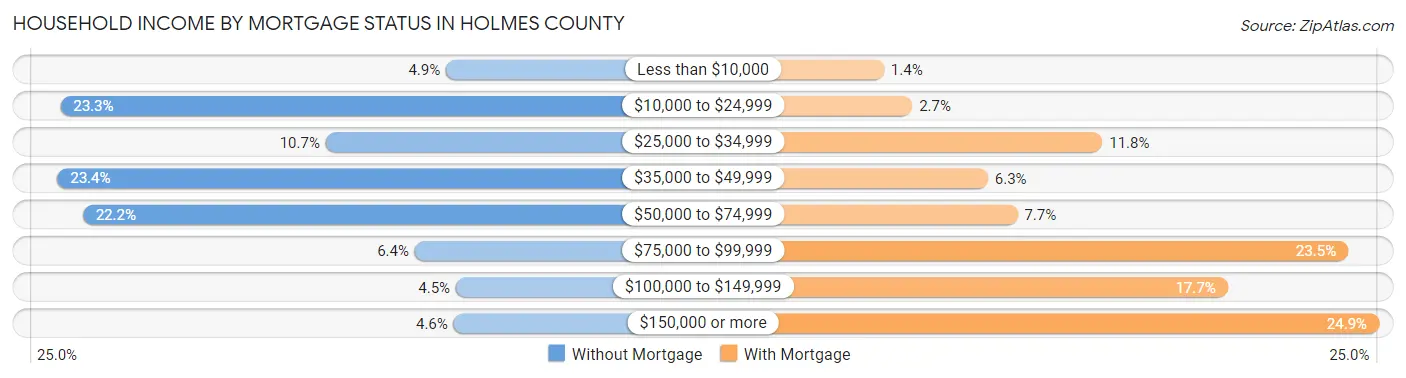
| Household Income | Without Mortgage | With Mortgage |
| Less than $10,000 | 179 (4.9%) | 24 (1.3%) |
| $10,000 to $24,999 | 846 (23.3%) | 48 (2.7%) |
| $25,000 to $34,999 | 387 (10.7%) | 209 (11.7%) |
| $35,000 to $49,999 | 851 (23.4%) | 112 (6.3%) |
| $50,000 to $74,999 | 807 (22.2%) | 137 (7.7%) |
| $75,000 to $99,999 | 233 (6.4%) | 417 (23.4%) |
| $100,000 to $149,999 | 162 (4.5%) | 315 (17.7%) |
| $150,000 or more | 166 (4.6%) | 443 (24.9%) |
| Total | 3,631 (100.0%) | 1,778 (100.0%) |
Property Value to Household Income Ratio in Holmes County
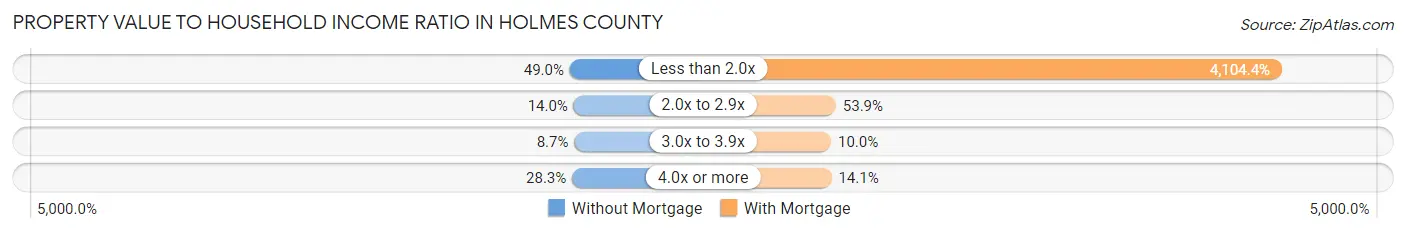
| Value-to-Income Ratio | Without Mortgage | With Mortgage |
| Less than 2.0x | 1,779 (49.0%) | 72,976 (4,104.4%) |
| 2.0x to 2.9x | 508 (14.0%) | 959 (53.9%) |
| 3.0x to 3.9x | 315 (8.7%) | 178 (10.0%) |
| 4.0x or more | 1,026 (28.3%) | 251 (14.1%) |
| Total | 3,631 (100.0%) | 1,778 (100.0%) |
Real Estate Taxes by Mortgage Status in Holmes County
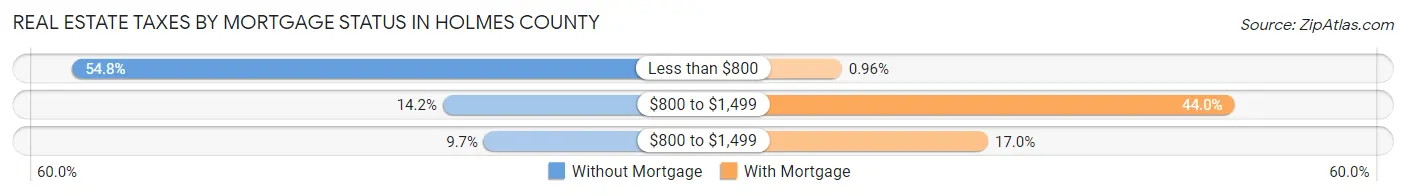
| Property Taxes | Without Mortgage | With Mortgage |
| Less than $800 | 1,989 (54.8%) | 17 (1.0%) |
| $800 to $1,499 | 515 (14.2%) | 782 (44.0%) |
| $800 to $1,499 | 351 (9.7%) | 302 (17.0%) |
| Total | 3,631 (100.0%) | 1,778 (100.0%) |
Health & Disability in Holmes County
Health Insurance Coverage by Age in Holmes County
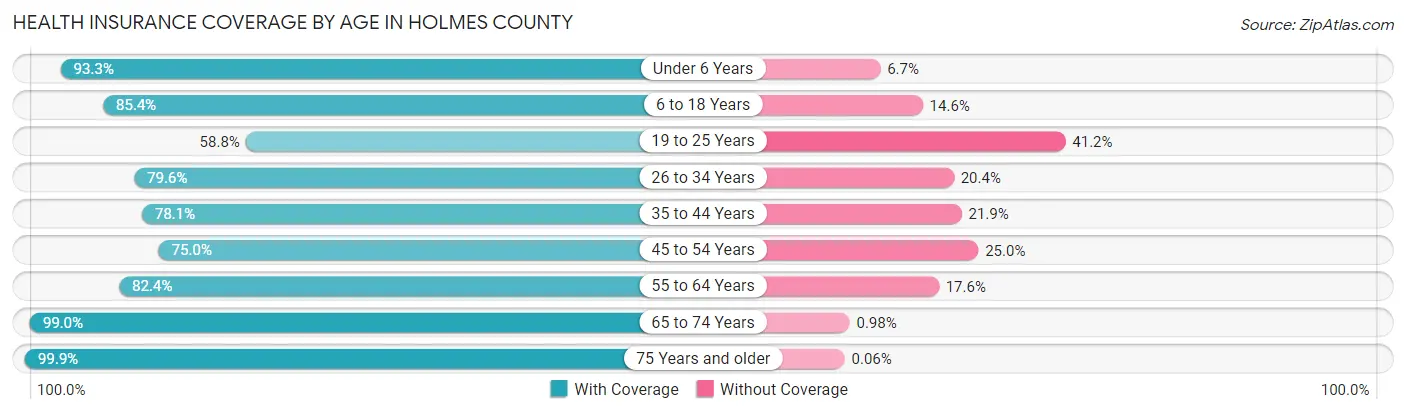
| Age Bracket | With Coverage | Without Coverage |
| Under 6 Years | 1,087 (93.3%) | 78 (6.7%) |
| 6 to 18 Years | 2,584 (85.4%) | 442 (14.6%) |
| 19 to 25 Years | 787 (58.8%) | 552 (41.2%) |
| 26 to 34 Years | 1,458 (79.6%) | 374 (20.4%) |
| 35 to 44 Years | 1,419 (78.1%) | 397 (21.9%) |
| 45 to 54 Years | 1,793 (75.0%) | 597 (25.0%) |
| 55 to 64 Years | 2,063 (82.4%) | 441 (17.6%) |
| 65 to 74 Years | 2,115 (99.0%) | 21 (1.0%) |
| 75 Years and older | 1,599 (99.9%) | 1 (0.1%) |
| Total | 14,905 (83.7%) | 2,903 (16.3%) |
Health Insurance Coverage by Citizenship Status in Holmes County
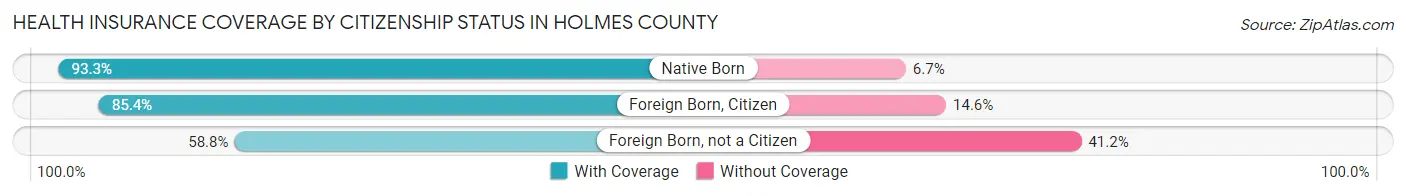
| Citizenship Status | With Coverage | Without Coverage |
| Native Born | 1,087 (93.3%) | 78 (6.7%) |
| Foreign Born, Citizen | 2,584 (85.4%) | 442 (14.6%) |
| Foreign Born, not a Citizen | 787 (58.8%) | 552 (41.2%) |
Health Insurance Coverage by Household Income in Holmes County
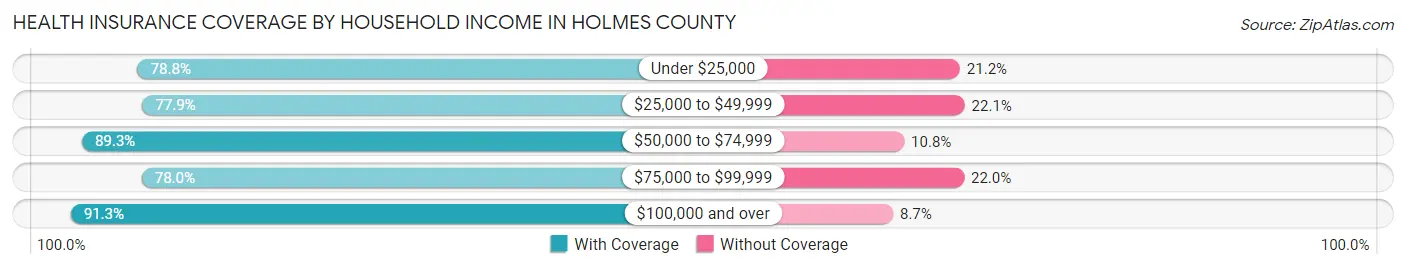
| Household Income | With Coverage | Without Coverage |
| Under $25,000 | 2,596 (78.8%) | 698 (21.2%) |
| $25,000 to $49,999 | 3,419 (77.9%) | 969 (22.1%) |
| $50,000 to $74,999 | 3,369 (89.2%) | 406 (10.7%) |
| $75,000 to $99,999 | 1,656 (78.0%) | 466 (22.0%) |
| $100,000 and over | 3,838 (91.3%) | 364 (8.7%) |
Public vs Private Health Insurance Coverage by Age in Holmes County
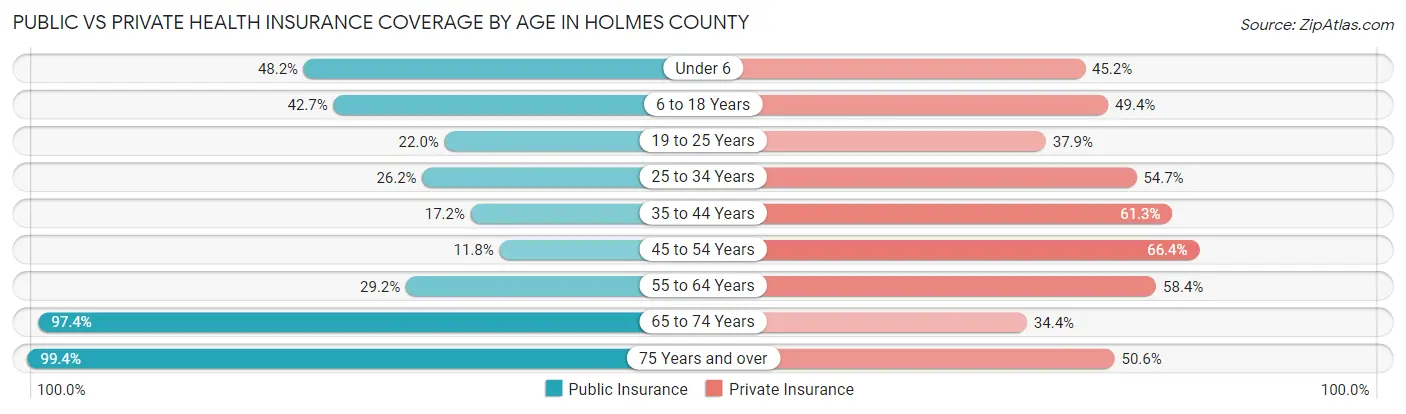
| Age Bracket | Public Insurance | Private Insurance |
| Under 6 | 561 (48.1%) | 526 (45.2%) |
| 6 to 18 Years | 1,291 (42.7%) | 1,496 (49.4%) |
| 19 to 25 Years | 295 (22.0%) | 507 (37.9%) |
| 25 to 34 Years | 479 (26.2%) | 1,002 (54.7%) |
| 35 to 44 Years | 312 (17.2%) | 1,114 (61.3%) |
| 45 to 54 Years | 283 (11.8%) | 1,586 (66.4%) |
| 55 to 64 Years | 731 (29.2%) | 1,461 (58.4%) |
| 65 to 74 Years | 2,081 (97.4%) | 734 (34.4%) |
| 75 Years and over | 1,591 (99.4%) | 810 (50.6%) |
| Total | 7,624 (42.8%) | 9,236 (51.9%) |
Disability Status by Sex by Age in Holmes County
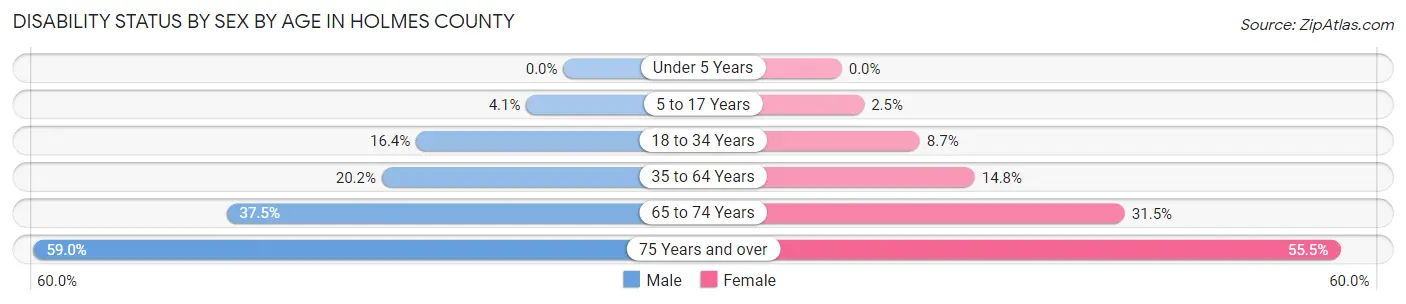
| Age Bracket | Male | Female |
| Under 5 Years | 0 (0.0%) | 0 (0.0%) |
| 5 to 17 Years | 63 (4.1%) | 37 (2.5%) |
| 18 to 34 Years | 296 (16.4%) | 137 (8.7%) |
| 35 to 64 Years | 661 (20.2%) | 510 (14.8%) |
| 65 to 74 Years | 386 (37.5%) | 349 (31.5%) |
| 75 Years and over | 439 (59.0%) | 475 (55.5%) |
Disability Class by Sex by Age in Holmes County
Disability Class: Hearing Difficulty
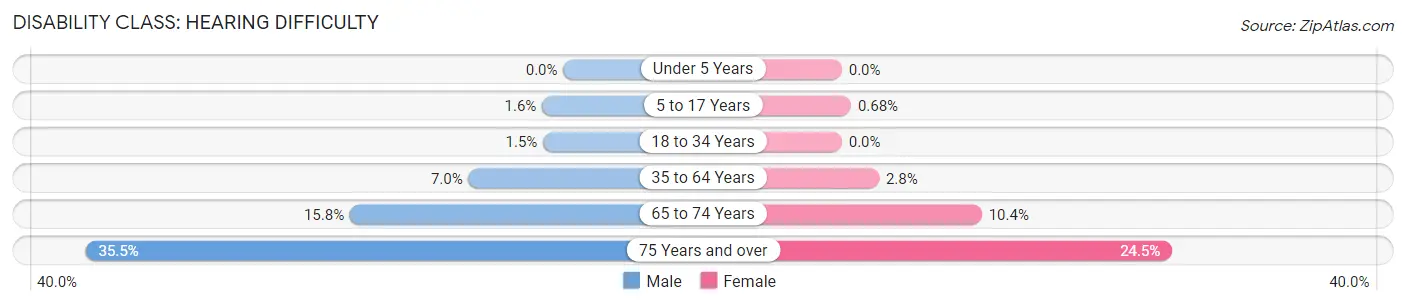
| Age Bracket | Male | Female |
| Under 5 Years | 0 (0.0%) | 0 (0.0%) |
| 5 to 17 Years | 24 (1.6%) | 10 (0.7%) |
| 18 to 34 Years | 27 (1.5%) | 0 (0.0%) |
| 35 to 64 Years | 230 (7.0%) | 95 (2.8%) |
| 65 to 74 Years | 163 (15.8%) | 115 (10.4%) |
| 75 Years and over | 264 (35.5%) | 210 (24.5%) |
Disability Class: Vision Difficulty
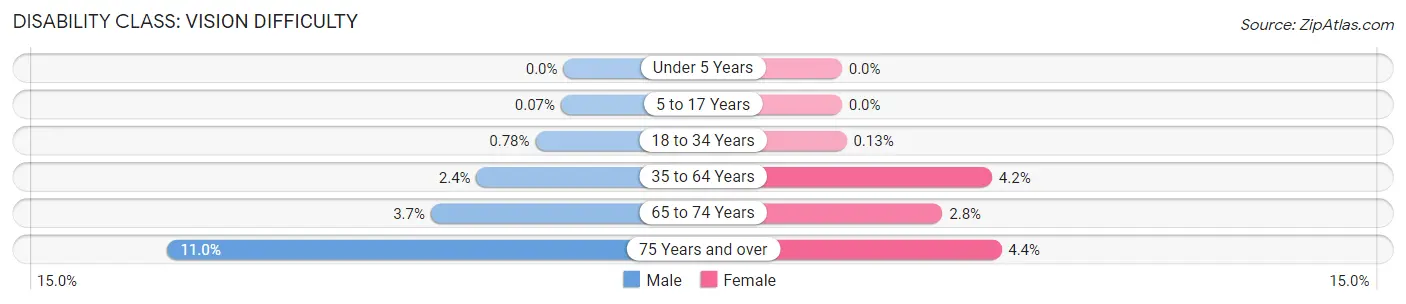
| Age Bracket | Male | Female |
| Under 5 Years | 0 (0.0%) | 0 (0.0%) |
| 5 to 17 Years | 1 (0.1%) | 0 (0.0%) |
| 18 to 34 Years | 14 (0.8%) | 2 (0.1%) |
| 35 to 64 Years | 79 (2.4%) | 144 (4.2%) |
| 65 to 74 Years | 38 (3.7%) | 31 (2.8%) |
| 75 Years and over | 82 (11.0%) | 38 (4.4%) |
Disability Class: Cognitive Difficulty
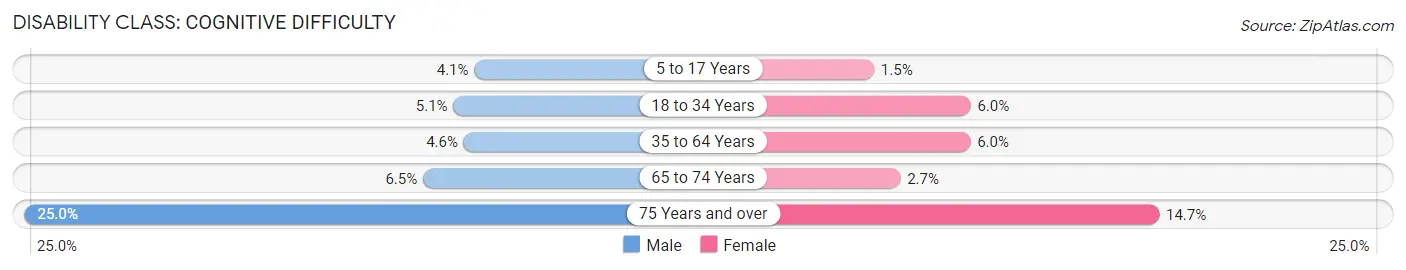
| Age Bracket | Male | Female |
| 5 to 17 Years | 63 (4.1%) | 22 (1.5%) |
| 18 to 34 Years | 92 (5.1%) | 94 (6.0%) |
| 35 to 64 Years | 151 (4.6%) | 205 (6.0%) |
| 65 to 74 Years | 67 (6.5%) | 30 (2.7%) |
| 75 Years and over | 186 (25.0%) | 126 (14.7%) |
Disability Class: Ambulatory Difficulty
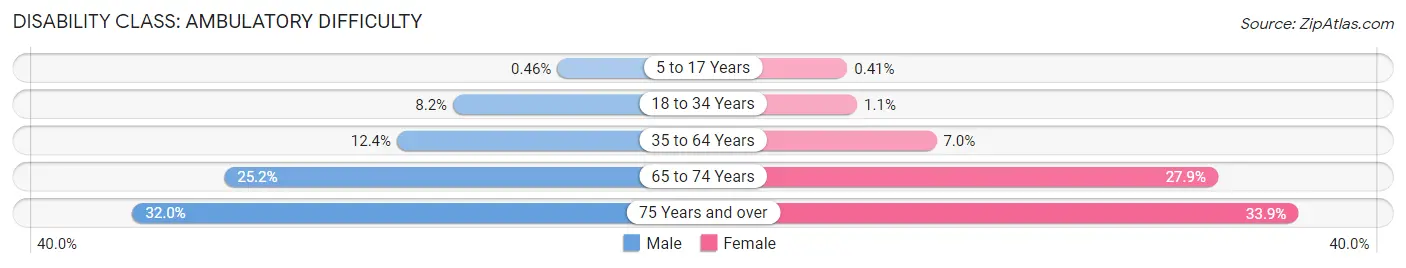
| Age Bracket | Male | Female |
| 5 to 17 Years | 7 (0.5%) | 6 (0.4%) |
| 18 to 34 Years | 148 (8.2%) | 18 (1.1%) |
| 35 to 64 Years | 404 (12.4%) | 242 (7.0%) |
| 65 to 74 Years | 259 (25.2%) | 309 (27.9%) |
| 75 Years and over | 238 (32.0%) | 290 (33.9%) |
Disability Class: Self-Care Difficulty
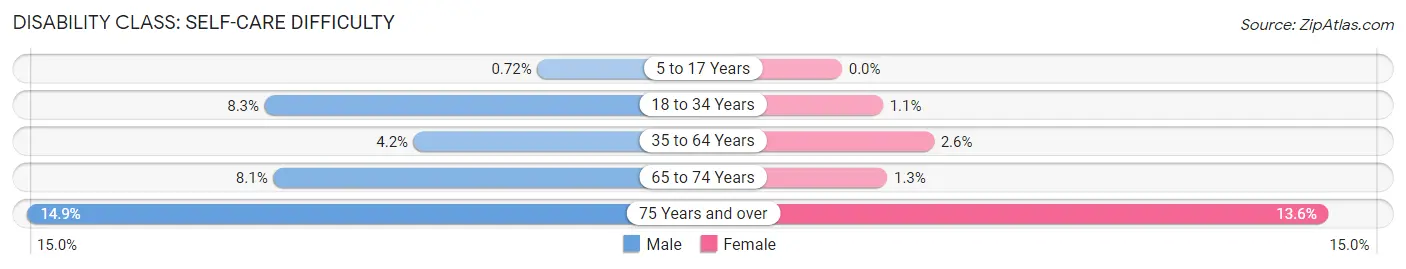
| Age Bracket | Male | Female |
| 5 to 17 Years | 11 (0.7%) | 0 (0.0%) |
| 18 to 34 Years | 150 (8.3%) | 18 (1.1%) |
| 35 to 64 Years | 136 (4.2%) | 88 (2.6%) |
| 65 to 74 Years | 83 (8.1%) | 14 (1.3%) |
| 75 Years and over | 111 (14.9%) | 116 (13.6%) |
Technology Access in Holmes County
Computing Device Access in Holmes County
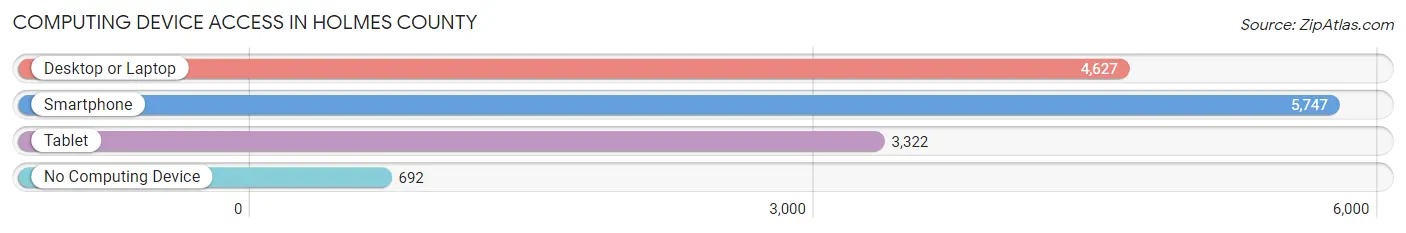
| Device Type | # Households | % Households |
| Desktop or Laptop | 4,627 | 65.4% |
| Smartphone | 5,747 | 81.3% |
| Tablet | 3,322 | 47.0% |
| No Computing Device | 692 | 9.8% |
| Total | 7,069 | 100.0% |
Internet Access in Holmes County
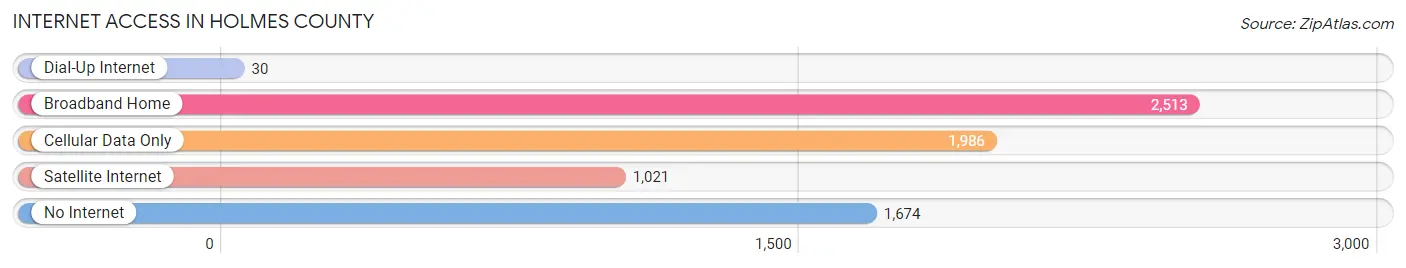
| Internet Type | # Households | % Households |
| Dial-Up Internet | 30 | 0.4% |
| Broadband Home | 2,513 | 35.5% |
| Cellular Data Only | 1,986 | 28.1% |
| Satellite Internet | 1,021 | 14.4% |
| No Internet | 1,674 | 23.7% |
| Total | 7,069 | 100.0% |
Holmes County Summary
Holmes County is located in the Florida Panhandle, in the northwest corner of the state. It is bordered by Washington County to the north, Jackson County to the east, Walton County to the south, and Okaloosa County to the west. The county seat is Bonifay, and the largest city is Ponce de Leon. The county was created in 1848 and named for Major John W. Holmes, a soldier in the Second Seminole War.
Geography
Holmes County covers an area of 590 square miles, making it the second-smallest county in Florida. The terrain is mostly flat, with some rolling hills in the northern part of the county. The Choctawhatchee River forms the western boundary of the county, and the Nokuse and Yellow Rivers flow through the county. The county is mostly rural, with the majority of the land used for agriculture.
Demographics
As of the 2010 census, Holmes County had a population of 19,927. The racial makeup of the county was 79.2% White, 17.7% African American, 0.4% Native American, 0.3% Asian, 0.1% Pacific Islander, 1.2% from other races, and 1.1% from two or more races. Hispanic or Latino of any race were 3.2% of the population.
The median household income was $30,945, and the median family income was $37,945. The per capita income was $15,945. About 18.2% of the population was below the poverty line.
Economy
Agriculture is the main economic activity in Holmes County. The county is the leading producer of peanuts in the state, and is also a major producer of cotton, corn, soybeans, and hay. Other agricultural products include pecans, watermelons, and cantaloupes.
The county is also home to several manufacturing companies, including a paper mill, a wood products plant, and a plastics plant. Tourism is also an important part of the economy, with visitors coming to the county to enjoy its natural beauty and outdoor activities.
History
Holmes County was created in 1848 from parts of Washington and Jackson Counties. It was named for Major John W. Holmes, a soldier in the Second Seminole War. The county seat was originally located in Cerro Gordo, but was moved to Bonifay in 1882.
The county was largely agricultural in the 19th century, with cotton, corn, and peanuts being the main crops. The timber industry also played an important role in the economy, with the county being home to several sawmills.
In the early 20th century, the county began to diversify its economy, with the establishment of several manufacturing companies. The county also began to attract tourists, with visitors coming to enjoy the natural beauty of the area.
Today, Holmes County is a rural county with a strong agricultural base. The county is also home to several manufacturing companies, and tourism is an important part of the economy.
Common Questions
What is Per Capita Income in Holmes County?
Per Capita income in Holmes County is $22,860.
What is the Median Family Income in Holmes County?
Median Family Income in Holmes County is $55,802.
What is the Median Household income in Holmes County?
Median Household Income in Holmes County is $46,063.
What is Income or Wage Gap in Holmes County?
Income or Wage Gap in Holmes County is 13.3%.
Women in Holmes County earn 86.7 cents for every dollar earned by a man.
What is Family Income Deficit in Holmes County?
Family Income Deficit in Holmes County is $9,229.
Families that are below poverty line in Holmes County earn $9,229 less on average than the poverty threshold level.
What is Inequality or Gini Index in Holmes County?
Inequality or Gini Index in Holmes County is 0.43.
What is the Total Population of Holmes County?
Total Population of Holmes County is 19,529.
What is the Total Male Population of Holmes County?
Total Male Population of Holmes County is 10,451.
What is the Total Female Population of Holmes County?
Total Female Population of Holmes County is 9,078.
What is the Ratio of Males per 100 Females in Holmes County?
There are 115.12 Males per 100 Females in Holmes County.
What is the Ratio of Females per 100 Males in Holmes County?
There are 86.86 Females per 100 Males in Holmes County.
What is the Median Population Age in Holmes County?
Median Population Age in Holmes County is 41.0 Years.
What is the Average Family Size in Holmes County
Average Family Size in Holmes County is 3.1 People.
What is the Average Household Size in Holmes County
Average Household Size in Holmes County is 2.5 People.
How Large is the Labor Force in Holmes County?
There are 7,940 People in the Labor Forcein in Holmes County.
What is the Percentage of People in the Labor Force in Holmes County?
49.3% of People are in the Labor Force in Holmes County.
What is the Unemployment Rate in Holmes County?
Unemployment Rate in Holmes County is 4.7%.