Highlands County, FL Map & Demographics
Highlands County Map
Highlands County Overview
$31,864
PER CAPITA INCOME
$62,914
AVG FAMILY INCOME
$53,679
AVG HOUSEHOLD INCOME
23.4%
WAGE / INCOME GAP [ % ]
76.6¢/ $1
WAGE / INCOME GAP [ $ ]
$10,141
FAMILY INCOME DEFICIT
0.46
INEQUALITY / GINI INDEX
102,339
TOTAL POPULATION
50,232
MALE POPULATION
52,107
FEMALE POPULATION
96.40
MALES / 100 FEMALES
103.73
FEMALES / 100 MALES
54.1
MEDIAN AGE
2.8
AVG FAMILY SIZE
2.2
AVG HOUSEHOLD SIZE
37,933
LABOR FORCE [ PEOPLE ]
43.5%
PERCENT IN LABOR FORCE
6.8%
UNEMPLOYMENT RATE
Highlands County Area Codes
Income in Highlands County
Income Overview in Highlands County
Per Capita Income in Highlands County is $31,864, while median incomes of families and households are $62,914 and $53,679 respectively.
| Characteristic | Number | Measure |
| Per Capita Income | 102,339 | $31,864 |
| Median Family Income | 28,639 | $62,914 |
| Mean Family Income | 28,639 | $81,210 |
| Median Household Income | 44,685 | $53,679 |
| Mean Household Income | 44,685 | $70,660 |
| Income Deficit | 28,639 | $10,141 |
| Wage / Income Gap (%) | 102,339 | 23.35% |
| Wage / Income Gap ($) | 102,339 | 76.65¢ per $1 |
| Gini / Inequality Index | 102,339 | 0.46 |
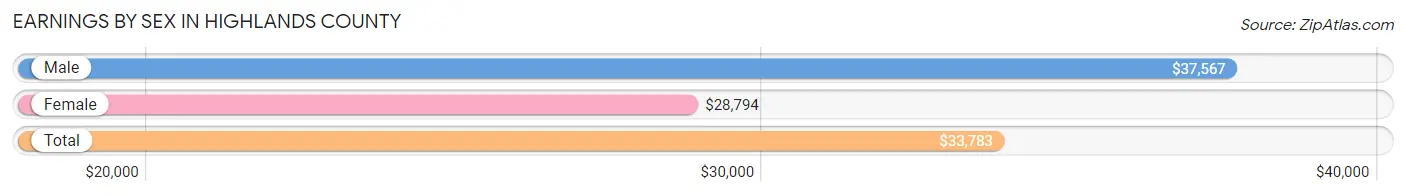
Earnings by Sex in Highlands County
Average Earnings in Highlands County are $33,783, $37,567 for men and $28,794 for women, a difference of 23.4%.
| Sex | Number | Average Earnings |
| Male | 20,645 (51.9%) | $37,567 |
| Female | 19,136 (48.1%) | $28,794 |
| Total | 39,781 (100.0%) | $33,783 |
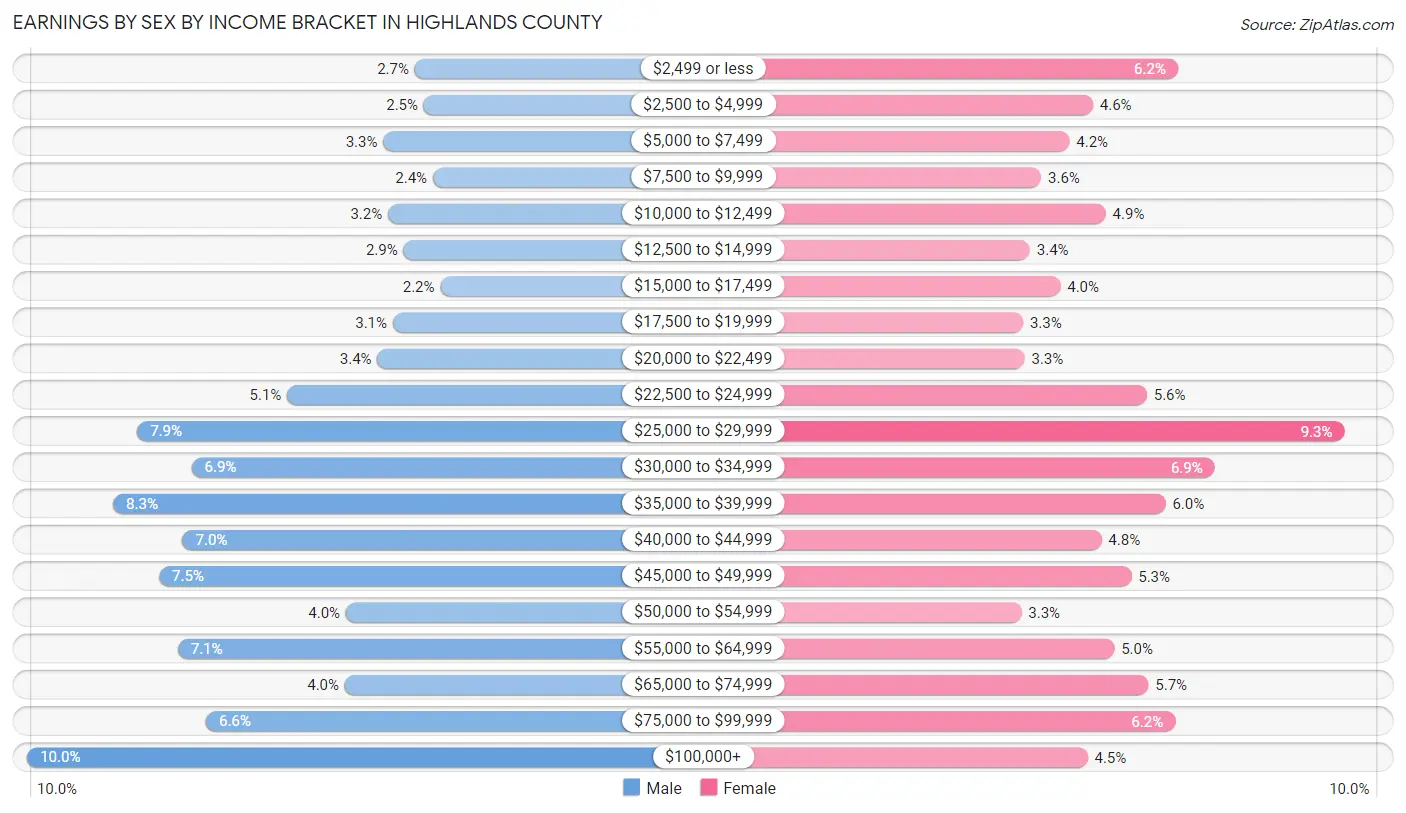
Earnings by Sex by Income Bracket in Highlands County
The most common earnings brackets in Highlands County are $100,000+ for men (2,054 | 10.0%) and $25,000 to $29,999 for women (1,783 | 9.3%).
| Income | Male | Female |
| $2,499 or less | 556 (2.7%) | 1,186 (6.2%) |
| $2,500 to $4,999 | 521 (2.5%) | 882 (4.6%) |
| $5,000 to $7,499 | 678 (3.3%) | 798 (4.2%) |
| $7,500 to $9,999 | 485 (2.4%) | 696 (3.6%) |
| $10,000 to $12,499 | 658 (3.2%) | 928 (4.9%) |
| $12,500 to $14,999 | 598 (2.9%) | 657 (3.4%) |
| $15,000 to $17,499 | 456 (2.2%) | 765 (4.0%) |
| $17,500 to $19,999 | 641 (3.1%) | 632 (3.3%) |
| $20,000 to $22,499 | 700 (3.4%) | 637 (3.3%) |
| $22,500 to $24,999 | 1,048 (5.1%) | 1,075 (5.6%) |
| $25,000 to $29,999 | 1,628 (7.9%) | 1,783 (9.3%) |
| $30,000 to $34,999 | 1,419 (6.9%) | 1,319 (6.9%) |
| $35,000 to $39,999 | 1,721 (8.3%) | 1,142 (6.0%) |
| $40,000 to $44,999 | 1,453 (7.0%) | 912 (4.8%) |
| $45,000 to $49,999 | 1,545 (7.5%) | 1,020 (5.3%) |
| $50,000 to $54,999 | 822 (4.0%) | 625 (3.3%) |
| $55,000 to $64,999 | 1,473 (7.1%) | 958 (5.0%) |
| $65,000 to $74,999 | 826 (4.0%) | 1,081 (5.7%) |
| $75,000 to $99,999 | 1,363 (6.6%) | 1,177 (6.1%) |
| $100,000+ | 2,054 (10.0%) | 863 (4.5%) |
| Total | 20,645 (100.0%) | 19,136 (100.0%) |
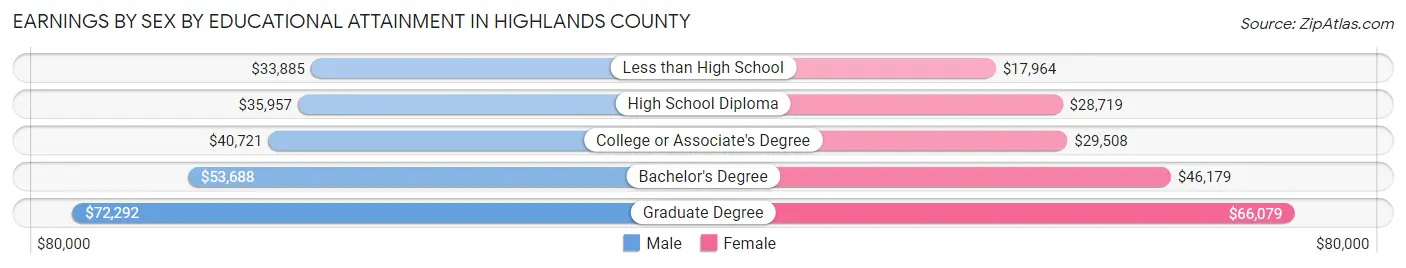
Earnings by Sex by Educational Attainment in Highlands County
Average earnings in Highlands County are $39,530 for men and $31,308 for women, a difference of 20.8%. Men with an educational attainment of graduate degree enjoy the highest average annual earnings of $72,292, while those with less than high school education earn the least with $33,885. Women with an educational attainment of graduate degree earn the most with the average annual earnings of $66,079, while those with less than high school education have the smallest earnings of $17,964.
| Educational Attainment | Male Income | Female Income |
| Less than High School | $33,885 | $17,964 |
| High School Diploma | $35,957 | $28,719 |
| College or Associate's Degree | $40,721 | $29,508 |
| Bachelor's Degree | $53,688 | $46,179 |
| Graduate Degree | $72,292 | $66,079 |
| Total | $39,530 | $31,308 |
Family Income in Highlands County
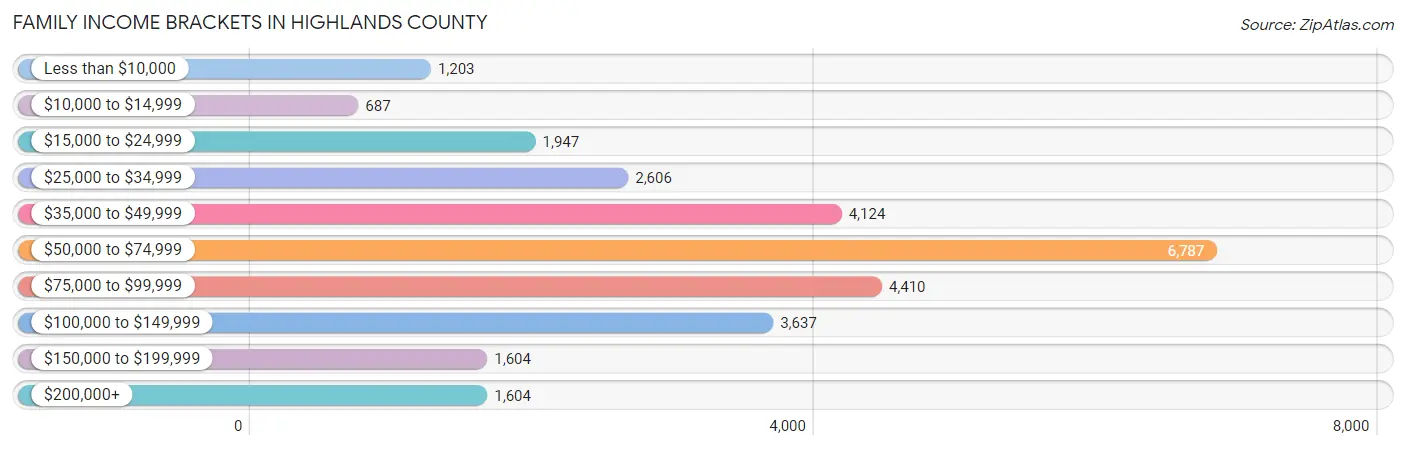
Family Income Brackets in Highlands County
According to the Highlands County family income data, there are 6,787 families falling into the $50,000 to $74,999 income range, which is the most common income bracket and makes up 23.7% of all families. Conversely, the $10,000 to $14,999 income bracket is the least frequent group with only 687 families (2.4%) belonging to this category.
| Income Bracket | # Families | % Families |
| Less than $10,000 | 1,203 | 4.2% |
| $10,000 to $14,999 | 687 | 2.4% |
| $15,000 to $24,999 | 1,947 | 6.8% |
| $25,000 to $34,999 | 2,606 | 9.1% |
| $35,000 to $49,999 | 4,124 | 14.4% |
| $50,000 to $74,999 | 6,787 | 23.7% |
| $75,000 to $99,999 | 4,410 | 15.4% |
| $100,000 to $149,999 | 3,637 | 12.7% |
| $150,000 to $199,999 | 1,604 | 5.6% |
| $200,000+ | 1,604 | 5.6% |
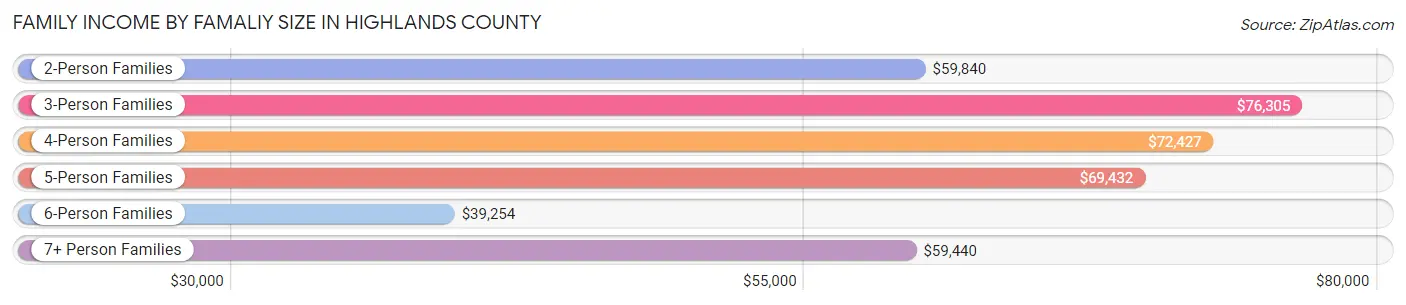
Family Income by Famaliy Size in Highlands County
3-person families (5,494 | 19.2%) account for the highest median family income in Highlands County with $76,305 per family, while 2-person families (17,648 | 61.6%) have the highest median income of $29,920 per family member.
| Income Bracket | # Families | Median Income |
| 2-Person Families | 17,648 (61.6%) | $59,840 |
| 3-Person Families | 5,494 (19.2%) | $76,305 |
| 4-Person Families | 3,337 (11.7%) | $72,427 |
| 5-Person Families | 1,345 (4.7%) | $69,432 |
| 6-Person Families | 613 (2.1%) | $39,254 |
| 7+ Person Families | 202 (0.7%) | $59,440 |
| Total | 28,639 (100.0%) | $62,914 |
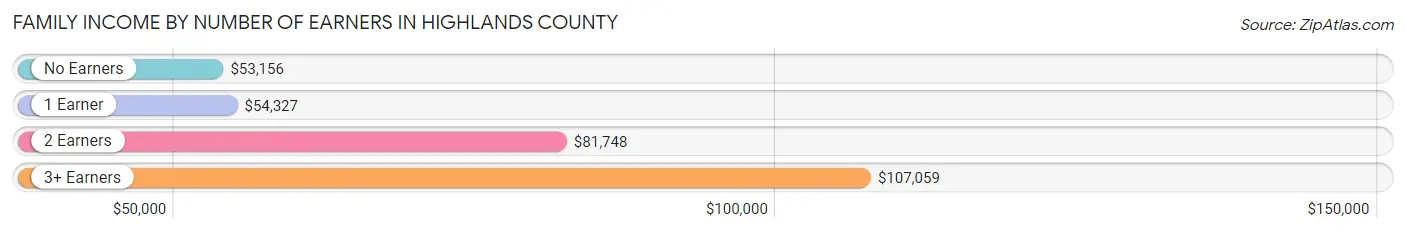
Family Income by Number of Earners in Highlands County
The median family income in Highlands County is $62,914, with families comprising 3+ earners (1,510) having the highest median family income of $107,059, while families with no earners (10,517) have the lowest median family income of $53,156, accounting for 5.3% and 36.7% of families, respectively.
| Number of Earners | # Families | Median Income |
| No Earners | 10,517 (36.7%) | $53,156 |
| 1 Earner | 8,443 (29.5%) | $54,327 |
| 2 Earners | 8,169 (28.5%) | $81,748 |
| 3+ Earners | 1,510 (5.3%) | $107,059 |
| Total | 28,639 (100.0%) | $62,914 |
Household Income in Highlands County
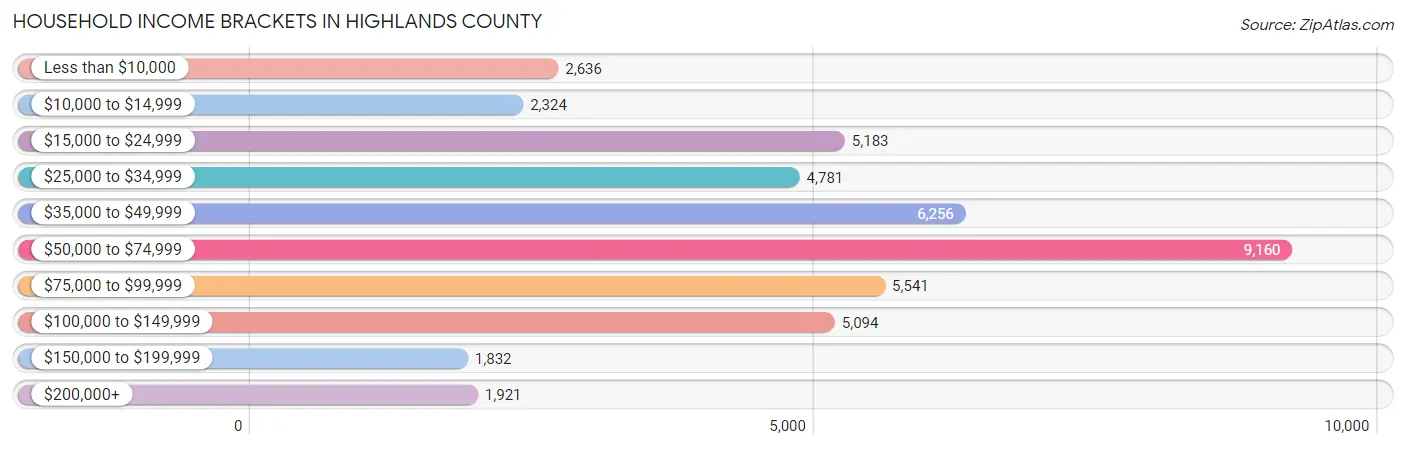
Household Income Brackets in Highlands County
With 9,160 households falling in the category, the $50,000 to $74,999 income range is the most frequent in Highlands County, accounting for 20.5% of all households. In contrast, only 1,832 households (4.1%) fall into the $150,000 to $199,999 income bracket, making it the least populous group.
| Income Bracket | # Households | % Households |
| Less than $10,000 | 2,636 | 5.9% |
| $10,000 to $14,999 | 2,324 | 5.2% |
| $15,000 to $24,999 | 5,183 | 11.6% |
| $25,000 to $34,999 | 4,781 | 10.7% |
| $35,000 to $49,999 | 6,256 | 14.0% |
| $50,000 to $74,999 | 9,160 | 20.5% |
| $75,000 to $99,999 | 5,541 | 12.4% |
| $100,000 to $149,999 | 5,094 | 11.4% |
| $150,000 to $199,999 | 1,832 | 4.1% |
| $200,000+ | 1,921 | 4.3% |
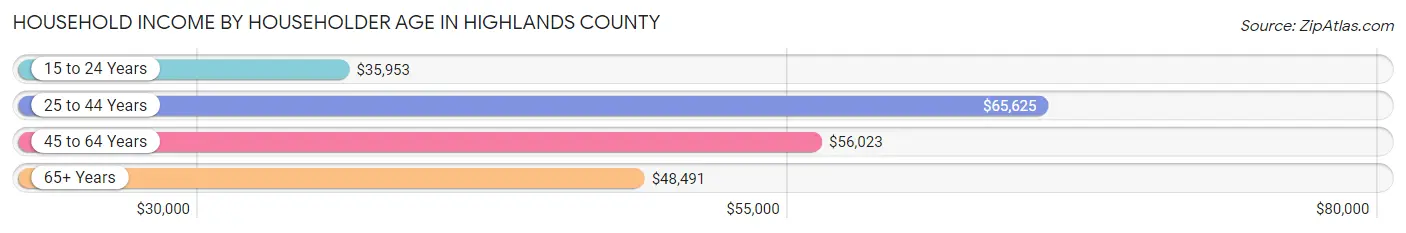
Household Income by Householder Age in Highlands County
The median household income in Highlands County is $53,679, with the highest median household income of $65,625 found in the 25 to 44 years age bracket for the primary householder. A total of 9,104 households (20.4%) fall into this category. Meanwhile, the 15 to 24 years age bracket for the primary householder has the lowest median household income of $35,953, with 731 households (1.6%) in this group.
| Income Bracket | # Households | Median Income |
| 15 to 24 Years | 731 (1.6%) | $35,953 |
| 25 to 44 Years | 9,104 (20.4%) | $65,625 |
| 45 to 64 Years | 12,941 (29.0%) | $56,023 |
| 65+ Years | 21,909 (49.0%) | $48,491 |
| Total | 44,685 (100.0%) | $53,679 |
Poverty in Highlands County
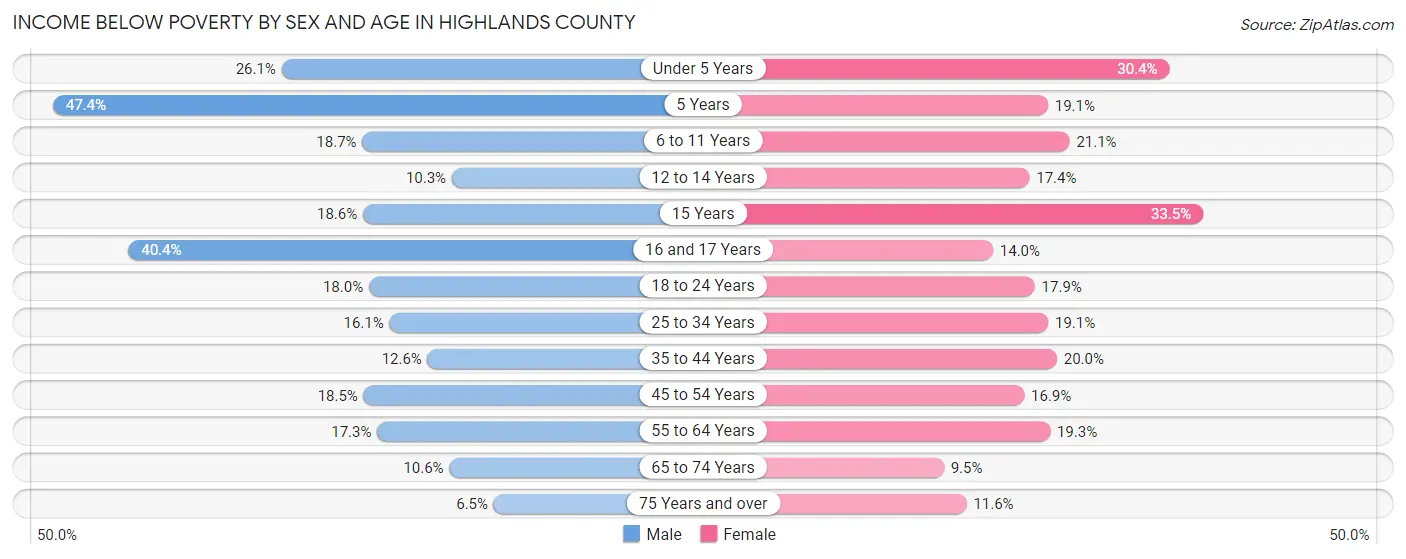
Income Below Poverty by Sex and Age in Highlands County
With 14.9% poverty level for males and 16.4% for females among the residents of Highlands County, 5 year old males and 15 year old females are the most vulnerable to poverty, with 226 males (47.4%) and 181 females (33.5%) in their respective age groups living below the poverty level.
| Age Bracket | Male | Female |
| Under 5 Years | 569 (26.1%) | 616 (30.4%) |
| 5 Years | 226 (47.4%) | 96 (19.1%) |
| 6 to 11 Years | 546 (18.6%) | 518 (21.1%) |
| 12 to 14 Years | 163 (10.3%) | 316 (17.4%) |
| 15 Years | 79 (18.6%) | 181 (33.5%) |
| 16 and 17 Years | 438 (40.4%) | 130 (14.0%) |
| 18 to 24 Years | 559 (18.0%) | 516 (17.9%) |
| 25 to 34 Years | 756 (16.1%) | 862 (19.1%) |
| 35 to 44 Years | 614 (12.6%) | 959 (20.0%) |
| 45 to 54 Years | 905 (18.5%) | 835 (16.9%) |
| 55 to 64 Years | 1,091 (17.3%) | 1,368 (19.3%) |
| 65 to 74 Years | 851 (10.6%) | 870 (9.5%) |
| 75 Years and over | 573 (6.5%) | 1,105 (11.6%) |
| Total | 7,370 (14.9%) | 8,372 (16.4%) |
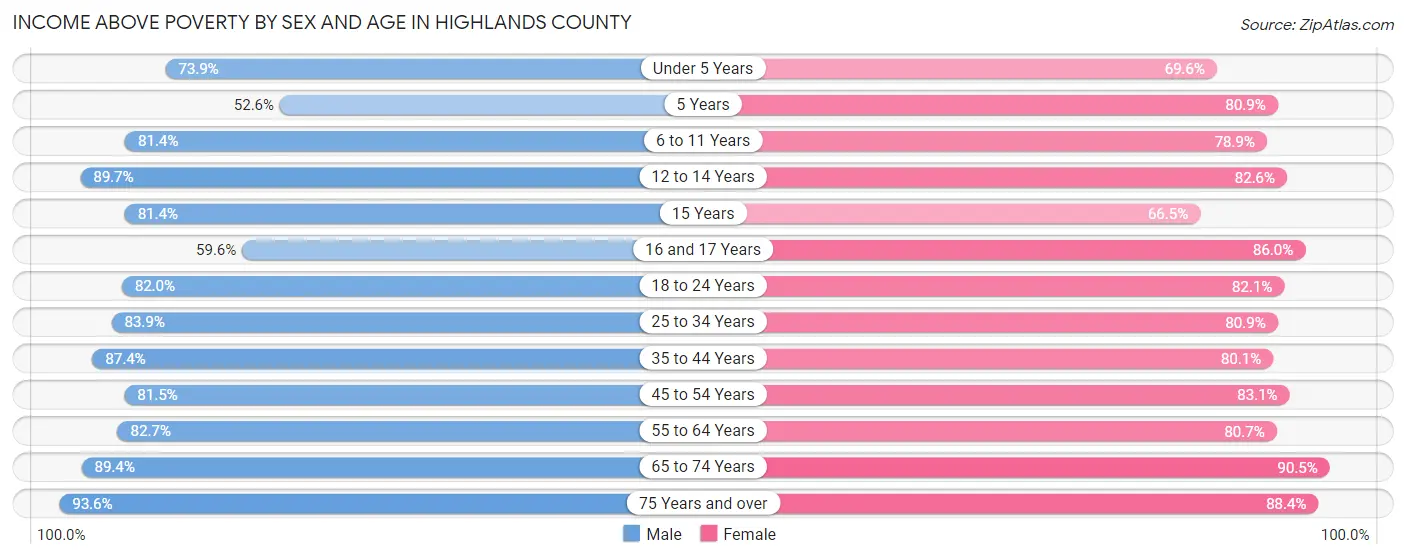
Income Above Poverty by Sex and Age in Highlands County
According to the poverty statistics in Highlands County, males aged 75 years and over and females aged 65 to 74 years are the age groups that are most secure financially, with 93.5% of males and 90.5% of females in these age groups living above the poverty line.
| Age Bracket | Male | Female |
| Under 5 Years | 1,608 (73.9%) | 1,410 (69.6%) |
| 5 Years | 251 (52.6%) | 406 (80.9%) |
| 6 to 11 Years | 2,382 (81.4%) | 1,934 (78.9%) |
| 12 to 14 Years | 1,414 (89.7%) | 1,500 (82.6%) |
| 15 Years | 346 (81.4%) | 359 (66.5%) |
| 16 and 17 Years | 647 (59.6%) | 797 (86.0%) |
| 18 to 24 Years | 2,539 (82.0%) | 2,366 (82.1%) |
| 25 to 34 Years | 3,932 (83.9%) | 3,641 (80.9%) |
| 35 to 44 Years | 4,261 (87.4%) | 3,849 (80.0%) |
| 45 to 54 Years | 3,980 (81.5%) | 4,099 (83.1%) |
| 55 to 64 Years | 5,225 (82.7%) | 5,714 (80.7%) |
| 65 to 74 Years | 7,199 (89.4%) | 8,329 (90.5%) |
| 75 Years and over | 8,317 (93.5%) | 8,443 (88.4%) |
| Total | 42,101 (85.1%) | 42,847 (83.7%) |
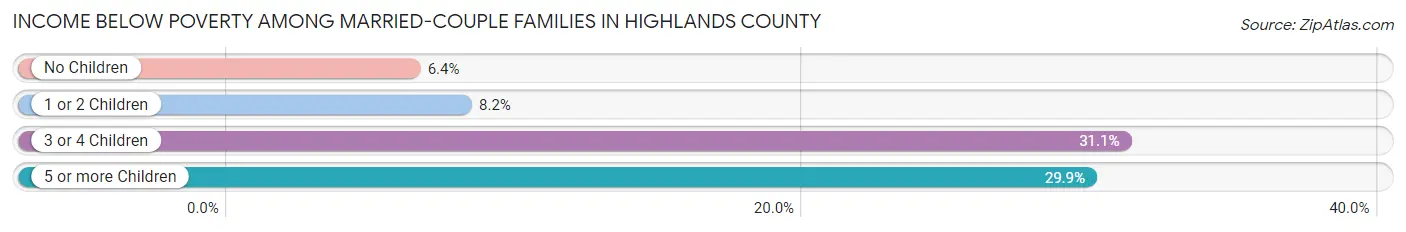
Income Below Poverty Among Married-Couple Families in Highlands County
The poverty statistics for married-couple families in Highlands County show that 8.0% or 1,767 of the total 22,151 families live below the poverty line. Families with 3 or 4 children have the highest poverty rate of 31.1%, comprising of 320 families. On the other hand, families with no children have the lowest poverty rate of 6.4%, which includes 1,047 families.
| Children | Above Poverty | Below Poverty |
| No Children | 15,424 (93.6%) | 1,047 (6.4%) |
| 1 or 2 Children | 4,183 (91.8%) | 371 (8.2%) |
| 3 or 4 Children | 709 (68.9%) | 320 (31.1%) |
| 5 or more Children | 68 (70.1%) | 29 (29.9%) |
| Total | 20,384 (92.0%) | 1,767 (8.0%) |
Income Below Poverty Among Single-Parent Households in Highlands County
According to the poverty data in Highlands County, 8.8% or 166 single-father households and 29.1% or 1,336 single-mother households are living below the poverty line. Among single-father households, those with 3 or 4 children have the highest poverty rate, with 19 households (12.3%) experiencing poverty. Likewise, among single-mother households, those with 5 or more children have the highest poverty rate, with 27 households (100.0%) falling below the poverty line.
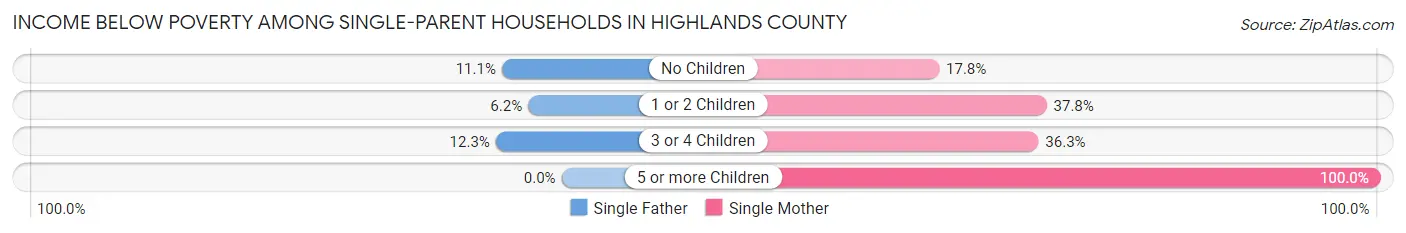
| Children | Single Father | Single Mother |
| No Children | 88 (11.1%) | 366 (17.8%) |
| 1 or 2 Children | 59 (6.2%) | 799 (37.8%) |
| 3 or 4 Children | 19 (12.3%) | 144 (36.3%) |
| 5 or more Children | 0 (0.0%) | 27 (100.0%) |
| Total | 166 (8.8%) | 1,336 (29.1%) |
Income Below Poverty Among Married-Couple vs Single-Parent Households in Highlands County
The poverty data for Highlands County shows that 1,767 of the married-couple family households (8.0%) and 1,502 of the single-parent households (23.2%) are living below the poverty level. Within the married-couple family households, those with 3 or 4 children have the highest poverty rate, with 320 households (31.1%) falling below the poverty line. Among the single-parent households, those with 5 or more children have the highest poverty rate, with 27 household (100.0%) living below poverty.
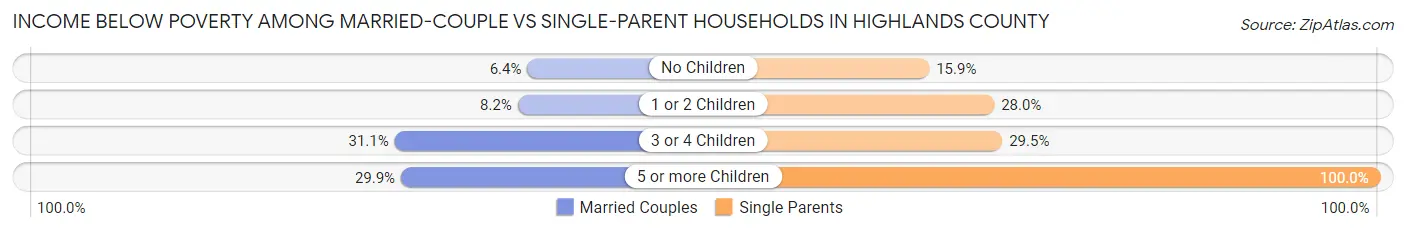
| Children | Married-Couple Families | Single-Parent Households |
| No Children | 1,047 (6.4%) | 454 (15.9%) |
| 1 or 2 Children | 371 (8.2%) | 858 (28.0%) |
| 3 or 4 Children | 320 (31.1%) | 163 (29.5%) |
| 5 or more Children | 29 (29.9%) | 27 (100.0%) |
| Total | 1,767 (8.0%) | 1,502 (23.2%) |
Race in Highlands County
The most populous races in Highlands County are White / Caucasian (76,633 | 74.9%), Hispanic or Latino (22,050 | 21.5%), and Black / African American (9,380 | 9.2%).
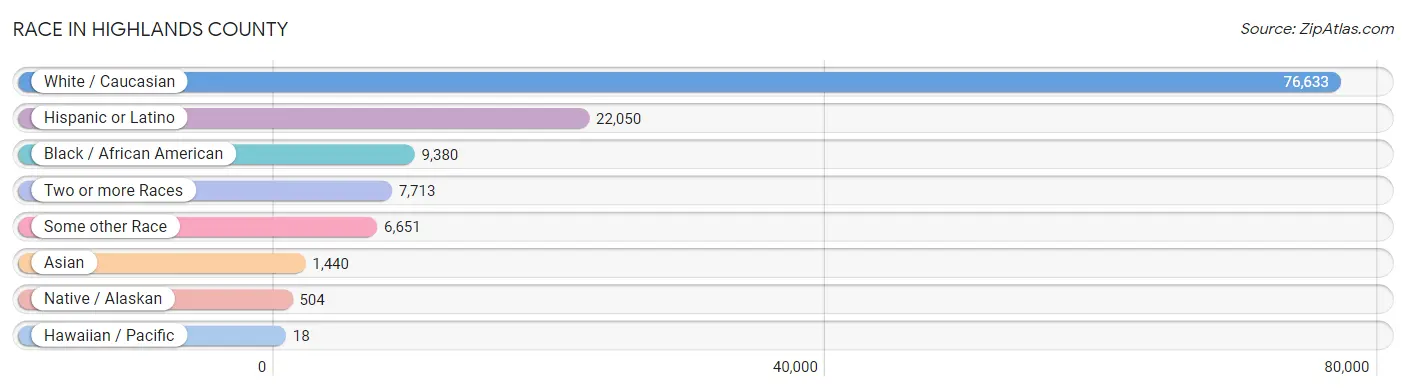
| Race | # Population | % Population |
| Asian | 1,440 | 1.4% |
| Black / African American | 9,380 | 9.2% |
| Hawaiian / Pacific | 18 | 0.0% |
| Hispanic or Latino | 22,050 | 21.5% |
| Native / Alaskan | 504 | 0.5% |
| White / Caucasian | 76,633 | 74.9% |
| Two or more Races | 7,713 | 7.5% |
| Some other Race | 6,651 | 6.5% |
| Total | 102,339 | 100.0% |
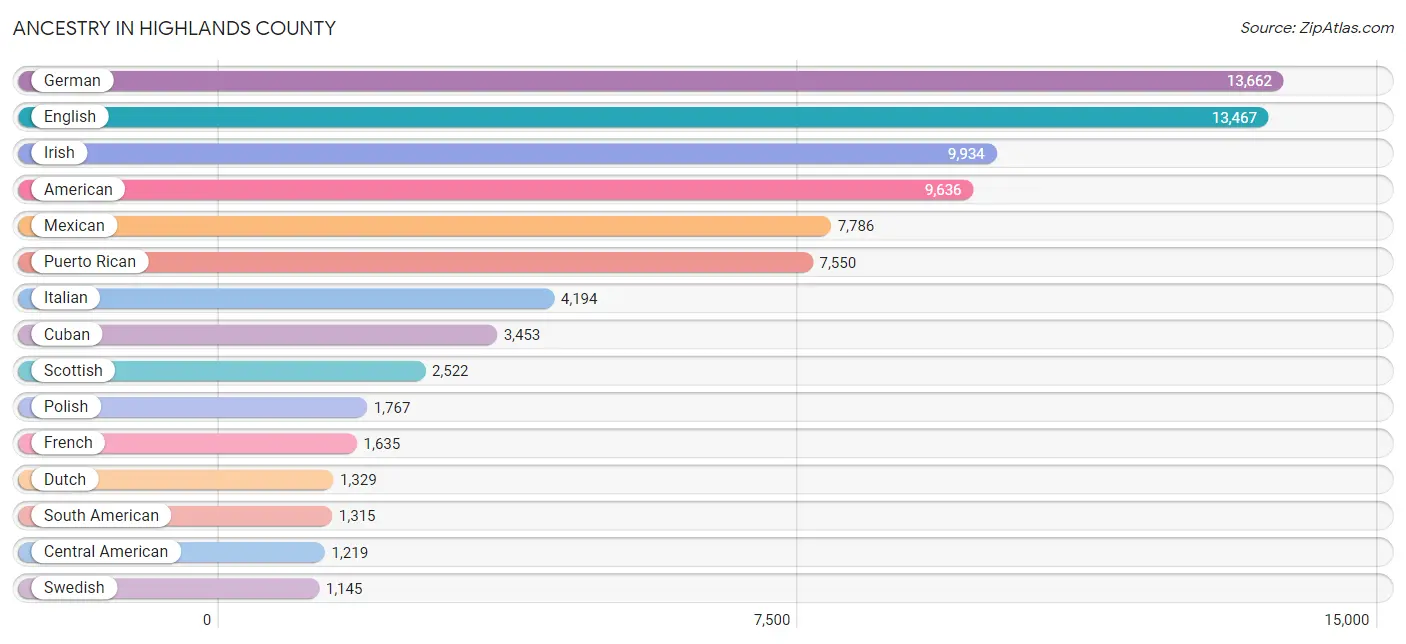
Ancestry in Highlands County
The most populous ancestries reported in Highlands County are German (13,662 | 13.4%), English (13,467 | 13.2%), Irish (9,934 | 9.7%), American (9,636 | 9.4%), and Mexican (7,786 | 7.6%), together accounting for 53.2% of all Highlands County residents.
| Ancestry | # Population | % Population |
| Afghan | 7 | 0.0% |
| African | 241 | 0.2% |
| American | 9,636 | 9.4% |
| Arab | 167 | 0.2% |
| Argentinean | 141 | 0.1% |
| Armenian | 13 | 0.0% |
| Assyrian / Chaldean / Syriac | 11 | 0.0% |
| Australian | 12 | 0.0% |
| Austrian | 176 | 0.2% |
| Bahamian | 87 | 0.1% |
| Bangladeshi | 31 | 0.0% |
| Belgian | 69 | 0.1% |
| Bermudan | 4 | 0.0% |
| Bhutanese | 104 | 0.1% |
| Blackfeet | 63 | 0.1% |
| Brazilian | 55 | 0.1% |
| British | 434 | 0.4% |
| British West Indian | 13 | 0.0% |
| Burmese | 64 | 0.1% |
| Cajun | 12 | 0.0% |
| Canadian | 354 | 0.4% |
| Cape Verdean | 8 | 0.0% |
| Central American | 1,219 | 1.2% |
| Central American Indian | 200 | 0.2% |
| Cherokee | 249 | 0.2% |
| Choctaw | 33 | 0.0% |
| Colombian | 882 | 0.9% |
| Costa Rican | 196 | 0.2% |
| Creek | 51 | 0.1% |
| Croatian | 55 | 0.1% |
| Cuban | 3,453 | 3.4% |
| Czech | 229 | 0.2% |
| Czechoslovakian | 104 | 0.1% |
| Danish | 225 | 0.2% |
| Delaware | 10 | 0.0% |
| Dominican | 359 | 0.4% |
| Dutch | 1,329 | 1.3% |
| Eastern European | 88 | 0.1% |
| Ecuadorian | 103 | 0.1% |
| Egyptian | 40 | 0.0% |
| English | 13,467 | 13.2% |
| Estonian | 13 | 0.0% |
| European | 797 | 0.8% |
| Filipino | 43 | 0.0% |
| Finnish | 238 | 0.2% |
| French | 1,635 | 1.6% |
| French American Indian | 63 | 0.1% |
| French Canadian | 642 | 0.6% |
| German | 13,662 | 13.4% |
| German Russian | 67 | 0.1% |
| Ghanaian | 9 | 0.0% |
| Greek | 473 | 0.5% |
| Guamanian / Chamorro | 20 | 0.0% |
| Guatemalan | 108 | 0.1% |
| Haitian | 578 | 0.6% |
| Honduran | 44 | 0.0% |
| Hungarian | 306 | 0.3% |
| Indian (Asian) | 134 | 0.1% |
| Inupiat | 16 | 0.0% |
| Irish | 9,934 | 9.7% |
| Iroquois | 15 | 0.0% |
| Israeli | 8 | 0.0% |
| Italian | 4,194 | 4.1% |
| Jamaican | 915 | 0.9% |
| Korean | 903 | 0.9% |
| Latvian | 28 | 0.0% |
| Lebanese | 77 | 0.1% |
| Lithuanian | 68 | 0.1% |
| Lumbee | 3 | 0.0% |
| Macedonian | 8 | 0.0% |
| Maltese | 14 | 0.0% |
| Mexican | 7,786 | 7.6% |
| Mexican American Indian | 121 | 0.1% |
| Mongolian | 3 | 0.0% |
| Native Hawaiian | 237 | 0.2% |
| Navajo | 8 | 0.0% |
| Nicaraguan | 55 | 0.1% |
| Nigerian | 112 | 0.1% |
| Northern European | 32 | 0.0% |
| Norwegian | 572 | 0.6% |
| Ottawa | 15 | 0.0% |
| Pakistani | 38 | 0.0% |
| Panamanian | 106 | 0.1% |
| Paraguayan | 9 | 0.0% |
| Pennsylvania German | 9 | 0.0% |
| Peruvian | 18 | 0.0% |
| Polish | 1,767 | 1.7% |
| Portuguese | 292 | 0.3% |
| Potawatomi | 7 | 0.0% |
| Puerto Rican | 7,550 | 7.4% |
| Romanian | 76 | 0.1% |
| Russian | 666 | 0.6% |
| Salvadoran | 710 | 0.7% |
| Samoan | 11 | 0.0% |
| Scandinavian | 174 | 0.2% |
| Scotch-Irish | 738 | 0.7% |
| Scottish | 2,522 | 2.5% |
| Seminole | 35 | 0.0% |
| Slavic | 8 | 0.0% |
| Slovak | 120 | 0.1% |
| Slovene | 19 | 0.0% |
| South African | 5 | 0.0% |
| South American | 1,315 | 1.3% |
| South American Indian | 27 | 0.0% |
| Spaniard | 97 | 0.1% |
| Spanish | 140 | 0.1% |
| Sri Lankan | 126 | 0.1% |
| Subsaharan African | 375 | 0.4% |
| Swedish | 1,145 | 1.1% |
| Swiss | 71 | 0.1% |
| Syrian | 43 | 0.0% |
| Thai | 328 | 0.3% |
| Trinidadian and Tobagonian | 253 | 0.3% |
| Turkish | 6 | 0.0% |
| Ukrainian | 139 | 0.1% |
| Uruguayan | 37 | 0.0% |
| Venezuelan | 125 | 0.1% |
| Welsh | 809 | 0.8% |
| West Indian | 26 | 0.0% |
| Yugoslavian | 12 | 0.0% | View All 120 Rows |
Immigrants in Highlands County
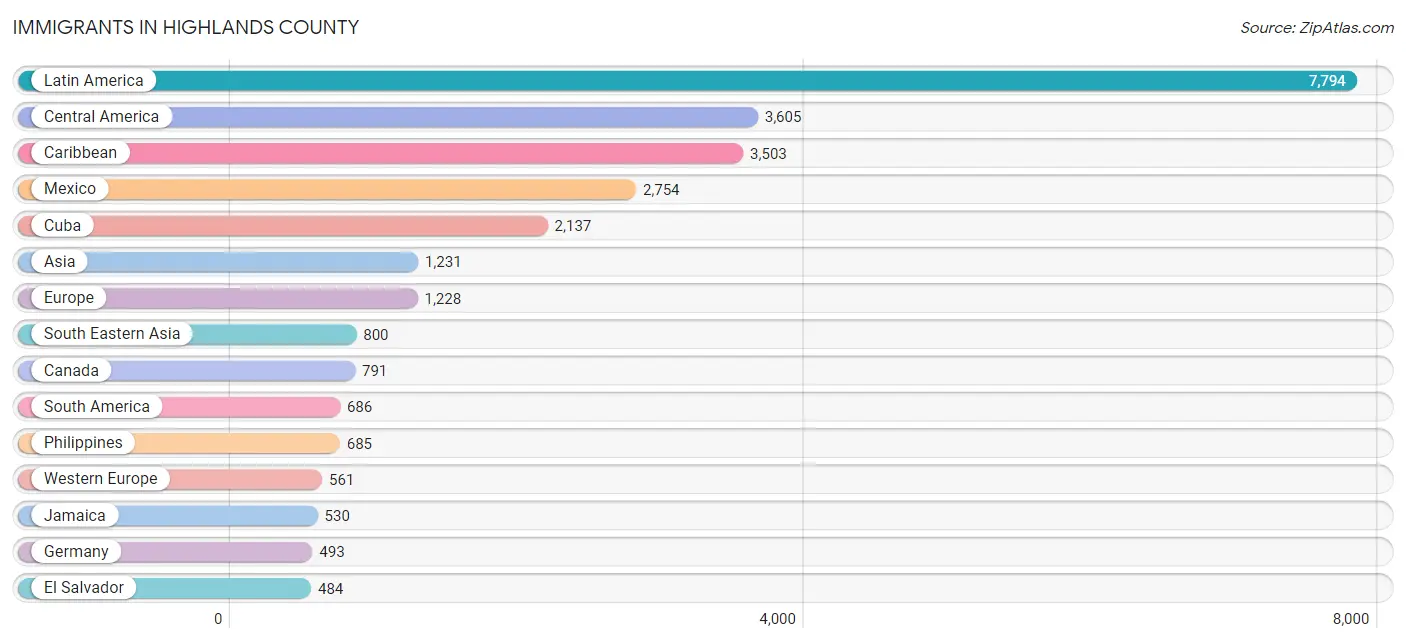
The most numerous immigrant groups reported in Highlands County came from Latin America (7,794 | 7.6%), Central America (3,605 | 3.5%), Caribbean (3,503 | 3.4%), Mexico (2,754 | 2.7%), and Cuba (2,137 | 2.1%), together accounting for 19.3% of all Highlands County residents.
| Immigration Origin | # Population | % Population |
| Afghanistan | 7 | 0.0% |
| Africa | 154 | 0.2% |
| Argentina | 131 | 0.1% |
| Asia | 1,231 | 1.2% |
| Bahamas | 87 | 0.1% |
| Brazil | 43 | 0.0% |
| Canada | 791 | 0.8% |
| Caribbean | 3,503 | 3.4% |
| Central America | 3,605 | 3.5% |
| Chile | 14 | 0.0% |
| China | 67 | 0.1% |
| Colombia | 238 | 0.2% |
| Costa Rica | 160 | 0.2% |
| Cuba | 2,137 | 2.1% |
| Dominican Republic | 226 | 0.2% |
| Eastern Africa | 1 | 0.0% |
| Eastern Asia | 148 | 0.1% |
| Eastern Europe | 132 | 0.1% |
| Ecuador | 103 | 0.1% |
| Egypt | 28 | 0.0% |
| El Salvador | 484 | 0.5% |
| England | 109 | 0.1% |
| Europe | 1,228 | 1.2% |
| France | 33 | 0.0% |
| Germany | 493 | 0.5% |
| Greece | 132 | 0.1% |
| Guatemala | 108 | 0.1% |
| Haiti | 308 | 0.3% |
| Honduras | 30 | 0.0% |
| India | 204 | 0.2% |
| Ireland | 29 | 0.0% |
| Italy | 80 | 0.1% |
| Jamaica | 530 | 0.5% |
| Japan | 45 | 0.0% |
| Kenya | 1 | 0.0% |
| Korea | 36 | 0.0% |
| Laos | 8 | 0.0% |
| Latin America | 7,794 | 7.6% |
| Latvia | 12 | 0.0% |
| Mexico | 2,754 | 2.7% |
| Netherlands | 21 | 0.0% |
| Nicaragua | 55 | 0.1% |
| Nigeria | 67 | 0.1% |
| Northern Africa | 28 | 0.0% |
| Northern Europe | 304 | 0.3% |
| Norway | 8 | 0.0% |
| Pakistan | 18 | 0.0% |
| Panama | 14 | 0.0% |
| Peru | 11 | 0.0% |
| Philippines | 685 | 0.7% |
| Poland | 96 | 0.1% |
| Portugal | 19 | 0.0% |
| Russia | 5 | 0.0% |
| Scotland | 75 | 0.1% |
| South Africa | 58 | 0.1% |
| South America | 686 | 0.7% |
| South Central Asia | 229 | 0.2% |
| South Eastern Asia | 800 | 0.8% |
| Southern Europe | 231 | 0.2% |
| Sweden | 11 | 0.0% |
| Switzerland | 14 | 0.0% |
| Thailand | 10 | 0.0% |
| Trinidad and Tobago | 194 | 0.2% |
| Uruguay | 42 | 0.0% |
| Venezuela | 95 | 0.1% |
| Vietnam | 97 | 0.1% |
| Western Africa | 67 | 0.1% |
| Western Europe | 561 | 0.5% | View All 68 Rows |
Sex and Age in Highlands County
Sex and Age in Highlands County
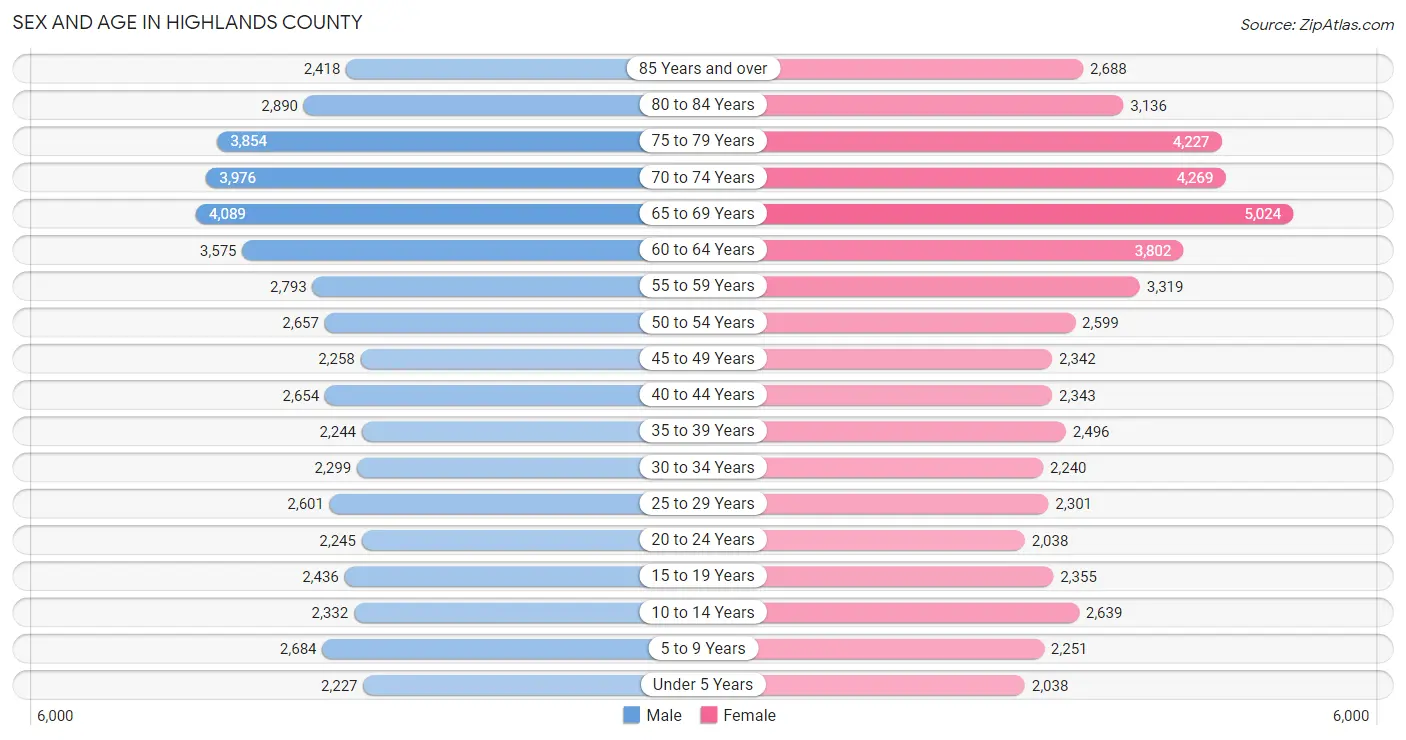
The most populous age groups in Highlands County are 65 to 69 Years (4,089 | 8.1%) for men and 65 to 69 Years (5,024 | 9.6%) for women.
| Age Bracket | Male | Female |
| Under 5 Years | 2,227 (4.4%) | 2,038 (3.9%) |
| 5 to 9 Years | 2,684 (5.3%) | 2,251 (4.3%) |
| 10 to 14 Years | 2,332 (4.6%) | 2,639 (5.1%) |
| 15 to 19 Years | 2,436 (4.9%) | 2,355 (4.5%) |
| 20 to 24 Years | 2,245 (4.5%) | 2,038 (3.9%) |
| 25 to 29 Years | 2,601 (5.2%) | 2,301 (4.4%) |
| 30 to 34 Years | 2,299 (4.6%) | 2,240 (4.3%) |
| 35 to 39 Years | 2,244 (4.5%) | 2,496 (4.8%) |
| 40 to 44 Years | 2,654 (5.3%) | 2,343 (4.5%) |
| 45 to 49 Years | 2,258 (4.5%) | 2,342 (4.5%) |
| 50 to 54 Years | 2,657 (5.3%) | 2,599 (5.0%) |
| 55 to 59 Years | 2,793 (5.6%) | 3,319 (6.4%) |
| 60 to 64 Years | 3,575 (7.1%) | 3,802 (7.3%) |
| 65 to 69 Years | 4,089 (8.1%) | 5,024 (9.6%) |
| 70 to 74 Years | 3,976 (7.9%) | 4,269 (8.2%) |
| 75 to 79 Years | 3,854 (7.7%) | 4,227 (8.1%) |
| 80 to 84 Years | 2,890 (5.8%) | 3,136 (6.0%) |
| 85 Years and over | 2,418 (4.8%) | 2,688 (5.2%) |
| Total | 50,232 (100.0%) | 52,107 (100.0%) |
Families and Households in Highlands County
Median Family Size in Highlands County
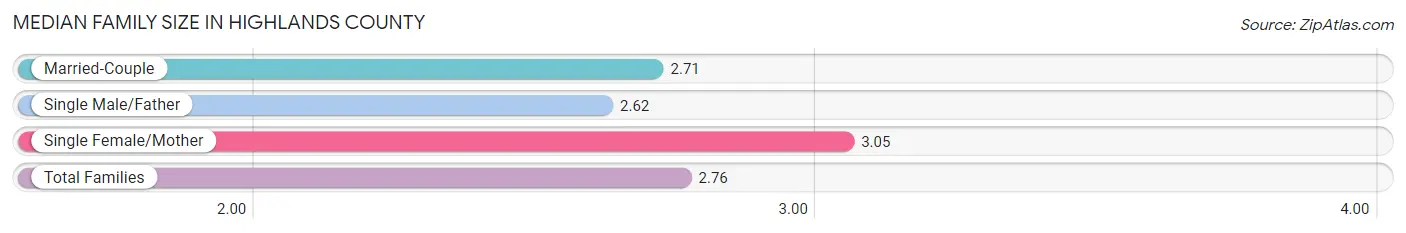
The median family size in Highlands County is 2.76 persons per family, with single female/mother families (4,596 | 16.1%) accounting for the largest median family size of 3.05 persons per family. On the other hand, single male/father families (1,892 | 6.6%) represent the smallest median family size with 2.62 persons per family.
| Family Type | # Families | Family Size |
| Married-Couple | 22,151 (77.3%) | 2.71 |
| Single Male/Father | 1,892 (6.6%) | 2.62 |
| Single Female/Mother | 4,596 (16.1%) | 3.05 |
| Total Families | 28,639 (100.0%) | 2.76 |
Median Household Size in Highlands County
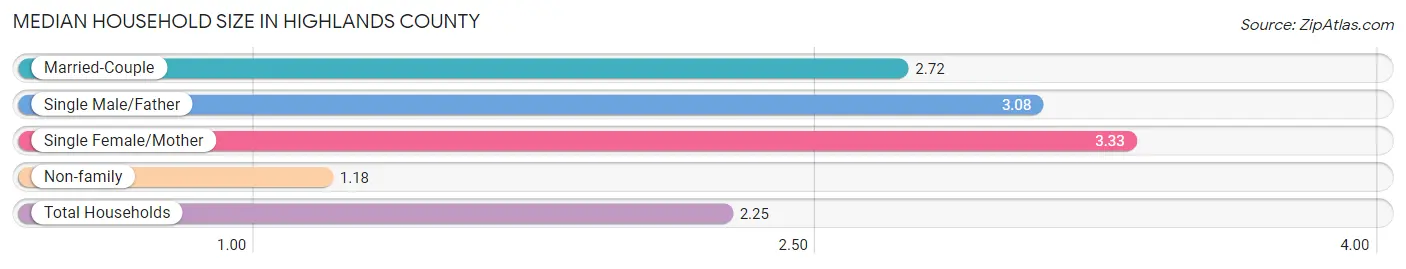
The median household size in Highlands County is 2.25 persons per household, with single female/mother households (4,596 | 10.3%) accounting for the largest median household size of 3.33 persons per household. non-family households (16,046 | 35.9%) represent the smallest median household size with 1.18 persons per household.
| Household Type | # Households | Household Size |
| Married-Couple | 22,151 (49.6%) | 2.72 |
| Single Male/Father | 1,892 (4.2%) | 3.08 |
| Single Female/Mother | 4,596 (10.3%) | 3.33 |
| Non-family | 16,046 (35.9%) | 1.18 |
| Total Households | 44,685 (100.0%) | 2.25 |
Household Size by Marriage Status in Highlands County
Out of a total of 44,685 households in Highlands County, 28,639 (64.1%) are family households, while 16,046 (35.9%) are nonfamily households. The most numerous type of family households are 2-person households, comprising 16,859, and the most common type of nonfamily households are 1-person households, comprising 13,583.
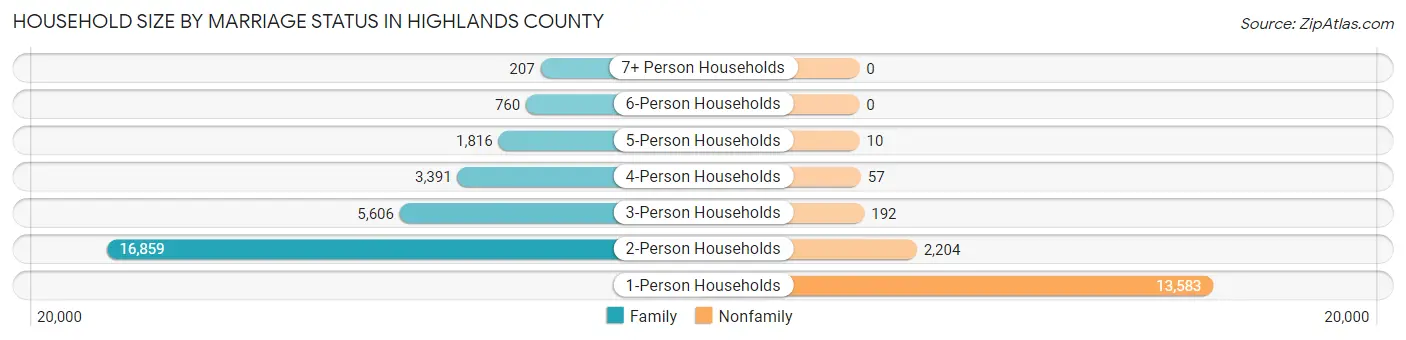
| Household Size | Family Households | Nonfamily Households |
| 1-Person Households | - | 13,583 (30.4%) |
| 2-Person Households | 16,859 (37.7%) | 2,204 (4.9%) |
| 3-Person Households | 5,606 (12.6%) | 192 (0.4%) |
| 4-Person Households | 3,391 (7.6%) | 57 (0.1%) |
| 5-Person Households | 1,816 (4.1%) | 10 (0.0%) |
| 6-Person Households | 760 (1.7%) | 0 (0.0%) |
| 7+ Person Households | 207 (0.5%) | 0 (0.0%) |
| Total | 28,639 (64.1%) | 16,046 (35.9%) |
Female Fertility in Highlands County
Fertility by Age in Highlands County
Average fertility rate in Highlands County is 46.0 births per 1,000 women. Women in the age bracket of 20 to 34 years have the highest fertility rate with 82.0 births per 1,000 women. Women in the age bracket of 20 to 34 years acount for 70.4% of all women with births.
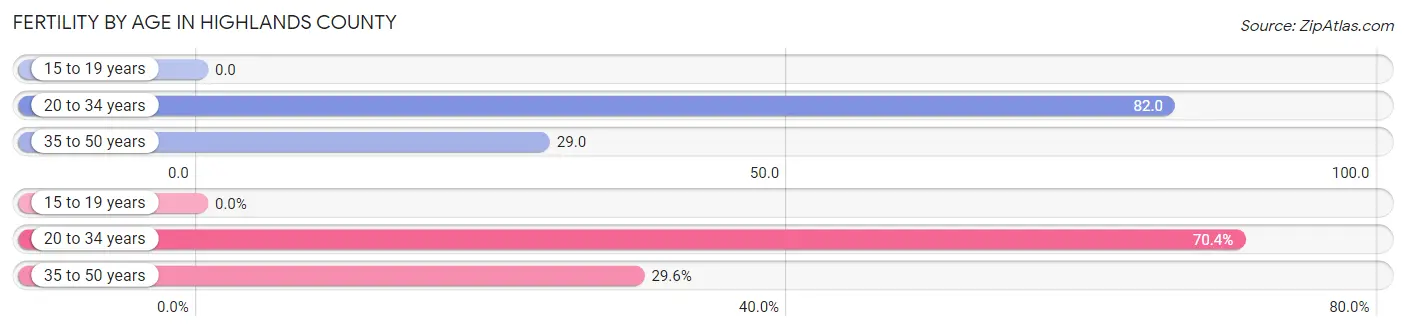
| Age Bracket | Women with Births | Births / 1,000 Women |
| 15 to 19 years | 0 (0.0%) | 0.0 |
| 20 to 34 years | 537 (70.4%) | 82.0 |
| 35 to 50 years | 226 (29.6%) | 29.0 |
| Total | 763 (100.0%) | 46.0 |
Fertility by Age by Marriage Status in Highlands County
55.7% of women with births (763) in Highlands County are married. The highest percentage of unmarried women with births falls into 20 to 34 years age bracket with 55.9% of them unmarried at the time of birth, while the lowest percentage of unmarried women with births belong to 35 to 50 years age bracket with 16.8% of them unmarried.
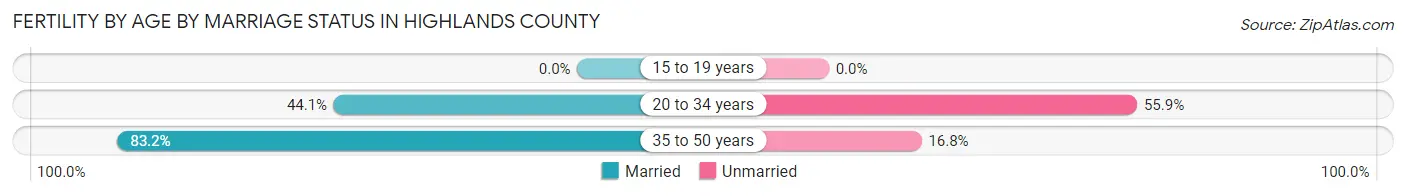
| Age Bracket | Married | Unmarried |
| 15 to 19 years | 0 (0.0%) | 0 (0.0%) |
| 20 to 34 years | 237 (44.1%) | 300 (55.9%) |
| 35 to 50 years | 188 (83.2%) | 38 (16.8%) |
| Total | 425 (55.7%) | 338 (44.3%) |
Fertility by Education in Highlands County
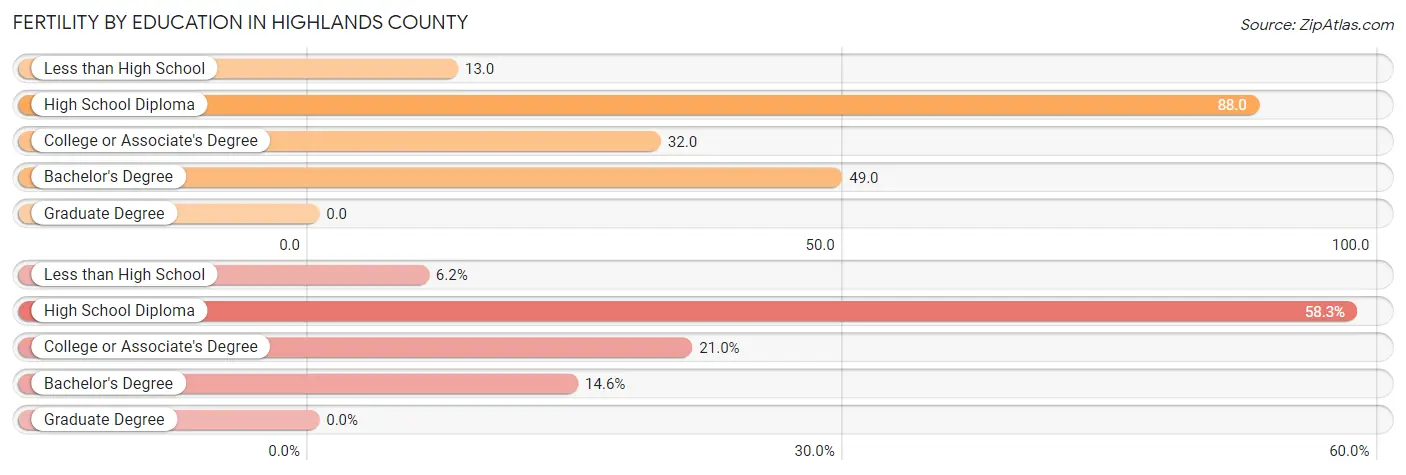
| Educational Attainment | Women with Births | Births / 1,000 Women |
| Less than High School | 47 (6.2%) | 13.0 |
| High School Diploma | 445 (58.3%) | 88.0 |
| College or Associate's Degree | 160 (21.0%) | 32.0 |
| Bachelor's Degree | 111 (14.5%) | 49.0 |
| Graduate Degree | 0 (0.0%) | 0.0 |
| Total | 763 (100.0%) | 46.0 |
Fertility by Education by Marriage Status in Highlands County
44.3% of women with births in Highlands County are unmarried. Women with the educational attainment of bachelor's degree are most likely to be married with 100.0% of them married at childbirth, while women with the educational attainment of high school diploma are least likely to be married with 69.7% of them unmarried at childbirth.
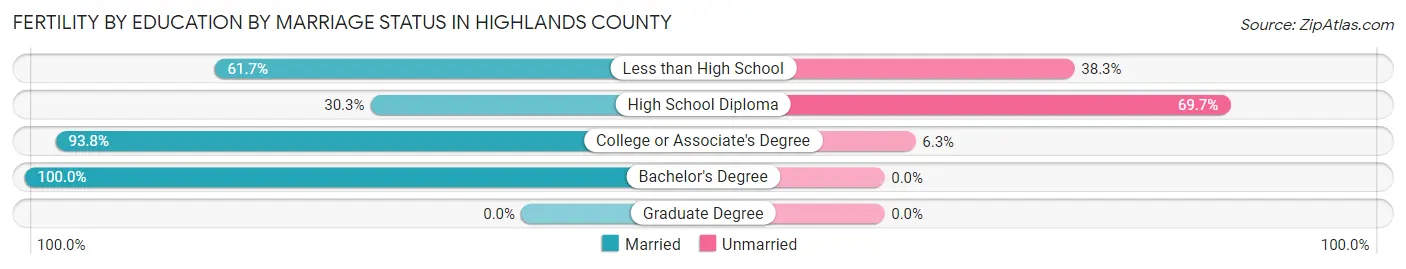
| Educational Attainment | Married | Unmarried |
| Less than High School | 29 (61.7%) | 18 (38.3%) |
| High School Diploma | 135 (30.3%) | 310 (69.7%) |
| College or Associate's Degree | 150 (93.8%) | 10 (6.2%) |
| Bachelor's Degree | 111 (100.0%) | 0 (0.0%) |
| Graduate Degree | 0 (0.0%) | 0 (0.0%) |
| Total | 425 (55.7%) | 338 (44.3%) |
Employment Characteristics in Highlands County
Employment by Class of Employer in Highlands County
Among the 34,686 employed individuals in Highlands County, private company employees (22,159 | 63.9%), local government employees (3,429 | 9.9%), and not-for-profit organizations (3,094 | 8.9%) make up the most common classes of employment.
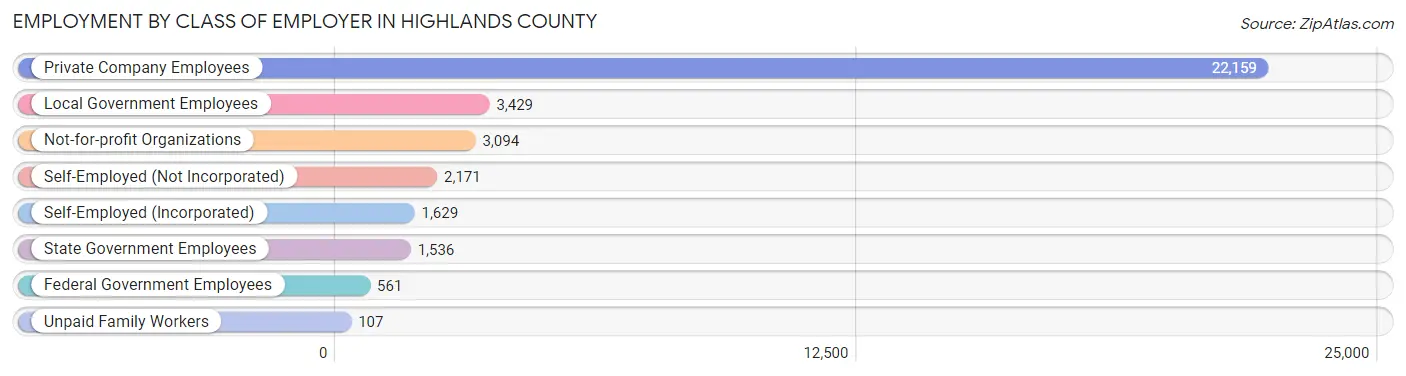
| Employer Class | # Employees | % Employees |
| Private Company Employees | 22,159 | 63.9% |
| Self-Employed (Incorporated) | 1,629 | 4.7% |
| Self-Employed (Not Incorporated) | 2,171 | 6.3% |
| Not-for-profit Organizations | 3,094 | 8.9% |
| Local Government Employees | 3,429 | 9.9% |
| State Government Employees | 1,536 | 4.4% |
| Federal Government Employees | 561 | 1.6% |
| Unpaid Family Workers | 107 | 0.3% |
| Total | 34,686 | 100.0% |
Employment Status by Age in Highlands County
According to the labor force statistics for Highlands County, out of the total population over 16 years of age (87,203), 43.5% or 37,933 individuals are in the labor force, with 6.8% or 2,579 of them unemployed. The age group with the highest labor force participation rate is 35 to 44 years, with 82.3% or 8,014 individuals in the labor force. Within the labor force, the 16 to 19 years age range has the highest percentage of unemployed individuals, with 31.1% or 427 of them being unemployed.
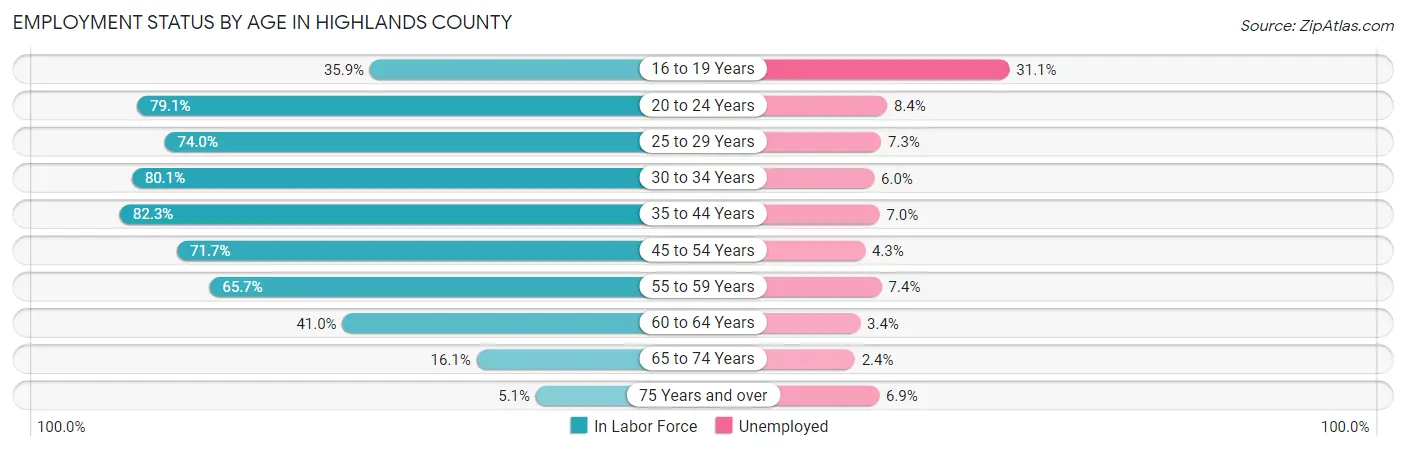
| Age Bracket | In Labor Force | Unemployed |
| 16 to 19 Years | 1,374 (35.9%) | 427 (31.1%) |
| 20 to 24 Years | 3,388 (79.1%) | 285 (8.4%) |
| 25 to 29 Years | 3,627 (74.0%) | 265 (7.3%) |
| 30 to 34 Years | 3,636 (80.1%) | 218 (6.0%) |
| 35 to 44 Years | 8,014 (82.3%) | 561 (7.0%) |
| 45 to 54 Years | 7,067 (71.7%) | 304 (4.3%) |
| 55 to 59 Years | 4,016 (65.7%) | 297 (7.4%) |
| 60 to 64 Years | 3,025 (41.0%) | 103 (3.4%) |
| 65 to 74 Years | 2,795 (16.1%) | 67 (2.4%) |
| 75 Years and over | 980 (5.1%) | 68 (6.9%) |
| Total | 37,933 (43.5%) | 2,579 (6.8%) |
Employment Status by Educational Attainment in Highlands County
According to labor force statistics for Highlands County, 69.1% of individuals (29,383) out of the total population between 25 and 64 years of age (42,523) are in the labor force, with 5.9% or 1,734 of them being unemployed. The group with the highest labor force participation rate are those with the educational attainment of bachelor's degree or higher, with 80.5% or 6,256 individuals in the labor force. Within the labor force, individuals with less than high school education have the highest percentage of unemployment, with 8.2% or 319 of them being unemployed.
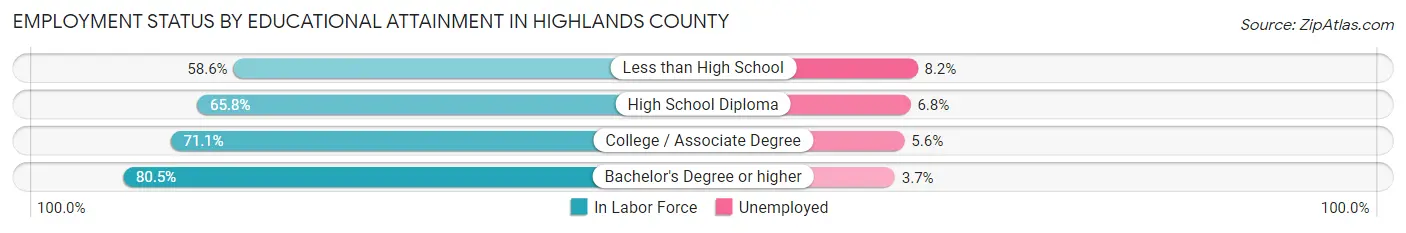
| Educational Attainment | In Labor Force | Unemployed |
| Less than High School | 3,888 (58.6%) | 544 (8.2%) |
| High School Diploma | 9,529 (65.8%) | 985 (6.8%) |
| College / Associate Degree | 9,694 (71.1%) | 764 (5.6%) |
| Bachelor's Degree or higher | 6,256 (80.5%) | 288 (3.7%) |
| Total | 29,383 (69.1%) | 2,509 (5.9%) |
Employment Occupations by Sex in Highlands County
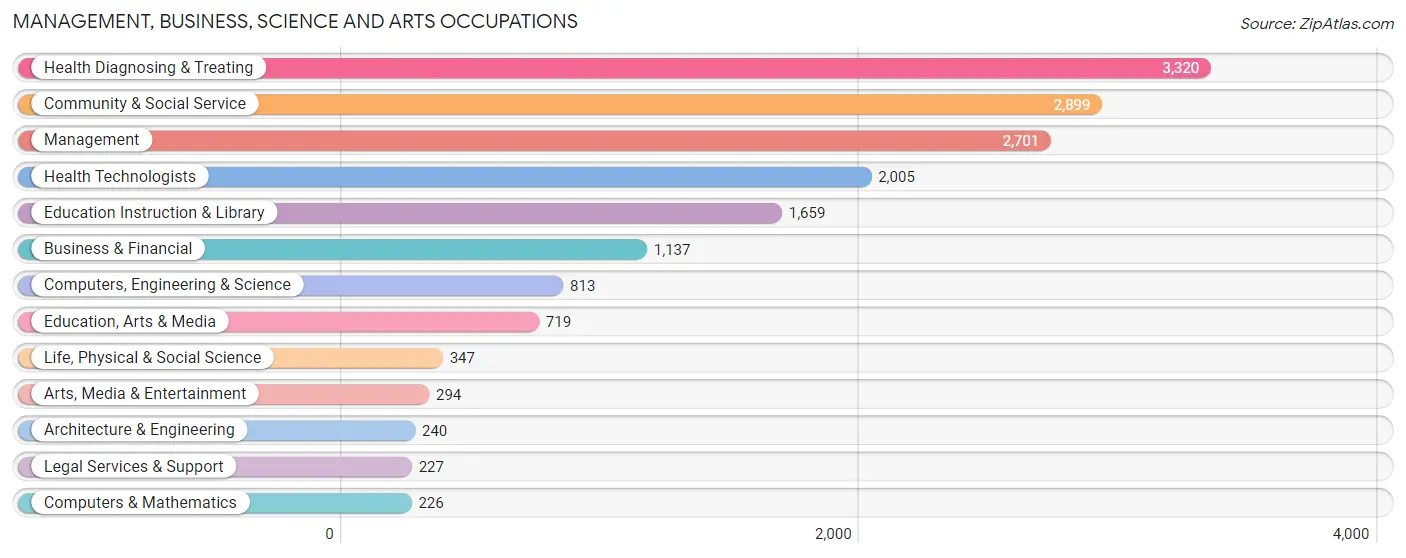
Management, Business, Science and Arts Occupations
The most common Management, Business, Science and Arts occupations in Highlands County are Health Diagnosing & Treating (3,320 | 9.4%), Community & Social Service (2,899 | 8.2%), Management (2,701 | 7.6%), Health Technologists (2,005 | 5.7%), and Education Instruction & Library (1,659 | 4.7%).
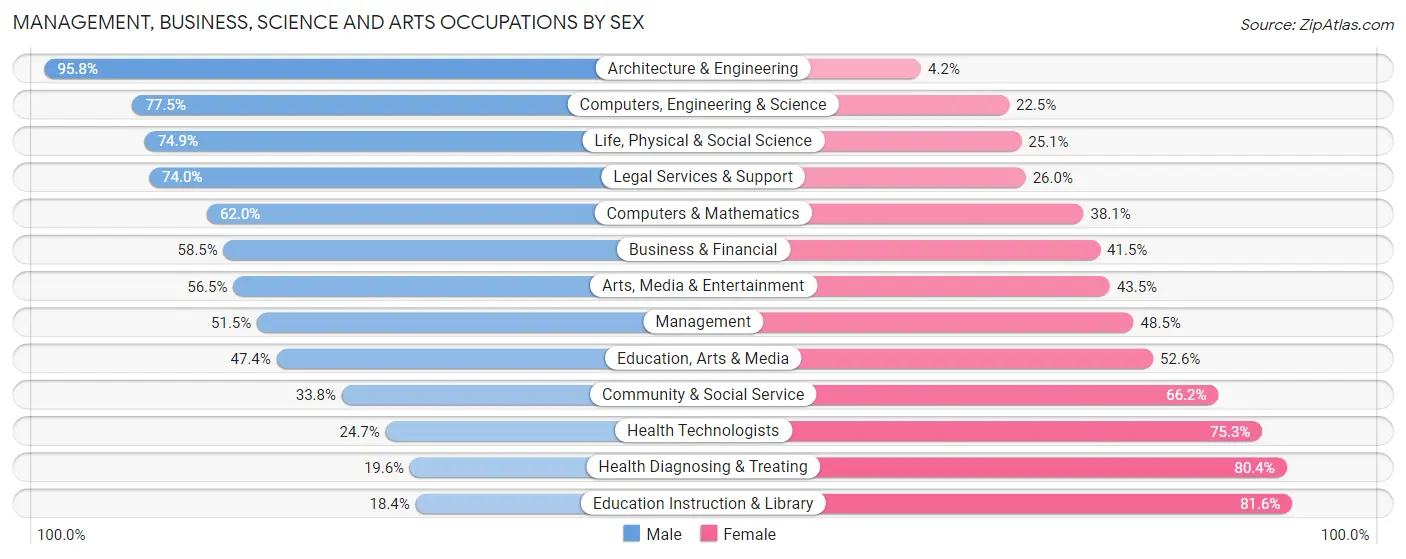
Management, Business, Science and Arts Occupations by Sex
Within the Management, Business, Science and Arts occupations in Highlands County, the most male-oriented occupations are Architecture & Engineering (95.8%), Computers, Engineering & Science (77.5%), and Life, Physical & Social Science (74.9%), while the most female-oriented occupations are Education Instruction & Library (81.6%), Health Diagnosing & Treating (80.4%), and Health Technologists (75.3%).
| Occupation | Male | Female |
| Management | 1,391 (51.5%) | 1,310 (48.5%) |
| Business & Financial | 665 (58.5%) | 472 (41.5%) |
| Computers, Engineering & Science | 630 (77.5%) | 183 (22.5%) |
| Computers & Mathematics | 140 (62.0%) | 86 (38.1%) |
| Architecture & Engineering | 230 (95.8%) | 10 (4.2%) |
| Life, Physical & Social Science | 260 (74.9%) | 87 (25.1%) |
| Community & Social Service | 981 (33.8%) | 1,918 (66.2%) |
| Education, Arts & Media | 341 (47.4%) | 378 (52.6%) |
| Legal Services & Support | 168 (74.0%) | 59 (26.0%) |
| Education Instruction & Library | 306 (18.4%) | 1,353 (81.6%) |
| Arts, Media & Entertainment | 166 (56.5%) | 128 (43.5%) |
| Health Diagnosing & Treating | 651 (19.6%) | 2,669 (80.4%) |
| Health Technologists | 495 (24.7%) | 1,510 (75.3%) |
| Total (Category) | 4,318 (39.7%) | 6,552 (60.3%) |
| Total (Overall) | 18,810 (53.2%) | 16,514 (46.8%) |
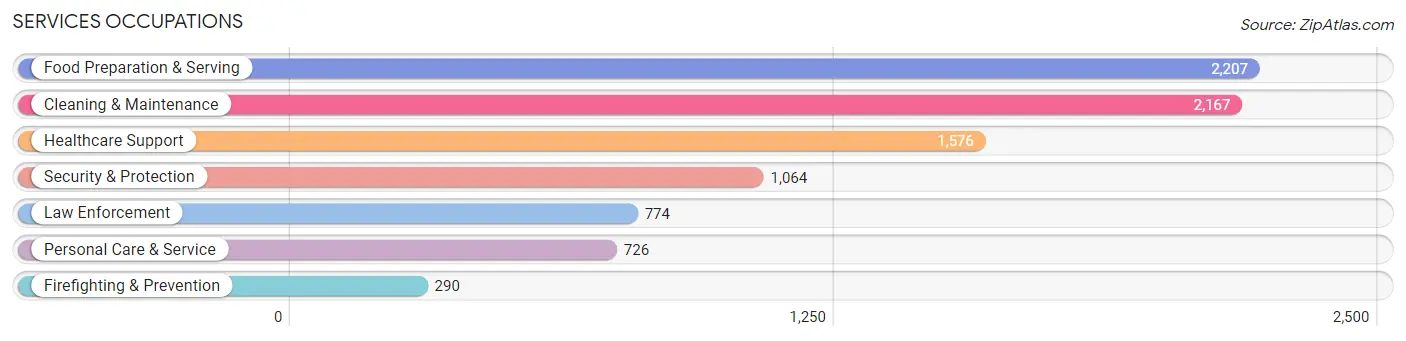
Services Occupations
The most common Services occupations in Highlands County are Food Preparation & Serving (2,207 | 6.2%), Cleaning & Maintenance (2,167 | 6.1%), Healthcare Support (1,576 | 4.5%), Security & Protection (1,064 | 3.0%), and Law Enforcement (774 | 2.2%).
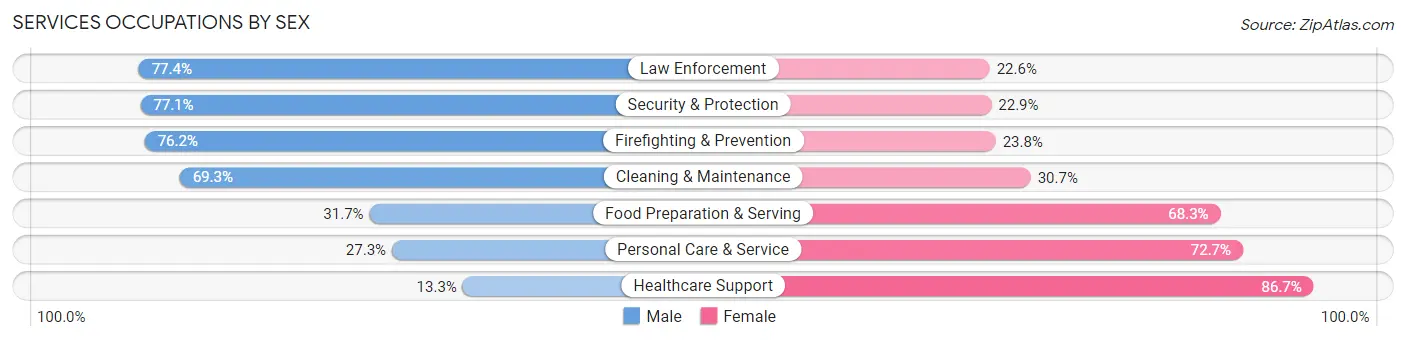
Services Occupations by Sex
Within the Services occupations in Highlands County, the most male-oriented occupations are Law Enforcement (77.4%), Security & Protection (77.1%), and Firefighting & Prevention (76.2%), while the most female-oriented occupations are Healthcare Support (86.7%), Personal Care & Service (72.7%), and Food Preparation & Serving (68.3%).
| Occupation | Male | Female |
| Healthcare Support | 209 (13.3%) | 1,367 (86.7%) |
| Security & Protection | 820 (77.1%) | 244 (22.9%) |
| Firefighting & Prevention | 221 (76.2%) | 69 (23.8%) |
| Law Enforcement | 599 (77.4%) | 175 (22.6%) |
| Food Preparation & Serving | 700 (31.7%) | 1,507 (68.3%) |
| Cleaning & Maintenance | 1,501 (69.3%) | 666 (30.7%) |
| Personal Care & Service | 198 (27.3%) | 528 (72.7%) |
| Total (Category) | 3,428 (44.3%) | 4,312 (55.7%) |
| Total (Overall) | 18,810 (53.2%) | 16,514 (46.8%) |
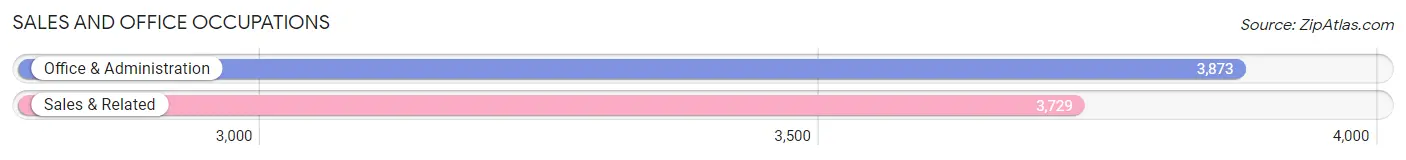
Sales and Office Occupations
The most common Sales and Office occupations in Highlands County are Office & Administration (3,873 | 11.0%), and Sales & Related (3,729 | 10.6%).
Sales and Office Occupations by Sex
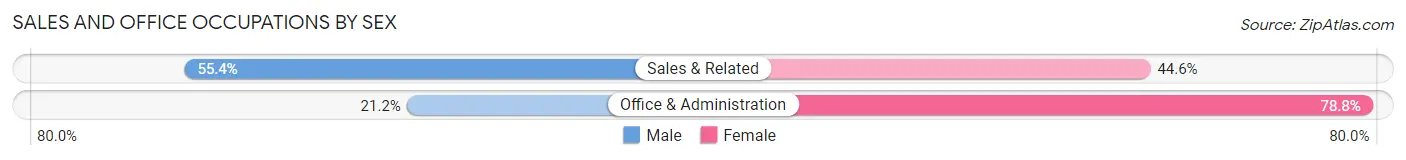
| Occupation | Male | Female |
| Sales & Related | 2,066 (55.4%) | 1,663 (44.6%) |
| Office & Administration | 822 (21.2%) | 3,051 (78.8%) |
| Total (Category) | 2,888 (38.0%) | 4,714 (62.0%) |
| Total (Overall) | 18,810 (53.2%) | 16,514 (46.8%) |
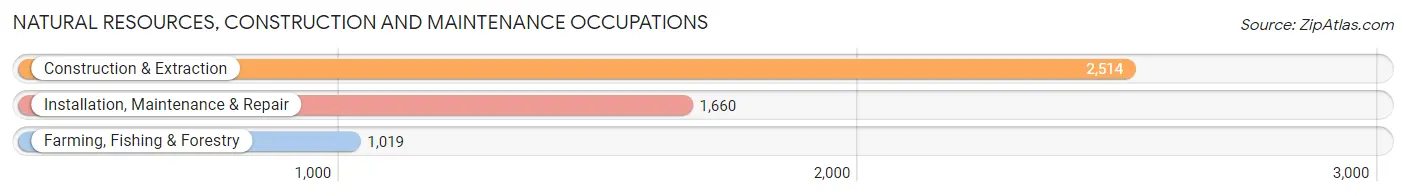
Natural Resources, Construction and Maintenance Occupations
The most common Natural Resources, Construction and Maintenance occupations in Highlands County are Construction & Extraction (2,514 | 7.1%), Installation, Maintenance & Repair (1,660 | 4.7%), and Farming, Fishing & Forestry (1,019 | 2.9%).
Natural Resources, Construction and Maintenance Occupations by Sex
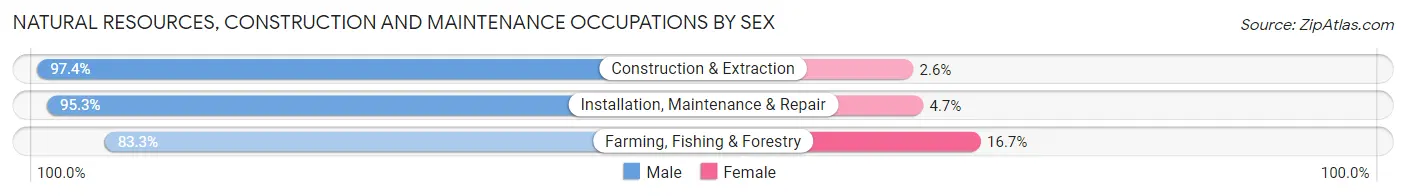
| Occupation | Male | Female |
| Farming, Fishing & Forestry | 849 (83.3%) | 170 (16.7%) |
| Construction & Extraction | 2,448 (97.4%) | 66 (2.6%) |
| Installation, Maintenance & Repair | 1,582 (95.3%) | 78 (4.7%) |
| Total (Category) | 4,879 (94.0%) | 314 (6.0%) |
| Total (Overall) | 18,810 (53.2%) | 16,514 (46.8%) |
Production, Transportation and Moving Occupations
The most common Production, Transportation and Moving occupations in Highlands County are Transportation (1,493 | 4.2%), Production (1,275 | 3.6%), and Material Moving (1,151 | 3.3%).
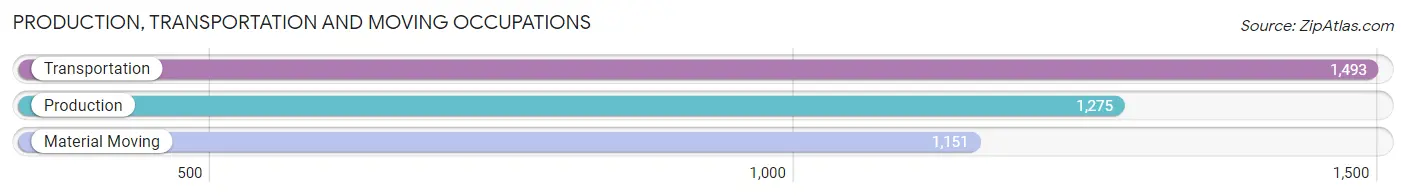
Production, Transportation and Moving Occupations by Sex
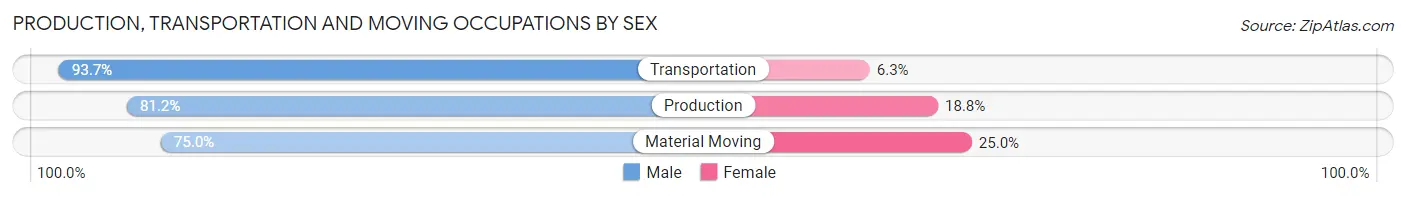
| Occupation | Male | Female |
| Production | 1,035 (81.2%) | 240 (18.8%) |
| Transportation | 1,399 (93.7%) | 94 (6.3%) |
| Material Moving | 863 (75.0%) | 288 (25.0%) |
| Total (Category) | 3,297 (84.1%) | 622 (15.9%) |
| Total (Overall) | 18,810 (53.2%) | 16,514 (46.8%) |
Employment Industries by Sex in Highlands County
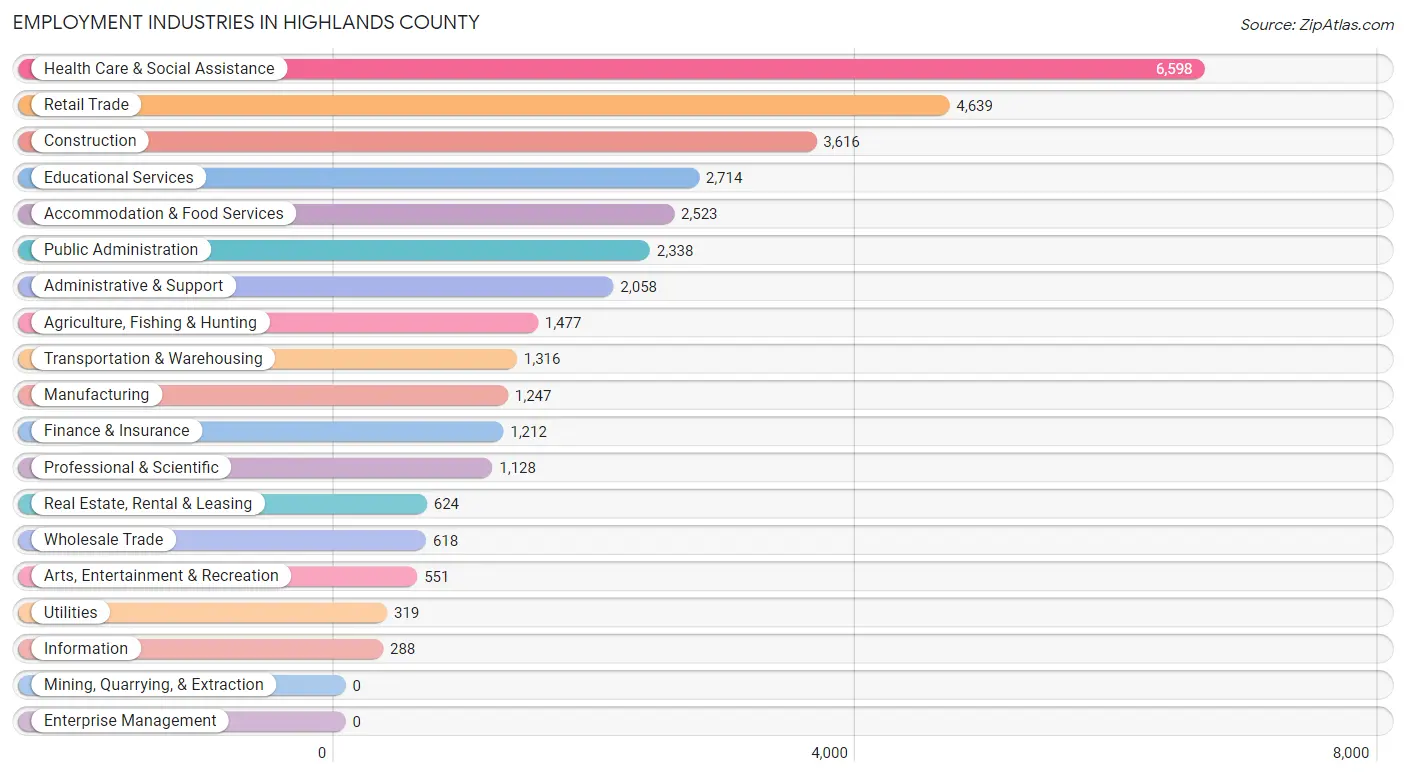
Employment Industries in Highlands County
The major employment industries in Highlands County include Health Care & Social Assistance (6,598 | 18.7%), Retail Trade (4,639 | 13.1%), Construction (3,616 | 10.2%), Educational Services (2,714 | 7.7%), and Accommodation & Food Services (2,523 | 7.1%).
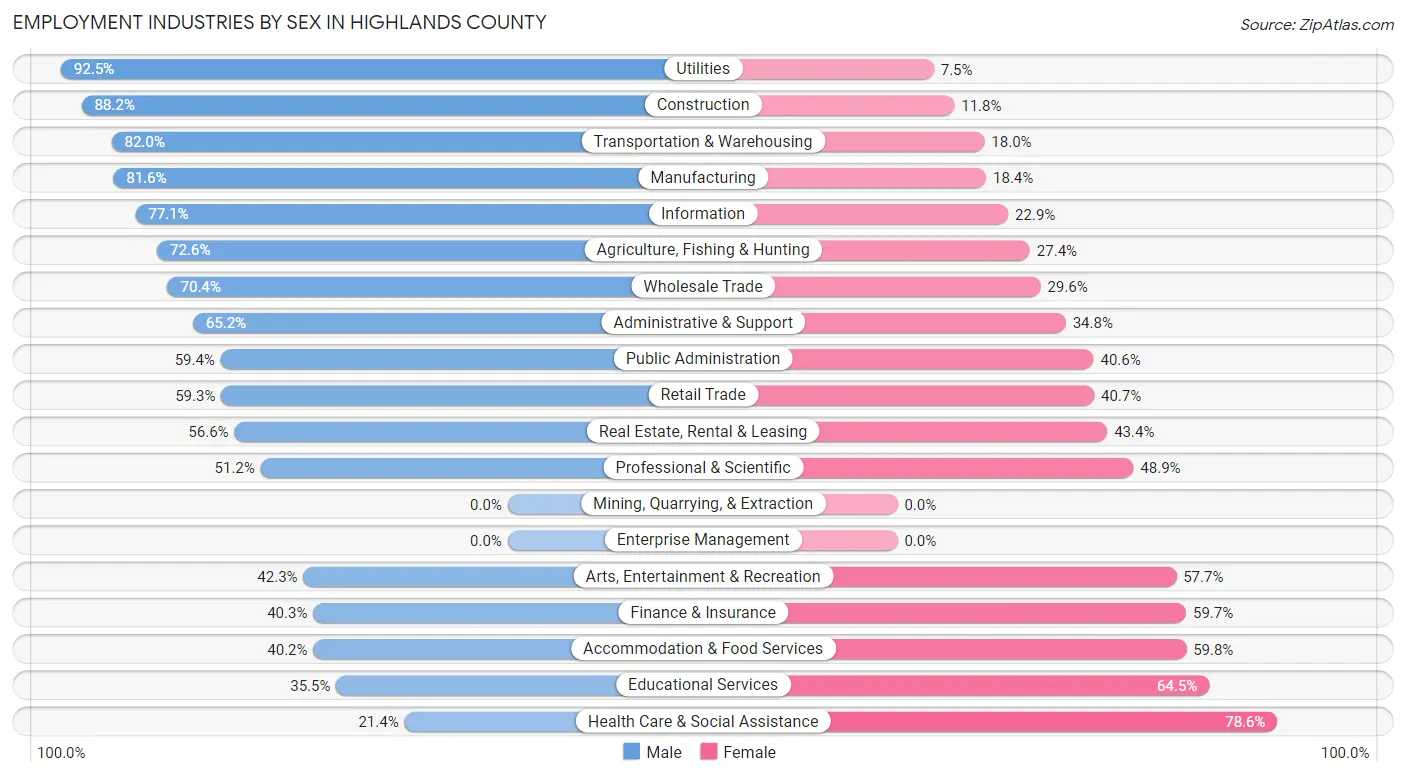
Employment Industries by Sex in Highlands County
The Highlands County industries that see more men than women are Utilities (92.5%), Construction (88.2%), and Transportation & Warehousing (82.0%), whereas the industries that tend to have a higher number of women are Health Care & Social Assistance (78.6%), Educational Services (64.5%), and Accommodation & Food Services (59.8%).
| Industry | Male | Female |
| Agriculture, Fishing & Hunting | 1,072 (72.6%) | 405 (27.4%) |
| Mining, Quarrying, & Extraction | 0 (0.0%) | 0 (0.0%) |
| Construction | 3,190 (88.2%) | 426 (11.8%) |
| Manufacturing | 1,018 (81.6%) | 229 (18.4%) |
| Wholesale Trade | 435 (70.4%) | 183 (29.6%) |
| Retail Trade | 2,751 (59.3%) | 1,888 (40.7%) |
| Transportation & Warehousing | 1,079 (82.0%) | 237 (18.0%) |
| Utilities | 295 (92.5%) | 24 (7.5%) |
| Information | 222 (77.1%) | 66 (22.9%) |
| Finance & Insurance | 488 (40.3%) | 724 (59.7%) |
| Real Estate, Rental & Leasing | 353 (56.6%) | 271 (43.4%) |
| Professional & Scientific | 577 (51.1%) | 551 (48.8%) |
| Enterprise Management | 0 (0.0%) | 0 (0.0%) |
| Administrative & Support | 1,341 (65.2%) | 717 (34.8%) |
| Educational Services | 963 (35.5%) | 1,751 (64.5%) |
| Health Care & Social Assistance | 1,410 (21.4%) | 5,188 (78.6%) |
| Arts, Entertainment & Recreation | 233 (42.3%) | 318 (57.7%) |
| Accommodation & Food Services | 1,015 (40.2%) | 1,508 (59.8%) |
| Public Administration | 1,389 (59.4%) | 949 (40.6%) |
| Total | 18,810 (53.2%) | 16,514 (46.8%) |
Education in Highlands County
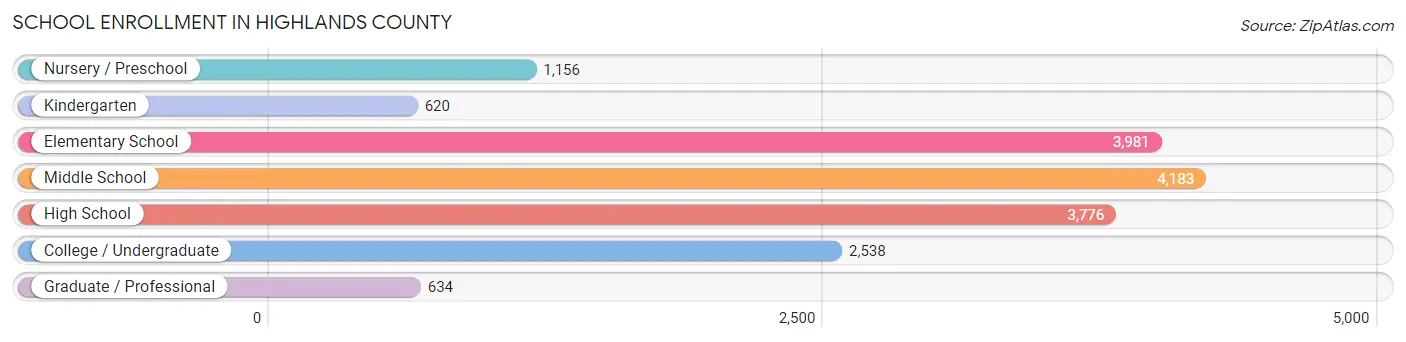
School Enrollment in Highlands County
The most common levels of schooling among the 16,888 students in Highlands County are middle school (4,183 | 24.8%), elementary school (3,981 | 23.6%), and high school (3,776 | 22.4%).
| School Level | # Students | % Students |
| Nursery / Preschool | 1,156 | 6.9% |
| Kindergarten | 620 | 3.7% |
| Elementary School | 3,981 | 23.6% |
| Middle School | 4,183 | 24.8% |
| High School | 3,776 | 22.4% |
| College / Undergraduate | 2,538 | 15.0% |
| Graduate / Professional | 634 | 3.7% |
| Total | 16,888 | 100.0% |
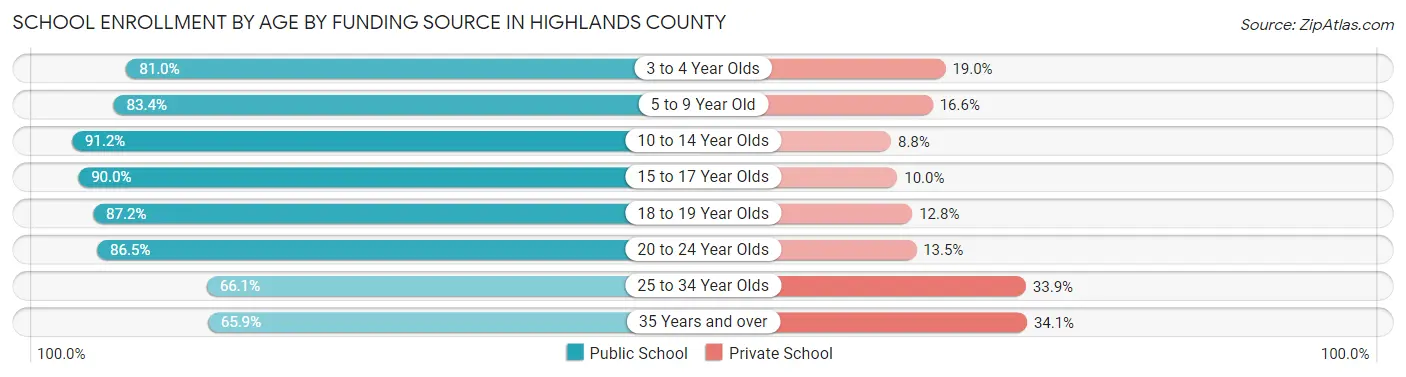
School Enrollment by Age by Funding Source in Highlands County
Out of a total of 16,888 students who are enrolled in schools in Highlands County, 2,499 (14.8%) attend a private institution, while the remaining 14,389 (85.2%) are enrolled in public schools. The age group of 35 years and over has the highest likelihood of being enrolled in private schools, with 367 (34.1% in the age bracket) enrolled. Conversely, the age group of 10 to 14 year olds has the lowest likelihood of being enrolled in a private school, with 4,487 (91.2% in the age bracket) attending a public institution.
| Age Bracket | Public School | Private School |
| 3 to 4 Year Olds | 577 (81.0%) | 135 (19.0%) |
| 5 to 9 Year Old | 3,810 (83.4%) | 758 (16.6%) |
| 10 to 14 Year Olds | 4,487 (91.2%) | 434 (8.8%) |
| 15 to 17 Year Olds | 2,541 (90.0%) | 282 (10.0%) |
| 18 to 19 Year Olds | 888 (87.2%) | 130 (12.8%) |
| 20 to 24 Year Olds | 864 (86.5%) | 135 (13.5%) |
| 25 to 34 Year Olds | 510 (66.1%) | 262 (33.9%) |
| 35 Years and over | 708 (65.9%) | 367 (34.1%) |
| Total | 14,389 (85.2%) | 2,499 (14.8%) |
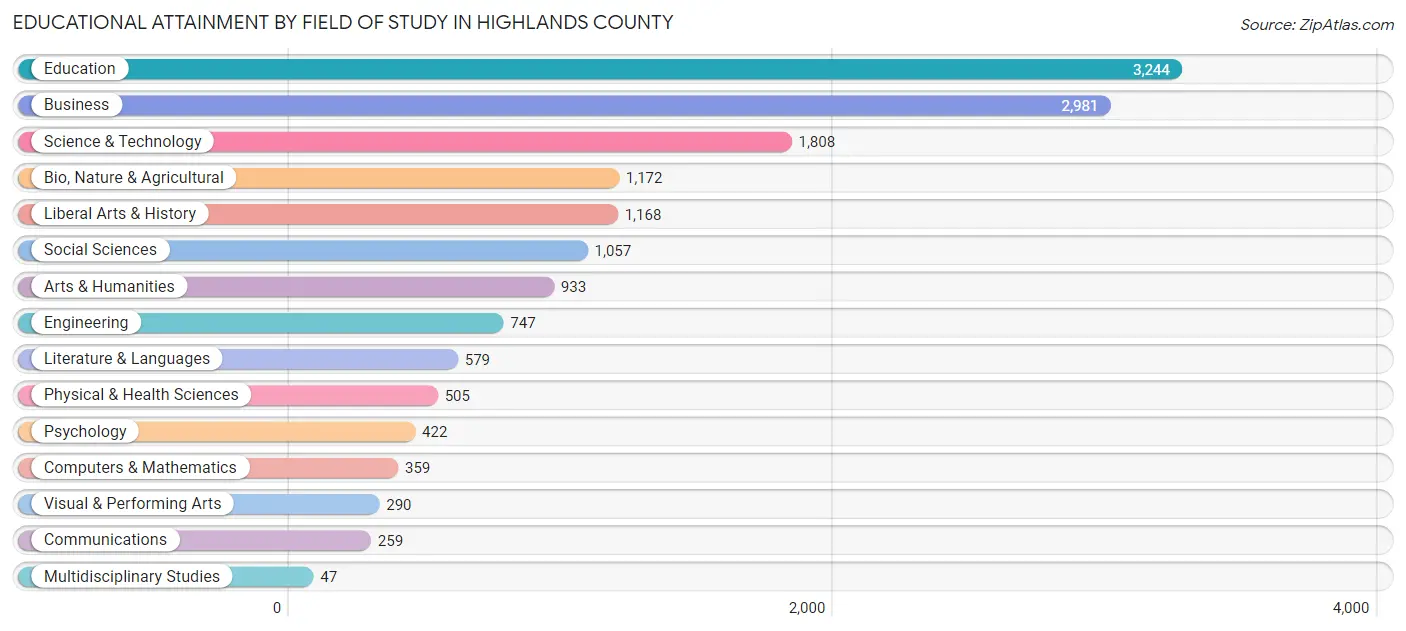
Educational Attainment by Field of Study in Highlands County
Education (3,244 | 20.8%), business (2,981 | 19.1%), science & technology (1,808 | 11.6%), bio, nature & agricultural (1,172 | 7.5%), and liberal arts & history (1,168 | 7.5%) are the most common fields of study among 15,571 individuals in Highlands County who have obtained a bachelor's degree or higher.
| Field of Study | # Graduates | % Graduates |
| Computers & Mathematics | 359 | 2.3% |
| Bio, Nature & Agricultural | 1,172 | 7.5% |
| Physical & Health Sciences | 505 | 3.2% |
| Psychology | 422 | 2.7% |
| Social Sciences | 1,057 | 6.8% |
| Engineering | 747 | 4.8% |
| Multidisciplinary Studies | 47 | 0.3% |
| Science & Technology | 1,808 | 11.6% |
| Business | 2,981 | 19.1% |
| Education | 3,244 | 20.8% |
| Literature & Languages | 579 | 3.7% |
| Liberal Arts & History | 1,168 | 7.5% |
| Visual & Performing Arts | 290 | 1.9% |
| Communications | 259 | 1.7% |
| Arts & Humanities | 933 | 6.0% |
| Total | 15,571 | 100.0% |
Transportation & Commute in Highlands County
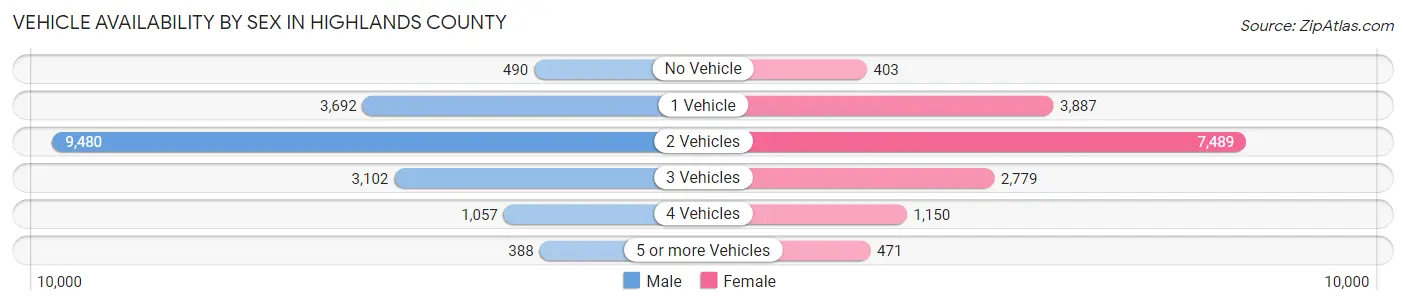
Vehicle Availability by Sex in Highlands County
The most prevalent vehicle ownership categories in Highlands County are males with 2 vehicles (9,480, accounting for 52.1%) and females with 2 vehicles (7,489, making up 58.6%).
| Vehicles Available | Male | Female |
| No Vehicle | 490 (2.7%) | 403 (2.5%) |
| 1 Vehicle | 3,692 (20.3%) | 3,887 (24.0%) |
| 2 Vehicles | 9,480 (52.1%) | 7,489 (46.3%) |
| 3 Vehicles | 3,102 (17.0%) | 2,779 (17.2%) |
| 4 Vehicles | 1,057 (5.8%) | 1,150 (7.1%) |
| 5 or more Vehicles | 388 (2.1%) | 471 (2.9%) |
| Total | 18,209 (100.0%) | 16,179 (100.0%) |
Commute Time in Highlands County
The most frequently occuring commute durations in Highlands County are 15 to 19 minutes (6,654 commuters, 20.5%), 10 to 14 minutes (5,904 commuters, 18.2%), and 5 to 9 minutes (4,687 commuters, 14.5%).
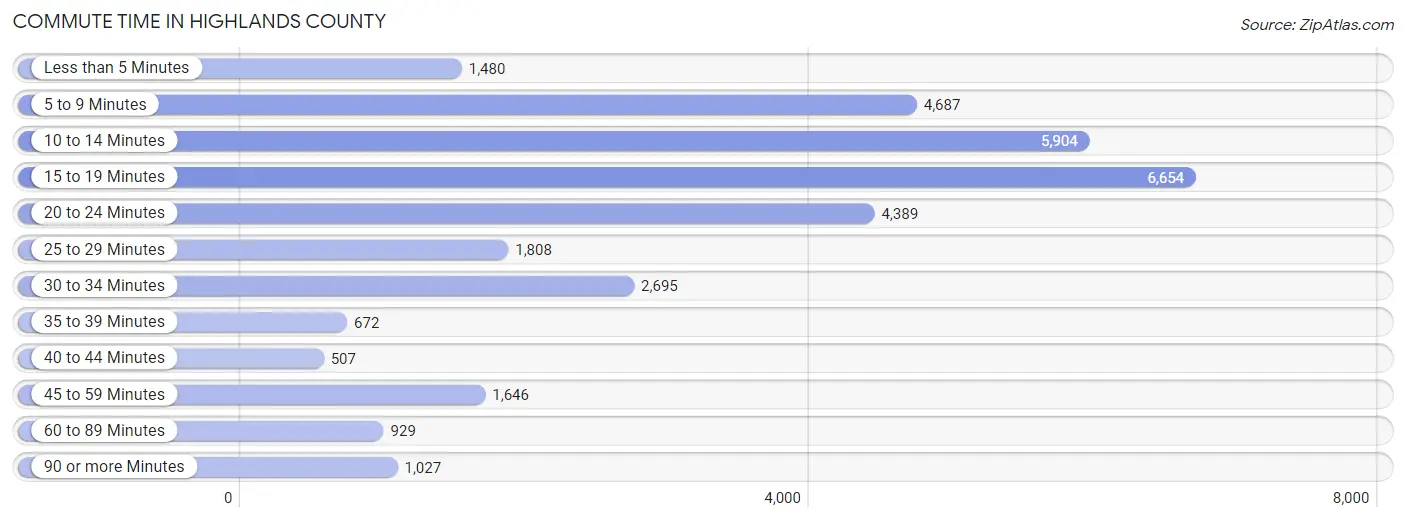
| Commute Time | # Commuters | % Commuters |
| Less than 5 Minutes | 1,480 | 4.6% |
| 5 to 9 Minutes | 4,687 | 14.5% |
| 10 to 14 Minutes | 5,904 | 18.2% |
| 15 to 19 Minutes | 6,654 | 20.5% |
| 20 to 24 Minutes | 4,389 | 13.6% |
| 25 to 29 Minutes | 1,808 | 5.6% |
| 30 to 34 Minutes | 2,695 | 8.3% |
| 35 to 39 Minutes | 672 | 2.1% |
| 40 to 44 Minutes | 507 | 1.6% |
| 45 to 59 Minutes | 1,646 | 5.1% |
| 60 to 89 Minutes | 929 | 2.9% |
| 90 or more Minutes | 1,027 | 3.2% |
Commute Time by Sex in Highlands County
The most common commute times in Highlands County are 15 to 19 minutes (3,285 commuters, 18.7%) for males and 15 to 19 minutes (3,369 commuters, 22.7%) for females.
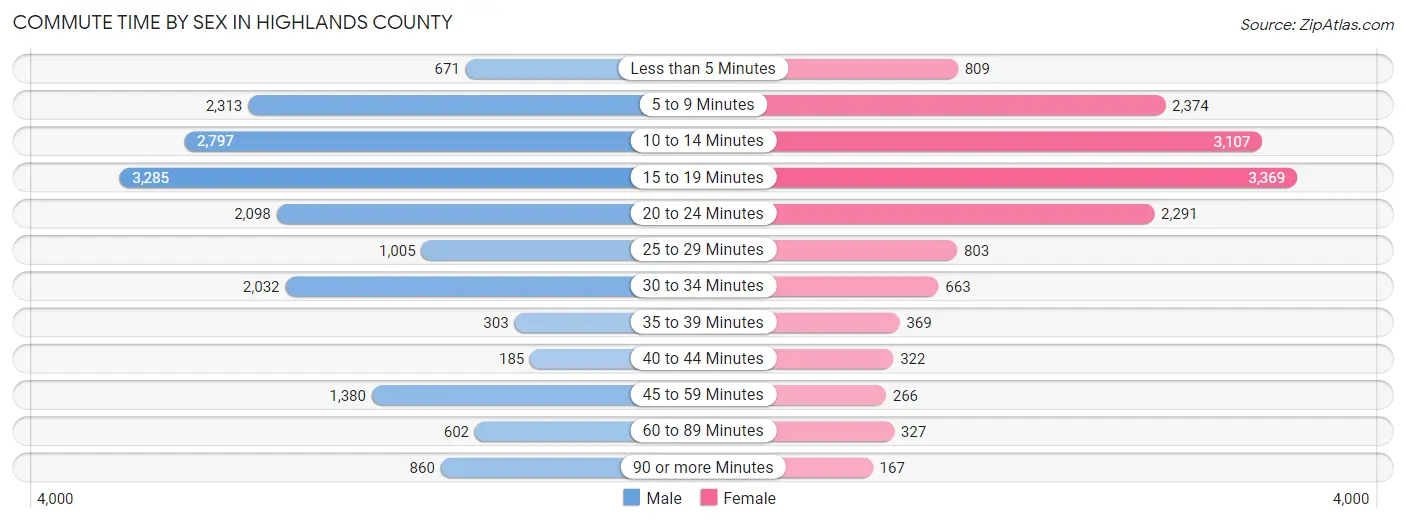
| Commute Time | Male | Female |
| Less than 5 Minutes | 671 (3.8%) | 809 (5.4%) |
| 5 to 9 Minutes | 2,313 (13.2%) | 2,374 (16.0%) |
| 10 to 14 Minutes | 2,797 (16.0%) | 3,107 (20.9%) |
| 15 to 19 Minutes | 3,285 (18.7%) | 3,369 (22.7%) |
| 20 to 24 Minutes | 2,098 (12.0%) | 2,291 (15.4%) |
| 25 to 29 Minutes | 1,005 (5.7%) | 803 (5.4%) |
| 30 to 34 Minutes | 2,032 (11.6%) | 663 (4.5%) |
| 35 to 39 Minutes | 303 (1.7%) | 369 (2.5%) |
| 40 to 44 Minutes | 185 (1.1%) | 322 (2.2%) |
| 45 to 59 Minutes | 1,380 (7.9%) | 266 (1.8%) |
| 60 to 89 Minutes | 602 (3.4%) | 327 (2.2%) |
| 90 or more Minutes | 860 (4.9%) | 167 (1.1%) |
Time of Departure to Work by Sex in Highlands County
The most frequent times of departure to work in Highlands County are 7:00 AM to 7:29 AM (2,761, 15.8%) for males and 7:30 AM to 7:59 AM (2,866, 19.3%) for females.
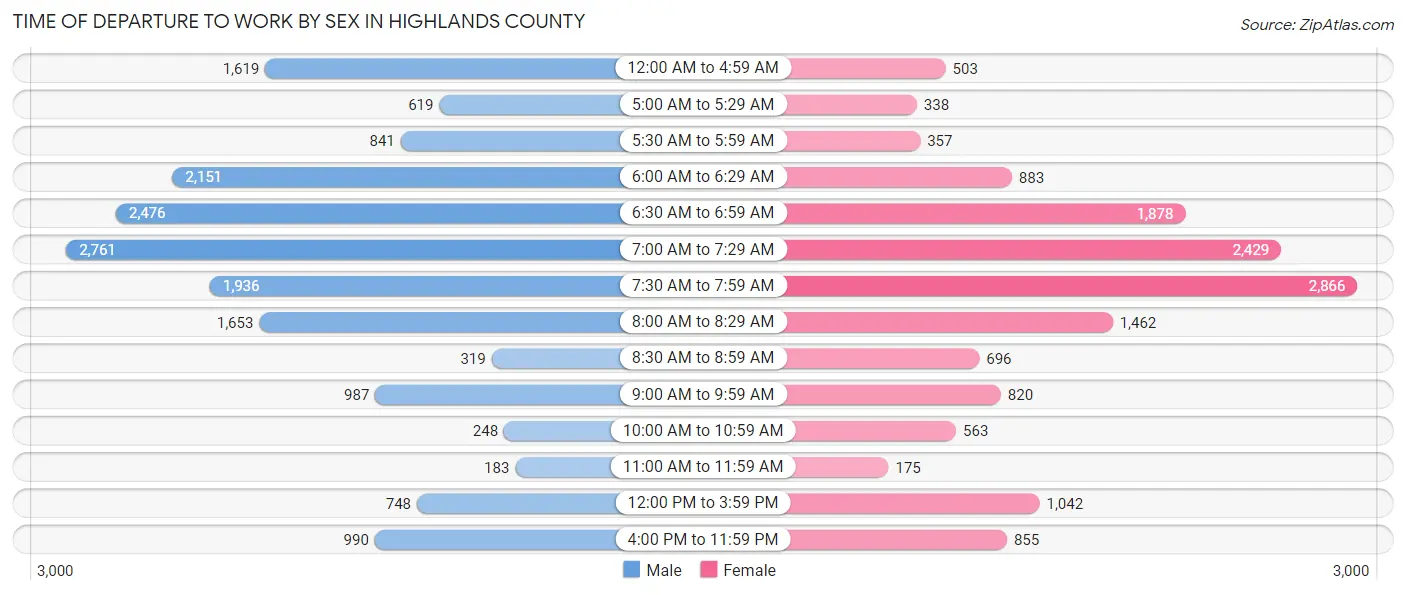
| Time of Departure | Male | Female |
| 12:00 AM to 4:59 AM | 1,619 (9.2%) | 503 (3.4%) |
| 5:00 AM to 5:29 AM | 619 (3.5%) | 338 (2.3%) |
| 5:30 AM to 5:59 AM | 841 (4.8%) | 357 (2.4%) |
| 6:00 AM to 6:29 AM | 2,151 (12.3%) | 883 (5.9%) |
| 6:30 AM to 6:59 AM | 2,476 (14.1%) | 1,878 (12.6%) |
| 7:00 AM to 7:29 AM | 2,761 (15.8%) | 2,429 (16.3%) |
| 7:30 AM to 7:59 AM | 1,936 (11.0%) | 2,866 (19.3%) |
| 8:00 AM to 8:29 AM | 1,653 (9.4%) | 1,462 (9.8%) |
| 8:30 AM to 8:59 AM | 319 (1.8%) | 696 (4.7%) |
| 9:00 AM to 9:59 AM | 987 (5.6%) | 820 (5.5%) |
| 10:00 AM to 10:59 AM | 248 (1.4%) | 563 (3.8%) |
| 11:00 AM to 11:59 AM | 183 (1.0%) | 175 (1.2%) |
| 12:00 PM to 3:59 PM | 748 (4.3%) | 1,042 (7.0%) |
| 4:00 PM to 11:59 PM | 990 (5.7%) | 855 (5.8%) |
| Total | 17,531 (100.0%) | 14,867 (100.0%) |
Housing Occupancy in Highlands County
Occupancy by Ownership in Highlands County
Of the total 44,685 dwellings in Highlands County, owner-occupied units account for 35,026 (78.4%), while renter-occupied units make up 9,659 (21.6%).
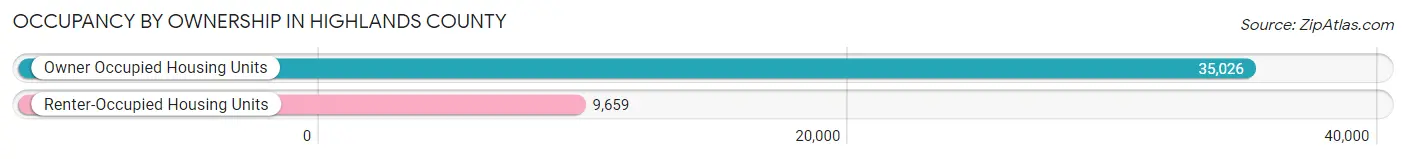
| Occupancy | # Housing Units | % Housing Units |
| Owner Occupied Housing Units | 35,026 | 78.4% |
| Renter-Occupied Housing Units | 9,659 | 21.6% |
| Total Occupied Housing Units | 44,685 | 100.0% |
Occupancy by Household Size in Highlands County
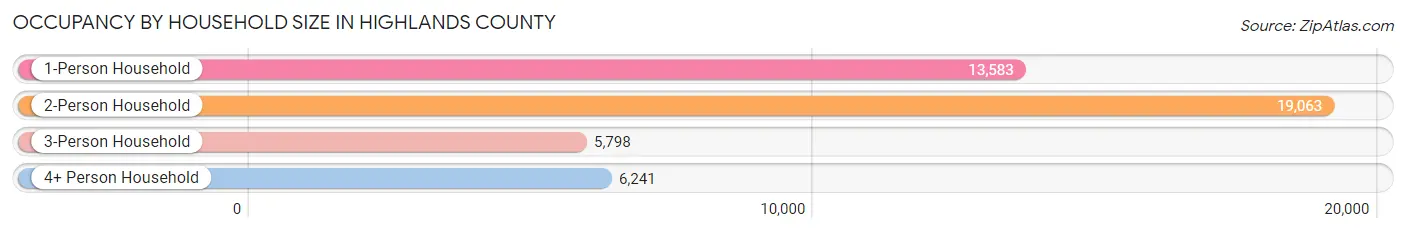
| Household Size | # Housing Units | % Housing Units |
| 1-Person Household | 13,583 | 30.4% |
| 2-Person Household | 19,063 | 42.7% |
| 3-Person Household | 5,798 | 13.0% |
| 4+ Person Household | 6,241 | 14.0% |
| Total Housing Units | 44,685 | 100.0% |
Occupancy by Ownership by Household Size in Highlands County
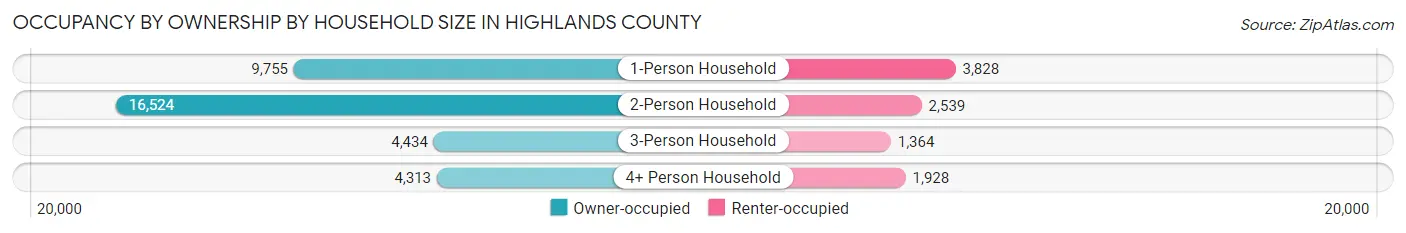
| Household Size | Owner-occupied | Renter-occupied |
| 1-Person Household | 9,755 (71.8%) | 3,828 (28.2%) |
| 2-Person Household | 16,524 (86.7%) | 2,539 (13.3%) |
| 3-Person Household | 4,434 (76.5%) | 1,364 (23.5%) |
| 4+ Person Household | 4,313 (69.1%) | 1,928 (30.9%) |
| Total Housing Units | 35,026 (78.4%) | 9,659 (21.6%) |
Occupancy by Educational Attainment in Highlands County
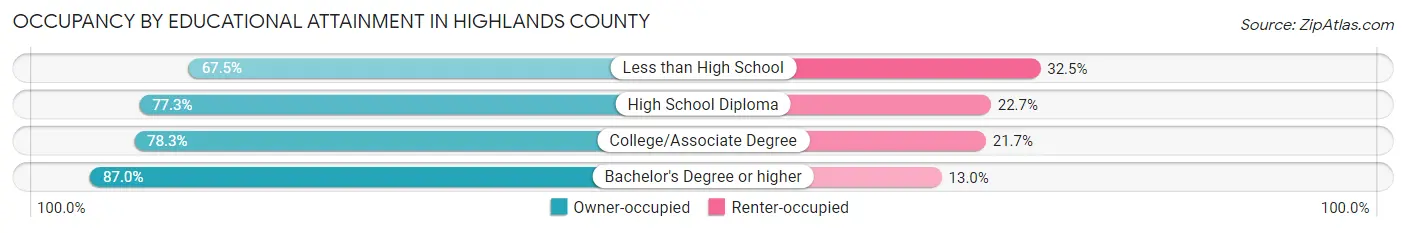
| Household Size | Owner-occupied | Renter-occupied |
| Less than High School | 3,563 (67.5%) | 1,719 (32.5%) |
| High School Diploma | 11,790 (77.3%) | 3,468 (22.7%) |
| College/Associate Degree | 11,982 (78.3%) | 3,326 (21.7%) |
| Bachelor's Degree or higher | 7,691 (87.0%) | 1,146 (13.0%) |
Occupancy by Age of Householder in Highlands County
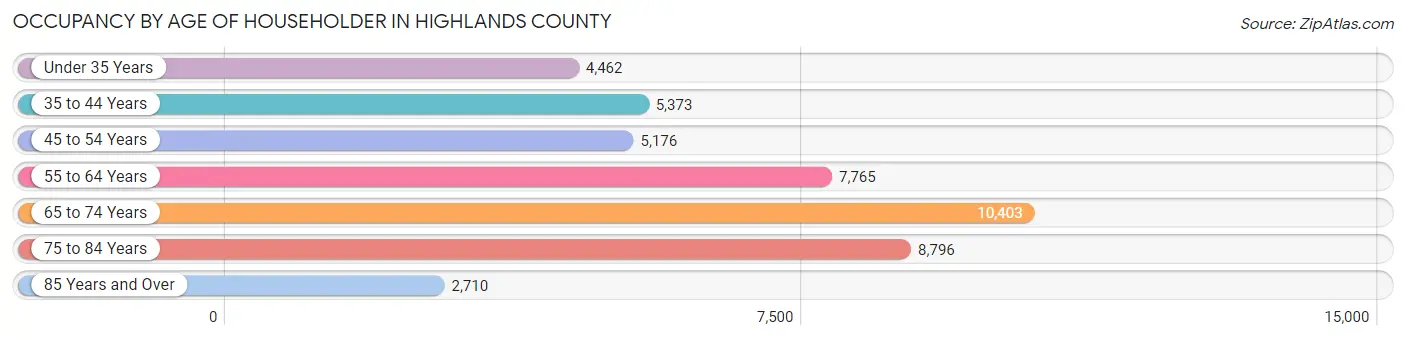
| Age Bracket | # Households | % Households |
| Under 35 Years | 4,462 | 10.0% |
| 35 to 44 Years | 5,373 | 12.0% |
| 45 to 54 Years | 5,176 | 11.6% |
| 55 to 64 Years | 7,765 | 17.4% |
| 65 to 74 Years | 10,403 | 23.3% |
| 75 to 84 Years | 8,796 | 19.7% |
| 85 Years and Over | 2,710 | 6.1% |
| Total | 44,685 | 100.0% |
Housing Finances in Highlands County
Median Income by Occupancy in Highlands County
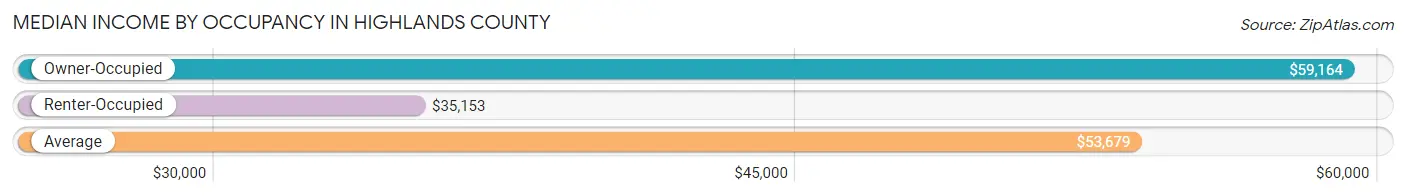
| Occupancy Type | # Households | Median Income |
| Owner-Occupied | 35,026 (78.4%) | $59,164 |
| Renter-Occupied | 9,659 (21.6%) | $35,153 |
| Average | 44,685 (100.0%) | $53,679 |
Occupancy by Householder Income Bracket in Highlands County
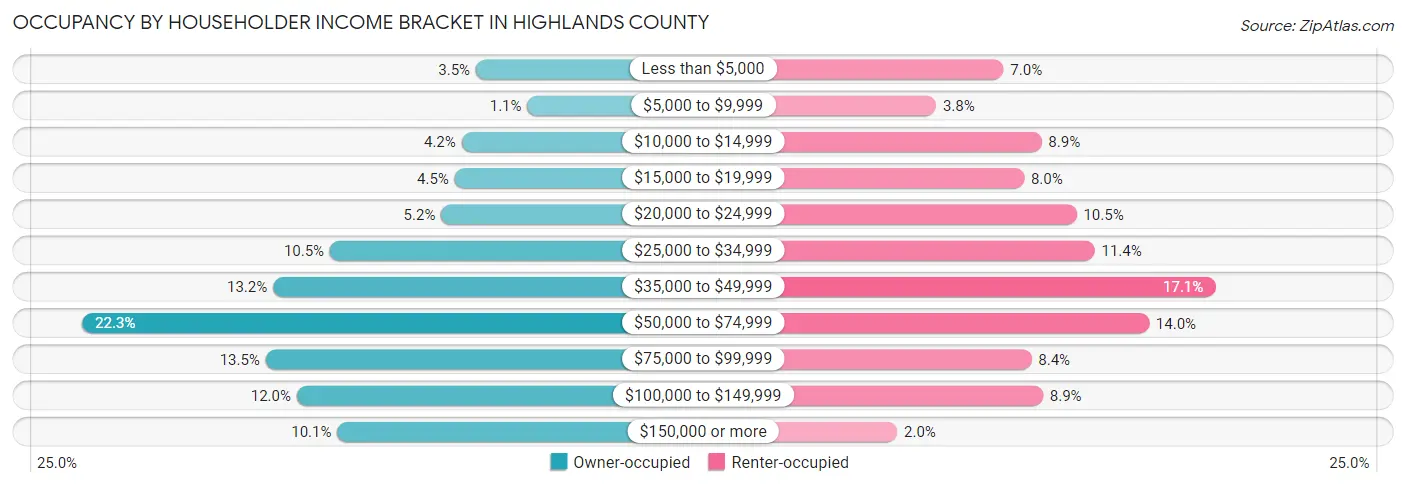
| Income Bracket | Owner-occupied | Renter-occupied |
| Less than $5,000 | 1,231 (3.5%) | 680 (7.0%) |
| $5,000 to $9,999 | 371 (1.1%) | 370 (3.8%) |
| $10,000 to $14,999 | 1,468 (4.2%) | 855 (8.8%) |
| $15,000 to $19,999 | 1,582 (4.5%) | 775 (8.0%) |
| $20,000 to $24,999 | 1,806 (5.2%) | 1,016 (10.5%) |
| $25,000 to $34,999 | 3,665 (10.5%) | 1,099 (11.4%) |
| $35,000 to $49,999 | 4,612 (13.2%) | 1,654 (17.1%) |
| $50,000 to $74,999 | 7,798 (22.3%) | 1,349 (14.0%) |
| $75,000 to $99,999 | 4,736 (13.5%) | 808 (8.4%) |
| $100,000 to $149,999 | 4,216 (12.0%) | 862 (8.9%) |
| $150,000 or more | 3,541 (10.1%) | 191 (2.0%) |
| Total | 35,026 (100.0%) | 9,659 (100.0%) |
Monthly Housing Cost Tiers in Highlands County
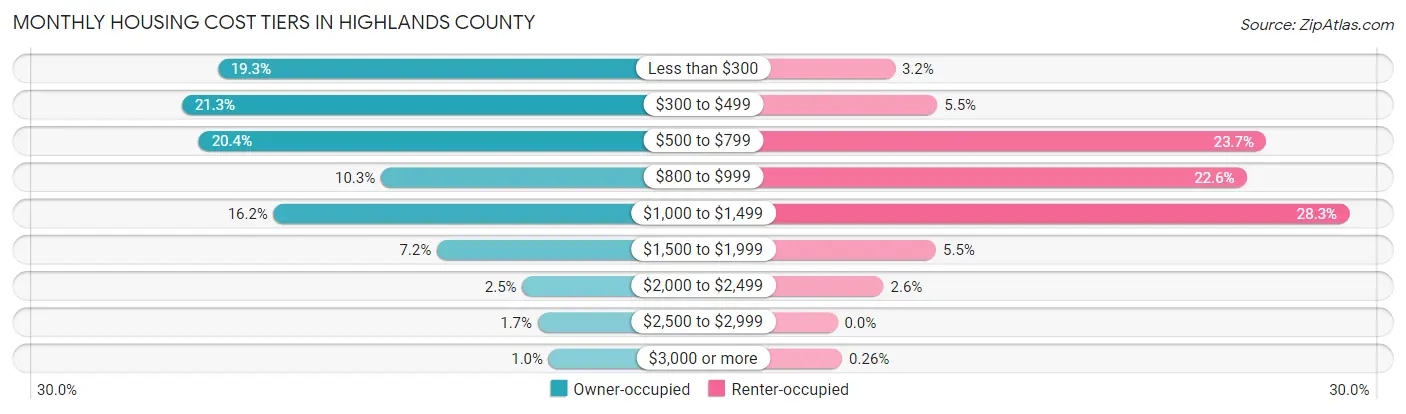
| Monthly Cost | Owner-occupied | Renter-occupied |
| Less than $300 | 6,772 (19.3%) | 307 (3.2%) |
| $300 to $499 | 7,468 (21.3%) | 533 (5.5%) |
| $500 to $799 | 7,138 (20.4%) | 2,285 (23.7%) |
| $800 to $999 | 3,611 (10.3%) | 2,182 (22.6%) |
| $1,000 to $1,499 | 5,689 (16.2%) | 2,729 (28.2%) |
| $1,500 to $1,999 | 2,530 (7.2%) | 526 (5.4%) |
| $2,000 to $2,499 | 874 (2.5%) | 246 (2.5%) |
| $2,500 to $2,999 | 578 (1.7%) | 0 (0.0%) |
| $3,000 or more | 366 (1.0%) | 25 (0.3%) |
| Total | 35,026 (100.0%) | 9,659 (100.0%) |
Physical Housing Characteristics in Highlands County
Housing Structures in Highlands County
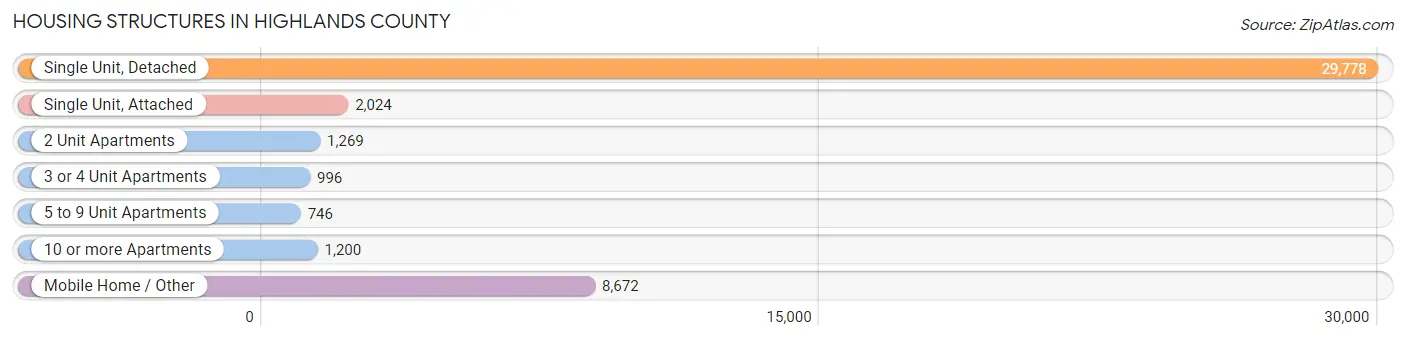
| Structure Type | # Housing Units | % Housing Units |
| Single Unit, Detached | 29,778 | 66.6% |
| Single Unit, Attached | 2,024 | 4.5% |
| 2 Unit Apartments | 1,269 | 2.8% |
| 3 or 4 Unit Apartments | 996 | 2.2% |
| 5 to 9 Unit Apartments | 746 | 1.7% |
| 10 or more Apartments | 1,200 | 2.7% |
| Mobile Home / Other | 8,672 | 19.4% |
| Total | 44,685 | 100.0% |
Housing Structures by Occupancy in Highlands County
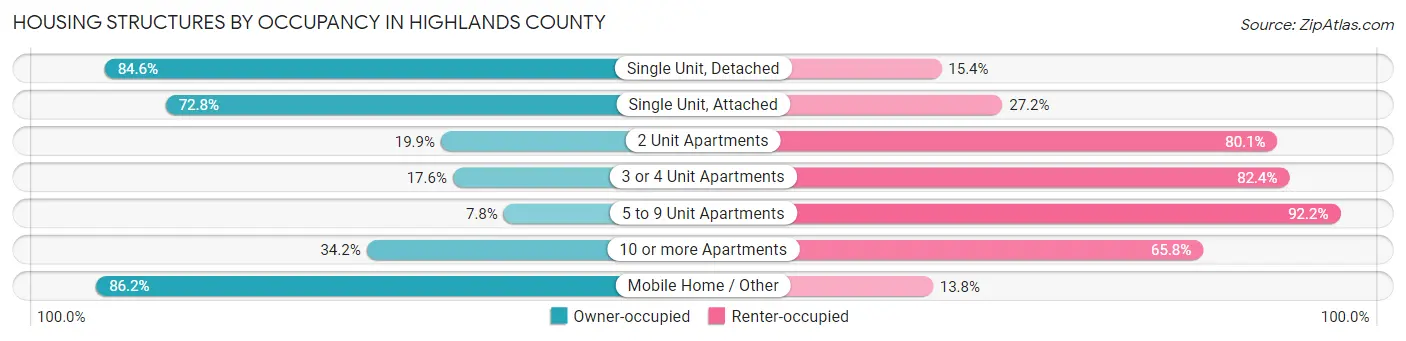
| Structure Type | Owner-occupied | Renter-occupied |
| Single Unit, Detached | 25,181 (84.6%) | 4,597 (15.4%) |
| Single Unit, Attached | 1,474 (72.8%) | 550 (27.2%) |
| 2 Unit Apartments | 252 (19.9%) | 1,017 (80.1%) |
| 3 or 4 Unit Apartments | 175 (17.6%) | 821 (82.4%) |
| 5 to 9 Unit Apartments | 58 (7.8%) | 688 (92.2%) |
| 10 or more Apartments | 410 (34.2%) | 790 (65.8%) |
| Mobile Home / Other | 7,476 (86.2%) | 1,196 (13.8%) |
| Total | 35,026 (78.4%) | 9,659 (21.6%) |
Housing Structures by Number of Rooms in Highlands County
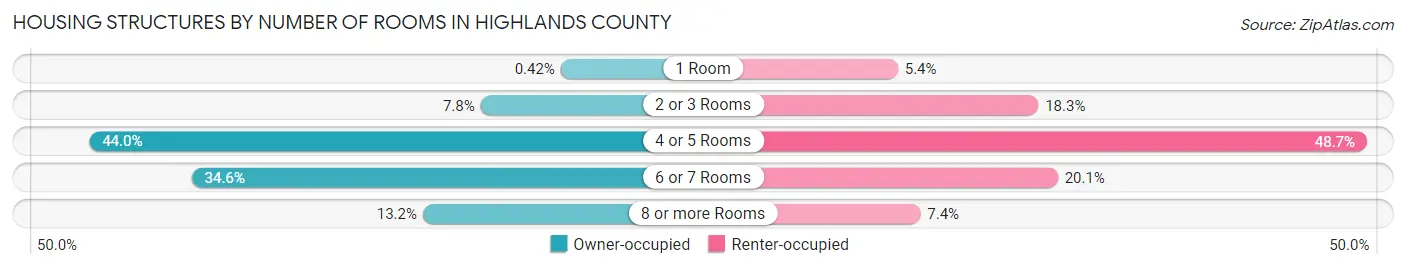
| Number of Rooms | Owner-occupied | Renter-occupied |
| 1 Room | 147 (0.4%) | 517 (5.3%) |
| 2 or 3 Rooms | 2,744 (7.8%) | 1,771 (18.3%) |
| 4 or 5 Rooms | 15,420 (44.0%) | 4,707 (48.7%) |
| 6 or 7 Rooms | 12,103 (34.5%) | 1,945 (20.1%) |
| 8 or more Rooms | 4,612 (13.2%) | 719 (7.4%) |
| Total | 35,026 (100.0%) | 9,659 (100.0%) |
Housing Structure by Heating Type in Highlands County
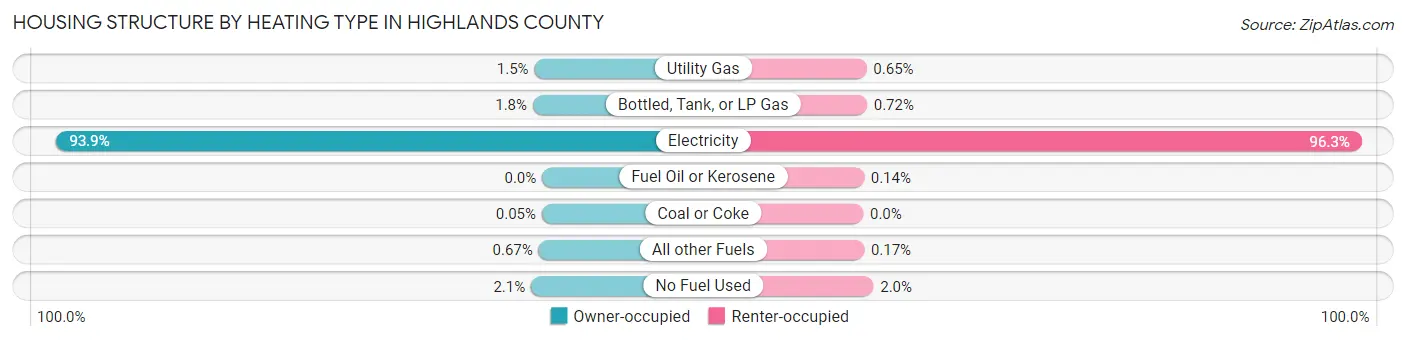
| Heating Type | Owner-occupied | Renter-occupied |
| Utility Gas | 521 (1.5%) | 63 (0.6%) |
| Bottled, Tank, or LP Gas | 624 (1.8%) | 70 (0.7%) |
| Electricity | 32,879 (93.9%) | 9,305 (96.3%) |
| Fuel Oil or Kerosene | 0 (0.0%) | 14 (0.1%) |
| Coal or Coke | 17 (0.1%) | 0 (0.0%) |
| All other Fuels | 234 (0.7%) | 16 (0.2%) |
| No Fuel Used | 751 (2.1%) | 191 (2.0%) |
| Total | 35,026 (100.0%) | 9,659 (100.0%) |
Household Vehicle Usage in Highlands County
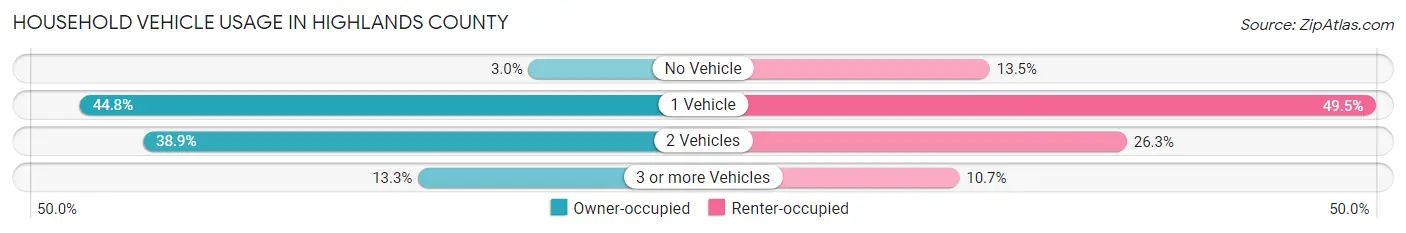
| Vehicles per Household | Owner-occupied | Renter-occupied |
| No Vehicle | 1,036 (3.0%) | 1,307 (13.5%) |
| 1 Vehicle | 15,705 (44.8%) | 4,779 (49.5%) |
| 2 Vehicles | 13,640 (38.9%) | 2,541 (26.3%) |
| 3 or more Vehicles | 4,645 (13.3%) | 1,032 (10.7%) |
| Total | 35,026 (100.0%) | 9,659 (100.0%) |
Real Estate & Mortgages in Highlands County
Real Estate and Mortgage Overview in Highlands County
| Characteristic | Without Mortgage | With Mortgage |
| Housing Units | 21,530 | 13,496 |
| Median Property Value | $126,800 | $186,100 |
| Median Household Income | $47,736 | $1,920 |
| Monthly Housing Costs | $414 | $355 |
| Real Estate Taxes | $959 | $600 |
Property Value by Mortgage Status in Highlands County
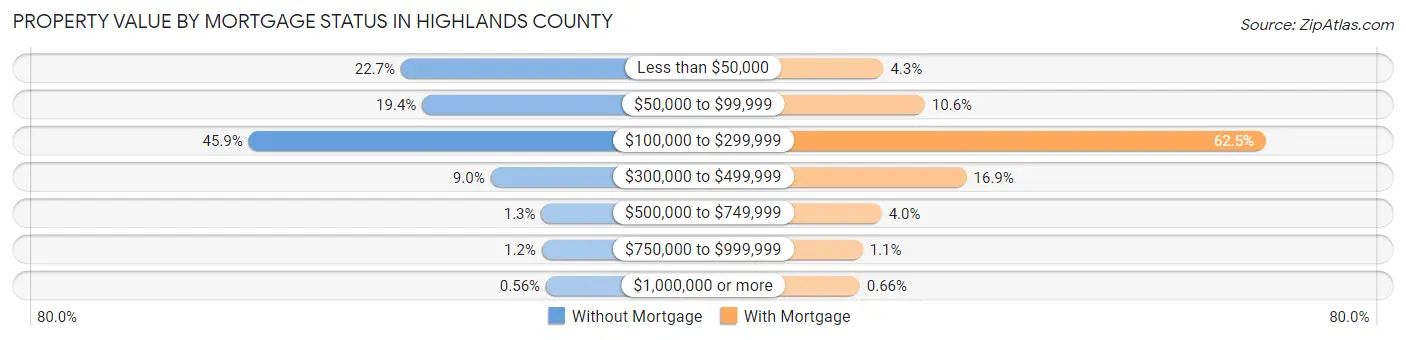
| Property Value | Without Mortgage | With Mortgage |
| Less than $50,000 | 4,882 (22.7%) | 575 (4.3%) |
| $50,000 to $99,999 | 4,181 (19.4%) | 1,426 (10.6%) |
| $100,000 to $299,999 | 9,877 (45.9%) | 8,439 (62.5%) |
| $300,000 to $499,999 | 1,939 (9.0%) | 2,282 (16.9%) |
| $500,000 to $749,999 | 270 (1.3%) | 538 (4.0%) |
| $750,000 to $999,999 | 261 (1.2%) | 147 (1.1%) |
| $1,000,000 or more | 120 (0.6%) | 89 (0.7%) |
| Total | 21,530 (100.0%) | 13,496 (100.0%) |
Household Income by Mortgage Status in Highlands County
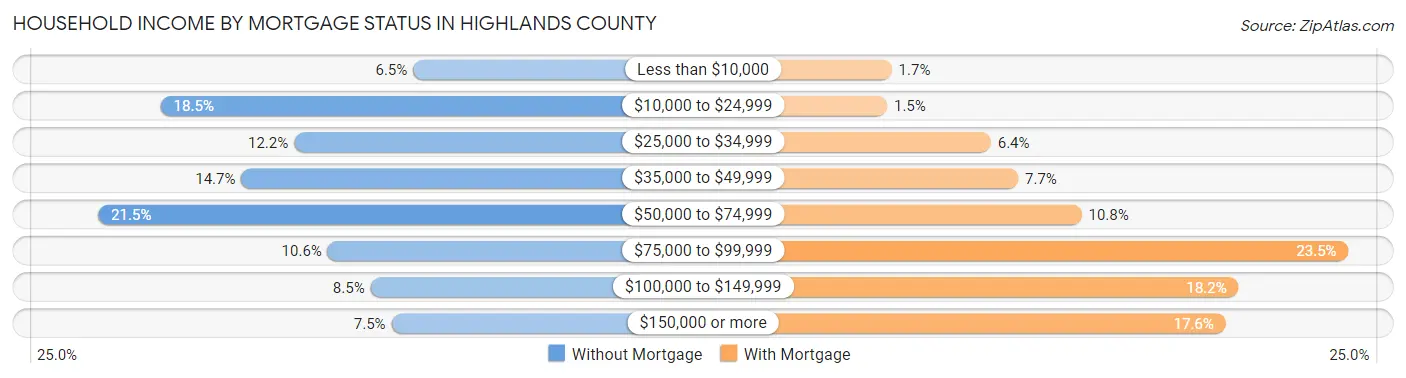
| Household Income | Without Mortgage | With Mortgage |
| Less than $10,000 | 1,399 (6.5%) | 232 (1.7%) |
| $10,000 to $24,999 | 3,987 (18.5%) | 203 (1.5%) |
| $25,000 to $34,999 | 2,621 (12.2%) | 869 (6.4%) |
| $35,000 to $49,999 | 3,160 (14.7%) | 1,044 (7.7%) |
| $50,000 to $74,999 | 4,630 (21.5%) | 1,452 (10.8%) |
| $75,000 to $99,999 | 2,275 (10.6%) | 3,168 (23.5%) |
| $100,000 to $149,999 | 1,837 (8.5%) | 2,461 (18.2%) |
| $150,000 or more | 1,621 (7.5%) | 2,379 (17.6%) |
| Total | 21,530 (100.0%) | 13,496 (100.0%) |
Property Value to Household Income Ratio in Highlands County
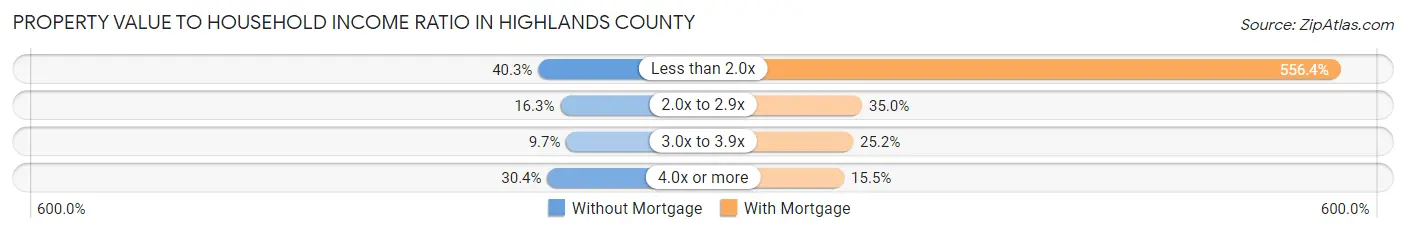
| Value-to-Income Ratio | Without Mortgage | With Mortgage |
| Less than 2.0x | 8,686 (40.3%) | 75,094 (556.4%) |
| 2.0x to 2.9x | 3,514 (16.3%) | 4,723 (35.0%) |
| 3.0x to 3.9x | 2,091 (9.7%) | 3,407 (25.2%) |
| 4.0x or more | 6,544 (30.4%) | 2,094 (15.5%) |
| Total | 21,530 (100.0%) | 13,496 (100.0%) |
Real Estate Taxes by Mortgage Status in Highlands County
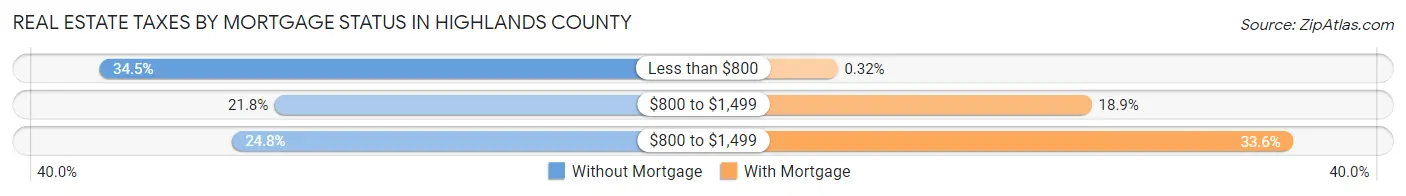
| Property Taxes | Without Mortgage | With Mortgage |
| Less than $800 | 7,424 (34.5%) | 43 (0.3%) |
| $800 to $1,499 | 4,687 (21.8%) | 2,550 (18.9%) |
| $800 to $1,499 | 5,345 (24.8%) | 4,532 (33.6%) |
| Total | 21,530 (100.0%) | 13,496 (100.0%) |
Health & Disability in Highlands County
Health Insurance Coverage by Age in Highlands County
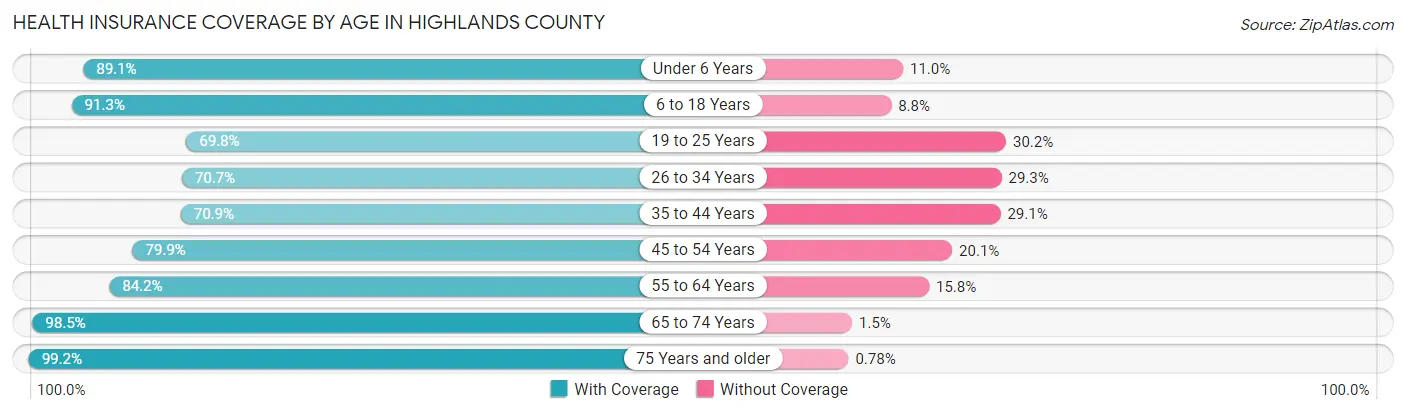
| Age Bracket | With Coverage | Without Coverage |
| Under 6 Years | 4,674 (89.0%) | 575 (11.0%) |
| 6 to 18 Years | 11,781 (91.2%) | 1,129 (8.7%) |
| 19 to 25 Years | 4,273 (69.8%) | 1,846 (30.2%) |
| 26 to 34 Years | 5,735 (70.7%) | 2,380 (29.3%) |
| 35 to 44 Years | 6,862 (70.9%) | 2,821 (29.1%) |
| 45 to 54 Years | 7,844 (79.9%) | 1,975 (20.1%) |
| 55 to 64 Years | 11,281 (84.2%) | 2,117 (15.8%) |
| 65 to 74 Years | 16,997 (98.5%) | 252 (1.5%) |
| 75 Years and older | 18,294 (99.2%) | 144 (0.8%) |
| Total | 87,741 (86.9%) | 13,239 (13.1%) |
Health Insurance Coverage by Citizenship Status in Highlands County
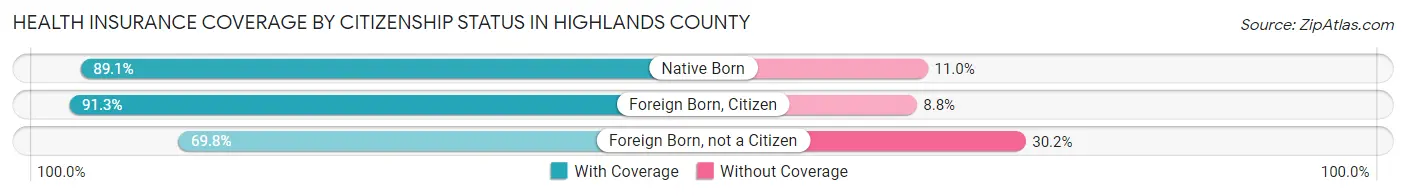
| Citizenship Status | With Coverage | Without Coverage |
| Native Born | 4,674 (89.0%) | 575 (11.0%) |
| Foreign Born, Citizen | 11,781 (91.2%) | 1,129 (8.7%) |
| Foreign Born, not a Citizen | 4,273 (69.8%) | 1,846 (30.2%) |
Health Insurance Coverage by Household Income in Highlands County
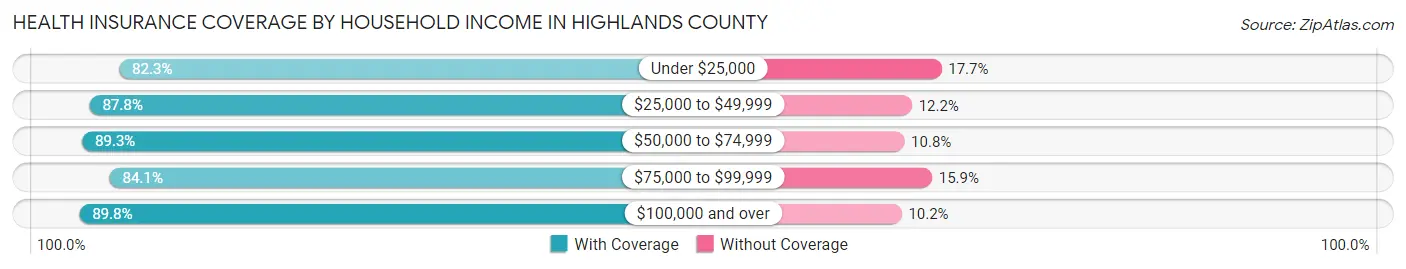
| Household Income | With Coverage | Without Coverage |
| Under $25,000 | 13,623 (82.3%) | 2,932 (17.7%) |
| $25,000 to $49,999 | 19,489 (87.8%) | 2,697 (12.2%) |
| $50,000 to $74,999 | 19,273 (89.2%) | 2,322 (10.7%) |
| $75,000 to $99,999 | 12,828 (84.1%) | 2,429 (15.9%) |
| $100,000 and over | 22,201 (89.8%) | 2,534 (10.2%) |
Public vs Private Health Insurance Coverage by Age in Highlands County
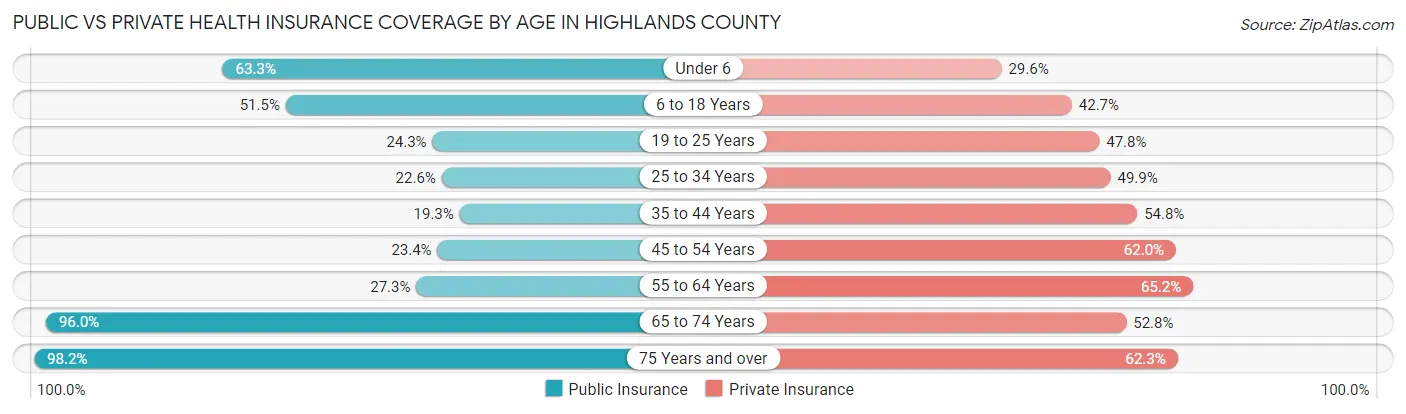
| Age Bracket | Public Insurance | Private Insurance |
| Under 6 | 3,320 (63.2%) | 1,556 (29.6%) |
| 6 to 18 Years | 6,652 (51.5%) | 5,512 (42.7%) |
| 19 to 25 Years | 1,487 (24.3%) | 2,925 (47.8%) |
| 25 to 34 Years | 1,833 (22.6%) | 4,048 (49.9%) |
| 35 to 44 Years | 1,865 (19.3%) | 5,309 (54.8%) |
| 45 to 54 Years | 2,295 (23.4%) | 6,089 (62.0%) |
| 55 to 64 Years | 3,656 (27.3%) | 8,734 (65.2%) |
| 65 to 74 Years | 16,566 (96.0%) | 9,108 (52.8%) |
| 75 Years and over | 18,110 (98.2%) | 11,489 (62.3%) |
| Total | 55,784 (55.2%) | 54,770 (54.2%) |
Disability Status by Sex by Age in Highlands County
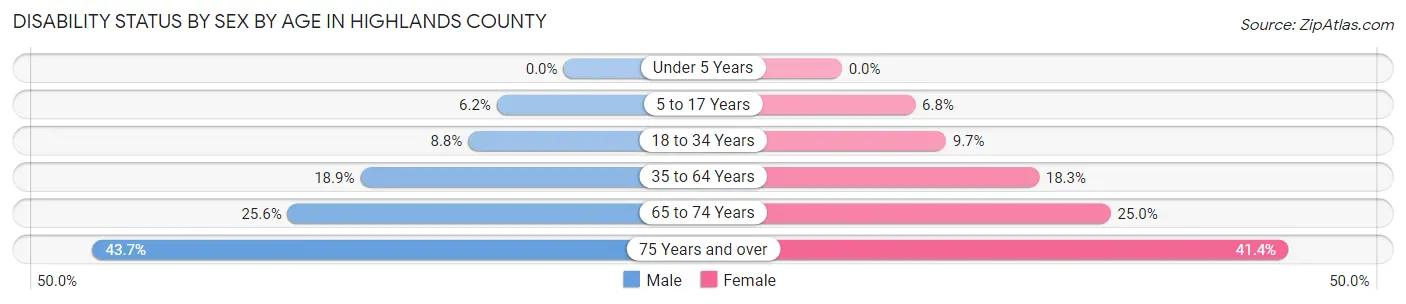
| Age Bracket | Male | Female |
| Under 5 Years | 0 (0.0%) | 0 (0.0%) |
| 5 to 17 Years | 404 (6.2%) | 433 (6.8%) |
| 18 to 34 Years | 692 (8.8%) | 716 (9.7%) |
| 35 to 64 Years | 3,031 (18.9%) | 3,076 (18.3%) |
| 65 to 74 Years | 2,061 (25.6%) | 2,295 (24.9%) |
| 75 Years and over | 3,883 (43.7%) | 3,953 (41.4%) |
Disability Class by Sex by Age in Highlands County
Disability Class: Hearing Difficulty
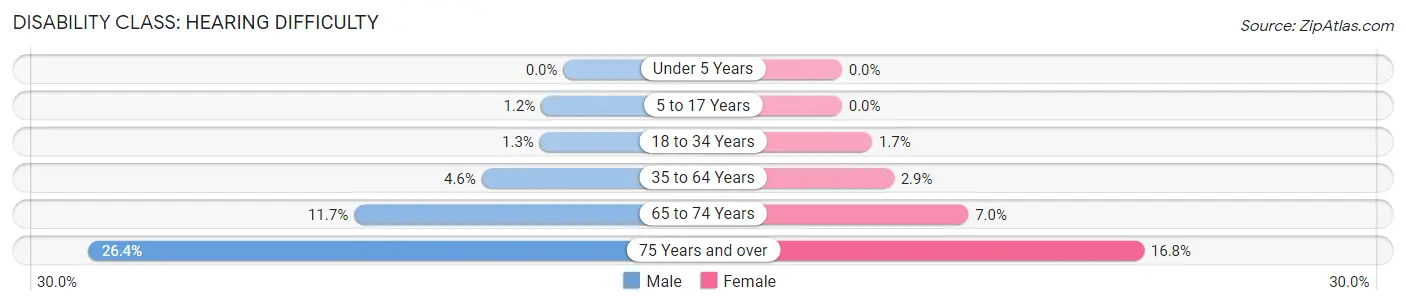
| Age Bracket | Male | Female |
| Under 5 Years | 0 (0.0%) | 0 (0.0%) |
| 5 to 17 Years | 81 (1.2%) | 0 (0.0%) |
| 18 to 34 Years | 103 (1.3%) | 125 (1.7%) |
| 35 to 64 Years | 731 (4.5%) | 486 (2.9%) |
| 65 to 74 Years | 939 (11.7%) | 648 (7.0%) |
| 75 Years and over | 2,349 (26.4%) | 1,606 (16.8%) |
Disability Class: Vision Difficulty
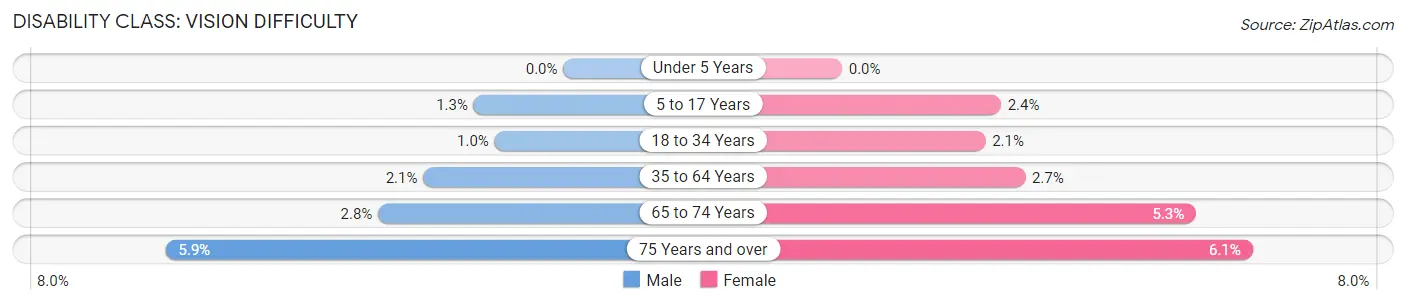
| Age Bracket | Male | Female |
| Under 5 Years | 0 (0.0%) | 0 (0.0%) |
| 5 to 17 Years | 87 (1.3%) | 150 (2.4%) |
| 18 to 34 Years | 80 (1.0%) | 158 (2.1%) |
| 35 to 64 Years | 335 (2.1%) | 458 (2.7%) |
| 65 to 74 Years | 221 (2.8%) | 484 (5.3%) |
| 75 Years and over | 525 (5.9%) | 582 (6.1%) |
Disability Class: Cognitive Difficulty
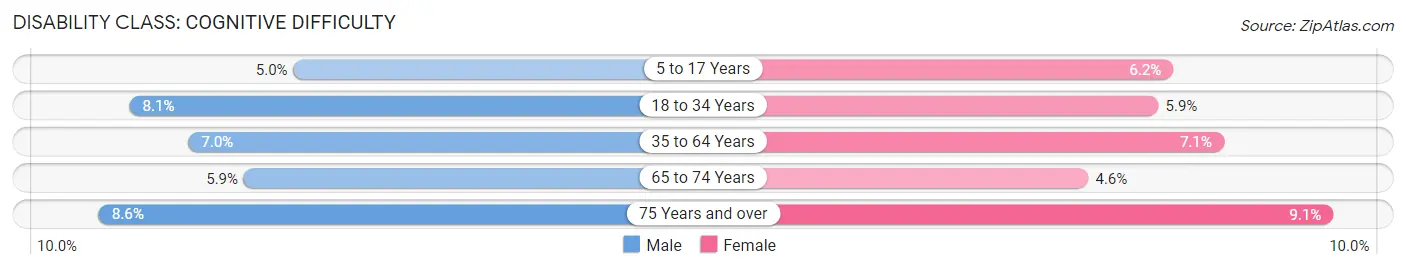
| Age Bracket | Male | Female |
| 5 to 17 Years | 327 (5.0%) | 391 (6.1%) |
| 18 to 34 Years | 630 (8.1%) | 436 (5.9%) |
| 35 to 64 Years | 1,119 (7.0%) | 1,192 (7.1%) |
| 65 to 74 Years | 477 (5.9%) | 421 (4.6%) |
| 75 Years and over | 766 (8.6%) | 871 (9.1%) |
Disability Class: Ambulatory Difficulty
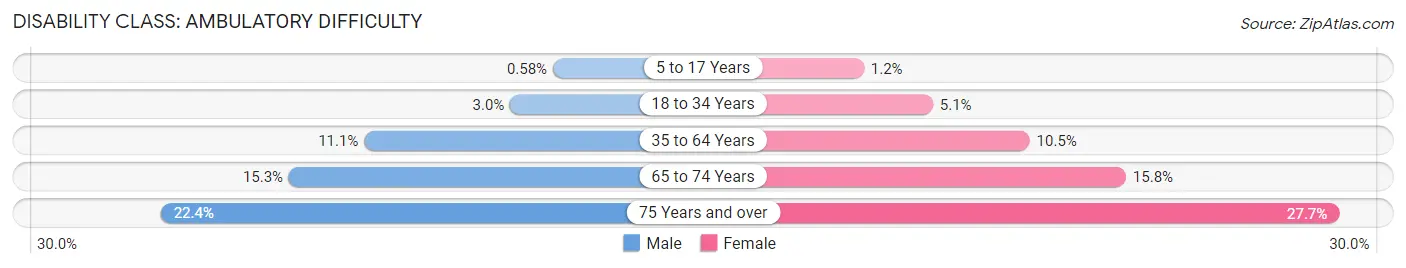
| Age Bracket | Male | Female |
| 5 to 17 Years | 38 (0.6%) | 78 (1.2%) |
| 18 to 34 Years | 232 (3.0%) | 376 (5.1%) |
| 35 to 64 Years | 1,783 (11.1%) | 1,760 (10.5%) |
| 65 to 74 Years | 1,230 (15.3%) | 1,455 (15.8%) |
| 75 Years and over | 1,993 (22.4%) | 2,644 (27.7%) |
Disability Class: Self-Care Difficulty
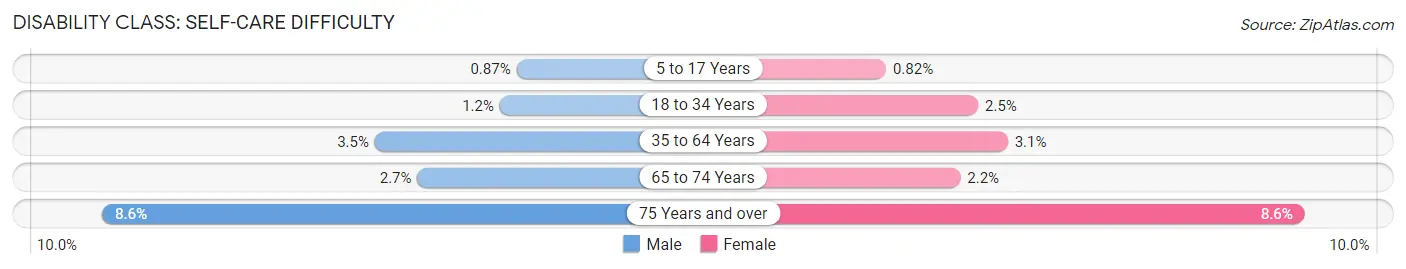
| Age Bracket | Male | Female |
| 5 to 17 Years | 57 (0.9%) | 52 (0.8%) |
| 18 to 34 Years | 92 (1.2%) | 188 (2.5%) |
| 35 to 64 Years | 563 (3.5%) | 519 (3.1%) |
| 65 to 74 Years | 218 (2.7%) | 202 (2.2%) |
| 75 Years and over | 761 (8.6%) | 820 (8.6%) |
Technology Access in Highlands County
Computing Device Access in Highlands County
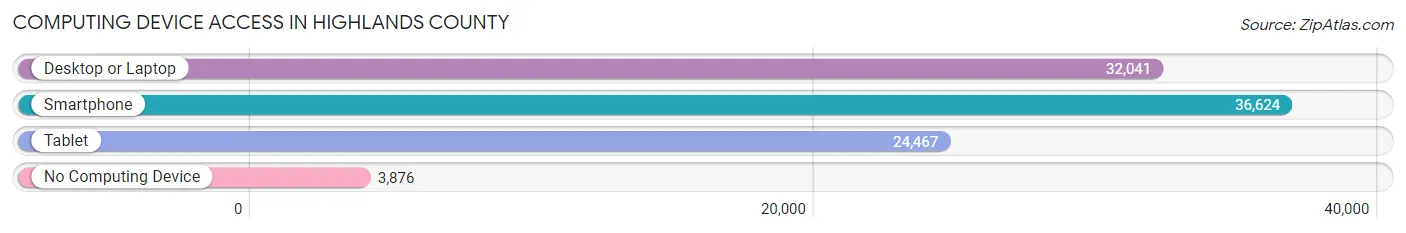
| Device Type | # Households | % Households |
| Desktop or Laptop | 32,041 | 71.7% |
| Smartphone | 36,624 | 82.0% |
| Tablet | 24,467 | 54.7% |
| No Computing Device | 3,876 | 8.7% |
| Total | 44,685 | 100.0% |
Internet Access in Highlands County
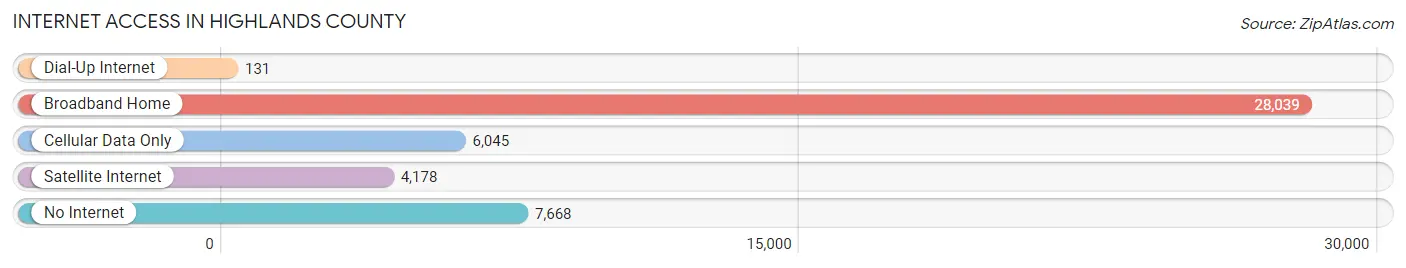
| Internet Type | # Households | % Households |
| Dial-Up Internet | 131 | 0.3% |
| Broadband Home | 28,039 | 62.7% |
| Cellular Data Only | 6,045 | 13.5% |
| Satellite Internet | 4,178 | 9.3% |
| No Internet | 7,668 | 17.2% |
| Total | 44,685 | 100.0% |
Highlands County Summary
Highlands County is located in the central part of the state of Florida, in the United States. It is part of the Tampa-St. Petersburg-Clearwater Metropolitan Statistical Area. The county was created in 1921 from parts of DeSoto and Hardee counties. It is named for the high elevation of its terrain, which is the highest in the state.
Geography
Highlands County covers an area of 1,106 square miles, making it the fifth-largest county in Florida. It is located in the central part of the state, bordered by Polk County to the north, Hardee County to the east, DeSoto County to the south, and Glades and Okeechobee counties to the west. The county is mostly rural, with a few small towns and cities. The county seat is Sebring, which is located in the center of the county.
The terrain of Highlands County is mostly flat, with some rolling hills. The highest point in the county is Iron Mountain, which has an elevation of 312 feet. The county is home to several lakes, including Lake Istokpoga, Lake June-in-Winter, and Lake Placid. The county is also home to several state parks, including Highlands Hammock State Park, Lake Kissimmee State Park, and Lake Wales Ridge State Park.
Demographics
As of the 2010 census, Highlands County had a population of 98,786. The racial makeup of the county was 79.2% White, 14.3% African American, 0.5% Native American, 1.2% Asian, 0.1% Pacific Islander, 3.2% from other races, and 1.6% from two or more races. Hispanic or Latino of any race were 11.2% of the population.
The median household income in the county was $37,845, and the median family income was $45,945. The per capita income was $20,945. About 14.2% of the population was below the poverty line.
Economy
Highlands County has a diverse economy, with a mix of agriculture, manufacturing, and tourism. The county is home to several large agricultural operations, including citrus groves, cattle ranches, and vegetable farms. The county is also home to several manufacturing companies, including a paper mill, a plastics plant, and a metal fabrication plant.
Tourism is an important part of the county's economy. The county is home to several popular attractions, including Sebring International Raceway, Highlands Hammock State Park, and Lake Placid. The county also hosts several annual events, including the Sebring 12 Hours of Endurance Race and the Highlands County Fair.
Conclusion
Highlands County is a rural county located in the central part of Florida. It is home to a diverse economy, with a mix of agriculture, manufacturing, and tourism. The county has a population of 98,786, and the median household income is $37,845. The county is home to several popular attractions, including Sebring International Raceway and Highlands Hammock State Park.
Common Questions
What is Per Capita Income in Highlands County?
Per Capita income in Highlands County is $31,864.
What is the Median Family Income in Highlands County?
Median Family Income in Highlands County is $62,914.
What is the Median Household income in Highlands County?
Median Household Income in Highlands County is $53,679.
What is Income or Wage Gap in Highlands County?
Income or Wage Gap in Highlands County is 23.4%.
Women in Highlands County earn 76.6 cents for every dollar earned by a man.
What is Family Income Deficit in Highlands County?
Family Income Deficit in Highlands County is $10,141.
Families that are below poverty line in Highlands County earn $10,141 less on average than the poverty threshold level.
What is Inequality or Gini Index in Highlands County?
Inequality or Gini Index in Highlands County is 0.46.
What is the Total Population of Highlands County?
Total Population of Highlands County is 102,339.
What is the Total Male Population of Highlands County?
Total Male Population of Highlands County is 50,232.
What is the Total Female Population of Highlands County?
Total Female Population of Highlands County is 52,107.
What is the Ratio of Males per 100 Females in Highlands County?
There are 96.40 Males per 100 Females in Highlands County.
What is the Ratio of Females per 100 Males in Highlands County?
There are 103.73 Females per 100 Males in Highlands County.
What is the Median Population Age in Highlands County?
Median Population Age in Highlands County is 54.1 Years.
What is the Average Family Size in Highlands County
Average Family Size in Highlands County is 2.8 People.
What is the Average Household Size in Highlands County
Average Household Size in Highlands County is 2.2 People.
How Large is the Labor Force in Highlands County?
There are 37,933 People in the Labor Forcein in Highlands County.
What is the Percentage of People in the Labor Force in Highlands County?
43.5% of People are in the Labor Force in Highlands County.
What is the Unemployment Rate in Highlands County?
Unemployment Rate in Highlands County is 6.8%.