Hendry County, FL Map & Demographics
Hendry County Map
Hendry County Overview
$24,825
PER CAPITA INCOME
$53,267
AVG FAMILY INCOME
$49,259
AVG HOUSEHOLD INCOME
23.2%
WAGE / INCOME GAP [ % ]
76.8¢/ $1
WAGE / INCOME GAP [ $ ]
$10,976
FAMILY INCOME DEFICIT
0.47
INEQUALITY / GINI INDEX
39,902
TOTAL POPULATION
21,905
MALE POPULATION
17,997
FEMALE POPULATION
121.71
MALES / 100 FEMALES
82.16
FEMALES / 100 MALES
35.1
MEDIAN AGE
3.2
AVG FAMILY SIZE
2.8
AVG HOUSEHOLD SIZE
19,306
LABOR FORCE [ PEOPLE ]
62.3%
PERCENT IN LABOR FORCE
5.8%
UNEMPLOYMENT RATE
Hendry County Area Codes
Income in Hendry County
Income Overview in Hendry County
Per Capita Income in Hendry County is $24,825, while median incomes of families and households are $53,267 and $49,259 respectively.
| Characteristic | Number | Measure |
| Per Capita Income | 39,902 | $24,825 |
| Median Family Income | 9,937 | $53,267 |
| Mean Family Income | 9,937 | $77,436 |
| Median Household Income | 13,289 | $49,259 |
| Mean Household Income | 13,289 | $71,309 |
| Income Deficit | 9,937 | $10,976 |
| Wage / Income Gap (%) | 39,902 | 23.20% |
| Wage / Income Gap ($) | 39,902 | 76.80¢ per $1 |
| Gini / Inequality Index | 39,902 | 0.47 |
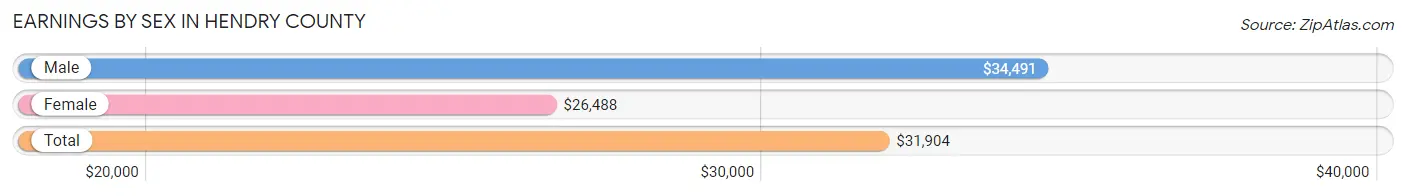
Earnings by Sex in Hendry County
Average Earnings in Hendry County are $31,904, $34,491 for men and $26,488 for women, a difference of 23.2%.
| Sex | Number | Average Earnings |
| Male | 12,043 (61.6%) | $34,491 |
| Female | 7,512 (38.4%) | $26,488 |
| Total | 19,555 (100.0%) | $31,904 |
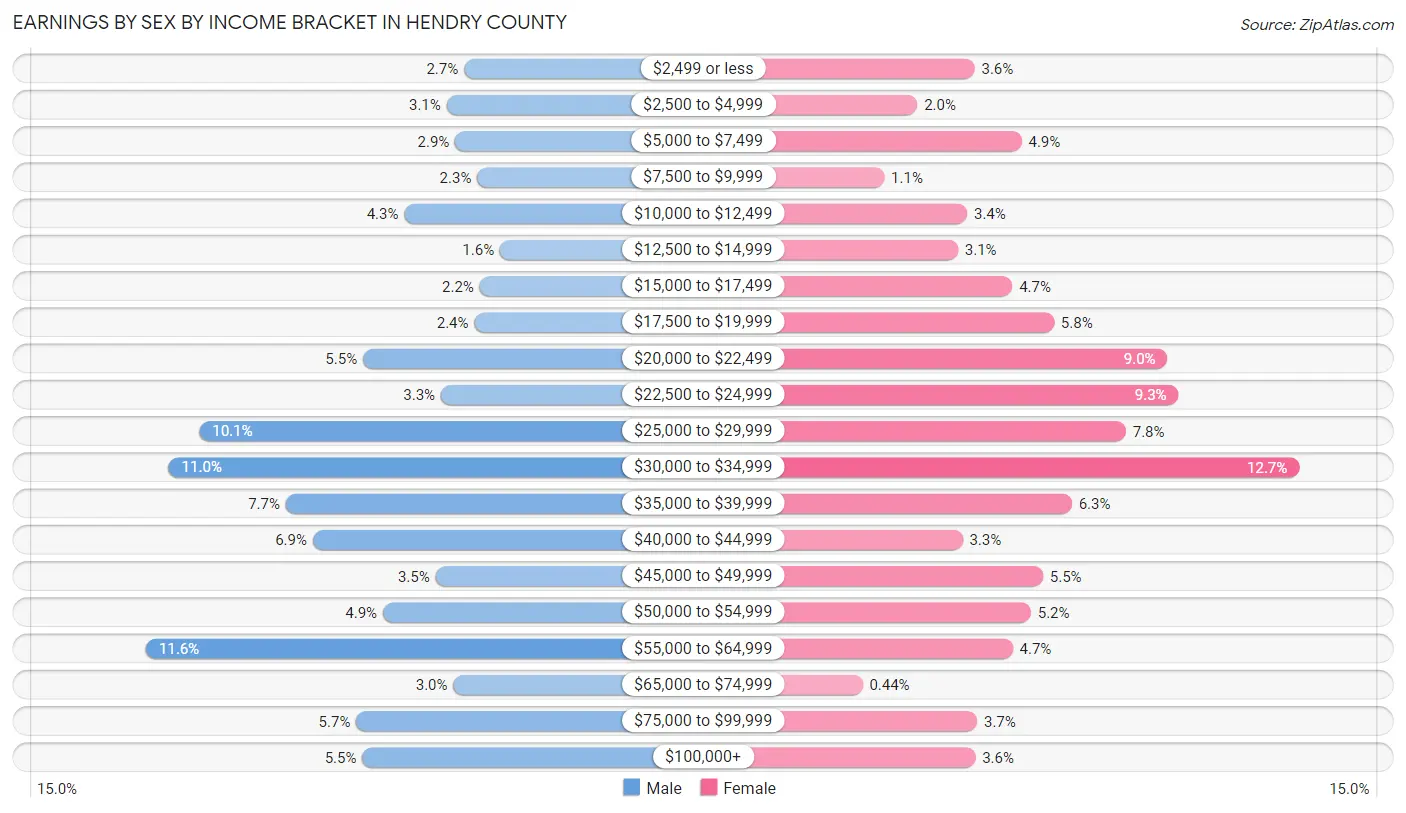
Earnings by Sex by Income Bracket in Hendry County
The most common earnings brackets in Hendry County are $55,000 to $64,999 for men (1,396 | 11.6%) and $30,000 to $34,999 for women (955 | 12.7%).
| Income | Male | Female |
| $2,499 or less | 319 (2.6%) | 270 (3.6%) |
| $2,500 to $4,999 | 378 (3.1%) | 149 (2.0%) |
| $5,000 to $7,499 | 349 (2.9%) | 369 (4.9%) |
| $7,500 to $9,999 | 274 (2.3%) | 79 (1.1%) |
| $10,000 to $12,499 | 522 (4.3%) | 254 (3.4%) |
| $12,500 to $14,999 | 198 (1.6%) | 234 (3.1%) |
| $15,000 to $17,499 | 266 (2.2%) | 349 (4.6%) |
| $17,500 to $19,999 | 284 (2.4%) | 437 (5.8%) |
| $20,000 to $22,499 | 661 (5.5%) | 677 (9.0%) |
| $22,500 to $24,999 | 397 (3.3%) | 700 (9.3%) |
| $25,000 to $29,999 | 1,215 (10.1%) | 589 (7.8%) |
| $30,000 to $34,999 | 1,319 (11.0%) | 955 (12.7%) |
| $35,000 to $39,999 | 923 (7.7%) | 475 (6.3%) |
| $40,000 to $44,999 | 831 (6.9%) | 244 (3.3%) |
| $45,000 to $49,999 | 415 (3.5%) | 414 (5.5%) |
| $50,000 to $54,999 | 594 (4.9%) | 388 (5.2%) |
| $55,000 to $64,999 | 1,396 (11.6%) | 350 (4.7%) |
| $65,000 to $74,999 | 355 (2.9%) | 33 (0.4%) |
| $75,000 to $99,999 | 684 (5.7%) | 275 (3.7%) |
| $100,000+ | 663 (5.5%) | 271 (3.6%) |
| Total | 12,043 (100.0%) | 7,512 (100.0%) |
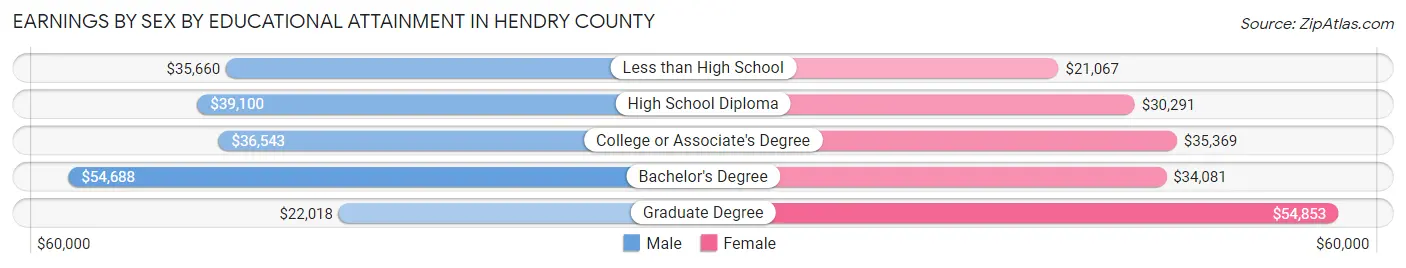
Earnings by Sex by Educational Attainment in Hendry County
Average earnings in Hendry County are $37,025 for men and $28,407 for women, a difference of 23.3%. Men with an educational attainment of bachelor's degree enjoy the highest average annual earnings of $54,688, while those with graduate degree education earn the least with $22,018. Women with an educational attainment of graduate degree earn the most with the average annual earnings of $54,853, while those with less than high school education have the smallest earnings of $21,067.
| Educational Attainment | Male Income | Female Income |
| Less than High School | $35,660 | $21,067 |
| High School Diploma | $39,100 | $30,291 |
| College or Associate's Degree | $36,543 | $35,369 |
| Bachelor's Degree | $54,688 | $34,081 |
| Graduate Degree | $22,018 | $54,853 |
| Total | $37,025 | $28,407 |
Family Income in Hendry County
Family Income Brackets in Hendry County
According to the Hendry County family income data, there are 1,659 families falling into the $50,000 to $74,999 income range, which is the most common income bracket and makes up 16.7% of all families. Conversely, the $10,000 to $14,999 income bracket is the least frequent group with only 238 families (2.4%) belonging to this category.
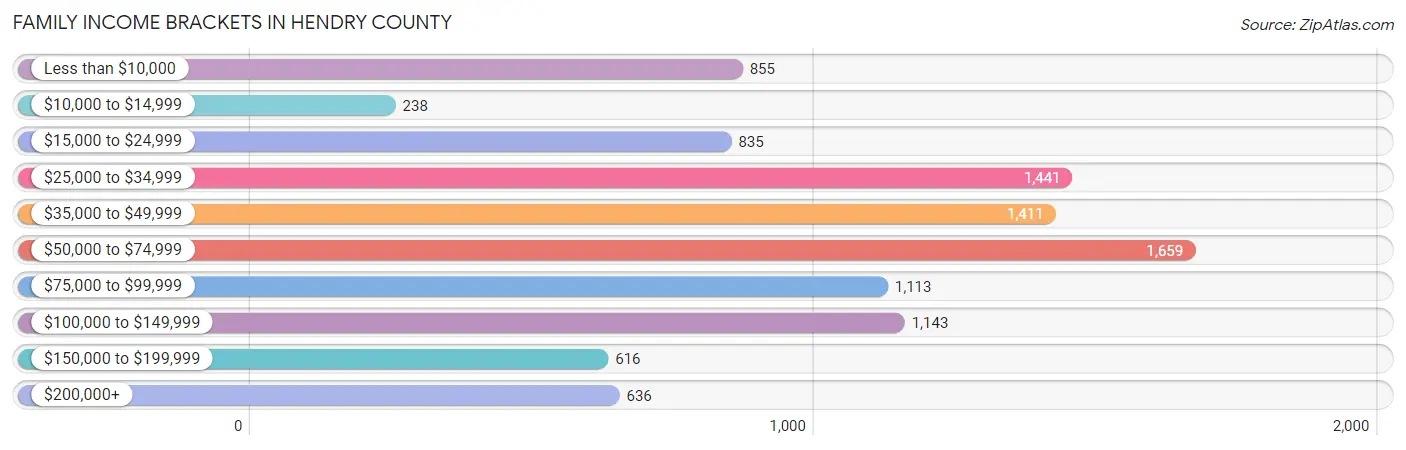
| Income Bracket | # Families | % Families |
| Less than $10,000 | 855 | 8.6% |
| $10,000 to $14,999 | 238 | 2.4% |
| $15,000 to $24,999 | 835 | 8.4% |
| $25,000 to $34,999 | 1,441 | 14.5% |
| $35,000 to $49,999 | 1,411 | 14.2% |
| $50,000 to $74,999 | 1,659 | 16.7% |
| $75,000 to $99,999 | 1,113 | 11.2% |
| $100,000 to $149,999 | 1,143 | 11.5% |
| $150,000 to $199,999 | 616 | 6.2% |
| $200,000+ | 636 | 6.4% |
Family Income by Famaliy Size in Hendry County
4-person families (2,019 | 20.3%) account for the highest median family income in Hendry County with $66,308 per family, while 2-person families (4,383 | 44.1%) have the highest median income of $20,169 per family member.
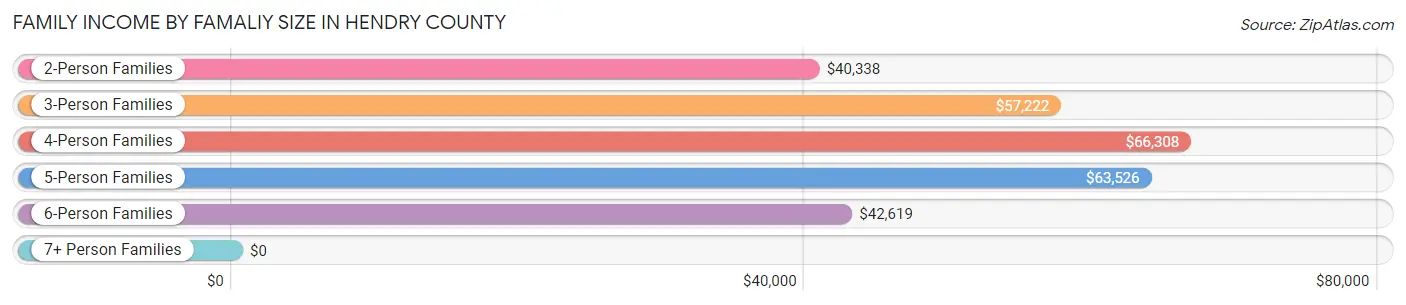
| Income Bracket | # Families | Median Income |
| 2-Person Families | 4,383 (44.1%) | $40,338 |
| 3-Person Families | 2,176 (21.9%) | $57,222 |
| 4-Person Families | 2,019 (20.3%) | $66,308 |
| 5-Person Families | 724 (7.3%) | $63,526 |
| 6-Person Families | 324 (3.3%) | $42,619 |
| 7+ Person Families | 311 (3.1%) | $0 |
| Total | 9,937 (100.0%) | $53,267 |
Family Income by Number of Earners in Hendry County
The median family income in Hendry County is $53,267, with families comprising 3+ earners (1,063) having the highest median family income of $126,422, while families with no earners (1,635) have the lowest median family income of $19,509, accounting for 10.7% and 16.5% of families, respectively.
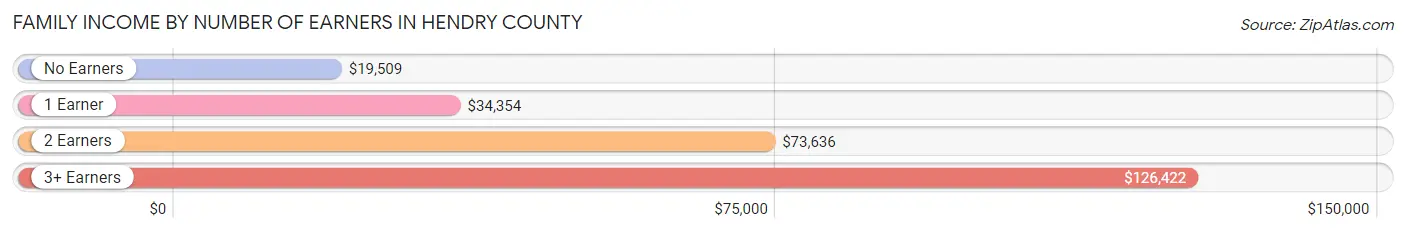
| Number of Earners | # Families | Median Income |
| No Earners | 1,635 (16.5%) | $19,509 |
| 1 Earner | 3,741 (37.7%) | $34,354 |
| 2 Earners | 3,498 (35.2%) | $73,636 |
| 3+ Earners | 1,063 (10.7%) | $126,422 |
| Total | 9,937 (100.0%) | $53,267 |
Household Income in Hendry County
Household Income Brackets in Hendry County
With 2,246 households falling in the category, the $50,000 to $74,999 income range is the most frequent in Hendry County, accounting for 16.9% of all households. In contrast, only 452 households (3.4%) fall into the $10,000 to $14,999 income bracket, making it the least populous group.
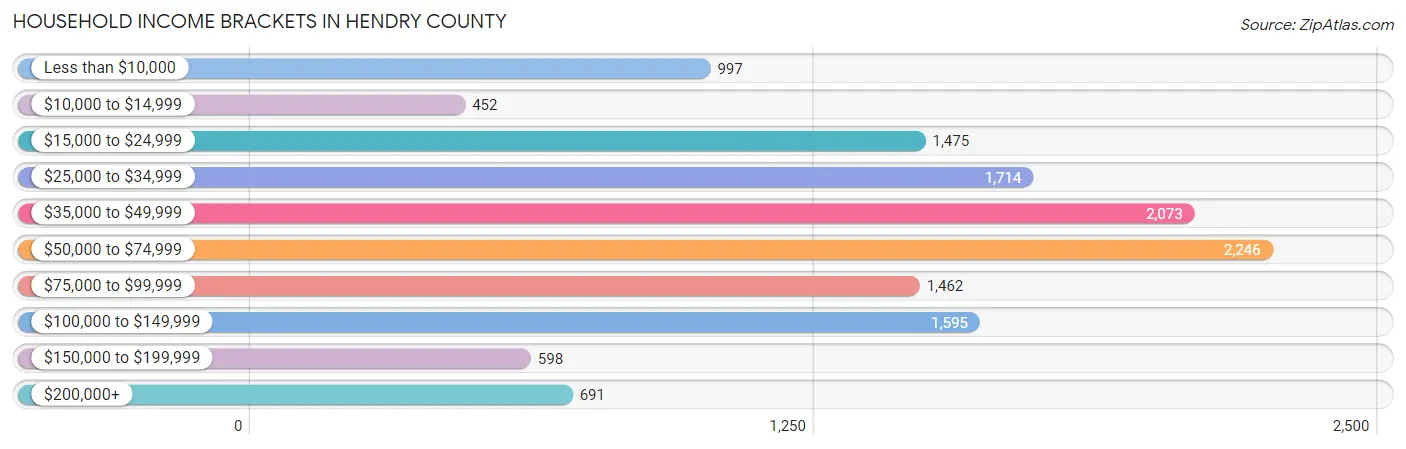
| Income Bracket | # Households | % Households |
| Less than $10,000 | 997 | 7.5% |
| $10,000 to $14,999 | 452 | 3.4% |
| $15,000 to $24,999 | 1,475 | 11.1% |
| $25,000 to $34,999 | 1,714 | 12.9% |
| $35,000 to $49,999 | 2,073 | 15.6% |
| $50,000 to $74,999 | 2,246 | 16.9% |
| $75,000 to $99,999 | 1,462 | 11.0% |
| $100,000 to $149,999 | 1,595 | 12.0% |
| $150,000 to $199,999 | 598 | 4.5% |
| $200,000+ | 691 | 5.2% |
Household Income by Householder Age in Hendry County
The median household income in Hendry County is $49,259, with the highest median household income of $57,725 found in the 45 to 64 years age bracket for the primary householder. A total of 4,780 households (36.0%) fall into this category. Meanwhile, the 65+ years age bracket for the primary householder has the lowest median household income of $41,811, with 3,093 households (23.3%) in this group.
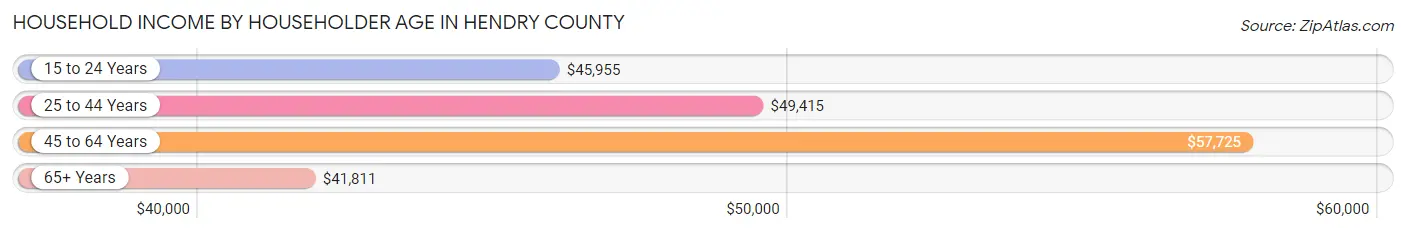
| Income Bracket | # Households | Median Income |
| 15 to 24 Years | 695 (5.2%) | $45,955 |
| 25 to 44 Years | 4,721 (35.5%) | $49,415 |
| 45 to 64 Years | 4,780 (36.0%) | $57,725 |
| 65+ Years | 3,093 (23.3%) | $41,811 |
| Total | 13,289 (100.0%) | $49,259 |
Poverty in Hendry County
Income Below Poverty by Sex and Age in Hendry County
With 22.1% poverty level for males and 22.5% for females among the residents of Hendry County, 15 year old males and 5 year old females are the most vulnerable to poverty, with 191 males (55.2%) and 109 females (46.8%) in their respective age groups living below the poverty level.
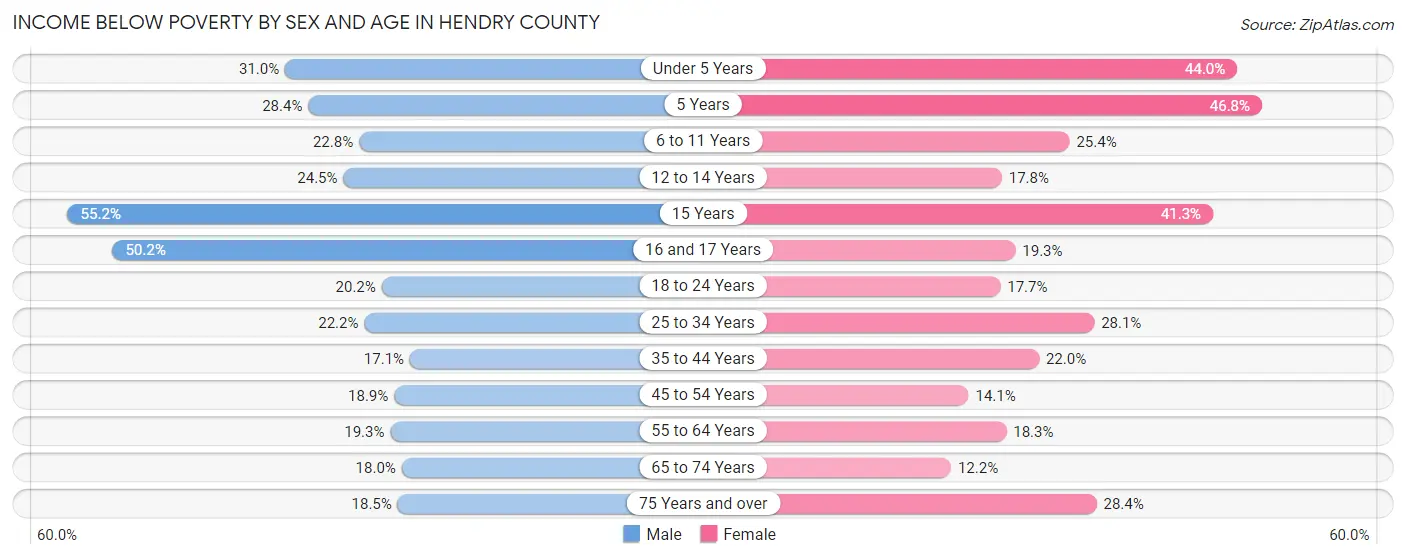
| Age Bracket | Male | Female |
| Under 5 Years | 471 (31.0%) | 530 (44.0%) |
| 5 Years | 127 (28.4%) | 109 (46.8%) |
| 6 to 11 Years | 355 (22.8%) | 428 (25.4%) |
| 12 to 14 Years | 234 (24.5%) | 139 (17.8%) |
| 15 Years | 191 (55.2%) | 62 (41.3%) |
| 16 and 17 Years | 234 (50.2%) | 145 (19.3%) |
| 18 to 24 Years | 498 (20.2%) | 293 (17.6%) |
| 25 to 34 Years | 716 (22.2%) | 633 (28.1%) |
| 35 to 44 Years | 507 (17.1%) | 454 (22.0%) |
| 45 to 54 Years | 497 (18.9%) | 335 (14.1%) |
| 55 to 64 Years | 437 (19.3%) | 377 (18.3%) |
| 65 to 74 Years | 265 (18.0%) | 172 (12.2%) |
| 75 Years and over | 194 (18.5%) | 326 (28.4%) |
| Total | 4,726 (22.1%) | 4,003 (22.5%) |
Income Above Poverty by Sex and Age in Hendry County
According to the poverty statistics in Hendry County, males aged 35 to 44 years and females aged 65 to 74 years are the age groups that are most secure financially, with 82.9% of males and 87.8% of females in these age groups living above the poverty line.
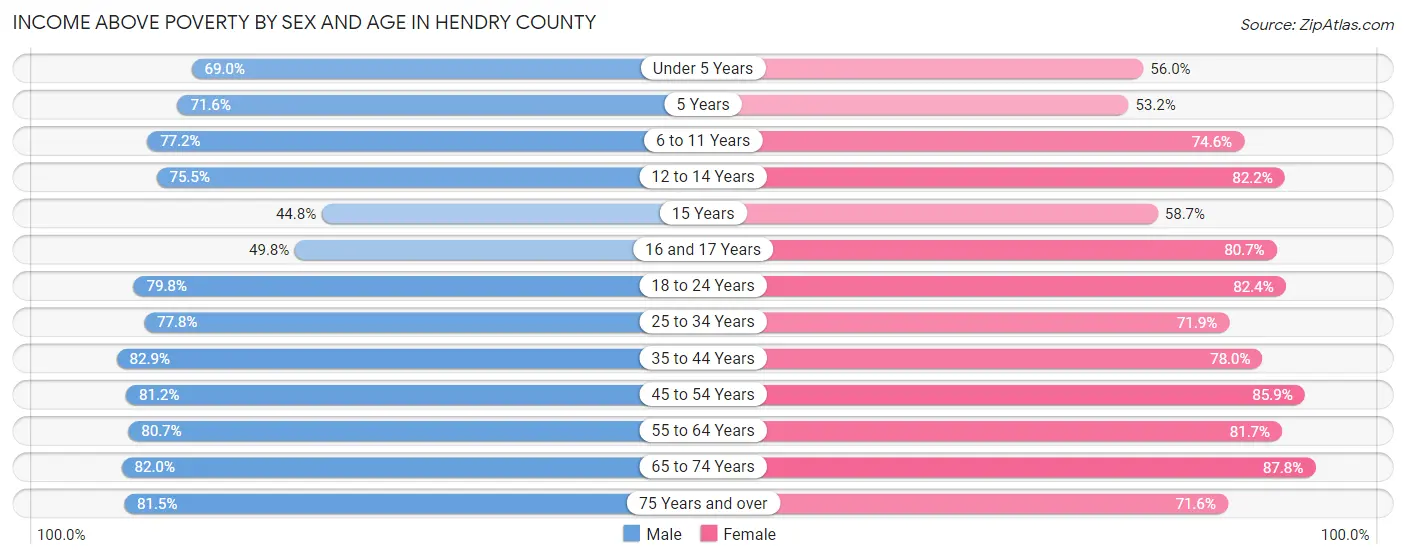
| Age Bracket | Male | Female |
| Under 5 Years | 1,049 (69.0%) | 674 (56.0%) |
| 5 Years | 320 (71.6%) | 124 (53.2%) |
| 6 to 11 Years | 1,205 (77.2%) | 1,260 (74.6%) |
| 12 to 14 Years | 721 (75.5%) | 641 (82.2%) |
| 15 Years | 155 (44.8%) | 88 (58.7%) |
| 16 and 17 Years | 232 (49.8%) | 605 (80.7%) |
| 18 to 24 Years | 1,963 (79.8%) | 1,367 (82.4%) |
| 25 to 34 Years | 2,514 (77.8%) | 1,619 (71.9%) |
| 35 to 44 Years | 2,459 (82.9%) | 1,613 (78.0%) |
| 45 to 54 Years | 2,139 (81.1%) | 2,038 (85.9%) |
| 55 to 64 Years | 1,831 (80.7%) | 1,681 (81.7%) |
| 65 to 74 Years | 1,206 (82.0%) | 1,242 (87.8%) |
| 75 Years and over | 857 (81.5%) | 823 (71.6%) |
| Total | 16,651 (77.9%) | 13,775 (77.5%) |
Income Below Poverty Among Married-Couple Families in Hendry County
The poverty statistics for married-couple families in Hendry County show that 11.0% or 685 of the total 6,225 families live below the poverty line. Families with 5 or more children have the highest poverty rate of 55.3%, comprising of 63 families. On the other hand, families with no children have the lowest poverty rate of 8.9%, which includes 320 families.
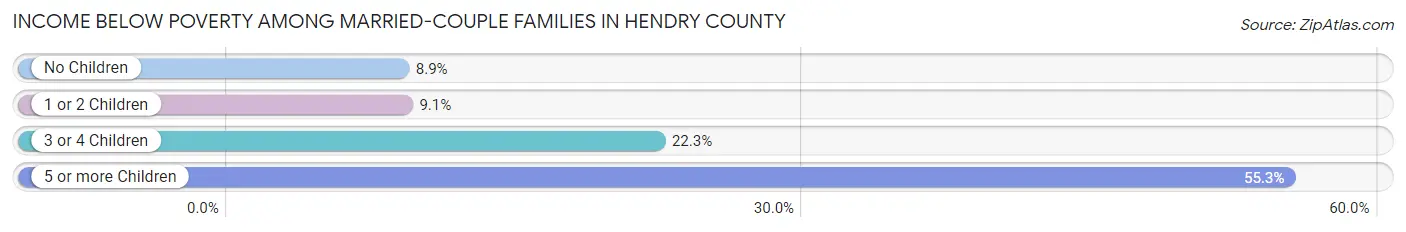
| Children | Above Poverty | Below Poverty |
| No Children | 3,268 (91.1%) | 320 (8.9%) |
| 1 or 2 Children | 1,796 (90.9%) | 180 (9.1%) |
| 3 or 4 Children | 425 (77.7%) | 122 (22.3%) |
| 5 or more Children | 51 (44.7%) | 63 (55.3%) |
| Total | 5,540 (89.0%) | 685 (11.0%) |
Income Below Poverty Among Single-Parent Households in Hendry County
According to the poverty data in Hendry County, 25.0% or 322 single-father households and 37.2% or 901 single-mother households are living below the poverty line. Among single-father households, those with 3 or 4 children have the highest poverty rate, with 42 households (58.3%) experiencing poverty. Likewise, among single-mother households, those with 5 or more children have the highest poverty rate, with 66 households (100.0%) falling below the poverty line.
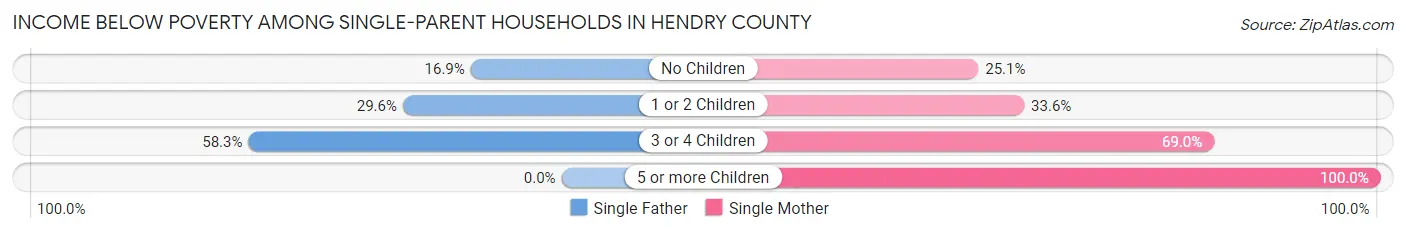
| Children | Single Father | Single Mother |
| No Children | 98 (16.9%) | 190 (25.1%) |
| 1 or 2 Children | 182 (29.5%) | 436 (33.6%) |
| 3 or 4 Children | 42 (58.3%) | 209 (69.0%) |
| 5 or more Children | 0 (0.0%) | 66 (100.0%) |
| Total | 322 (25.0%) | 901 (37.2%) |
Income Below Poverty Among Married-Couple vs Single-Parent Households in Hendry County
The poverty data for Hendry County shows that 685 of the married-couple family households (11.0%) and 1,223 of the single-parent households (33.0%) are living below the poverty level. Within the married-couple family households, those with 5 or more children have the highest poverty rate, with 63 households (55.3%) falling below the poverty line. Among the single-parent households, those with 5 or more children have the highest poverty rate, with 66 household (75.9%) living below poverty.
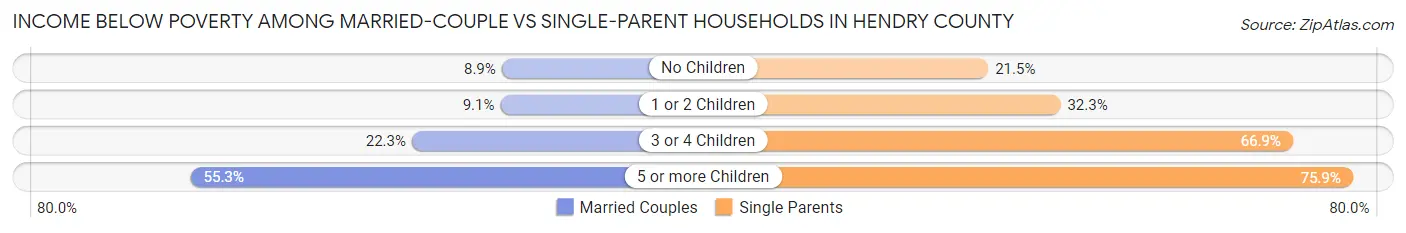
| Children | Married-Couple Families | Single-Parent Households |
| No Children | 320 (8.9%) | 288 (21.5%) |
| 1 or 2 Children | 180 (9.1%) | 618 (32.3%) |
| 3 or 4 Children | 122 (22.3%) | 251 (66.9%) |
| 5 or more Children | 63 (55.3%) | 66 (75.9%) |
| Total | 685 (11.0%) | 1,223 (33.0%) |
Race in Hendry County
The most populous races in Hendry County are White / Caucasian (24,361 | 61.1%), Hispanic or Latino (22,789 | 57.1%), and Two or more Races (7,559 | 18.9%).
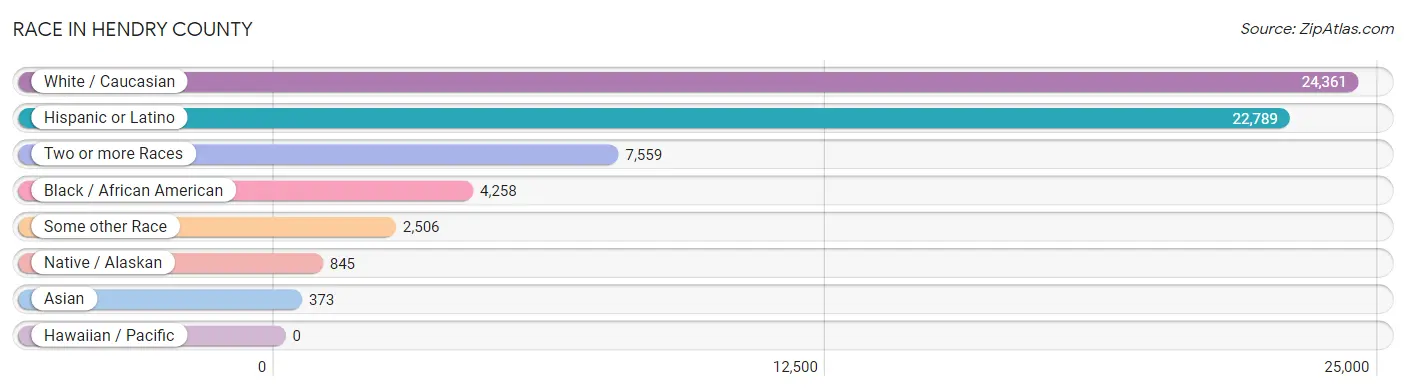
| Race | # Population | % Population |
| Asian | 373 | 0.9% |
| Black / African American | 4,258 | 10.7% |
| Hawaiian / Pacific | 0 | 0.0% |
| Hispanic or Latino | 22,789 | 57.1% |
| Native / Alaskan | 845 | 2.1% |
| White / Caucasian | 24,361 | 61.1% |
| Two or more Races | 7,559 | 18.9% |
| Some other Race | 2,506 | 6.3% |
| Total | 39,902 | 100.0% |
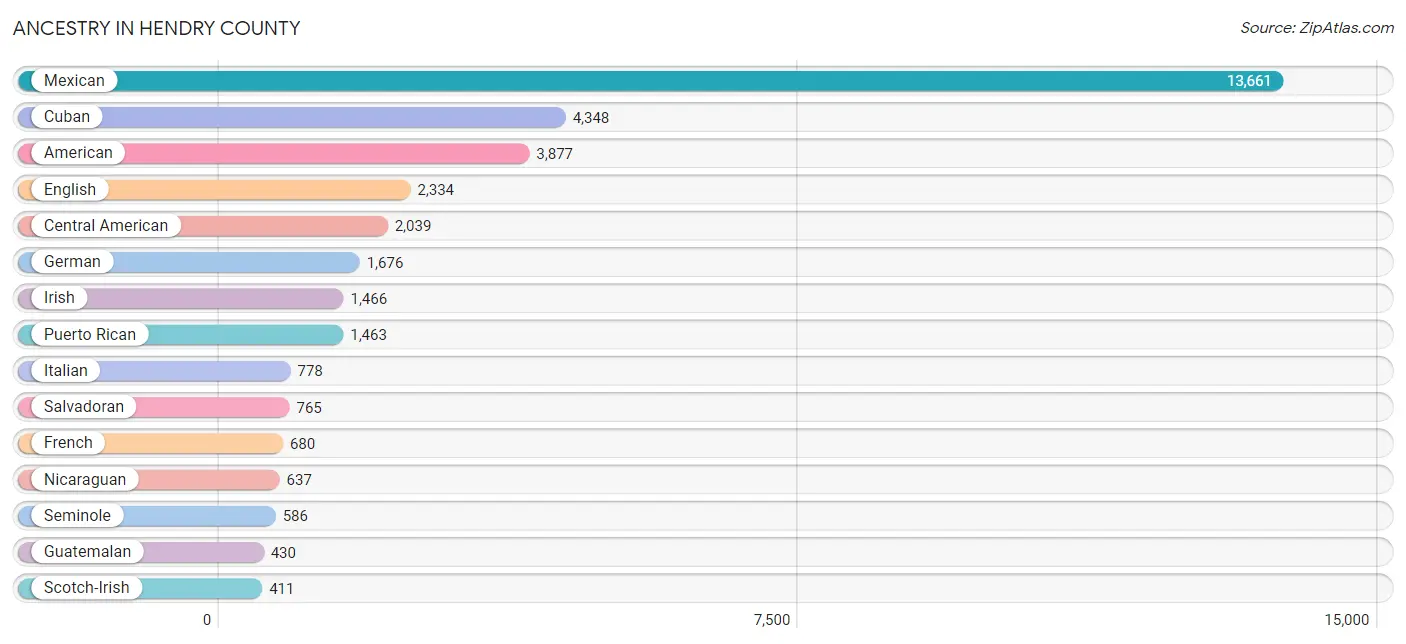
Ancestry in Hendry County
The most populous ancestries reported in Hendry County are Mexican (13,661 | 34.2%), Cuban (4,348 | 10.9%), American (3,877 | 9.7%), English (2,334 | 5.9%), and Central American (2,039 | 5.1%), together accounting for 65.8% of all Hendry County residents.
| Ancestry | # Population | % Population |
| African | 305 | 0.8% |
| Alaska Native | 16 | 0.0% |
| American | 3,877 | 9.7% |
| Arab | 15 | 0.0% |
| Argentinean | 6 | 0.0% |
| Bahamian | 68 | 0.2% |
| Barbadian | 19 | 0.1% |
| Belizean | 28 | 0.1% |
| Bhutanese | 45 | 0.1% |
| Brazilian | 228 | 0.6% |
| British | 16 | 0.0% |
| Bulgarian | 21 | 0.1% |
| Canadian | 169 | 0.4% |
| Celtic | 27 | 0.1% |
| Central American | 2,039 | 5.1% |
| Central American Indian | 91 | 0.2% |
| Cherokee | 53 | 0.1% |
| Cheyenne | 6 | 0.0% |
| Colombian | 324 | 0.8% |
| Costa Rican | 56 | 0.1% |
| Cuban | 4,348 | 10.9% |
| Czech | 9 | 0.0% |
| Danish | 7 | 0.0% |
| Dominican | 161 | 0.4% |
| Dutch | 33 | 0.1% |
| Ecuadorian | 4 | 0.0% |
| English | 2,334 | 5.9% |
| European | 204 | 0.5% |
| French | 680 | 1.7% |
| French Canadian | 61 | 0.2% |
| German | 1,676 | 4.2% |
| Guatemalan | 430 | 1.1% |
| Haitian | 82 | 0.2% |
| Honduran | 151 | 0.4% |
| Hungarian | 3 | 0.0% |
| Indian (Asian) | 93 | 0.2% |
| Irish | 1,466 | 3.7% |
| Italian | 778 | 1.9% |
| Jamaican | 139 | 0.4% |
| Korean | 86 | 0.2% |
| Latvian | 5 | 0.0% |
| Mexican | 13,661 | 34.2% |
| Mexican American Indian | 67 | 0.2% |
| Mongolian | 27 | 0.1% |
| Native Hawaiian | 21 | 0.1% |
| Nicaraguan | 637 | 1.6% |
| Norwegian | 104 | 0.3% |
| Peruvian | 29 | 0.1% |
| Polish | 281 | 0.7% |
| Puerto Rican | 1,463 | 3.7% |
| Russian | 7 | 0.0% |
| Salvadoran | 765 | 1.9% |
| Scotch-Irish | 411 | 1.0% |
| Scottish | 202 | 0.5% |
| Seminole | 586 | 1.5% |
| Sioux | 32 | 0.1% |
| Slovak | 17 | 0.0% |
| South American | 365 | 0.9% |
| Spaniard | 71 | 0.2% |
| Spanish | 109 | 0.3% |
| Sri Lankan | 14 | 0.0% |
| Subsaharan African | 305 | 0.8% |
| Swedish | 74 | 0.2% |
| Swiss | 36 | 0.1% |
| Syrian | 4 | 0.0% |
| Thai | 262 | 0.7% |
| Trinidadian and Tobagonian | 11 | 0.0% |
| Ukrainian | 21 | 0.1% |
| Venezuelan | 2 | 0.0% |
| Welsh | 148 | 0.4% |
| West Indian | 37 | 0.1% | View All 71 Rows |
Immigrants in Hendry County
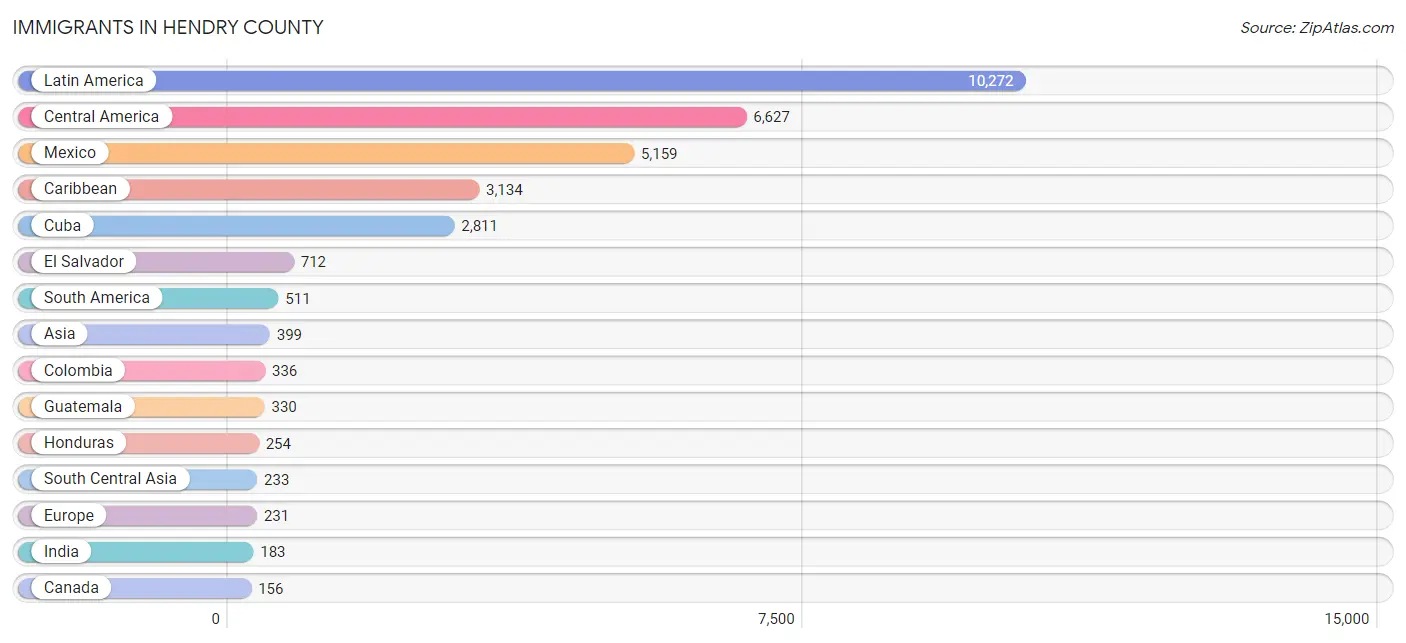
The most numerous immigrant groups reported in Hendry County came from Latin America (10,272 | 25.7%), Central America (6,627 | 16.6%), Mexico (5,159 | 12.9%), Caribbean (3,134 | 7.9%), and Cuba (2,811 | 7.0%), together accounting for 70.2% of all Hendry County residents.
| Immigration Origin | # Population | % Population |
| Argentina | 16 | 0.0% |
| Asia | 399 | 1.0% |
| Austria | 11 | 0.0% |
| Barbados | 76 | 0.2% |
| Belize | 28 | 0.1% |
| Brazil | 4 | 0.0% |
| Canada | 156 | 0.4% |
| Caribbean | 3,134 | 7.9% |
| Central America | 6,627 | 16.6% |
| Chile | 124 | 0.3% |
| China | 68 | 0.2% |
| Colombia | 336 | 0.8% |
| Cuba | 2,811 | 7.0% |
| Dominican Republic | 68 | 0.2% |
| Eastern Asia | 75 | 0.2% |
| El Salvador | 712 | 1.8% |
| England | 22 | 0.1% |
| Europe | 231 | 0.6% |
| Germany | 112 | 0.3% |
| Guatemala | 330 | 0.8% |
| Haiti | 42 | 0.1% |
| Honduras | 254 | 0.6% |
| India | 183 | 0.5% |
| Ireland | 30 | 0.1% |
| Jamaica | 137 | 0.3% |
| Japan | 7 | 0.0% |
| Latin America | 10,272 | 25.7% |
| Malaysia | 27 | 0.1% |
| Mexico | 5,159 | 12.9% |
| Netherlands | 7 | 0.0% |
| Nicaragua | 144 | 0.4% |
| Northern Europe | 52 | 0.1% |
| Oceania | 5 | 0.0% |
| Peru | 29 | 0.1% |
| Philippines | 34 | 0.1% |
| South America | 511 | 1.3% |
| South Central Asia | 233 | 0.6% |
| South Eastern Asia | 91 | 0.2% |
| Southern Europe | 49 | 0.1% |
| Spain | 49 | 0.1% |
| Sri Lanka | 50 | 0.1% |
| Thailand | 22 | 0.1% |
| Venezuela | 2 | 0.0% |
| Vietnam | 8 | 0.0% |
| Western Europe | 130 | 0.3% | View All 45 Rows |
Sex and Age in Hendry County
Sex and Age in Hendry County
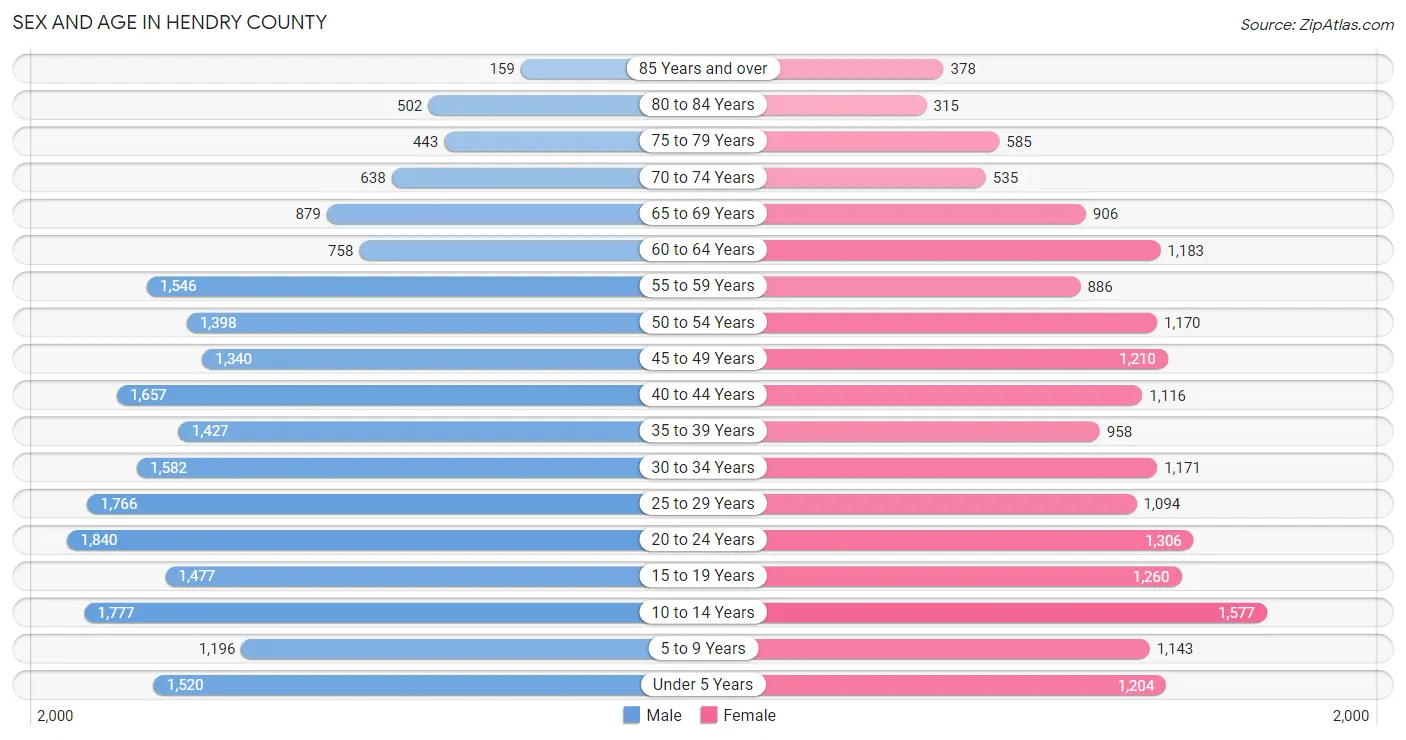
The most populous age groups in Hendry County are 20 to 24 Years (1,840 | 8.4%) for men and 10 to 14 Years (1,577 | 8.8%) for women.
| Age Bracket | Male | Female |
| Under 5 Years | 1,520 (6.9%) | 1,204 (6.7%) |
| 5 to 9 Years | 1,196 (5.5%) | 1,143 (6.4%) |
| 10 to 14 Years | 1,777 (8.1%) | 1,577 (8.8%) |
| 15 to 19 Years | 1,477 (6.7%) | 1,260 (7.0%) |
| 20 to 24 Years | 1,840 (8.4%) | 1,306 (7.3%) |
| 25 to 29 Years | 1,766 (8.1%) | 1,094 (6.1%) |
| 30 to 34 Years | 1,582 (7.2%) | 1,171 (6.5%) |
| 35 to 39 Years | 1,427 (6.5%) | 958 (5.3%) |
| 40 to 44 Years | 1,657 (7.6%) | 1,116 (6.2%) |
| 45 to 49 Years | 1,340 (6.1%) | 1,210 (6.7%) |
| 50 to 54 Years | 1,398 (6.4%) | 1,170 (6.5%) |
| 55 to 59 Years | 1,546 (7.1%) | 886 (4.9%) |
| 60 to 64 Years | 758 (3.5%) | 1,183 (6.6%) |
| 65 to 69 Years | 879 (4.0%) | 906 (5.0%) |
| 70 to 74 Years | 638 (2.9%) | 535 (3.0%) |
| 75 to 79 Years | 443 (2.0%) | 585 (3.3%) |
| 80 to 84 Years | 502 (2.3%) | 315 (1.8%) |
| 85 Years and over | 159 (0.7%) | 378 (2.1%) |
| Total | 21,905 (100.0%) | 17,997 (100.0%) |
Families and Households in Hendry County
Median Family Size in Hendry County
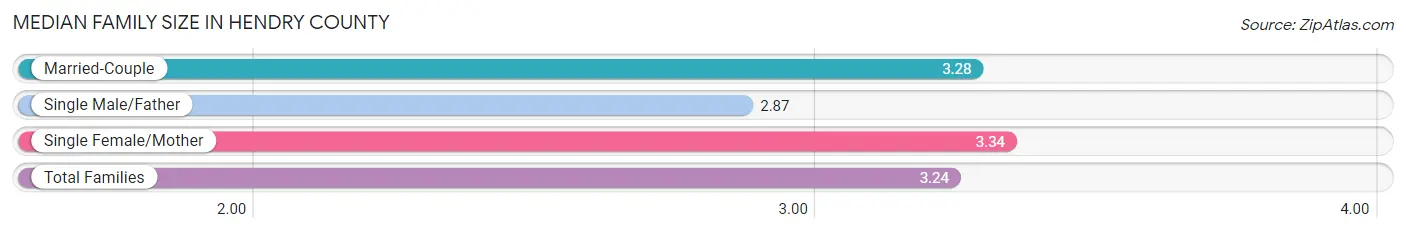
The median family size in Hendry County is 3.24 persons per family, with single female/mother families (2,424 | 24.4%) accounting for the largest median family size of 3.34 persons per family. On the other hand, single male/father families (1,288 | 13.0%) represent the smallest median family size with 2.87 persons per family.
| Family Type | # Families | Family Size |
| Married-Couple | 6,225 (62.6%) | 3.28 |
| Single Male/Father | 1,288 (13.0%) | 2.87 |
| Single Female/Mother | 2,424 (24.4%) | 3.34 |
| Total Families | 9,937 (100.0%) | 3.24 |
Median Household Size in Hendry County
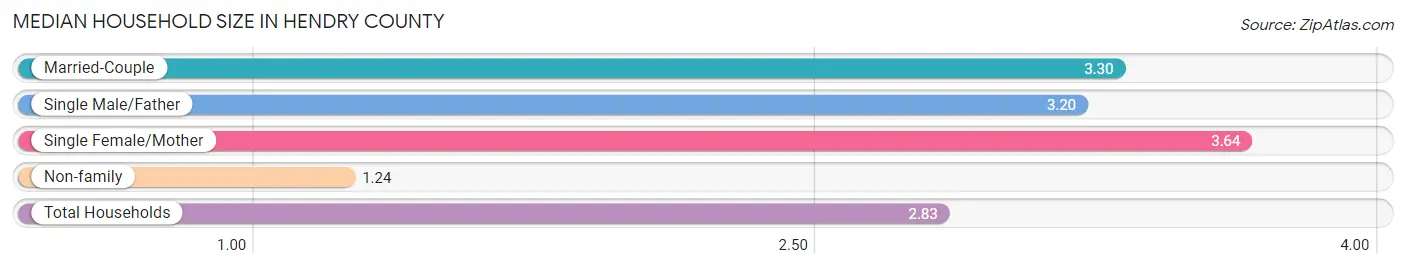
The median household size in Hendry County is 2.83 persons per household, with single female/mother households (2,424 | 18.2%) accounting for the largest median household size of 3.64 persons per household. non-family households (3,352 | 25.2%) represent the smallest median household size with 1.24 persons per household.
| Household Type | # Households | Household Size |
| Married-Couple | 6,225 (46.8%) | 3.30 |
| Single Male/Father | 1,288 (9.7%) | 3.20 |
| Single Female/Mother | 2,424 (18.2%) | 3.64 |
| Non-family | 3,352 (25.2%) | 1.24 |
| Total Households | 13,289 (100.0%) | 2.83 |
Household Size by Marriage Status in Hendry County
Out of a total of 13,289 households in Hendry County, 9,937 (74.8%) are family households, while 3,352 (25.2%) are nonfamily households. The most numerous type of family households are 2-person households, comprising 3,820, and the most common type of nonfamily households are 1-person households, comprising 2,783.
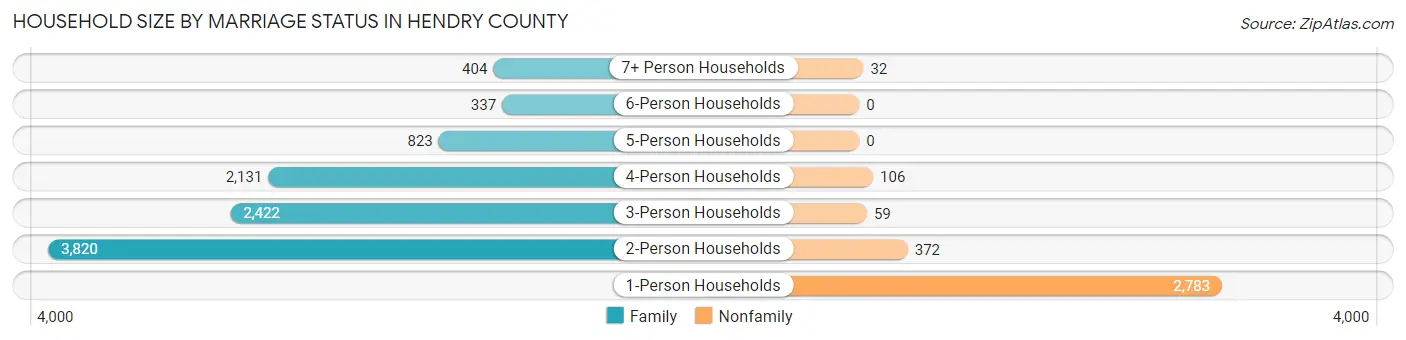
| Household Size | Family Households | Nonfamily Households |
| 1-Person Households | - | 2,783 (20.9%) |
| 2-Person Households | 3,820 (28.7%) | 372 (2.8%) |
| 3-Person Households | 2,422 (18.2%) | 59 (0.4%) |
| 4-Person Households | 2,131 (16.0%) | 106 (0.8%) |
| 5-Person Households | 823 (6.2%) | 0 (0.0%) |
| 6-Person Households | 337 (2.5%) | 0 (0.0%) |
| 7+ Person Households | 404 (3.0%) | 32 (0.2%) |
| Total | 9,937 (74.8%) | 3,352 (25.2%) |
Female Fertility in Hendry County
Fertility by Age in Hendry County
Average fertility rate in Hendry County is 48.0 births per 1,000 women. Women in the age bracket of 20 to 34 years have the highest fertility rate with 87.0 births per 1,000 women. Women in the age bracket of 20 to 34 years acount for 77.1% of all women with births.
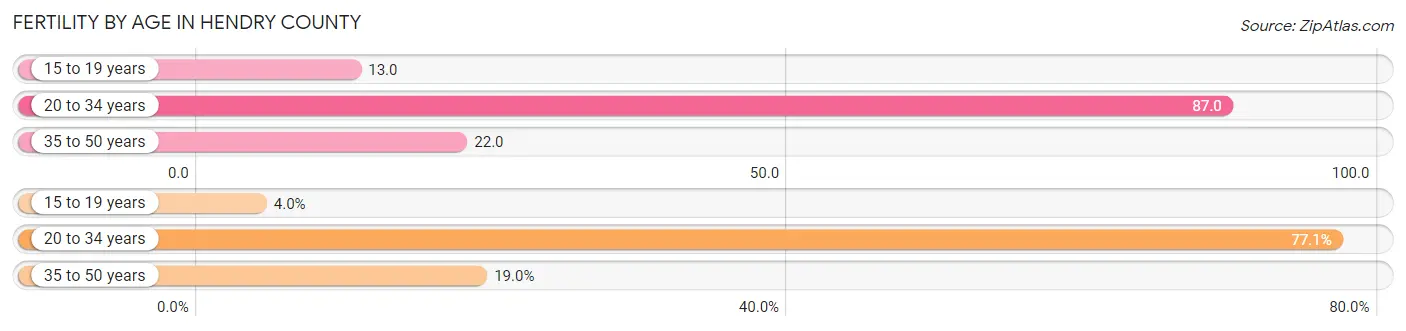
| Age Bracket | Women with Births | Births / 1,000 Women |
| 15 to 19 years | 16 (4.0%) | 13.0 |
| 20 to 34 years | 309 (77.1%) | 87.0 |
| 35 to 50 years | 76 (19.0%) | 22.0 |
| Total | 401 (100.0%) | 48.0 |
Fertility by Age by Marriage Status in Hendry County
58.9% of women with births (401) in Hendry County are married. The highest percentage of unmarried women with births falls into 20 to 34 years age bracket with 48.2% of them unmarried at the time of birth, while the lowest percentage of unmarried women with births belong to 15 to 19 years age bracket with 0.0% of them unmarried.
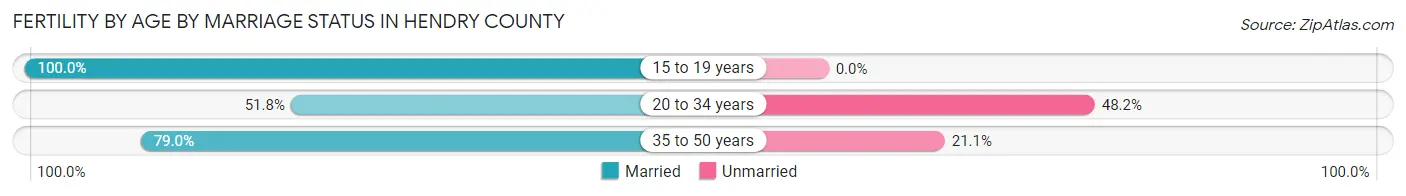
| Age Bracket | Married | Unmarried |
| 15 to 19 years | 16 (100.0%) | 0 (0.0%) |
| 20 to 34 years | 160 (51.8%) | 149 (48.2%) |
| 35 to 50 years | 60 (78.9%) | 16 (21.0%) |
| Total | 236 (58.9%) | 165 (41.1%) |
Fertility by Education in Hendry County
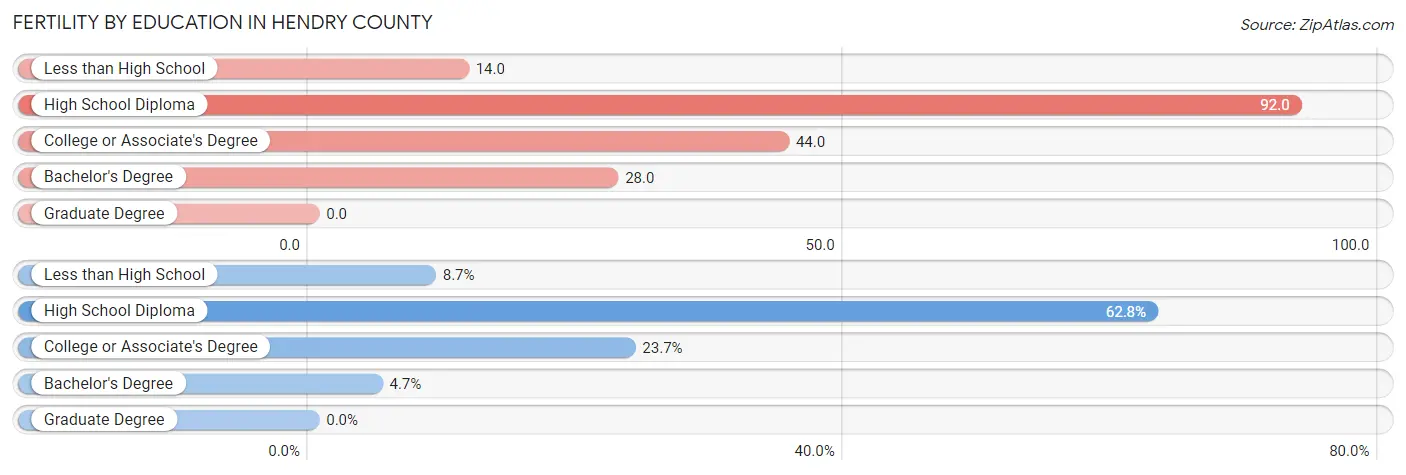
| Educational Attainment | Women with Births | Births / 1,000 Women |
| Less than High School | 35 (8.7%) | 14.0 |
| High School Diploma | 252 (62.8%) | 92.0 |
| College or Associate's Degree | 95 (23.7%) | 44.0 |
| Bachelor's Degree | 19 (4.7%) | 28.0 |
| Graduate Degree | 0 (0.0%) | 0.0 |
| Total | 401 (100.0%) | 48.0 |
Fertility by Education by Marriage Status in Hendry County
41.1% of women with births in Hendry County are unmarried. Women with the educational attainment of less than high school are most likely to be married with 100.0% of them married at childbirth, while women with the educational attainment of college or associate's degree are least likely to be married with 50.5% of them unmarried at childbirth.
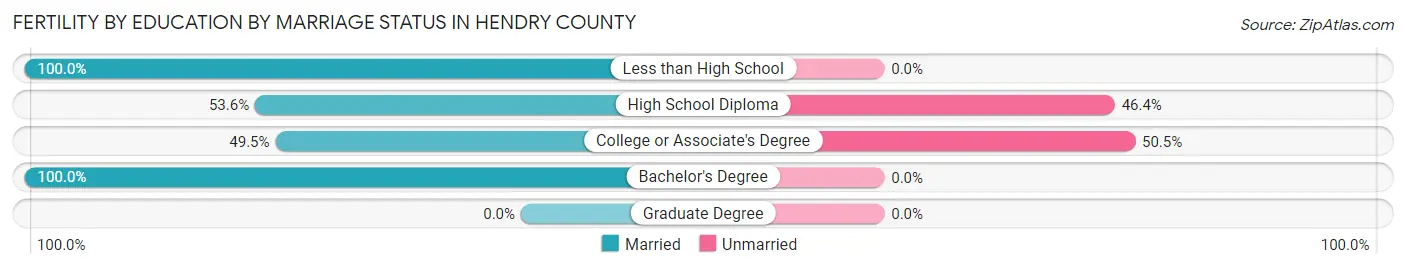
| Educational Attainment | Married | Unmarried |
| Less than High School | 35 (100.0%) | 0 (0.0%) |
| High School Diploma | 135 (53.6%) | 117 (46.4%) |
| College or Associate's Degree | 47 (49.5%) | 48 (50.5%) |
| Bachelor's Degree | 19 (100.0%) | 0 (0.0%) |
| Graduate Degree | 0 (0.0%) | 0 (0.0%) |
| Total | 236 (58.9%) | 165 (41.1%) |
Employment Characteristics in Hendry County
Employment by Class of Employer in Hendry County
Among the 17,935 employed individuals in Hendry County, private company employees (12,761 | 71.2%), not-for-profit organizations (1,343 | 7.5%), and local government employees (1,105 | 6.2%) make up the most common classes of employment.
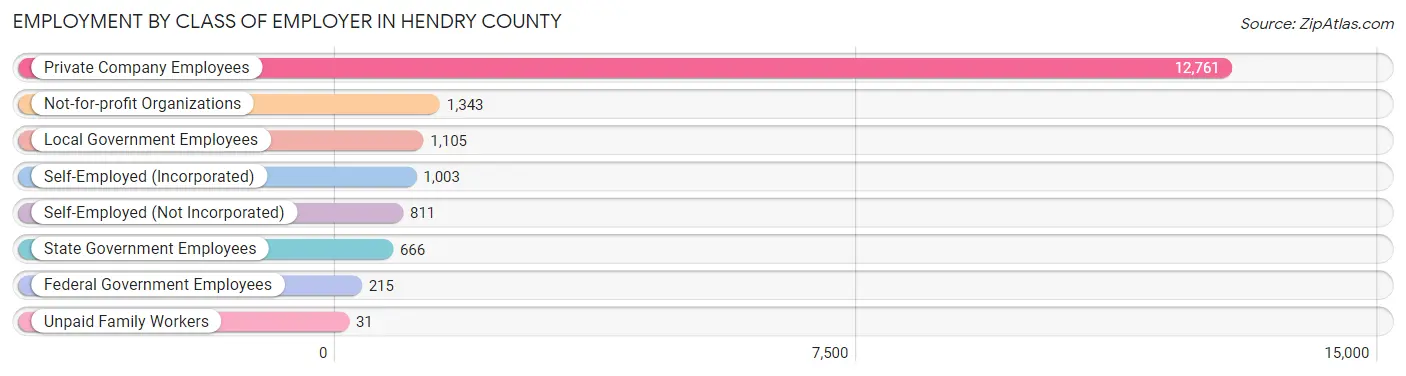
| Employer Class | # Employees | % Employees |
| Private Company Employees | 12,761 | 71.2% |
| Self-Employed (Incorporated) | 1,003 | 5.6% |
| Self-Employed (Not Incorporated) | 811 | 4.5% |
| Not-for-profit Organizations | 1,343 | 7.5% |
| Local Government Employees | 1,105 | 6.2% |
| State Government Employees | 666 | 3.7% |
| Federal Government Employees | 215 | 1.2% |
| Unpaid Family Workers | 31 | 0.2% |
| Total | 17,935 | 100.0% |
Employment Status by Age in Hendry County
According to the labor force statistics for Hendry County, out of the total population over 16 years of age (30,989), 62.3% or 19,306 individuals are in the labor force, with 5.8% or 1,120 of them unemployed. The age group with the highest labor force participation rate is 25 to 29 years, with 82.7% or 2,365 individuals in the labor force. Within the labor force, the 16 to 19 years age range has the highest percentage of unemployed individuals, with 30.4% or 258 of them being unemployed.
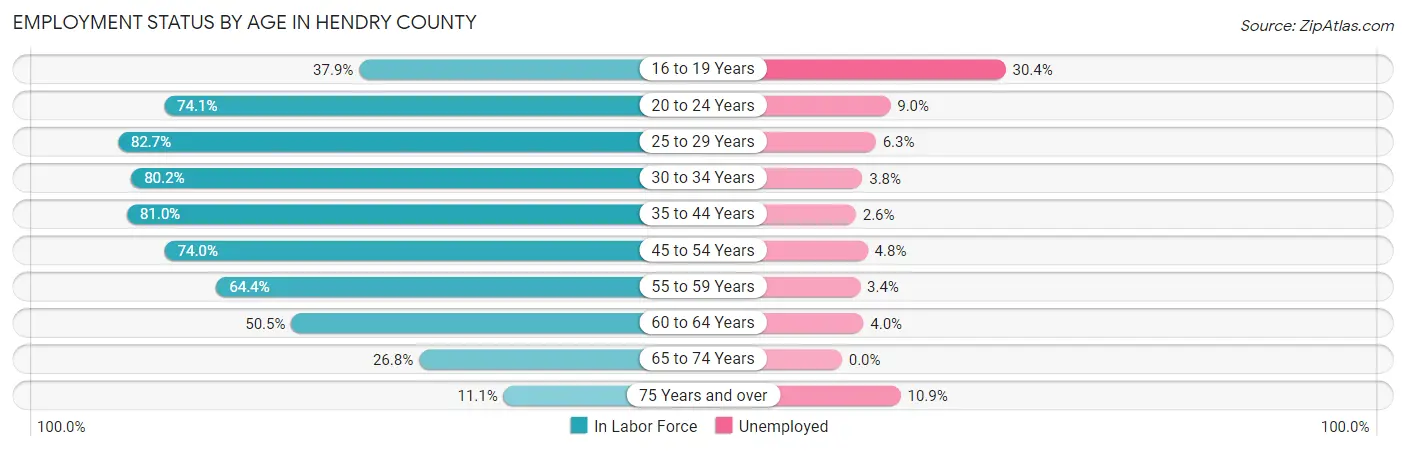
| Age Bracket | In Labor Force | Unemployed |
| 16 to 19 Years | 849 (37.9%) | 258 (30.4%) |
| 20 to 24 Years | 2,331 (74.1%) | 210 (9.0%) |
| 25 to 29 Years | 2,365 (82.7%) | 149 (6.3%) |
| 30 to 34 Years | 2,208 (80.2%) | 84 (3.8%) |
| 35 to 44 Years | 4,178 (81.0%) | 109 (2.6%) |
| 45 to 54 Years | 3,787 (74.0%) | 182 (4.8%) |
| 55 to 59 Years | 1,566 (64.4%) | 53 (3.4%) |
| 60 to 64 Years | 980 (50.5%) | 39 (4.0%) |
| 65 to 74 Years | 793 (26.8%) | 0 (0.0%) |
| 75 Years and over | 264 (11.1%) | 29 (10.9%) |
| Total | 19,306 (62.3%) | 1,120 (5.8%) |
Employment Status by Educational Attainment in Hendry County
According to labor force statistics for Hendry County, 74.4% of individuals (15,075) out of the total population between 25 and 64 years of age (20,262) are in the labor force, with 4.1% or 618 of them being unemployed. The group with the highest labor force participation rate are those with the educational attainment of bachelor's degree or higher, with 79.9% or 1,581 individuals in the labor force. Within the labor force, individuals with less than high school education have the highest percentage of unemployment, with 5.7% or 250 of them being unemployed.
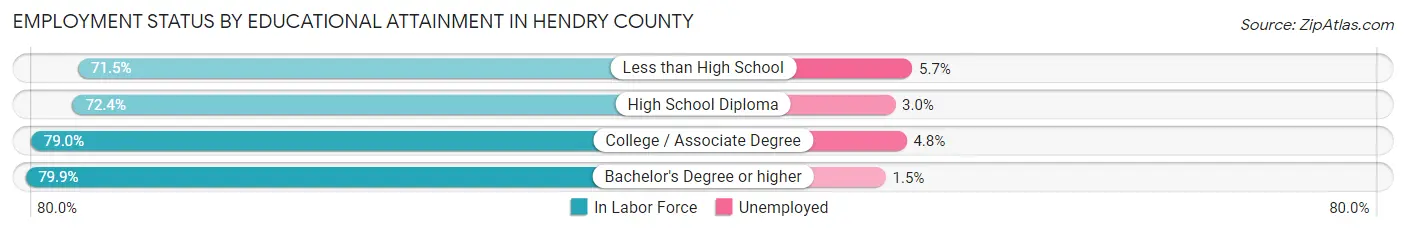
| Educational Attainment | In Labor Force | Unemployed |
| Less than High School | 4,389 (71.5%) | 350 (5.7%) |
| High School Diploma | 5,334 (72.4%) | 221 (3.0%) |
| College / Associate Degree | 3,774 (79.0%) | 229 (4.8%) |
| Bachelor's Degree or higher | 1,581 (79.9%) | 30 (1.5%) |
| Total | 15,075 (74.4%) | 831 (4.1%) |
Employment Occupations by Sex in Hendry County
Management, Business, Science and Arts Occupations
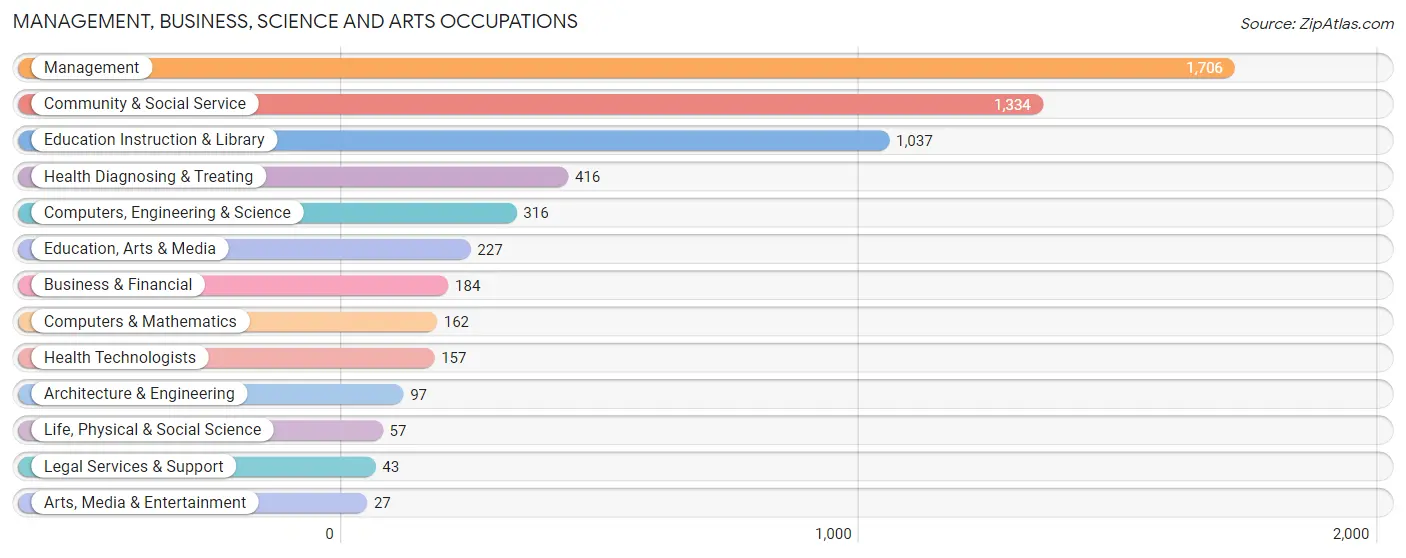
The most common Management, Business, Science and Arts occupations in Hendry County are Management (1,706 | 9.4%), Community & Social Service (1,334 | 7.3%), Education Instruction & Library (1,037 | 5.7%), Health Diagnosing & Treating (416 | 2.3%), and Computers, Engineering & Science (316 | 1.7%).
Management, Business, Science and Arts Occupations by Sex
Within the Management, Business, Science and Arts occupations in Hendry County, the most male-oriented occupations are Life, Physical & Social Science (100.0%), Education, Arts & Media (76.6%), and Computers & Mathematics (74.1%), while the most female-oriented occupations are Legal Services & Support (100.0%), Arts, Media & Entertainment (100.0%), and Education Instruction & Library (92.0%).
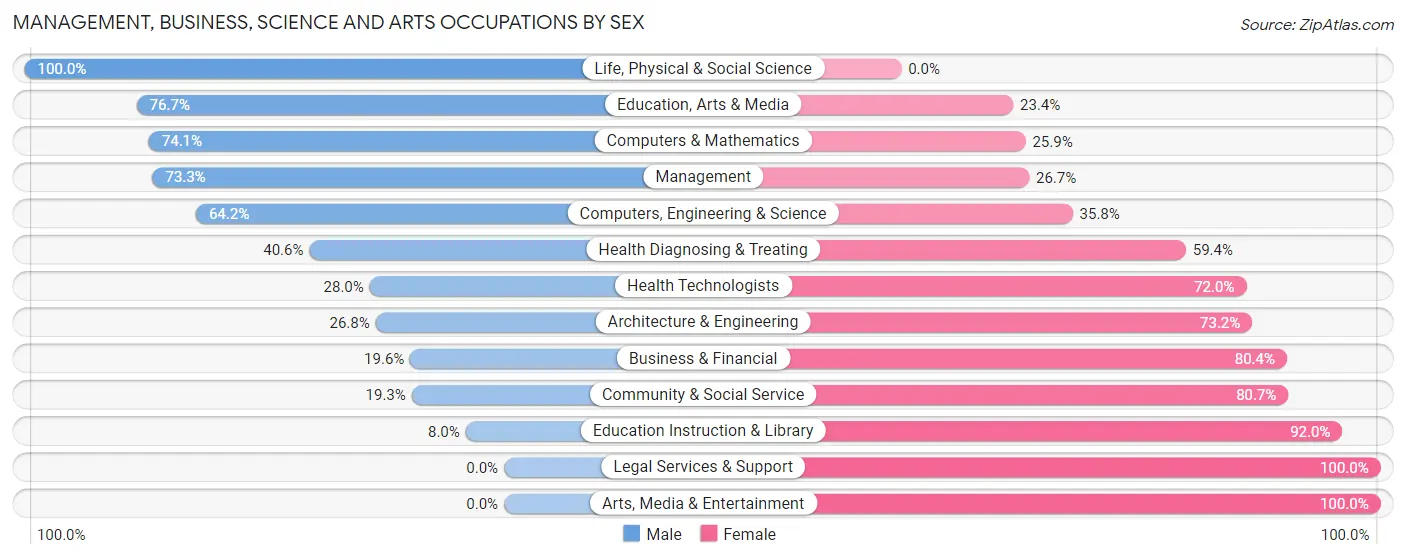
| Occupation | Male | Female |
| Management | 1,251 (73.3%) | 455 (26.7%) |
| Business & Financial | 36 (19.6%) | 148 (80.4%) |
| Computers, Engineering & Science | 203 (64.2%) | 113 (35.8%) |
| Computers & Mathematics | 120 (74.1%) | 42 (25.9%) |
| Architecture & Engineering | 26 (26.8%) | 71 (73.2%) |
| Life, Physical & Social Science | 57 (100.0%) | 0 (0.0%) |
| Community & Social Service | 257 (19.3%) | 1,077 (80.7%) |
| Education, Arts & Media | 174 (76.6%) | 53 (23.4%) |
| Legal Services & Support | 0 (0.0%) | 43 (100.0%) |
| Education Instruction & Library | 83 (8.0%) | 954 (92.0%) |
| Arts, Media & Entertainment | 0 (0.0%) | 27 (100.0%) |
| Health Diagnosing & Treating | 169 (40.6%) | 247 (59.4%) |
| Health Technologists | 44 (28.0%) | 113 (72.0%) |
| Total (Category) | 1,916 (48.4%) | 2,040 (51.6%) |
| Total (Overall) | 10,971 (60.3%) | 7,238 (39.8%) |
Services Occupations
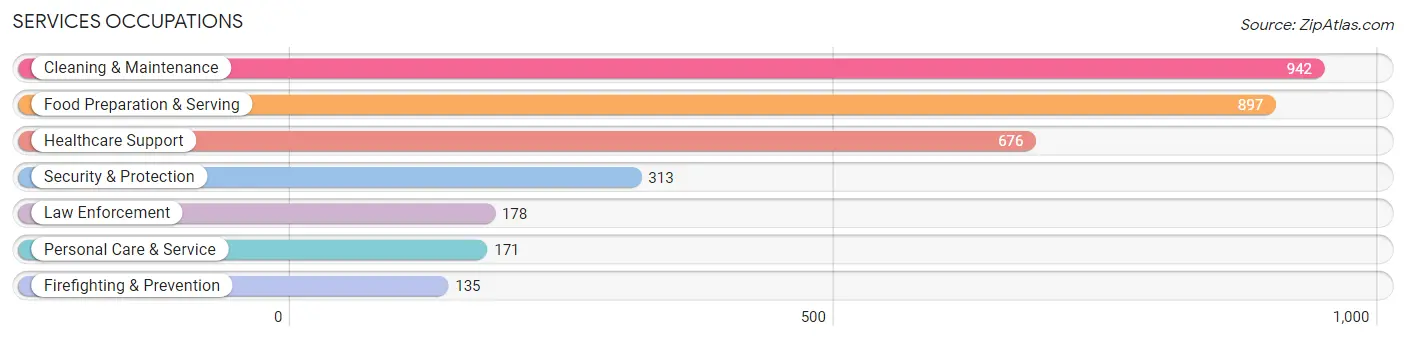
The most common Services occupations in Hendry County are Cleaning & Maintenance (942 | 5.2%), Food Preparation & Serving (897 | 4.9%), Healthcare Support (676 | 3.7%), Security & Protection (313 | 1.7%), and Law Enforcement (178 | 1.0%).
Services Occupations by Sex
Within the Services occupations in Hendry County, the most male-oriented occupations are Firefighting & Prevention (100.0%), Security & Protection (97.1%), and Law Enforcement (94.9%), while the most female-oriented occupations are Healthcare Support (92.5%), Food Preparation & Serving (60.5%), and Personal Care & Service (56.7%).
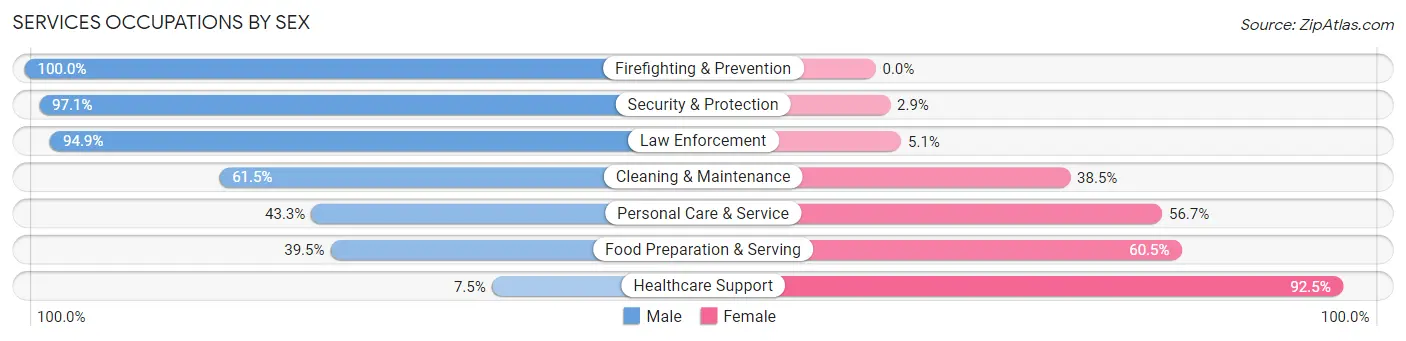
| Occupation | Male | Female |
| Healthcare Support | 51 (7.5%) | 625 (92.5%) |
| Security & Protection | 304 (97.1%) | 9 (2.9%) |
| Firefighting & Prevention | 135 (100.0%) | 0 (0.0%) |
| Law Enforcement | 169 (94.9%) | 9 (5.1%) |
| Food Preparation & Serving | 354 (39.5%) | 543 (60.5%) |
| Cleaning & Maintenance | 579 (61.5%) | 363 (38.5%) |
| Personal Care & Service | 74 (43.3%) | 97 (56.7%) |
| Total (Category) | 1,362 (45.4%) | 1,637 (54.6%) |
| Total (Overall) | 10,971 (60.3%) | 7,238 (39.8%) |
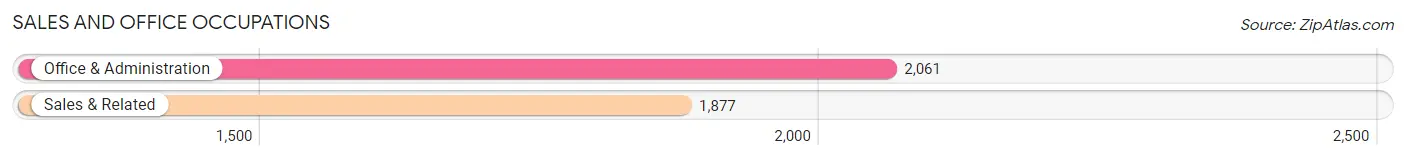
Sales and Office Occupations
The most common Sales and Office occupations in Hendry County are Office & Administration (2,061 | 11.3%), and Sales & Related (1,877 | 10.3%).
Sales and Office Occupations by Sex
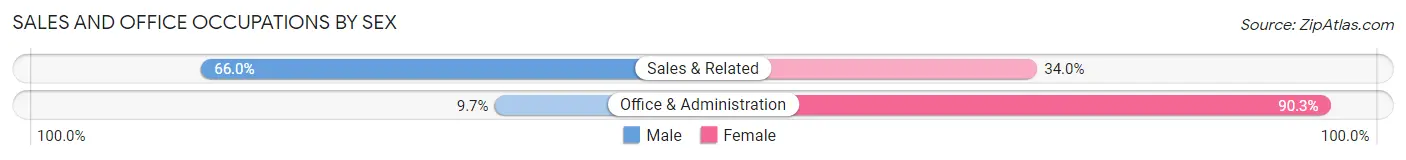
| Occupation | Male | Female |
| Sales & Related | 1,239 (66.0%) | 638 (34.0%) |
| Office & Administration | 199 (9.7%) | 1,862 (90.3%) |
| Total (Category) | 1,438 (36.5%) | 2,500 (63.5%) |
| Total (Overall) | 10,971 (60.3%) | 7,238 (39.8%) |
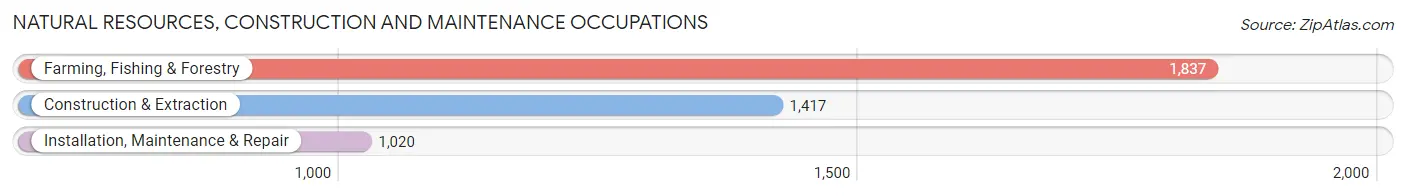
Natural Resources, Construction and Maintenance Occupations
The most common Natural Resources, Construction and Maintenance occupations in Hendry County are Farming, Fishing & Forestry (1,837 | 10.1%), Construction & Extraction (1,417 | 7.8%), and Installation, Maintenance & Repair (1,020 | 5.6%).
Natural Resources, Construction and Maintenance Occupations by Sex
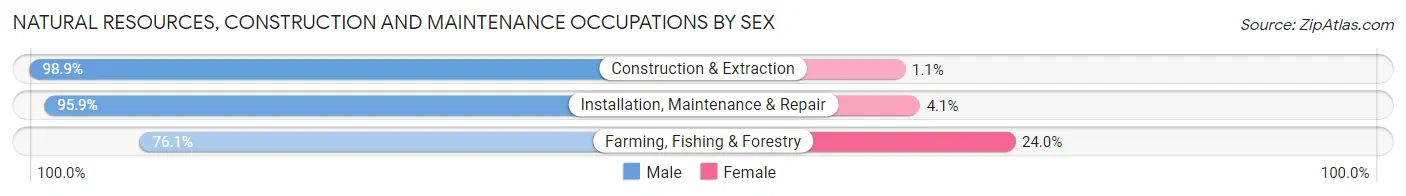
| Occupation | Male | Female |
| Farming, Fishing & Forestry | 1,397 (76.0%) | 440 (23.9%) |
| Construction & Extraction | 1,402 (98.9%) | 15 (1.1%) |
| Installation, Maintenance & Repair | 978 (95.9%) | 42 (4.1%) |
| Total (Category) | 3,777 (88.4%) | 497 (11.6%) |
| Total (Overall) | 10,971 (60.3%) | 7,238 (39.8%) |
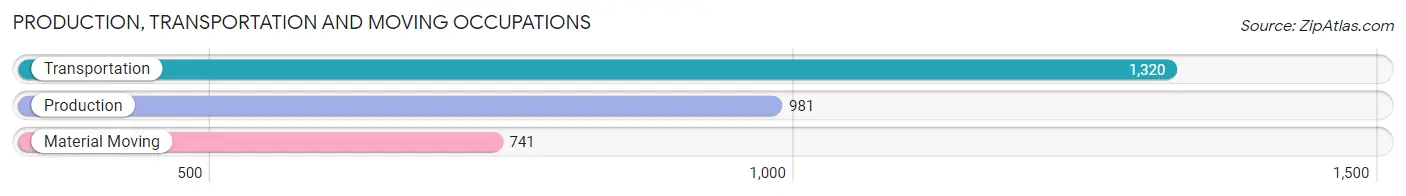
Production, Transportation and Moving Occupations
The most common Production, Transportation and Moving occupations in Hendry County are Transportation (1,320 | 7.2%), Production (981 | 5.4%), and Material Moving (741 | 4.1%).
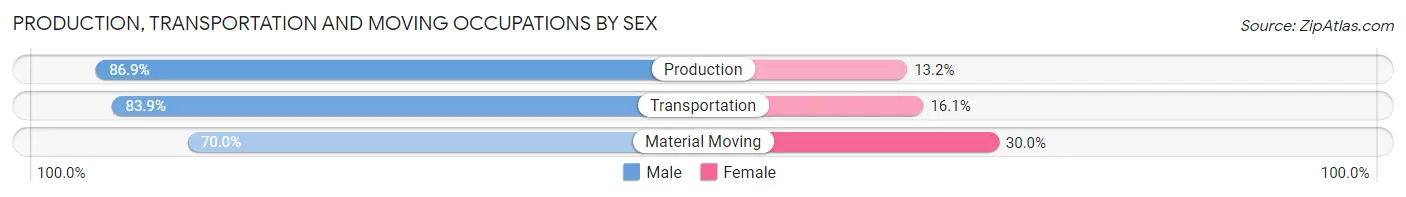
Production, Transportation and Moving Occupations by Sex
| Occupation | Male | Female |
| Production | 852 (86.9%) | 129 (13.2%) |
| Transportation | 1,107 (83.9%) | 213 (16.1%) |
| Material Moving | 519 (70.0%) | 222 (30.0%) |
| Total (Category) | 2,478 (81.5%) | 564 (18.5%) |
| Total (Overall) | 10,971 (60.3%) | 7,238 (39.8%) |
Employment Industries by Sex in Hendry County
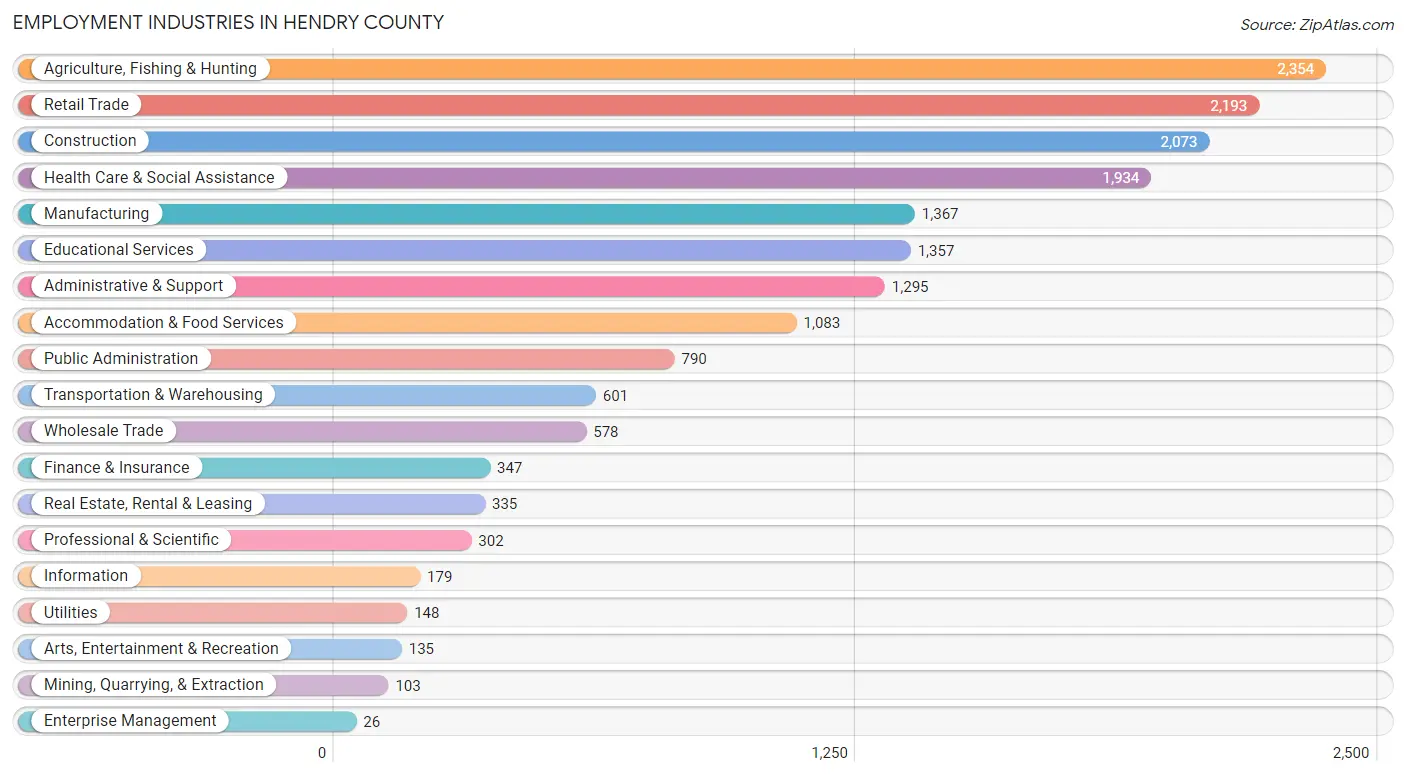
Employment Industries in Hendry County
The major employment industries in Hendry County include Agriculture, Fishing & Hunting (2,354 | 12.9%), Retail Trade (2,193 | 12.0%), Construction (2,073 | 11.4%), Health Care & Social Assistance (1,934 | 10.6%), and Manufacturing (1,367 | 7.5%).
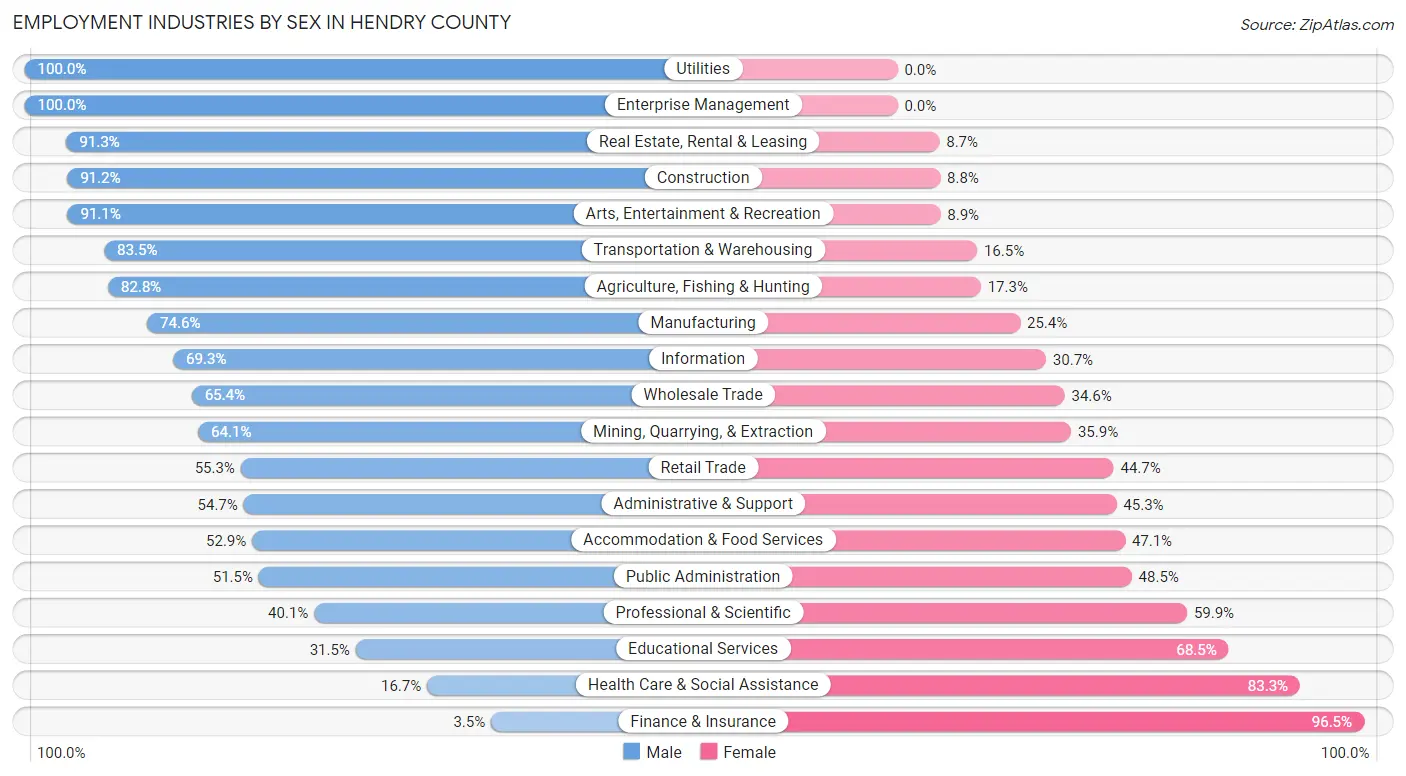
Employment Industries by Sex in Hendry County
The Hendry County industries that see more men than women are Utilities (100.0%), Enterprise Management (100.0%), and Real Estate, Rental & Leasing (91.3%), whereas the industries that tend to have a higher number of women are Finance & Insurance (96.5%), Health Care & Social Assistance (83.3%), and Educational Services (68.5%).
| Industry | Male | Female |
| Agriculture, Fishing & Hunting | 1,948 (82.8%) | 406 (17.2%) |
| Mining, Quarrying, & Extraction | 66 (64.1%) | 37 (35.9%) |
| Construction | 1,890 (91.2%) | 183 (8.8%) |
| Manufacturing | 1,020 (74.6%) | 347 (25.4%) |
| Wholesale Trade | 378 (65.4%) | 200 (34.6%) |
| Retail Trade | 1,212 (55.3%) | 981 (44.7%) |
| Transportation & Warehousing | 502 (83.5%) | 99 (16.5%) |
| Utilities | 148 (100.0%) | 0 (0.0%) |
| Information | 124 (69.3%) | 55 (30.7%) |
| Finance & Insurance | 12 (3.5%) | 335 (96.5%) |
| Real Estate, Rental & Leasing | 306 (91.3%) | 29 (8.7%) |
| Professional & Scientific | 121 (40.1%) | 181 (59.9%) |
| Enterprise Management | 26 (100.0%) | 0 (0.0%) |
| Administrative & Support | 708 (54.7%) | 587 (45.3%) |
| Educational Services | 427 (31.5%) | 930 (68.5%) |
| Health Care & Social Assistance | 323 (16.7%) | 1,611 (83.3%) |
| Arts, Entertainment & Recreation | 123 (91.1%) | 12 (8.9%) |
| Accommodation & Food Services | 573 (52.9%) | 510 (47.1%) |
| Public Administration | 407 (51.5%) | 383 (48.5%) |
| Total | 10,971 (60.3%) | 7,238 (39.8%) |
Education in Hendry County
School Enrollment in Hendry County
The most common levels of schooling among the 9,526 students in Hendry County are middle school (2,653 | 27.9%), high school (2,165 | 22.7%), and elementary school (1,917 | 20.1%).
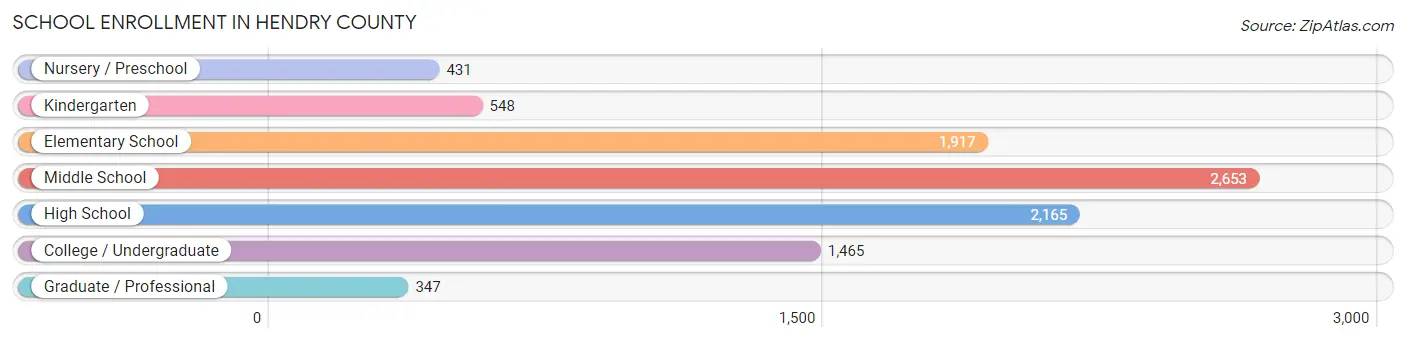
| School Level | # Students | % Students |
| Nursery / Preschool | 431 | 4.5% |
| Kindergarten | 548 | 5.8% |
| Elementary School | 1,917 | 20.1% |
| Middle School | 2,653 | 27.9% |
| High School | 2,165 | 22.7% |
| College / Undergraduate | 1,465 | 15.4% |
| Graduate / Professional | 347 | 3.6% |
| Total | 9,526 | 100.0% |
School Enrollment by Age by Funding Source in Hendry County
Out of a total of 9,526 students who are enrolled in schools in Hendry County, 1,000 (10.5%) attend a private institution, while the remaining 8,526 (89.5%) are enrolled in public schools. The age group of 25 to 34 year olds has the highest likelihood of being enrolled in private schools, with 180 (52.3% in the age bracket) enrolled. Conversely, the age group of 3 to 4 year olds has the lowest likelihood of being enrolled in a private school, with 332 (100.0% in the age bracket) attending a public institution.
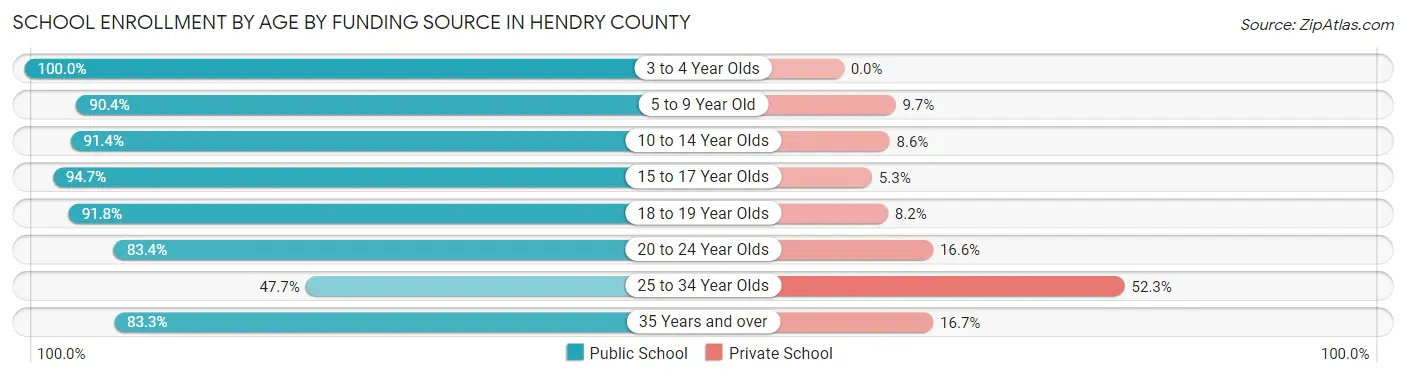
| Age Bracket | Public School | Private School |
| 3 to 4 Year Olds | 332 (100.0%) | 0 (0.0%) |
| 5 to 9 Year Old | 1,976 (90.3%) | 211 (9.7%) |
| 10 to 14 Year Olds | 3,067 (91.4%) | 287 (8.6%) |
| 15 to 17 Year Olds | 1,530 (94.7%) | 85 (5.3%) |
| 18 to 19 Year Olds | 490 (91.8%) | 44 (8.2%) |
| 20 to 24 Year Olds | 877 (83.4%) | 175 (16.6%) |
| 25 to 34 Year Olds | 164 (47.7%) | 180 (52.3%) |
| 35 Years and over | 90 (83.3%) | 18 (16.7%) |
| Total | 8,526 (89.5%) | 1,000 (10.5%) |
Educational Attainment by Field of Study in Hendry County
Education (630 | 22.4%), business (335 | 11.9%), bio, nature & agricultural (312 | 11.1%), liberal arts & history (301 | 10.7%), and psychology (259 | 9.2%) are the most common fields of study among 2,807 individuals in Hendry County who have obtained a bachelor's degree or higher.
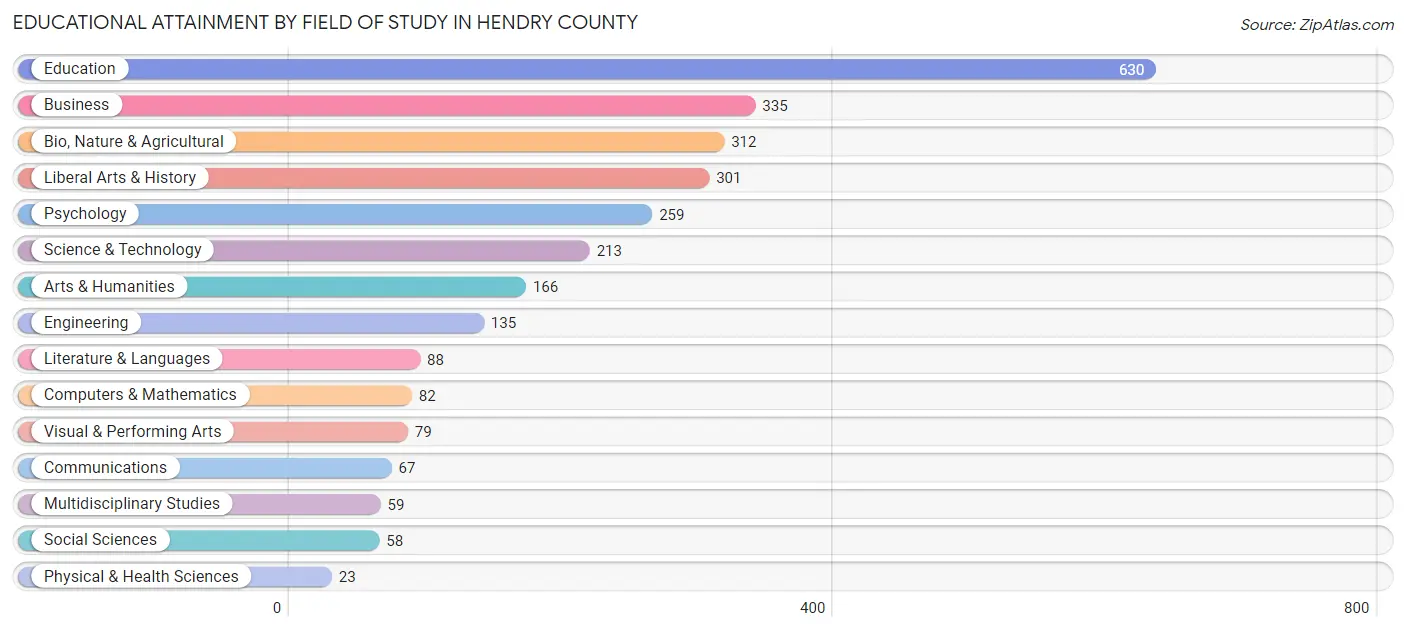
| Field of Study | # Graduates | % Graduates |
| Computers & Mathematics | 82 | 2.9% |
| Bio, Nature & Agricultural | 312 | 11.1% |
| Physical & Health Sciences | 23 | 0.8% |
| Psychology | 259 | 9.2% |
| Social Sciences | 58 | 2.1% |
| Engineering | 135 | 4.8% |
| Multidisciplinary Studies | 59 | 2.1% |
| Science & Technology | 213 | 7.6% |
| Business | 335 | 11.9% |
| Education | 630 | 22.4% |
| Literature & Languages | 88 | 3.1% |
| Liberal Arts & History | 301 | 10.7% |
| Visual & Performing Arts | 79 | 2.8% |
| Communications | 67 | 2.4% |
| Arts & Humanities | 166 | 5.9% |
| Total | 2,807 | 100.0% |
Transportation & Commute in Hendry County
Vehicle Availability by Sex in Hendry County
The most prevalent vehicle ownership categories in Hendry County are males with 2 vehicles (3,145, accounting for 31.2%) and females with 2 vehicles (2,607, making up 44.7%).
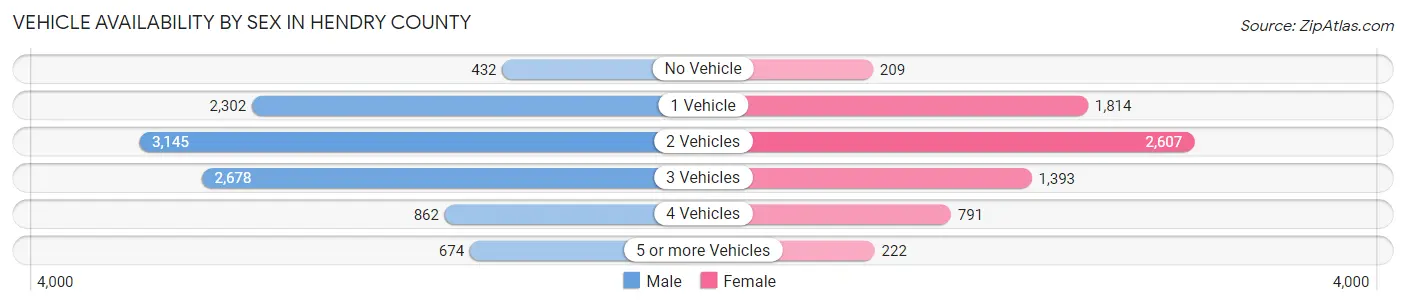
| Vehicles Available | Male | Female |
| No Vehicle | 432 (4.3%) | 209 (3.0%) |
| 1 Vehicle | 2,302 (22.8%) | 1,814 (25.8%) |
| 2 Vehicles | 3,145 (31.2%) | 2,607 (37.0%) |
| 3 Vehicles | 2,678 (26.5%) | 1,393 (19.8%) |
| 4 Vehicles | 862 (8.5%) | 791 (11.2%) |
| 5 or more Vehicles | 674 (6.7%) | 222 (3.2%) |
| Total | 10,093 (100.0%) | 7,036 (100.0%) |
Commute Time in Hendry County
The most frequently occuring commute durations in Hendry County are 5 to 9 minutes (2,866 commuters, 16.9%), 10 to 14 minutes (2,715 commuters, 16.0%), and 60 to 89 minutes (2,617 commuters, 15.4%).
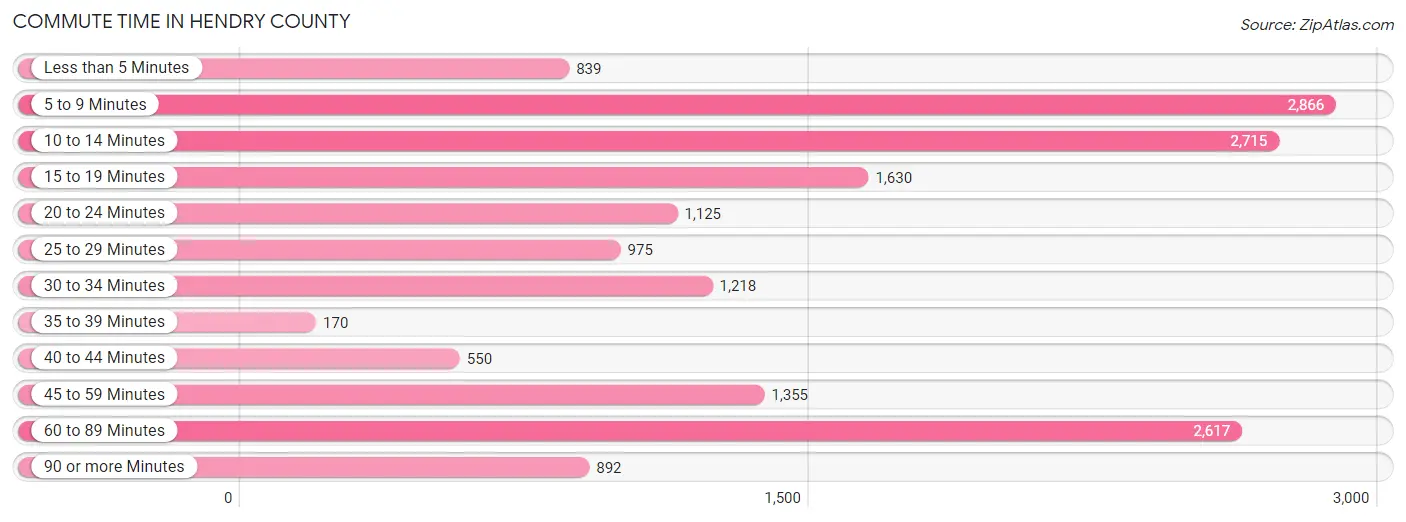
| Commute Time | # Commuters | % Commuters |
| Less than 5 Minutes | 839 | 5.0% |
| 5 to 9 Minutes | 2,866 | 16.9% |
| 10 to 14 Minutes | 2,715 | 16.0% |
| 15 to 19 Minutes | 1,630 | 9.6% |
| 20 to 24 Minutes | 1,125 | 6.6% |
| 25 to 29 Minutes | 975 | 5.8% |
| 30 to 34 Minutes | 1,218 | 7.2% |
| 35 to 39 Minutes | 170 | 1.0% |
| 40 to 44 Minutes | 550 | 3.2% |
| 45 to 59 Minutes | 1,355 | 8.0% |
| 60 to 89 Minutes | 2,617 | 15.4% |
| 90 or more Minutes | 892 | 5.3% |
Commute Time by Sex in Hendry County
The most common commute times in Hendry County are 60 to 89 minutes (1,895 commuters, 18.4%) for males and 10 to 14 minutes (1,367 commuters, 20.5%) for females.
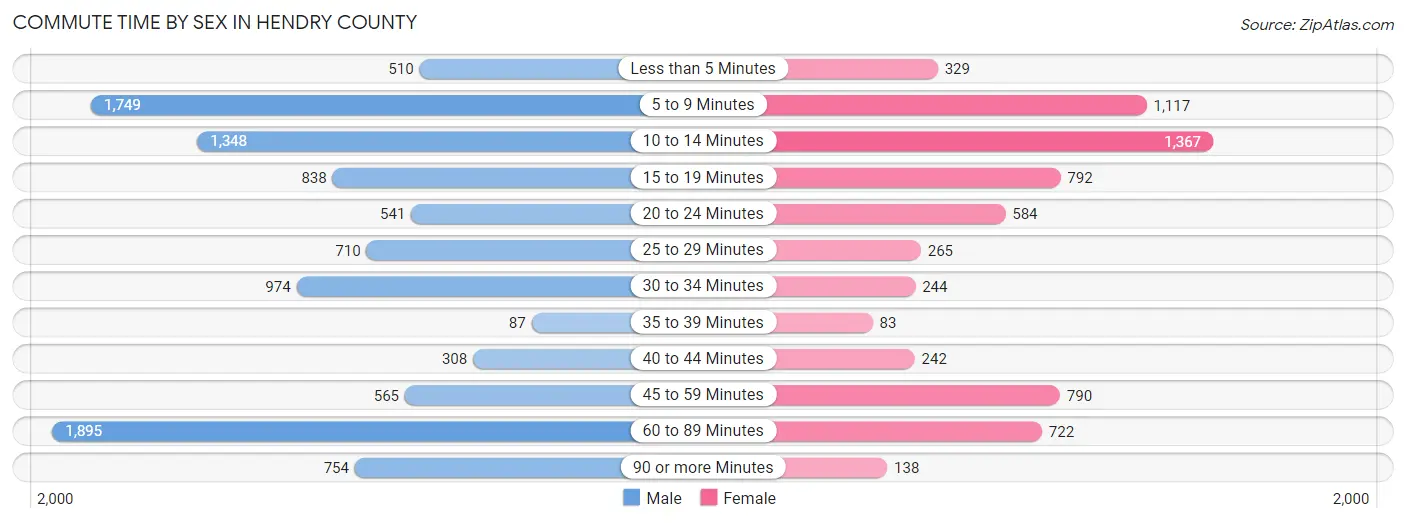
| Commute Time | Male | Female |
| Less than 5 Minutes | 510 (5.0%) | 329 (4.9%) |
| 5 to 9 Minutes | 1,749 (17.0%) | 1,117 (16.7%) |
| 10 to 14 Minutes | 1,348 (13.1%) | 1,367 (20.5%) |
| 15 to 19 Minutes | 838 (8.2%) | 792 (11.9%) |
| 20 to 24 Minutes | 541 (5.3%) | 584 (8.7%) |
| 25 to 29 Minutes | 710 (6.9%) | 265 (4.0%) |
| 30 to 34 Minutes | 974 (9.5%) | 244 (3.7%) |
| 35 to 39 Minutes | 87 (0.9%) | 83 (1.2%) |
| 40 to 44 Minutes | 308 (3.0%) | 242 (3.6%) |
| 45 to 59 Minutes | 565 (5.5%) | 790 (11.8%) |
| 60 to 89 Minutes | 1,895 (18.4%) | 722 (10.8%) |
| 90 or more Minutes | 754 (7.3%) | 138 (2.1%) |
Time of Departure to Work by Sex in Hendry County
The most frequent times of departure to work in Hendry County are 6:00 AM to 6:29 AM (2,264, 22.0%) for males and 7:00 AM to 7:29 AM (1,378, 20.6%) for females.
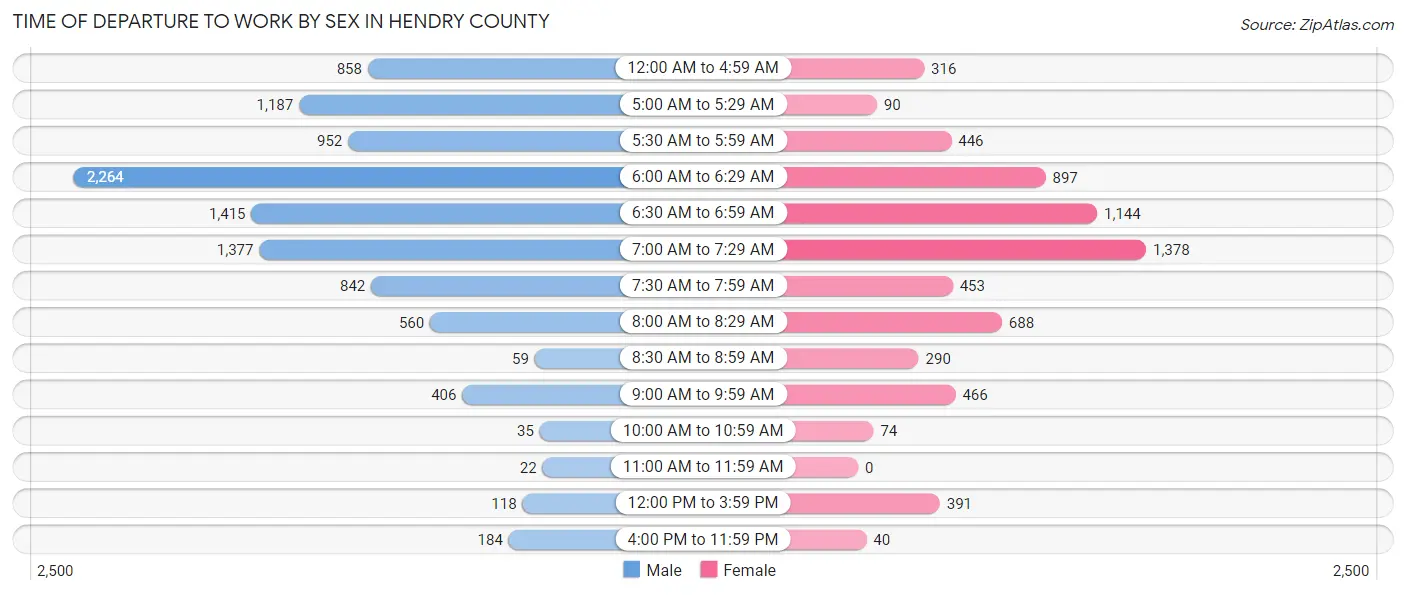
| Time of Departure | Male | Female |
| 12:00 AM to 4:59 AM | 858 (8.4%) | 316 (4.7%) |
| 5:00 AM to 5:29 AM | 1,187 (11.6%) | 90 (1.3%) |
| 5:30 AM to 5:59 AM | 952 (9.3%) | 446 (6.7%) |
| 6:00 AM to 6:29 AM | 2,264 (22.0%) | 897 (13.4%) |
| 6:30 AM to 6:59 AM | 1,415 (13.8%) | 1,144 (17.1%) |
| 7:00 AM to 7:29 AM | 1,377 (13.4%) | 1,378 (20.6%) |
| 7:30 AM to 7:59 AM | 842 (8.2%) | 453 (6.8%) |
| 8:00 AM to 8:29 AM | 560 (5.4%) | 688 (10.3%) |
| 8:30 AM to 8:59 AM | 59 (0.6%) | 290 (4.3%) |
| 9:00 AM to 9:59 AM | 406 (4.0%) | 466 (7.0%) |
| 10:00 AM to 10:59 AM | 35 (0.3%) | 74 (1.1%) |
| 11:00 AM to 11:59 AM | 22 (0.2%) | 0 (0.0%) |
| 12:00 PM to 3:59 PM | 118 (1.1%) | 391 (5.9%) |
| 4:00 PM to 11:59 PM | 184 (1.8%) | 40 (0.6%) |
| Total | 10,279 (100.0%) | 6,673 (100.0%) |
Housing Occupancy in Hendry County
Occupancy by Ownership in Hendry County
Of the total 13,289 dwellings in Hendry County, owner-occupied units account for 9,269 (69.8%), while renter-occupied units make up 4,020 (30.2%).
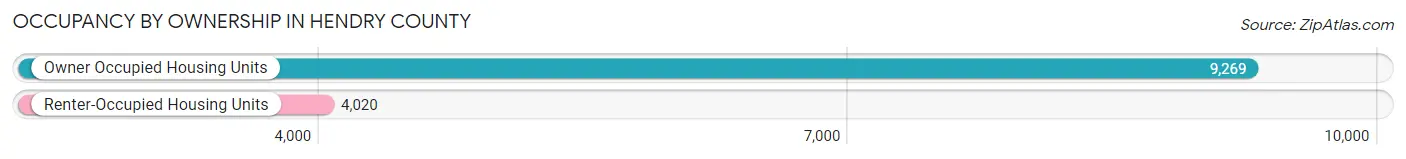
| Occupancy | # Housing Units | % Housing Units |
| Owner Occupied Housing Units | 9,269 | 69.8% |
| Renter-Occupied Housing Units | 4,020 | 30.2% |
| Total Occupied Housing Units | 13,289 | 100.0% |
Occupancy by Household Size in Hendry County
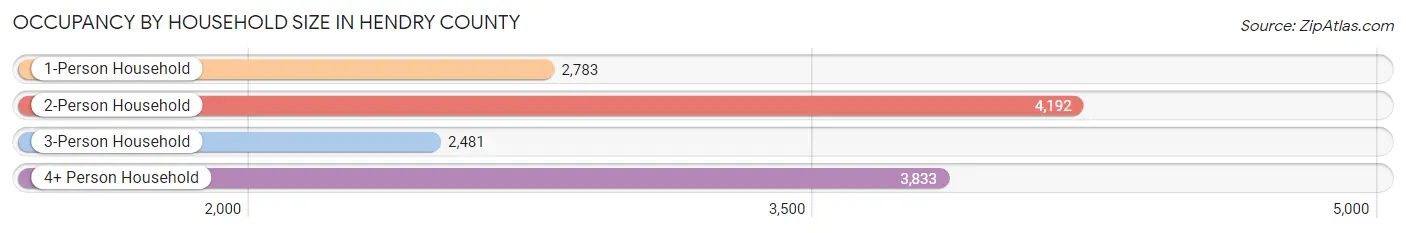
| Household Size | # Housing Units | % Housing Units |
| 1-Person Household | 2,783 | 20.9% |
| 2-Person Household | 4,192 | 31.5% |
| 3-Person Household | 2,481 | 18.7% |
| 4+ Person Household | 3,833 | 28.8% |
| Total Housing Units | 13,289 | 100.0% |
Occupancy by Ownership by Household Size in Hendry County
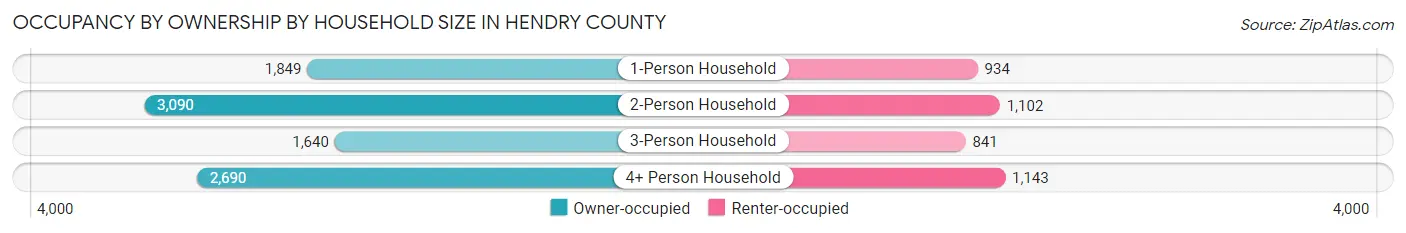
| Household Size | Owner-occupied | Renter-occupied |
| 1-Person Household | 1,849 (66.4%) | 934 (33.6%) |
| 2-Person Household | 3,090 (73.7%) | 1,102 (26.3%) |
| 3-Person Household | 1,640 (66.1%) | 841 (33.9%) |
| 4+ Person Household | 2,690 (70.2%) | 1,143 (29.8%) |
| Total Housing Units | 9,269 (69.8%) | 4,020 (30.2%) |
Occupancy by Educational Attainment in Hendry County
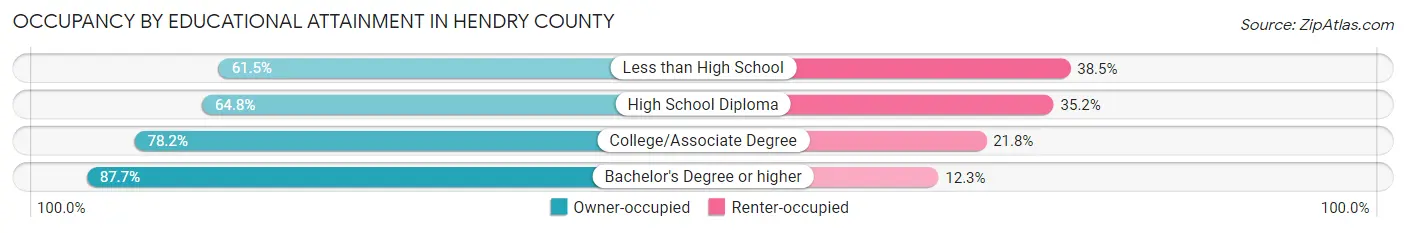
| Household Size | Owner-occupied | Renter-occupied |
| Less than High School | 2,186 (61.5%) | 1,368 (38.5%) |
| High School Diploma | 3,190 (64.8%) | 1,731 (35.2%) |
| College/Associate Degree | 2,699 (78.2%) | 753 (21.8%) |
| Bachelor's Degree or higher | 1,194 (87.7%) | 168 (12.3%) |
Occupancy by Age of Householder in Hendry County
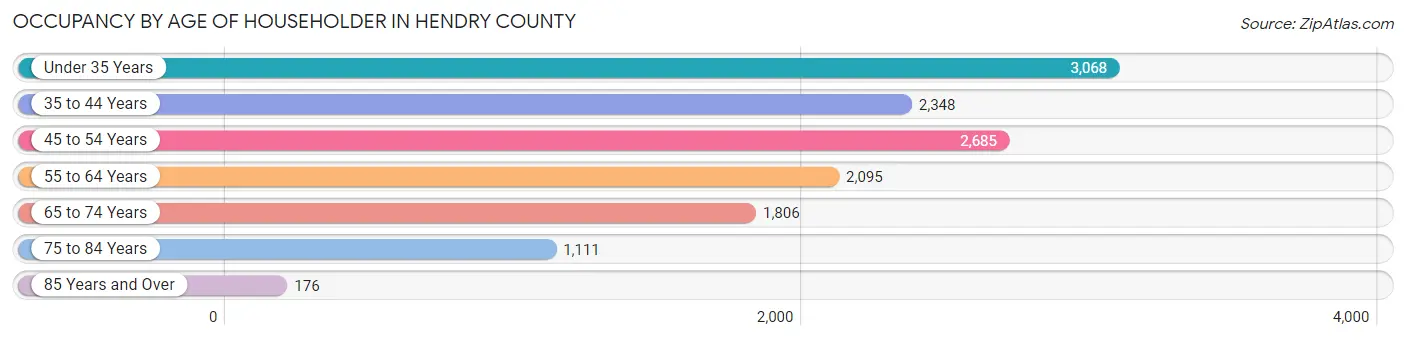
| Age Bracket | # Households | % Households |
| Under 35 Years | 3,068 | 23.1% |
| 35 to 44 Years | 2,348 | 17.7% |
| 45 to 54 Years | 2,685 | 20.2% |
| 55 to 64 Years | 2,095 | 15.8% |
| 65 to 74 Years | 1,806 | 13.6% |
| 75 to 84 Years | 1,111 | 8.4% |
| 85 Years and Over | 176 | 1.3% |
| Total | 13,289 | 100.0% |
Housing Finances in Hendry County
Median Income by Occupancy in Hendry County
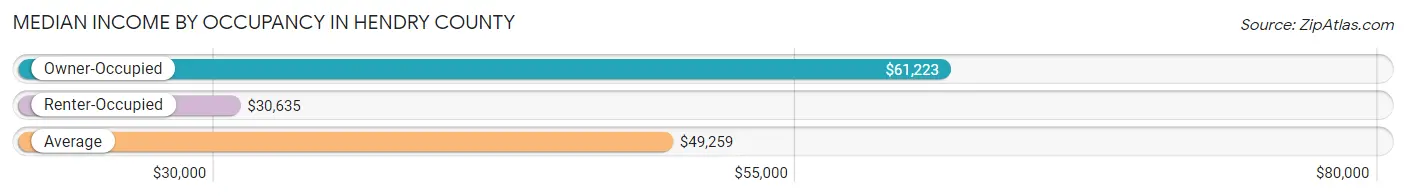
| Occupancy Type | # Households | Median Income |
| Owner-Occupied | 9,269 (69.8%) | $61,223 |
| Renter-Occupied | 4,020 (30.2%) | $30,635 |
| Average | 13,289 (100.0%) | $49,259 |
Occupancy by Householder Income Bracket in Hendry County
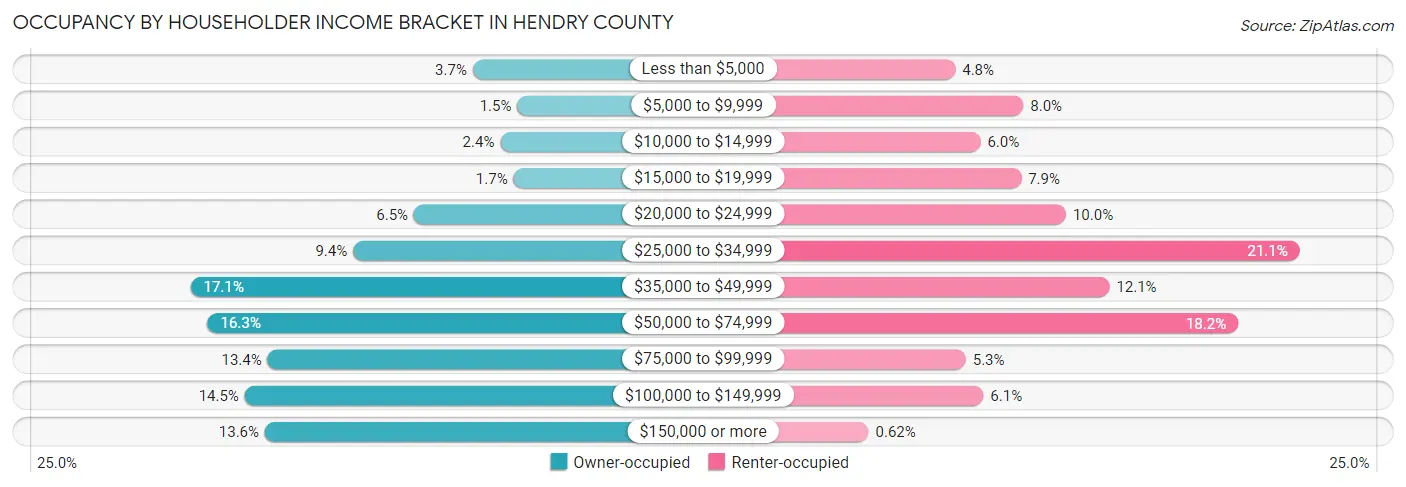
| Income Bracket | Owner-occupied | Renter-occupied |
| Less than $5,000 | 339 (3.7%) | 191 (4.8%) |
| $5,000 to $9,999 | 143 (1.5%) | 321 (8.0%) |
| $10,000 to $14,999 | 218 (2.4%) | 239 (5.9%) |
| $15,000 to $19,999 | 159 (1.7%) | 317 (7.9%) |
| $20,000 to $24,999 | 599 (6.5%) | 403 (10.0%) |
| $25,000 to $34,999 | 868 (9.4%) | 850 (21.1%) |
| $35,000 to $49,999 | 1,585 (17.1%) | 486 (12.1%) |
| $50,000 to $74,999 | 1,510 (16.3%) | 732 (18.2%) |
| $75,000 to $99,999 | 1,245 (13.4%) | 211 (5.2%) |
| $100,000 to $149,999 | 1,346 (14.5%) | 245 (6.1%) |
| $150,000 or more | 1,257 (13.6%) | 25 (0.6%) |
| Total | 9,269 (100.0%) | 4,020 (100.0%) |
Monthly Housing Cost Tiers in Hendry County
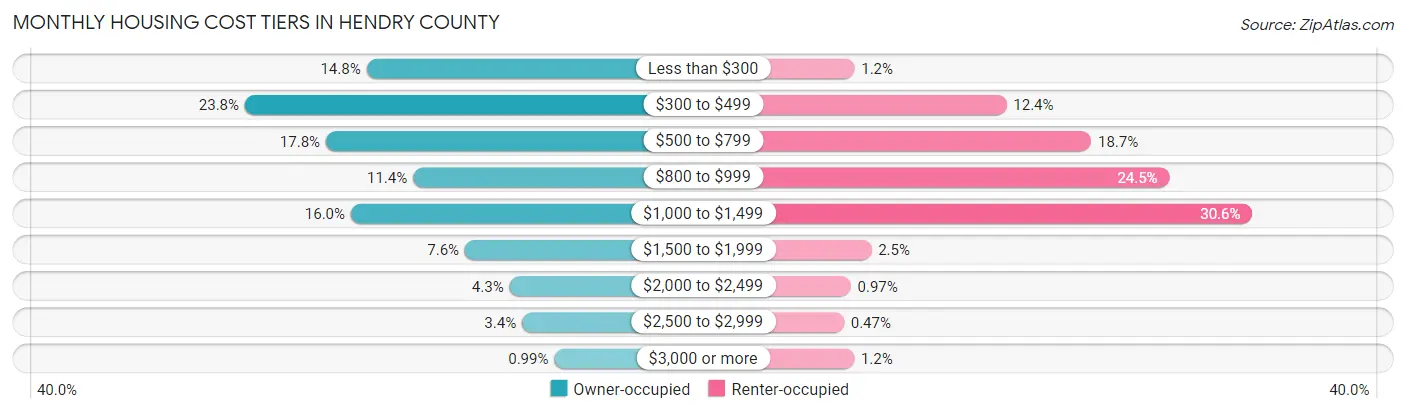
| Monthly Cost | Owner-occupied | Renter-occupied |
| Less than $300 | 1,374 (14.8%) | 50 (1.2%) |
| $300 to $499 | 2,204 (23.8%) | 500 (12.4%) |
| $500 to $799 | 1,651 (17.8%) | 751 (18.7%) |
| $800 to $999 | 1,056 (11.4%) | 983 (24.4%) |
| $1,000 to $1,499 | 1,480 (16.0%) | 1,228 (30.5%) |
| $1,500 to $1,999 | 702 (7.6%) | 100 (2.5%) |
| $2,000 to $2,499 | 398 (4.3%) | 39 (1.0%) |
| $2,500 to $2,999 | 312 (3.4%) | 19 (0.5%) |
| $3,000 or more | 92 (1.0%) | 49 (1.2%) |
| Total | 9,269 (100.0%) | 4,020 (100.0%) |
Physical Housing Characteristics in Hendry County
Housing Structures in Hendry County
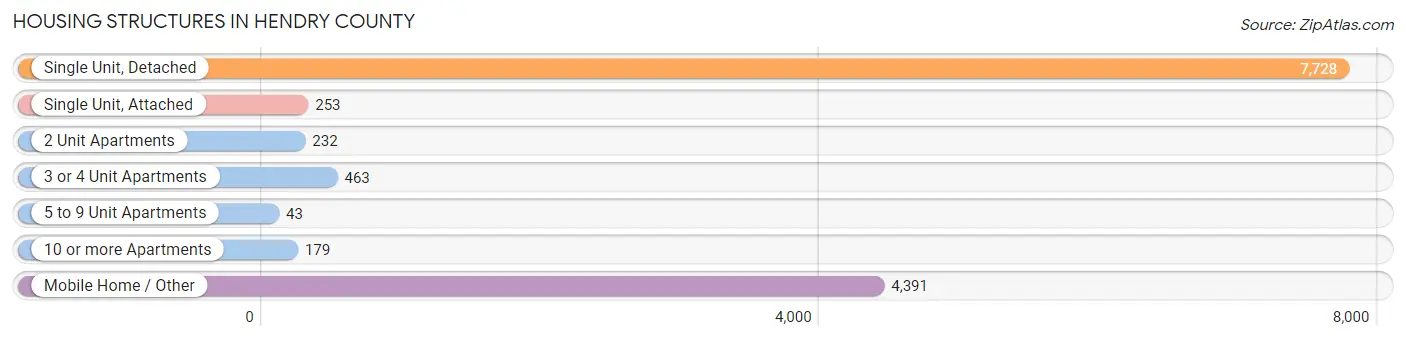
| Structure Type | # Housing Units | % Housing Units |
| Single Unit, Detached | 7,728 | 58.2% |
| Single Unit, Attached | 253 | 1.9% |
| 2 Unit Apartments | 232 | 1.8% |
| 3 or 4 Unit Apartments | 463 | 3.5% |
| 5 to 9 Unit Apartments | 43 | 0.3% |
| 10 or more Apartments | 179 | 1.3% |
| Mobile Home / Other | 4,391 | 33.0% |
| Total | 13,289 | 100.0% |
Housing Structures by Occupancy in Hendry County
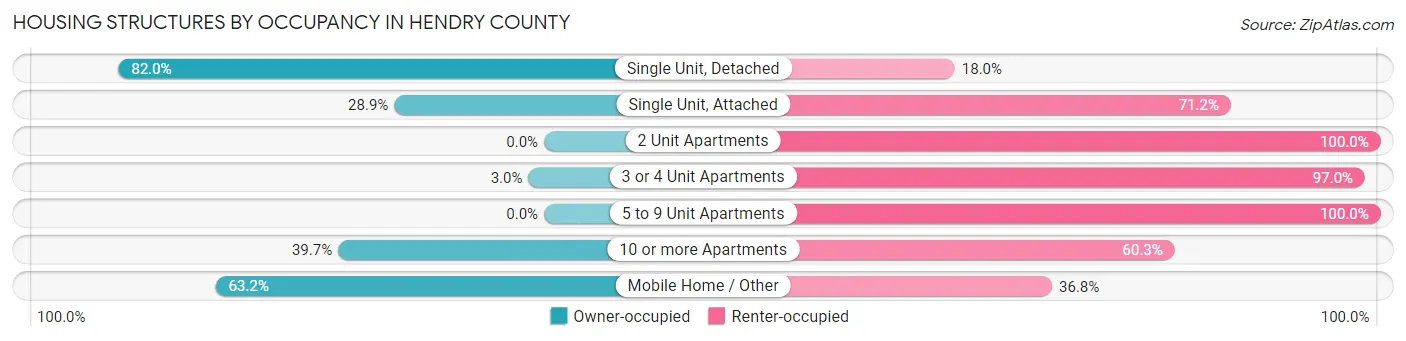
| Structure Type | Owner-occupied | Renter-occupied |
| Single Unit, Detached | 6,334 (82.0%) | 1,394 (18.0%) |
| Single Unit, Attached | 73 (28.8%) | 180 (71.2%) |
| 2 Unit Apartments | 0 (0.0%) | 232 (100.0%) |
| 3 or 4 Unit Apartments | 14 (3.0%) | 449 (97.0%) |
| 5 to 9 Unit Apartments | 0 (0.0%) | 43 (100.0%) |
| 10 or more Apartments | 71 (39.7%) | 108 (60.3%) |
| Mobile Home / Other | 2,777 (63.2%) | 1,614 (36.8%) |
| Total | 9,269 (69.8%) | 4,020 (30.2%) |
Housing Structures by Number of Rooms in Hendry County
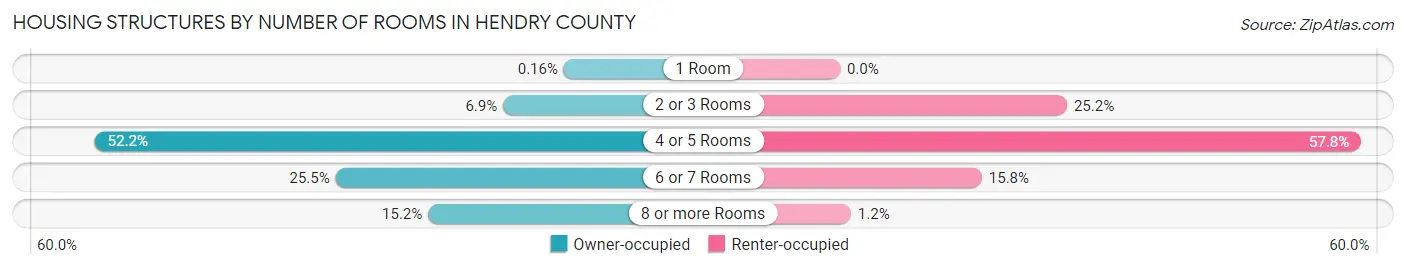
| Number of Rooms | Owner-occupied | Renter-occupied |
| 1 Room | 15 (0.2%) | 0 (0.0%) |
| 2 or 3 Rooms | 640 (6.9%) | 1,013 (25.2%) |
| 4 or 5 Rooms | 4,840 (52.2%) | 2,325 (57.8%) |
| 6 or 7 Rooms | 2,363 (25.5%) | 633 (15.8%) |
| 8 or more Rooms | 1,411 (15.2%) | 49 (1.2%) |
| Total | 9,269 (100.0%) | 4,020 (100.0%) |
Housing Structure by Heating Type in Hendry County
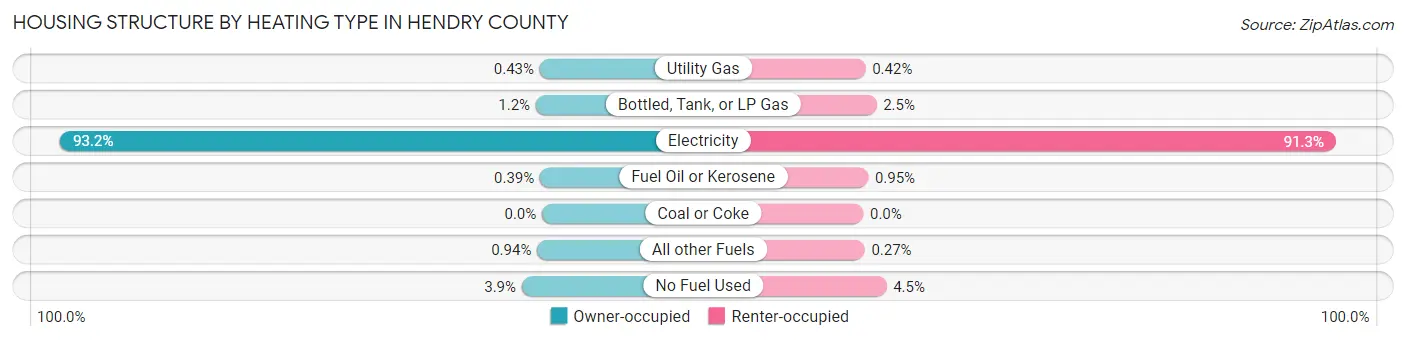
| Heating Type | Owner-occupied | Renter-occupied |
| Utility Gas | 40 (0.4%) | 17 (0.4%) |
| Bottled, Tank, or LP Gas | 110 (1.2%) | 102 (2.5%) |
| Electricity | 8,634 (93.1%) | 3,672 (91.3%) |
| Fuel Oil or Kerosene | 36 (0.4%) | 38 (0.9%) |
| Coal or Coke | 0 (0.0%) | 0 (0.0%) |
| All other Fuels | 87 (0.9%) | 11 (0.3%) |
| No Fuel Used | 362 (3.9%) | 180 (4.5%) |
| Total | 9,269 (100.0%) | 4,020 (100.0%) |
Household Vehicle Usage in Hendry County
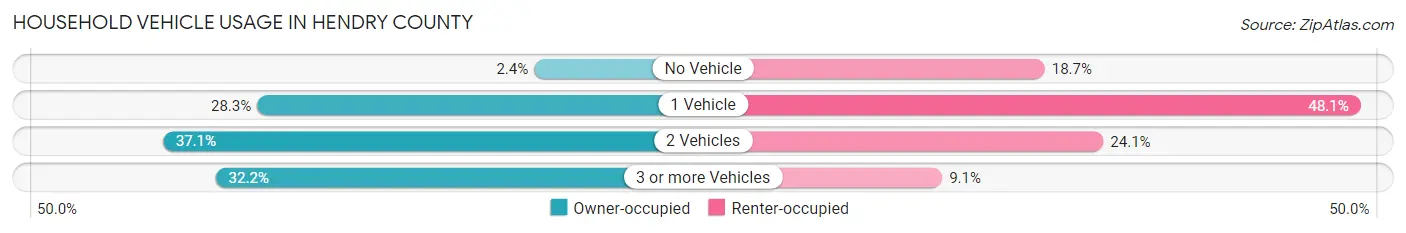
| Vehicles per Household | Owner-occupied | Renter-occupied |
| No Vehicle | 226 (2.4%) | 750 (18.7%) |
| 1 Vehicle | 2,623 (28.3%) | 1,935 (48.1%) |
| 2 Vehicles | 3,439 (37.1%) | 970 (24.1%) |
| 3 or more Vehicles | 2,981 (32.2%) | 365 (9.1%) |
| Total | 9,269 (100.0%) | 4,020 (100.0%) |
Real Estate & Mortgages in Hendry County
Real Estate and Mortgage Overview in Hendry County
| Characteristic | Without Mortgage | With Mortgage |
| Housing Units | 5,231 | 4,038 |
| Median Property Value | $144,800 | $170,400 |
| Median Household Income | $52,788 | $540 |
| Monthly Housing Costs | $400 | $92 |
| Real Estate Taxes | $1,281 | $120 |
Property Value by Mortgage Status in Hendry County
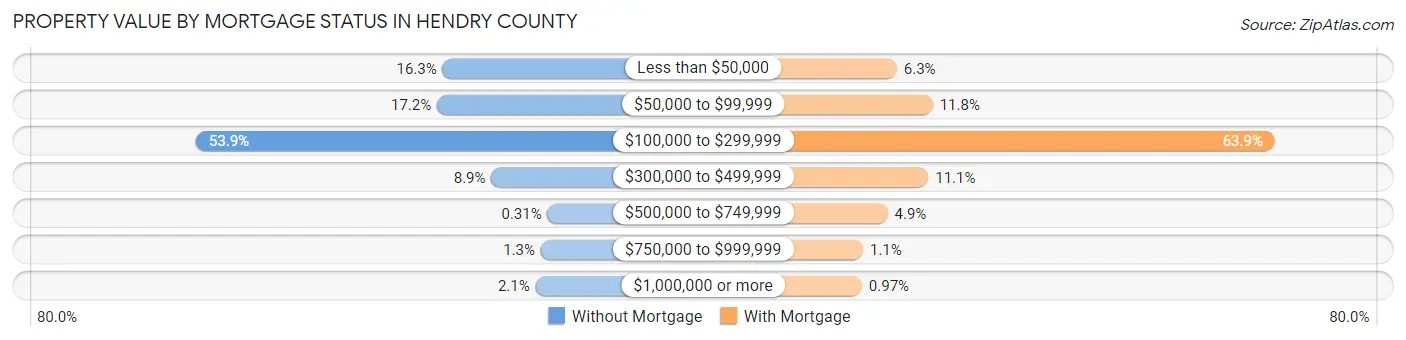
| Property Value | Without Mortgage | With Mortgage |
| Less than $50,000 | 853 (16.3%) | 254 (6.3%) |
| $50,000 to $99,999 | 897 (17.2%) | 475 (11.8%) |
| $100,000 to $299,999 | 2,819 (53.9%) | 2,579 (63.9%) |
| $300,000 to $499,999 | 464 (8.9%) | 448 (11.1%) |
| $500,000 to $749,999 | 16 (0.3%) | 197 (4.9%) |
| $750,000 to $999,999 | 70 (1.3%) | 46 (1.1%) |
| $1,000,000 or more | 112 (2.1%) | 39 (1.0%) |
| Total | 5,231 (100.0%) | 4,038 (100.0%) |
Household Income by Mortgage Status in Hendry County
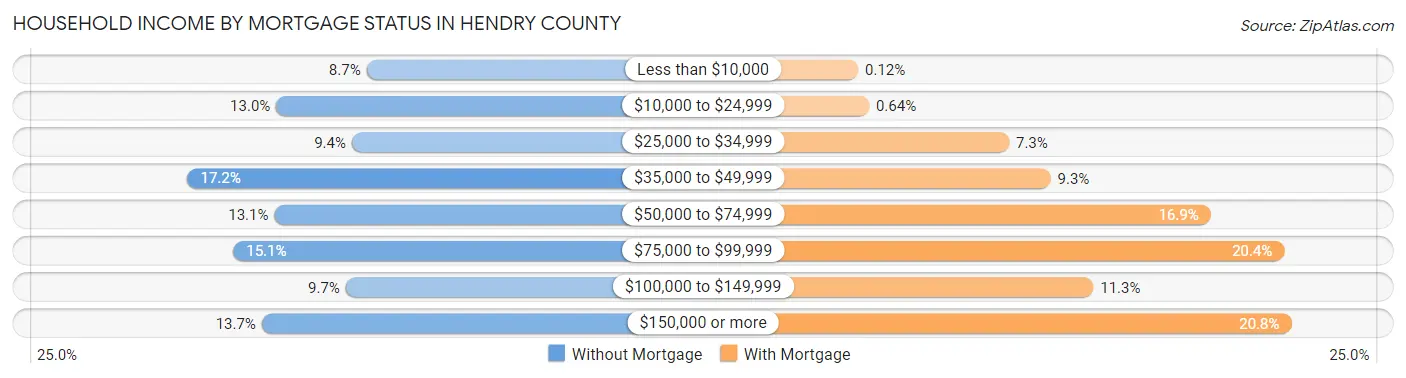
| Household Income | Without Mortgage | With Mortgage |
| Less than $10,000 | 456 (8.7%) | 5 (0.1%) |
| $10,000 to $24,999 | 681 (13.0%) | 26 (0.6%) |
| $25,000 to $34,999 | 493 (9.4%) | 295 (7.3%) |
| $35,000 to $49,999 | 902 (17.2%) | 375 (9.3%) |
| $50,000 to $74,999 | 686 (13.1%) | 683 (16.9%) |
| $75,000 to $99,999 | 788 (15.1%) | 824 (20.4%) |
| $100,000 to $149,999 | 508 (9.7%) | 457 (11.3%) |
| $150,000 or more | 717 (13.7%) | 838 (20.7%) |
| Total | 5,231 (100.0%) | 4,038 (100.0%) |
Property Value to Household Income Ratio in Hendry County
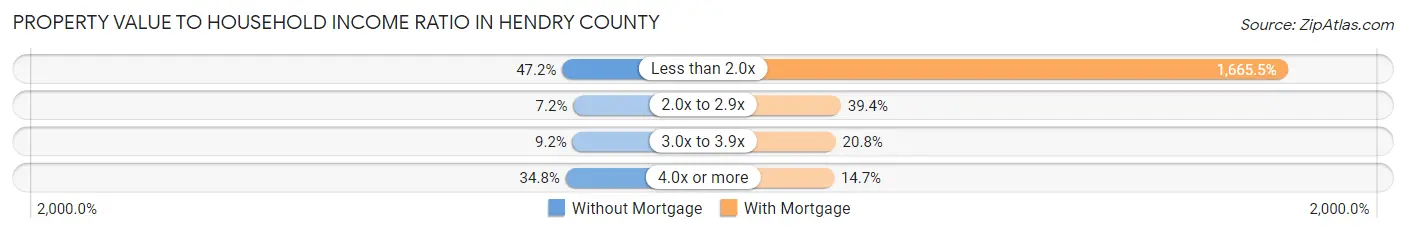
| Value-to-Income Ratio | Without Mortgage | With Mortgage |
| Less than 2.0x | 2,471 (47.2%) | 67,253 (1,665.5%) |
| 2.0x to 2.9x | 378 (7.2%) | 1,591 (39.4%) |
| 3.0x to 3.9x | 483 (9.2%) | 841 (20.8%) |
| 4.0x or more | 1,822 (34.8%) | 592 (14.7%) |
| Total | 5,231 (100.0%) | 4,038 (100.0%) |
Real Estate Taxes by Mortgage Status in Hendry County
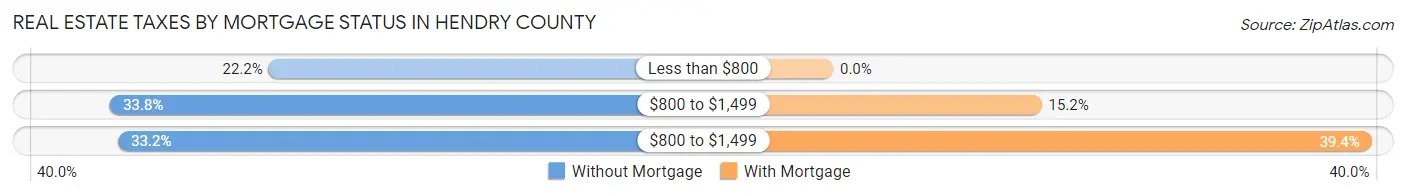
| Property Taxes | Without Mortgage | With Mortgage |
| Less than $800 | 1,160 (22.2%) | 0 (0.0%) |
| $800 to $1,499 | 1,766 (33.8%) | 615 (15.2%) |
| $800 to $1,499 | 1,735 (33.2%) | 1,589 (39.4%) |
| Total | 5,231 (100.0%) | 4,038 (100.0%) |
Health & Disability in Hendry County
Health Insurance Coverage by Age in Hendry County
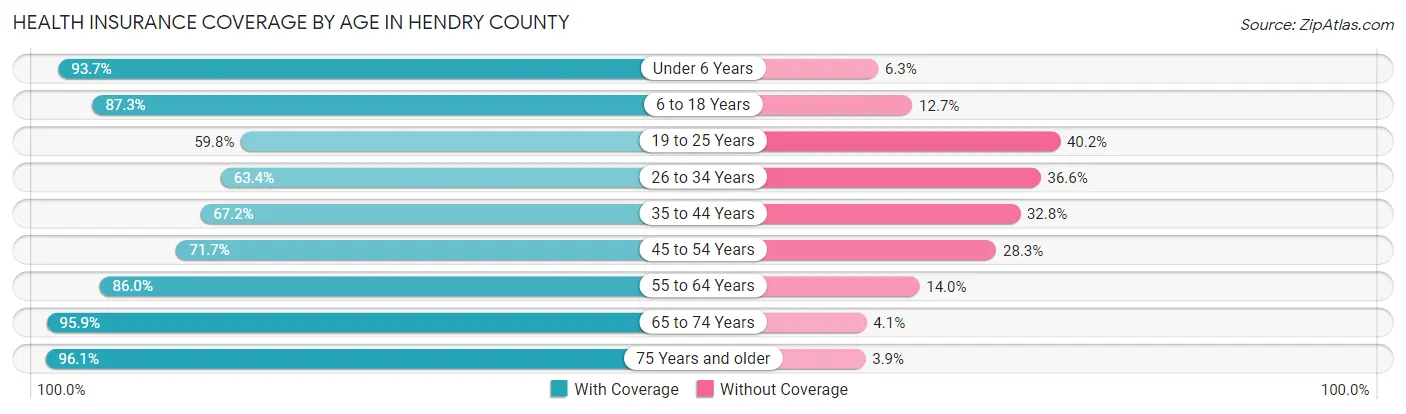
| Age Bracket | With Coverage | Without Coverage |
| Under 6 Years | 3,190 (93.7%) | 214 (6.3%) |
| 6 to 18 Years | 6,307 (87.3%) | 914 (12.7%) |
| 19 to 25 Years | 2,507 (59.8%) | 1,686 (40.2%) |
| 26 to 34 Years | 3,116 (63.4%) | 1,798 (36.6%) |
| 35 to 44 Years | 3,384 (67.2%) | 1,649 (32.8%) |
| 45 to 54 Years | 3,591 (71.7%) | 1,418 (28.3%) |
| 55 to 64 Years | 3,721 (86.0%) | 605 (14.0%) |
| 65 to 74 Years | 2,766 (95.9%) | 119 (4.1%) |
| 75 Years and older | 2,114 (96.1%) | 86 (3.9%) |
| Total | 30,696 (78.3%) | 8,489 (21.7%) |
Health Insurance Coverage by Citizenship Status in Hendry County
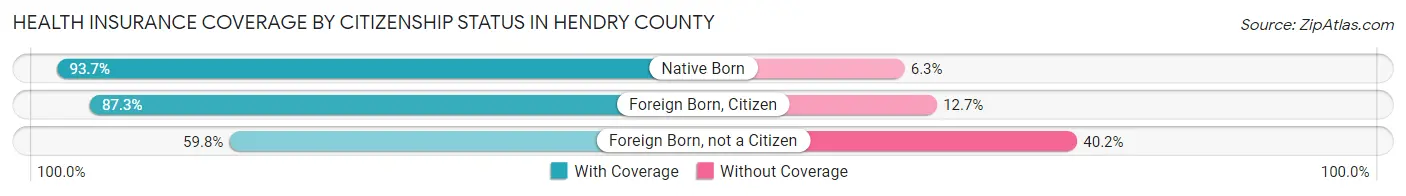
| Citizenship Status | With Coverage | Without Coverage |
| Native Born | 3,190 (93.7%) | 214 (6.3%) |
| Foreign Born, Citizen | 6,307 (87.3%) | 914 (12.7%) |
| Foreign Born, not a Citizen | 2,507 (59.8%) | 1,686 (40.2%) |
Health Insurance Coverage by Household Income in Hendry County
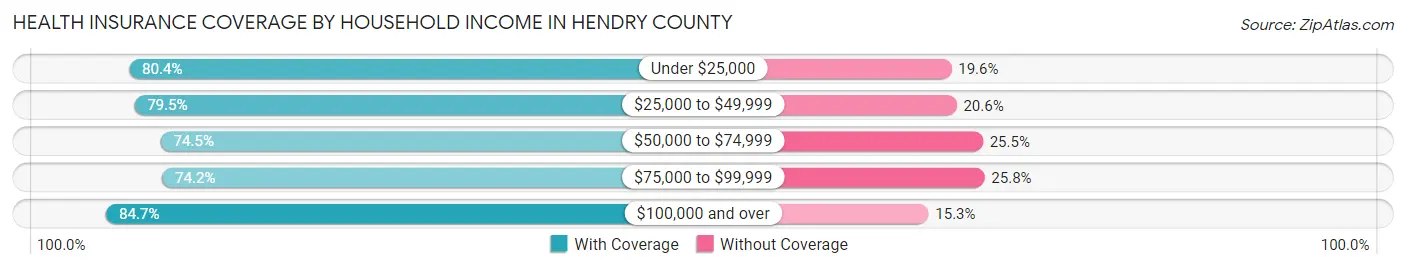
| Household Income | With Coverage | Without Coverage |
| Under $25,000 | 4,776 (80.4%) | 1,163 (19.6%) |
| $25,000 to $49,999 | 8,089 (79.4%) | 2,092 (20.5%) |
| $50,000 to $74,999 | 4,369 (74.5%) | 1,493 (25.5%) |
| $75,000 to $99,999 | 3,835 (74.2%) | 1,332 (25.8%) |
| $100,000 and over | 8,915 (84.7%) | 1,608 (15.3%) |
Public vs Private Health Insurance Coverage by Age in Hendry County
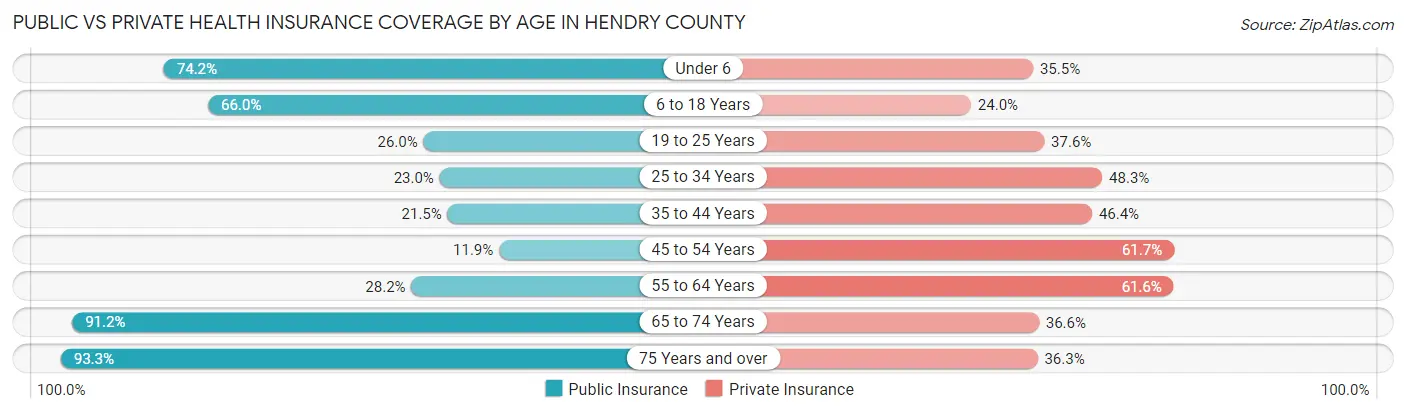
| Age Bracket | Public Insurance | Private Insurance |
| Under 6 | 2,524 (74.2%) | 1,208 (35.5%) |
| 6 to 18 Years | 4,762 (65.9%) | 1,731 (24.0%) |
| 19 to 25 Years | 1,088 (26.0%) | 1,575 (37.6%) |
| 25 to 34 Years | 1,128 (23.0%) | 2,375 (48.3%) |
| 35 to 44 Years | 1,081 (21.5%) | 2,337 (46.4%) |
| 45 to 54 Years | 597 (11.9%) | 3,088 (61.7%) |
| 55 to 64 Years | 1,220 (28.2%) | 2,665 (61.6%) |
| 65 to 74 Years | 2,630 (91.2%) | 1,055 (36.6%) |
| 75 Years and over | 2,052 (93.3%) | 799 (36.3%) |
| Total | 17,082 (43.6%) | 16,833 (43.0%) |
Disability Status by Sex by Age in Hendry County
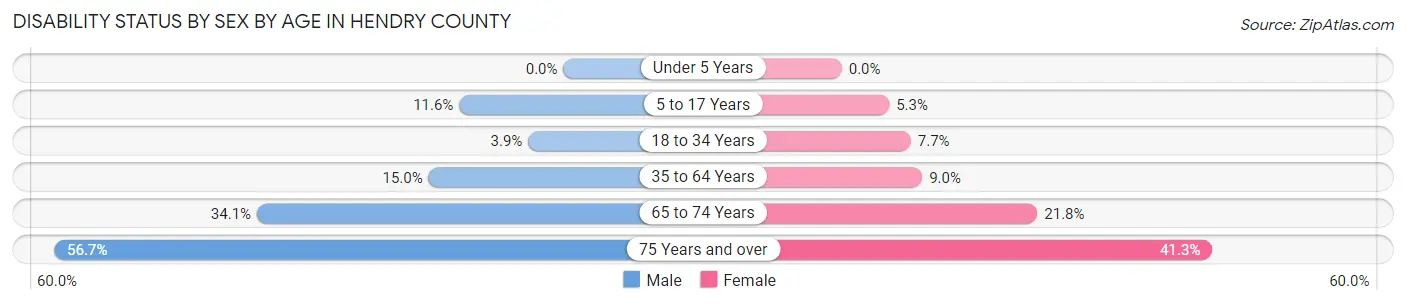
| Age Bracket | Male | Female |
| Under 5 Years | 0 (0.0%) | 0 (0.0%) |
| 5 to 17 Years | 439 (11.6%) | 191 (5.3%) |
| 18 to 34 Years | 223 (3.9%) | 301 (7.7%) |
| 35 to 64 Years | 1,181 (15.0%) | 582 (9.0%) |
| 65 to 74 Years | 502 (34.1%) | 308 (21.8%) |
| 75 Years and over | 596 (56.7%) | 474 (41.2%) |
Disability Class by Sex by Age in Hendry County
Disability Class: Hearing Difficulty
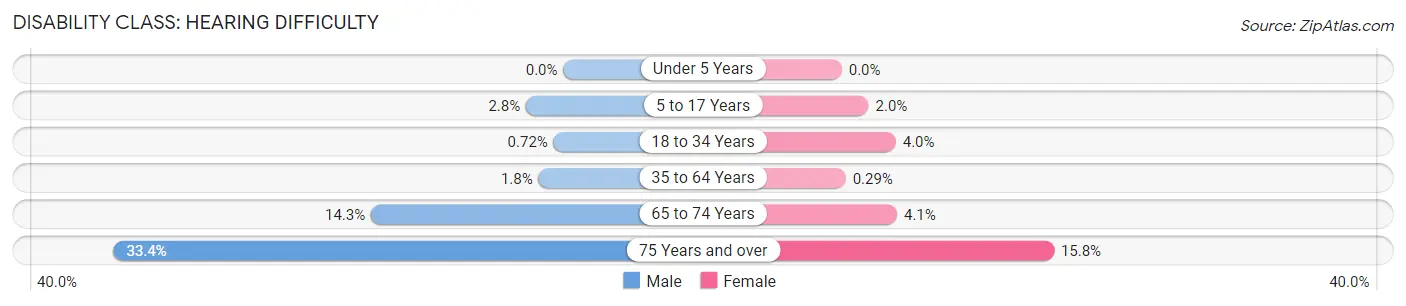
| Age Bracket | Male | Female |
| Under 5 Years | 0 (0.0%) | 0 (0.0%) |
| 5 to 17 Years | 105 (2.8%) | 72 (2.0%) |
| 18 to 34 Years | 41 (0.7%) | 157 (4.0%) |
| 35 to 64 Years | 145 (1.8%) | 19 (0.3%) |
| 65 to 74 Years | 210 (14.3%) | 58 (4.1%) |
| 75 Years and over | 351 (33.4%) | 181 (15.8%) |
Disability Class: Vision Difficulty
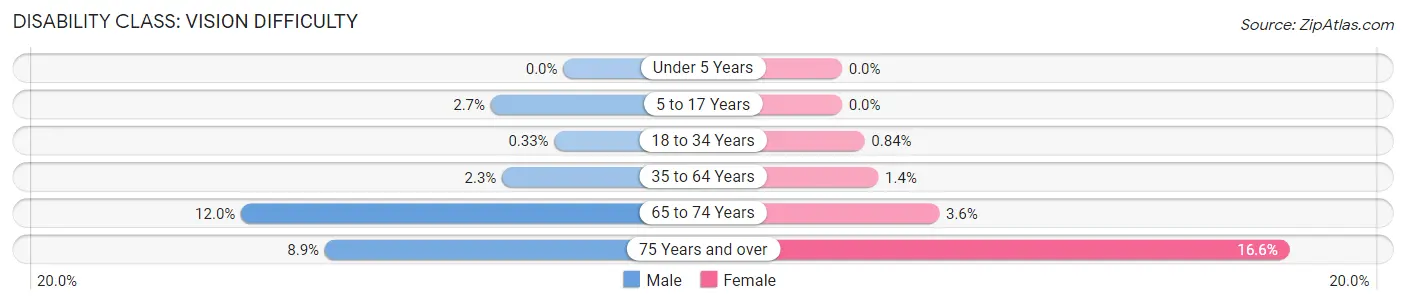
| Age Bracket | Male | Female |
| Under 5 Years | 0 (0.0%) | 0 (0.0%) |
| 5 to 17 Years | 102 (2.7%) | 0 (0.0%) |
| 18 to 34 Years | 19 (0.3%) | 33 (0.8%) |
| 35 to 64 Years | 179 (2.3%) | 88 (1.3%) |
| 65 to 74 Years | 176 (12.0%) | 51 (3.6%) |
| 75 Years and over | 93 (8.8%) | 191 (16.6%) |
Disability Class: Cognitive Difficulty
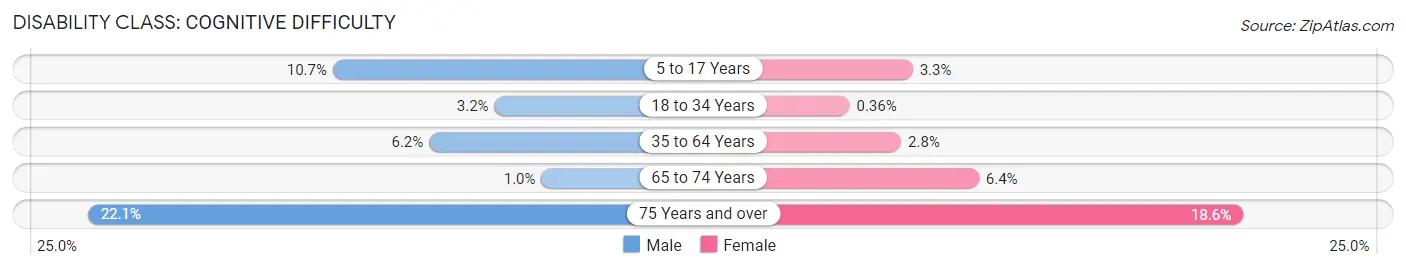
| Age Bracket | Male | Female |
| 5 to 17 Years | 405 (10.7%) | 119 (3.3%) |
| 18 to 34 Years | 182 (3.2%) | 14 (0.4%) |
| 35 to 64 Years | 490 (6.2%) | 179 (2.8%) |
| 65 to 74 Years | 15 (1.0%) | 90 (6.4%) |
| 75 Years and over | 232 (22.1%) | 214 (18.6%) |
Disability Class: Ambulatory Difficulty
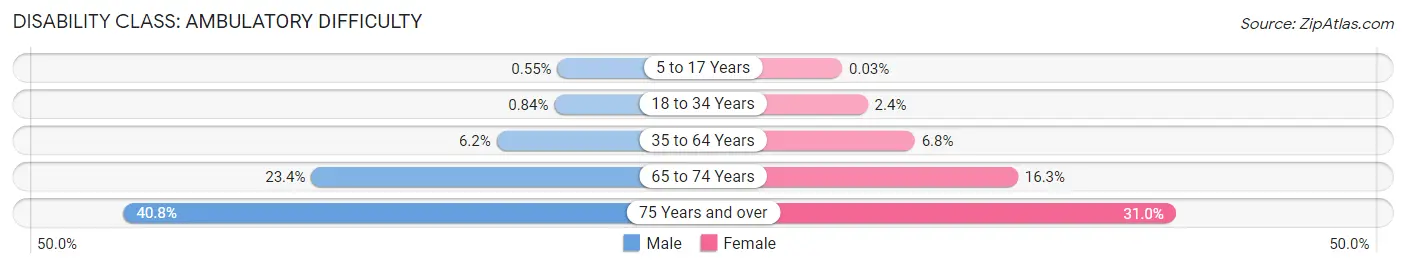
| Age Bracket | Male | Female |
| 5 to 17 Years | 21 (0.5%) | 1 (0.0%) |
| 18 to 34 Years | 48 (0.8%) | 94 (2.4%) |
| 35 to 64 Years | 488 (6.2%) | 440 (6.8%) |
| 65 to 74 Years | 344 (23.4%) | 231 (16.3%) |
| 75 Years and over | 429 (40.8%) | 356 (31.0%) |
Disability Class: Self-Care Difficulty
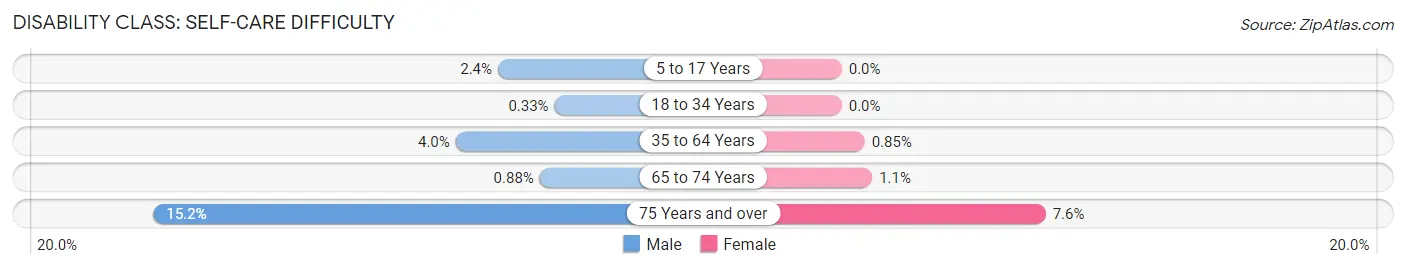
| Age Bracket | Male | Female |
| 5 to 17 Years | 92 (2.4%) | 0 (0.0%) |
| 18 to 34 Years | 19 (0.3%) | 0 (0.0%) |
| 35 to 64 Years | 315 (4.0%) | 55 (0.9%) |
| 65 to 74 Years | 13 (0.9%) | 16 (1.1%) |
| 75 Years and over | 160 (15.2%) | 87 (7.6%) |
Technology Access in Hendry County
Computing Device Access in Hendry County
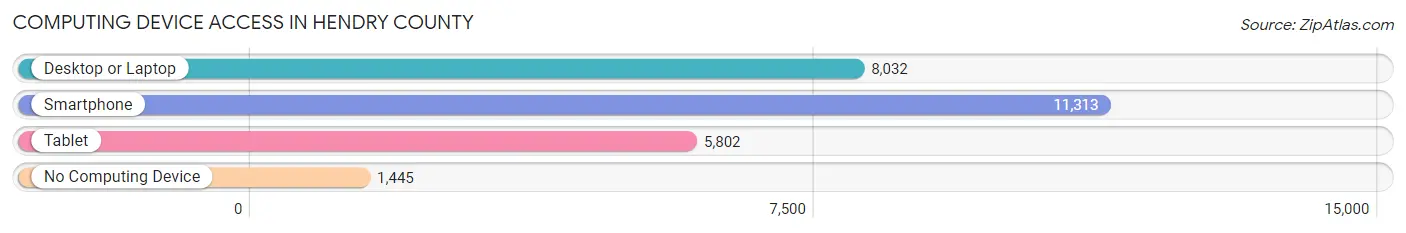
| Device Type | # Households | % Households |
| Desktop or Laptop | 8,032 | 60.4% |
| Smartphone | 11,313 | 85.1% |
| Tablet | 5,802 | 43.7% |
| No Computing Device | 1,445 | 10.9% |
| Total | 13,289 | 100.0% |
Internet Access in Hendry County
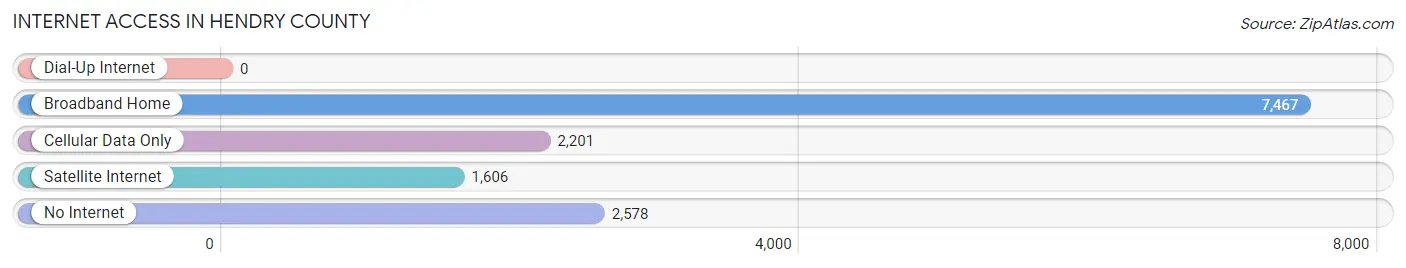
| Internet Type | # Households | % Households |
| Dial-Up Internet | 0 | 0.0% |
| Broadband Home | 7,467 | 56.2% |
| Cellular Data Only | 2,201 | 16.6% |
| Satellite Internet | 1,606 | 12.1% |
| No Internet | 2,578 | 19.4% |
| Total | 13,289 | 100.0% |
Hendry County Summary
Hendry County is located in the southwestern part of the state of Florida in the United States. It is part of the Fort Myers–Cape Coral Metropolitan Statistical Area. The county seat is LaBelle. As of the 2010 census, the population was 39,140.
History
Hendry County was created in 1923 from parts of Lee and Charlotte counties. It was named for Captain Francis A. Hendry, a Confederate soldier and one of the first settlers in the area. The county was originally part of Lee County, but was split off in 1923.
Geography
Hendry County is located in the southwestern part of the state of Florida. It is bordered by Lee County to the north, Collier County to the east, Glades County to the south, and Charlotte County to the west. The county covers an area of 1,190 square miles, making it the second-largest county in the state. The county is mostly rural, with the majority of the population living in the cities of LaBelle and Clewiston.
The county is home to several natural features, including the Caloosahatchee River, Lake Okeechobee, and the Big Cypress National Preserve. The county is also home to several state parks, including the Big Cypress National Preserve, Fisheating Creek Wildlife Management Area, and the Kissimmee River State Park.
Economy
Hendry County has a diverse economy, with the majority of the population employed in agriculture, manufacturing, and tourism. The county is home to several large agricultural operations, including sugarcane, citrus, and cattle. The county is also home to several manufacturing operations, including a sugar mill, a citrus processing plant, and a paper mill.
Tourism is also an important part of the county’s economy. The county is home to several state parks, as well as the Caloosahatchee River, Lake Okeechobee, and the Big Cypress National Preserve. The county is also home to several golf courses, fishing charters, and other recreational activities.
Demographics
As of the 2010 census, the population of Hendry County was 39,140. The population is made up of a diverse mix of ethnicities, with the majority of the population being of Hispanic or Latino origin. The median household income in the county is $37,845, and the median age is 40.7 years.
Conclusion
Hendry County is located in the southwestern part of the state of Florida in the United States. It is part of the Fort Myers–Cape Coral Metropolitan Statistical Area. The county was created in 1923 from parts of Lee and Charlotte counties and is named for Captain Francis A. Hendry, a Confederate soldier and one of the first settlers in the area. The county covers an area of 1,190 square miles and has a population of 39,140. The county has a diverse economy, with the majority of the population employed in agriculture, manufacturing, and tourism. The population is made up of a diverse mix of ethnicities, with the majority of the population being of Hispanic or Latino origin.
Common Questions
What is Per Capita Income in Hendry County?
Per Capita income in Hendry County is $24,825.
What is the Median Family Income in Hendry County?
Median Family Income in Hendry County is $53,267.
What is the Median Household income in Hendry County?
Median Household Income in Hendry County is $49,259.
What is Income or Wage Gap in Hendry County?
Income or Wage Gap in Hendry County is 23.2%.
Women in Hendry County earn 76.8 cents for every dollar earned by a man.
What is Family Income Deficit in Hendry County?
Family Income Deficit in Hendry County is $10,976.
Families that are below poverty line in Hendry County earn $10,976 less on average than the poverty threshold level.
What is Inequality or Gini Index in Hendry County?
Inequality or Gini Index in Hendry County is 0.47.
What is the Total Population of Hendry County?
Total Population of Hendry County is 39,902.
What is the Total Male Population of Hendry County?
Total Male Population of Hendry County is 21,905.
What is the Total Female Population of Hendry County?
Total Female Population of Hendry County is 17,997.
What is the Ratio of Males per 100 Females in Hendry County?
There are 121.71 Males per 100 Females in Hendry County.
What is the Ratio of Females per 100 Males in Hendry County?
There are 82.16 Females per 100 Males in Hendry County.
What is the Median Population Age in Hendry County?
Median Population Age in Hendry County is 35.1 Years.
What is the Average Family Size in Hendry County
Average Family Size in Hendry County is 3.2 People.
What is the Average Household Size in Hendry County
Average Household Size in Hendry County is 2.8 People.
How Large is the Labor Force in Hendry County?
There are 19,306 People in the Labor Forcein in Hendry County.
What is the Percentage of People in the Labor Force in Hendry County?
62.3% of People are in the Labor Force in Hendry County.
What is the Unemployment Rate in Hendry County?
Unemployment Rate in Hendry County is 5.8%.