Hamilton County, FL Map & Demographics
Hamilton County Map
Hamilton County Overview
$17,331
PER CAPITA INCOME
$52,202
AVG FAMILY INCOME
$47,668
AVG HOUSEHOLD INCOME
9.7%
WAGE / INCOME GAP [ % ]
90.3¢/ $1
WAGE / INCOME GAP [ $ ]
$12,131
FAMILY INCOME DEFICIT
0.43
INEQUALITY / GINI INDEX
13,492
TOTAL POPULATION
7,721
MALE POPULATION
5,771
FEMALE POPULATION
133.79
MALES / 100 FEMALES
74.74
FEMALES / 100 MALES
41.8
MEDIAN AGE
2.8
AVG FAMILY SIZE
2.5
AVG HOUSEHOLD SIZE
4,058
LABOR FORCE [ PEOPLE ]
36.6%
PERCENT IN LABOR FORCE
9.2%
UNEMPLOYMENT RATE
Hamilton County Area Codes
Income in Hamilton County
Income Overview in Hamilton County
Per Capita Income in Hamilton County is $17,331, while median incomes of families and households are $52,202 and $47,668 respectively.
| Characteristic | Number | Measure |
| Per Capita Income | 13,492 | $17,331 |
| Median Family Income | 3,088 | $52,202 |
| Mean Family Income | 3,088 | $64,202 |
| Median Household Income | 4,300 | $47,668 |
| Mean Household Income | 4,300 | $56,950 |
| Income Deficit | 3,088 | $12,131 |
| Wage / Income Gap (%) | 13,492 | 9.70% |
| Wage / Income Gap ($) | 13,492 | 90.30¢ per $1 |
| Gini / Inequality Index | 13,492 | 0.43 |
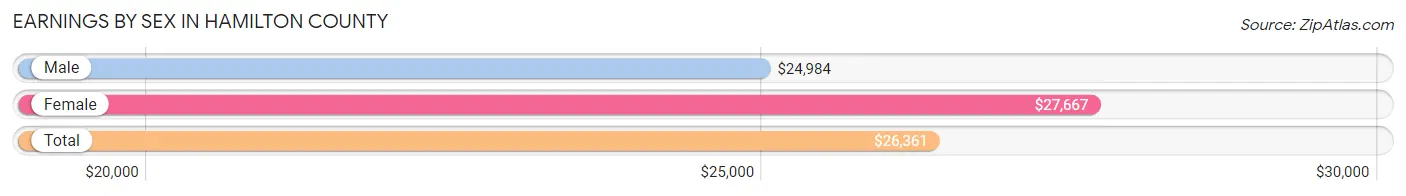
Earnings by Sex in Hamilton County
Average Earnings in Hamilton County are $26,361, $24,984 for men and $27,667 for women, a difference of 9.7%.
| Sex | Number | Average Earnings |
| Male | 2,304 (51.2%) | $24,984 |
| Female | 2,194 (48.8%) | $27,667 |
| Total | 4,498 (100.0%) | $26,361 |
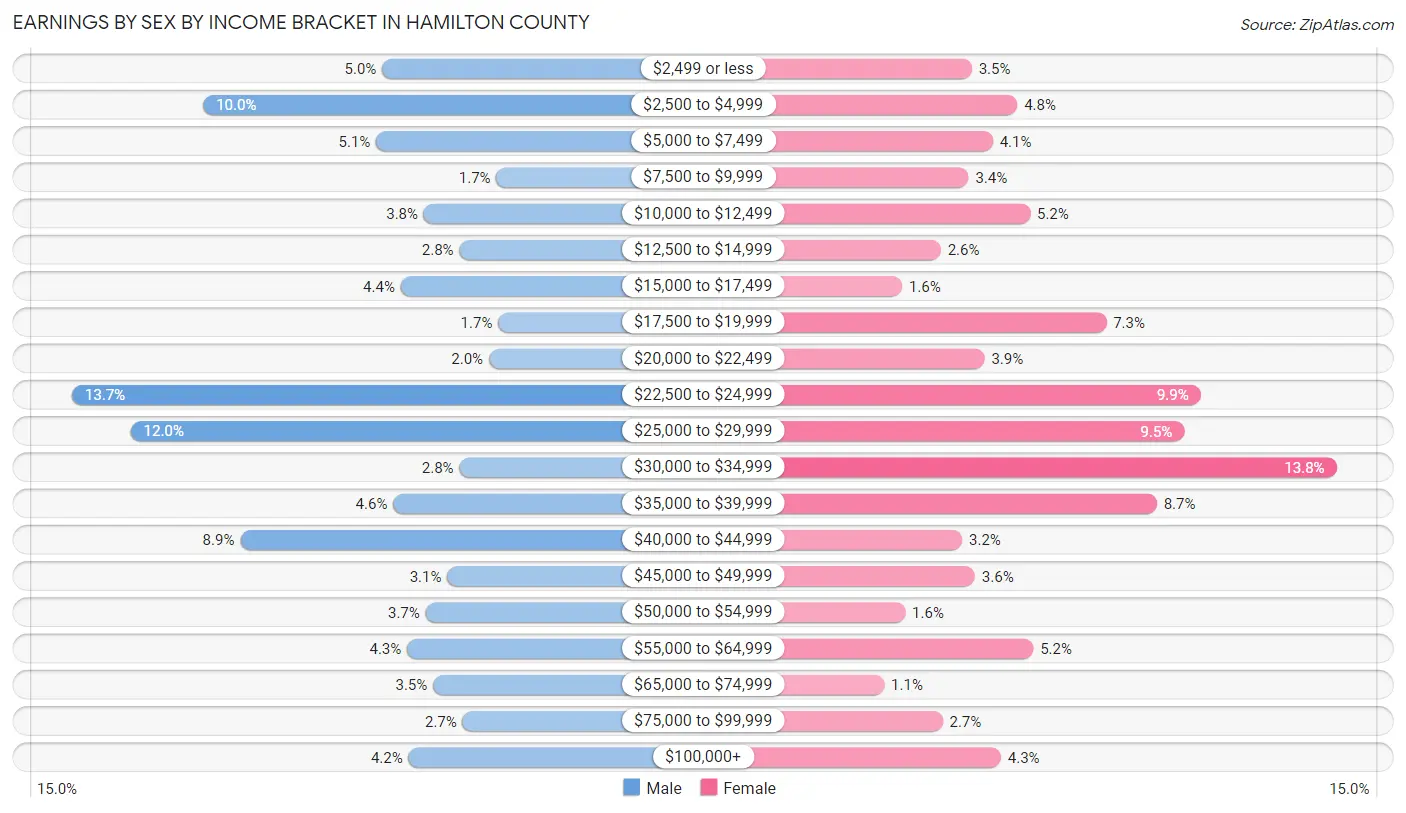
Earnings by Sex by Income Bracket in Hamilton County
The most common earnings brackets in Hamilton County are $22,500 to $24,999 for men (315 | 13.7%) and $30,000 to $34,999 for women (302 | 13.8%).
| Income | Male | Female |
| $2,499 or less | 114 (5.0%) | 77 (3.5%) |
| $2,500 to $4,999 | 230 (10.0%) | 105 (4.8%) |
| $5,000 to $7,499 | 118 (5.1%) | 90 (4.1%) |
| $7,500 to $9,999 | 40 (1.7%) | 75 (3.4%) |
| $10,000 to $12,499 | 87 (3.8%) | 113 (5.1%) |
| $12,500 to $14,999 | 64 (2.8%) | 58 (2.6%) |
| $15,000 to $17,499 | 102 (4.4%) | 34 (1.5%) |
| $17,500 to $19,999 | 39 (1.7%) | 160 (7.3%) |
| $20,000 to $22,499 | 45 (1.9%) | 85 (3.9%) |
| $22,500 to $24,999 | 315 (13.7%) | 218 (9.9%) |
| $25,000 to $29,999 | 277 (12.0%) | 208 (9.5%) |
| $30,000 to $34,999 | 64 (2.8%) | 302 (13.8%) |
| $35,000 to $39,999 | 107 (4.6%) | 191 (8.7%) |
| $40,000 to $44,999 | 206 (8.9%) | 71 (3.2%) |
| $45,000 to $49,999 | 72 (3.1%) | 79 (3.6%) |
| $50,000 to $54,999 | 86 (3.7%) | 36 (1.6%) |
| $55,000 to $64,999 | 98 (4.3%) | 115 (5.2%) |
| $65,000 to $74,999 | 81 (3.5%) | 23 (1.1%) |
| $75,000 to $99,999 | 62 (2.7%) | 59 (2.7%) |
| $100,000+ | 97 (4.2%) | 95 (4.3%) |
| Total | 2,304 (100.0%) | 2,194 (100.0%) |
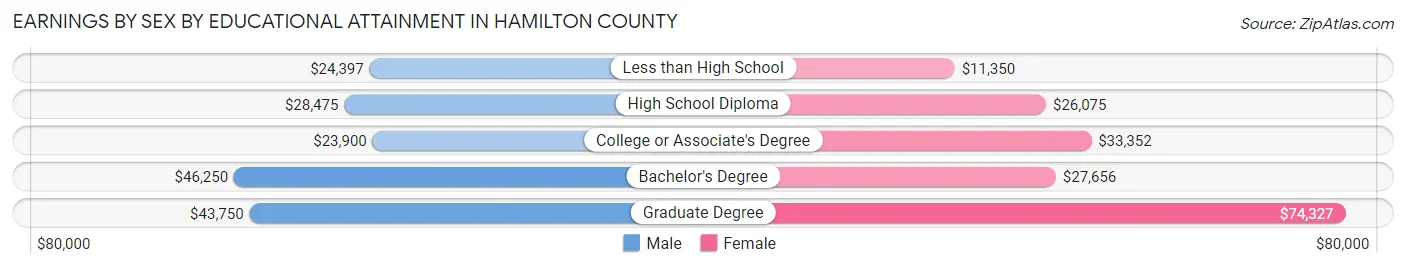
Earnings by Sex by Educational Attainment in Hamilton County
Average earnings in Hamilton County are $27,602 for men and $28,525 for women, a difference of 3.2%. Men with an educational attainment of bachelor's degree enjoy the highest average annual earnings of $46,250, while those with college or associate's degree education earn the least with $23,900. Women with an educational attainment of graduate degree earn the most with the average annual earnings of $74,327, while those with less than high school education have the smallest earnings of $11,350.
| Educational Attainment | Male Income | Female Income |
| Less than High School | $24,397 | $11,350 |
| High School Diploma | $28,475 | $26,075 |
| College or Associate's Degree | $23,900 | $33,352 |
| Bachelor's Degree | $46,250 | $27,656 |
| Graduate Degree | $43,750 | $74,327 |
| Total | $27,602 | $28,525 |
Family Income in Hamilton County
Family Income Brackets in Hamilton County
According to the Hamilton County family income data, there are 852 families falling into the $50,000 to $74,999 income range, which is the most common income bracket and makes up 27.6% of all families. Conversely, the $200,000+ income bracket is the least frequent group with only 71 families (2.3%) belonging to this category.
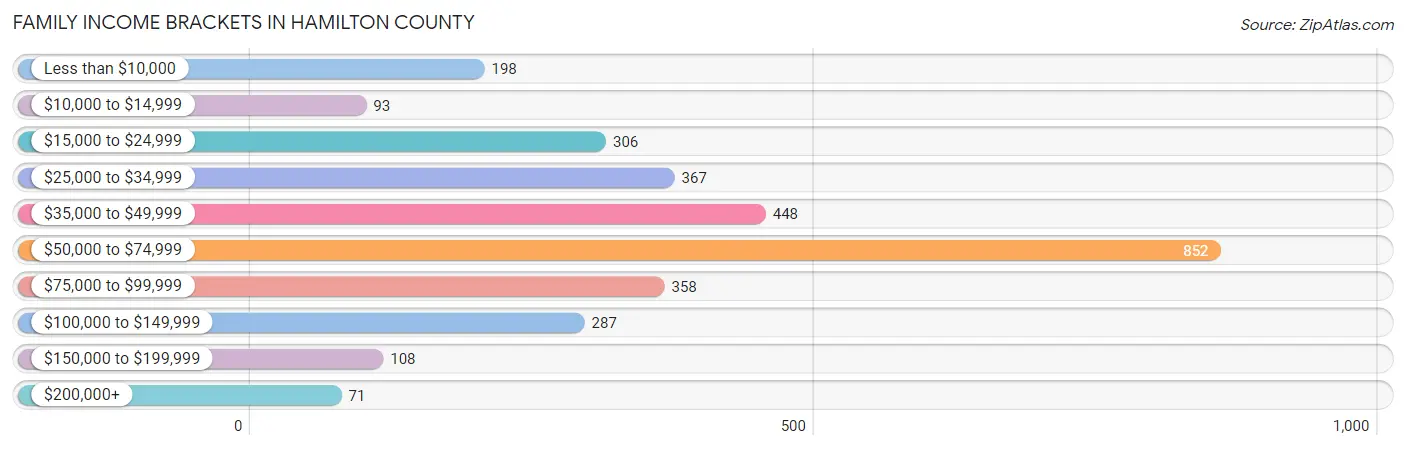
| Income Bracket | # Families | % Families |
| Less than $10,000 | 198 | 6.4% |
| $10,000 to $14,999 | 93 | 3.0% |
| $15,000 to $24,999 | 306 | 9.9% |
| $25,000 to $34,999 | 367 | 11.9% |
| $35,000 to $49,999 | 448 | 14.5% |
| $50,000 to $74,999 | 852 | 27.6% |
| $75,000 to $99,999 | 358 | 11.6% |
| $100,000 to $149,999 | 287 | 9.3% |
| $150,000 to $199,999 | 108 | 3.5% |
| $200,000+ | 71 | 2.3% |
Family Income by Famaliy Size in Hamilton County
5-person families (182 | 5.9%) account for the highest median family income in Hamilton County with $78,221 per family, while 2-person families (1,729 | 56.0%) have the highest median income of $25,452 per family member.
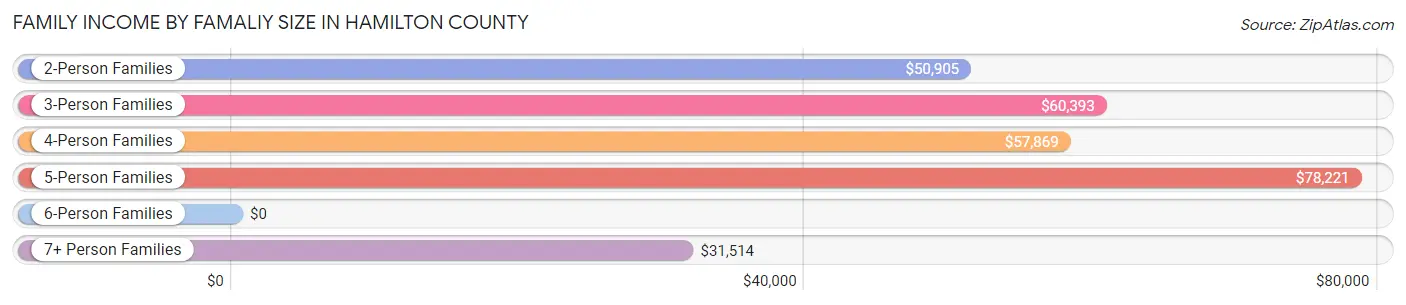
| Income Bracket | # Families | Median Income |
| 2-Person Families | 1,729 (56.0%) | $50,905 |
| 3-Person Families | 664 (21.5%) | $60,393 |
| 4-Person Families | 373 (12.1%) | $57,869 |
| 5-Person Families | 182 (5.9%) | $78,221 |
| 6-Person Families | 71 (2.3%) | $0 |
| 7+ Person Families | 69 (2.2%) | $31,514 |
| Total | 3,088 (100.0%) | $52,202 |
Family Income by Number of Earners in Hamilton County
The median family income in Hamilton County is $52,202, with families comprising 3+ earners (146) having the highest median family income of $103,077, while families with no earners (667) have the lowest median family income of $37,014, accounting for 4.7% and 21.6% of families, respectively.
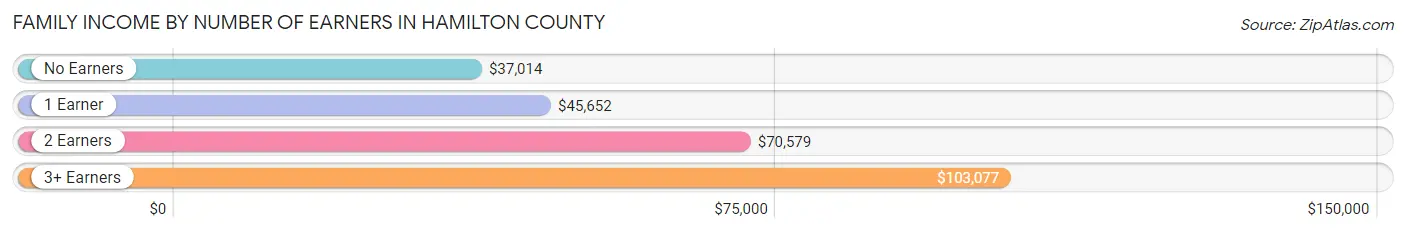
| Number of Earners | # Families | Median Income |
| No Earners | 667 (21.6%) | $37,014 |
| 1 Earner | 1,470 (47.6%) | $45,652 |
| 2 Earners | 805 (26.1%) | $70,579 |
| 3+ Earners | 146 (4.7%) | $103,077 |
| Total | 3,088 (100.0%) | $52,202 |
Household Income in Hamilton County
Household Income Brackets in Hamilton County
With 1,096 households falling in the category, the $50,000 to $74,999 income range is the most frequent in Hamilton County, accounting for 25.5% of all households. In contrast, only 73 households (1.7%) fall into the $200,000+ income bracket, making it the least populous group.
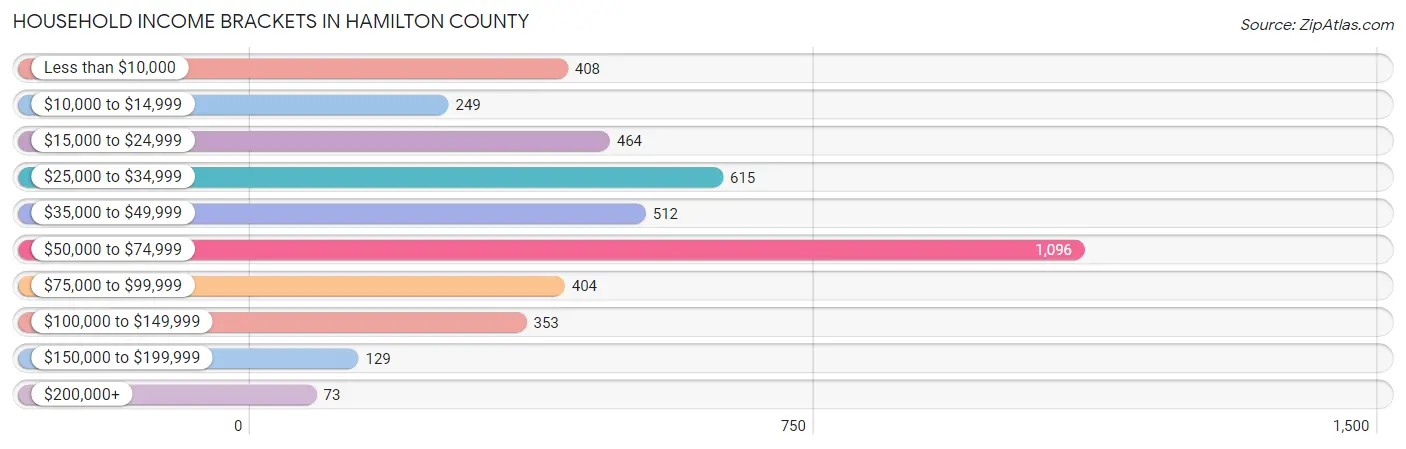
| Income Bracket | # Households | % Households |
| Less than $10,000 | 408 | 9.5% |
| $10,000 to $14,999 | 249 | 5.8% |
| $15,000 to $24,999 | 464 | 10.8% |
| $25,000 to $34,999 | 615 | 14.3% |
| $35,000 to $49,999 | 512 | 11.9% |
| $50,000 to $74,999 | 1,096 | 25.5% |
| $75,000 to $99,999 | 404 | 9.4% |
| $100,000 to $149,999 | 353 | 8.2% |
| $150,000 to $199,999 | 129 | 3.0% |
| $200,000+ | 73 | 1.7% |
Household Income by Householder Age in Hamilton County
The median household income in Hamilton County is $47,668, with the highest median household income of $50,987 found in the 45 to 64 years age bracket for the primary householder. A total of 1,616 households (37.6%) fall into this category. Meanwhile, the 15 to 24 years age bracket for the primary householder has the lowest median household income of $0, with 90 households (2.1%) in this group.
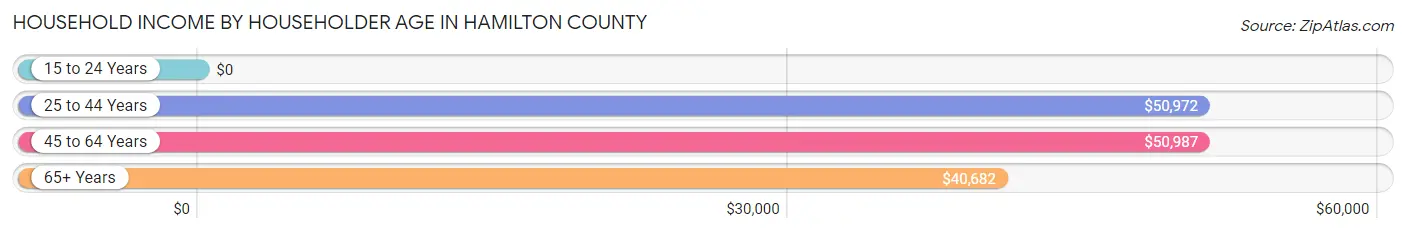
| Income Bracket | # Households | Median Income |
| 15 to 24 Years | 90 (2.1%) | $0 |
| 25 to 44 Years | 968 (22.5%) | $50,972 |
| 45 to 64 Years | 1,616 (37.6%) | $50,987 |
| 65+ Years | 1,626 (37.8%) | $40,682 |
| Total | 4,300 (100.0%) | $47,668 |
Poverty in Hamilton County
Income Below Poverty by Sex and Age in Hamilton County
With 23.1% poverty level for males and 29.3% for females among the residents of Hamilton County, 16 and 17 year old males and 5 year old females are the most vulnerable to poverty, with 53 males (55.8%) and 17 females (100.0%) in their respective age groups living below the poverty level.
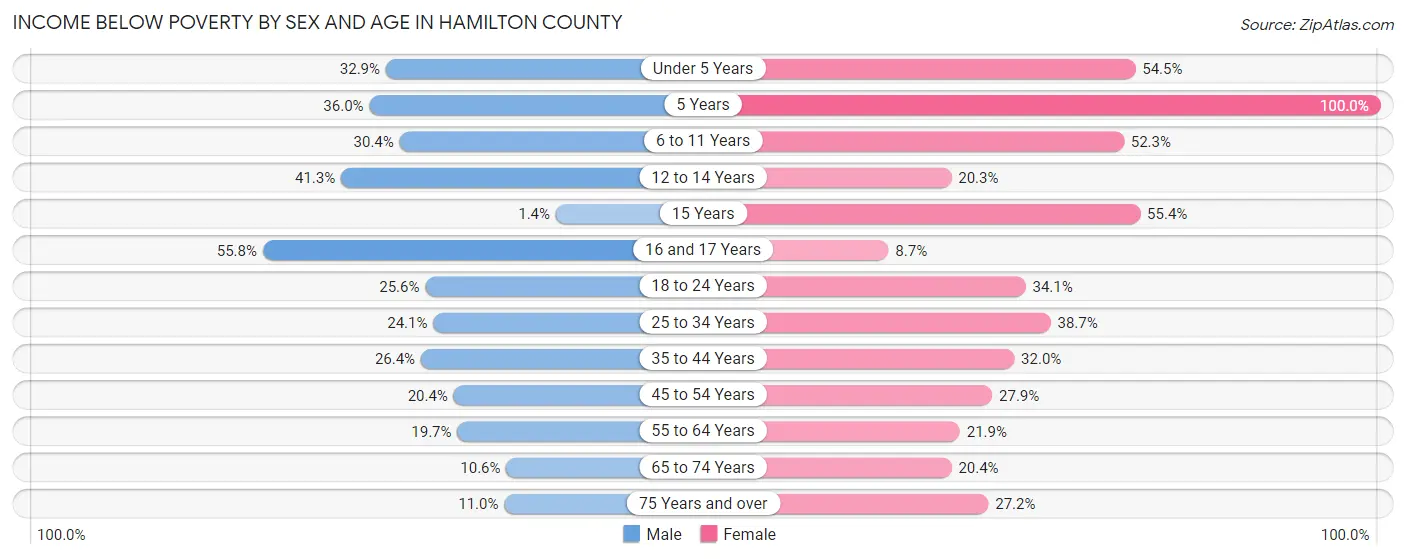
| Age Bracket | Male | Female |
| Under 5 Years | 140 (32.9%) | 67 (54.5%) |
| 5 Years | 18 (36.0%) | 17 (100.0%) |
| 6 to 11 Years | 162 (30.4%) | 179 (52.3%) |
| 12 to 14 Years | 92 (41.3%) | 77 (20.3%) |
| 15 Years | 1 (1.4%) | 36 (55.4%) |
| 16 and 17 Years | 53 (55.8%) | 18 (8.6%) |
| 18 to 24 Years | 91 (25.6%) | 73 (34.1%) |
| 25 to 34 Years | 119 (24.1%) | 289 (38.7%) |
| 35 to 44 Years | 129 (26.4%) | 206 (32.0%) |
| 45 to 54 Years | 92 (20.3%) | 202 (27.9%) |
| 55 to 64 Years | 145 (19.7%) | 195 (21.9%) |
| 65 to 74 Years | 75 (10.6%) | 162 (20.3%) |
| 75 Years and over | 41 (11.0%) | 143 (27.2%) |
| Total | 1,158 (23.1%) | 1,664 (29.3%) |
Income Above Poverty by Sex and Age in Hamilton County
According to the poverty statistics in Hamilton County, males aged 15 years and females aged 16 and 17 years are the age groups that are most secure financially, with 98.6% of males and 91.3% of females in these age groups living above the poverty line.
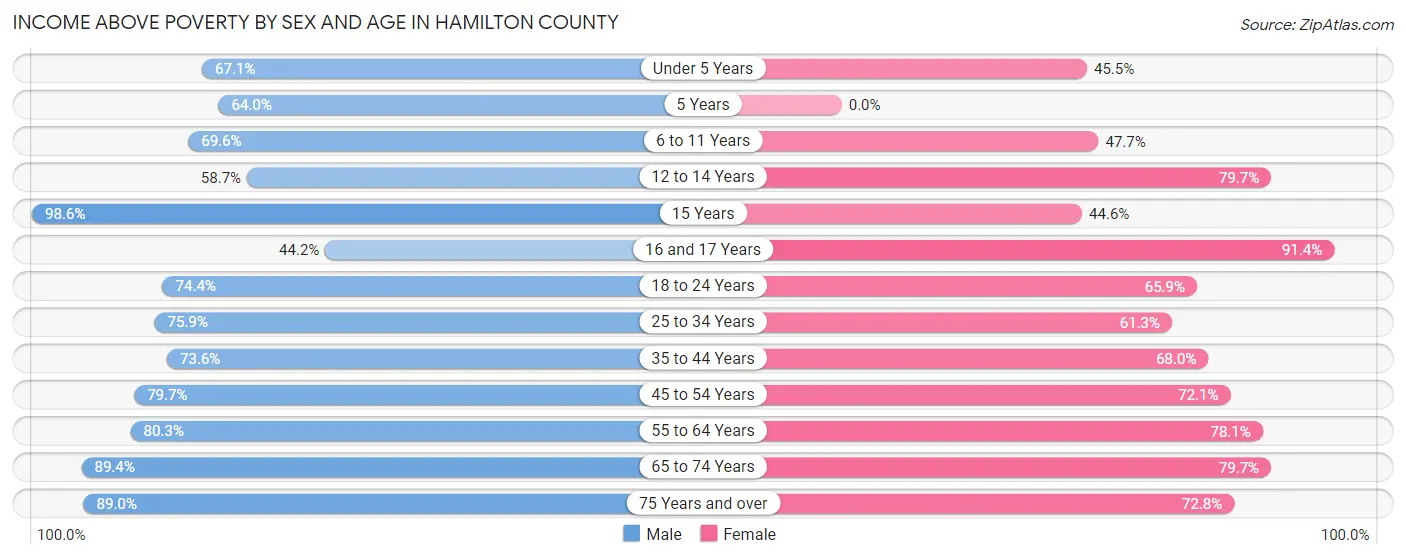
| Age Bracket | Male | Female |
| Under 5 Years | 285 (67.1%) | 56 (45.5%) |
| 5 Years | 32 (64.0%) | 0 (0.0%) |
| 6 to 11 Years | 371 (69.6%) | 163 (47.7%) |
| 12 to 14 Years | 131 (58.7%) | 302 (79.7%) |
| 15 Years | 71 (98.6%) | 29 (44.6%) |
| 16 and 17 Years | 42 (44.2%) | 190 (91.3%) |
| 18 to 24 Years | 264 (74.4%) | 141 (65.9%) |
| 25 to 34 Years | 374 (75.9%) | 457 (61.3%) |
| 35 to 44 Years | 359 (73.6%) | 438 (68.0%) |
| 45 to 54 Years | 360 (79.6%) | 522 (72.1%) |
| 55 to 64 Years | 592 (80.3%) | 695 (78.1%) |
| 65 to 74 Years | 634 (89.4%) | 634 (79.6%) |
| 75 Years and over | 333 (89.0%) | 383 (72.8%) |
| Total | 3,848 (76.9%) | 4,010 (70.7%) |
Income Below Poverty Among Married-Couple Families in Hamilton County
The poverty statistics for married-couple families in Hamilton County show that 13.8% or 280 of the total 2,035 families live below the poverty line. Families with 5 or more children have the highest poverty rate of 90.2%, comprising of 55 families. On the other hand, families with no children have the lowest poverty rate of 7.1%, which includes 96 families.
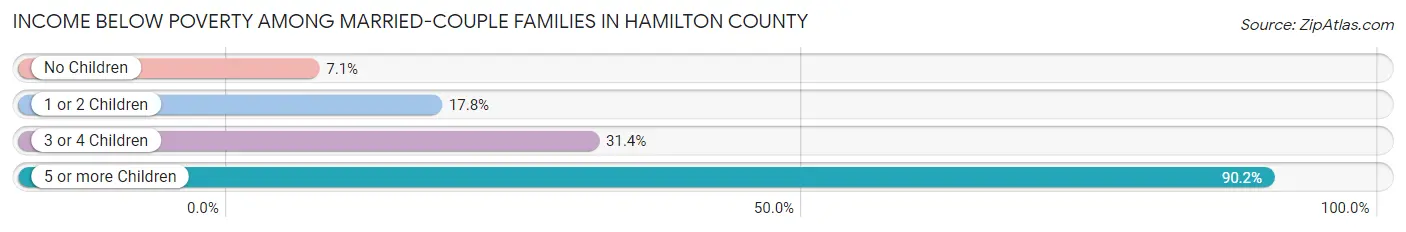
| Children | Above Poverty | Below Poverty |
| No Children | 1,259 (92.9%) | 96 (7.1%) |
| 1 or 2 Children | 394 (82.3%) | 85 (17.7%) |
| 3 or 4 Children | 96 (68.6%) | 44 (31.4%) |
| 5 or more Children | 6 (9.8%) | 55 (90.2%) |
| Total | 1,755 (86.2%) | 280 (13.8%) |
Income Below Poverty Among Single-Parent Households in Hamilton County
According to the poverty data in Hamilton County, 18.6% or 41 single-father households and 26.8% or 223 single-mother households are living below the poverty line. Among single-father households, those with 5 or more children have the highest poverty rate, with 9 households (100.0%) experiencing poverty. Likewise, among single-mother households, those with 5 or more children have the highest poverty rate, with 23 households (82.1%) falling below the poverty line.
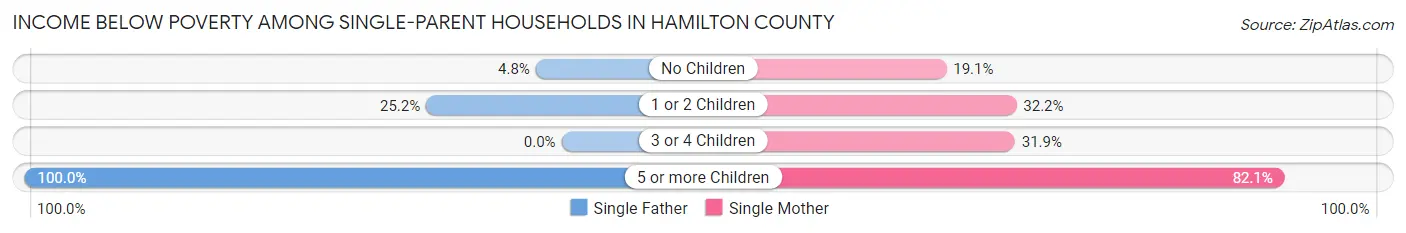
| Children | Single Father | Single Mother |
| No Children | 5 (4.8%) | 86 (19.1%) |
| 1 or 2 Children | 27 (25.2%) | 92 (32.2%) |
| 3 or 4 Children | 0 (0.0%) | 22 (31.9%) |
| 5 or more Children | 9 (100.0%) | 23 (82.1%) |
| Total | 41 (18.6%) | 223 (26.8%) |
Income Below Poverty Among Married-Couple vs Single-Parent Households in Hamilton County
The poverty data for Hamilton County shows that 280 of the married-couple family households (13.8%) and 264 of the single-parent households (25.1%) are living below the poverty level. Within the married-couple family households, those with 5 or more children have the highest poverty rate, with 55 households (90.2%) falling below the poverty line. Among the single-parent households, those with 5 or more children have the highest poverty rate, with 32 household (86.5%) living below poverty.
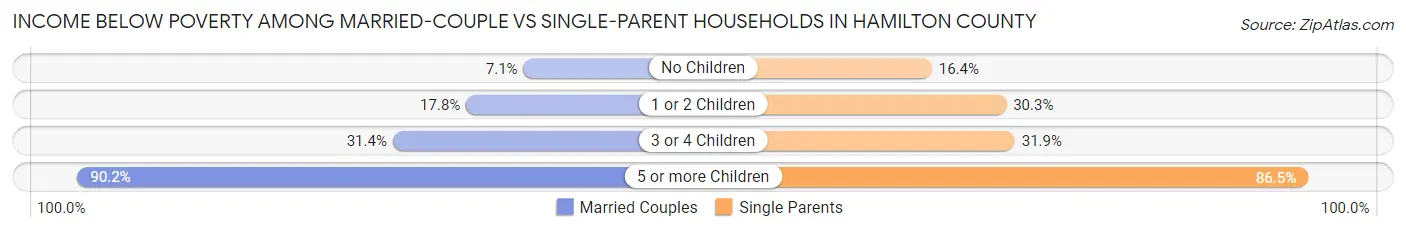
| Children | Married-Couple Families | Single-Parent Households |
| No Children | 96 (7.1%) | 91 (16.4%) |
| 1 or 2 Children | 85 (17.7%) | 119 (30.3%) |
| 3 or 4 Children | 44 (31.4%) | 22 (31.9%) |
| 5 or more Children | 55 (90.2%) | 32 (86.5%) |
| Total | 280 (13.8%) | 264 (25.1%) |
Race in Hamilton County
The most populous races in Hamilton County are White / Caucasian (7,985 | 59.2%), Black / African American (4,403 | 32.6%), and Hispanic or Latino (1,445 | 10.7%).
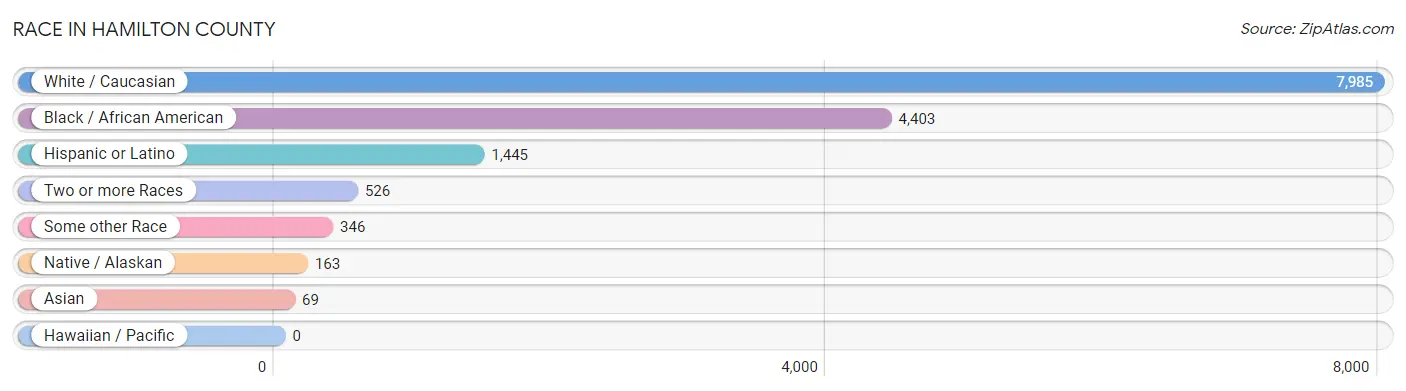
| Race | # Population | % Population |
| Asian | 69 | 0.5% |
| Black / African American | 4,403 | 32.6% |
| Hawaiian / Pacific | 0 | 0.0% |
| Hispanic or Latino | 1,445 | 10.7% |
| Native / Alaskan | 163 | 1.2% |
| White / Caucasian | 7,985 | 59.2% |
| Two or more Races | 526 | 3.9% |
| Some other Race | 346 | 2.6% |
| Total | 13,492 | 100.0% |
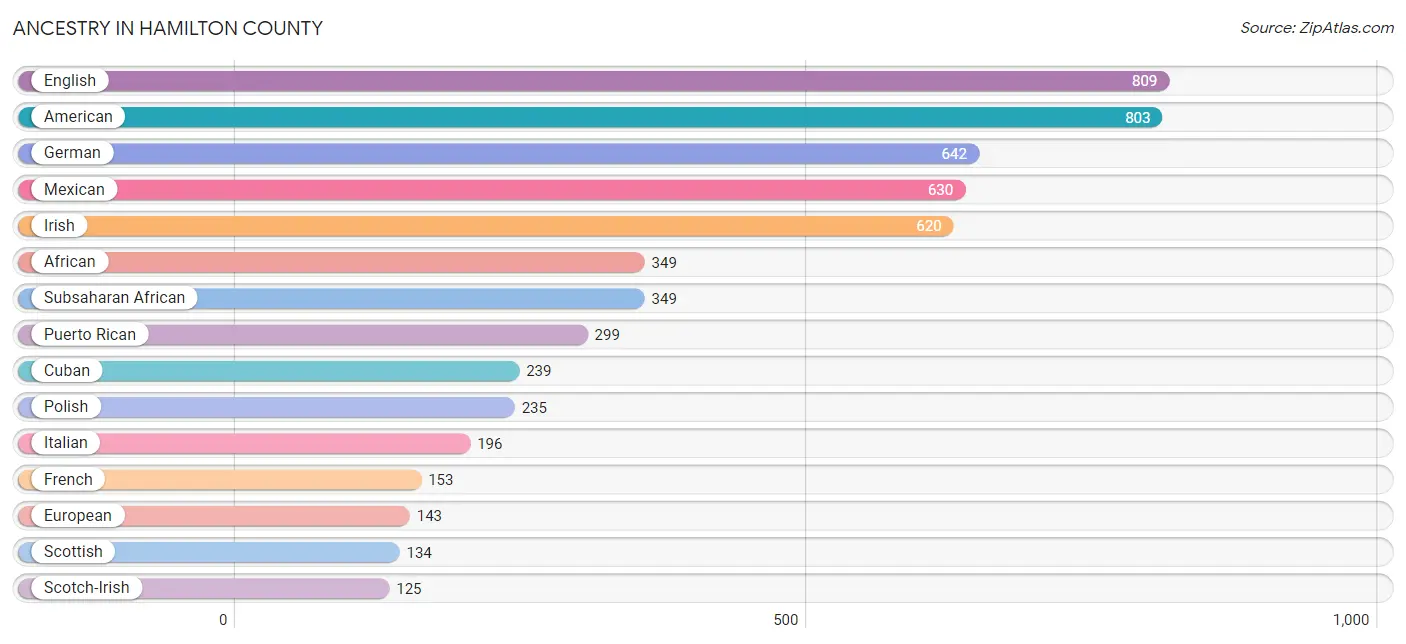
Ancestry in Hamilton County
The most populous ancestries reported in Hamilton County are English (809 | 6.0%), American (803 | 5.9%), German (642 | 4.8%), Mexican (630 | 4.7%), and Irish (620 | 4.6%), together accounting for 26.0% of all Hamilton County residents.
| Ancestry | # Population | % Population |
| African | 349 | 2.6% |
| Alaska Native | 12 | 0.1% |
| Albanian | 2 | 0.0% |
| American | 803 | 5.9% |
| Arab | 3 | 0.0% |
| Bahamian | 1 | 0.0% |
| Barbadian | 11 | 0.1% |
| Bhutanese | 6 | 0.0% |
| Blackfeet | 3 | 0.0% |
| British | 15 | 0.1% |
| Burmese | 81 | 0.6% |
| Canadian | 1 | 0.0% |
| Central American | 75 | 0.6% |
| Cherokee | 51 | 0.4% |
| Chippewa | 34 | 0.3% |
| Colombian | 31 | 0.2% |
| Croatian | 4 | 0.0% |
| Cuban | 239 | 1.8% |
| Czech | 19 | 0.1% |
| Danish | 41 | 0.3% |
| Dominican | 7 | 0.1% |
| Dutch | 36 | 0.3% |
| Dutch West Indian | 10 | 0.1% |
| Ecuadorian | 49 | 0.4% |
| English | 809 | 6.0% |
| European | 143 | 1.1% |
| French | 153 | 1.1% |
| French Canadian | 22 | 0.2% |
| German | 642 | 4.8% |
| Greek | 12 | 0.1% |
| Guatemalan | 67 | 0.5% |
| Guyanese | 12 | 0.1% |
| Haitian | 58 | 0.4% |
| Hungarian | 49 | 0.4% |
| Irish | 620 | 4.6% |
| Iroquois | 5 | 0.0% |
| Israeli | 6 | 0.0% |
| Italian | 196 | 1.5% |
| Jamaican | 31 | 0.2% |
| Jordanian | 2 | 0.0% |
| Korean | 48 | 0.4% |
| Lithuanian | 2 | 0.0% |
| Lumbee | 4 | 0.0% |
| Mexican | 630 | 4.7% |
| Navajo | 16 | 0.1% |
| Nicaraguan | 8 | 0.1% |
| Northern European | 5 | 0.0% |
| Pakistani | 11 | 0.1% |
| Palestinian | 1 | 0.0% |
| Peruvian | 9 | 0.1% |
| Polish | 235 | 1.7% |
| Potawatomi | 5 | 0.0% |
| Puerto Rican | 299 | 2.2% |
| Russian | 49 | 0.4% |
| Samoan | 64 | 0.5% |
| Scotch-Irish | 125 | 0.9% |
| Scottish | 134 | 1.0% |
| Slovak | 2 | 0.0% |
| South American | 112 | 0.8% |
| South American Indian | 6 | 0.0% |
| Spaniard | 30 | 0.2% |
| Sri Lankan | 4 | 0.0% |
| Subsaharan African | 349 | 2.6% |
| Swedish | 52 | 0.4% |
| Swiss | 20 | 0.2% |
| Ukrainian | 121 | 0.9% |
| Venezuelan | 23 | 0.2% |
| Welsh | 27 | 0.2% | View All 68 Rows |
Immigrants in Hamilton County
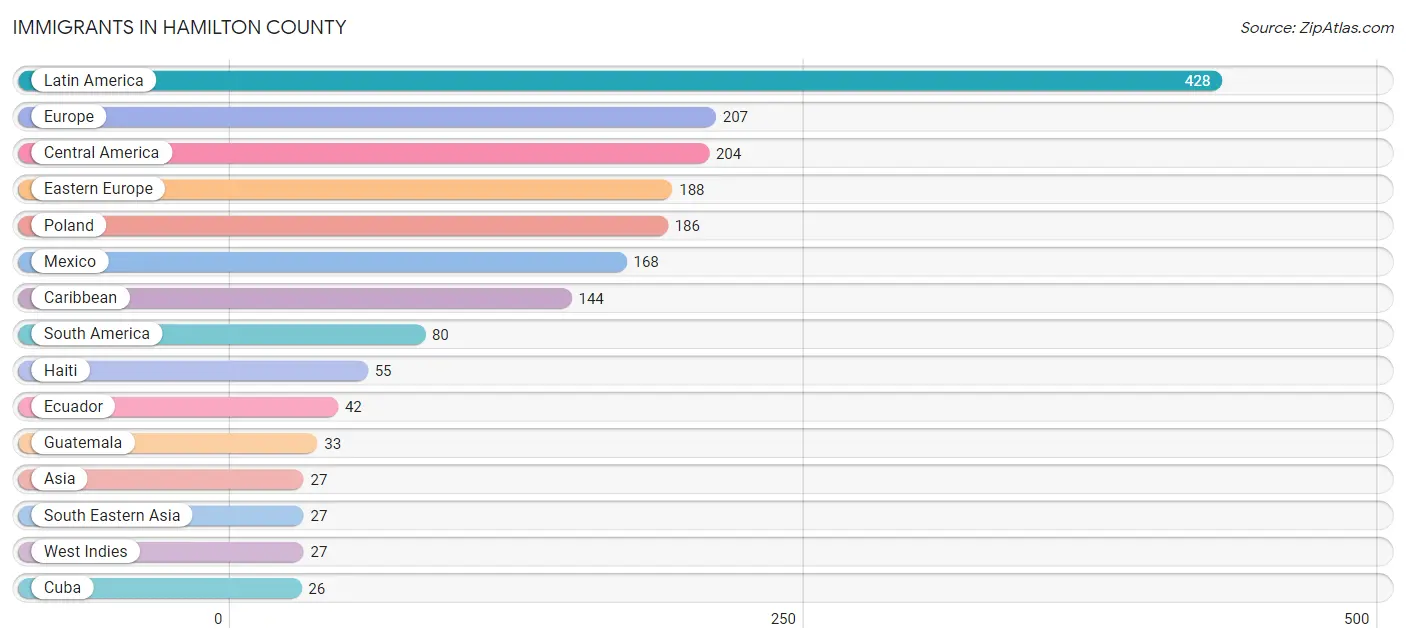
The most numerous immigrant groups reported in Hamilton County came from Latin America (428 | 3.2%), Europe (207 | 1.5%), Central America (204 | 1.5%), Eastern Europe (188 | 1.4%), and Poland (186 | 1.4%), together accounting for 9.0% of all Hamilton County residents.
| Immigration Origin | # Population | % Population |
| Albania | 2 | 0.0% |
| Asia | 27 | 0.2% |
| Canada | 1 | 0.0% |
| Caribbean | 144 | 1.1% |
| Central America | 204 | 1.5% |
| Colombia | 5 | 0.0% |
| Cuba | 26 | 0.2% |
| Dominican Republic | 7 | 0.1% |
| Eastern Europe | 188 | 1.4% |
| Ecuador | 42 | 0.3% |
| England | 2 | 0.0% |
| Europe | 207 | 1.5% |
| Guatemala | 33 | 0.2% |
| Guyana | 12 | 0.1% |
| Haiti | 55 | 0.4% |
| Honduras | 3 | 0.0% |
| Jamaica | 19 | 0.1% |
| Latin America | 428 | 3.2% |
| Mexico | 168 | 1.3% |
| Northern Europe | 14 | 0.1% |
| Oceania | 11 | 0.1% |
| Peru | 9 | 0.1% |
| Philippines | 17 | 0.1% |
| Poland | 186 | 1.4% |
| South America | 80 | 0.6% |
| South Eastern Asia | 27 | 0.2% |
| Southern Europe | 5 | 0.0% |
| Spain | 5 | 0.0% |
| Venezuela | 12 | 0.1% |
| Vietnam | 10 | 0.1% |
| West Indies | 27 | 0.2% | View All 31 Rows |
Sex and Age in Hamilton County
Sex and Age in Hamilton County
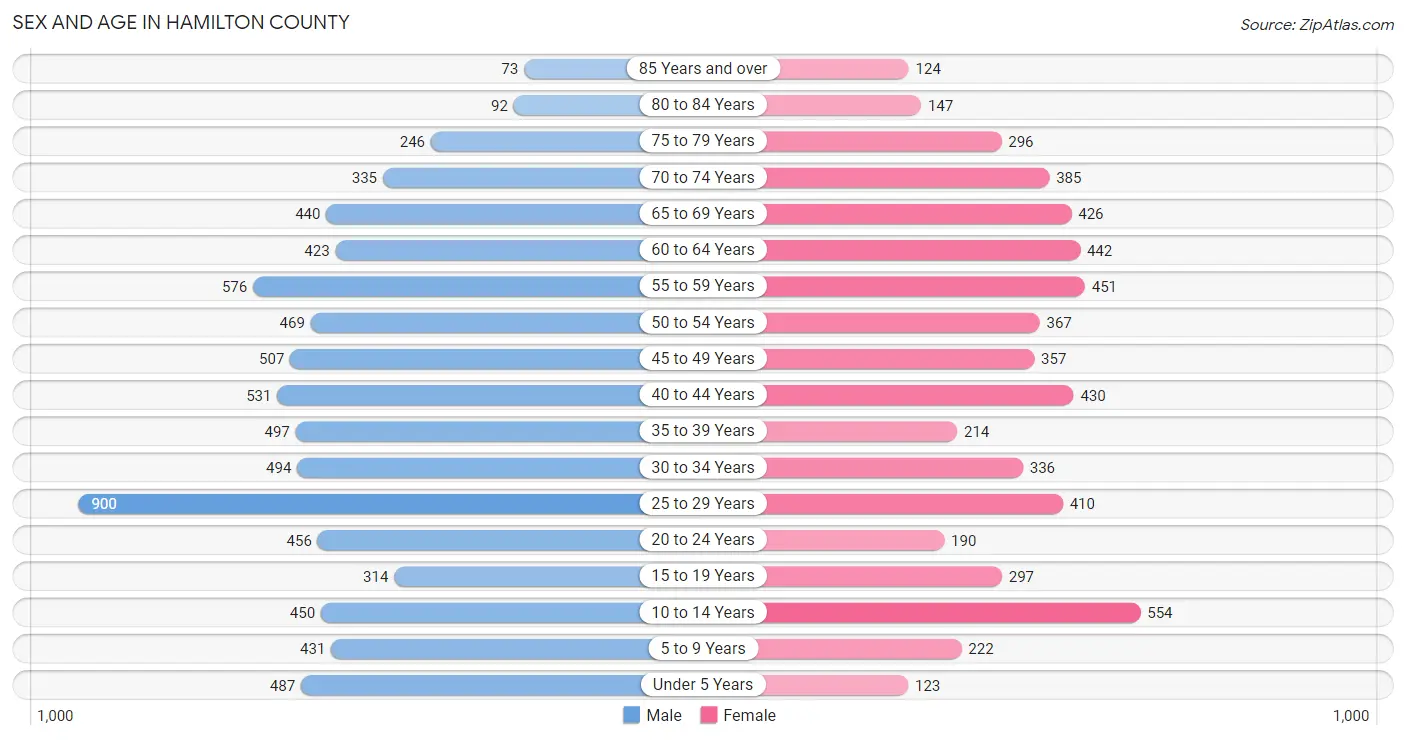
The most populous age groups in Hamilton County are 25 to 29 Years (900 | 11.7%) for men and 10 to 14 Years (554 | 9.6%) for women.
| Age Bracket | Male | Female |
| Under 5 Years | 487 (6.3%) | 123 (2.1%) |
| 5 to 9 Years | 431 (5.6%) | 222 (3.8%) |
| 10 to 14 Years | 450 (5.8%) | 554 (9.6%) |
| 15 to 19 Years | 314 (4.1%) | 297 (5.1%) |
| 20 to 24 Years | 456 (5.9%) | 190 (3.3%) |
| 25 to 29 Years | 900 (11.7%) | 410 (7.1%) |
| 30 to 34 Years | 494 (6.4%) | 336 (5.8%) |
| 35 to 39 Years | 497 (6.4%) | 214 (3.7%) |
| 40 to 44 Years | 531 (6.9%) | 430 (7.4%) |
| 45 to 49 Years | 507 (6.6%) | 357 (6.2%) |
| 50 to 54 Years | 469 (6.1%) | 367 (6.4%) |
| 55 to 59 Years | 576 (7.5%) | 451 (7.8%) |
| 60 to 64 Years | 423 (5.5%) | 442 (7.7%) |
| 65 to 69 Years | 440 (5.7%) | 426 (7.4%) |
| 70 to 74 Years | 335 (4.3%) | 385 (6.7%) |
| 75 to 79 Years | 246 (3.2%) | 296 (5.1%) |
| 80 to 84 Years | 92 (1.2%) | 147 (2.5%) |
| 85 Years and over | 73 (0.9%) | 124 (2.1%) |
| Total | 7,721 (100.0%) | 5,771 (100.0%) |
Families and Households in Hamilton County
Median Family Size in Hamilton County
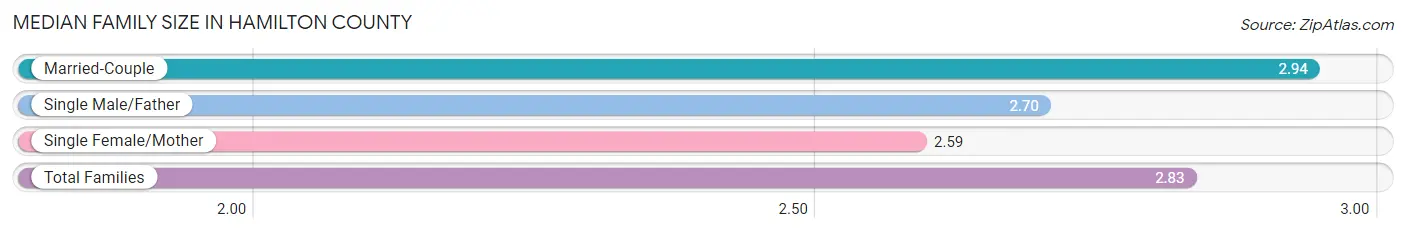
The median family size in Hamilton County is 2.83 persons per family, with married-couple families (2,035 | 65.9%) accounting for the largest median family size of 2.94 persons per family. On the other hand, single female/mother families (833 | 27.0%) represent the smallest median family size with 2.59 persons per family.
| Family Type | # Families | Family Size |
| Married-Couple | 2,035 (65.9%) | 2.94 |
| Single Male/Father | 220 (7.1%) | 2.70 |
| Single Female/Mother | 833 (27.0%) | 2.59 |
| Total Families | 3,088 (100.0%) | 2.83 |
Median Household Size in Hamilton County
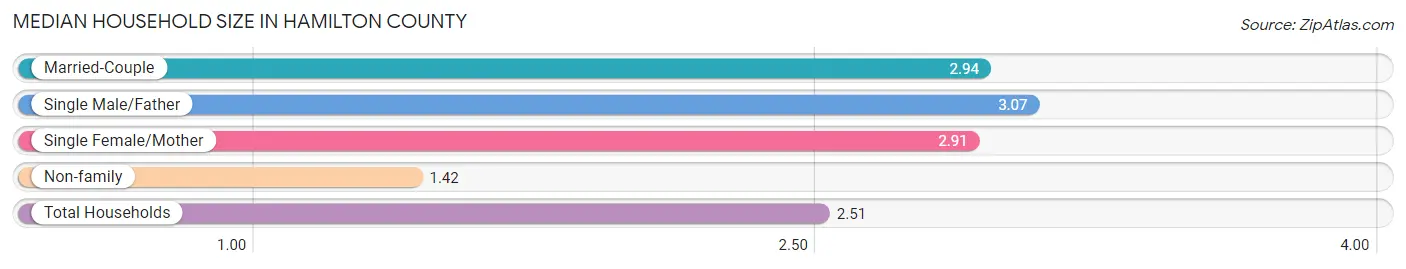
The median household size in Hamilton County is 2.51 persons per household, with single male/father households (220 | 5.1%) accounting for the largest median household size of 3.07 persons per household. non-family households (1,212 | 28.2%) represent the smallest median household size with 1.42 persons per household.
| Household Type | # Households | Household Size |
| Married-Couple | 2,035 (47.3%) | 2.94 |
| Single Male/Father | 220 (5.1%) | 3.07 |
| Single Female/Mother | 833 (19.4%) | 2.91 |
| Non-family | 1,212 (28.2%) | 1.42 |
| Total Households | 4,300 (100.0%) | 2.51 |
Household Size by Marriage Status in Hamilton County
Out of a total of 4,300 households in Hamilton County, 3,088 (71.8%) are family households, while 1,212 (28.2%) are nonfamily households. The most numerous type of family households are 2-person households, comprising 1,560, and the most common type of nonfamily households are 1-person households, comprising 878.
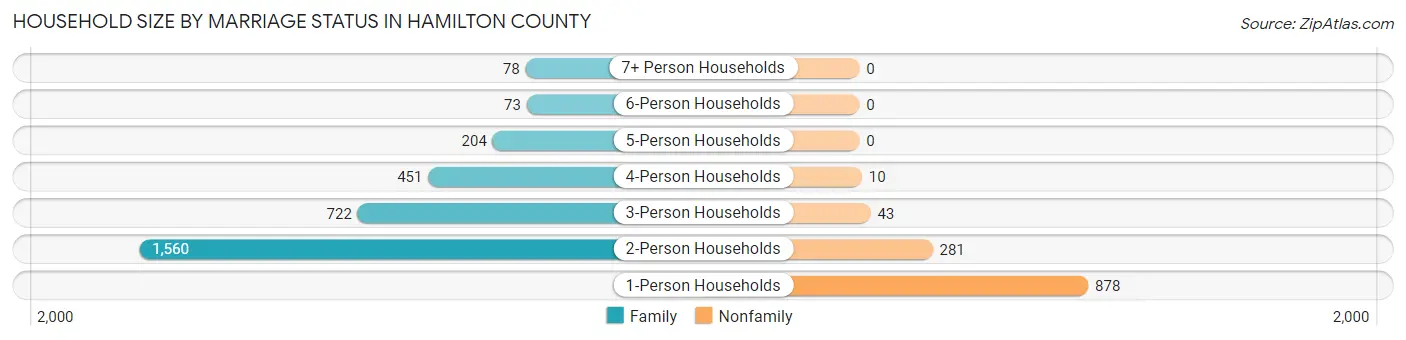
| Household Size | Family Households | Nonfamily Households |
| 1-Person Households | - | 878 (20.4%) |
| 2-Person Households | 1,560 (36.3%) | 281 (6.5%) |
| 3-Person Households | 722 (16.8%) | 43 (1.0%) |
| 4-Person Households | 451 (10.5%) | 10 (0.2%) |
| 5-Person Households | 204 (4.7%) | 0 (0.0%) |
| 6-Person Households | 73 (1.7%) | 0 (0.0%) |
| 7+ Person Households | 78 (1.8%) | 0 (0.0%) |
| Total | 3,088 (71.8%) | 1,212 (28.2%) |
Female Fertility in Hamilton County
Fertility by Age in Hamilton County
Average fertility rate in Hamilton County is 194.0 births per 1,000 women. Women in the age bracket of 20 to 34 years have the highest fertility rate with 307.0 births per 1,000 women. Women in the age bracket of 20 to 34 years acount for 65.1% of all women with births.
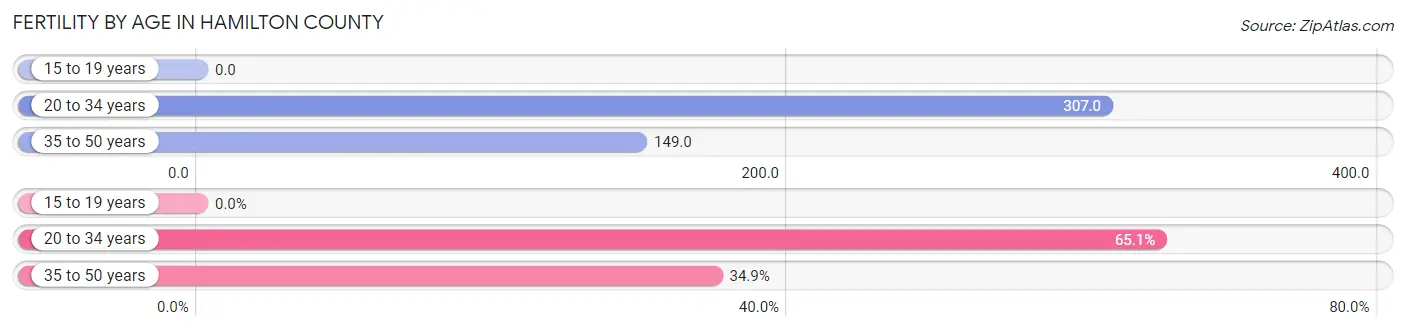
| Age Bracket | Women with Births | Births / 1,000 Women |
| 15 to 19 years | 0 (0.0%) | 0.0 |
| 20 to 34 years | 287 (65.1%) | 307.0 |
| 35 to 50 years | 154 (34.9%) | 149.0 |
| Total | 441 (100.0%) | 194.0 |
Fertility by Age by Marriage Status in Hamilton County
52.6% of women with births (441) in Hamilton County are married. The highest percentage of unmarried women with births falls into 20 to 34 years age bracket with 60.6% of them unmarried at the time of birth, while the lowest percentage of unmarried women with births belong to 35 to 50 years age bracket with 22.7% of them unmarried.
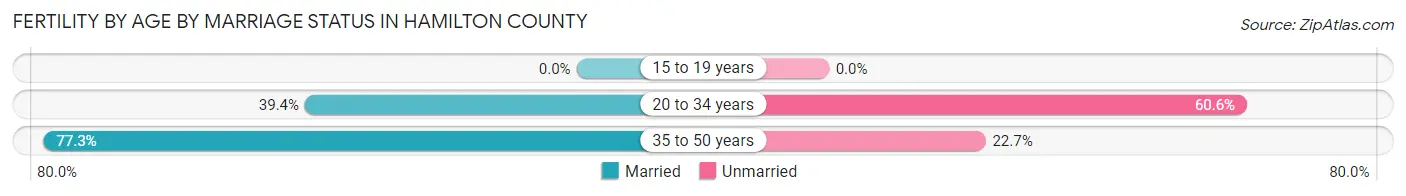
| Age Bracket | Married | Unmarried |
| 15 to 19 years | 0 (0.0%) | 0 (0.0%) |
| 20 to 34 years | 113 (39.4%) | 174 (60.6%) |
| 35 to 50 years | 119 (77.3%) | 35 (22.7%) |
| Total | 232 (52.6%) | 209 (47.4%) |
Fertility by Education in Hamilton County
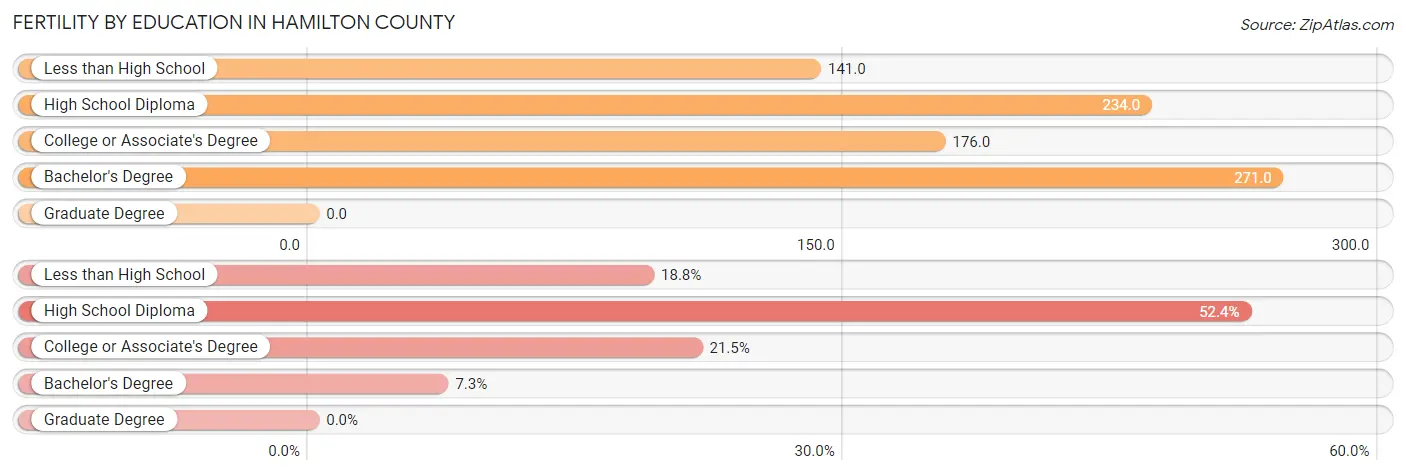
| Educational Attainment | Women with Births | Births / 1,000 Women |
| Less than High School | 83 (18.8%) | 141.0 |
| High School Diploma | 231 (52.4%) | 234.0 |
| College or Associate's Degree | 95 (21.5%) | 176.0 |
| Bachelor's Degree | 32 (7.3%) | 271.0 |
| Graduate Degree | 0 (0.0%) | 0.0 |
| Total | 441 (100.0%) | 194.0 |
Fertility by Education by Marriage Status in Hamilton County
47.4% of women with births in Hamilton County are unmarried. Women with the educational attainment of bachelor's degree are most likely to be married with 100.0% of them married at childbirth, while women with the educational attainment of less than high school are least likely to be married with 71.1% of them unmarried at childbirth.
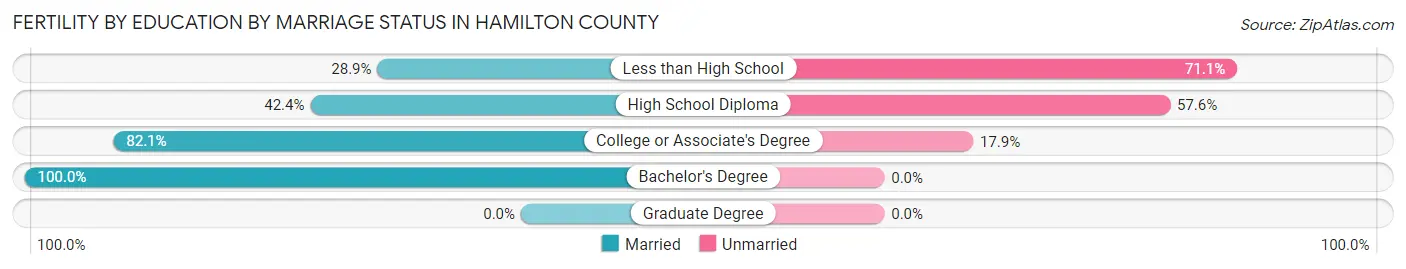
| Educational Attainment | Married | Unmarried |
| Less than High School | 24 (28.9%) | 59 (71.1%) |
| High School Diploma | 98 (42.4%) | 133 (57.6%) |
| College or Associate's Degree | 78 (82.1%) | 17 (17.9%) |
| Bachelor's Degree | 32 (100.0%) | 0 (0.0%) |
| Graduate Degree | 0 (0.0%) | 0 (0.0%) |
| Total | 232 (52.6%) | 209 (47.4%) |
Employment Characteristics in Hamilton County
Employment by Class of Employer in Hamilton County
Among the 3,588 employed individuals in Hamilton County, private company employees (2,115 | 59.0%), local government employees (345 | 9.6%), and not-for-profit organizations (287 | 8.0%) make up the most common classes of employment.
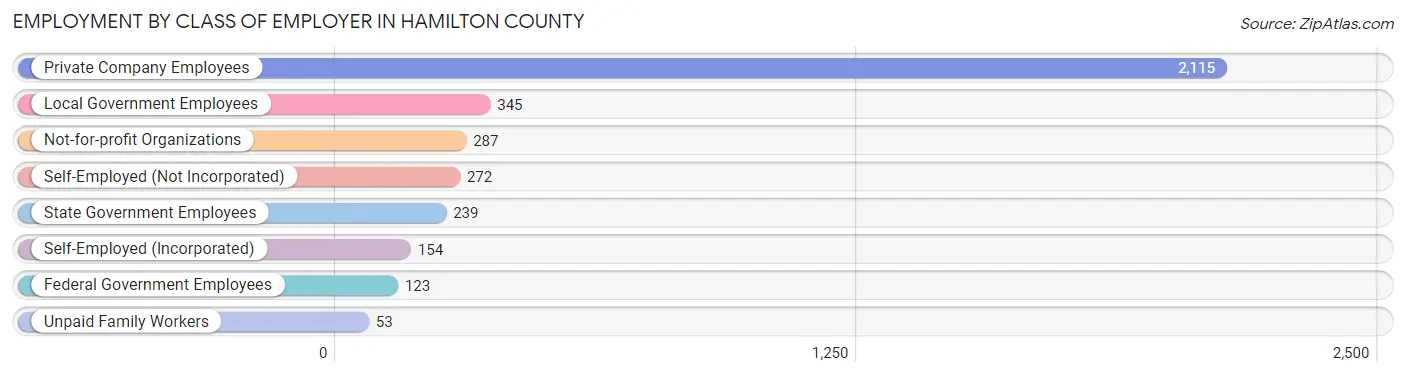
| Employer Class | # Employees | % Employees |
| Private Company Employees | 2,115 | 59.0% |
| Self-Employed (Incorporated) | 154 | 4.3% |
| Self-Employed (Not Incorporated) | 272 | 7.6% |
| Not-for-profit Organizations | 287 | 8.0% |
| Local Government Employees | 345 | 9.6% |
| State Government Employees | 239 | 6.7% |
| Federal Government Employees | 123 | 3.4% |
| Unpaid Family Workers | 53 | 1.5% |
| Total | 3,588 | 100.0% |
Employment Status by Age in Hamilton County
According to the labor force statistics for Hamilton County, out of the total population over 16 years of age (11,088), 36.6% or 4,058 individuals are in the labor force, with 9.2% or 373 of them unemployed. The age group with the highest labor force participation rate is 55 to 59 years, with 61.3% or 630 individuals in the labor force. Within the labor force, the 20 to 24 years age range has the highest percentage of unemployed individuals, with 29.0% or 92 of them being unemployed.
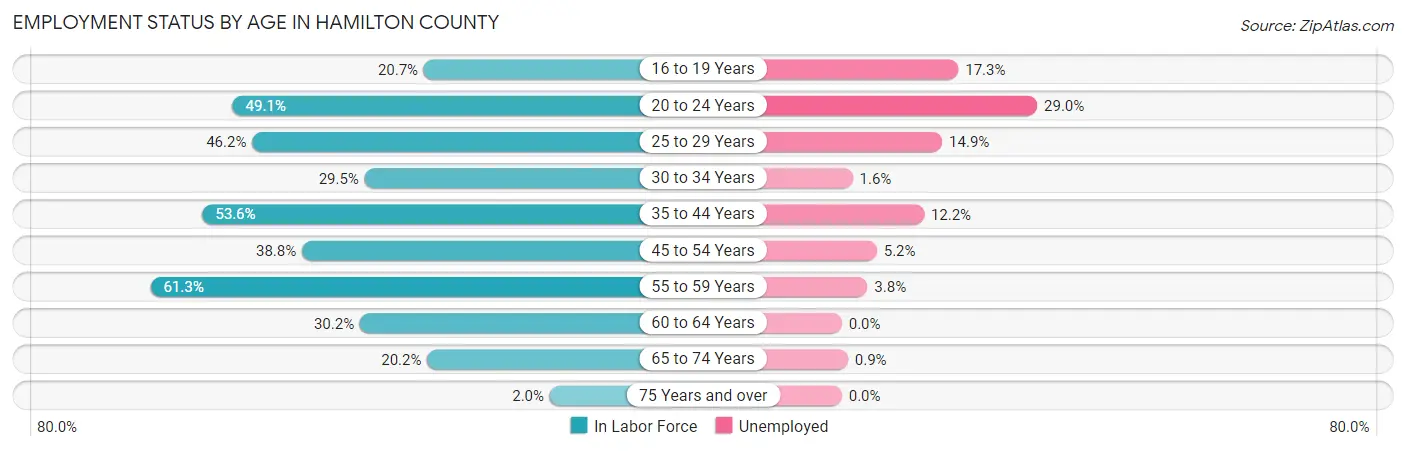
| Age Bracket | In Labor Force | Unemployed |
| 16 to 19 Years | 98 (20.7%) | 17 (17.3%) |
| 20 to 24 Years | 317 (49.1%) | 92 (29.0%) |
| 25 to 29 Years | 605 (46.2%) | 90 (14.9%) |
| 30 to 34 Years | 245 (29.5%) | 4 (1.6%) |
| 35 to 44 Years | 896 (53.6%) | 109 (12.2%) |
| 45 to 54 Years | 660 (38.8%) | 34 (5.2%) |
| 55 to 59 Years | 630 (61.3%) | 24 (3.8%) |
| 60 to 64 Years | 261 (30.2%) | 0 (0.0%) |
| 65 to 74 Years | 320 (20.2%) | 3 (0.9%) |
| 75 Years and over | 20 (2.0%) | 0 (0.0%) |
| Total | 4,058 (36.6%) | 373 (9.2%) |
Employment Status by Educational Attainment in Hamilton County
According to labor force statistics for Hamilton County, 44.5% of individuals (3,295) out of the total population between 25 and 64 years of age (7,404) are in the labor force, with 7.9% or 260 of them being unemployed. The group with the highest labor force participation rate are those with the educational attainment of bachelor's degree or higher, with 68.4% or 432 individuals in the labor force. Within the labor force, individuals with less than high school education have the highest percentage of unemployment, with 23.8% or 93 of them being unemployed.
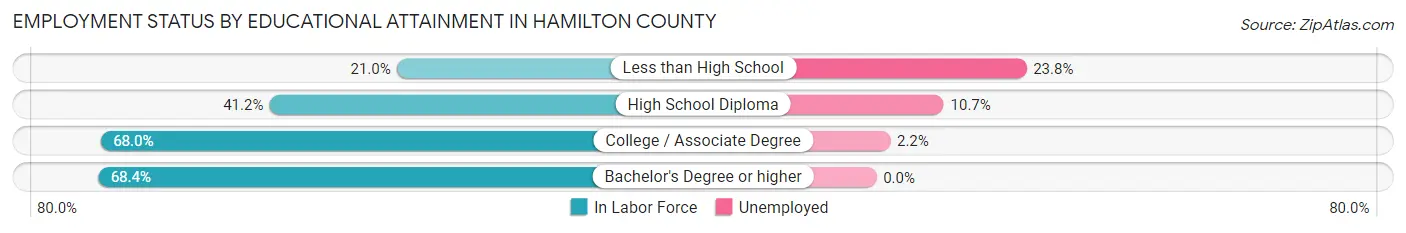
| Educational Attainment | In Labor Force | Unemployed |
| Less than High School | 389 (21.0%) | 441 (23.8%) |
| High School Diploma | 1,338 (41.2%) | 347 (10.7%) |
| College / Associate Degree | 1,137 (68.0%) | 37 (2.2%) |
| Bachelor's Degree or higher | 432 (68.4%) | 0 (0.0%) |
| Total | 3,295 (44.5%) | 585 (7.9%) |
Employment Occupations by Sex in Hamilton County
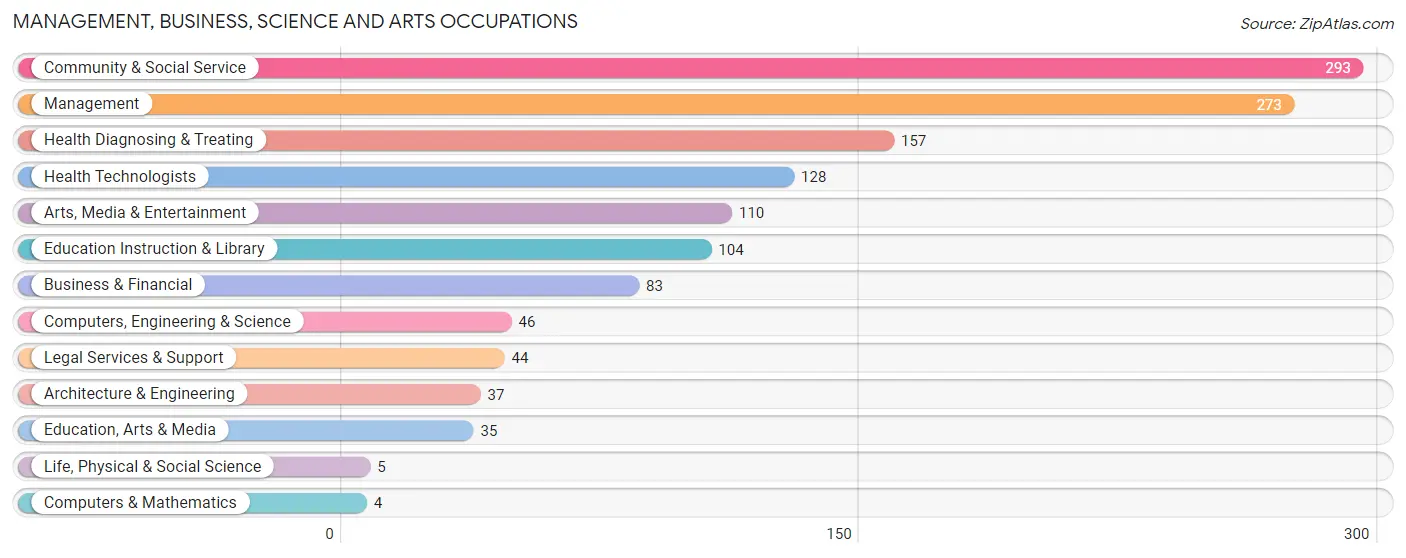
Management, Business, Science and Arts Occupations
The most common Management, Business, Science and Arts occupations in Hamilton County are Community & Social Service (293 | 8.0%), Management (273 | 7.4%), Health Diagnosing & Treating (157 | 4.3%), Health Technologists (128 | 3.5%), and Arts, Media & Entertainment (110 | 3.0%).
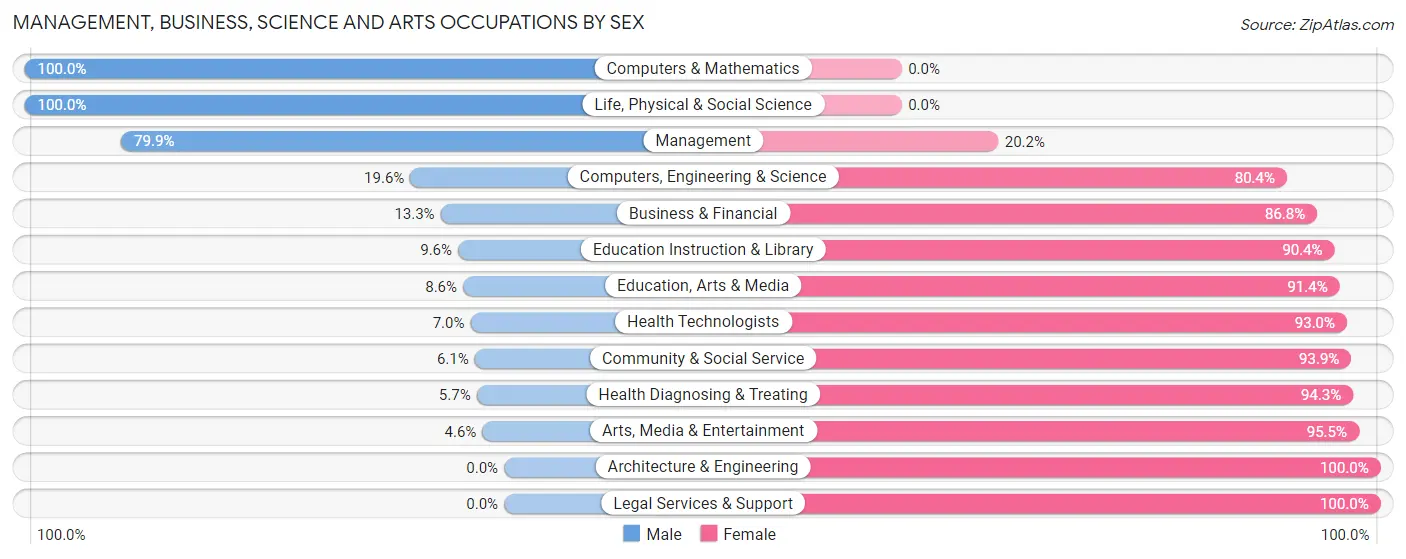
Management, Business, Science and Arts Occupations by Sex
Within the Management, Business, Science and Arts occupations in Hamilton County, the most male-oriented occupations are Computers & Mathematics (100.0%), Life, Physical & Social Science (100.0%), and Management (79.8%), while the most female-oriented occupations are Architecture & Engineering (100.0%), Legal Services & Support (100.0%), and Arts, Media & Entertainment (95.5%).
| Occupation | Male | Female |
| Management | 218 (79.8%) | 55 (20.2%) |
| Business & Financial | 11 (13.3%) | 72 (86.8%) |
| Computers, Engineering & Science | 9 (19.6%) | 37 (80.4%) |
| Computers & Mathematics | 4 (100.0%) | 0 (0.0%) |
| Architecture & Engineering | 0 (0.0%) | 37 (100.0%) |
| Life, Physical & Social Science | 5 (100.0%) | 0 (0.0%) |
| Community & Social Service | 18 (6.1%) | 275 (93.9%) |
| Education, Arts & Media | 3 (8.6%) | 32 (91.4%) |
| Legal Services & Support | 0 (0.0%) | 44 (100.0%) |
| Education Instruction & Library | 10 (9.6%) | 94 (90.4%) |
| Arts, Media & Entertainment | 5 (4.5%) | 105 (95.5%) |
| Health Diagnosing & Treating | 9 (5.7%) | 148 (94.3%) |
| Health Technologists | 9 (7.0%) | 119 (93.0%) |
| Total (Category) | 265 (31.1%) | 587 (68.9%) |
| Total (Overall) | 1,772 (48.1%) | 1,909 (51.9%) |
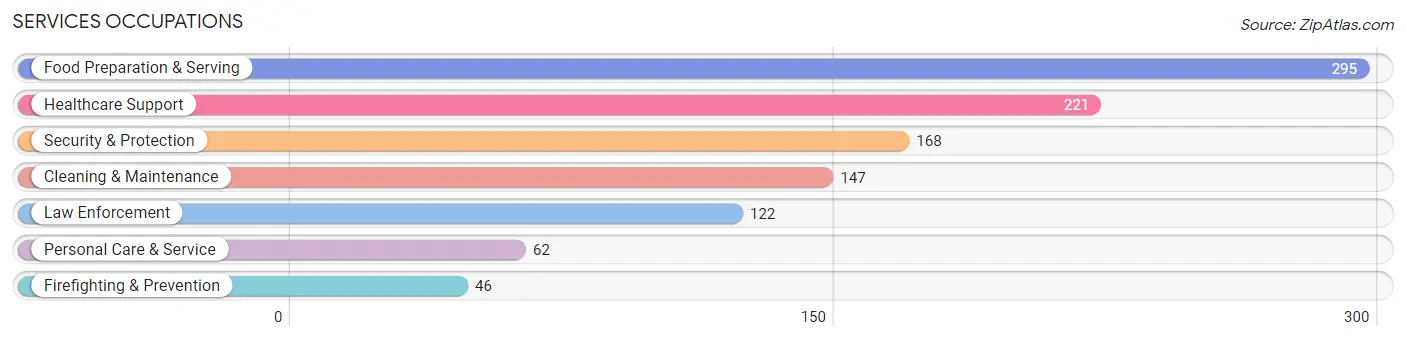
Services Occupations
The most common Services occupations in Hamilton County are Food Preparation & Serving (295 | 8.0%), Healthcare Support (221 | 6.0%), Security & Protection (168 | 4.6%), Cleaning & Maintenance (147 | 4.0%), and Law Enforcement (122 | 3.3%).
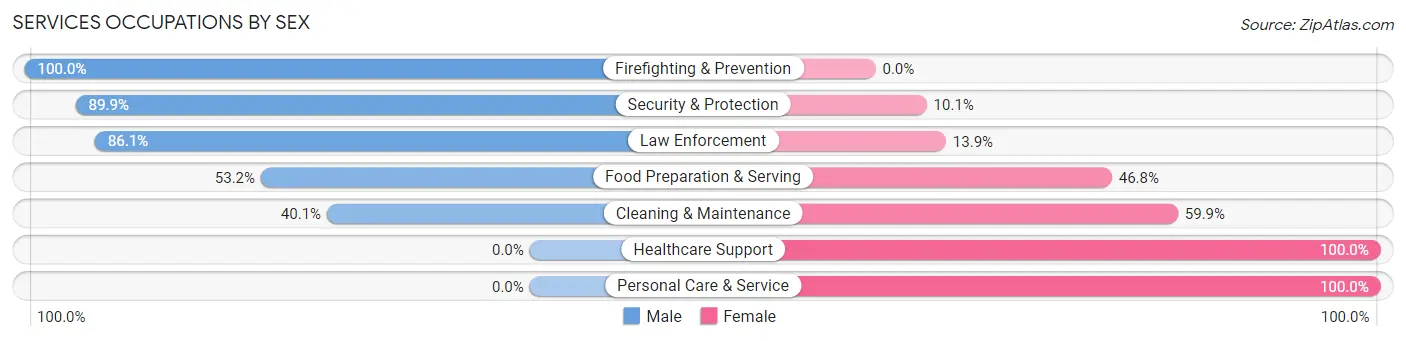
Services Occupations by Sex
Within the Services occupations in Hamilton County, the most male-oriented occupations are Firefighting & Prevention (100.0%), Security & Protection (89.9%), and Law Enforcement (86.1%), while the most female-oriented occupations are Healthcare Support (100.0%), Personal Care & Service (100.0%), and Cleaning & Maintenance (59.9%).
| Occupation | Male | Female |
| Healthcare Support | 0 (0.0%) | 221 (100.0%) |
| Security & Protection | 151 (89.9%) | 17 (10.1%) |
| Firefighting & Prevention | 46 (100.0%) | 0 (0.0%) |
| Law Enforcement | 105 (86.1%) | 17 (13.9%) |
| Food Preparation & Serving | 157 (53.2%) | 138 (46.8%) |
| Cleaning & Maintenance | 59 (40.1%) | 88 (59.9%) |
| Personal Care & Service | 0 (0.0%) | 62 (100.0%) |
| Total (Category) | 367 (41.1%) | 526 (58.9%) |
| Total (Overall) | 1,772 (48.1%) | 1,909 (51.9%) |
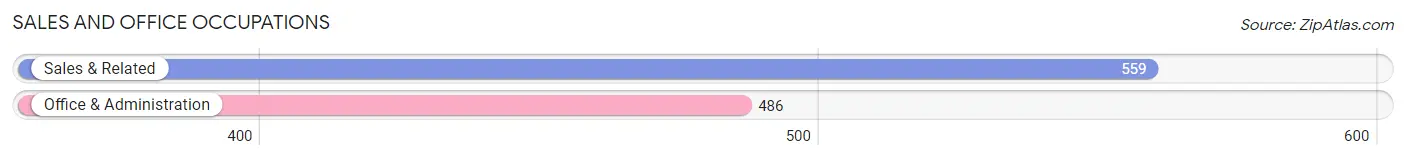
Sales and Office Occupations
The most common Sales and Office occupations in Hamilton County are Sales & Related (559 | 15.2%), and Office & Administration (486 | 13.2%).
Sales and Office Occupations by Sex
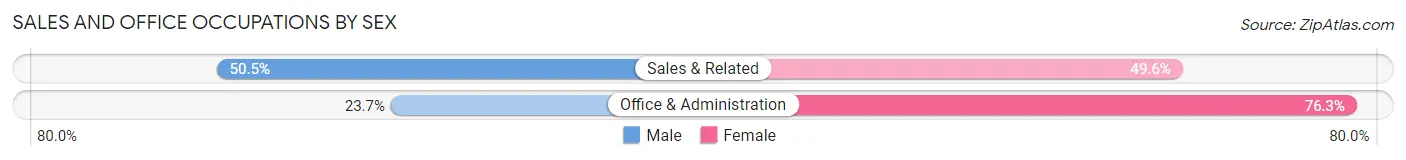
| Occupation | Male | Female |
| Sales & Related | 282 (50.4%) | 277 (49.5%) |
| Office & Administration | 115 (23.7%) | 371 (76.3%) |
| Total (Category) | 397 (38.0%) | 648 (62.0%) |
| Total (Overall) | 1,772 (48.1%) | 1,909 (51.9%) |
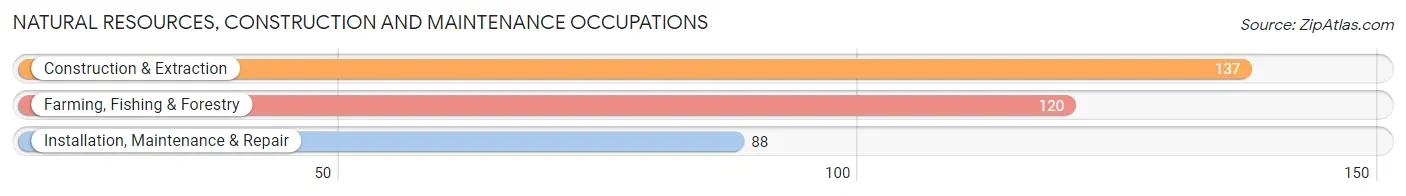
Natural Resources, Construction and Maintenance Occupations
The most common Natural Resources, Construction and Maintenance occupations in Hamilton County are Construction & Extraction (137 | 3.7%), Farming, Fishing & Forestry (120 | 3.3%), and Installation, Maintenance & Repair (88 | 2.4%).
Natural Resources, Construction and Maintenance Occupations by Sex
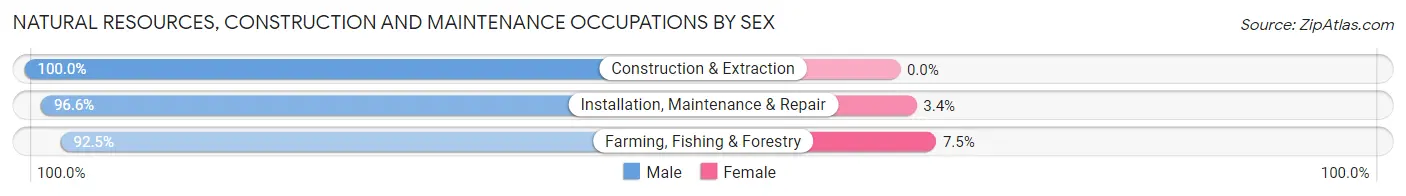
| Occupation | Male | Female |
| Farming, Fishing & Forestry | 111 (92.5%) | 9 (7.5%) |
| Construction & Extraction | 137 (100.0%) | 0 (0.0%) |
| Installation, Maintenance & Repair | 85 (96.6%) | 3 (3.4%) |
| Total (Category) | 333 (96.5%) | 12 (3.5%) |
| Total (Overall) | 1,772 (48.1%) | 1,909 (51.9%) |
Production, Transportation and Moving Occupations
The most common Production, Transportation and Moving occupations in Hamilton County are Transportation (234 | 6.4%), Material Moving (158 | 4.3%), and Production (154 | 4.2%).
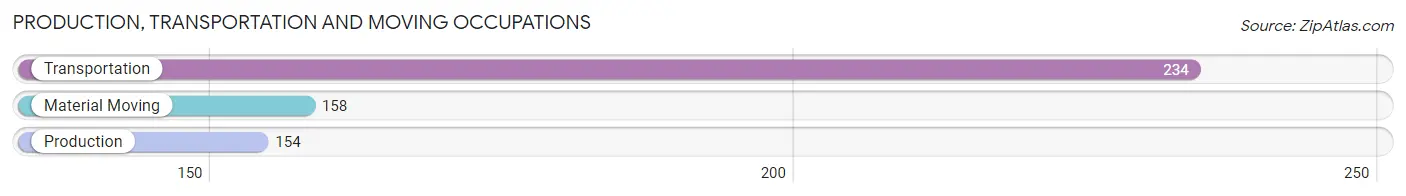
Production, Transportation and Moving Occupations by Sex
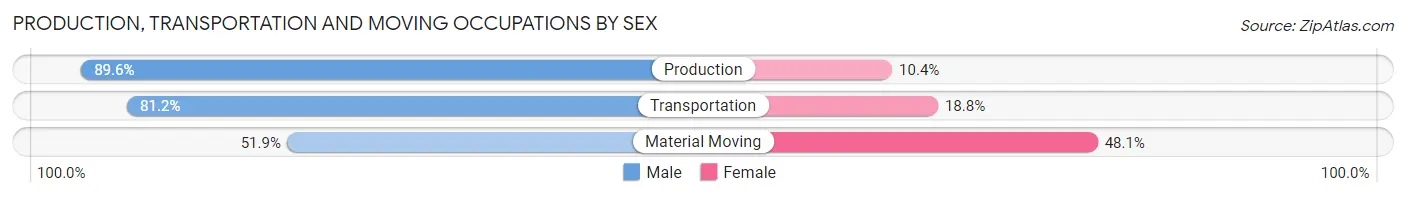
| Occupation | Male | Female |
| Production | 138 (89.6%) | 16 (10.4%) |
| Transportation | 190 (81.2%) | 44 (18.8%) |
| Material Moving | 82 (51.9%) | 76 (48.1%) |
| Total (Category) | 410 (75.1%) | 136 (24.9%) |
| Total (Overall) | 1,772 (48.1%) | 1,909 (51.9%) |
Employment Industries by Sex in Hamilton County
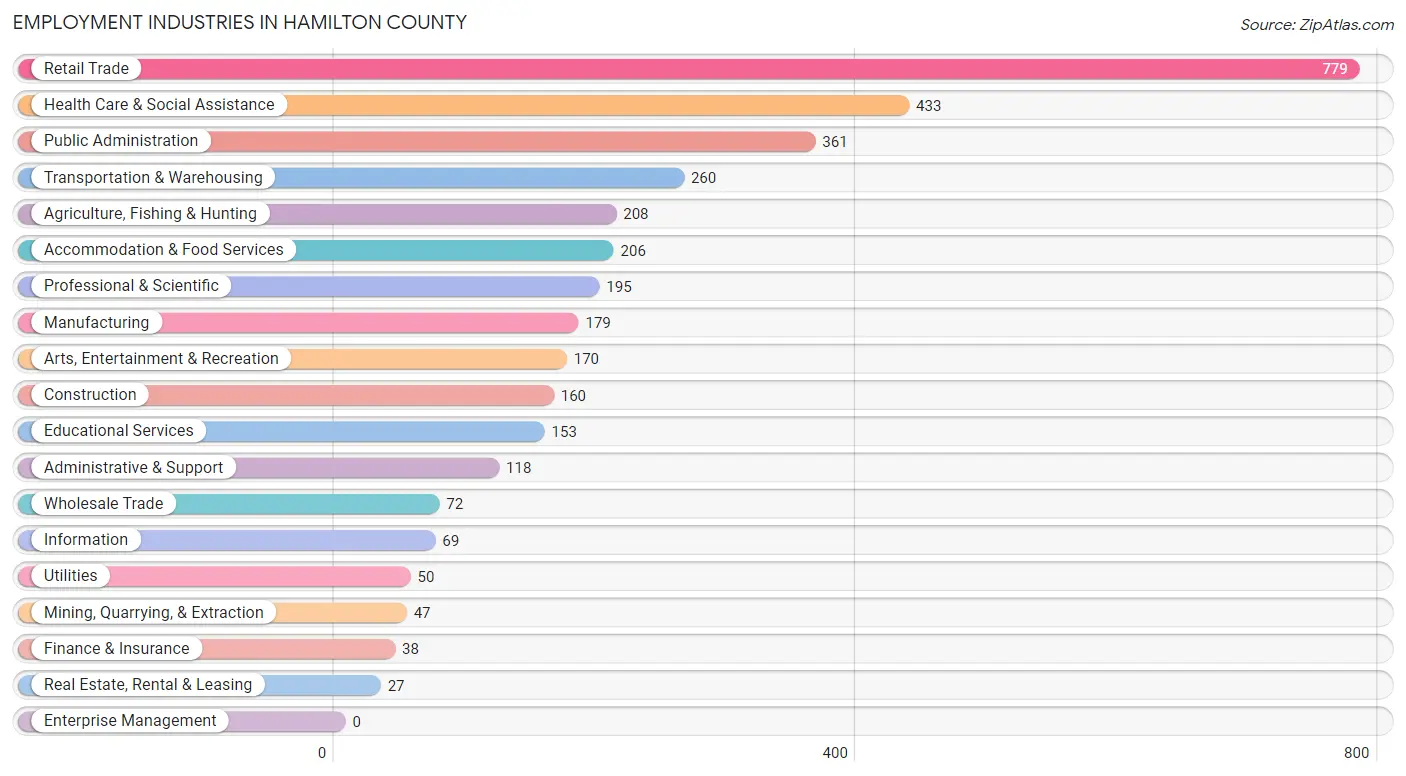
Employment Industries in Hamilton County
The major employment industries in Hamilton County include Retail Trade (779 | 21.2%), Health Care & Social Assistance (433 | 11.8%), Public Administration (361 | 9.8%), Transportation & Warehousing (260 | 7.1%), and Agriculture, Fishing & Hunting (208 | 5.7%).
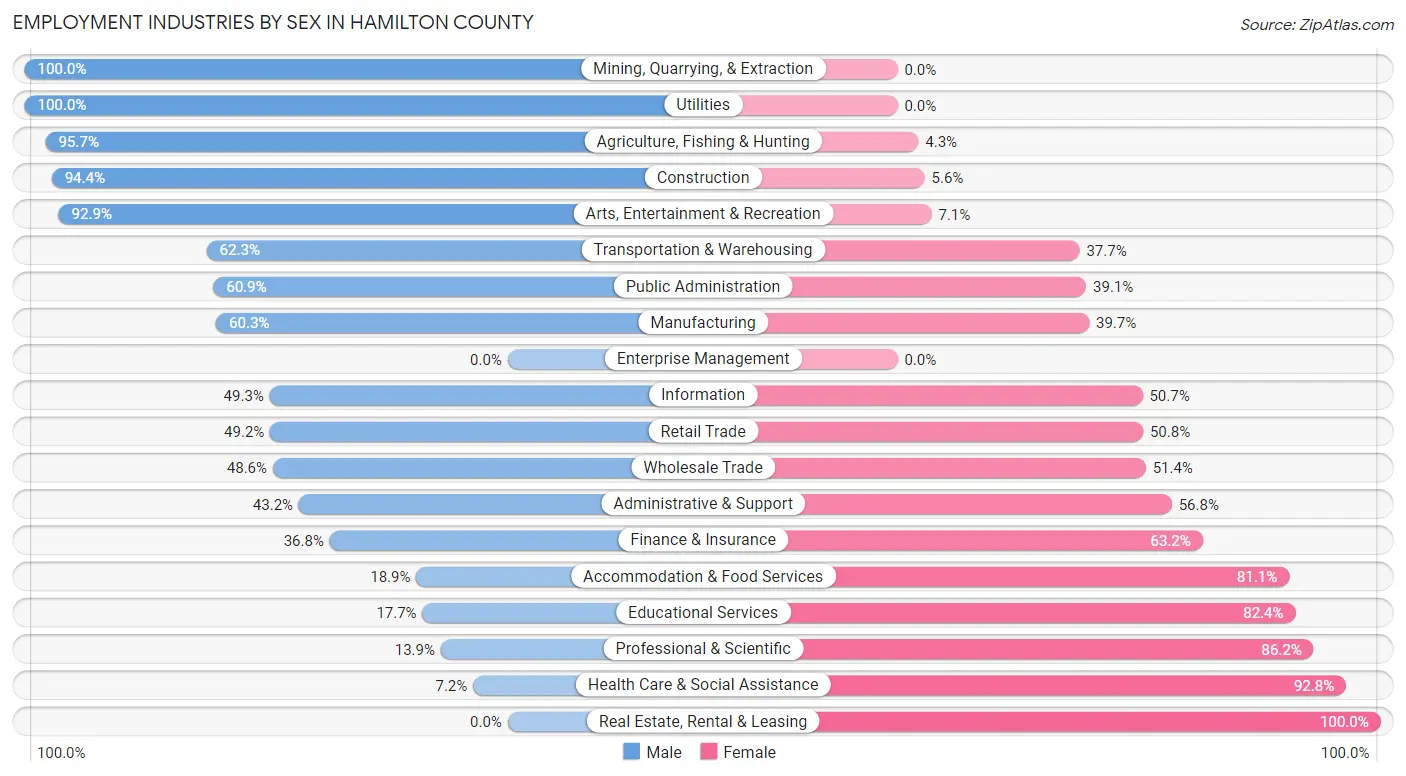
Employment Industries by Sex in Hamilton County
The Hamilton County industries that see more men than women are Mining, Quarrying, & Extraction (100.0%), Utilities (100.0%), and Agriculture, Fishing & Hunting (95.7%), whereas the industries that tend to have a higher number of women are Real Estate, Rental & Leasing (100.0%), Health Care & Social Assistance (92.8%), and Professional & Scientific (86.2%).
| Industry | Male | Female |
| Agriculture, Fishing & Hunting | 199 (95.7%) | 9 (4.3%) |
| Mining, Quarrying, & Extraction | 47 (100.0%) | 0 (0.0%) |
| Construction | 151 (94.4%) | 9 (5.6%) |
| Manufacturing | 108 (60.3%) | 71 (39.7%) |
| Wholesale Trade | 35 (48.6%) | 37 (51.4%) |
| Retail Trade | 383 (49.2%) | 396 (50.8%) |
| Transportation & Warehousing | 162 (62.3%) | 98 (37.7%) |
| Utilities | 50 (100.0%) | 0 (0.0%) |
| Information | 34 (49.3%) | 35 (50.7%) |
| Finance & Insurance | 14 (36.8%) | 24 (63.2%) |
| Real Estate, Rental & Leasing | 0 (0.0%) | 27 (100.0%) |
| Professional & Scientific | 27 (13.9%) | 168 (86.2%) |
| Enterprise Management | 0 (0.0%) | 0 (0.0%) |
| Administrative & Support | 51 (43.2%) | 67 (56.8%) |
| Educational Services | 27 (17.6%) | 126 (82.4%) |
| Health Care & Social Assistance | 31 (7.2%) | 402 (92.8%) |
| Arts, Entertainment & Recreation | 158 (92.9%) | 12 (7.1%) |
| Accommodation & Food Services | 39 (18.9%) | 167 (81.1%) |
| Public Administration | 220 (60.9%) | 141 (39.1%) |
| Total | 1,772 (48.1%) | 1,909 (51.9%) |
Education in Hamilton County
School Enrollment in Hamilton County
The most common levels of schooling among the 2,583 students in Hamilton County are middle school (895 | 34.6%), high school (695 | 26.9%), and elementary school (564 | 21.8%).
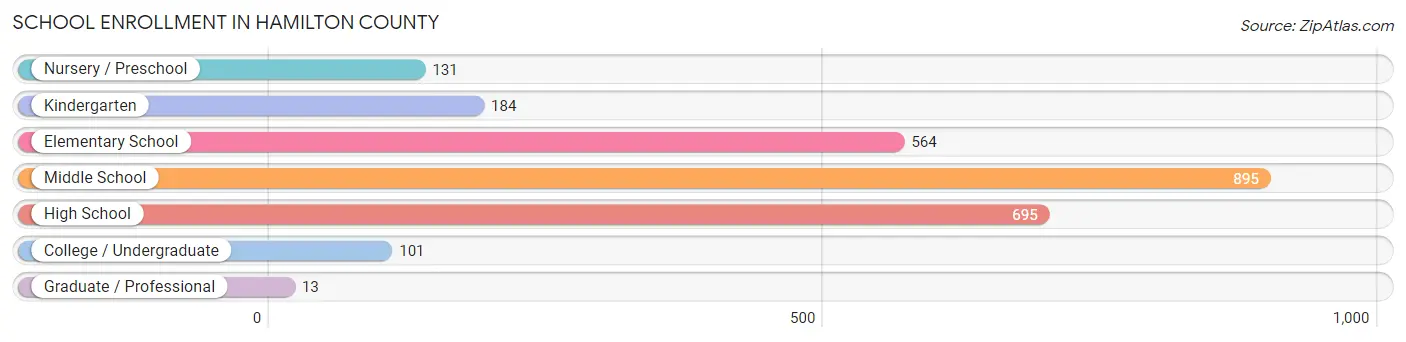
| School Level | # Students | % Students |
| Nursery / Preschool | 131 | 5.1% |
| Kindergarten | 184 | 7.1% |
| Elementary School | 564 | 21.8% |
| Middle School | 895 | 34.6% |
| High School | 695 | 26.9% |
| College / Undergraduate | 101 | 3.9% |
| Graduate / Professional | 13 | 0.5% |
| Total | 2,583 | 100.0% |
School Enrollment by Age by Funding Source in Hamilton County
Out of a total of 2,583 students who are enrolled in schools in Hamilton County, 320 (12.4%) attend a private institution, while the remaining 2,263 (87.6%) are enrolled in public schools. The age group of 15 to 17 year olds has the highest likelihood of being enrolled in private schools, with 103 (23.0% in the age bracket) enrolled. Conversely, the age group of 3 to 4 year olds has the lowest likelihood of being enrolled in a private school, with 144 (100.0% in the age bracket) attending a public institution.
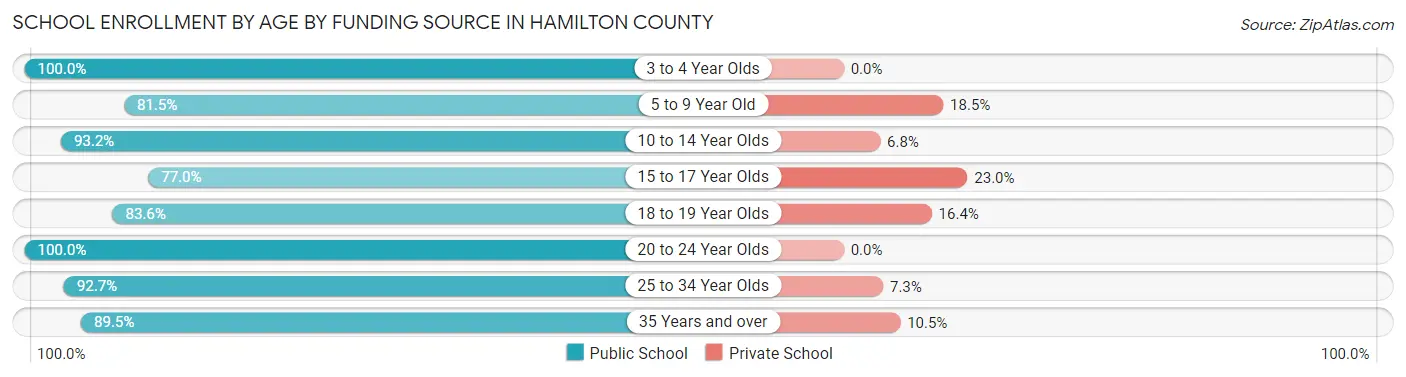
| Age Bracket | Public School | Private School |
| 3 to 4 Year Olds | 144 (100.0%) | 0 (0.0%) |
| 5 to 9 Year Old | 510 (81.5%) | 116 (18.5%) |
| 10 to 14 Year Olds | 907 (93.2%) | 66 (6.8%) |
| 15 to 17 Year Olds | 344 (77.0%) | 103 (23.0%) |
| 18 to 19 Year Olds | 51 (83.6%) | 10 (16.4%) |
| 20 to 24 Year Olds | 49 (100.0%) | 0 (0.0%) |
| 25 to 34 Year Olds | 139 (92.7%) | 11 (7.3%) |
| 35 Years and over | 119 (89.5%) | 14 (10.5%) |
| Total | 2,263 (87.6%) | 320 (12.4%) |
Educational Attainment by Field of Study in Hamilton County
Business (258 | 25.9%), education (193 | 19.4%), science & technology (118 | 11.8%), computers & mathematics (115 | 11.5%), and arts & humanities (82 | 8.2%) are the most common fields of study among 997 individuals in Hamilton County who have obtained a bachelor's degree or higher.
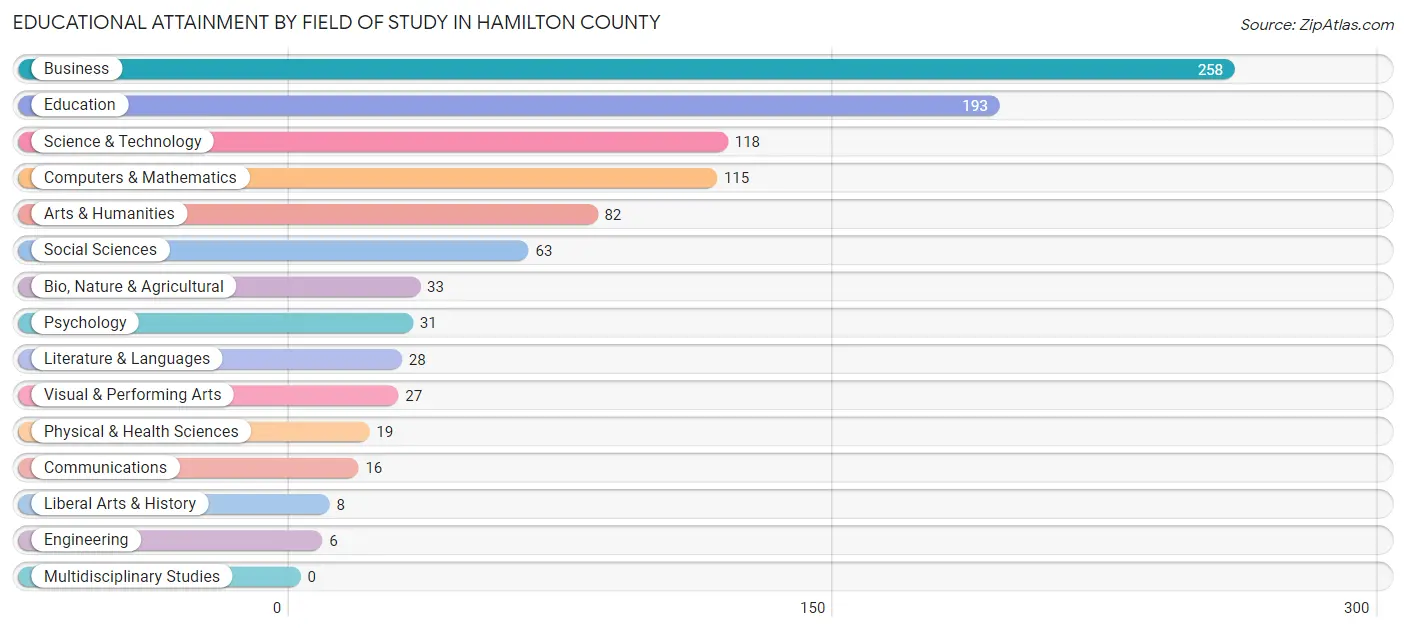
| Field of Study | # Graduates | % Graduates |
| Computers & Mathematics | 115 | 11.5% |
| Bio, Nature & Agricultural | 33 | 3.3% |
| Physical & Health Sciences | 19 | 1.9% |
| Psychology | 31 | 3.1% |
| Social Sciences | 63 | 6.3% |
| Engineering | 6 | 0.6% |
| Multidisciplinary Studies | 0 | 0.0% |
| Science & Technology | 118 | 11.8% |
| Business | 258 | 25.9% |
| Education | 193 | 19.4% |
| Literature & Languages | 28 | 2.8% |
| Liberal Arts & History | 8 | 0.8% |
| Visual & Performing Arts | 27 | 2.7% |
| Communications | 16 | 1.6% |
| Arts & Humanities | 82 | 8.2% |
| Total | 997 | 100.0% |
Transportation & Commute in Hamilton County
Vehicle Availability by Sex in Hamilton County
The most prevalent vehicle ownership categories in Hamilton County are males with 2 vehicles (811, accounting for 46.2%) and females with 2 vehicles (661, making up 44.3%).
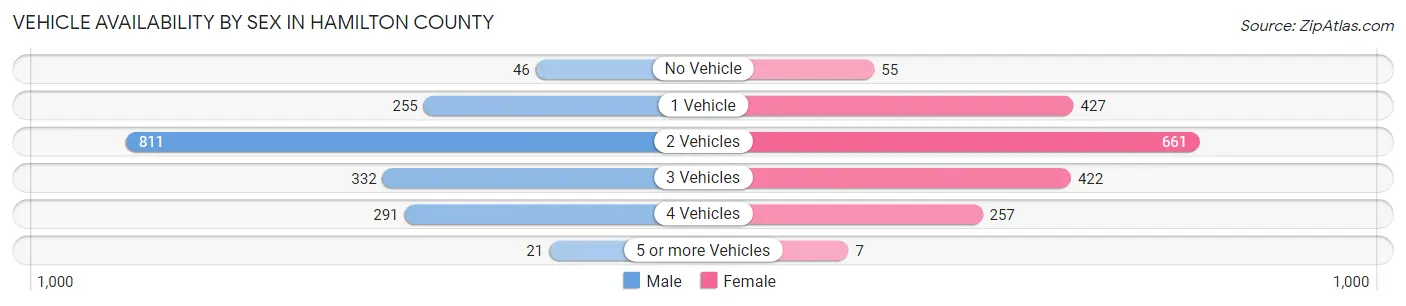
| Vehicles Available | Male | Female |
| No Vehicle | 46 (2.6%) | 55 (3.0%) |
| 1 Vehicle | 255 (14.5%) | 427 (23.4%) |
| 2 Vehicles | 811 (46.2%) | 661 (36.1%) |
| 3 Vehicles | 332 (18.9%) | 422 (23.1%) |
| 4 Vehicles | 291 (16.6%) | 257 (14.1%) |
| 5 or more Vehicles | 21 (1.2%) | 7 (0.4%) |
| Total | 1,756 (100.0%) | 1,829 (100.0%) |
Commute Time in Hamilton County
The most frequently occuring commute durations in Hamilton County are 15 to 19 minutes (570 commuters, 17.0%), 10 to 14 minutes (430 commuters, 12.8%), and 30 to 34 minutes (389 commuters, 11.6%).
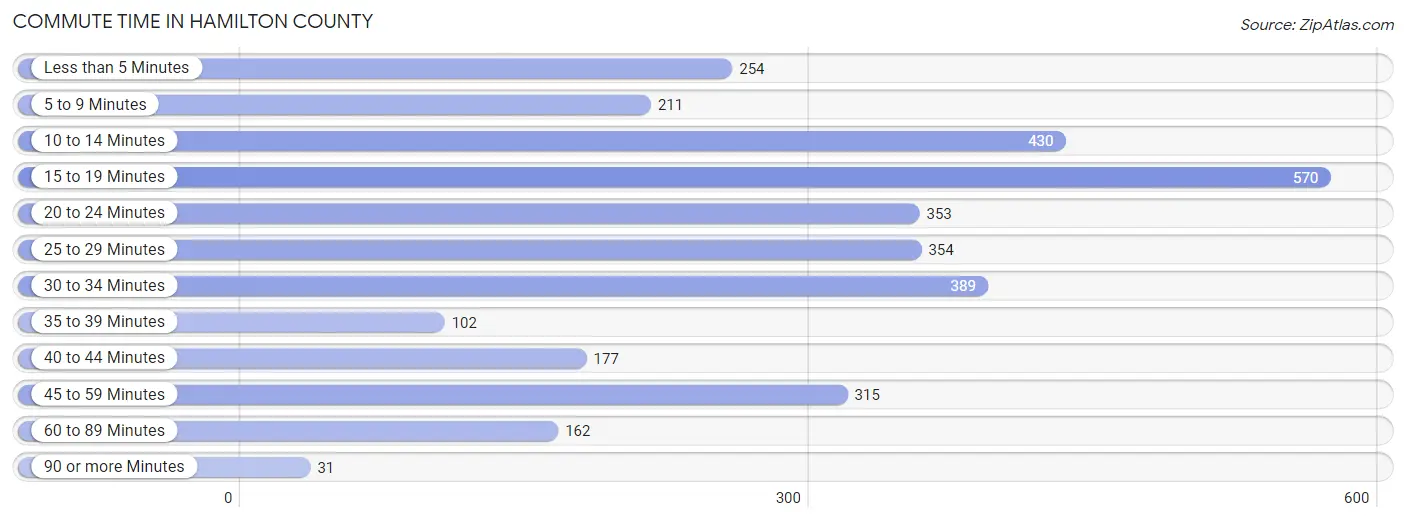
| Commute Time | # Commuters | % Commuters |
| Less than 5 Minutes | 254 | 7.6% |
| 5 to 9 Minutes | 211 | 6.3% |
| 10 to 14 Minutes | 430 | 12.8% |
| 15 to 19 Minutes | 570 | 17.0% |
| 20 to 24 Minutes | 353 | 10.5% |
| 25 to 29 Minutes | 354 | 10.6% |
| 30 to 34 Minutes | 389 | 11.6% |
| 35 to 39 Minutes | 102 | 3.0% |
| 40 to 44 Minutes | 177 | 5.3% |
| 45 to 59 Minutes | 315 | 9.4% |
| 60 to 89 Minutes | 162 | 4.8% |
| 90 or more Minutes | 31 | 0.9% |
Commute Time by Sex in Hamilton County
The most common commute times in Hamilton County are 15 to 19 minutes (433 commuters, 25.3%) for males and 45 to 59 minutes (199 commuters, 12.2%) for females.
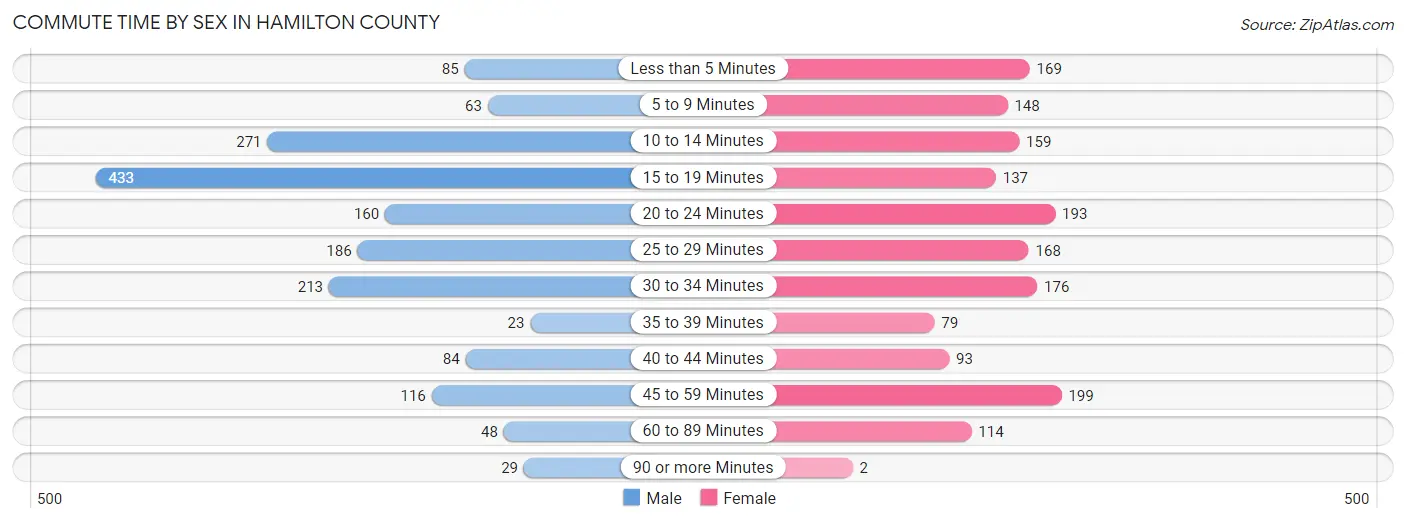
| Commute Time | Male | Female |
| Less than 5 Minutes | 85 (5.0%) | 169 (10.3%) |
| 5 to 9 Minutes | 63 (3.7%) | 148 (9.0%) |
| 10 to 14 Minutes | 271 (15.8%) | 159 (9.7%) |
| 15 to 19 Minutes | 433 (25.3%) | 137 (8.4%) |
| 20 to 24 Minutes | 160 (9.3%) | 193 (11.8%) |
| 25 to 29 Minutes | 186 (10.9%) | 168 (10.3%) |
| 30 to 34 Minutes | 213 (12.4%) | 176 (10.7%) |
| 35 to 39 Minutes | 23 (1.3%) | 79 (4.8%) |
| 40 to 44 Minutes | 84 (4.9%) | 93 (5.7%) |
| 45 to 59 Minutes | 116 (6.8%) | 199 (12.2%) |
| 60 to 89 Minutes | 48 (2.8%) | 114 (7.0%) |
| 90 or more Minutes | 29 (1.7%) | 2 (0.1%) |
Time of Departure to Work by Sex in Hamilton County
The most frequent times of departure to work in Hamilton County are 7:00 AM to 7:29 AM (275, 16.1%) for males and 7:30 AM to 7:59 AM (282, 17.2%) for females.
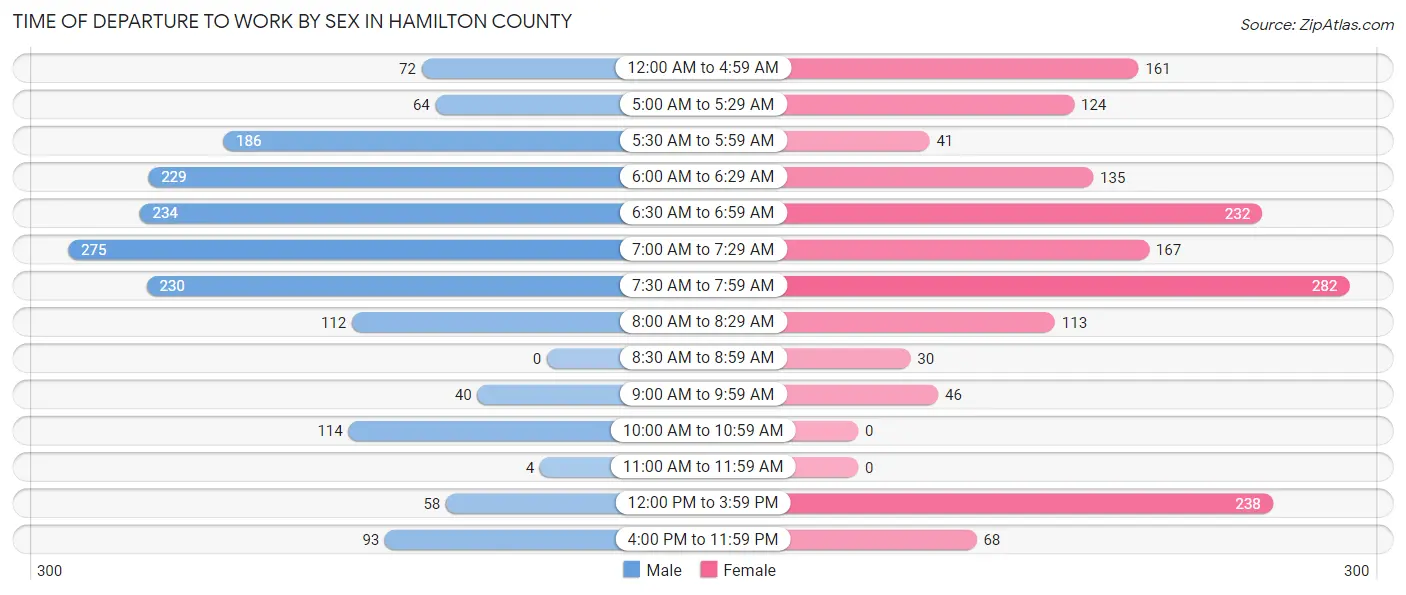
| Time of Departure | Male | Female |
| 12:00 AM to 4:59 AM | 72 (4.2%) | 161 (9.8%) |
| 5:00 AM to 5:29 AM | 64 (3.7%) | 124 (7.6%) |
| 5:30 AM to 5:59 AM | 186 (10.9%) | 41 (2.5%) |
| 6:00 AM to 6:29 AM | 229 (13.4%) | 135 (8.3%) |
| 6:30 AM to 6:59 AM | 234 (13.7%) | 232 (14.2%) |
| 7:00 AM to 7:29 AM | 275 (16.1%) | 167 (10.2%) |
| 7:30 AM to 7:59 AM | 230 (13.4%) | 282 (17.2%) |
| 8:00 AM to 8:29 AM | 112 (6.6%) | 113 (6.9%) |
| 8:30 AM to 8:59 AM | 0 (0.0%) | 30 (1.8%) |
| 9:00 AM to 9:59 AM | 40 (2.3%) | 46 (2.8%) |
| 10:00 AM to 10:59 AM | 114 (6.7%) | 0 (0.0%) |
| 11:00 AM to 11:59 AM | 4 (0.2%) | 0 (0.0%) |
| 12:00 PM to 3:59 PM | 58 (3.4%) | 238 (14.5%) |
| 4:00 PM to 11:59 PM | 93 (5.4%) | 68 (4.2%) |
| Total | 1,711 (100.0%) | 1,637 (100.0%) |
Housing Occupancy in Hamilton County
Occupancy by Ownership in Hamilton County
Of the total 4,300 dwellings in Hamilton County, owner-occupied units account for 3,233 (75.2%), while renter-occupied units make up 1,067 (24.8%).
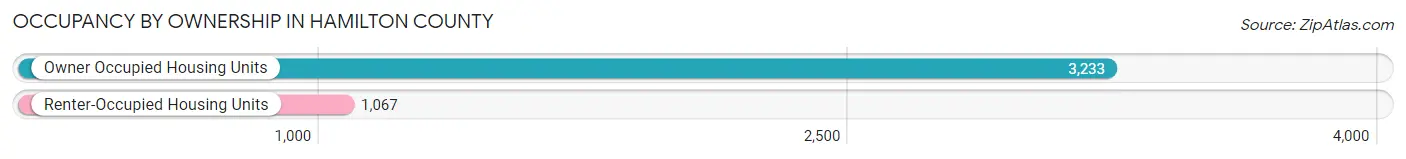
| Occupancy | # Housing Units | % Housing Units |
| Owner Occupied Housing Units | 3,233 | 75.2% |
| Renter-Occupied Housing Units | 1,067 | 24.8% |
| Total Occupied Housing Units | 4,300 | 100.0% |
Occupancy by Household Size in Hamilton County
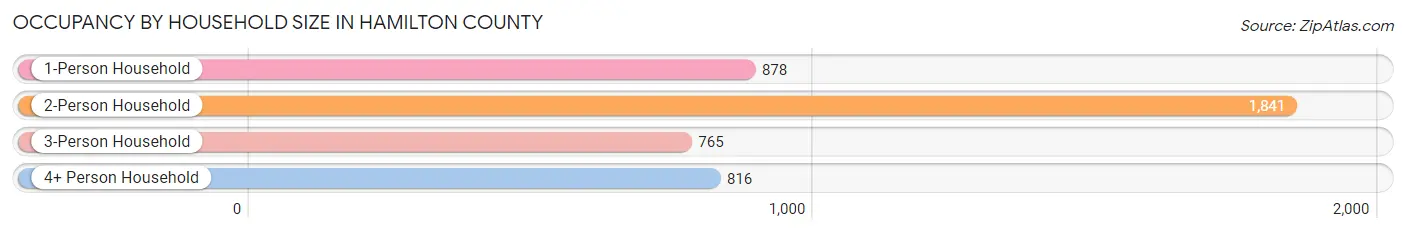
| Household Size | # Housing Units | % Housing Units |
| 1-Person Household | 878 | 20.4% |
| 2-Person Household | 1,841 | 42.8% |
| 3-Person Household | 765 | 17.8% |
| 4+ Person Household | 816 | 19.0% |
| Total Housing Units | 4,300 | 100.0% |
Occupancy by Ownership by Household Size in Hamilton County
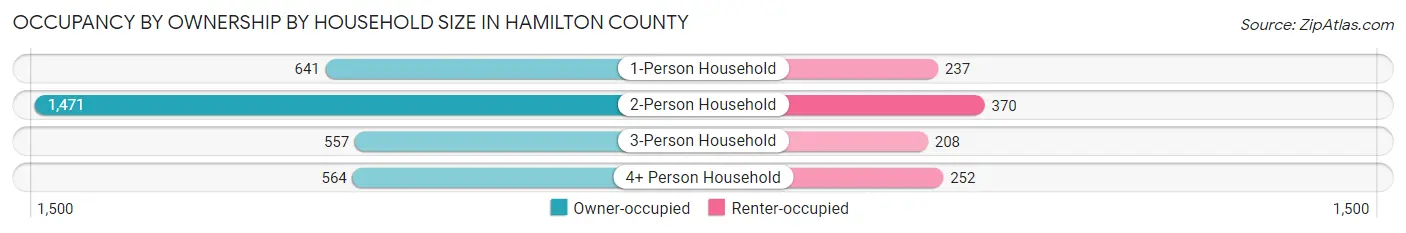
| Household Size | Owner-occupied | Renter-occupied |
| 1-Person Household | 641 (73.0%) | 237 (27.0%) |
| 2-Person Household | 1,471 (79.9%) | 370 (20.1%) |
| 3-Person Household | 557 (72.8%) | 208 (27.2%) |
| 4+ Person Household | 564 (69.1%) | 252 (30.9%) |
| Total Housing Units | 3,233 (75.2%) | 1,067 (24.8%) |
Occupancy by Educational Attainment in Hamilton County
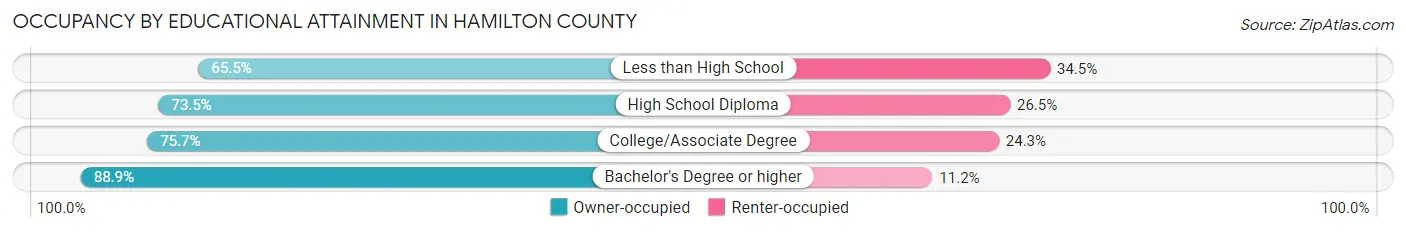
| Household Size | Owner-occupied | Renter-occupied |
| Less than High School | 365 (65.5%) | 192 (34.5%) |
| High School Diploma | 1,334 (73.5%) | 482 (26.5%) |
| College/Associate Degree | 1,024 (75.7%) | 329 (24.3%) |
| Bachelor's Degree or higher | 510 (88.8%) | 64 (11.2%) |
Occupancy by Age of Householder in Hamilton County
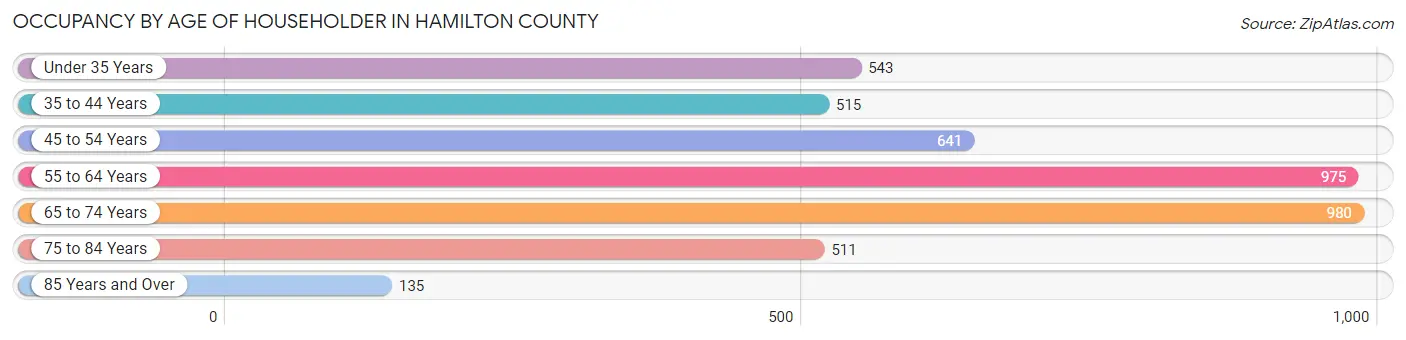
| Age Bracket | # Households | % Households |
| Under 35 Years | 543 | 12.6% |
| 35 to 44 Years | 515 | 12.0% |
| 45 to 54 Years | 641 | 14.9% |
| 55 to 64 Years | 975 | 22.7% |
| 65 to 74 Years | 980 | 22.8% |
| 75 to 84 Years | 511 | 11.9% |
| 85 Years and Over | 135 | 3.1% |
| Total | 4,300 | 100.0% |
Housing Finances in Hamilton County
Median Income by Occupancy in Hamilton County
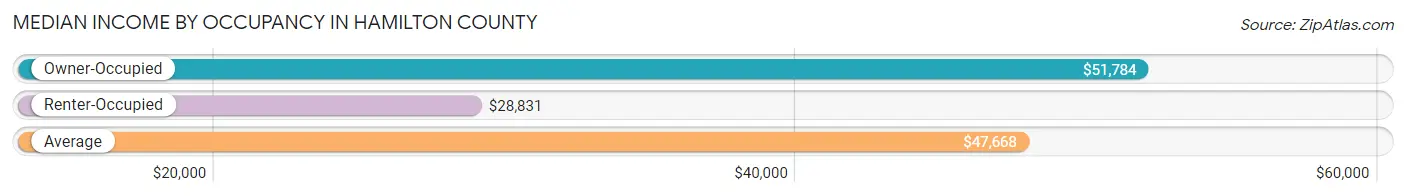
| Occupancy Type | # Households | Median Income |
| Owner-Occupied | 3,233 (75.2%) | $51,784 |
| Renter-Occupied | 1,067 (24.8%) | $28,831 |
| Average | 4,300 (100.0%) | $47,668 |
Occupancy by Householder Income Bracket in Hamilton County
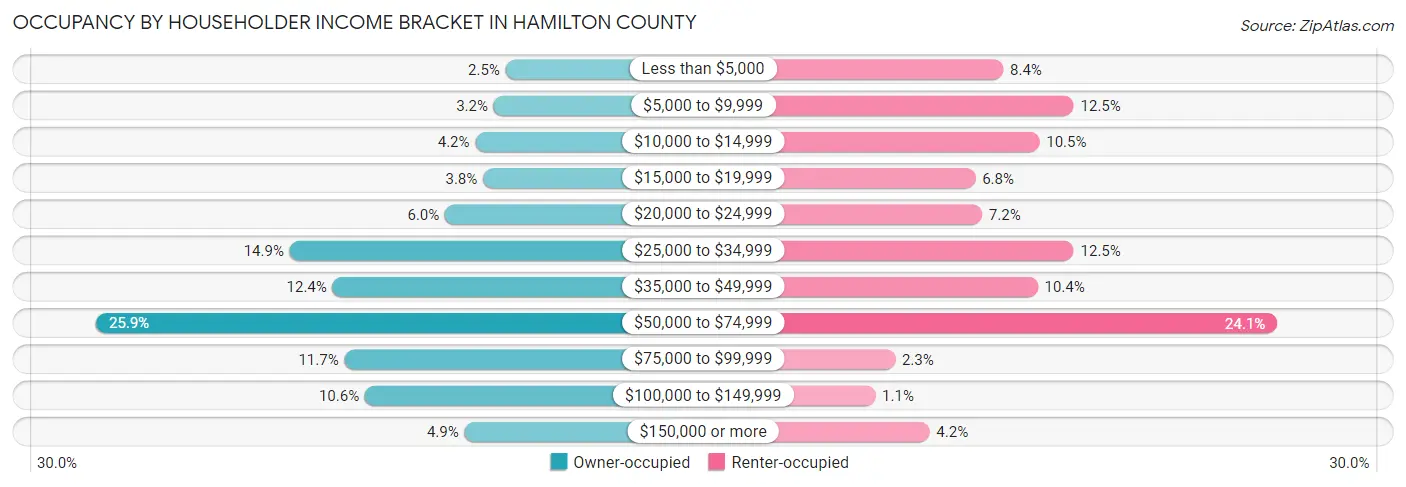
| Income Bracket | Owner-occupied | Renter-occupied |
| Less than $5,000 | 81 (2.5%) | 90 (8.4%) |
| $5,000 to $9,999 | 103 (3.2%) | 133 (12.5%) |
| $10,000 to $14,999 | 137 (4.2%) | 112 (10.5%) |
| $15,000 to $19,999 | 123 (3.8%) | 73 (6.8%) |
| $20,000 to $24,999 | 193 (6.0%) | 77 (7.2%) |
| $25,000 to $34,999 | 480 (14.8%) | 133 (12.5%) |
| $35,000 to $49,999 | 401 (12.4%) | 111 (10.4%) |
| $50,000 to $74,999 | 838 (25.9%) | 257 (24.1%) |
| $75,000 to $99,999 | 379 (11.7%) | 24 (2.2%) |
| $100,000 to $149,999 | 341 (10.5%) | 12 (1.1%) |
| $150,000 or more | 157 (4.9%) | 45 (4.2%) |
| Total | 3,233 (100.0%) | 1,067 (100.0%) |
Monthly Housing Cost Tiers in Hamilton County
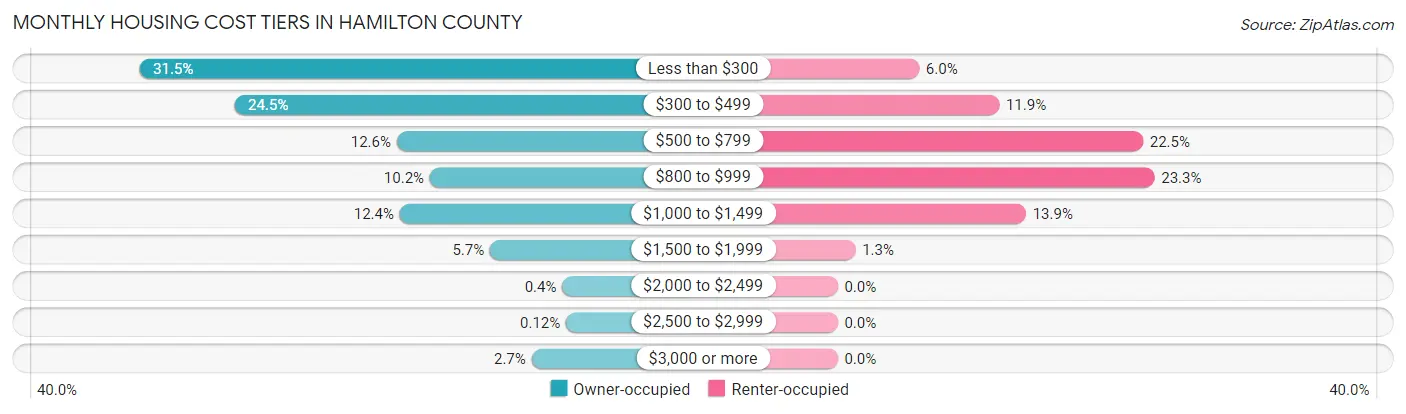
| Monthly Cost | Owner-occupied | Renter-occupied |
| Less than $300 | 1,018 (31.5%) | 64 (6.0%) |
| $300 to $499 | 792 (24.5%) | 127 (11.9%) |
| $500 to $799 | 407 (12.6%) | 240 (22.5%) |
| $800 to $999 | 328 (10.2%) | 249 (23.3%) |
| $1,000 to $1,499 | 400 (12.4%) | 148 (13.9%) |
| $1,500 to $1,999 | 185 (5.7%) | 14 (1.3%) |
| $2,000 to $2,499 | 13 (0.4%) | 0 (0.0%) |
| $2,500 to $2,999 | 4 (0.1%) | 0 (0.0%) |
| $3,000 or more | 86 (2.7%) | 0 (0.0%) |
| Total | 3,233 (100.0%) | 1,067 (100.0%) |
Physical Housing Characteristics in Hamilton County
Housing Structures in Hamilton County
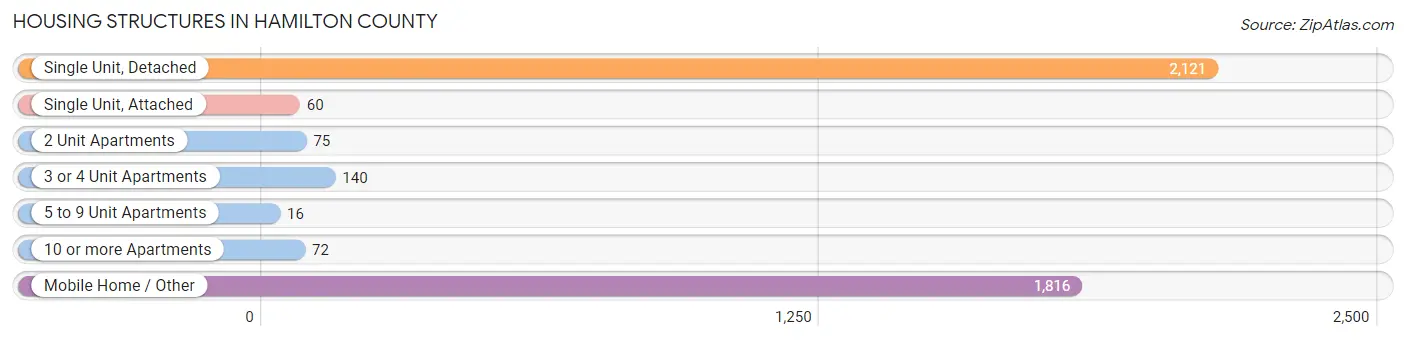
| Structure Type | # Housing Units | % Housing Units |
| Single Unit, Detached | 2,121 | 49.3% |
| Single Unit, Attached | 60 | 1.4% |
| 2 Unit Apartments | 75 | 1.7% |
| 3 or 4 Unit Apartments | 140 | 3.3% |
| 5 to 9 Unit Apartments | 16 | 0.4% |
| 10 or more Apartments | 72 | 1.7% |
| Mobile Home / Other | 1,816 | 42.2% |
| Total | 4,300 | 100.0% |
Housing Structures by Occupancy in Hamilton County
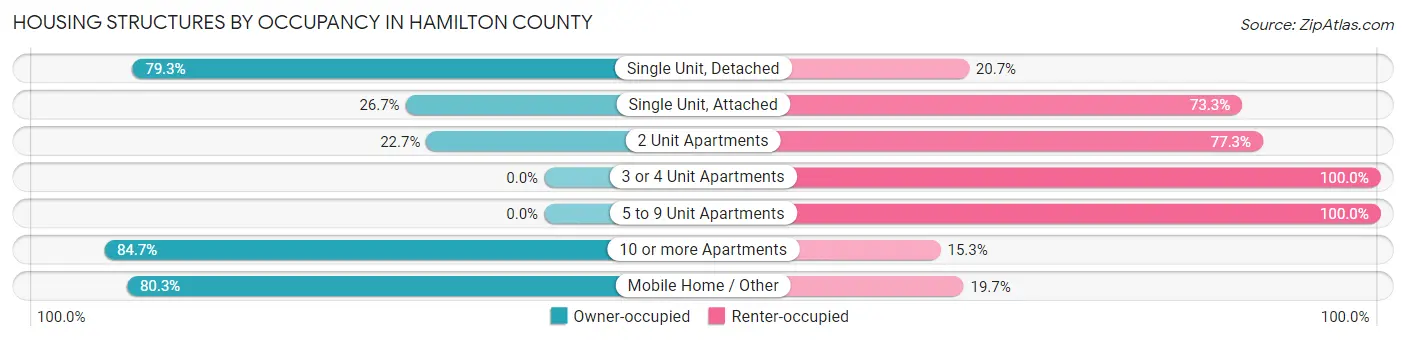
| Structure Type | Owner-occupied | Renter-occupied |
| Single Unit, Detached | 1,681 (79.3%) | 440 (20.7%) |
| Single Unit, Attached | 16 (26.7%) | 44 (73.3%) |
| 2 Unit Apartments | 17 (22.7%) | 58 (77.3%) |
| 3 or 4 Unit Apartments | 0 (0.0%) | 140 (100.0%) |
| 5 to 9 Unit Apartments | 0 (0.0%) | 16 (100.0%) |
| 10 or more Apartments | 61 (84.7%) | 11 (15.3%) |
| Mobile Home / Other | 1,458 (80.3%) | 358 (19.7%) |
| Total | 3,233 (75.2%) | 1,067 (24.8%) |
Housing Structures by Number of Rooms in Hamilton County
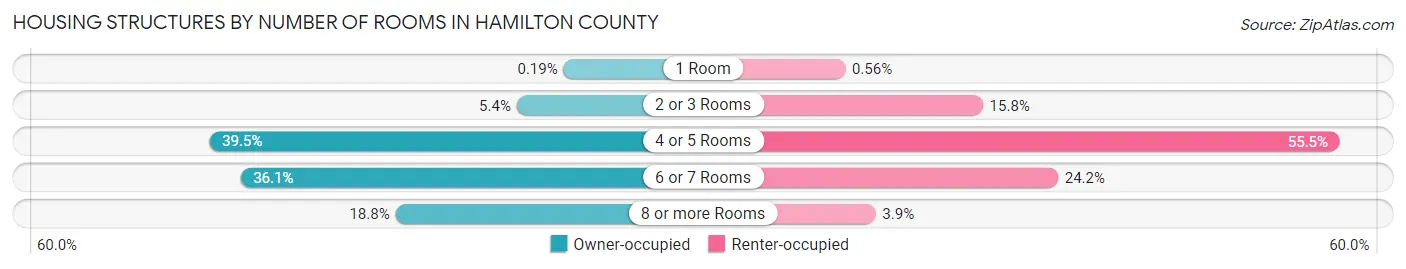
| Number of Rooms | Owner-occupied | Renter-occupied |
| 1 Room | 6 (0.2%) | 6 (0.6%) |
| 2 or 3 Rooms | 174 (5.4%) | 169 (15.8%) |
| 4 or 5 Rooms | 1,278 (39.5%) | 592 (55.5%) |
| 6 or 7 Rooms | 1,166 (36.1%) | 258 (24.2%) |
| 8 or more Rooms | 609 (18.8%) | 42 (3.9%) |
| Total | 3,233 (100.0%) | 1,067 (100.0%) |
Housing Structure by Heating Type in Hamilton County
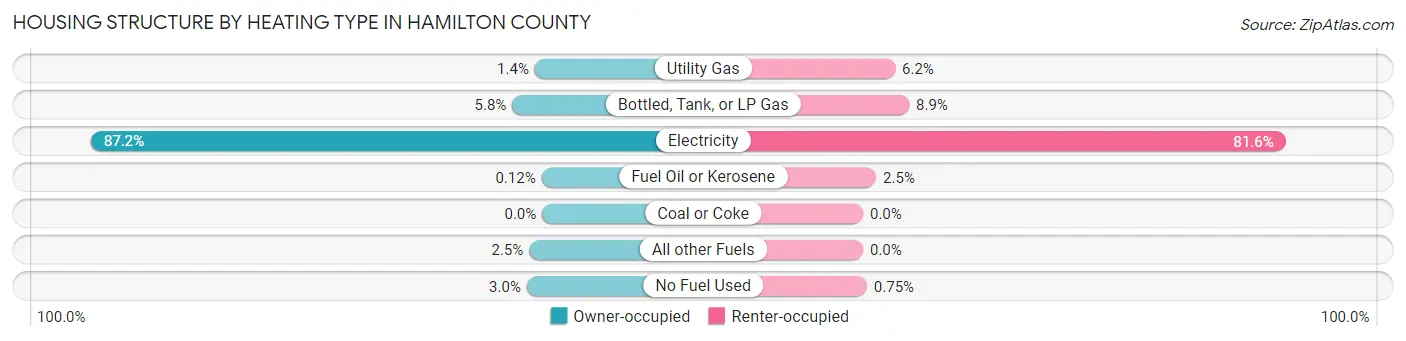
| Heating Type | Owner-occupied | Renter-occupied |
| Utility Gas | 46 (1.4%) | 66 (6.2%) |
| Bottled, Tank, or LP Gas | 187 (5.8%) | 95 (8.9%) |
| Electricity | 2,819 (87.2%) | 871 (81.6%) |
| Fuel Oil or Kerosene | 4 (0.1%) | 27 (2.5%) |
| Coal or Coke | 0 (0.0%) | 0 (0.0%) |
| All other Fuels | 81 (2.5%) | 0 (0.0%) |
| No Fuel Used | 96 (3.0%) | 8 (0.7%) |
| Total | 3,233 (100.0%) | 1,067 (100.0%) |
Household Vehicle Usage in Hamilton County
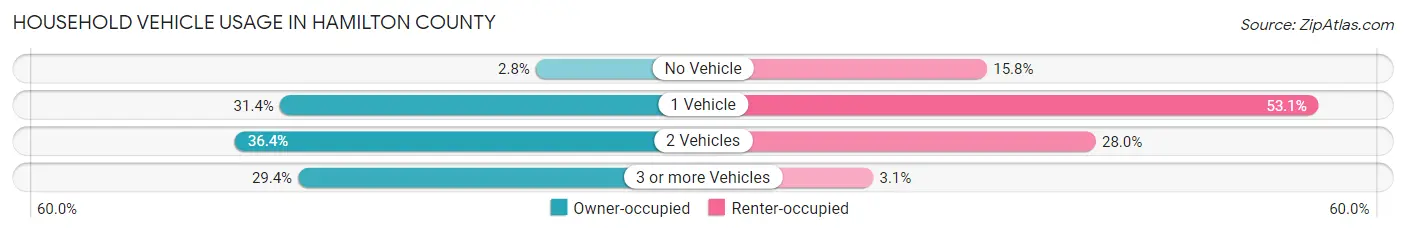
| Vehicles per Household | Owner-occupied | Renter-occupied |
| No Vehicle | 89 (2.8%) | 169 (15.8%) |
| 1 Vehicle | 1,016 (31.4%) | 566 (53.0%) |
| 2 Vehicles | 1,178 (36.4%) | 299 (28.0%) |
| 3 or more Vehicles | 950 (29.4%) | 33 (3.1%) |
| Total | 3,233 (100.0%) | 1,067 (100.0%) |
Real Estate & Mortgages in Hamilton County
Real Estate and Mortgage Overview in Hamilton County
| Characteristic | Without Mortgage | With Mortgage |
| Housing Units | 2,135 | 1,098 |
| Median Property Value | $80,100 | $124,200 |
| Median Household Income | $41,938 | $75 |
| Monthly Housing Costs | $312 | $86 |
| Real Estate Taxes | $629 | $114 |
Property Value by Mortgage Status in Hamilton County
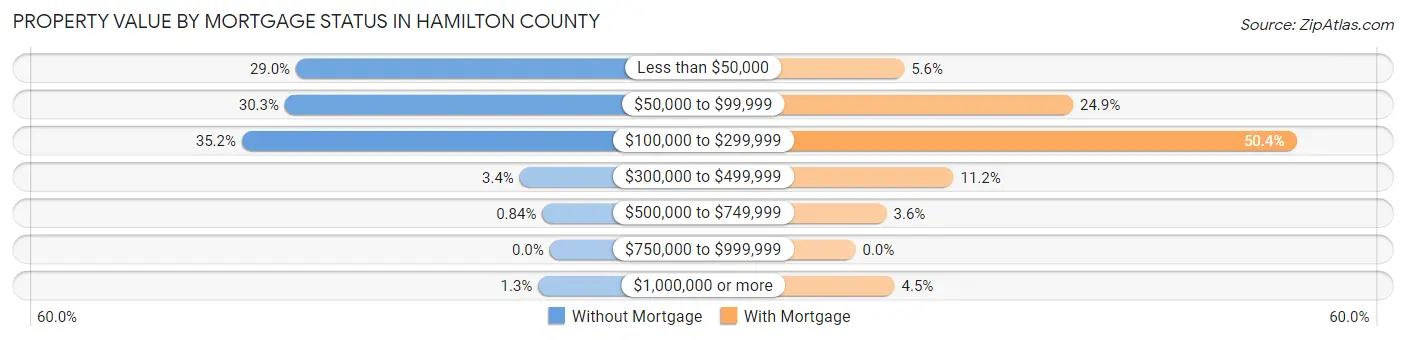
| Property Value | Without Mortgage | With Mortgage |
| Less than $50,000 | 619 (29.0%) | 61 (5.6%) |
| $50,000 to $99,999 | 646 (30.3%) | 273 (24.9%) |
| $100,000 to $299,999 | 751 (35.2%) | 553 (50.4%) |
| $300,000 to $499,999 | 73 (3.4%) | 123 (11.2%) |
| $500,000 to $749,999 | 18 (0.8%) | 39 (3.5%) |
| $750,000 to $999,999 | 0 (0.0%) | 0 (0.0%) |
| $1,000,000 or more | 28 (1.3%) | 49 (4.5%) |
| Total | 2,135 (100.0%) | 1,098 (100.0%) |
Household Income by Mortgage Status in Hamilton County
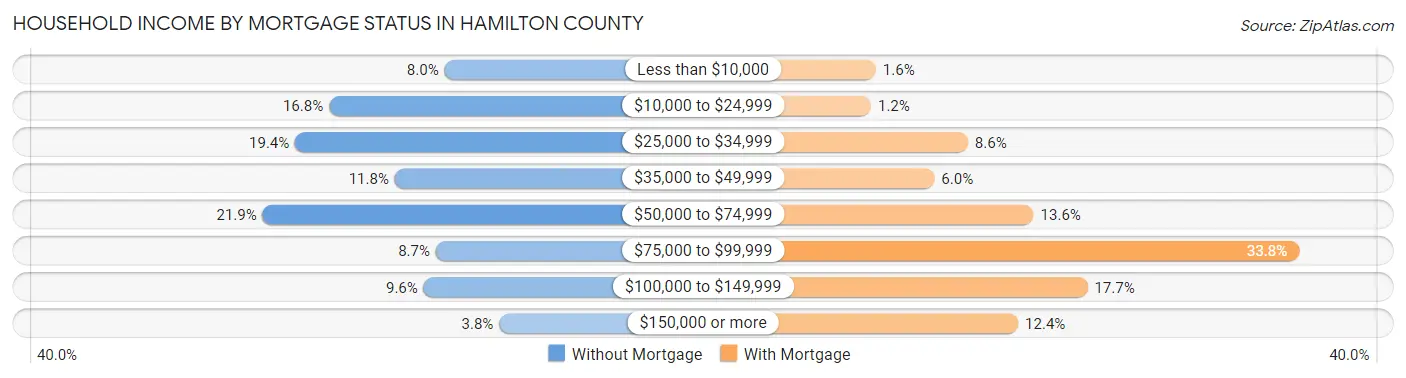
| Household Income | Without Mortgage | With Mortgage |
| Less than $10,000 | 171 (8.0%) | 17 (1.5%) |
| $10,000 to $24,999 | 359 (16.8%) | 13 (1.2%) |
| $25,000 to $34,999 | 414 (19.4%) | 94 (8.6%) |
| $35,000 to $49,999 | 252 (11.8%) | 66 (6.0%) |
| $50,000 to $74,999 | 467 (21.9%) | 149 (13.6%) |
| $75,000 to $99,999 | 185 (8.7%) | 371 (33.8%) |
| $100,000 to $149,999 | 205 (9.6%) | 194 (17.7%) |
| $150,000 or more | 82 (3.8%) | 136 (12.4%) |
| Total | 2,135 (100.0%) | 1,098 (100.0%) |
Property Value to Household Income Ratio in Hamilton County
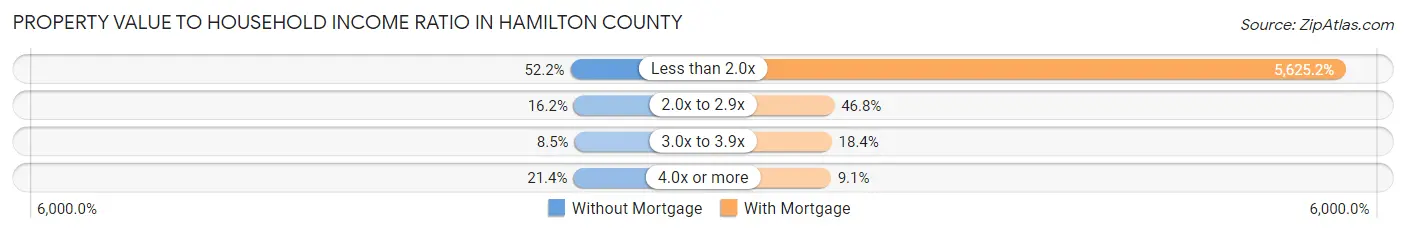
| Value-to-Income Ratio | Without Mortgage | With Mortgage |
| Less than 2.0x | 1,115 (52.2%) | 61,765 (5,625.2%) |
| 2.0x to 2.9x | 345 (16.2%) | 514 (46.8%) |
| 3.0x to 3.9x | 182 (8.5%) | 202 (18.4%) |
| 4.0x or more | 456 (21.4%) | 100 (9.1%) |
| Total | 2,135 (100.0%) | 1,098 (100.0%) |
Real Estate Taxes by Mortgage Status in Hamilton County
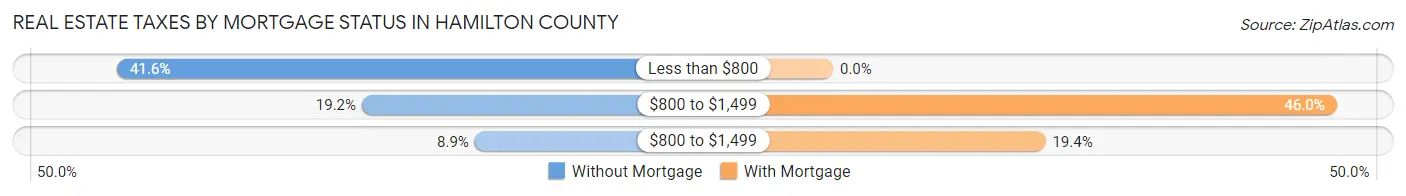
| Property Taxes | Without Mortgage | With Mortgage |
| Less than $800 | 887 (41.5%) | 0 (0.0%) |
| $800 to $1,499 | 410 (19.2%) | 505 (46.0%) |
| $800 to $1,499 | 190 (8.9%) | 213 (19.4%) |
| Total | 2,135 (100.0%) | 1,098 (100.0%) |
Health & Disability in Hamilton County
Health Insurance Coverage by Age in Hamilton County
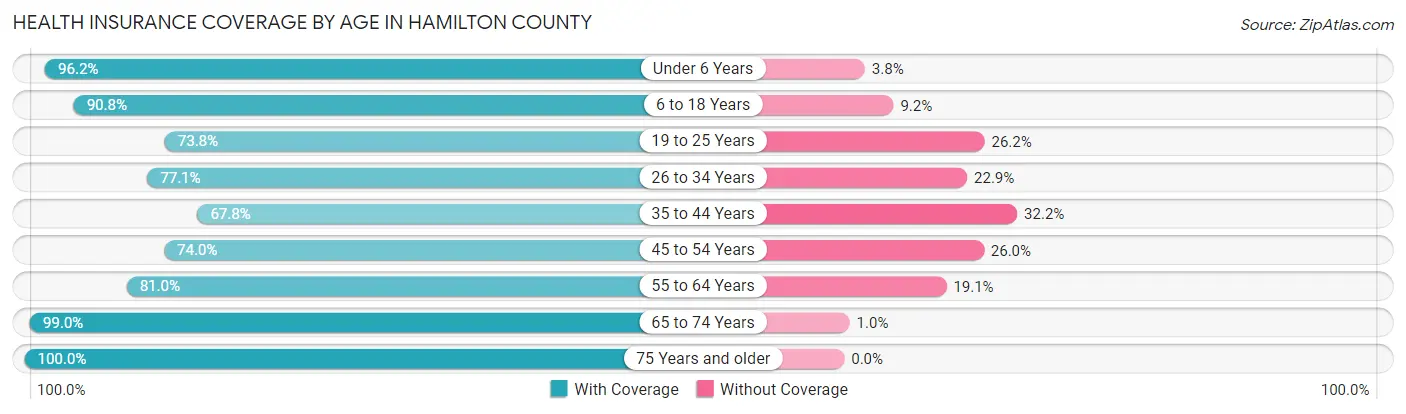
| Age Bracket | With Coverage | Without Coverage |
| Under 6 Years | 651 (96.2%) | 26 (3.8%) |
| 6 to 18 Years | 1,902 (90.8%) | 192 (9.2%) |
| 19 to 25 Years | 494 (73.8%) | 175 (26.2%) |
| 26 to 34 Years | 825 (77.1%) | 245 (22.9%) |
| 35 to 44 Years | 767 (67.8%) | 365 (32.2%) |
| 45 to 54 Years | 870 (74.0%) | 306 (26.0%) |
| 55 to 64 Years | 1,317 (80.9%) | 310 (19.1%) |
| 65 to 74 Years | 1,490 (99.0%) | 15 (1.0%) |
| 75 Years and older | 900 (100.0%) | 0 (0.0%) |
| Total | 9,216 (84.9%) | 1,634 (15.1%) |
Health Insurance Coverage by Citizenship Status in Hamilton County
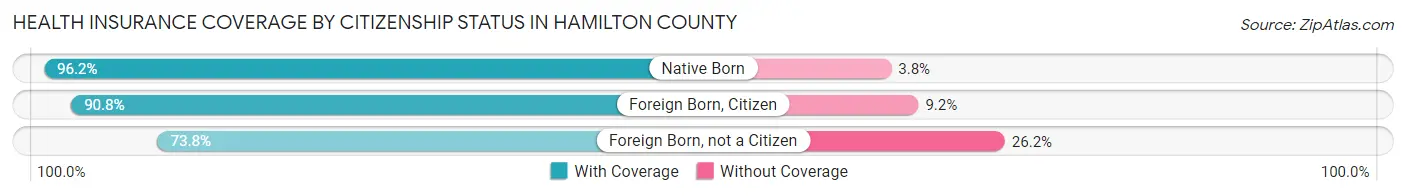
| Citizenship Status | With Coverage | Without Coverage |
| Native Born | 651 (96.2%) | 26 (3.8%) |
| Foreign Born, Citizen | 1,902 (90.8%) | 192 (9.2%) |
| Foreign Born, not a Citizen | 494 (73.8%) | 175 (26.2%) |
Health Insurance Coverage by Household Income in Hamilton County
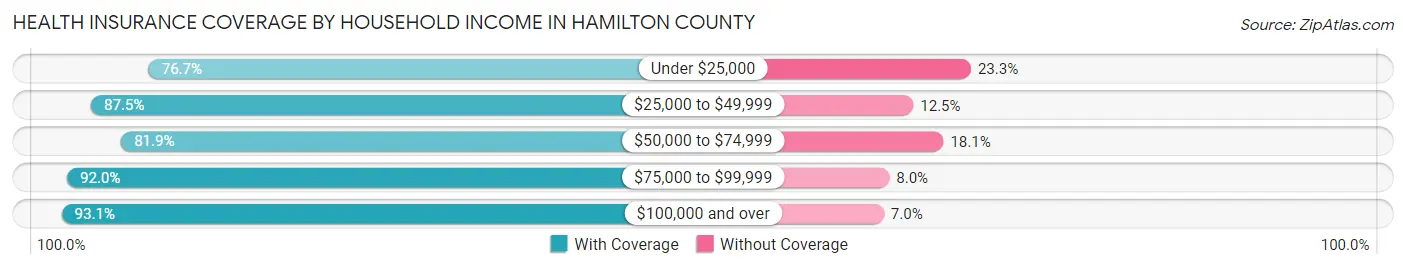
| Household Income | With Coverage | Without Coverage |
| Under $25,000 | 1,883 (76.7%) | 571 (23.3%) |
| $25,000 to $49,999 | 2,303 (87.5%) | 328 (12.5%) |
| $50,000 to $74,999 | 2,239 (81.9%) | 495 (18.1%) |
| $75,000 to $99,999 | 1,431 (92.0%) | 124 (8.0%) |
| $100,000 and over | 1,339 (93.0%) | 100 (7.0%) |
Public vs Private Health Insurance Coverage by Age in Hamilton County
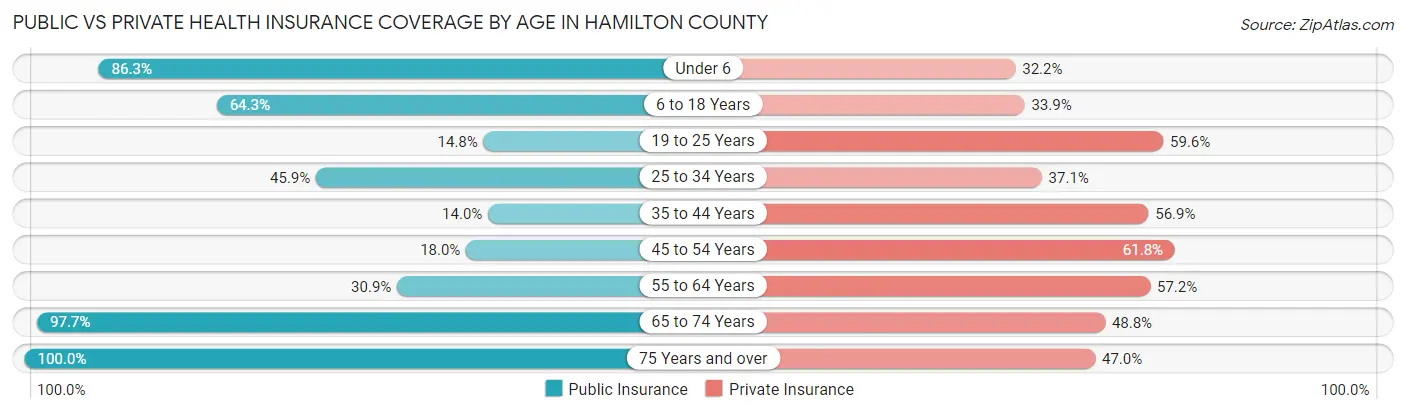
| Age Bracket | Public Insurance | Private Insurance |
| Under 6 | 584 (86.3%) | 218 (32.2%) |
| 6 to 18 Years | 1,347 (64.3%) | 710 (33.9%) |
| 19 to 25 Years | 99 (14.8%) | 399 (59.6%) |
| 25 to 34 Years | 491 (45.9%) | 397 (37.1%) |
| 35 to 44 Years | 158 (14.0%) | 644 (56.9%) |
| 45 to 54 Years | 212 (18.0%) | 727 (61.8%) |
| 55 to 64 Years | 502 (30.8%) | 931 (57.2%) |
| 65 to 74 Years | 1,470 (97.7%) | 735 (48.8%) |
| 75 Years and over | 900 (100.0%) | 423 (47.0%) |
| Total | 5,763 (53.1%) | 5,184 (47.8%) |
Disability Status by Sex by Age in Hamilton County
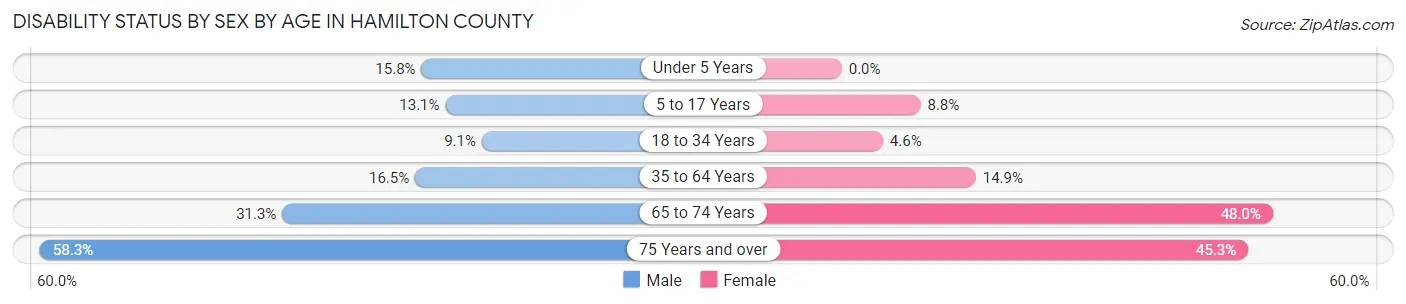
| Age Bracket | Male | Female |
| Under 5 Years | 77 (15.8%) | 0 (0.0%) |
| 5 to 17 Years | 137 (13.1%) | 92 (8.8%) |
| 18 to 34 Years | 77 (9.1%) | 44 (4.6%) |
| 35 to 64 Years | 277 (16.5%) | 337 (14.9%) |
| 65 to 74 Years | 222 (31.3%) | 382 (48.0%) |
| 75 Years and over | 218 (58.3%) | 238 (45.3%) |
Disability Class by Sex by Age in Hamilton County
Disability Class: Hearing Difficulty
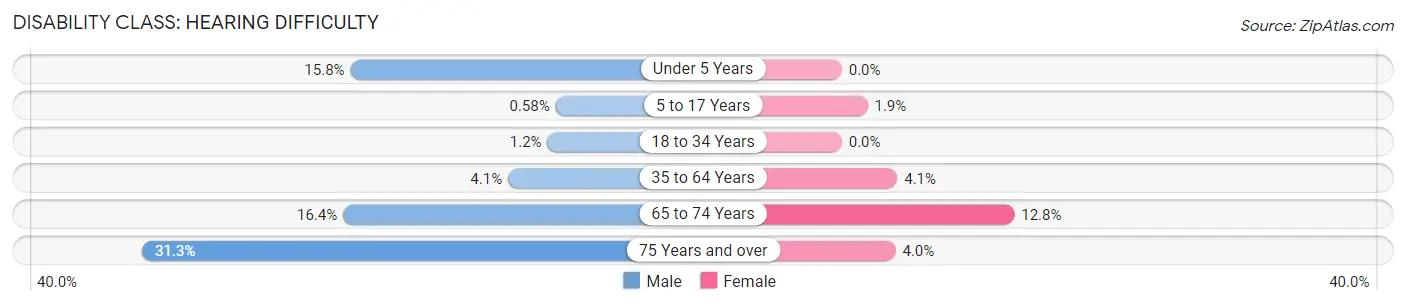
| Age Bracket | Male | Female |
| Under 5 Years | 77 (15.8%) | 0 (0.0%) |
| 5 to 17 Years | 6 (0.6%) | 20 (1.9%) |
| 18 to 34 Years | 10 (1.2%) | 0 (0.0%) |
| 35 to 64 Years | 69 (4.1%) | 93 (4.1%) |
| 65 to 74 Years | 116 (16.4%) | 102 (12.8%) |
| 75 Years and over | 117 (31.3%) | 21 (4.0%) |
Disability Class: Vision Difficulty
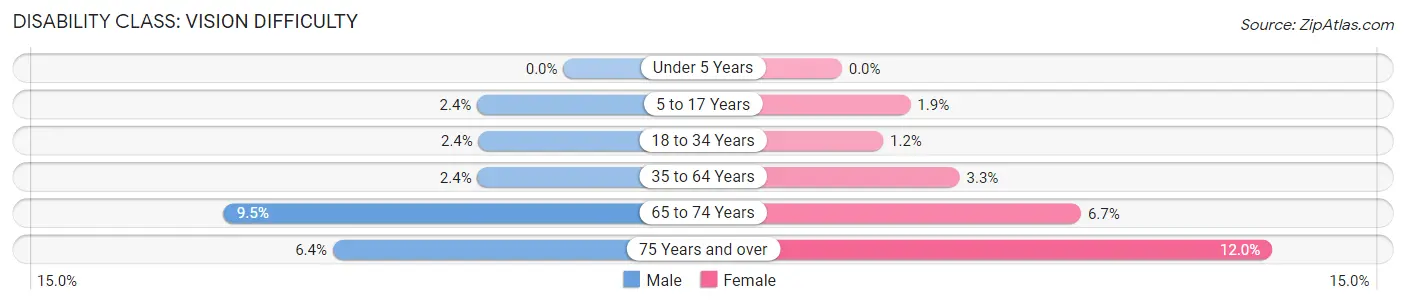
| Age Bracket | Male | Female |
| Under 5 Years | 0 (0.0%) | 0 (0.0%) |
| 5 to 17 Years | 25 (2.4%) | 20 (1.9%) |
| 18 to 34 Years | 20 (2.4%) | 11 (1.1%) |
| 35 to 64 Years | 40 (2.4%) | 74 (3.3%) |
| 65 to 74 Years | 67 (9.5%) | 53 (6.7%) |
| 75 Years and over | 24 (6.4%) | 63 (12.0%) |
Disability Class: Cognitive Difficulty
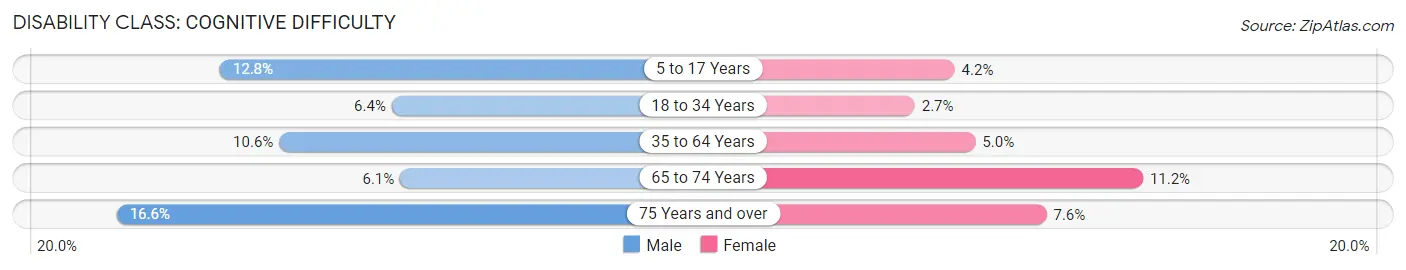
| Age Bracket | Male | Female |
| 5 to 17 Years | 133 (12.8%) | 44 (4.2%) |
| 18 to 34 Years | 54 (6.4%) | 26 (2.7%) |
| 35 to 64 Years | 177 (10.5%) | 112 (5.0%) |
| 65 to 74 Years | 43 (6.1%) | 89 (11.2%) |
| 75 Years and over | 62 (16.6%) | 40 (7.6%) |
Disability Class: Ambulatory Difficulty
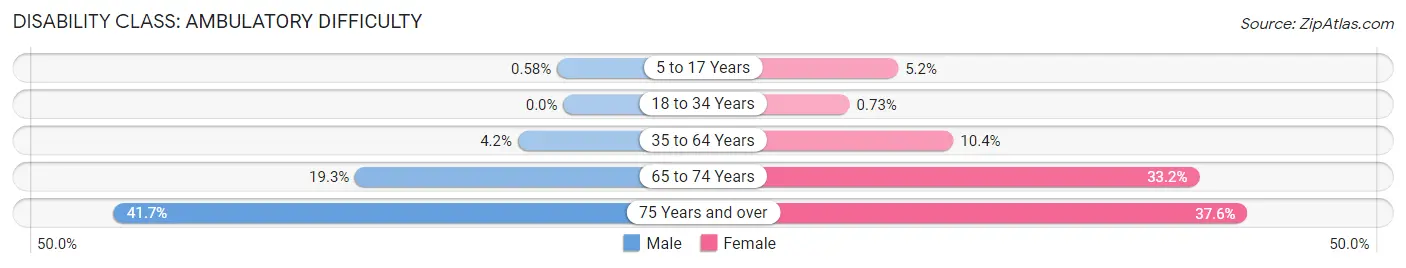
| Age Bracket | Male | Female |
| 5 to 17 Years | 6 (0.6%) | 55 (5.2%) |
| 18 to 34 Years | 0 (0.0%) | 7 (0.7%) |
| 35 to 64 Years | 71 (4.2%) | 234 (10.4%) |
| 65 to 74 Years | 137 (19.3%) | 264 (33.2%) |
| 75 Years and over | 156 (41.7%) | 198 (37.6%) |
Disability Class: Self-Care Difficulty
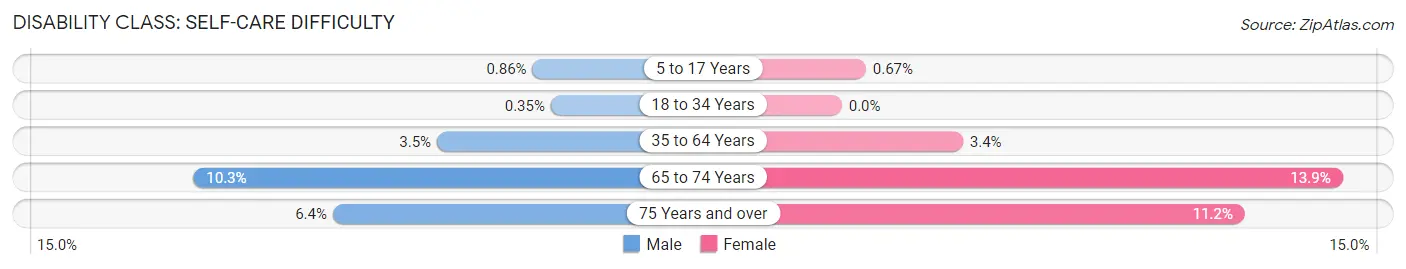
| Age Bracket | Male | Female |
| 5 to 17 Years | 9 (0.9%) | 7 (0.7%) |
| 18 to 34 Years | 3 (0.4%) | 0 (0.0%) |
| 35 to 64 Years | 59 (3.5%) | 76 (3.4%) |
| 65 to 74 Years | 73 (10.3%) | 111 (13.9%) |
| 75 Years and over | 24 (6.4%) | 59 (11.2%) |
Technology Access in Hamilton County
Computing Device Access in Hamilton County
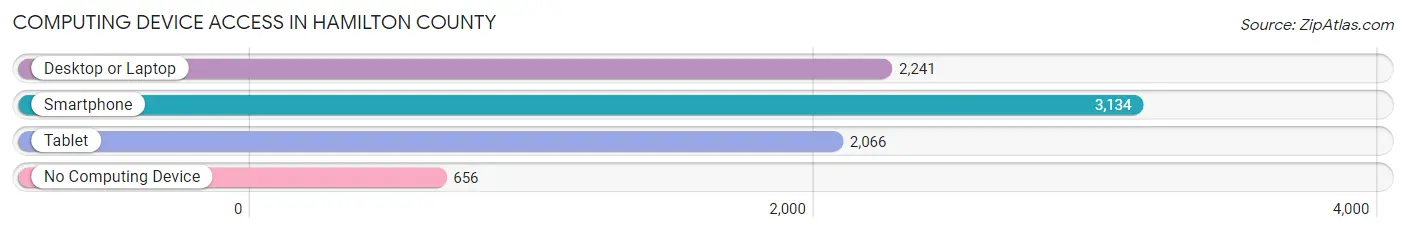
| Device Type | # Households | % Households |
| Desktop or Laptop | 2,241 | 52.1% |
| Smartphone | 3,134 | 72.9% |
| Tablet | 2,066 | 48.0% |
| No Computing Device | 656 | 15.3% |
| Total | 4,300 | 100.0% |
Internet Access in Hamilton County
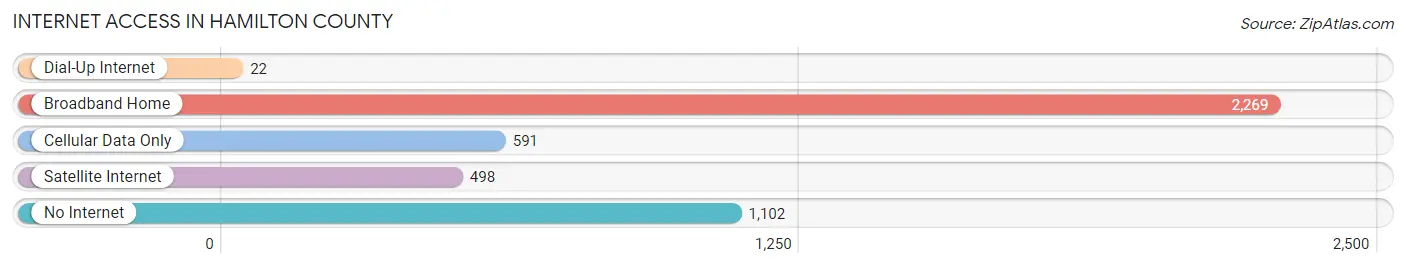
| Internet Type | # Households | % Households |
| Dial-Up Internet | 22 | 0.5% |
| Broadband Home | 2,269 | 52.8% |
| Cellular Data Only | 591 | 13.7% |
| Satellite Internet | 498 | 11.6% |
| No Internet | 1,102 | 25.6% |
| Total | 4,300 | 100.0% |
Hamilton County Summary
Hamilton County is located in the north-central part of the state of Florida, in the United States. It is bordered by Madison County to the north, Suwannee County to the east, Columbia County to the south, and Lafayette County to the west. The county seat is Jasper, and the largest city is Jennings. The county was created in 1827 and named for Alexander Hamilton, the first Secretary of the Treasury.
Geography
Hamilton County covers an area of 545 square miles, of which 543 square miles is land and 2 square miles (0.4%) is water. The county is located in the Suwannee River Valley, and is part of the Big Bend region of Florida. The terrain is mostly flat, with some rolling hills in the northern part of the county. The highest point in the county is the summit of Pine Hill, at an elevation of 140 feet.
The county is home to several rivers and streams, including the Suwannee River, the Withlacoochee River, the Alapaha River, and the Little River. There are also several lakes in the county, including Lake Hamilton, Lake City, and Lake Iamonia.
Climate
Hamilton County has a humid subtropical climate, with hot, humid summers and mild winters. The average annual temperature is 68°F, and the average annual precipitation is 54 inches.
Demographics
As of the 2010 census, there were 14,636 people, 5,717 households, and 3,945 families living in the county. The population density was 27 people per square mile. The racial makeup of the county was 73.3% White, 22.2% African American, 0.4% Native American, 0.3% Asian, 0.1% Pacific Islander, 2.3% from other races, and 1.4% from two or more races. Hispanic or Latino of any race were 5.2% of the population.
The median income for a household in the county was $30,917, and the median income for a family was $37,917. The per capita income for the county was $15,917. About 19.3% of the population was below the poverty line.
Economy
The economy of Hamilton County is largely based on agriculture and forestry. The county is home to several large timber companies, and the timber industry is the largest employer in the county. Other major industries include cattle ranching, poultry farming, and vegetable farming.
The county is also home to several small businesses, including restaurants, retail stores, and service providers. The county is served by two hospitals, Hamilton Medical Center and Suwannee Valley Medical Center.
Conclusion
Hamilton County is a rural county located in the north-central part of the state of Florida. It is home to several rivers and streams, and is part of the Big Bend region of Florida. The county has a humid subtropical climate, with hot, humid summers and mild winters. The population of the county is largely white, with a significant African American population. The economy of the county is largely based on agriculture and forestry, and the timber industry is the largest employer in the county. The county is also home to several small businesses, and is served by two hospitals.
Common Questions
What is Per Capita Income in Hamilton County?
Per Capita income in Hamilton County is $17,331.
What is the Median Family Income in Hamilton County?
Median Family Income in Hamilton County is $52,202.
What is the Median Household income in Hamilton County?
Median Household Income in Hamilton County is $47,668.
What is Income or Wage Gap in Hamilton County?
Income or Wage Gap in Hamilton County is 9.7%.
Women in Hamilton County earn 90.3 cents for every dollar earned by a man.
What is Family Income Deficit in Hamilton County?
Family Income Deficit in Hamilton County is $12,131.
Families that are below poverty line in Hamilton County earn $12,131 less on average than the poverty threshold level.
What is Inequality or Gini Index in Hamilton County?
Inequality or Gini Index in Hamilton County is 0.43.
What is the Total Population of Hamilton County?
Total Population of Hamilton County is 13,492.
What is the Total Male Population of Hamilton County?
Total Male Population of Hamilton County is 7,721.
What is the Total Female Population of Hamilton County?
Total Female Population of Hamilton County is 5,771.
What is the Ratio of Males per 100 Females in Hamilton County?
There are 133.79 Males per 100 Females in Hamilton County.
What is the Ratio of Females per 100 Males in Hamilton County?
There are 74.74 Females per 100 Males in Hamilton County.
What is the Median Population Age in Hamilton County?
Median Population Age in Hamilton County is 41.8 Years.
What is the Average Family Size in Hamilton County
Average Family Size in Hamilton County is 2.8 People.
What is the Average Household Size in Hamilton County
Average Household Size in Hamilton County is 2.5 People.
How Large is the Labor Force in Hamilton County?
There are 4,058 People in the Labor Forcein in Hamilton County.
What is the Percentage of People in the Labor Force in Hamilton County?
36.6% of People are in the Labor Force in Hamilton County.
What is the Unemployment Rate in Hamilton County?
Unemployment Rate in Hamilton County is 9.2%.