Gulf County, FL Map & Demographics
Gulf County Overview
$30,011
PER CAPITA INCOME
$70,654
AVG FAMILY INCOME
$56,250
AVG HOUSEHOLD INCOME
24.7%
WAGE / INCOME GAP [ % ]
75.3¢/ $1
WAGE / INCOME GAP [ $ ]
$10,440
FAMILY INCOME DEFICIT
0.45
INEQUALITY / GINI INDEX
15,002
TOTAL POPULATION
8,629
MALE POPULATION
6,373
FEMALE POPULATION
135.40
MALES / 100 FEMALES
73.86
FEMALES / 100 MALES
46.5
MEDIAN AGE
2.7
AVG FAMILY SIZE
2.2
AVG HOUSEHOLD SIZE
5,536
LABOR FORCE [ PEOPLE ]
42.4%
PERCENT IN LABOR FORCE
4.3%
UNEMPLOYMENT RATE
Gulf County Area Codes
Income in Gulf County
Income Overview in Gulf County
Per Capita Income in Gulf County is $30,011, while median incomes of families and households are $70,654 and $56,250 respectively.
| Characteristic | Number | Measure |
| Per Capita Income | 15,002 | $30,011 |
| Median Family Income | 3,717 | $70,654 |
| Mean Family Income | 3,717 | $92,966 |
| Median Household Income | 5,648 | $56,250 |
| Mean Household Income | 5,648 | $79,013 |
| Income Deficit | 3,717 | $10,440 |
| Wage / Income Gap (%) | 15,002 | 24.72% |
| Wage / Income Gap ($) | 15,002 | 75.28¢ per $1 |
| Gini / Inequality Index | 15,002 | 0.45 |
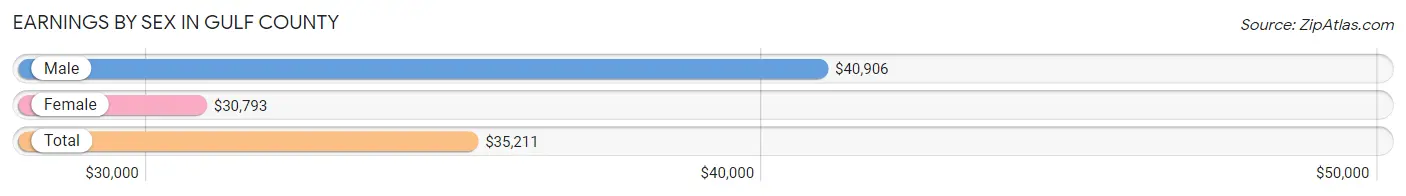
Earnings by Sex in Gulf County
Average Earnings in Gulf County are $35,211, $40,906 for men and $30,793 for women, a difference of 24.7%.
| Sex | Number | Average Earnings |
| Male | 3,363 (54.5%) | $40,906 |
| Female | 2,811 (45.5%) | $30,793 |
| Total | 6,174 (100.0%) | $35,211 |
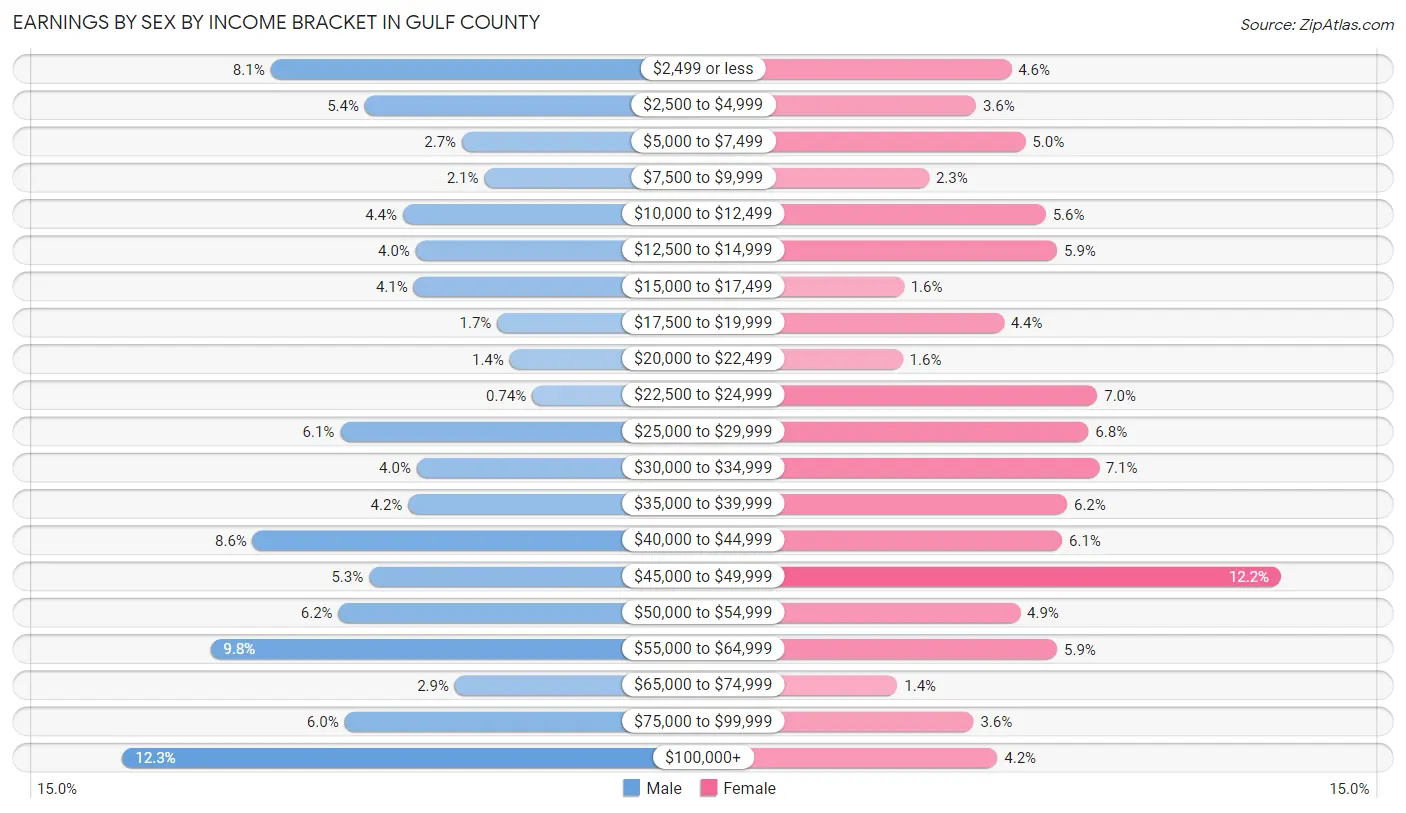
Earnings by Sex by Income Bracket in Gulf County
The most common earnings brackets in Gulf County are $100,000+ for men (412 | 12.2%) and $45,000 to $49,999 for women (343 | 12.2%).
| Income | Male | Female |
| $2,499 or less | 272 (8.1%) | 130 (4.6%) |
| $2,500 to $4,999 | 183 (5.4%) | 102 (3.6%) |
| $5,000 to $7,499 | 91 (2.7%) | 141 (5.0%) |
| $7,500 to $9,999 | 70 (2.1%) | 65 (2.3%) |
| $10,000 to $12,499 | 147 (4.4%) | 157 (5.6%) |
| $12,500 to $14,999 | 135 (4.0%) | 166 (5.9%) |
| $15,000 to $17,499 | 137 (4.1%) | 45 (1.6%) |
| $17,500 to $19,999 | 58 (1.7%) | 124 (4.4%) |
| $20,000 to $22,499 | 46 (1.4%) | 44 (1.6%) |
| $22,500 to $24,999 | 25 (0.7%) | 198 (7.0%) |
| $25,000 to $29,999 | 206 (6.1%) | 191 (6.8%) |
| $30,000 to $34,999 | 134 (4.0%) | 199 (7.1%) |
| $35,000 to $39,999 | 142 (4.2%) | 174 (6.2%) |
| $40,000 to $44,999 | 289 (8.6%) | 170 (6.0%) |
| $45,000 to $49,999 | 179 (5.3%) | 343 (12.2%) |
| $50,000 to $54,999 | 208 (6.2%) | 137 (4.9%) |
| $55,000 to $64,999 | 329 (9.8%) | 166 (5.9%) |
| $65,000 to $74,999 | 98 (2.9%) | 40 (1.4%) |
| $75,000 to $99,999 | 202 (6.0%) | 100 (3.6%) |
| $100,000+ | 412 (12.2%) | 119 (4.2%) |
| Total | 3,363 (100.0%) | 2,811 (100.0%) |
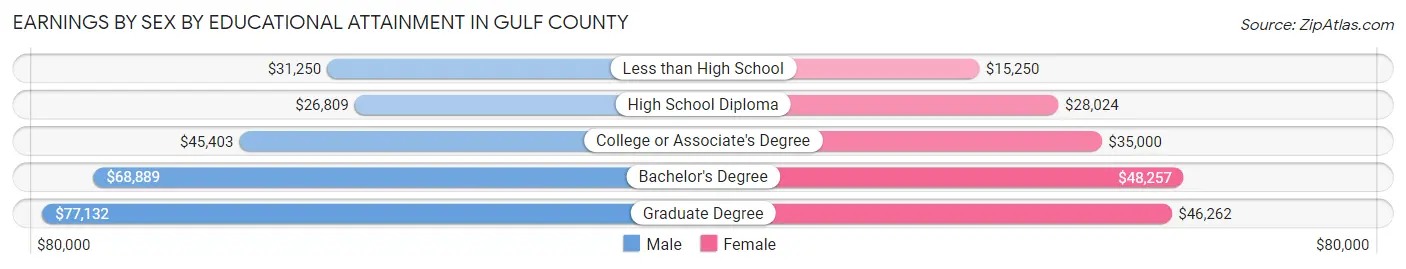
Earnings by Sex by Educational Attainment in Gulf County
Average earnings in Gulf County are $43,388 for men and $34,623 for women, a difference of 20.2%. Men with an educational attainment of graduate degree enjoy the highest average annual earnings of $77,132, while those with high school diploma education earn the least with $26,809. Women with an educational attainment of bachelor's degree earn the most with the average annual earnings of $48,257, while those with less than high school education have the smallest earnings of $15,250.
| Educational Attainment | Male Income | Female Income |
| Less than High School | $31,250 | $15,250 |
| High School Diploma | $26,809 | $28,024 |
| College or Associate's Degree | $45,403 | $35,000 |
| Bachelor's Degree | $68,889 | $48,257 |
| Graduate Degree | $77,132 | $46,262 |
| Total | $43,388 | $34,623 |
Family Income in Gulf County
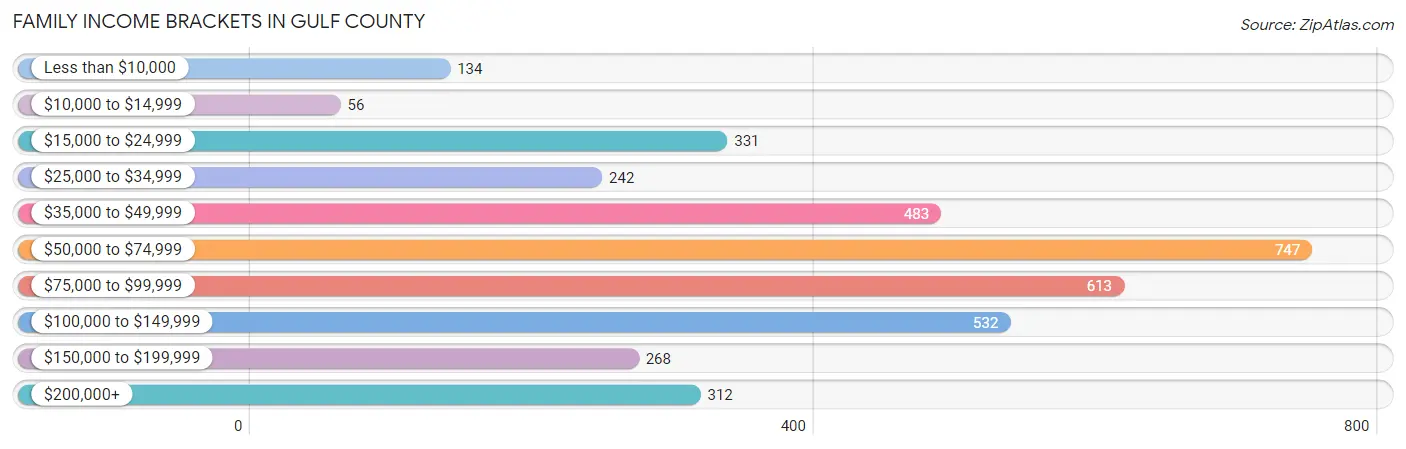
Family Income Brackets in Gulf County
According to the Gulf County family income data, there are 747 families falling into the $50,000 to $74,999 income range, which is the most common income bracket and makes up 20.1% of all families. Conversely, the $10,000 to $14,999 income bracket is the least frequent group with only 56 families (1.5%) belonging to this category.
| Income Bracket | # Families | % Families |
| Less than $10,000 | 134 | 3.6% |
| $10,000 to $14,999 | 56 | 1.5% |
| $15,000 to $24,999 | 331 | 8.9% |
| $25,000 to $34,999 | 242 | 6.5% |
| $35,000 to $49,999 | 483 | 13.0% |
| $50,000 to $74,999 | 747 | 20.1% |
| $75,000 to $99,999 | 613 | 16.5% |
| $100,000 to $149,999 | 532 | 14.3% |
| $150,000 to $199,999 | 268 | 7.2% |
| $200,000+ | 312 | 8.4% |
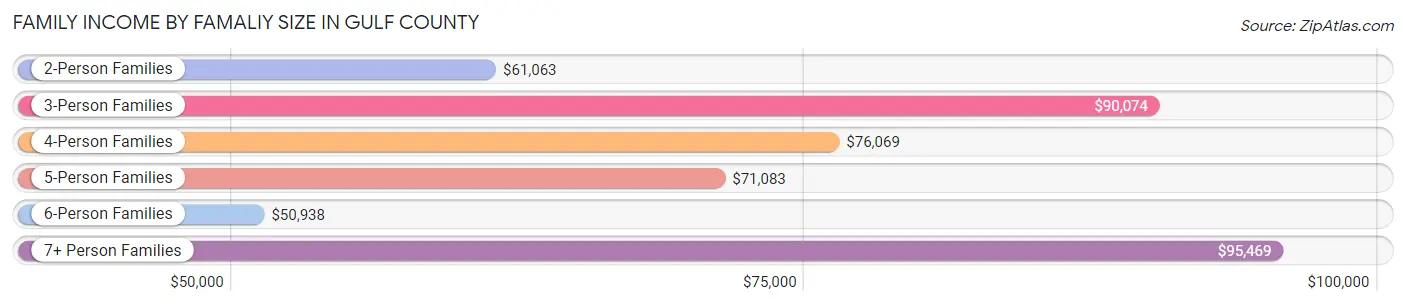
Family Income by Famaliy Size in Gulf County
7+ person families (73 | 2.0%) account for the highest median family income in Gulf County with $95,469 per family, while 2-person families (2,149 | 57.8%) have the highest median income of $30,532 per family member.
| Income Bracket | # Families | Median Income |
| 2-Person Families | 2,149 (57.8%) | $61,063 |
| 3-Person Families | 770 (20.7%) | $90,074 |
| 4-Person Families | 519 (14.0%) | $76,069 |
| 5-Person Families | 165 (4.4%) | $71,083 |
| 6-Person Families | 41 (1.1%) | $50,938 |
| 7+ Person Families | 73 (2.0%) | $95,469 |
| Total | 3,717 (100.0%) | $70,654 |
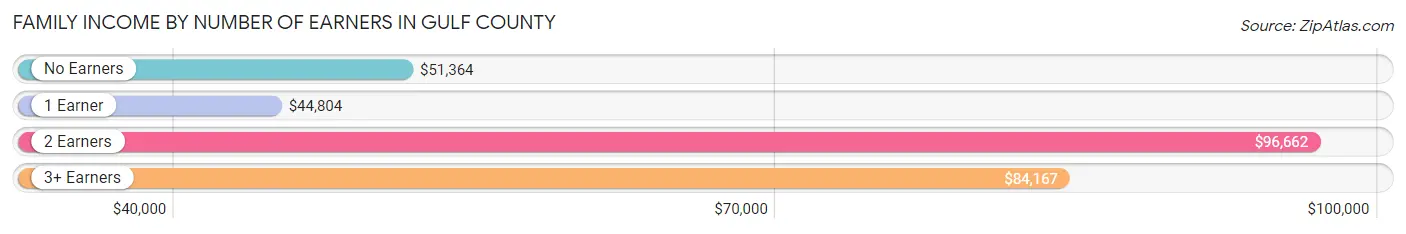
Family Income by Number of Earners in Gulf County
The median family income in Gulf County is $70,654, with families comprising 2 earners (1,543) having the highest median family income of $96,662, while families with 1 earner (1,016) have the lowest median family income of $44,804, accounting for 41.5% and 27.3% of families, respectively.
| Number of Earners | # Families | Median Income |
| No Earners | 988 (26.6%) | $51,364 |
| 1 Earner | 1,016 (27.3%) | $44,804 |
| 2 Earners | 1,543 (41.5%) | $96,662 |
| 3+ Earners | 170 (4.6%) | $84,167 |
| Total | 3,717 (100.0%) | $70,654 |
Household Income in Gulf County
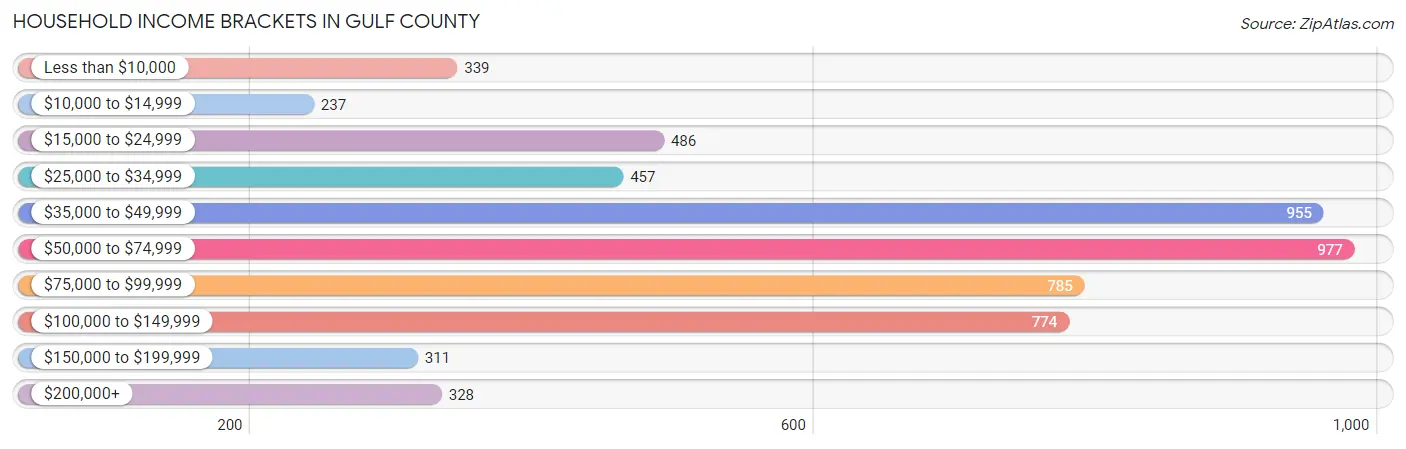
Household Income Brackets in Gulf County
With 977 households falling in the category, the $50,000 to $74,999 income range is the most frequent in Gulf County, accounting for 17.3% of all households. In contrast, only 237 households (4.2%) fall into the $10,000 to $14,999 income bracket, making it the least populous group.
| Income Bracket | # Households | % Households |
| Less than $10,000 | 339 | 6.0% |
| $10,000 to $14,999 | 237 | 4.2% |
| $15,000 to $24,999 | 486 | 8.6% |
| $25,000 to $34,999 | 457 | 8.1% |
| $35,000 to $49,999 | 955 | 16.9% |
| $50,000 to $74,999 | 977 | 17.3% |
| $75,000 to $99,999 | 785 | 13.9% |
| $100,000 to $149,999 | 774 | 13.7% |
| $150,000 to $199,999 | 311 | 5.5% |
| $200,000+ | 328 | 5.8% |
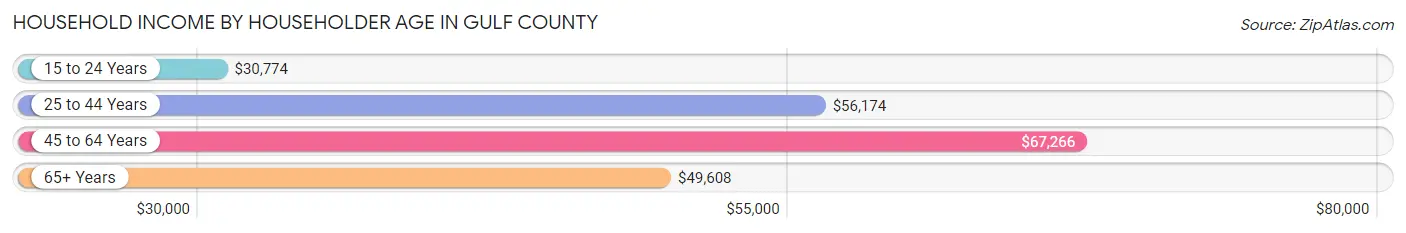
Household Income by Householder Age in Gulf County
The median household income in Gulf County is $56,250, with the highest median household income of $67,266 found in the 45 to 64 years age bracket for the primary householder. A total of 2,221 households (39.3%) fall into this category. Meanwhile, the 15 to 24 years age bracket for the primary householder has the lowest median household income of $30,774, with 211 households (3.7%) in this group.
| Income Bracket | # Households | Median Income |
| 15 to 24 Years | 211 (3.7%) | $30,774 |
| 25 to 44 Years | 1,221 (21.6%) | $56,174 |
| 45 to 64 Years | 2,221 (39.3%) | $67,266 |
| 65+ Years | 1,995 (35.3%) | $49,608 |
| Total | 5,648 (100.0%) | $56,250 |
Poverty in Gulf County
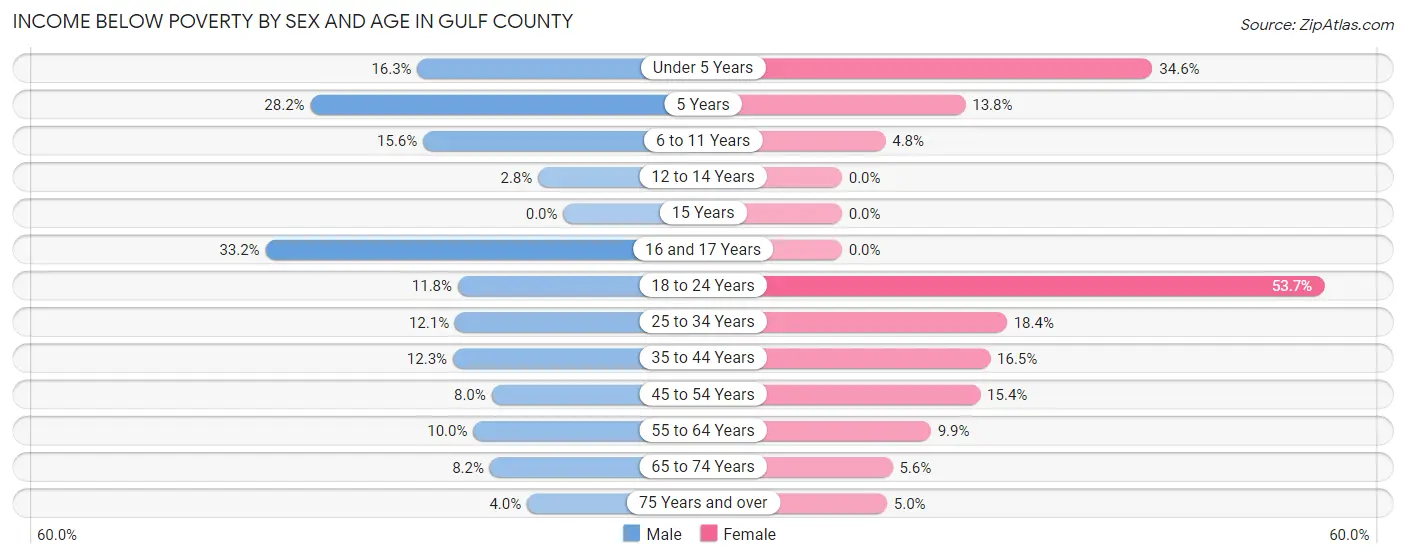
Income Below Poverty by Sex and Age in Gulf County
With 10.7% poverty level for males and 13.9% for females among the residents of Gulf County, 16 and 17 year old males and 18 to 24 year old females are the most vulnerable to poverty, with 70 males (33.2%) and 189 females (53.7%) in their respective age groups living below the poverty level.
| Age Bracket | Male | Female |
| Under 5 Years | 46 (16.3%) | 101 (34.6%) |
| 5 Years | 20 (28.2%) | 11 (13.8%) |
| 6 to 11 Years | 60 (15.6%) | 20 (4.8%) |
| 12 to 14 Years | 5 (2.8%) | 0 (0.0%) |
| 15 Years | 0 (0.0%) | 0 (0.0%) |
| 16 and 17 Years | 70 (33.2%) | 0 (0.0%) |
| 18 to 24 Years | 49 (11.7%) | 189 (53.7%) |
| 25 to 34 Years | 60 (12.1%) | 113 (18.4%) |
| 35 to 44 Years | 70 (12.3%) | 113 (16.5%) |
| 45 to 54 Years | 59 (8.0%) | 116 (15.4%) |
| 55 to 64 Years | 103 (10.0%) | 114 (9.9%) |
| 65 to 74 Years | 88 (8.2%) | 59 (5.6%) |
| 75 Years and over | 24 (4.0%) | 32 (5.0%) |
| Total | 654 (10.7%) | 868 (13.9%) |
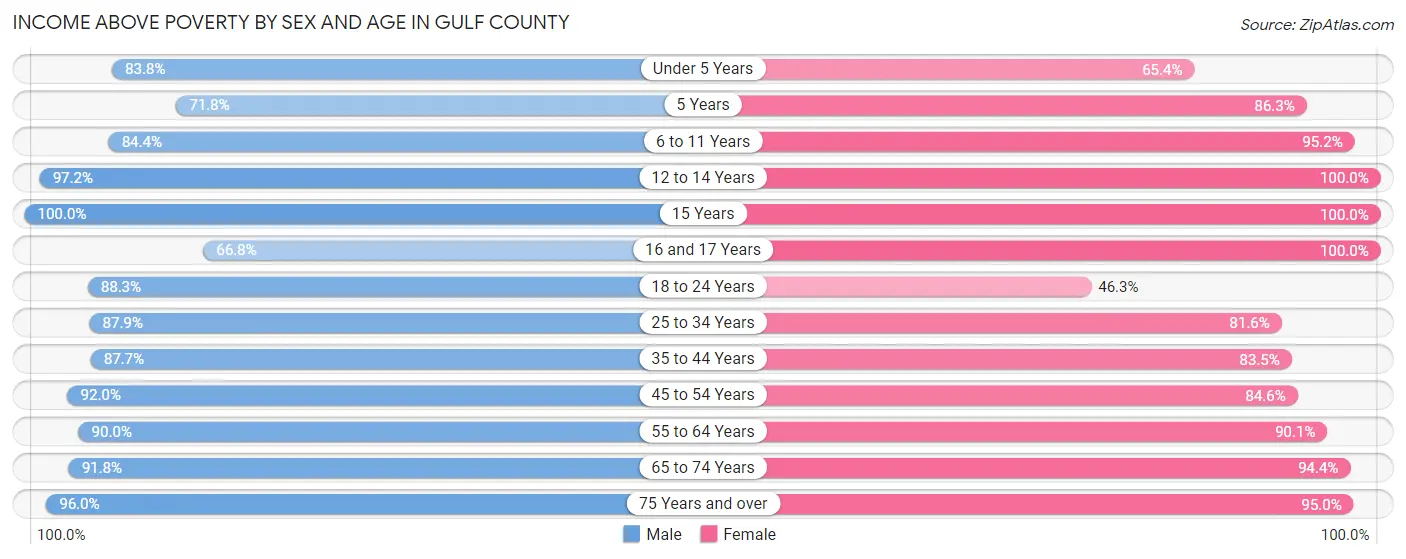
Income Above Poverty by Sex and Age in Gulf County
According to the poverty statistics in Gulf County, males aged 15 years and females aged 12 to 14 years are the age groups that are most secure financially, with 100.0% of males and 100.0% of females in these age groups living above the poverty line.
| Age Bracket | Male | Female |
| Under 5 Years | 237 (83.8%) | 191 (65.4%) |
| 5 Years | 51 (71.8%) | 69 (86.3%) |
| 6 to 11 Years | 324 (84.4%) | 393 (95.2%) |
| 12 to 14 Years | 173 (97.2%) | 126 (100.0%) |
| 15 Years | 38 (100.0%) | 34 (100.0%) |
| 16 and 17 Years | 141 (66.8%) | 83 (100.0%) |
| 18 to 24 Years | 368 (88.2%) | 163 (46.3%) |
| 25 to 34 Years | 437 (87.9%) | 502 (81.6%) |
| 35 to 44 Years | 499 (87.7%) | 571 (83.5%) |
| 45 to 54 Years | 679 (92.0%) | 637 (84.6%) |
| 55 to 64 Years | 924 (90.0%) | 1,038 (90.1%) |
| 65 to 74 Years | 986 (91.8%) | 988 (94.4%) |
| 75 Years and over | 570 (96.0%) | 605 (95.0%) |
| Total | 5,427 (89.2%) | 5,400 (86.2%) |
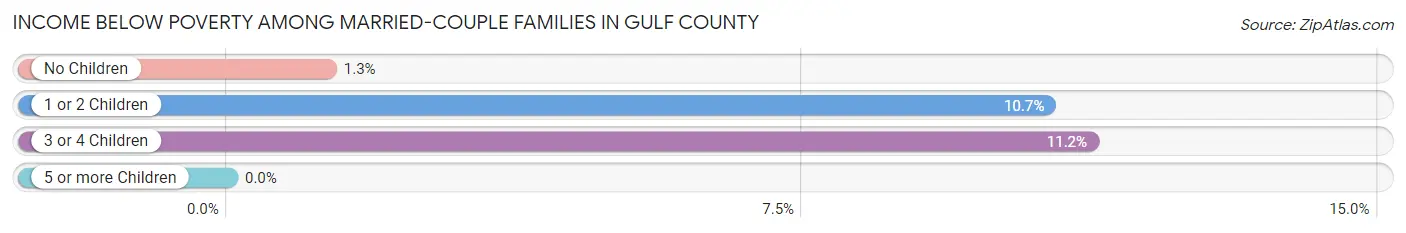
Income Below Poverty Among Married-Couple Families in Gulf County
The poverty statistics for married-couple families in Gulf County show that 4.3% or 122 of the total 2,858 families live below the poverty line. Families with 3 or 4 children have the highest poverty rate of 11.2%, comprising of 19 families. On the other hand, families with 5 or more children have the lowest poverty rate of 0.0%, which includes 0 families.
| Children | Above Poverty | Below Poverty |
| No Children | 1,912 (98.7%) | 25 (1.3%) |
| 1 or 2 Children | 652 (89.3%) | 78 (10.7%) |
| 3 or 4 Children | 150 (88.8%) | 19 (11.2%) |
| 5 or more Children | 22 (100.0%) | 0 (0.0%) |
| Total | 2,736 (95.7%) | 122 (4.3%) |
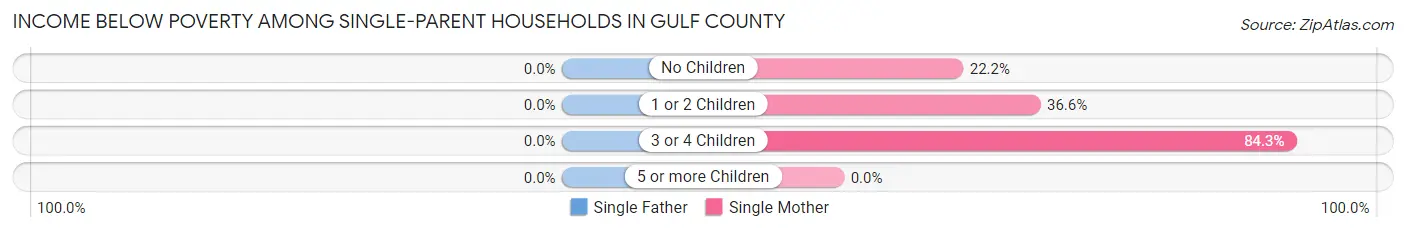
Income Below Poverty Among Single-Parent Households in Gulf County
| Children | Single Father | Single Mother |
| No Children | 0 (0.0%) | 69 (22.2%) |
| 1 or 2 Children | 0 (0.0%) | 109 (36.6%) |
| 3 or 4 Children | 0 (0.0%) | 59 (84.3%) |
| 5 or more Children | 0 (0.0%) | 0 (0.0%) |
| Total | 0 (0.0%) | 237 (34.9%) |
Income Below Poverty Among Married-Couple vs Single-Parent Households in Gulf County
The poverty data for Gulf County shows that 122 of the married-couple family households (4.3%) and 237 of the single-parent households (27.6%) are living below the poverty level. Within the married-couple family households, those with 3 or 4 children have the highest poverty rate, with 19 households (11.2%) falling below the poverty line. Among the single-parent households, those with 3 or 4 children have the highest poverty rate, with 59 household (84.3%) living below poverty.
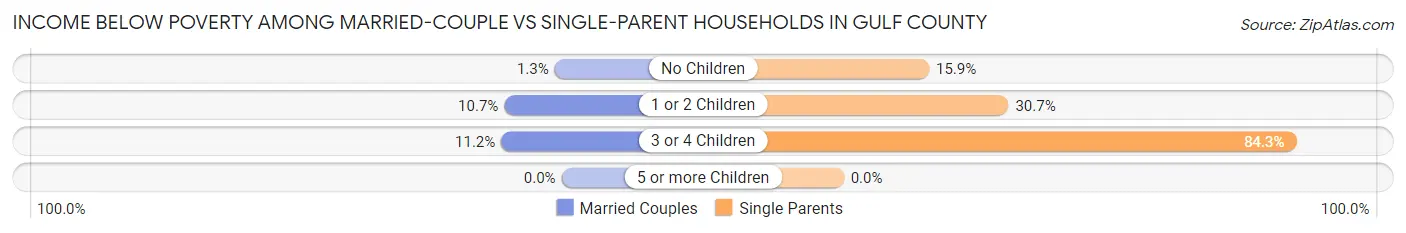
| Children | Married-Couple Families | Single-Parent Households |
| No Children | 25 (1.3%) | 69 (15.9%) |
| 1 or 2 Children | 78 (10.7%) | 109 (30.7%) |
| 3 or 4 Children | 19 (11.2%) | 59 (84.3%) |
| 5 or more Children | 0 (0.0%) | 0 (0.0%) |
| Total | 122 (4.3%) | 237 (27.6%) |
Race in Gulf County
The most populous races in Gulf County are White / Caucasian (11,878 | 79.2%), Black / African American (2,266 | 15.1%), and Two or more Races (595 | 4.0%).
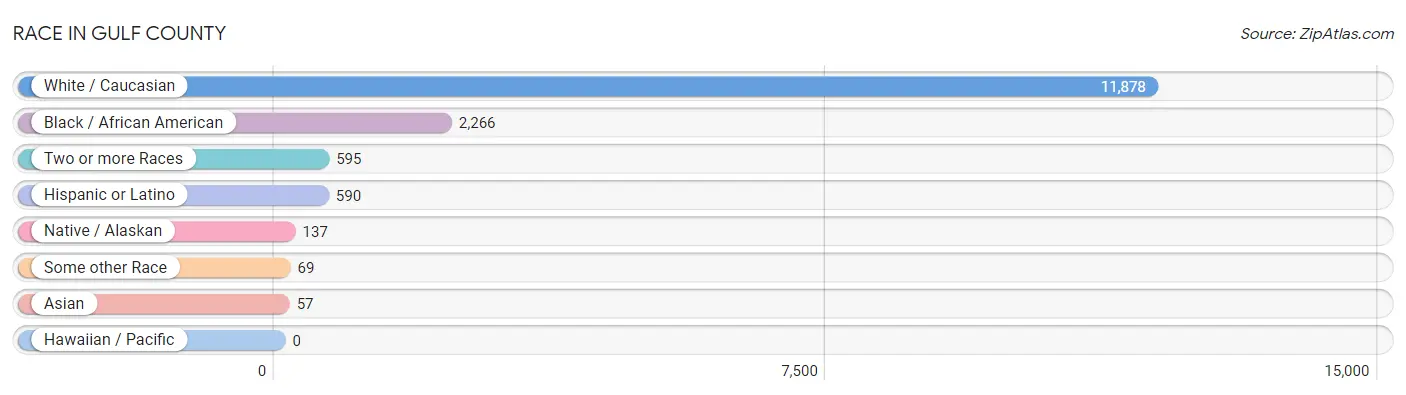
| Race | # Population | % Population |
| Asian | 57 | 0.4% |
| Black / African American | 2,266 | 15.1% |
| Hawaiian / Pacific | 0 | 0.0% |
| Hispanic or Latino | 590 | 3.9% |
| Native / Alaskan | 137 | 0.9% |
| White / Caucasian | 11,878 | 79.2% |
| Two or more Races | 595 | 4.0% |
| Some other Race | 69 | 0.5% |
| Total | 15,002 | 100.0% |
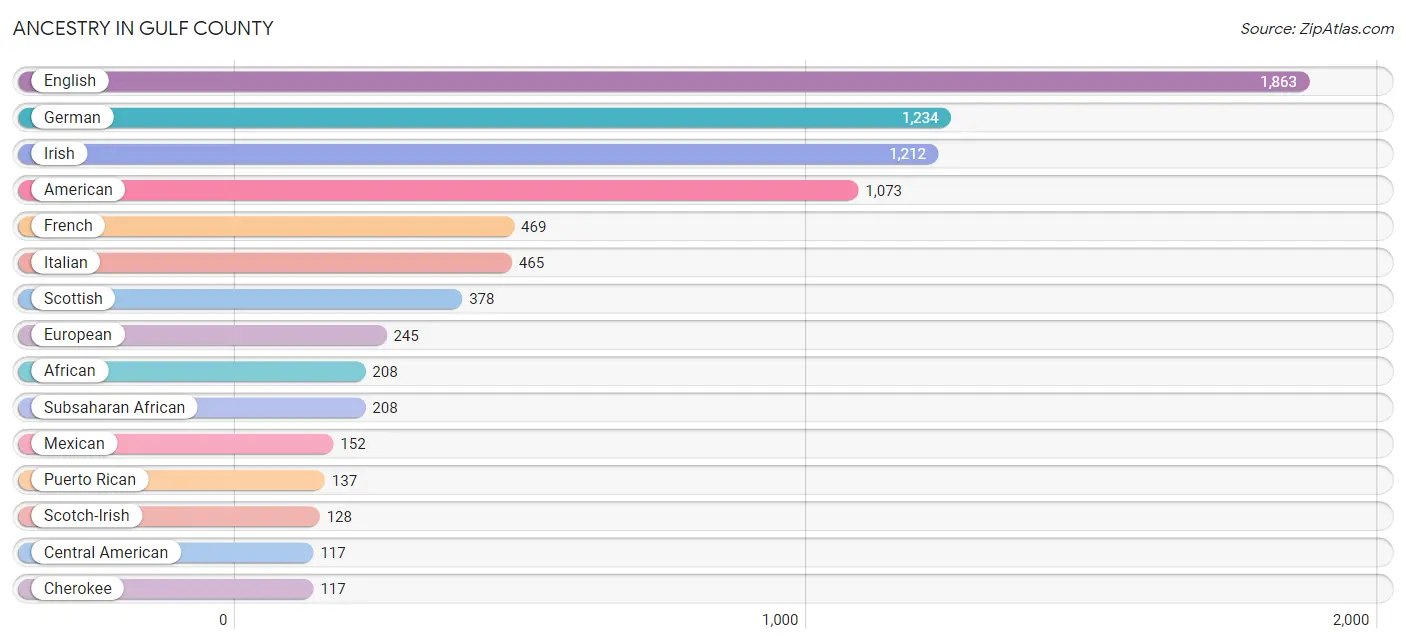
Ancestry in Gulf County
The most populous ancestries reported in Gulf County are English (1,863 | 12.4%), German (1,234 | 8.2%), Irish (1,212 | 8.1%), American (1,073 | 7.1%), and French (469 | 3.1%), together accounting for 39.0% of all Gulf County residents.
| Ancestry | # Population | % Population |
| African | 208 | 1.4% |
| American | 1,073 | 7.1% |
| Apache | 4 | 0.0% |
| Arab | 8 | 0.1% |
| Armenian | 7 | 0.1% |
| Austrian | 48 | 0.3% |
| Bahamian | 23 | 0.2% |
| Blackfeet | 20 | 0.1% |
| British | 95 | 0.6% |
| Burmese | 31 | 0.2% |
| Canadian | 22 | 0.2% |
| Celtic | 8 | 0.1% |
| Central American | 117 | 0.8% |
| Central American Indian | 86 | 0.6% |
| Cherokee | 117 | 0.8% |
| Colombian | 6 | 0.0% |
| Creek | 12 | 0.1% |
| Croatian | 4 | 0.0% |
| Cuban | 105 | 0.7% |
| Czech | 27 | 0.2% |
| Danish | 27 | 0.2% |
| Dominican | 1 | 0.0% |
| Dutch | 41 | 0.3% |
| Dutch West Indian | 27 | 0.2% |
| English | 1,863 | 12.4% |
| European | 245 | 1.6% |
| Finnish | 8 | 0.1% |
| French | 469 | 3.1% |
| French Canadian | 16 | 0.1% |
| German | 1,234 | 8.2% |
| Guatemalan | 41 | 0.3% |
| Haitian | 99 | 0.7% |
| Honduran | 33 | 0.2% |
| Hungarian | 19 | 0.1% |
| Irish | 1,212 | 8.1% |
| Israeli | 19 | 0.1% |
| Italian | 465 | 3.1% |
| Jamaican | 50 | 0.3% |
| Jordanian | 8 | 0.1% |
| Korean | 7 | 0.1% |
| Mexican | 152 | 1.0% |
| Nicaraguan | 36 | 0.2% |
| Northern European | 11 | 0.1% |
| Norwegian | 68 | 0.4% |
| Pennsylvania German | 13 | 0.1% |
| Peruvian | 2 | 0.0% |
| Polish | 94 | 0.6% |
| Portuguese | 31 | 0.2% |
| Puerto Rican | 137 | 0.9% |
| Russian | 63 | 0.4% |
| Salvadoran | 7 | 0.1% |
| Scandinavian | 34 | 0.2% |
| Scotch-Irish | 128 | 0.9% |
| Scottish | 378 | 2.5% |
| Seminole | 5 | 0.0% |
| South American | 18 | 0.1% |
| South American Indian | 19 | 0.1% |
| Soviet Union | 7 | 0.1% |
| Spaniard | 19 | 0.1% |
| Spanish | 27 | 0.2% |
| Subsaharan African | 208 | 1.4% |
| Swedish | 80 | 0.5% |
| Thai | 53 | 0.4% |
| Ukrainian | 9 | 0.1% |
| Venezuelan | 10 | 0.1% |
| Welsh | 102 | 0.7% |
| West Indian | 9 | 0.1% | View All 67 Rows |
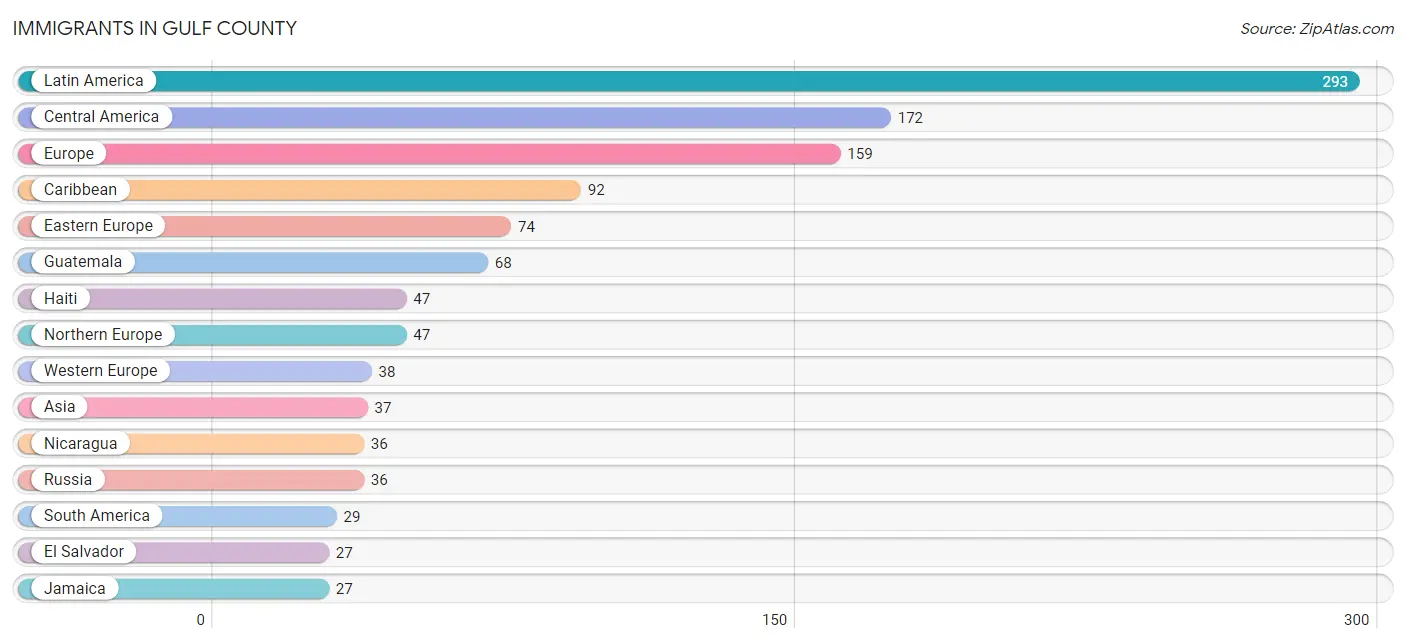
Immigrants in Gulf County
The most numerous immigrant groups reported in Gulf County came from Latin America (293 | 1.9%), Central America (172 | 1.1%), Europe (159 | 1.1%), Caribbean (92 | 0.6%), and Eastern Europe (74 | 0.5%), together accounting for 5.3% of all Gulf County residents.
| Immigration Origin | # Population | % Population |
| Africa | 5 | 0.0% |
| Asia | 37 | 0.3% |
| Austria | 21 | 0.1% |
| Bangladesh | 5 | 0.0% |
| Brazil | 11 | 0.1% |
| Canada | 22 | 0.2% |
| Caribbean | 92 | 0.6% |
| Central America | 172 | 1.1% |
| Colombia | 6 | 0.0% |
| Cuba | 14 | 0.1% |
| Eastern Europe | 74 | 0.5% |
| El Salvador | 27 | 0.2% |
| Europe | 159 | 1.1% |
| Germany | 17 | 0.1% |
| Ghana | 5 | 0.0% |
| Guatemala | 68 | 0.4% |
| Haiti | 47 | 0.3% |
| Honduras | 24 | 0.2% |
| Hungary | 6 | 0.0% |
| India | 12 | 0.1% |
| Israel | 5 | 0.0% |
| Jamaica | 27 | 0.2% |
| Jordan | 8 | 0.1% |
| Latin America | 293 | 1.9% |
| Mexico | 17 | 0.1% |
| Nicaragua | 36 | 0.2% |
| Northern Europe | 47 | 0.3% |
| Peru | 2 | 0.0% |
| Philippines | 7 | 0.1% |
| Poland | 25 | 0.2% |
| Russia | 36 | 0.2% |
| South America | 29 | 0.2% |
| South Central Asia | 17 | 0.1% |
| South Eastern Asia | 7 | 0.1% |
| Venezuela | 10 | 0.1% |
| West Indies | 4 | 0.0% |
| Western Africa | 5 | 0.0% |
| Western Asia | 13 | 0.1% |
| Western Europe | 38 | 0.3% | View All 39 Rows |
Sex and Age in Gulf County
Sex and Age in Gulf County
The most populous age groups in Gulf County are 35 to 39 Years (840 | 9.7%) for men and 65 to 69 Years (611 | 9.6%) for women.
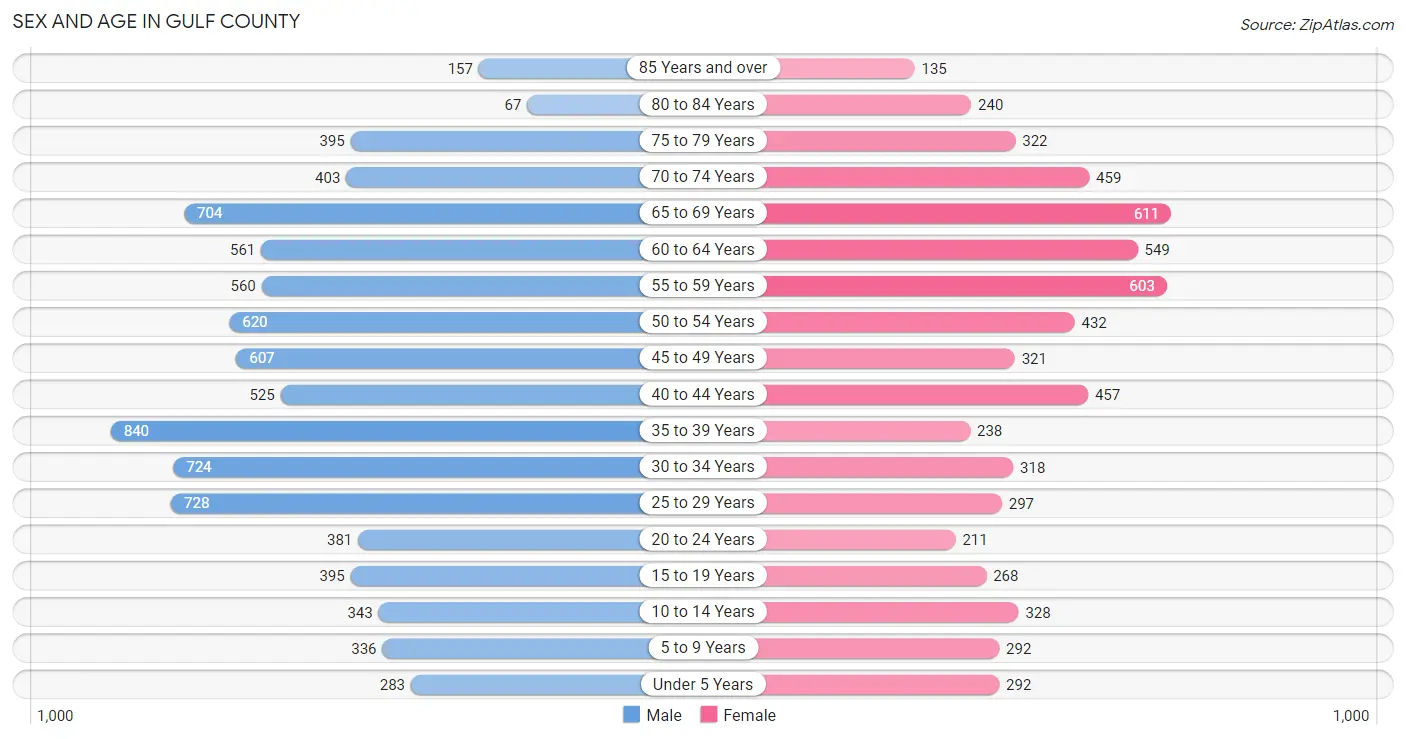
| Age Bracket | Male | Female |
| Under 5 Years | 283 (3.3%) | 292 (4.6%) |
| 5 to 9 Years | 336 (3.9%) | 292 (4.6%) |
| 10 to 14 Years | 343 (4.0%) | 328 (5.1%) |
| 15 to 19 Years | 395 (4.6%) | 268 (4.2%) |
| 20 to 24 Years | 381 (4.4%) | 211 (3.3%) |
| 25 to 29 Years | 728 (8.4%) | 297 (4.7%) |
| 30 to 34 Years | 724 (8.4%) | 318 (5.0%) |
| 35 to 39 Years | 840 (9.7%) | 238 (3.7%) |
| 40 to 44 Years | 525 (6.1%) | 457 (7.2%) |
| 45 to 49 Years | 607 (7.0%) | 321 (5.0%) |
| 50 to 54 Years | 620 (7.2%) | 432 (6.8%) |
| 55 to 59 Years | 560 (6.5%) | 603 (9.5%) |
| 60 to 64 Years | 561 (6.5%) | 549 (8.6%) |
| 65 to 69 Years | 704 (8.2%) | 611 (9.6%) |
| 70 to 74 Years | 403 (4.7%) | 459 (7.2%) |
| 75 to 79 Years | 395 (4.6%) | 322 (5.1%) |
| 80 to 84 Years | 67 (0.8%) | 240 (3.8%) |
| 85 Years and over | 157 (1.8%) | 135 (2.1%) |
| Total | 8,629 (100.0%) | 6,373 (100.0%) |
Families and Households in Gulf County
Median Family Size in Gulf County
The median family size in Gulf County is 2.67 persons per family, with married-couple families (2,858 | 76.9%) accounting for the largest median family size of 2.81 persons per family. On the other hand, single male/father families (180 | 4.8%) represent the smallest median family size with 2.01 persons per family.
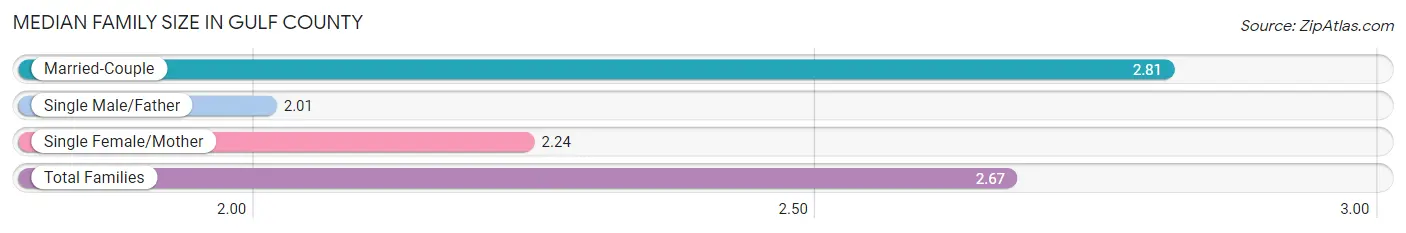
| Family Type | # Families | Family Size |
| Married-Couple | 2,858 (76.9%) | 2.81 |
| Single Male/Father | 180 (4.8%) | 2.01 |
| Single Female/Mother | 679 (18.3%) | 2.24 |
| Total Families | 3,717 (100.0%) | 2.67 |
Median Household Size in Gulf County
The median household size in Gulf County is 2.19 persons per household, with married-couple households (2,858 | 50.6%) accounting for the largest median household size of 2.81 persons per household. non-family households (1,931 | 34.2%) represent the smallest median household size with 1.21 persons per household.
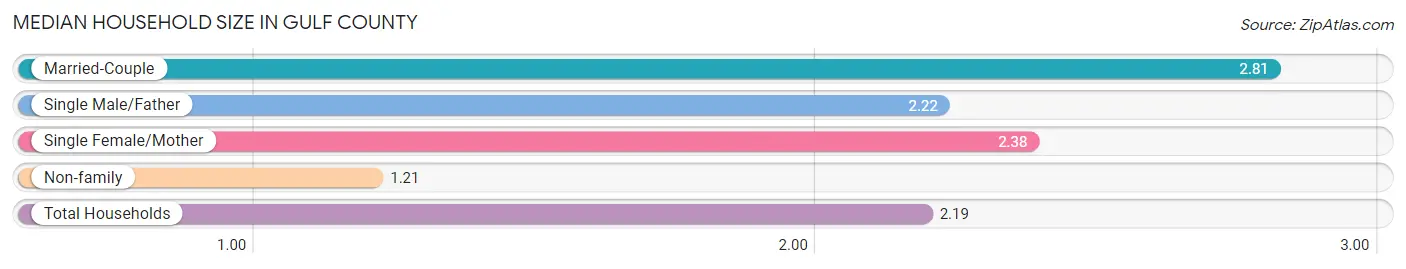
| Household Type | # Households | Household Size |
| Married-Couple | 2,858 (50.6%) | 2.81 |
| Single Male/Father | 180 (3.2%) | 2.22 |
| Single Female/Mother | 679 (12.0%) | 2.38 |
| Non-family | 1,931 (34.2%) | 1.21 |
| Total Households | 5,648 (100.0%) | 2.19 |
Household Size by Marriage Status in Gulf County
Out of a total of 5,648 households in Gulf County, 3,717 (65.8%) are family households, while 1,931 (34.2%) are nonfamily households. The most numerous type of family households are 2-person households, comprising 2,044, and the most common type of nonfamily households are 1-person households, comprising 1,568.
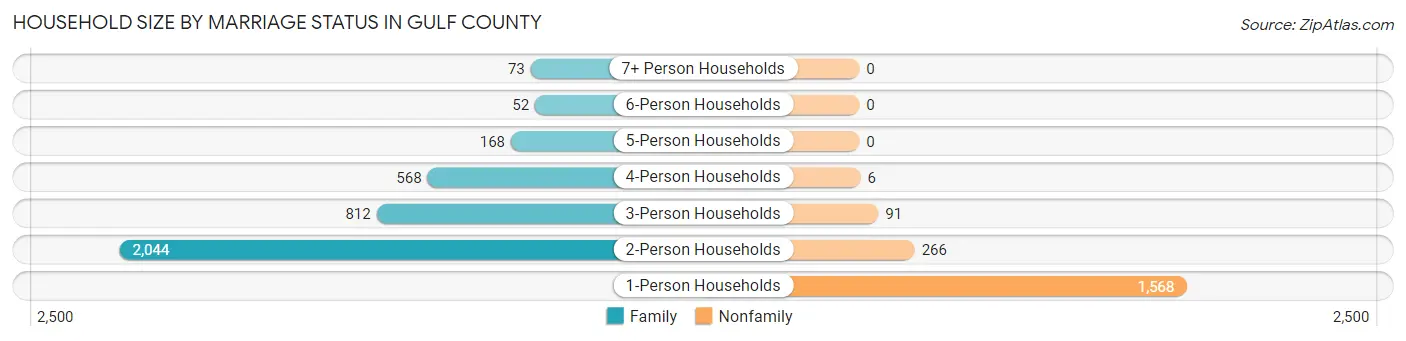
| Household Size | Family Households | Nonfamily Households |
| 1-Person Households | - | 1,568 (27.8%) |
| 2-Person Households | 2,044 (36.2%) | 266 (4.7%) |
| 3-Person Households | 812 (14.4%) | 91 (1.6%) |
| 4-Person Households | 568 (10.1%) | 6 (0.1%) |
| 5-Person Households | 168 (3.0%) | 0 (0.0%) |
| 6-Person Households | 52 (0.9%) | 0 (0.0%) |
| 7+ Person Households | 73 (1.3%) | 0 (0.0%) |
| Total | 3,717 (65.8%) | 1,931 (34.2%) |
Female Fertility in Gulf County
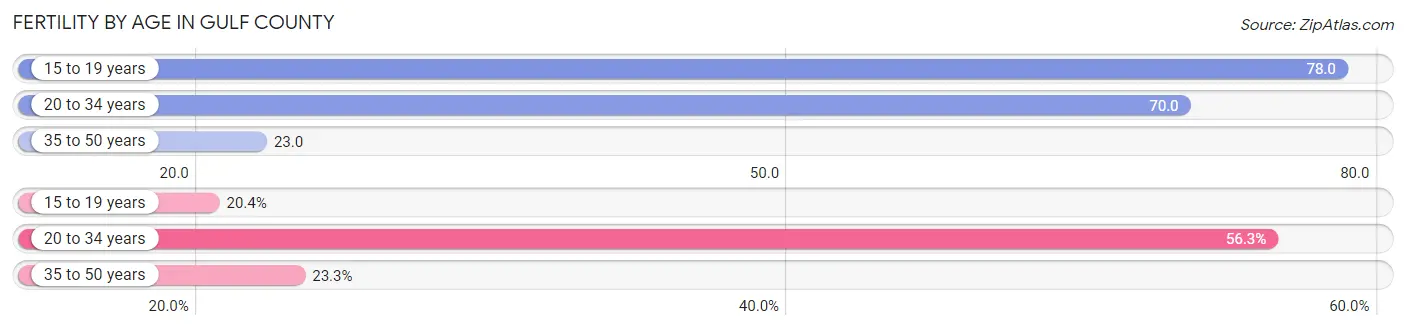
Fertility by Age in Gulf County
Average fertility rate in Gulf County is 48.0 births per 1,000 women. Women in the age bracket of 15 to 19 years have the highest fertility rate with 78.0 births per 1,000 women. Women in the age bracket of 20 to 34 years acount for 56.3% of all women with births.
| Age Bracket | Women with Births | Births / 1,000 Women |
| 15 to 19 years | 21 (20.4%) | 78.0 |
| 20 to 34 years | 58 (56.3%) | 70.0 |
| 35 to 50 years | 24 (23.3%) | 23.0 |
| Total | 103 (100.0%) | 48.0 |
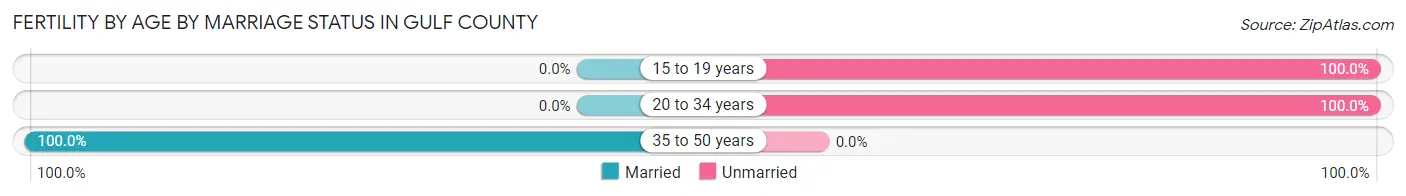
Fertility by Age by Marriage Status in Gulf County
23.3% of women with births (103) in Gulf County are married. The highest percentage of unmarried women with births falls into 15 to 19 years age bracket with 100.0% of them unmarried at the time of birth, while the lowest percentage of unmarried women with births belong to 35 to 50 years age bracket with 0.0% of them unmarried.
| Age Bracket | Married | Unmarried |
| 15 to 19 years | 0 (0.0%) | 21 (100.0%) |
| 20 to 34 years | 0 (0.0%) | 58 (100.0%) |
| 35 to 50 years | 24 (100.0%) | 0 (0.0%) |
| Total | 24 (23.3%) | 79 (76.7%) |
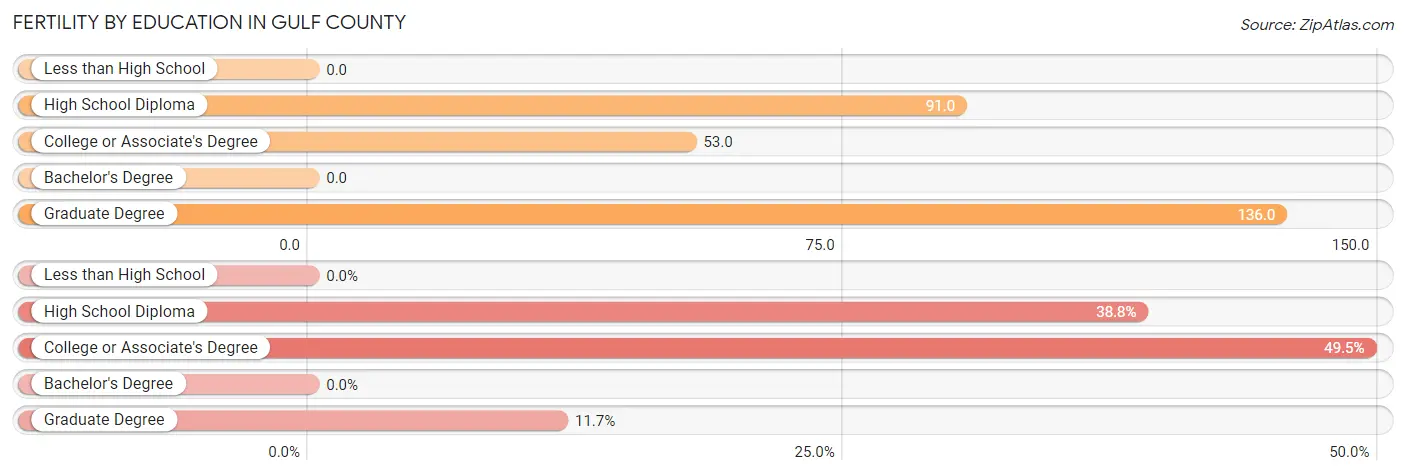
Fertility by Education in Gulf County
| Educational Attainment | Women with Births | Births / 1,000 Women |
| Less than High School | 0 (0.0%) | 0.0 |
| High School Diploma | 40 (38.8%) | 91.0 |
| College or Associate's Degree | 51 (49.5%) | 53.0 |
| Bachelor's Degree | 0 (0.0%) | 0.0 |
| Graduate Degree | 12 (11.7%) | 136.0 |
| Total | 103 (100.0%) | 48.0 |
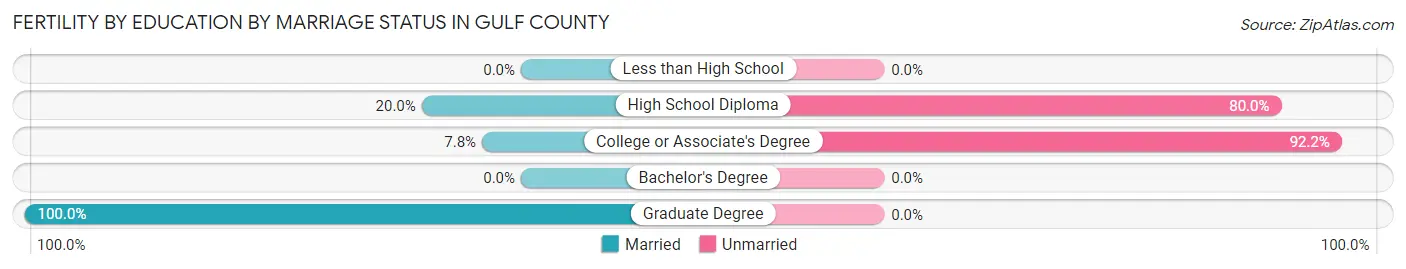
Fertility by Education by Marriage Status in Gulf County
76.7% of women with births in Gulf County are unmarried. Women with the educational attainment of graduate degree are most likely to be married with 100.0% of them married at childbirth, while women with the educational attainment of college or associate's degree are least likely to be married with 92.2% of them unmarried at childbirth.
| Educational Attainment | Married | Unmarried |
| Less than High School | 0 (0.0%) | 0 (0.0%) |
| High School Diploma | 8 (20.0%) | 32 (80.0%) |
| College or Associate's Degree | 4 (7.8%) | 47 (92.2%) |
| Bachelor's Degree | 0 (0.0%) | 0 (0.0%) |
| Graduate Degree | 12 (100.0%) | 0 (0.0%) |
| Total | 24 (23.3%) | 79 (76.7%) |
Employment Characteristics in Gulf County
Employment by Class of Employer in Gulf County
Among the 5,106 employed individuals in Gulf County, private company employees (2,865 | 56.1%), local government employees (612 | 12.0%), and state government employees (465 | 9.1%) make up the most common classes of employment.
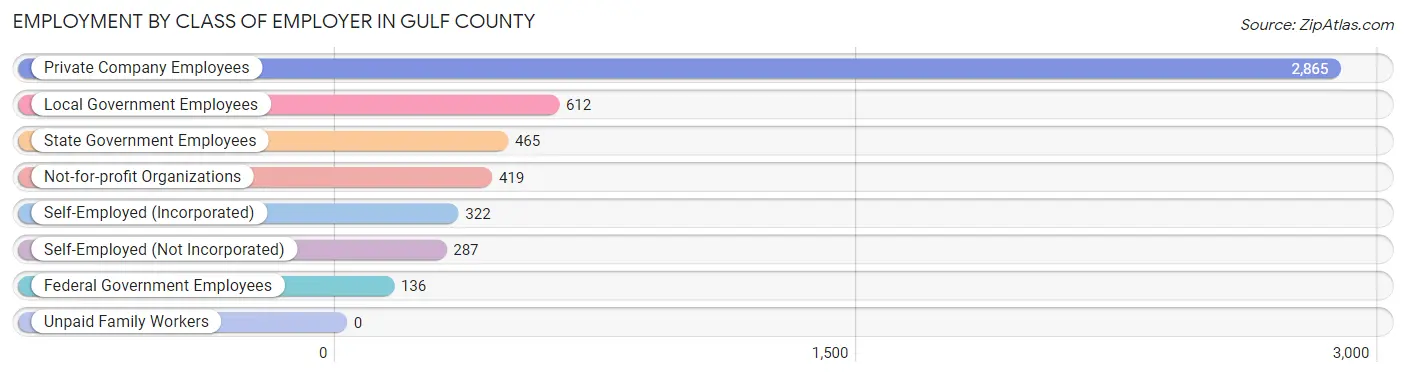
| Employer Class | # Employees | % Employees |
| Private Company Employees | 2,865 | 56.1% |
| Self-Employed (Incorporated) | 322 | 6.3% |
| Self-Employed (Not Incorporated) | 287 | 5.6% |
| Not-for-profit Organizations | 419 | 8.2% |
| Local Government Employees | 612 | 12.0% |
| State Government Employees | 465 | 9.1% |
| Federal Government Employees | 136 | 2.7% |
| Unpaid Family Workers | 0 | 0.0% |
| Total | 5,106 | 100.0% |
Employment Status by Age in Gulf County
According to the labor force statistics for Gulf County, out of the total population over 16 years of age (13,056), 42.4% or 5,536 individuals are in the labor force, with 4.3% or 238 of them unemployed. The age group with the highest labor force participation rate is 20 to 24 years, with 76.2% or 451 individuals in the labor force. Within the labor force, the 75 years and over age range has the highest percentage of unemployed individuals, with 16.9% or 11 of them being unemployed.
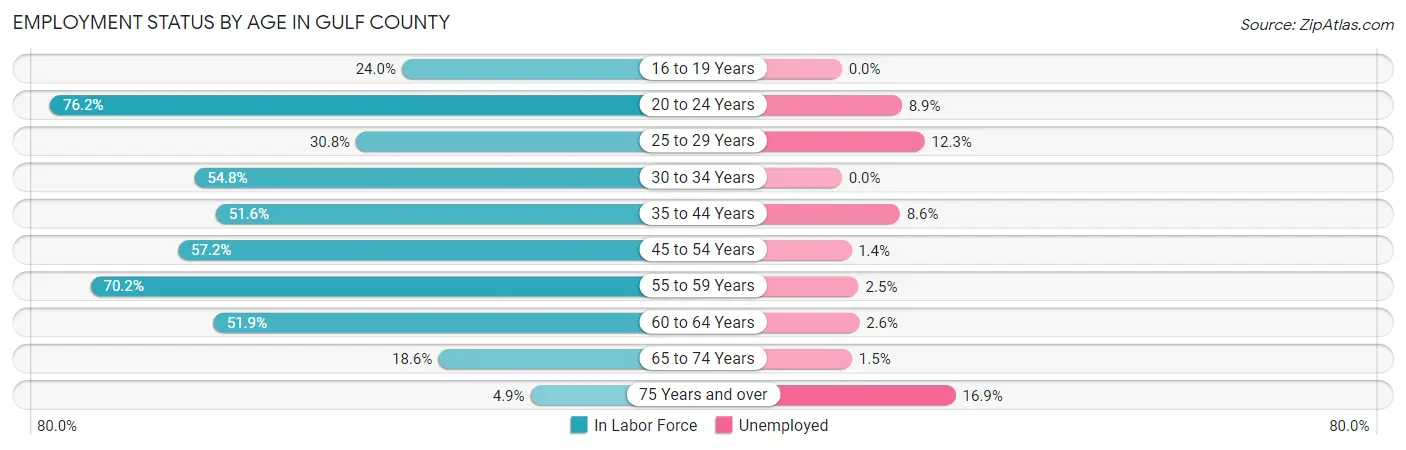
| Age Bracket | In Labor Force | Unemployed |
| 16 to 19 Years | 142 (24.0%) | 0 (0.0%) |
| 20 to 24 Years | 451 (76.2%) | 40 (8.9%) |
| 25 to 29 Years | 316 (30.8%) | 39 (12.3%) |
| 30 to 34 Years | 571 (54.8%) | 0 (0.0%) |
| 35 to 44 Years | 1,063 (51.6%) | 91 (8.6%) |
| 45 to 54 Years | 1,133 (57.2%) | 16 (1.4%) |
| 55 to 59 Years | 816 (70.2%) | 20 (2.5%) |
| 60 to 64 Years | 576 (51.9%) | 15 (2.6%) |
| 65 to 74 Years | 405 (18.6%) | 6 (1.5%) |
| 75 Years and over | 64 (4.9%) | 11 (16.9%) |
| Total | 5,536 (42.4%) | 238 (4.3%) |
Employment Status by Educational Attainment in Gulf County
According to labor force statistics for Gulf County, 53.4% of individuals (4,475) out of the total population between 25 and 64 years of age (8,380) are in the labor force, with 4.1% or 183 of them being unemployed. The group with the highest labor force participation rate are those with the educational attainment of bachelor's degree or higher, with 76.2% or 1,248 individuals in the labor force. Within the labor force, individuals with less than high school education have the highest percentage of unemployment, with 8.3% or 26 of them being unemployed.
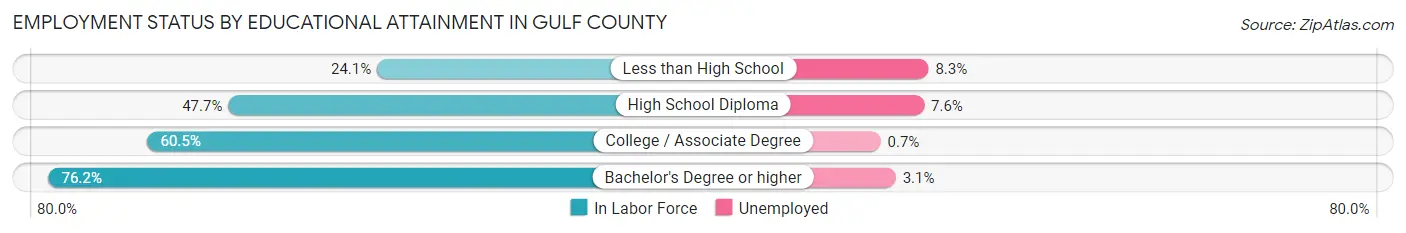
| Educational Attainment | In Labor Force | Unemployed |
| Less than High School | 314 (24.1%) | 108 (8.3%) |
| High School Diploma | 1,412 (47.7%) | 225 (7.6%) |
| College / Associate Degree | 1,501 (60.5%) | 17 (0.7%) |
| Bachelor's Degree or higher | 1,248 (76.2%) | 51 (3.1%) |
| Total | 4,475 (53.4%) | 344 (4.1%) |
Employment Occupations by Sex in Gulf County
Management, Business, Science and Arts Occupations
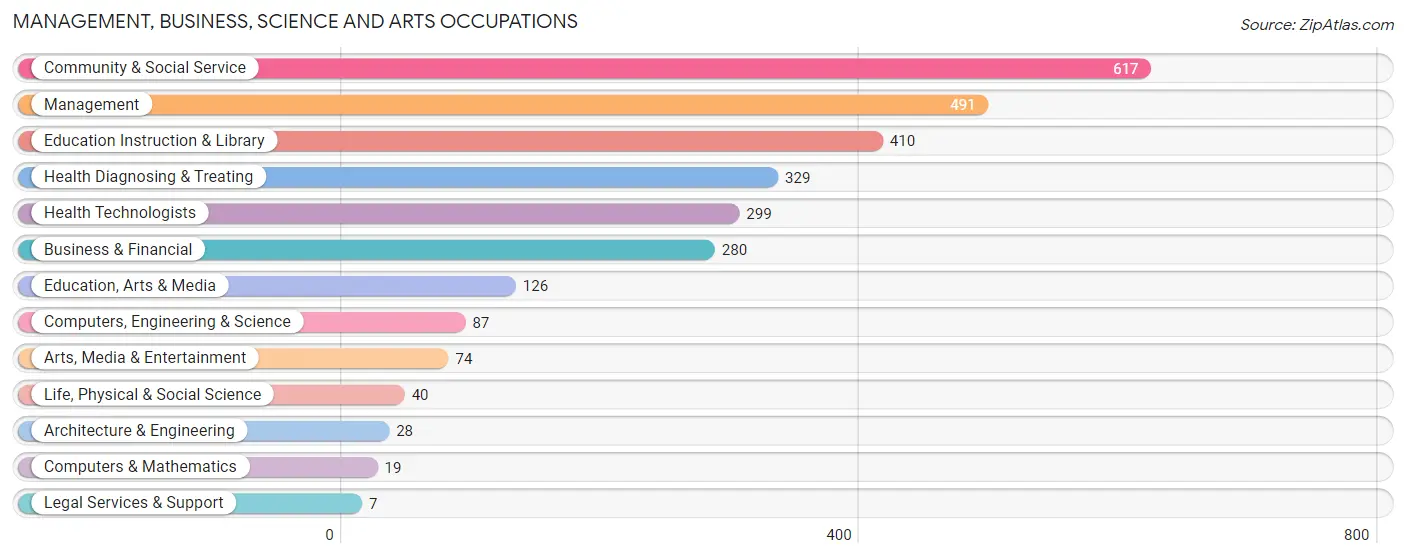
The most common Management, Business, Science and Arts occupations in Gulf County are Community & Social Service (617 | 11.7%), Management (491 | 9.3%), Education Instruction & Library (410 | 7.7%), Health Diagnosing & Treating (329 | 6.2%), and Health Technologists (299 | 5.7%).
Management, Business, Science and Arts Occupations by Sex
Within the Management, Business, Science and Arts occupations in Gulf County, the most male-oriented occupations are Computers & Mathematics (100.0%), Architecture & Engineering (100.0%), and Legal Services & Support (100.0%), while the most female-oriented occupations are Business & Financial (91.1%), Health Diagnosing & Treating (79.9%), and Health Technologists (77.9%).
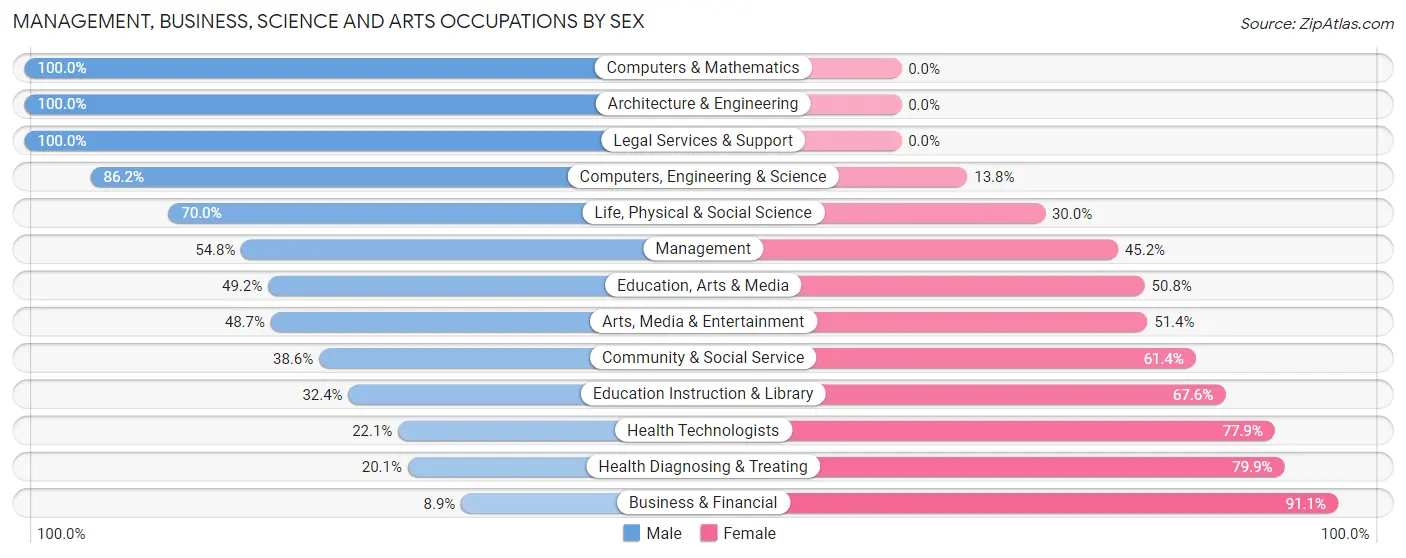
| Occupation | Male | Female |
| Management | 269 (54.8%) | 222 (45.2%) |
| Business & Financial | 25 (8.9%) | 255 (91.1%) |
| Computers, Engineering & Science | 75 (86.2%) | 12 (13.8%) |
| Computers & Mathematics | 19 (100.0%) | 0 (0.0%) |
| Architecture & Engineering | 28 (100.0%) | 0 (0.0%) |
| Life, Physical & Social Science | 28 (70.0%) | 12 (30.0%) |
| Community & Social Service | 238 (38.6%) | 379 (61.4%) |
| Education, Arts & Media | 62 (49.2%) | 64 (50.8%) |
| Legal Services & Support | 7 (100.0%) | 0 (0.0%) |
| Education Instruction & Library | 133 (32.4%) | 277 (67.6%) |
| Arts, Media & Entertainment | 36 (48.6%) | 38 (51.3%) |
| Health Diagnosing & Treating | 66 (20.1%) | 263 (79.9%) |
| Health Technologists | 66 (22.1%) | 233 (77.9%) |
| Total (Category) | 673 (37.3%) | 1,131 (62.7%) |
| Total (Overall) | 2,752 (52.0%) | 2,538 (48.0%) |
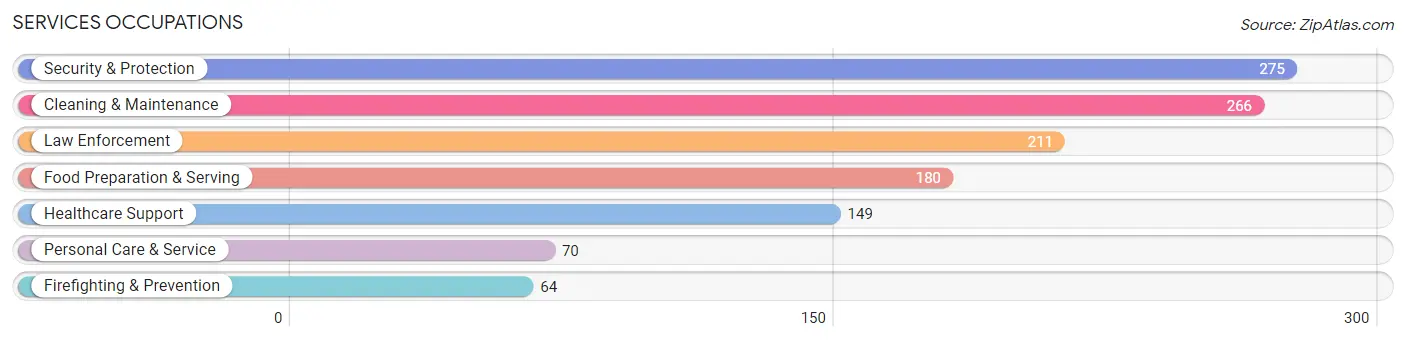
Services Occupations
The most common Services occupations in Gulf County are Security & Protection (275 | 5.2%), Cleaning & Maintenance (266 | 5.0%), Law Enforcement (211 | 4.0%), Food Preparation & Serving (180 | 3.4%), and Healthcare Support (149 | 2.8%).
Services Occupations by Sex
Within the Services occupations in Gulf County, the most male-oriented occupations are Firefighting & Prevention (85.9%), Security & Protection (77.1%), and Law Enforcement (74.4%), while the most female-oriented occupations are Healthcare Support (72.5%), Personal Care & Service (71.4%), and Food Preparation & Serving (65.0%).
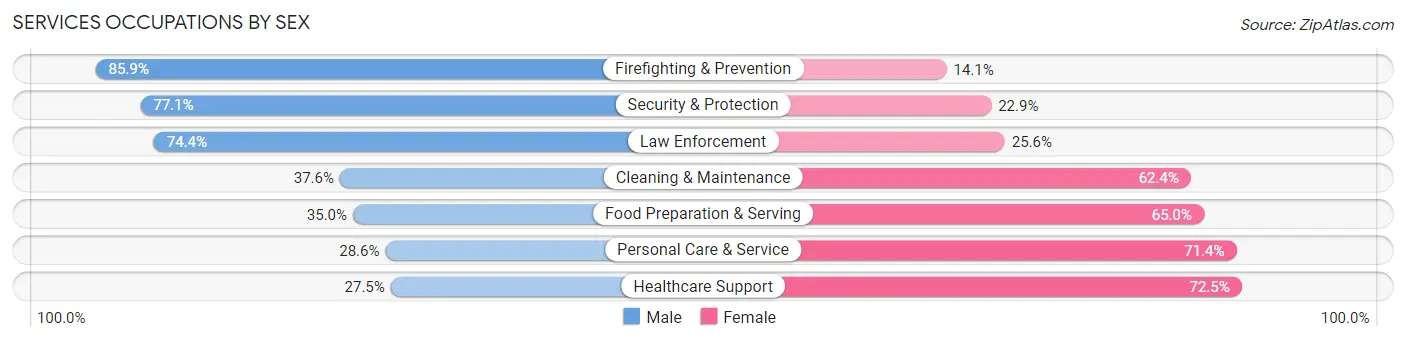
| Occupation | Male | Female |
| Healthcare Support | 41 (27.5%) | 108 (72.5%) |
| Security & Protection | 212 (77.1%) | 63 (22.9%) |
| Firefighting & Prevention | 55 (85.9%) | 9 (14.1%) |
| Law Enforcement | 157 (74.4%) | 54 (25.6%) |
| Food Preparation & Serving | 63 (35.0%) | 117 (65.0%) |
| Cleaning & Maintenance | 100 (37.6%) | 166 (62.4%) |
| Personal Care & Service | 20 (28.6%) | 50 (71.4%) |
| Total (Category) | 436 (46.4%) | 504 (53.6%) |
| Total (Overall) | 2,752 (52.0%) | 2,538 (48.0%) |
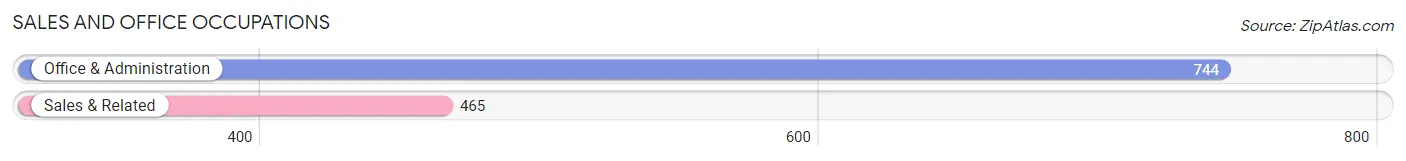
Sales and Office Occupations
The most common Sales and Office occupations in Gulf County are Office & Administration (744 | 14.1%), and Sales & Related (465 | 8.8%).
Sales and Office Occupations by Sex

| Occupation | Male | Female |
| Sales & Related | 293 (63.0%) | 172 (37.0%) |
| Office & Administration | 119 (16.0%) | 625 (84.0%) |
| Total (Category) | 412 (34.1%) | 797 (65.9%) |
| Total (Overall) | 2,752 (52.0%) | 2,538 (48.0%) |
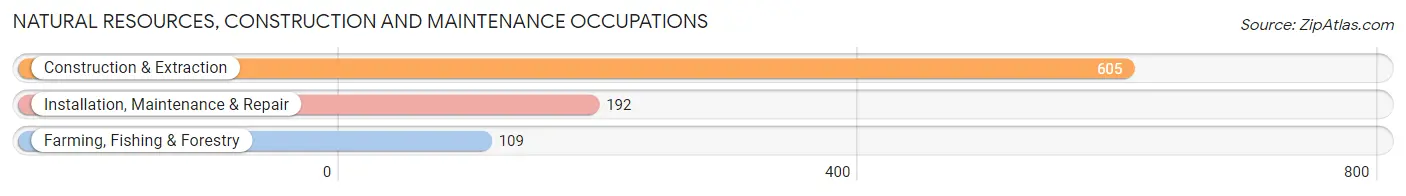
Natural Resources, Construction and Maintenance Occupations
The most common Natural Resources, Construction and Maintenance occupations in Gulf County are Construction & Extraction (605 | 11.4%), Installation, Maintenance & Repair (192 | 3.6%), and Farming, Fishing & Forestry (109 | 2.1%).
Natural Resources, Construction and Maintenance Occupations by Sex
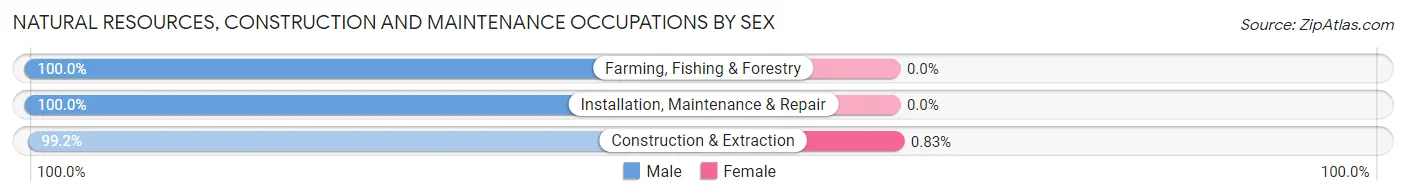
| Occupation | Male | Female |
| Farming, Fishing & Forestry | 109 (100.0%) | 0 (0.0%) |
| Construction & Extraction | 600 (99.2%) | 5 (0.8%) |
| Installation, Maintenance & Repair | 192 (100.0%) | 0 (0.0%) |
| Total (Category) | 901 (99.5%) | 5 (0.5%) |
| Total (Overall) | 2,752 (52.0%) | 2,538 (48.0%) |
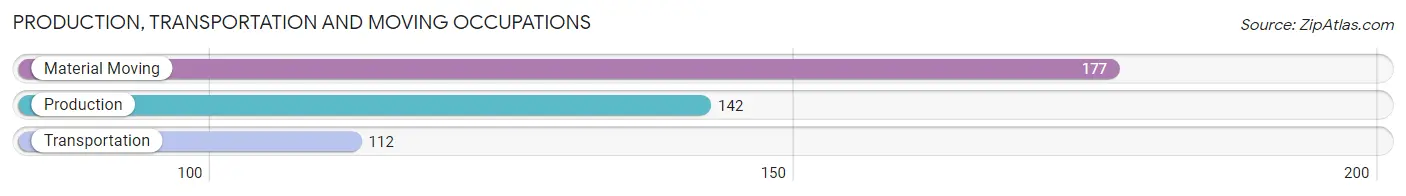
Production, Transportation and Moving Occupations
The most common Production, Transportation and Moving occupations in Gulf County are Material Moving (177 | 3.4%), Production (142 | 2.7%), and Transportation (112 | 2.1%).
Production, Transportation and Moving Occupations by Sex
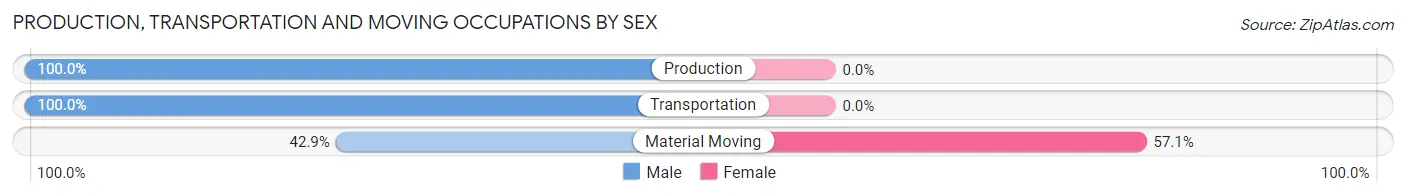
| Occupation | Male | Female |
| Production | 142 (100.0%) | 0 (0.0%) |
| Transportation | 112 (100.0%) | 0 (0.0%) |
| Material Moving | 76 (42.9%) | 101 (57.1%) |
| Total (Category) | 330 (76.6%) | 101 (23.4%) |
| Total (Overall) | 2,752 (52.0%) | 2,538 (48.0%) |
Employment Industries by Sex in Gulf County
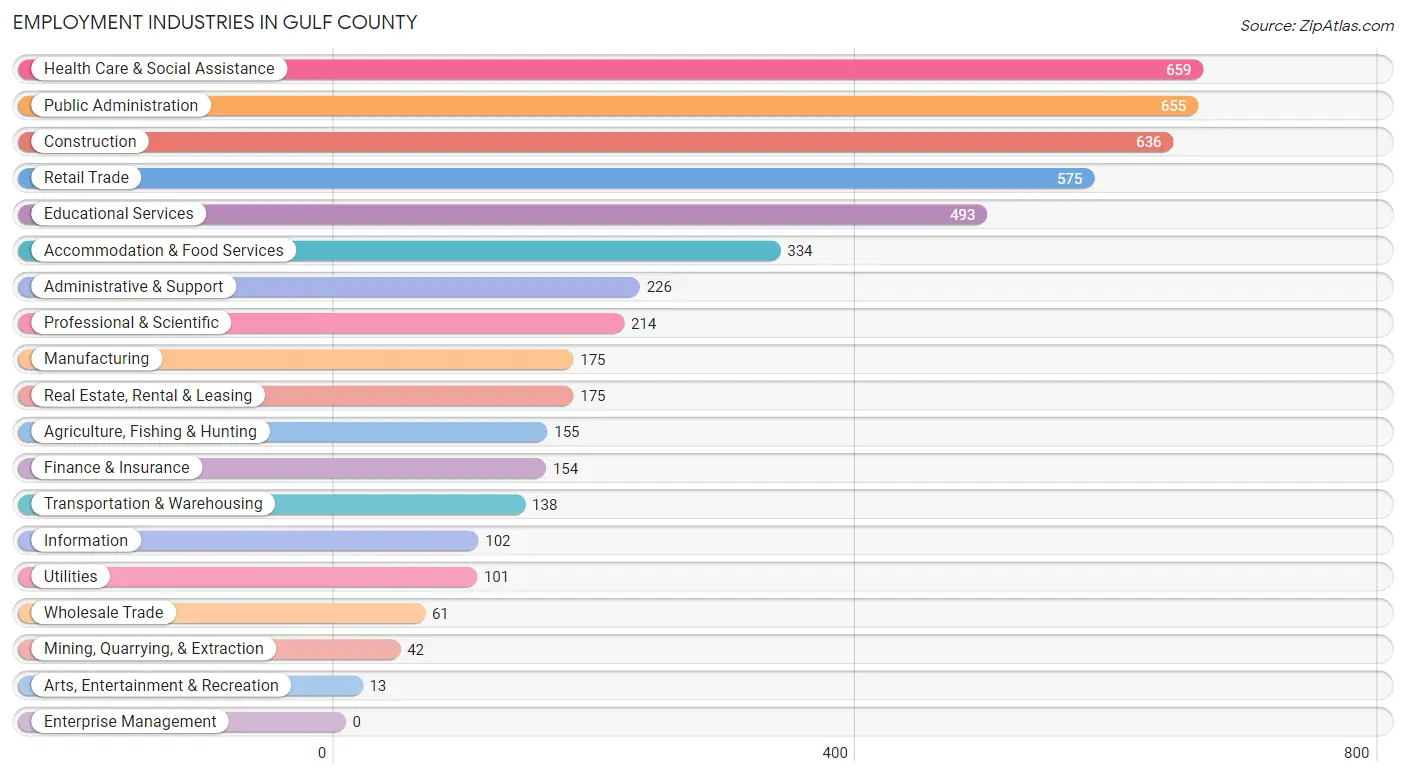
Employment Industries in Gulf County
The major employment industries in Gulf County include Health Care & Social Assistance (659 | 12.5%), Public Administration (655 | 12.4%), Construction (636 | 12.0%), Retail Trade (575 | 10.9%), and Educational Services (493 | 9.3%).
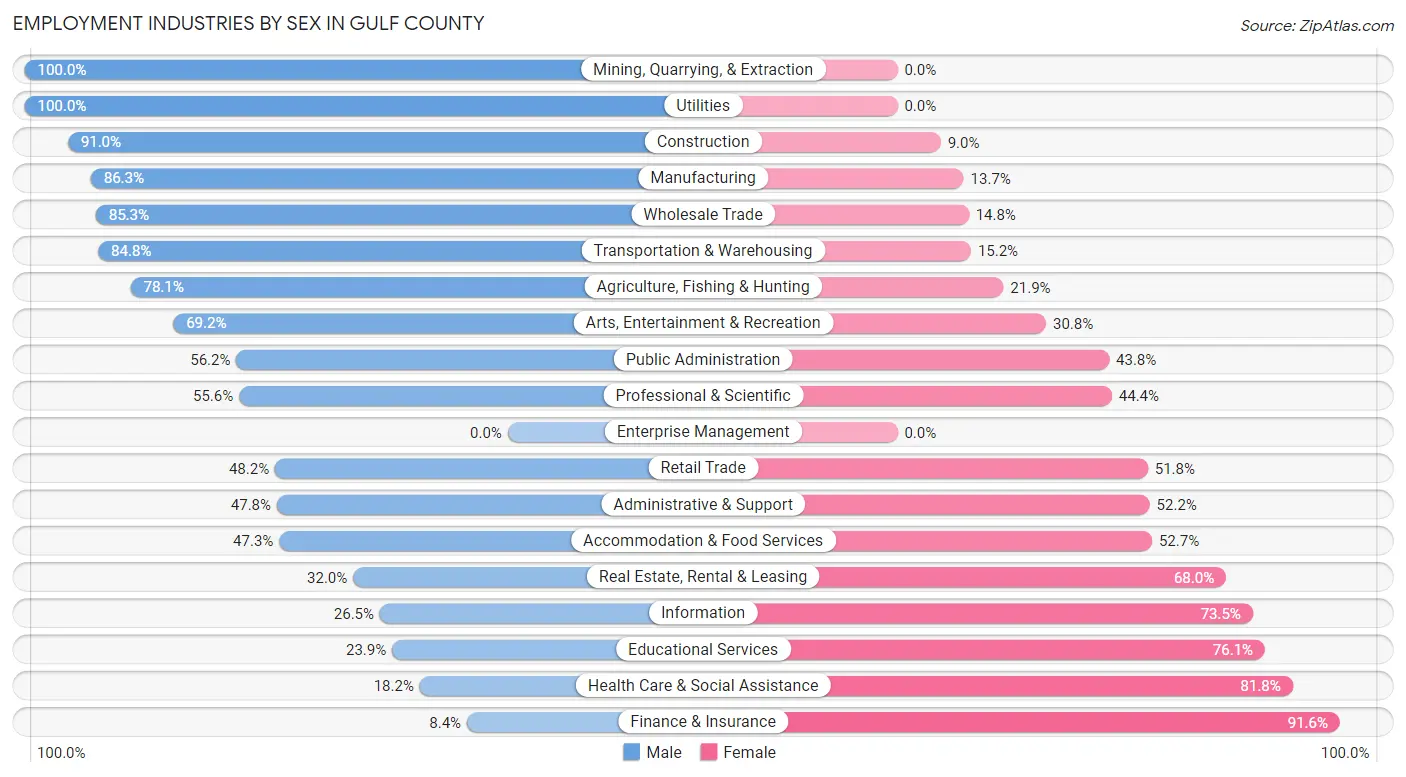
Employment Industries by Sex in Gulf County
The Gulf County industries that see more men than women are Mining, Quarrying, & Extraction (100.0%), Utilities (100.0%), and Construction (91.0%), whereas the industries that tend to have a higher number of women are Finance & Insurance (91.6%), Health Care & Social Assistance (81.8%), and Educational Services (76.1%).
| Industry | Male | Female |
| Agriculture, Fishing & Hunting | 121 (78.1%) | 34 (21.9%) |
| Mining, Quarrying, & Extraction | 42 (100.0%) | 0 (0.0%) |
| Construction | 579 (91.0%) | 57 (9.0%) |
| Manufacturing | 151 (86.3%) | 24 (13.7%) |
| Wholesale Trade | 52 (85.3%) | 9 (14.7%) |
| Retail Trade | 277 (48.2%) | 298 (51.8%) |
| Transportation & Warehousing | 117 (84.8%) | 21 (15.2%) |
| Utilities | 101 (100.0%) | 0 (0.0%) |
| Information | 27 (26.5%) | 75 (73.5%) |
| Finance & Insurance | 13 (8.4%) | 141 (91.6%) |
| Real Estate, Rental & Leasing | 56 (32.0%) | 119 (68.0%) |
| Professional & Scientific | 119 (55.6%) | 95 (44.4%) |
| Enterprise Management | 0 (0.0%) | 0 (0.0%) |
| Administrative & Support | 108 (47.8%) | 118 (52.2%) |
| Educational Services | 118 (23.9%) | 375 (76.1%) |
| Health Care & Social Assistance | 120 (18.2%) | 539 (81.8%) |
| Arts, Entertainment & Recreation | 9 (69.2%) | 4 (30.8%) |
| Accommodation & Food Services | 158 (47.3%) | 176 (52.7%) |
| Public Administration | 368 (56.2%) | 287 (43.8%) |
| Total | 2,752 (52.0%) | 2,538 (48.0%) |
Education in Gulf County
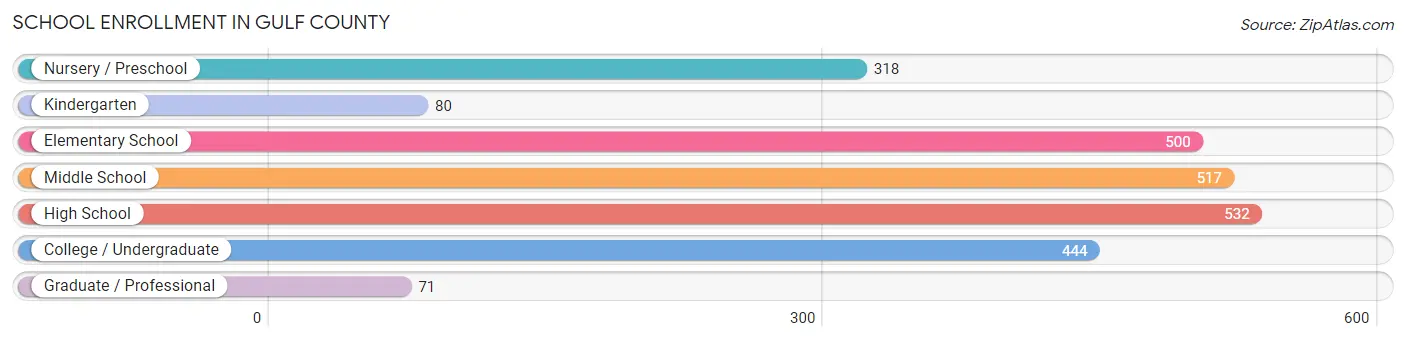
School Enrollment in Gulf County
The most common levels of schooling among the 2,462 students in Gulf County are high school (532 | 21.6%), middle school (517 | 21.0%), and elementary school (500 | 20.3%).
| School Level | # Students | % Students |
| Nursery / Preschool | 318 | 12.9% |
| Kindergarten | 80 | 3.3% |
| Elementary School | 500 | 20.3% |
| Middle School | 517 | 21.0% |
| High School | 532 | 21.6% |
| College / Undergraduate | 444 | 18.0% |
| Graduate / Professional | 71 | 2.9% |
| Total | 2,462 | 100.0% |
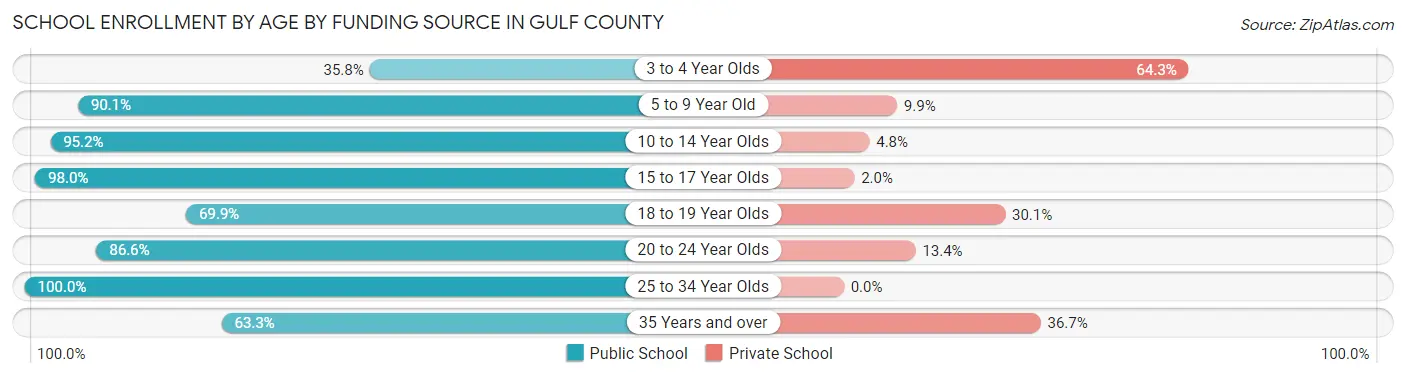
School Enrollment by Age by Funding Source in Gulf County
Out of a total of 2,462 students who are enrolled in schools in Gulf County, 369 (15.0%) attend a private institution, while the remaining 2,093 (85.0%) are enrolled in public schools. The age group of 3 to 4 year olds has the highest likelihood of being enrolled in private schools, with 142 (64.2% in the age bracket) enrolled. Conversely, the age group of 25 to 34 year olds has the lowest likelihood of being enrolled in a private school, with 110 (100.0% in the age bracket) attending a public institution.
| Age Bracket | Public School | Private School |
| 3 to 4 Year Olds | 79 (35.7%) | 142 (64.2%) |
| 5 to 9 Year Old | 545 (90.1%) | 60 (9.9%) |
| 10 to 14 Year Olds | 639 (95.2%) | 32 (4.8%) |
| 15 to 17 Year Olds | 348 (98.0%) | 7 (2.0%) |
| 18 to 19 Year Olds | 114 (69.9%) | 49 (30.1%) |
| 20 to 24 Year Olds | 162 (86.6%) | 25 (13.4%) |
| 25 to 34 Year Olds | 110 (100.0%) | 0 (0.0%) |
| 35 Years and over | 95 (63.3%) | 55 (36.7%) |
| Total | 2,093 (85.0%) | 369 (15.0%) |
Educational Attainment by Field of Study in Gulf County
Business (648 | 23.2%), education (497 | 17.8%), science & technology (403 | 14.4%), social sciences (179 | 6.4%), and arts & humanities (152 | 5.4%) are the most common fields of study among 2,797 individuals in Gulf County who have obtained a bachelor's degree or higher.
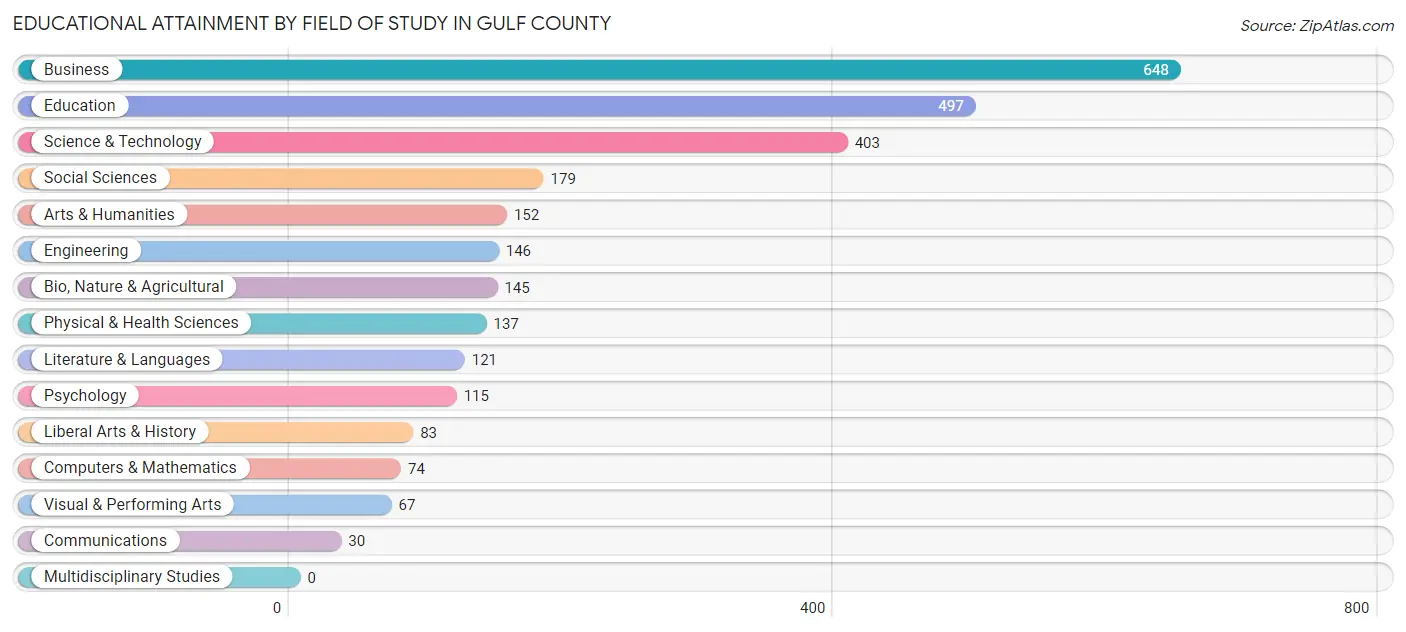
| Field of Study | # Graduates | % Graduates |
| Computers & Mathematics | 74 | 2.6% |
| Bio, Nature & Agricultural | 145 | 5.2% |
| Physical & Health Sciences | 137 | 4.9% |
| Psychology | 115 | 4.1% |
| Social Sciences | 179 | 6.4% |
| Engineering | 146 | 5.2% |
| Multidisciplinary Studies | 0 | 0.0% |
| Science & Technology | 403 | 14.4% |
| Business | 648 | 23.2% |
| Education | 497 | 17.8% |
| Literature & Languages | 121 | 4.3% |
| Liberal Arts & History | 83 | 3.0% |
| Visual & Performing Arts | 67 | 2.4% |
| Communications | 30 | 1.1% |
| Arts & Humanities | 152 | 5.4% |
| Total | 2,797 | 100.0% |
Transportation & Commute in Gulf County
Vehicle Availability by Sex in Gulf County
The most prevalent vehicle ownership categories in Gulf County are males with 2 vehicles (1,055, accounting for 40.5%) and females with 2 vehicles (1,014, making up 42.3%).
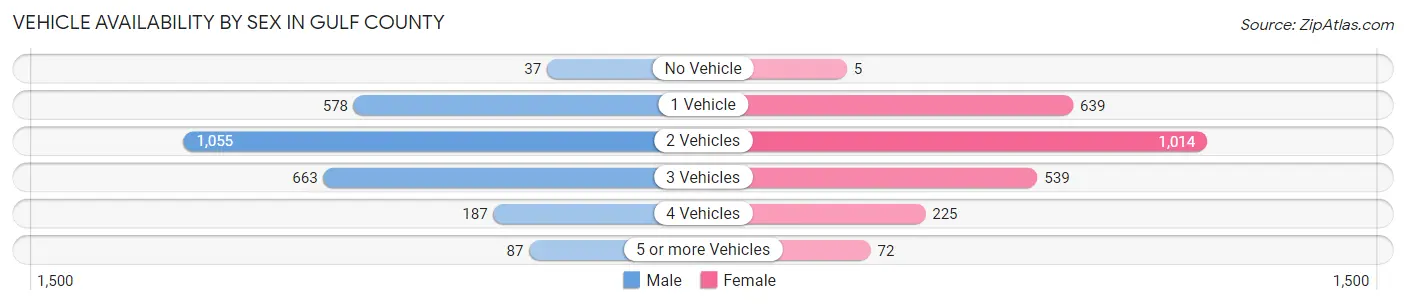
| Vehicles Available | Male | Female |
| No Vehicle | 37 (1.4%) | 5 (0.2%) |
| 1 Vehicle | 578 (22.2%) | 639 (25.6%) |
| 2 Vehicles | 1,055 (40.5%) | 1,014 (40.7%) |
| 3 Vehicles | 663 (25.4%) | 539 (21.6%) |
| 4 Vehicles | 187 (7.2%) | 225 (9.0%) |
| 5 or more Vehicles | 87 (3.3%) | 72 (2.9%) |
| Total | 2,607 (100.0%) | 2,494 (100.0%) |
Commute Time in Gulf County
The most frequently occuring commute durations in Gulf County are 5 to 9 minutes (892 commuters, 18.6%), 10 to 14 minutes (698 commuters, 14.5%), and 45 to 59 minutes (574 commuters, 11.9%).
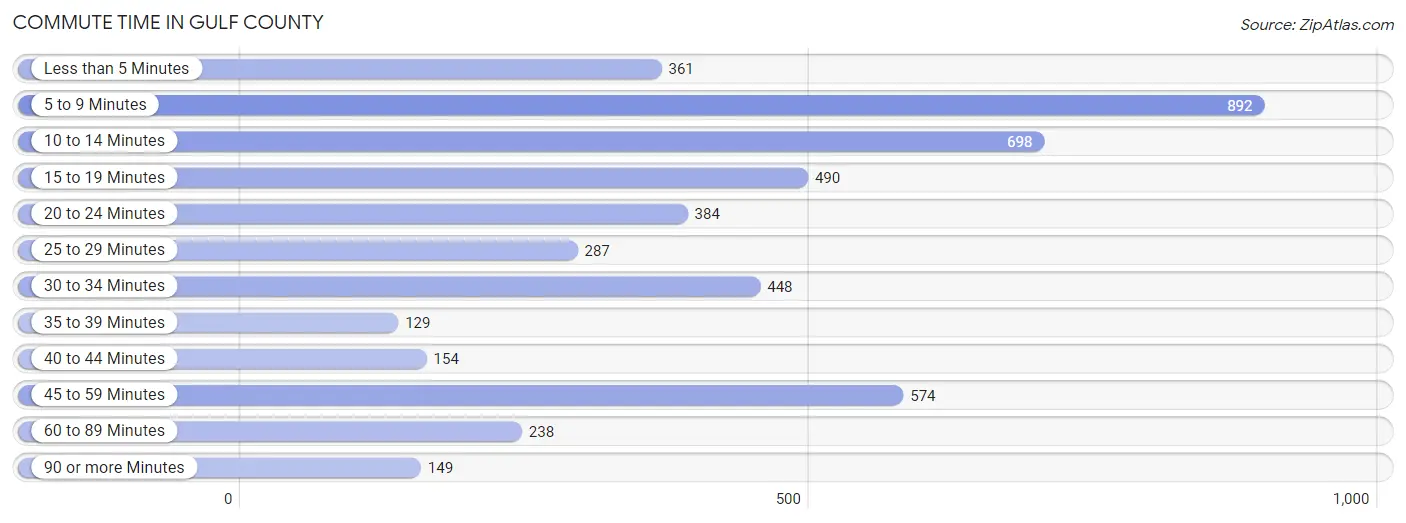
| Commute Time | # Commuters | % Commuters |
| Less than 5 Minutes | 361 | 7.5% |
| 5 to 9 Minutes | 892 | 18.6% |
| 10 to 14 Minutes | 698 | 14.5% |
| 15 to 19 Minutes | 490 | 10.2% |
| 20 to 24 Minutes | 384 | 8.0% |
| 25 to 29 Minutes | 287 | 6.0% |
| 30 to 34 Minutes | 448 | 9.3% |
| 35 to 39 Minutes | 129 | 2.7% |
| 40 to 44 Minutes | 154 | 3.2% |
| 45 to 59 Minutes | 574 | 11.9% |
| 60 to 89 Minutes | 238 | 5.0% |
| 90 or more Minutes | 149 | 3.1% |
Commute Time by Sex in Gulf County
The most common commute times in Gulf County are 5 to 9 minutes (408 commuters, 16.8%) for males and 5 to 9 minutes (484 commuters, 20.4%) for females.
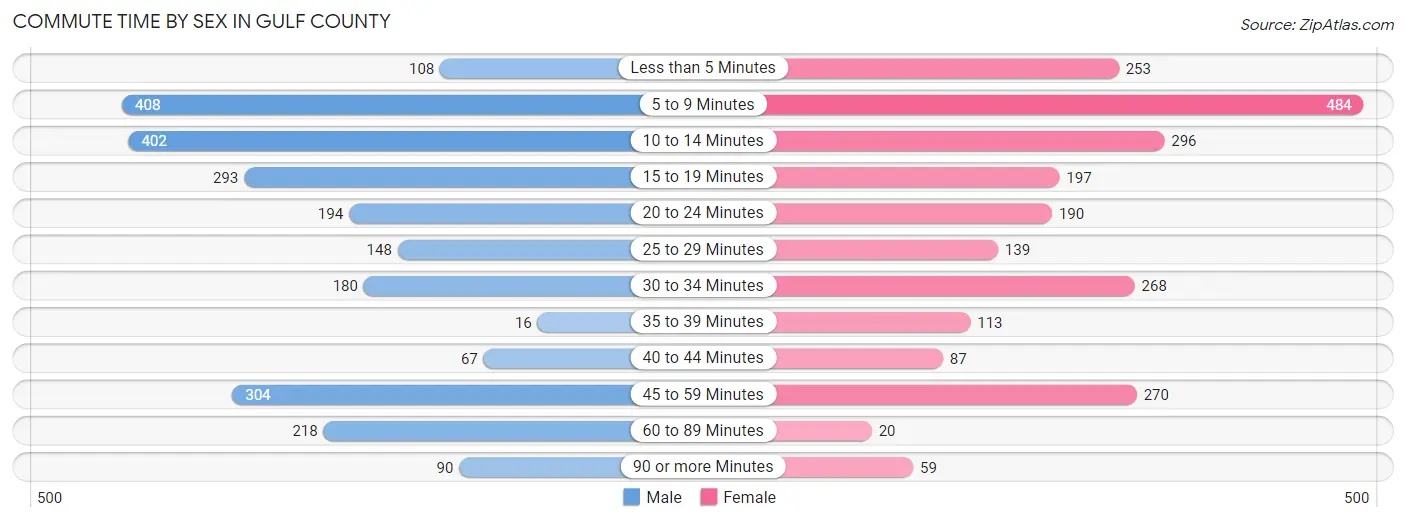
| Commute Time | Male | Female |
| Less than 5 Minutes | 108 (4.4%) | 253 (10.6%) |
| 5 to 9 Minutes | 408 (16.8%) | 484 (20.4%) |
| 10 to 14 Minutes | 402 (16.6%) | 296 (12.5%) |
| 15 to 19 Minutes | 293 (12.1%) | 197 (8.3%) |
| 20 to 24 Minutes | 194 (8.0%) | 190 (8.0%) |
| 25 to 29 Minutes | 148 (6.1%) | 139 (5.9%) |
| 30 to 34 Minutes | 180 (7.4%) | 268 (11.3%) |
| 35 to 39 Minutes | 16 (0.7%) | 113 (4.8%) |
| 40 to 44 Minutes | 67 (2.8%) | 87 (3.7%) |
| 45 to 59 Minutes | 304 (12.5%) | 270 (11.4%) |
| 60 to 89 Minutes | 218 (9.0%) | 20 (0.8%) |
| 90 or more Minutes | 90 (3.7%) | 59 (2.5%) |
Time of Departure to Work by Sex in Gulf County
The most frequent times of departure to work in Gulf County are 7:00 AM to 7:29 AM (502, 20.7%) for males and 8:00 AM to 8:29 AM (474, 20.0%) for females.
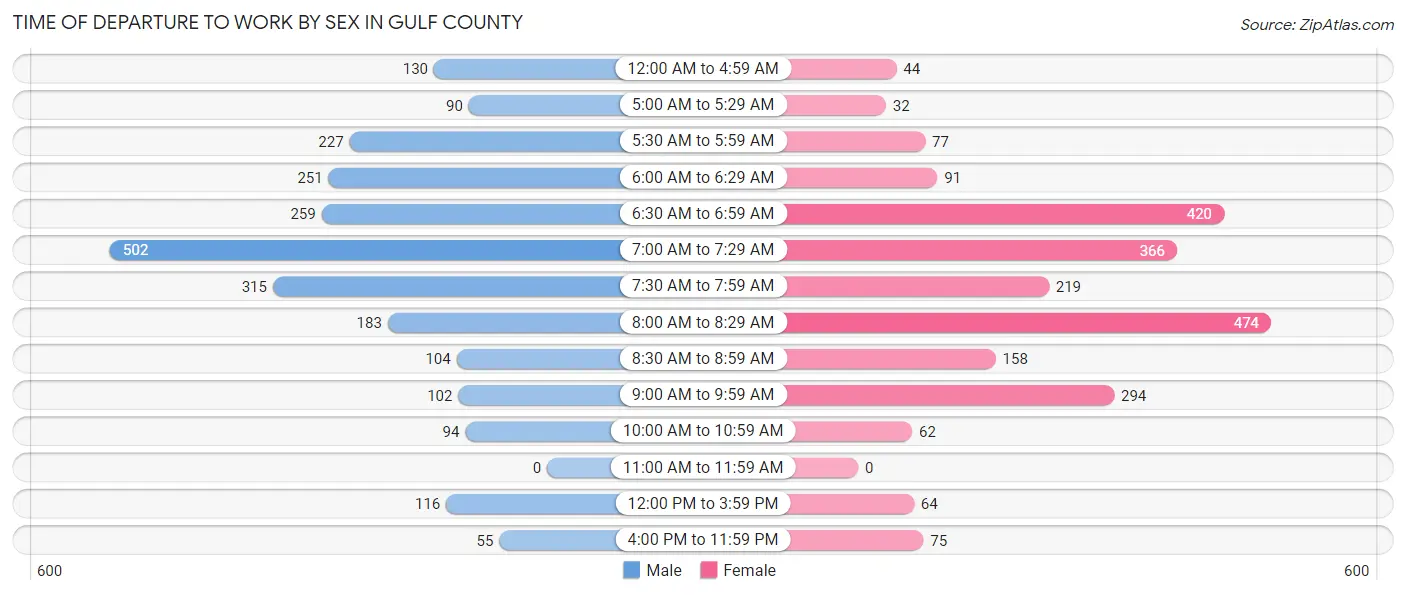
| Time of Departure | Male | Female |
| 12:00 AM to 4:59 AM | 130 (5.3%) | 44 (1.8%) |
| 5:00 AM to 5:29 AM | 90 (3.7%) | 32 (1.3%) |
| 5:30 AM to 5:59 AM | 227 (9.3%) | 77 (3.2%) |
| 6:00 AM to 6:29 AM | 251 (10.3%) | 91 (3.8%) |
| 6:30 AM to 6:59 AM | 259 (10.7%) | 420 (17.7%) |
| 7:00 AM to 7:29 AM | 502 (20.7%) | 366 (15.4%) |
| 7:30 AM to 7:59 AM | 315 (13.0%) | 219 (9.2%) |
| 8:00 AM to 8:29 AM | 183 (7.5%) | 474 (20.0%) |
| 8:30 AM to 8:59 AM | 104 (4.3%) | 158 (6.7%) |
| 9:00 AM to 9:59 AM | 102 (4.2%) | 294 (12.4%) |
| 10:00 AM to 10:59 AM | 94 (3.9%) | 62 (2.6%) |
| 11:00 AM to 11:59 AM | 0 (0.0%) | 0 (0.0%) |
| 12:00 PM to 3:59 PM | 116 (4.8%) | 64 (2.7%) |
| 4:00 PM to 11:59 PM | 55 (2.3%) | 75 (3.2%) |
| Total | 2,428 (100.0%) | 2,376 (100.0%) |
Housing Occupancy in Gulf County
Occupancy by Ownership in Gulf County
Of the total 5,648 dwellings in Gulf County, owner-occupied units account for 4,438 (78.6%), while renter-occupied units make up 1,210 (21.4%).
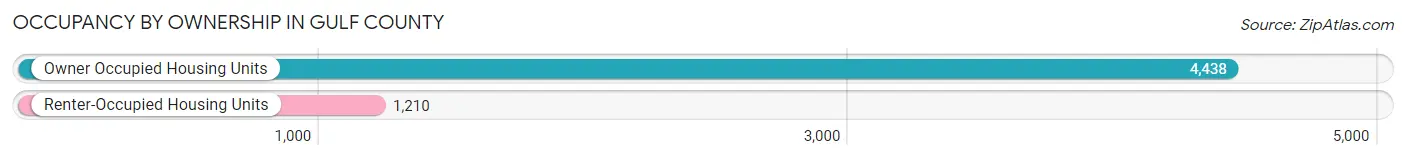
| Occupancy | # Housing Units | % Housing Units |
| Owner Occupied Housing Units | 4,438 | 78.6% |
| Renter-Occupied Housing Units | 1,210 | 21.4% |
| Total Occupied Housing Units | 5,648 | 100.0% |
Occupancy by Household Size in Gulf County
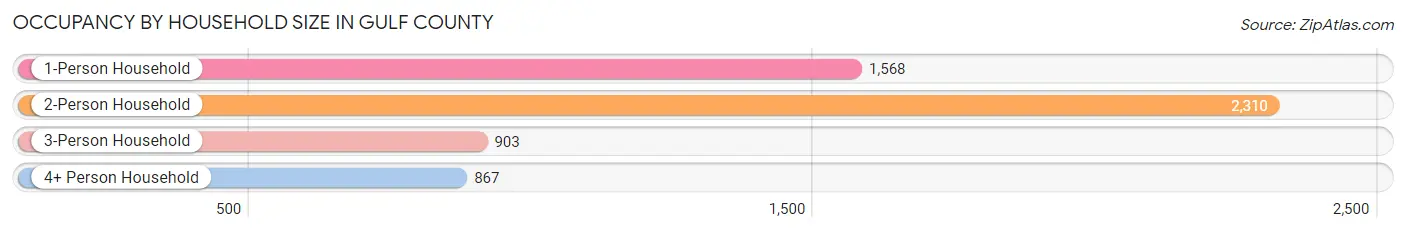
| Household Size | # Housing Units | % Housing Units |
| 1-Person Household | 1,568 | 27.8% |
| 2-Person Household | 2,310 | 40.9% |
| 3-Person Household | 903 | 16.0% |
| 4+ Person Household | 867 | 15.3% |
| Total Housing Units | 5,648 | 100.0% |
Occupancy by Ownership by Household Size in Gulf County
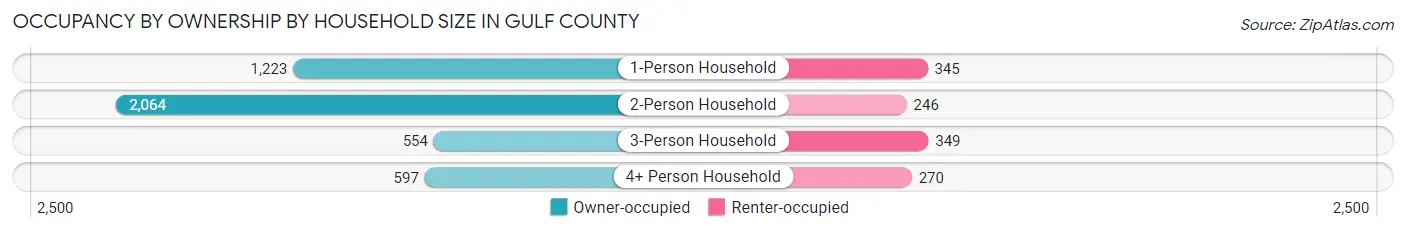
| Household Size | Owner-occupied | Renter-occupied |
| 1-Person Household | 1,223 (78.0%) | 345 (22.0%) |
| 2-Person Household | 2,064 (89.3%) | 246 (10.6%) |
| 3-Person Household | 554 (61.4%) | 349 (38.7%) |
| 4+ Person Household | 597 (68.9%) | 270 (31.1%) |
| Total Housing Units | 4,438 (78.6%) | 1,210 (21.4%) |
Occupancy by Educational Attainment in Gulf County
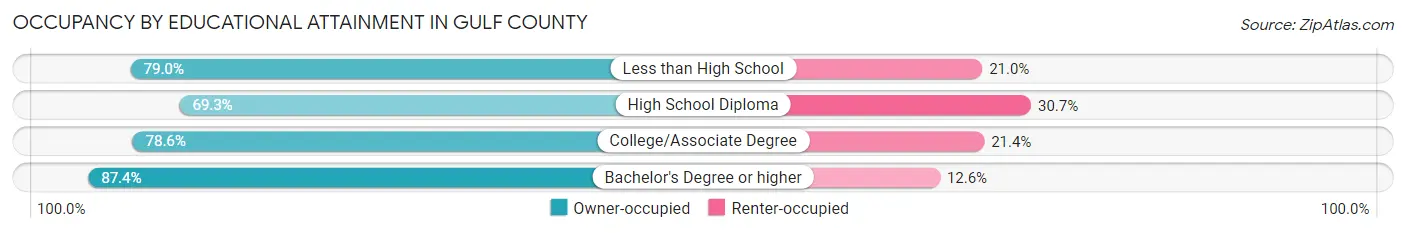
| Household Size | Owner-occupied | Renter-occupied |
| Less than High School | 372 (79.0%) | 99 (21.0%) |
| High School Diploma | 1,067 (69.3%) | 473 (30.7%) |
| College/Associate Degree | 1,596 (78.6%) | 435 (21.4%) |
| Bachelor's Degree or higher | 1,403 (87.4%) | 203 (12.6%) |
Occupancy by Age of Householder in Gulf County
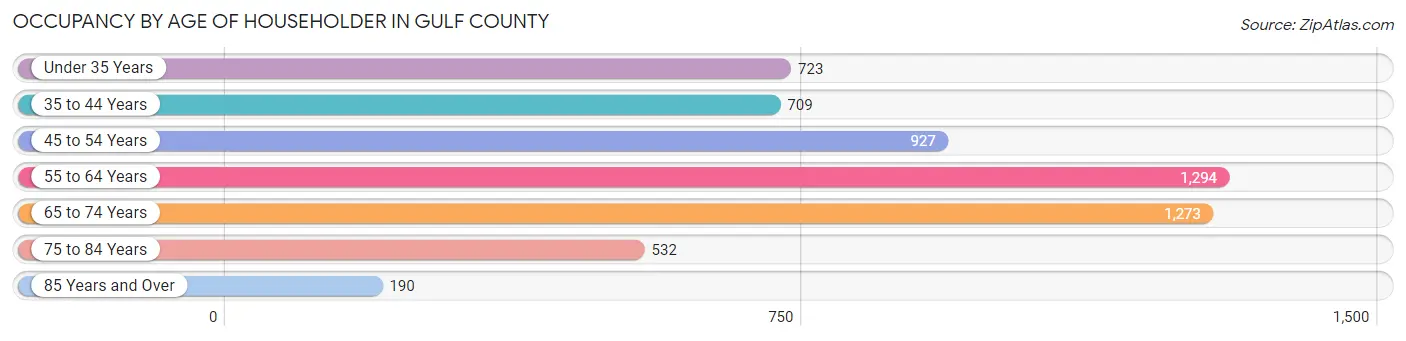
| Age Bracket | # Households | % Households |
| Under 35 Years | 723 | 12.8% |
| 35 to 44 Years | 709 | 12.6% |
| 45 to 54 Years | 927 | 16.4% |
| 55 to 64 Years | 1,294 | 22.9% |
| 65 to 74 Years | 1,273 | 22.5% |
| 75 to 84 Years | 532 | 9.4% |
| 85 Years and Over | 190 | 3.4% |
| Total | 5,648 | 100.0% |
Housing Finances in Gulf County
Median Income by Occupancy in Gulf County
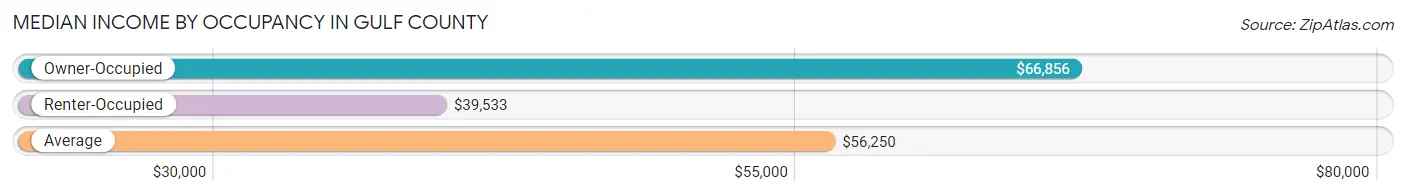
| Occupancy Type | # Households | Median Income |
| Owner-Occupied | 4,438 (78.6%) | $66,856 |
| Renter-Occupied | 1,210 (21.4%) | $39,533 |
| Average | 5,648 (100.0%) | $56,250 |
Occupancy by Householder Income Bracket in Gulf County
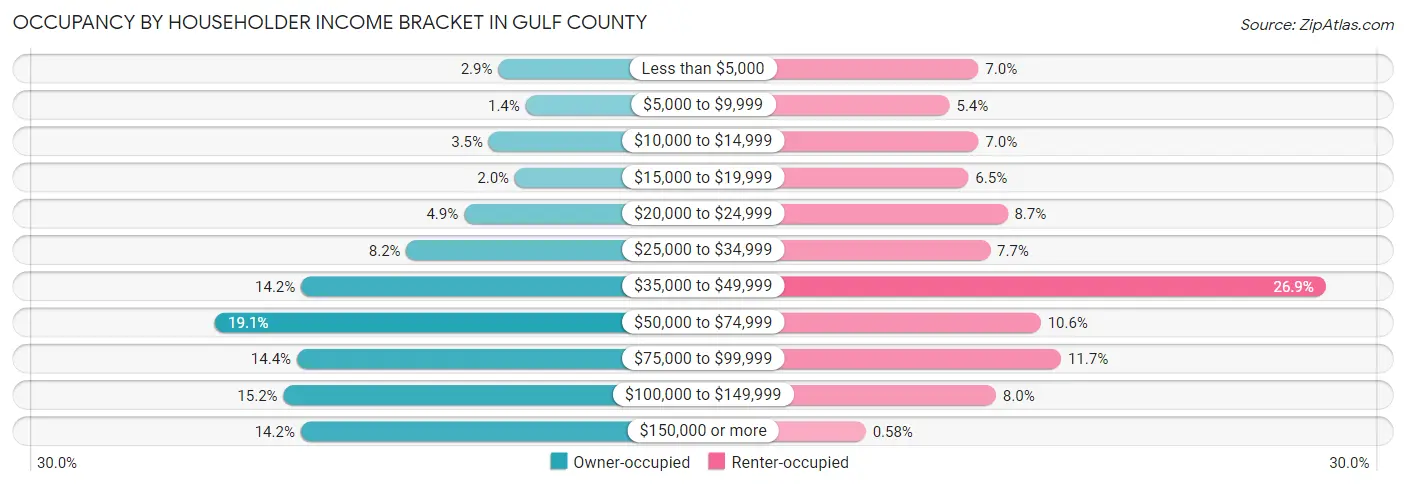
| Income Bracket | Owner-occupied | Renter-occupied |
| Less than $5,000 | 130 (2.9%) | 85 (7.0%) |
| $5,000 to $9,999 | 61 (1.4%) | 65 (5.4%) |
| $10,000 to $14,999 | 154 (3.5%) | 85 (7.0%) |
| $15,000 to $19,999 | 88 (2.0%) | 78 (6.5%) |
| $20,000 to $24,999 | 217 (4.9%) | 105 (8.7%) |
| $25,000 to $34,999 | 363 (8.2%) | 93 (7.7%) |
| $35,000 to $49,999 | 630 (14.2%) | 325 (26.9%) |
| $50,000 to $74,999 | 848 (19.1%) | 128 (10.6%) |
| $75,000 to $99,999 | 641 (14.4%) | 142 (11.7%) |
| $100,000 to $149,999 | 675 (15.2%) | 97 (8.0%) |
| $150,000 or more | 631 (14.2%) | 7 (0.6%) |
| Total | 4,438 (100.0%) | 1,210 (100.0%) |
Monthly Housing Cost Tiers in Gulf County
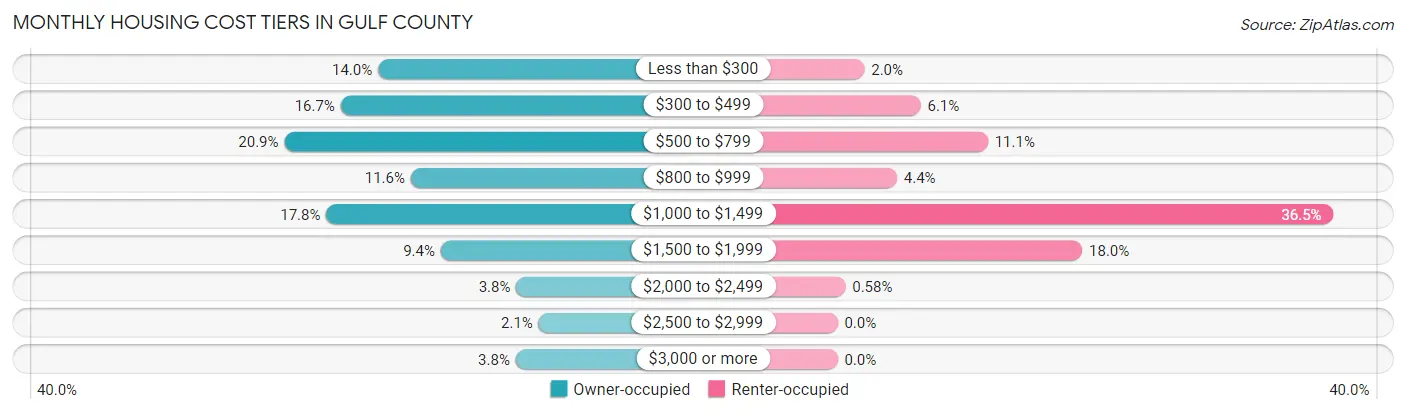
| Monthly Cost | Owner-occupied | Renter-occupied |
| Less than $300 | 620 (14.0%) | 24 (2.0%) |
| $300 to $499 | 742 (16.7%) | 74 (6.1%) |
| $500 to $799 | 926 (20.9%) | 134 (11.1%) |
| $800 to $999 | 513 (11.6%) | 53 (4.4%) |
| $1,000 to $1,499 | 789 (17.8%) | 442 (36.5%) |
| $1,500 to $1,999 | 415 (9.3%) | 218 (18.0%) |
| $2,000 to $2,499 | 168 (3.8%) | 7 (0.6%) |
| $2,500 to $2,999 | 95 (2.1%) | 0 (0.0%) |
| $3,000 or more | 170 (3.8%) | 0 (0.0%) |
| Total | 4,438 (100.0%) | 1,210 (100.0%) |
Physical Housing Characteristics in Gulf County
Housing Structures in Gulf County
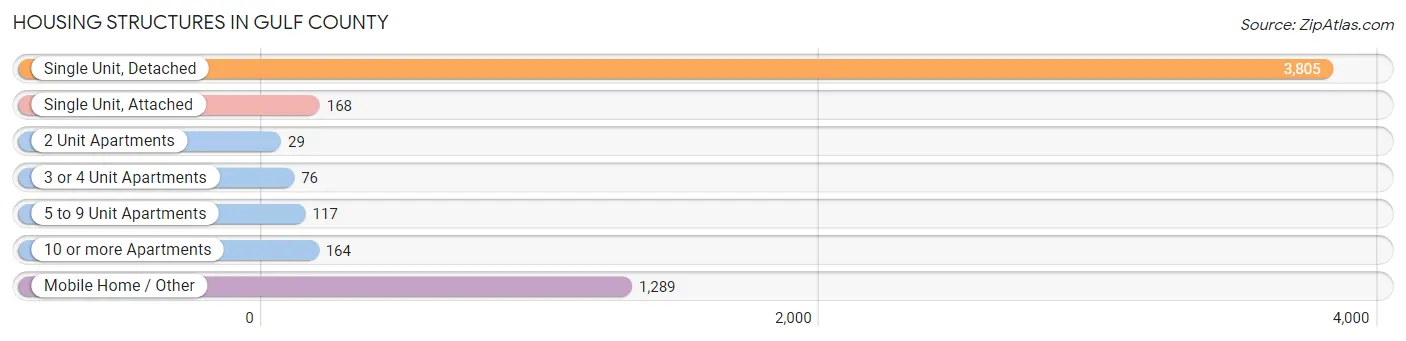
| Structure Type | # Housing Units | % Housing Units |
| Single Unit, Detached | 3,805 | 67.4% |
| Single Unit, Attached | 168 | 3.0% |
| 2 Unit Apartments | 29 | 0.5% |
| 3 or 4 Unit Apartments | 76 | 1.3% |
| 5 to 9 Unit Apartments | 117 | 2.1% |
| 10 or more Apartments | 164 | 2.9% |
| Mobile Home / Other | 1,289 | 22.8% |
| Total | 5,648 | 100.0% |
Housing Structures by Occupancy in Gulf County
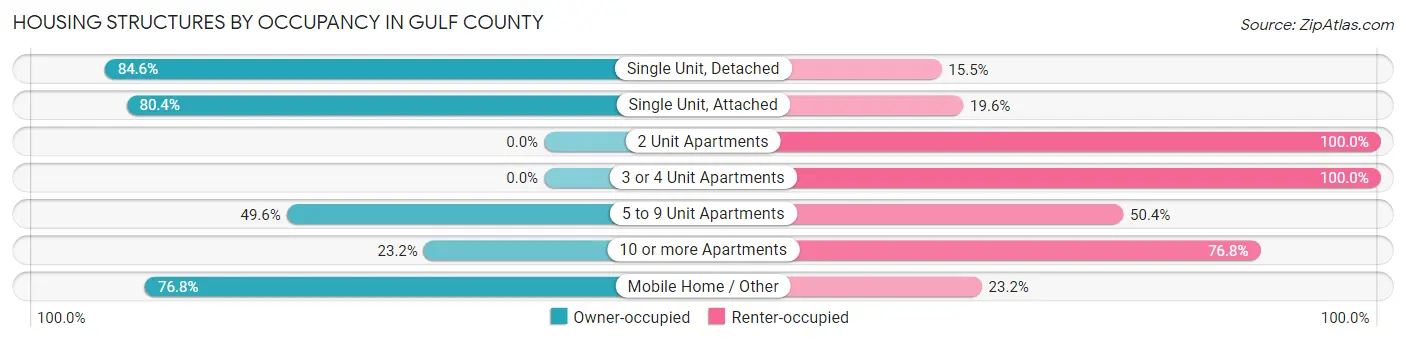
| Structure Type | Owner-occupied | Renter-occupied |
| Single Unit, Detached | 3,217 (84.6%) | 588 (15.4%) |
| Single Unit, Attached | 135 (80.4%) | 33 (19.6%) |
| 2 Unit Apartments | 0 (0.0%) | 29 (100.0%) |
| 3 or 4 Unit Apartments | 0 (0.0%) | 76 (100.0%) |
| 5 to 9 Unit Apartments | 58 (49.6%) | 59 (50.4%) |
| 10 or more Apartments | 38 (23.2%) | 126 (76.8%) |
| Mobile Home / Other | 990 (76.8%) | 299 (23.2%) |
| Total | 4,438 (78.6%) | 1,210 (21.4%) |
Housing Structures by Number of Rooms in Gulf County
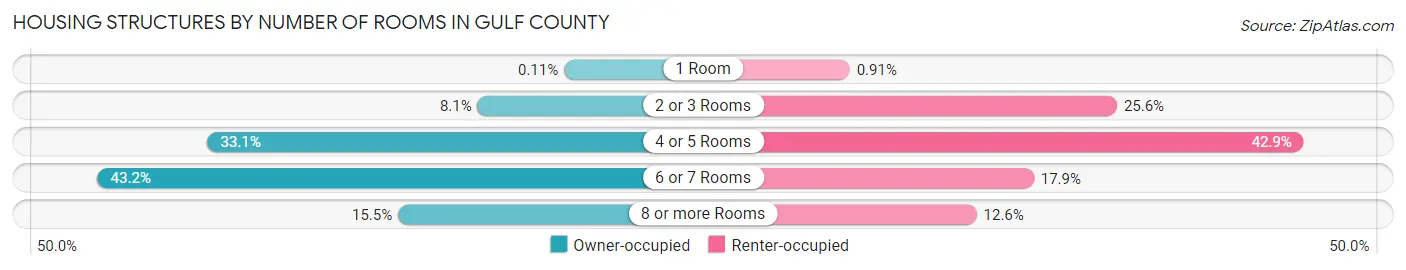
| Number of Rooms | Owner-occupied | Renter-occupied |
| 1 Room | 5 (0.1%) | 11 (0.9%) |
| 2 or 3 Rooms | 360 (8.1%) | 310 (25.6%) |
| 4 or 5 Rooms | 1,468 (33.1%) | 519 (42.9%) |
| 6 or 7 Rooms | 1,919 (43.2%) | 217 (17.9%) |
| 8 or more Rooms | 686 (15.5%) | 153 (12.6%) |
| Total | 4,438 (100.0%) | 1,210 (100.0%) |
Housing Structure by Heating Type in Gulf County
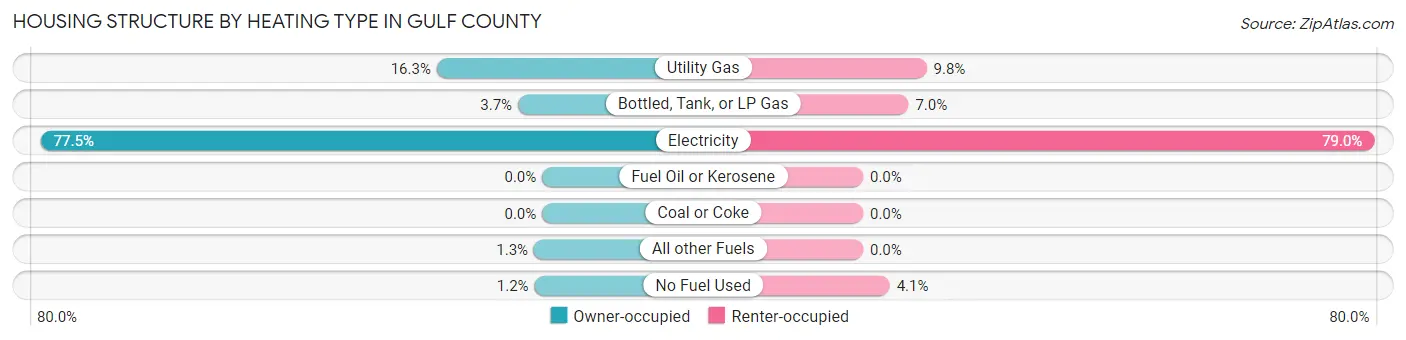
| Heating Type | Owner-occupied | Renter-occupied |
| Utility Gas | 723 (16.3%) | 119 (9.8%) |
| Bottled, Tank, or LP Gas | 166 (3.7%) | 85 (7.0%) |
| Electricity | 3,440 (77.5%) | 956 (79.0%) |
| Fuel Oil or Kerosene | 0 (0.0%) | 0 (0.0%) |
| Coal or Coke | 0 (0.0%) | 0 (0.0%) |
| All other Fuels | 56 (1.3%) | 0 (0.0%) |
| No Fuel Used | 53 (1.2%) | 50 (4.1%) |
| Total | 4,438 (100.0%) | 1,210 (100.0%) |
Household Vehicle Usage in Gulf County
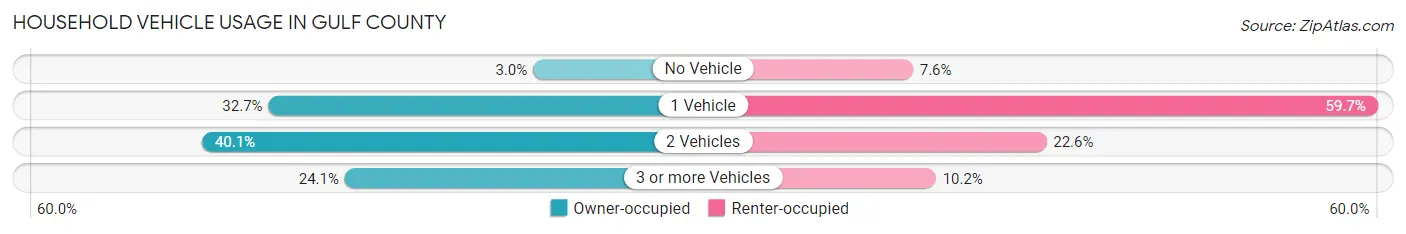
| Vehicles per Household | Owner-occupied | Renter-occupied |
| No Vehicle | 135 (3.0%) | 92 (7.6%) |
| 1 Vehicle | 1,451 (32.7%) | 722 (59.7%) |
| 2 Vehicles | 1,781 (40.1%) | 273 (22.6%) |
| 3 or more Vehicles | 1,071 (24.1%) | 123 (10.2%) |
| Total | 4,438 (100.0%) | 1,210 (100.0%) |
Real Estate & Mortgages in Gulf County
Real Estate and Mortgage Overview in Gulf County
| Characteristic | Without Mortgage | With Mortgage |
| Housing Units | 2,550 | 1,888 |
| Median Property Value | $190,000 | $204,700 |
| Median Household Income | $55,482 | $260 |
| Monthly Housing Costs | $489 | $170 |
| Real Estate Taxes | $1,036 | $179 |
Property Value by Mortgage Status in Gulf County
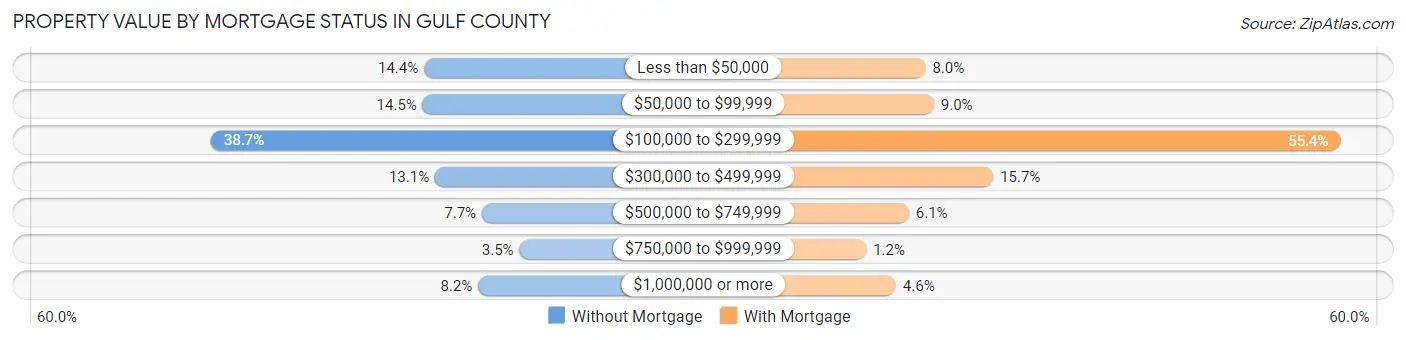
| Property Value | Without Mortgage | With Mortgage |
| Less than $50,000 | 366 (14.3%) | 151 (8.0%) |
| $50,000 to $99,999 | 370 (14.5%) | 169 (8.9%) |
| $100,000 to $299,999 | 987 (38.7%) | 1,046 (55.4%) |
| $300,000 to $499,999 | 334 (13.1%) | 297 (15.7%) |
| $500,000 to $749,999 | 197 (7.7%) | 115 (6.1%) |
| $750,000 to $999,999 | 88 (3.5%) | 23 (1.2%) |
| $1,000,000 or more | 208 (8.2%) | 87 (4.6%) |
| Total | 2,550 (100.0%) | 1,888 (100.0%) |
Household Income by Mortgage Status in Gulf County
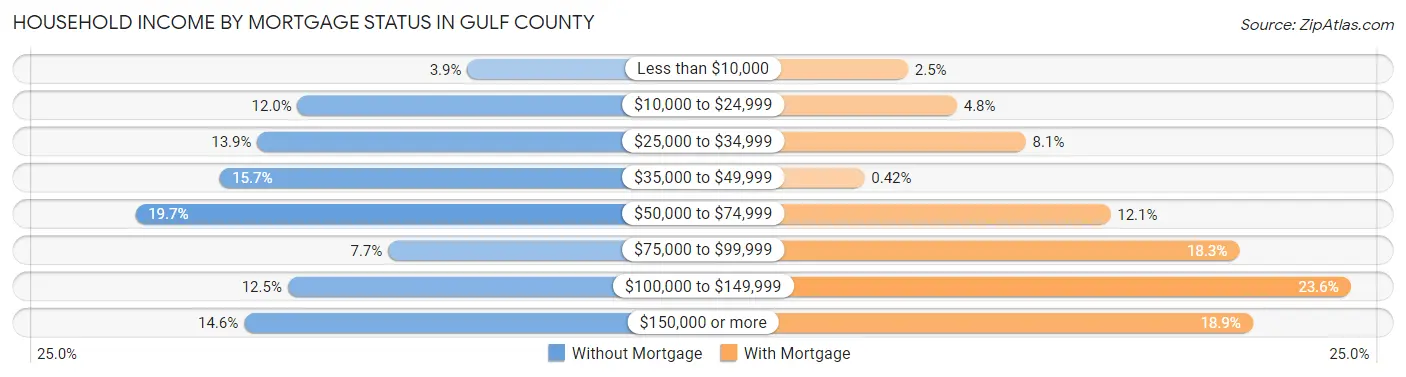
| Household Income | Without Mortgage | With Mortgage |
| Less than $10,000 | 100 (3.9%) | 47 (2.5%) |
| $10,000 to $24,999 | 306 (12.0%) | 91 (4.8%) |
| $25,000 to $34,999 | 355 (13.9%) | 153 (8.1%) |
| $35,000 to $49,999 | 401 (15.7%) | 8 (0.4%) |
| $50,000 to $74,999 | 503 (19.7%) | 229 (12.1%) |
| $75,000 to $99,999 | 196 (7.7%) | 345 (18.3%) |
| $100,000 to $149,999 | 318 (12.5%) | 445 (23.6%) |
| $150,000 or more | 371 (14.5%) | 357 (18.9%) |
| Total | 2,550 (100.0%) | 1,888 (100.0%) |
Property Value to Household Income Ratio in Gulf County
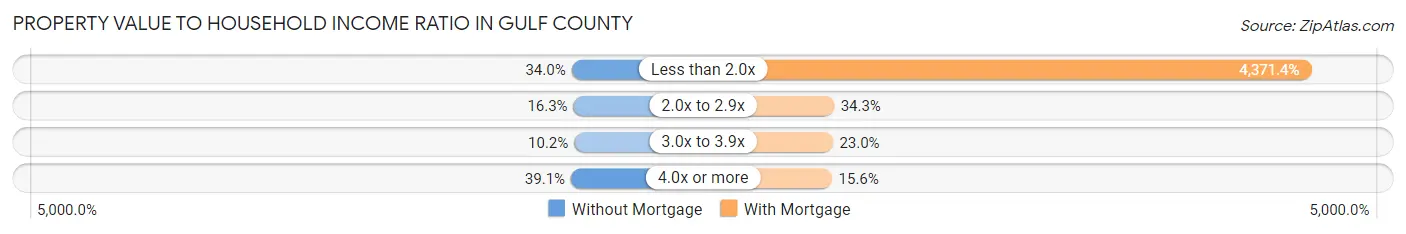
| Value-to-Income Ratio | Without Mortgage | With Mortgage |
| Less than 2.0x | 867 (34.0%) | 82,532 (4,371.4%) |
| 2.0x to 2.9x | 416 (16.3%) | 648 (34.3%) |
| 3.0x to 3.9x | 261 (10.2%) | 435 (23.0%) |
| 4.0x or more | 997 (39.1%) | 294 (15.6%) |
| Total | 2,550 (100.0%) | 1,888 (100.0%) |
Real Estate Taxes by Mortgage Status in Gulf County
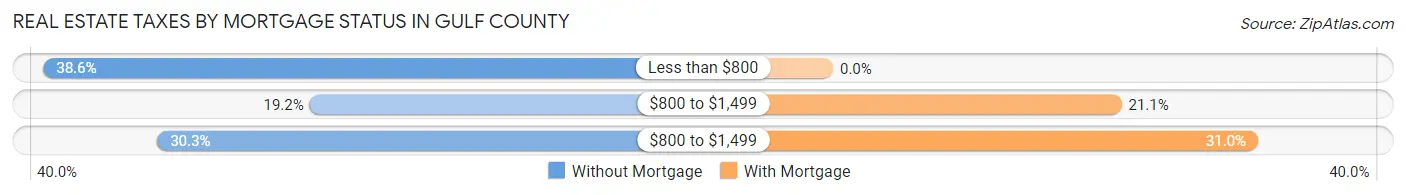
| Property Taxes | Without Mortgage | With Mortgage |
| Less than $800 | 985 (38.6%) | 0 (0.0%) |
| $800 to $1,499 | 489 (19.2%) | 398 (21.1%) |
| $800 to $1,499 | 773 (30.3%) | 586 (31.0%) |
| Total | 2,550 (100.0%) | 1,888 (100.0%) |
Health & Disability in Gulf County
Health Insurance Coverage by Age in Gulf County
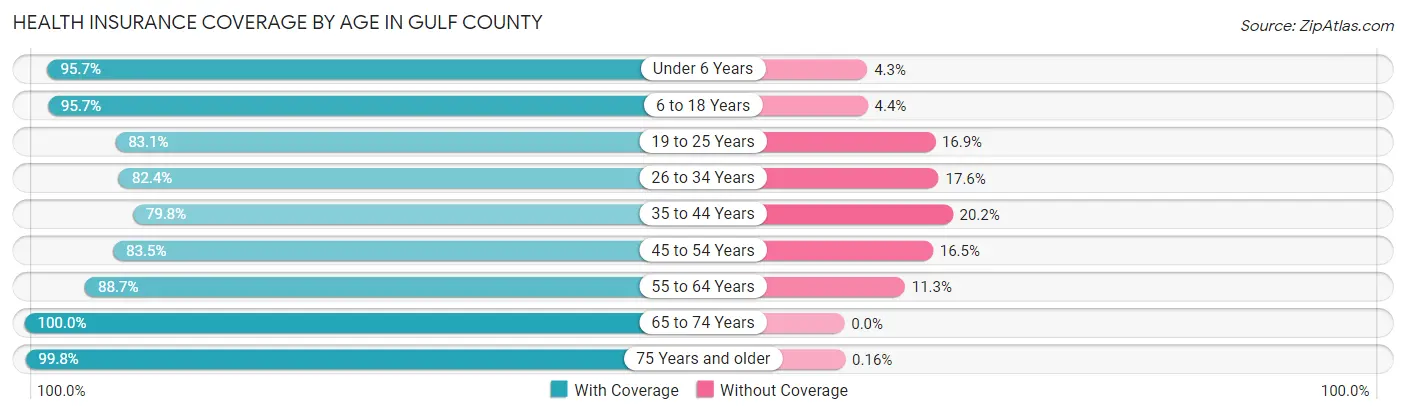
| Age Bracket | With Coverage | Without Coverage |
| Under 6 Years | 695 (95.7%) | 31 (4.3%) |
| 6 to 18 Years | 1,582 (95.7%) | 72 (4.3%) |
| 19 to 25 Years | 585 (83.1%) | 119 (16.9%) |
| 26 to 34 Years | 848 (82.4%) | 181 (17.6%) |
| 35 to 44 Years | 1,000 (79.8%) | 253 (20.2%) |
| 45 to 54 Years | 1,245 (83.5%) | 246 (16.5%) |
| 55 to 64 Years | 1,933 (88.7%) | 246 (11.3%) |
| 65 to 74 Years | 2,121 (100.0%) | 0 (0.0%) |
| 75 Years and older | 1,229 (99.8%) | 2 (0.2%) |
| Total | 11,238 (90.7%) | 1,150 (9.3%) |
Health Insurance Coverage by Citizenship Status in Gulf County
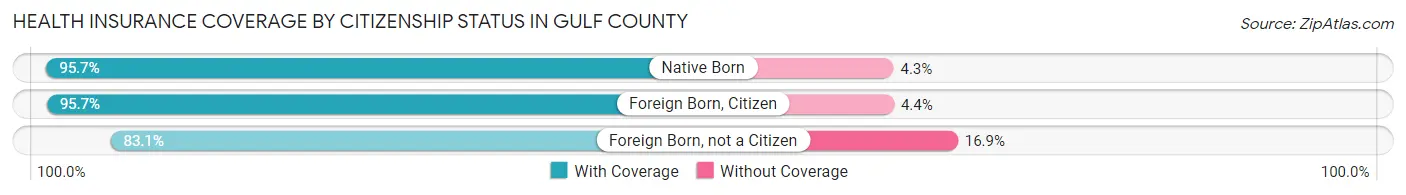
| Citizenship Status | With Coverage | Without Coverage |
| Native Born | 695 (95.7%) | 31 (4.3%) |
| Foreign Born, Citizen | 1,582 (95.7%) | 72 (4.3%) |
| Foreign Born, not a Citizen | 585 (83.1%) | 119 (16.9%) |
Health Insurance Coverage by Household Income in Gulf County
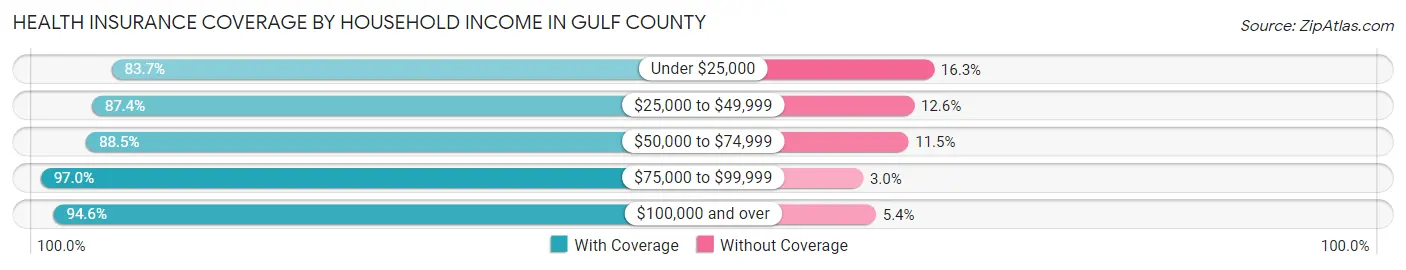
| Household Income | With Coverage | Without Coverage |
| Under $25,000 | 1,410 (83.7%) | 275 (16.3%) |
| $25,000 to $49,999 | 2,312 (87.4%) | 333 (12.6%) |
| $50,000 to $74,999 | 2,142 (88.5%) | 279 (11.5%) |
| $75,000 to $99,999 | 2,112 (97.0%) | 66 (3.0%) |
| $100,000 and over | 3,259 (94.6%) | 187 (5.4%) |
Public vs Private Health Insurance Coverage by Age in Gulf County
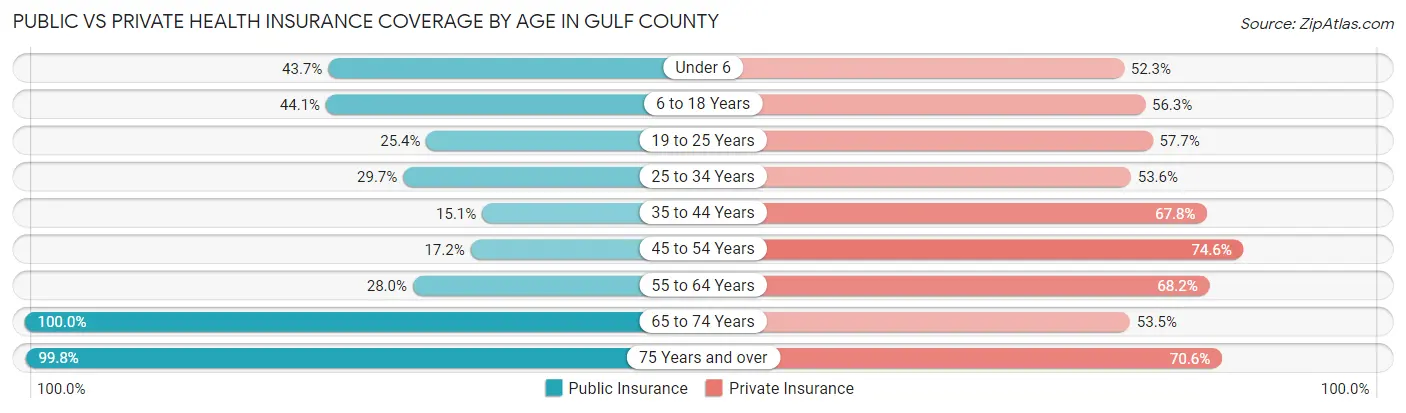
| Age Bracket | Public Insurance | Private Insurance |
| Under 6 | 317 (43.7%) | 380 (52.3%) |
| 6 to 18 Years | 729 (44.1%) | 931 (56.3%) |
| 19 to 25 Years | 179 (25.4%) | 406 (57.7%) |
| 25 to 34 Years | 306 (29.7%) | 552 (53.6%) |
| 35 to 44 Years | 189 (15.1%) | 850 (67.8%) |
| 45 to 54 Years | 257 (17.2%) | 1,112 (74.6%) |
| 55 to 64 Years | 609 (28.0%) | 1,487 (68.2%) |
| 65 to 74 Years | 2,121 (100.0%) | 1,134 (53.5%) |
| 75 Years and over | 1,229 (99.8%) | 869 (70.6%) |
| Total | 5,936 (47.9%) | 7,721 (62.3%) |
Disability Status by Sex by Age in Gulf County
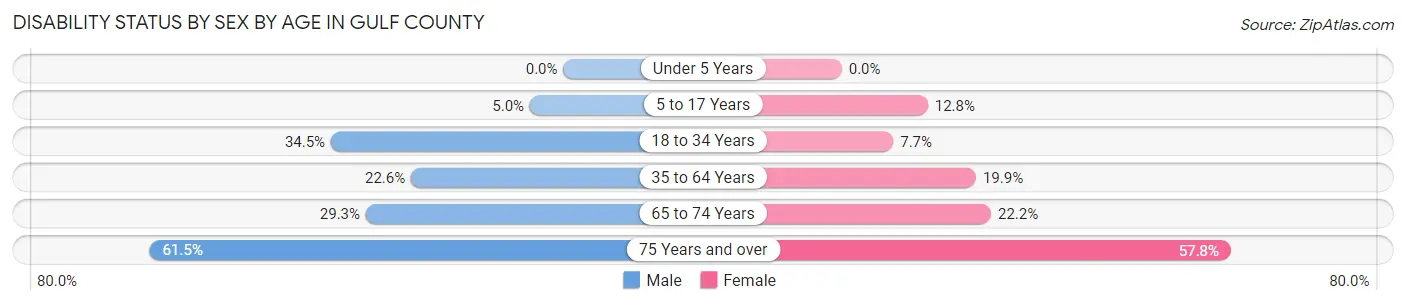
| Age Bracket | Male | Female |
| Under 5 Years | 0 (0.0%) | 0 (0.0%) |
| 5 to 17 Years | 46 (5.0%) | 94 (12.8%) |
| 18 to 34 Years | 313 (34.5%) | 74 (7.6%) |
| 35 to 64 Years | 528 (22.6%) | 516 (19.9%) |
| 65 to 74 Years | 315 (29.3%) | 232 (22.2%) |
| 75 Years and over | 365 (61.5%) | 368 (57.8%) |
Disability Class by Sex by Age in Gulf County
Disability Class: Hearing Difficulty
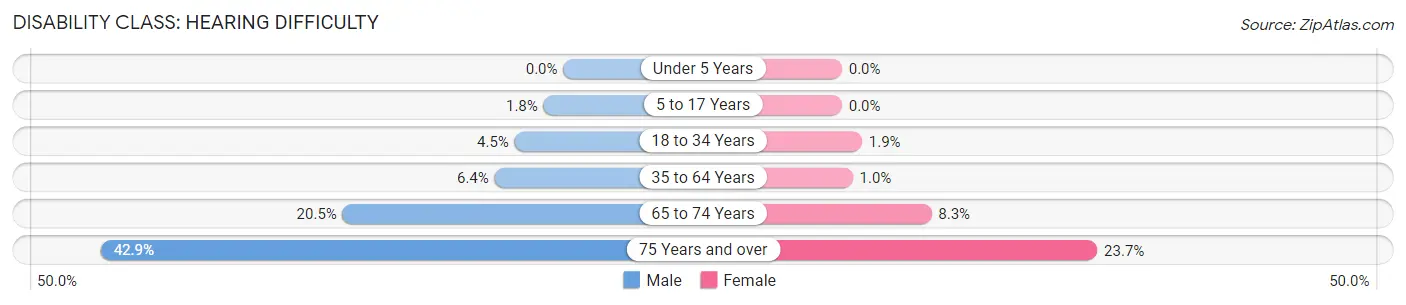
| Age Bracket | Male | Female |
| Under 5 Years | 0 (0.0%) | 0 (0.0%) |
| 5 to 17 Years | 17 (1.8%) | 0 (0.0%) |
| 18 to 34 Years | 41 (4.5%) | 18 (1.9%) |
| 35 to 64 Years | 149 (6.4%) | 26 (1.0%) |
| 65 to 74 Years | 220 (20.5%) | 87 (8.3%) |
| 75 Years and over | 255 (42.9%) | 151 (23.7%) |
Disability Class: Vision Difficulty
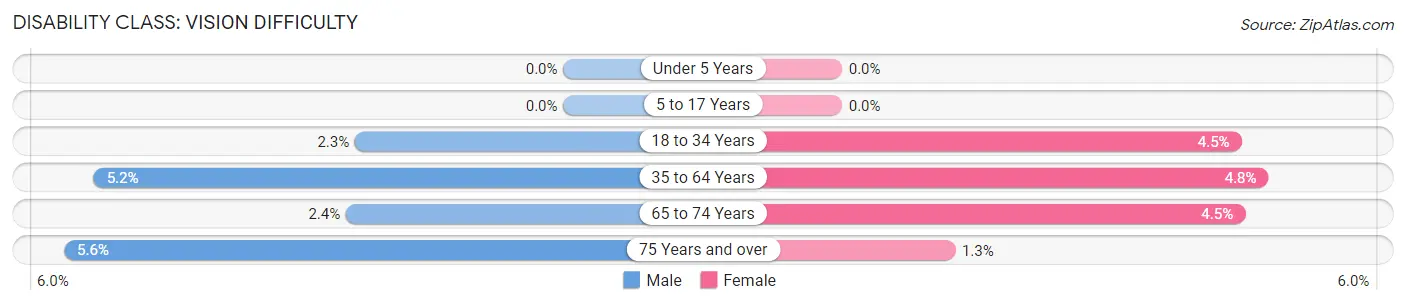
| Age Bracket | Male | Female |
| Under 5 Years | 0 (0.0%) | 0 (0.0%) |
| 5 to 17 Years | 0 (0.0%) | 0 (0.0%) |
| 18 to 34 Years | 21 (2.3%) | 43 (4.4%) |
| 35 to 64 Years | 122 (5.2%) | 123 (4.8%) |
| 65 to 74 Years | 26 (2.4%) | 47 (4.5%) |
| 75 Years and over | 33 (5.6%) | 8 (1.3%) |
Disability Class: Cognitive Difficulty
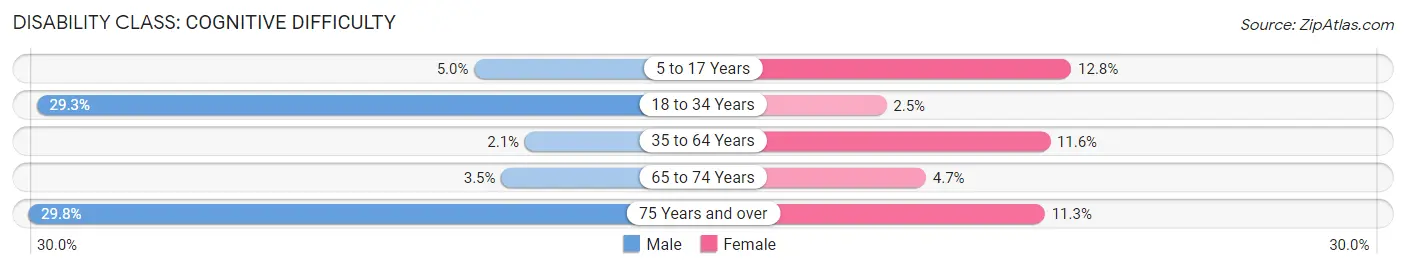
| Age Bracket | Male | Female |
| 5 to 17 Years | 46 (5.0%) | 94 (12.8%) |
| 18 to 34 Years | 266 (29.3%) | 24 (2.5%) |
| 35 to 64 Years | 50 (2.1%) | 300 (11.6%) |
| 65 to 74 Years | 37 (3.5%) | 49 (4.7%) |
| 75 Years and over | 177 (29.8%) | 72 (11.3%) |
Disability Class: Ambulatory Difficulty
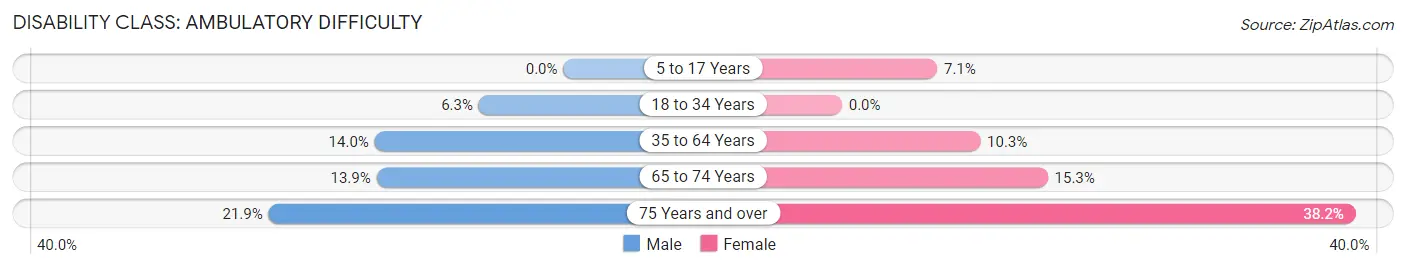
| Age Bracket | Male | Female |
| 5 to 17 Years | 0 (0.0%) | 52 (7.1%) |
| 18 to 34 Years | 57 (6.3%) | 0 (0.0%) |
| 35 to 64 Years | 327 (14.0%) | 266 (10.3%) |
| 65 to 74 Years | 149 (13.9%) | 160 (15.3%) |
| 75 Years and over | 130 (21.9%) | 243 (38.2%) |
Disability Class: Self-Care Difficulty
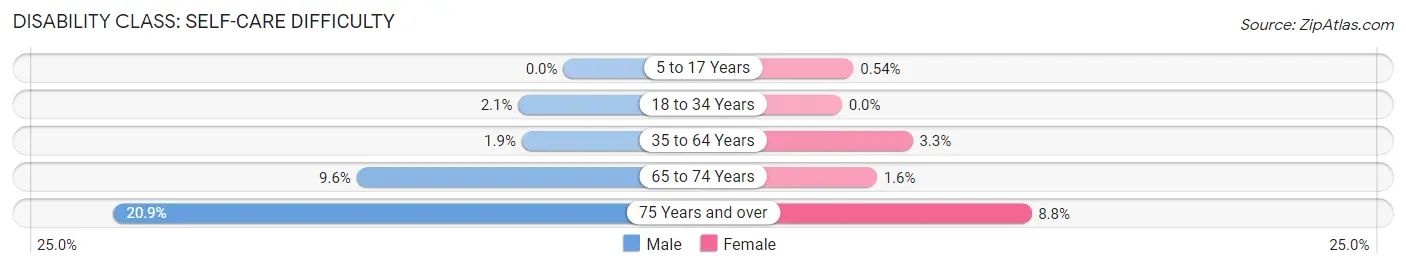
| Age Bracket | Male | Female |
| 5 to 17 Years | 0 (0.0%) | 4 (0.5%) |
| 18 to 34 Years | 19 (2.1%) | 0 (0.0%) |
| 35 to 64 Years | 45 (1.9%) | 85 (3.3%) |
| 65 to 74 Years | 103 (9.6%) | 17 (1.6%) |
| 75 Years and over | 124 (20.9%) | 56 (8.8%) |
Technology Access in Gulf County
Computing Device Access in Gulf County
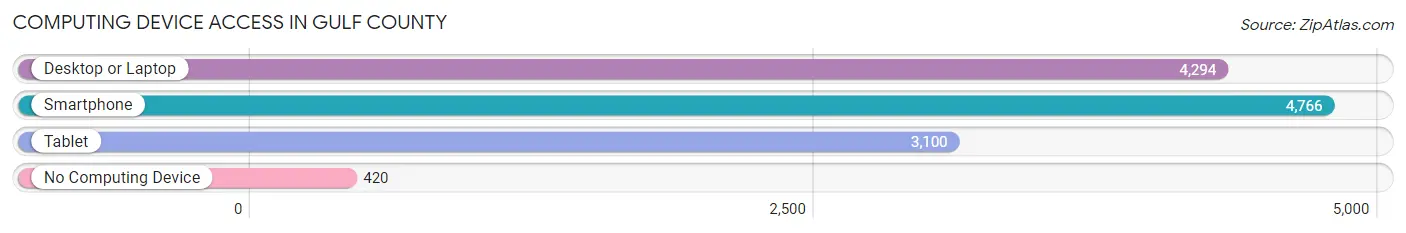
| Device Type | # Households | % Households |
| Desktop or Laptop | 4,294 | 76.0% |
| Smartphone | 4,766 | 84.4% |
| Tablet | 3,100 | 54.9% |
| No Computing Device | 420 | 7.4% |
| Total | 5,648 | 100.0% |
Internet Access in Gulf County
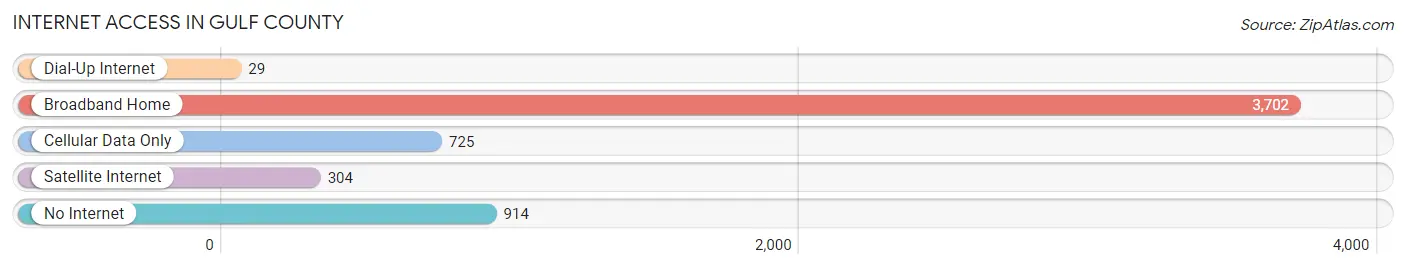
| Internet Type | # Households | % Households |
| Dial-Up Internet | 29 | 0.5% |
| Broadband Home | 3,702 | 65.5% |
| Cellular Data Only | 725 | 12.8% |
| Satellite Internet | 304 | 5.4% |
| No Internet | 914 | 16.2% |
| Total | 5,648 | 100.0% |
Gulf County Summary
Gulf County is a county located in the northwestern part of the U.S. state of Florida. As of the 2010 census, the population was 15,863. Its county seat is Port St. Joe. The county was created in 1925 and is named for the Gulf of Mexico, which borders the county to the south.
History
Gulf County was created in 1925 from parts of Calhoun and Bay counties. It was named for the Gulf of Mexico, which borders the county to the south. The county seat is Port St. Joe, which was founded in 1835.
The area was originally inhabited by Native Americans, including the Apalachee, Creek, and Seminole tribes. The first European settlers arrived in the area in the early 19th century, and the county was officially established in 1925.
Geography
Gulf County is located in the northwestern part of Florida, along the Gulf of Mexico. It is bordered by Bay County to the north, Calhoun County to the east, and Franklin County to the west. The county has a total area of 576 square miles, of which 545 square miles is land and 31 square miles is water.
The county is home to several rivers, including the Apalachicola, Chipola, and Econfina rivers. The county also contains several lakes, including Lake Wimico, Lake Alice, and Lake Powell.
The county is mostly flat, with some rolling hills in the northern part of the county. The highest point in the county is the summit of Cat Point Hill, which has an elevation of 85 feet.
Economy
Gulf County's economy is largely based on tourism and fishing. The county is home to several popular tourist destinations, including St. Joseph Peninsula State Park, Cape San Blas, and St. Vincent National Wildlife Refuge.
The county is also home to several seafood processing plants, which process shrimp, oysters, and other seafood. The county is also home to several timber companies, which harvest timber from the county's forests.
Demographics
As of the 2010 census, there were 15,863 people, 6,845 households, and 4,717 families residing in the county. The population density was 29.2 people per square mile. There were 8,845 housing units at an average density of 16.2 per square mile.
The racial makeup of the county was 87.2% White, 8.3% African American, 0.7% Native American, 0.4% Asian, 0.1% Pacific Islander, 1.3% from other races, and 2.1% from two or more races. Hispanic or Latino of any race were 4.2% of the population.
There were 6,845 households, out of which 24.2% had children under the age of 18 living with them, 51.2% were married couples living together, 11.7% had a female householder with no husband present, and 32.7% were non-families. 28.2% of all households were made up of individuals, and 12.7% had someone living alone who was 65 years of age or older. The average household size was 2.30 and the average family size was 2.78.
In the county, the population was spread out, with 20.7% under the age of 18, 6.7% from 18 to 24, 24.2% from 25 to 44, 28.2% from 45 to 64, and 20.2% who were 65 years of age or older. The median age was 43 years. For every 100 females, there were 96.2 males. For every 100 females age 18 and over, there were 93.7 males.
The median income for a household in the county was $32,845, and the median income for a family was $39,813. Males had a median income of $30,890 versus $21,845 for females. The per capita income for the county was $18,845. About 11.7% of families and 15.2% of the population were below the poverty line, including 22.2% of those under age 18 and 11.2% of those age 65 or over.
Common Questions
What is Per Capita Income in Gulf County?
Per Capita income in Gulf County is $30,011.
What is the Median Family Income in Gulf County?
Median Family Income in Gulf County is $70,654.
What is the Median Household income in Gulf County?
Median Household Income in Gulf County is $56,250.
What is Income or Wage Gap in Gulf County?
Income or Wage Gap in Gulf County is 24.7%.
Women in Gulf County earn 75.3 cents for every dollar earned by a man.
What is Family Income Deficit in Gulf County?
Family Income Deficit in Gulf County is $10,440.
Families that are below poverty line in Gulf County earn $10,440 less on average than the poverty threshold level.
What is Inequality or Gini Index in Gulf County?
Inequality or Gini Index in Gulf County is 0.45.
What is the Total Population of Gulf County?
Total Population of Gulf County is 15,002.
What is the Total Male Population of Gulf County?
Total Male Population of Gulf County is 8,629.
What is the Total Female Population of Gulf County?
Total Female Population of Gulf County is 6,373.
What is the Ratio of Males per 100 Females in Gulf County?
There are 135.40 Males per 100 Females in Gulf County.
What is the Ratio of Females per 100 Males in Gulf County?
There are 73.86 Females per 100 Males in Gulf County.
What is the Median Population Age in Gulf County?
Median Population Age in Gulf County is 46.5 Years.
What is the Average Family Size in Gulf County
Average Family Size in Gulf County is 2.7 People.
What is the Average Household Size in Gulf County
Average Household Size in Gulf County is 2.2 People.
How Large is the Labor Force in Gulf County?
There are 5,536 People in the Labor Forcein in Gulf County.
What is the Percentage of People in the Labor Force in Gulf County?
42.4% of People are in the Labor Force in Gulf County.
What is the Unemployment Rate in Gulf County?
Unemployment Rate in Gulf County is 4.3%.