Franklin County, FL Map & Demographics
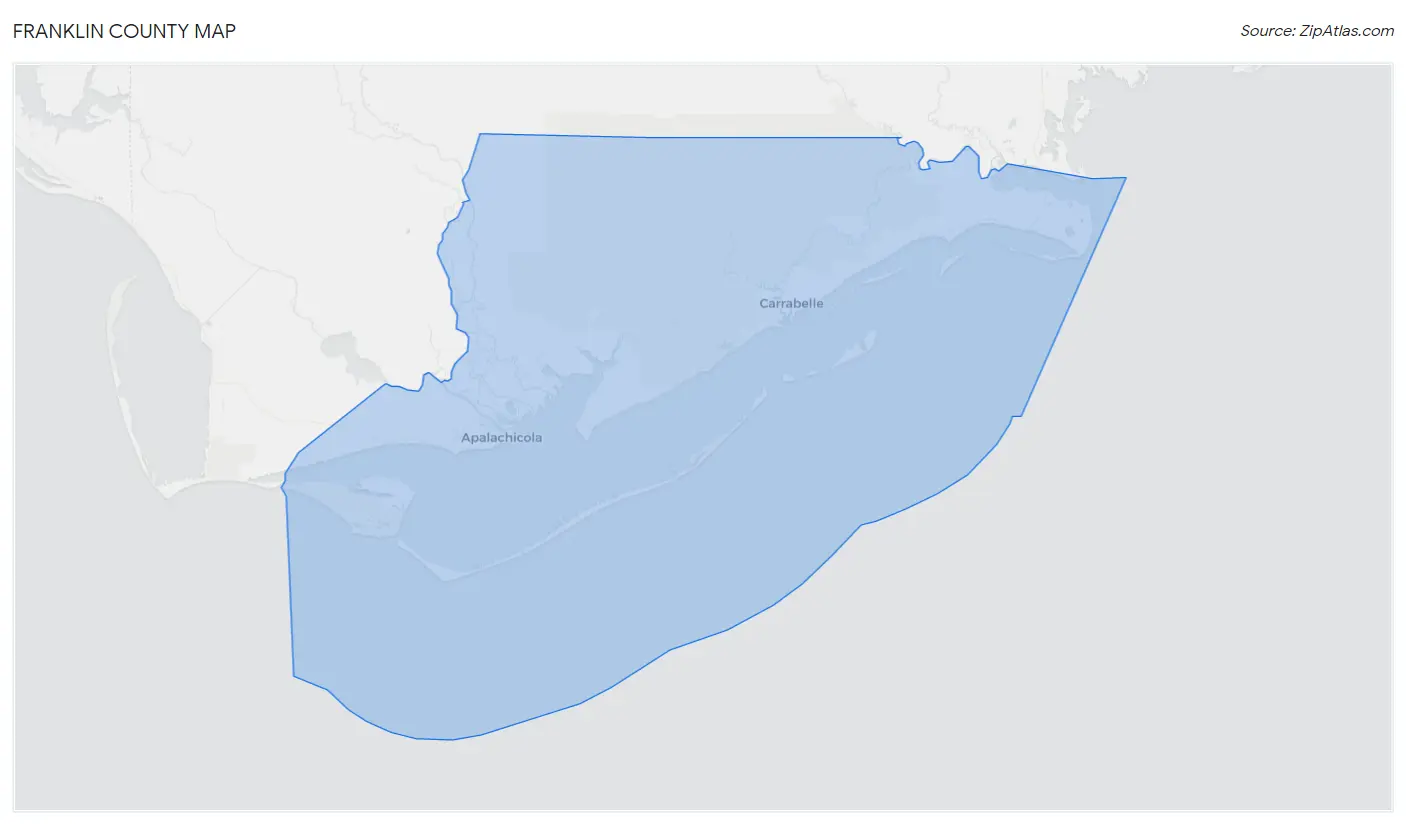
Franklin County Map
Franklin County Overview
$31,433
PER CAPITA INCOME
$65,462
AVG FAMILY INCOME
$58,107
AVG HOUSEHOLD INCOME
15.9%
WAGE / INCOME GAP [ % ]
84.1¢/ $1
WAGE / INCOME GAP [ $ ]
$9,330
FAMILY INCOME DEFICIT
0.48
INEQUALITY / GINI INDEX
12,276
TOTAL POPULATION
6,827
MALE POPULATION
5,449
FEMALE POPULATION
125.29
MALES / 100 FEMALES
79.82
FEMALES / 100 MALES
48.7
MEDIAN AGE
2.8
AVG FAMILY SIZE
2.2
AVG HOUSEHOLD SIZE
4,671
LABOR FORCE [ PEOPLE ]
44.6%
PERCENT IN LABOR FORCE
8.9%
UNEMPLOYMENT RATE
Franklin County Area Codes
Income in Franklin County
Income Overview in Franklin County
Per Capita Income in Franklin County is $31,433, while median incomes of families and households are $65,462 and $58,107 respectively.
| Characteristic | Number | Measure |
| Per Capita Income | 12,276 | $31,433 |
| Median Family Income | 2,963 | $65,462 |
| Mean Family Income | 2,963 | $90,856 |
| Median Household Income | 4,761 | $58,107 |
| Mean Household Income | 4,761 | $77,080 |
| Income Deficit | 2,963 | $9,330 |
| Wage / Income Gap (%) | 12,276 | 15.87% |
| Wage / Income Gap ($) | 12,276 | 84.13¢ per $1 |
| Gini / Inequality Index | 12,276 | 0.48 |
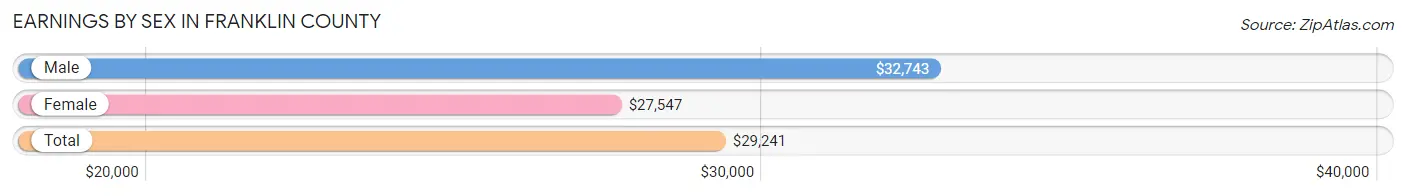
Earnings by Sex in Franklin County
Average Earnings in Franklin County are $29,241, $32,743 for men and $27,547 for women, a difference of 15.9%.
| Sex | Number | Average Earnings |
| Male | 2,581 (52.0%) | $32,743 |
| Female | 2,384 (48.0%) | $27,547 |
| Total | 4,965 (100.0%) | $29,241 |
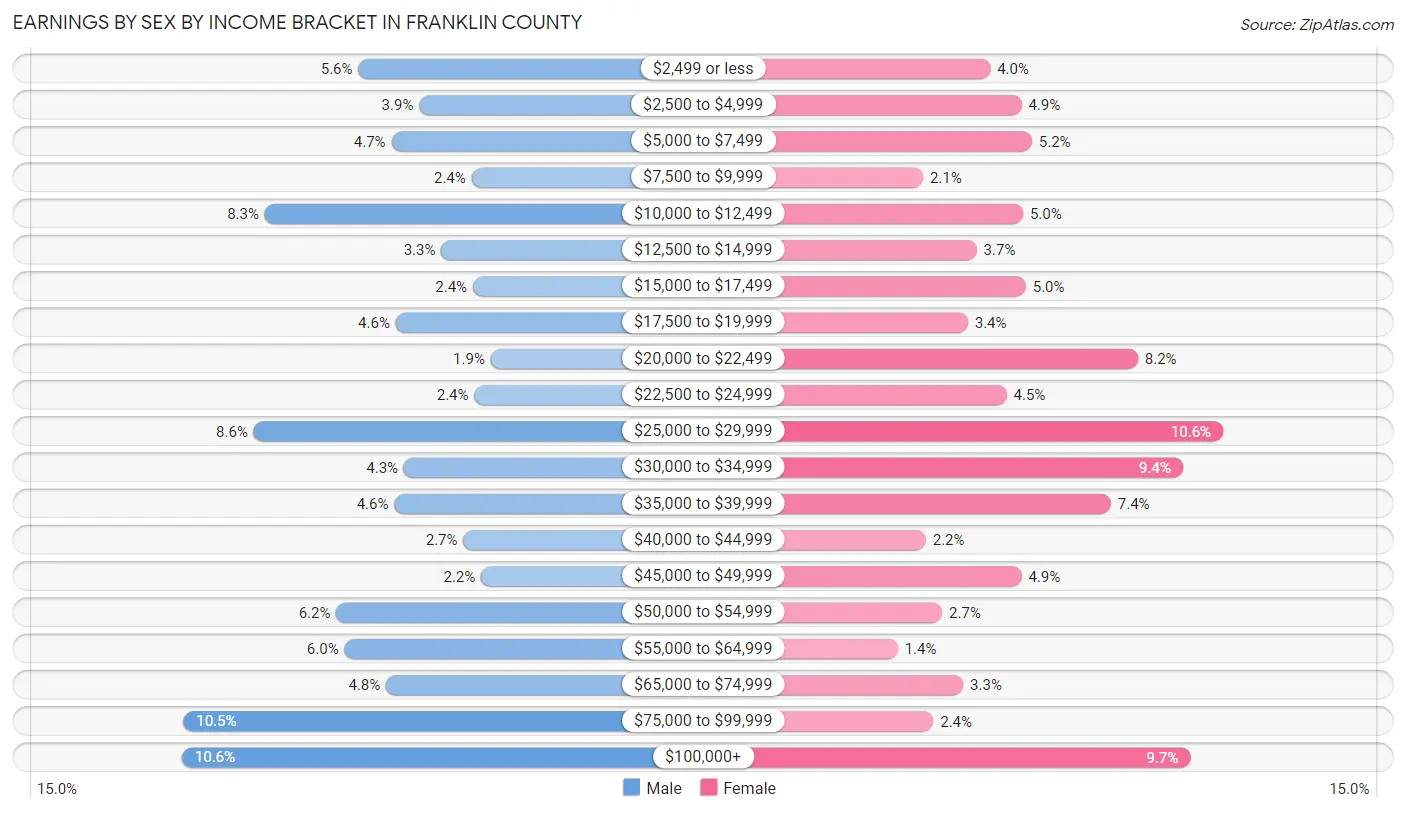
Earnings by Sex by Income Bracket in Franklin County
The most common earnings brackets in Franklin County are $100,000+ for men (273 | 10.6%) and $25,000 to $29,999 for women (252 | 10.6%).
| Income | Male | Female |
| $2,499 or less | 145 (5.6%) | 96 (4.0%) |
| $2,500 to $4,999 | 101 (3.9%) | 117 (4.9%) |
| $5,000 to $7,499 | 121 (4.7%) | 124 (5.2%) |
| $7,500 to $9,999 | 63 (2.4%) | 51 (2.1%) |
| $10,000 to $12,499 | 213 (8.3%) | 118 (5.0%) |
| $12,500 to $14,999 | 85 (3.3%) | 87 (3.6%) |
| $15,000 to $17,499 | 62 (2.4%) | 120 (5.0%) |
| $17,500 to $19,999 | 118 (4.6%) | 81 (3.4%) |
| $20,000 to $22,499 | 49 (1.9%) | 195 (8.2%) |
| $22,500 to $24,999 | 61 (2.4%) | 107 (4.5%) |
| $25,000 to $29,999 | 221 (8.6%) | 252 (10.6%) |
| $30,000 to $34,999 | 112 (4.3%) | 225 (9.4%) |
| $35,000 to $39,999 | 119 (4.6%) | 177 (7.4%) |
| $40,000 to $44,999 | 69 (2.7%) | 53 (2.2%) |
| $45,000 to $49,999 | 56 (2.2%) | 117 (4.9%) |
| $50,000 to $54,999 | 161 (6.2%) | 64 (2.7%) |
| $55,000 to $64,999 | 155 (6.0%) | 34 (1.4%) |
| $65,000 to $74,999 | 125 (4.8%) | 78 (3.3%) |
| $75,000 to $99,999 | 272 (10.5%) | 58 (2.4%) |
| $100,000+ | 273 (10.6%) | 230 (9.7%) |
| Total | 2,581 (100.0%) | 2,384 (100.0%) |
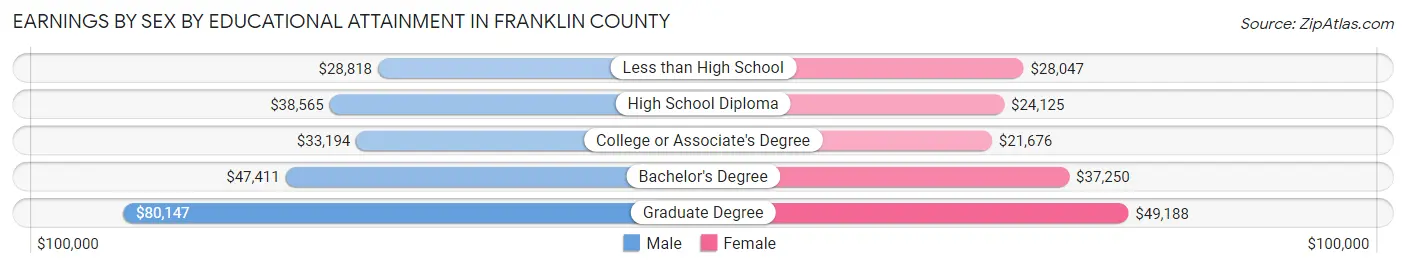
Earnings by Sex by Educational Attainment in Franklin County
Average earnings in Franklin County are $36,875 for men and $28,179 for women, a difference of 23.6%. Men with an educational attainment of graduate degree enjoy the highest average annual earnings of $80,147, while those with less than high school education earn the least with $28,818. Women with an educational attainment of graduate degree earn the most with the average annual earnings of $49,188, while those with college or associate's degree education have the smallest earnings of $21,676.
| Educational Attainment | Male Income | Female Income |
| Less than High School | $28,818 | $28,047 |
| High School Diploma | $38,565 | $24,125 |
| College or Associate's Degree | $33,194 | $21,676 |
| Bachelor's Degree | $47,411 | $37,250 |
| Graduate Degree | $80,147 | $49,188 |
| Total | $36,875 | $28,179 |
Family Income in Franklin County
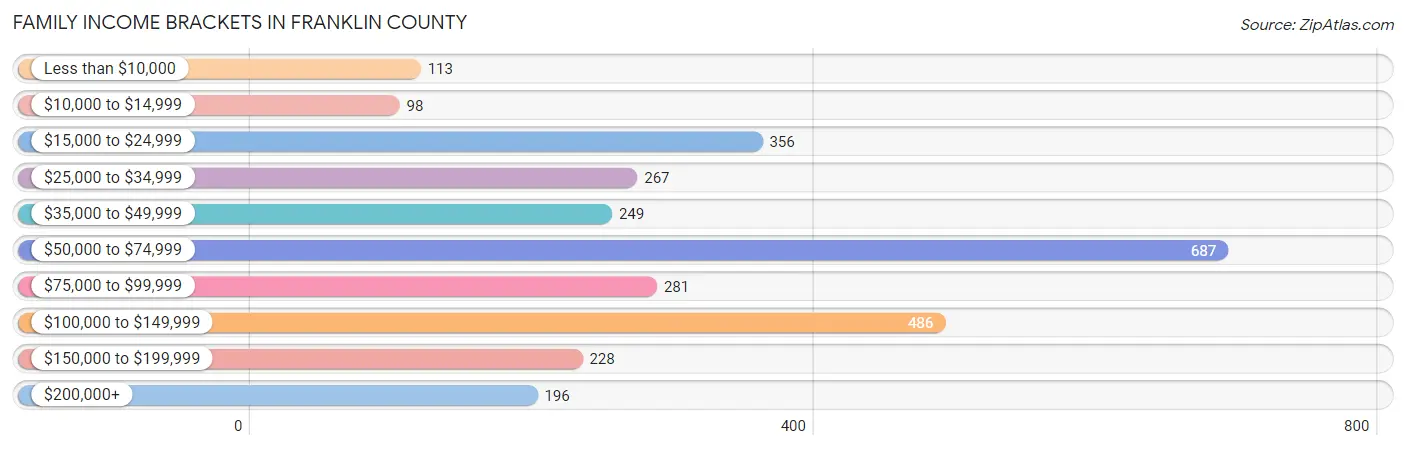
Family Income Brackets in Franklin County
According to the Franklin County family income data, there are 687 families falling into the $50,000 to $74,999 income range, which is the most common income bracket and makes up 23.2% of all families. Conversely, the $10,000 to $14,999 income bracket is the least frequent group with only 98 families (3.3%) belonging to this category.
| Income Bracket | # Families | % Families |
| Less than $10,000 | 113 | 3.8% |
| $10,000 to $14,999 | 98 | 3.3% |
| $15,000 to $24,999 | 356 | 12.0% |
| $25,000 to $34,999 | 267 | 9.0% |
| $35,000 to $49,999 | 249 | 8.4% |
| $50,000 to $74,999 | 687 | 23.2% |
| $75,000 to $99,999 | 281 | 9.5% |
| $100,000 to $149,999 | 486 | 16.4% |
| $150,000 to $199,999 | 228 | 7.7% |
| $200,000+ | 196 | 6.6% |
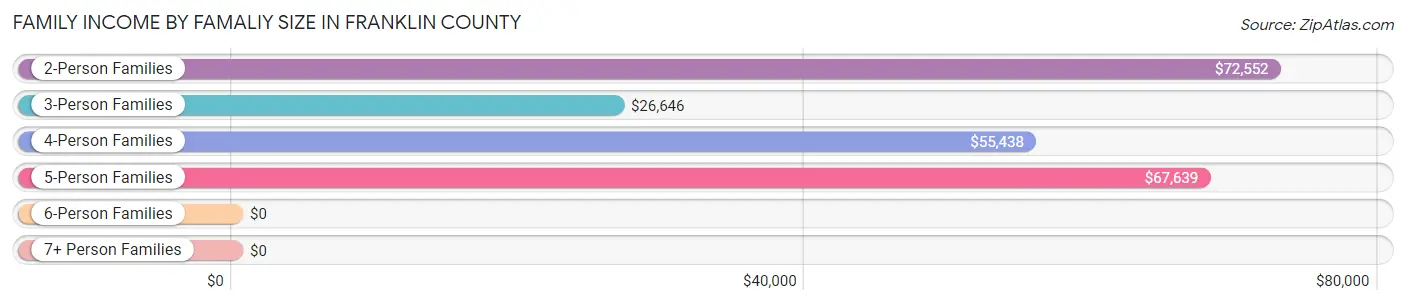
Family Income by Famaliy Size in Franklin County
2-person families (1,819 | 61.4%) account for the highest median family income in Franklin County with $72,552 per family, while 2-person families (1,819 | 61.4%) have the highest median income of $36,276 per family member.
| Income Bracket | # Families | Median Income |
| 2-Person Families | 1,819 (61.4%) | $72,552 |
| 3-Person Families | 546 (18.4%) | $26,646 |
| 4-Person Families | 331 (11.2%) | $55,438 |
| 5-Person Families | 246 (8.3%) | $67,639 |
| 6-Person Families | 0 (0.0%) | $0 |
| 7+ Person Families | 21 (0.7%) | $0 |
| Total | 2,963 (100.0%) | $65,462 |
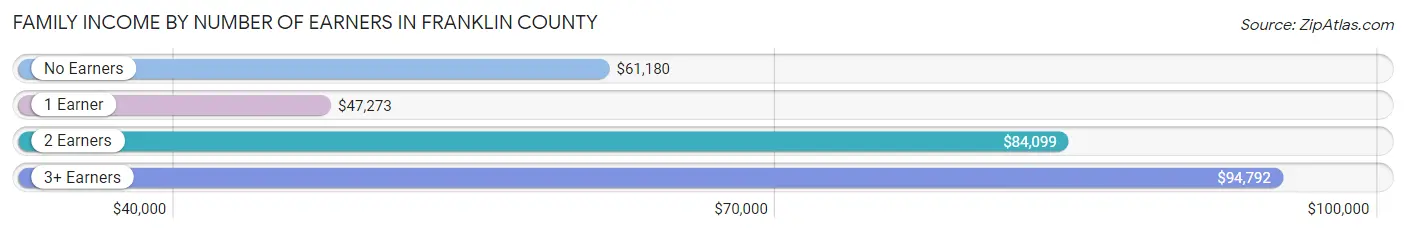
Family Income by Number of Earners in Franklin County
The median family income in Franklin County is $65,462, with families comprising 3+ earners (119) having the highest median family income of $94,792, while families with 1 earner (1,136) have the lowest median family income of $47,273, accounting for 4.0% and 38.3% of families, respectively.
| Number of Earners | # Families | Median Income |
| No Earners | 813 (27.4%) | $61,180 |
| 1 Earner | 1,136 (38.3%) | $47,273 |
| 2 Earners | 895 (30.2%) | $84,099 |
| 3+ Earners | 119 (4.0%) | $94,792 |
| Total | 2,963 (100.0%) | $65,462 |
Household Income in Franklin County
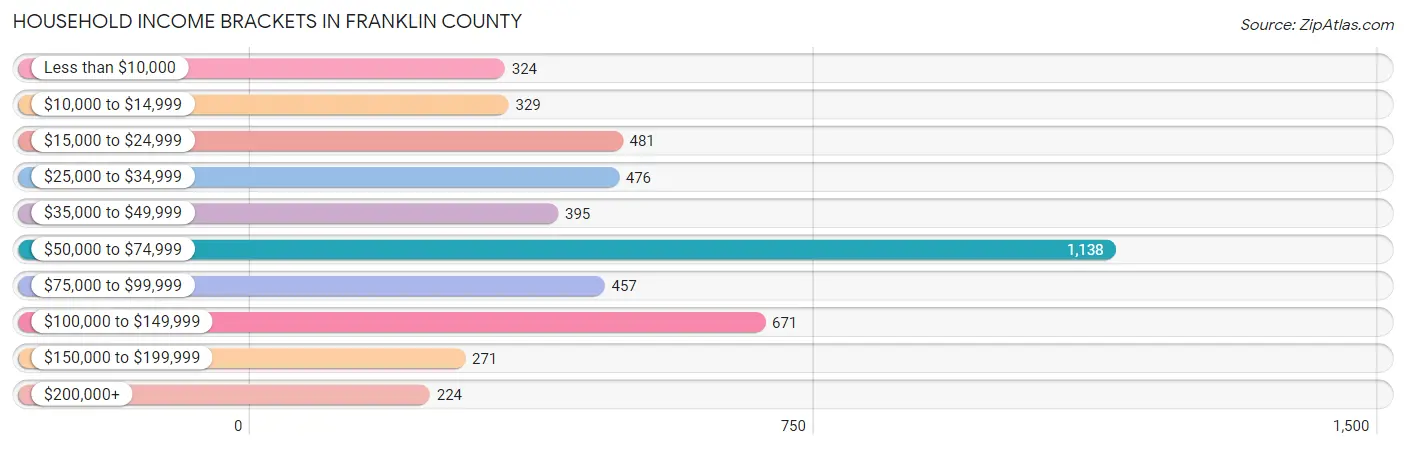
Household Income Brackets in Franklin County
With 1,138 households falling in the category, the $50,000 to $74,999 income range is the most frequent in Franklin County, accounting for 23.9% of all households. In contrast, only 224 households (4.7%) fall into the $200,000+ income bracket, making it the least populous group.
| Income Bracket | # Households | % Households |
| Less than $10,000 | 324 | 6.8% |
| $10,000 to $14,999 | 329 | 6.9% |
| $15,000 to $24,999 | 481 | 10.1% |
| $25,000 to $34,999 | 476 | 10.0% |
| $35,000 to $49,999 | 395 | 8.3% |
| $50,000 to $74,999 | 1,138 | 23.9% |
| $75,000 to $99,999 | 457 | 9.6% |
| $100,000 to $149,999 | 671 | 14.1% |
| $150,000 to $199,999 | 271 | 5.7% |
| $200,000+ | 224 | 4.7% |
Household Income by Householder Age in Franklin County
The median household income in Franklin County is $58,107, with the highest median household income of $71,149 found in the 45 to 64 years age bracket for the primary householder. A total of 1,705 households (35.8%) fall into this category. Meanwhile, the 15 to 24 years age bracket for the primary householder has the lowest median household income of $0, with 31 households (0.6%) in this group.
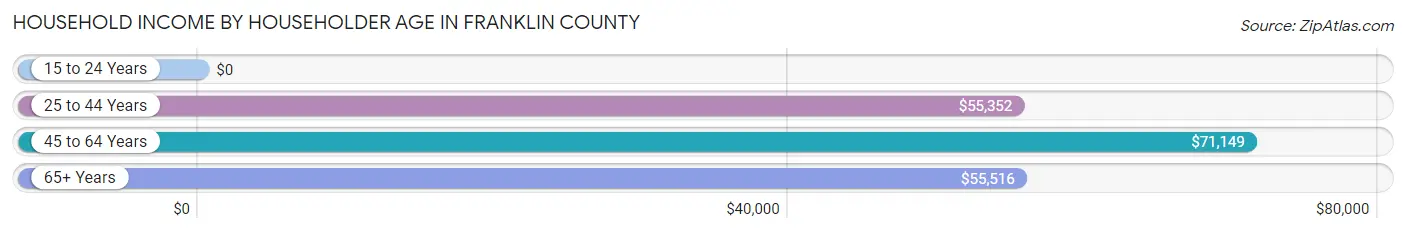
| Income Bracket | # Households | Median Income |
| 15 to 24 Years | 31 (0.6%) | $0 |
| 25 to 44 Years | 960 (20.2%) | $55,352 |
| 45 to 64 Years | 1,705 (35.8%) | $71,149 |
| 65+ Years | 2,065 (43.4%) | $55,516 |
| Total | 4,761 (100.0%) | $58,107 |
Poverty in Franklin County
Income Below Poverty by Sex and Age in Franklin County
With 20.4% poverty level for males and 22.9% for females among the residents of Franklin County, 5 year old males and under 5 year old females are the most vulnerable to poverty, with 20 males (95.2%) and 108 females (61.7%) in their respective age groups living below the poverty level.
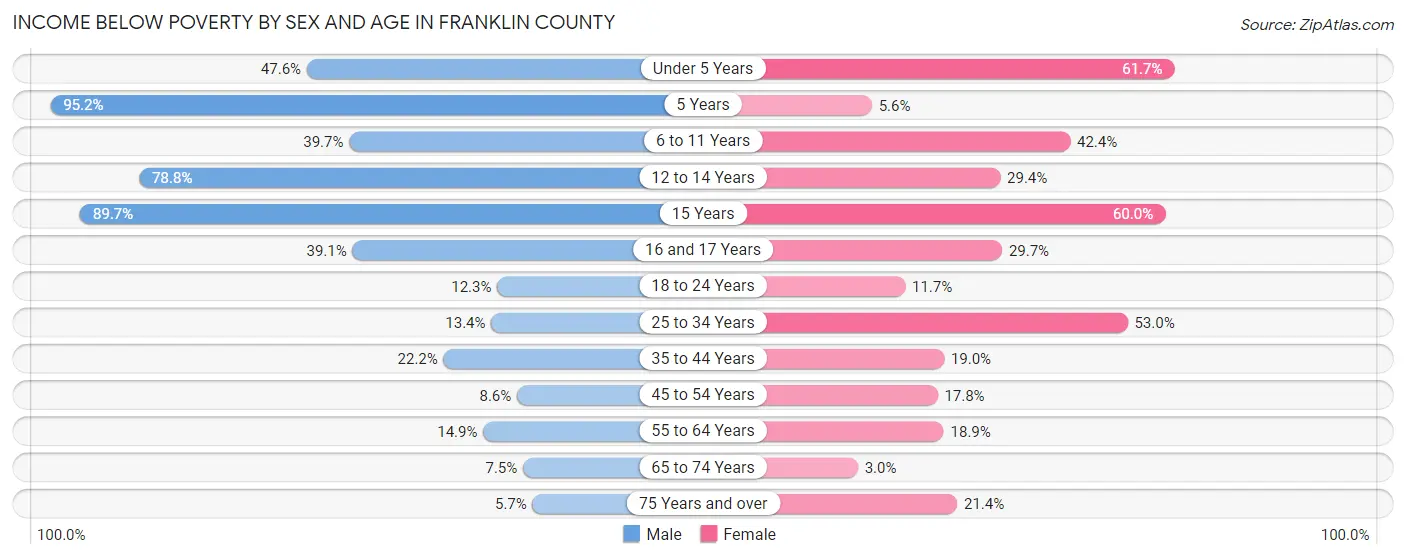
| Age Bracket | Male | Female |
| Under 5 Years | 129 (47.6%) | 108 (61.7%) |
| 5 Years | 20 (95.2%) | 1 (5.6%) |
| 6 to 11 Years | 149 (39.7%) | 147 (42.4%) |
| 12 to 14 Years | 152 (78.8%) | 57 (29.4%) |
| 15 Years | 105 (89.7%) | 42 (60.0%) |
| 16 and 17 Years | 36 (39.1%) | 11 (29.7%) |
| 18 to 24 Years | 38 (12.3%) | 31 (11.7%) |
| 25 to 34 Years | 62 (13.4%) | 271 (53.0%) |
| 35 to 44 Years | 114 (22.2%) | 106 (19.0%) |
| 45 to 54 Years | 52 (8.6%) | 123 (17.7%) |
| 55 to 64 Years | 129 (14.9%) | 193 (18.9%) |
| 65 to 74 Years | 68 (7.5%) | 28 (2.9%) |
| 75 Years and over | 34 (5.7%) | 119 (21.4%) |
| Total | 1,088 (20.4%) | 1,237 (22.9%) |
Income Above Poverty by Sex and Age in Franklin County
According to the poverty statistics in Franklin County, males aged 75 years and over and females aged 65 to 74 years are the age groups that are most secure financially, with 94.3% of males and 97.1% of females in these age groups living above the poverty line.
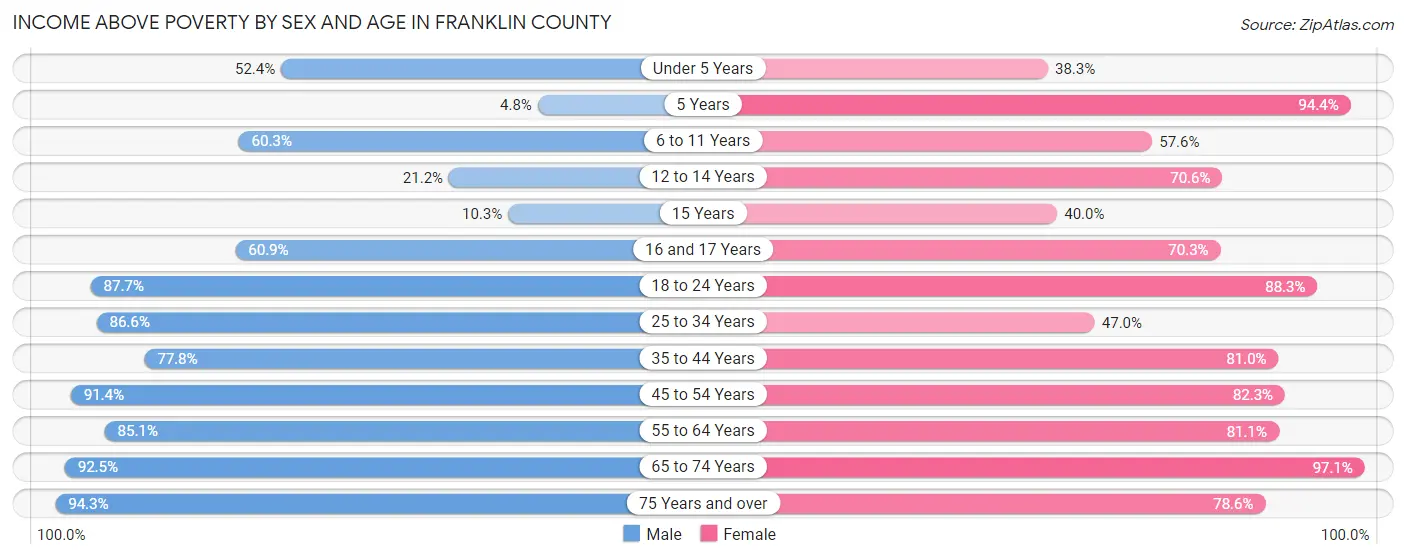
| Age Bracket | Male | Female |
| Under 5 Years | 142 (52.4%) | 67 (38.3%) |
| 5 Years | 1 (4.8%) | 17 (94.4%) |
| 6 to 11 Years | 226 (60.3%) | 200 (57.6%) |
| 12 to 14 Years | 41 (21.2%) | 137 (70.6%) |
| 15 Years | 12 (10.3%) | 28 (40.0%) |
| 16 and 17 Years | 56 (60.9%) | 26 (70.3%) |
| 18 to 24 Years | 272 (87.7%) | 233 (88.3%) |
| 25 to 34 Years | 402 (86.6%) | 240 (47.0%) |
| 35 to 44 Years | 399 (77.8%) | 453 (81.0%) |
| 45 to 54 Years | 554 (91.4%) | 570 (82.3%) |
| 55 to 64 Years | 739 (85.1%) | 828 (81.1%) |
| 65 to 74 Years | 842 (92.5%) | 920 (97.1%) |
| 75 Years and over | 563 (94.3%) | 437 (78.6%) |
| Total | 4,249 (79.6%) | 4,156 (77.1%) |
Income Below Poverty Among Married-Couple Families in Franklin County
The poverty statistics for married-couple families in Franklin County show that 5.2% or 112 of the total 2,163 families live below the poverty line. Families with 5 or more children have the highest poverty rate of 61.9%, comprising of 13 families. On the other hand, families with 3 or 4 children have the lowest poverty rate of 0.0%, which includes 0 families.
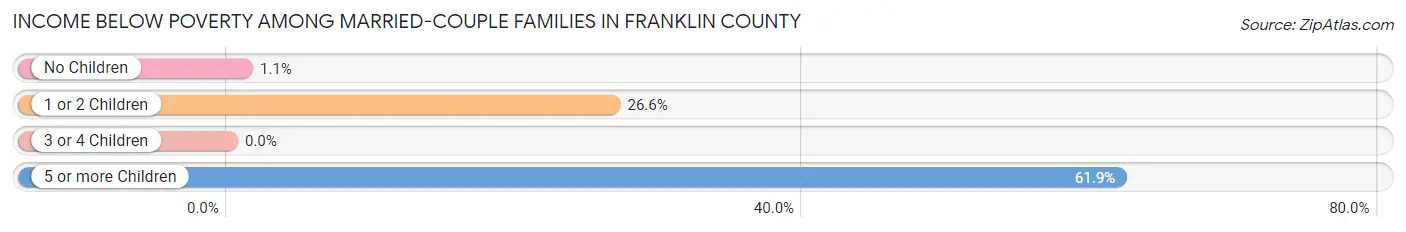
| Children | Above Poverty | Below Poverty |
| No Children | 1,692 (99.0%) | 18 (1.1%) |
| 1 or 2 Children | 223 (73.4%) | 81 (26.6%) |
| 3 or 4 Children | 128 (100.0%) | 0 (0.0%) |
| 5 or more Children | 8 (38.1%) | 13 (61.9%) |
| Total | 2,051 (94.8%) | 112 (5.2%) |
Income Below Poverty Among Single-Parent Households in Franklin County
According to the poverty data in Franklin County, 22.6% or 35 single-father households and 45.0% or 290 single-mother households are living below the poverty line. Among single-father households, those with 3 or 4 children have the highest poverty rate, with 8 households (100.0%) experiencing poverty. Likewise, among single-mother households, those with 3 or 4 children have the highest poverty rate, with 65 households (64.4%) falling below the poverty line.
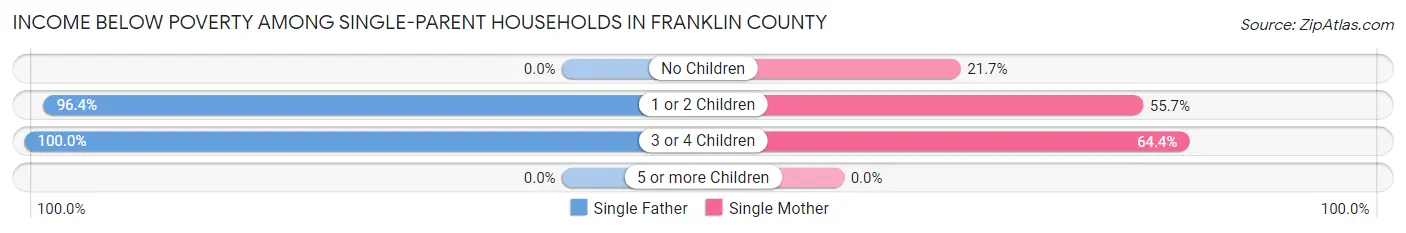
| Children | Single Father | Single Mother |
| No Children | 0 (0.0%) | 50 (21.7%) |
| 1 or 2 Children | 27 (96.4%) | 175 (55.7%) |
| 3 or 4 Children | 8 (100.0%) | 65 (64.4%) |
| 5 or more Children | 0 (0.0%) | 0 (0.0%) |
| Total | 35 (22.6%) | 290 (45.0%) |
Income Below Poverty Among Married-Couple vs Single-Parent Households in Franklin County
The poverty data for Franklin County shows that 112 of the married-couple family households (5.2%) and 325 of the single-parent households (40.6%) are living below the poverty level. Within the married-couple family households, those with 5 or more children have the highest poverty rate, with 13 households (61.9%) falling below the poverty line. Among the single-parent households, those with 3 or 4 children have the highest poverty rate, with 73 household (67.0%) living below poverty.
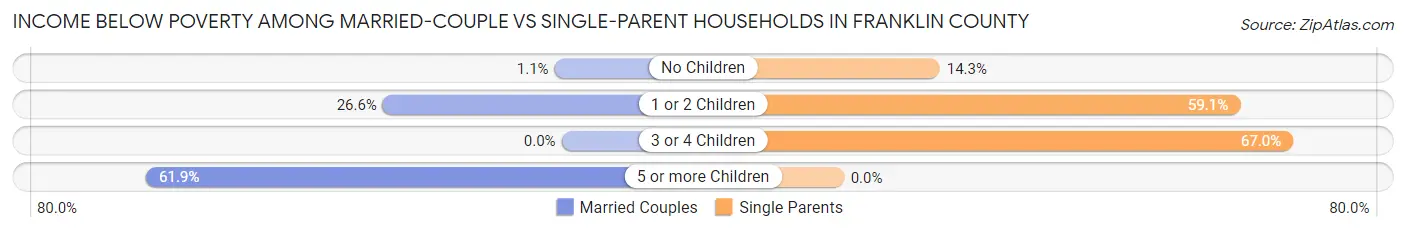
| Children | Married-Couple Families | Single-Parent Households |
| No Children | 18 (1.1%) | 50 (14.3%) |
| 1 or 2 Children | 81 (26.6%) | 202 (59.1%) |
| 3 or 4 Children | 0 (0.0%) | 73 (67.0%) |
| 5 or more Children | 13 (61.9%) | 0 (0.0%) |
| Total | 112 (5.2%) | 325 (40.6%) |
Race in Franklin County
The most populous races in Franklin County are White / Caucasian (9,598 | 78.2%), Black / African American (1,342 | 10.9%), and Two or more Races (903 | 7.4%).
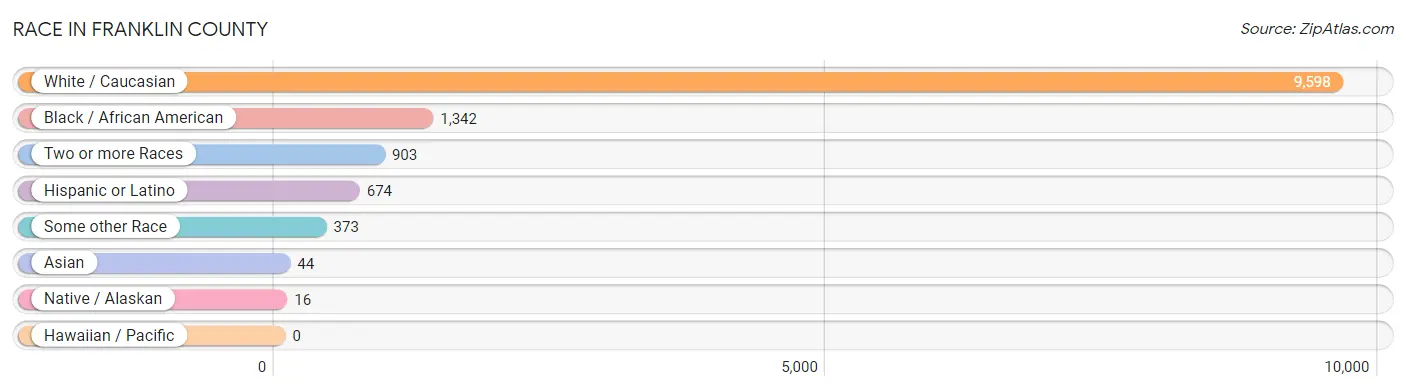
| Race | # Population | % Population |
| Asian | 44 | 0.4% |
| Black / African American | 1,342 | 10.9% |
| Hawaiian / Pacific | 0 | 0.0% |
| Hispanic or Latino | 674 | 5.5% |
| Native / Alaskan | 16 | 0.1% |
| White / Caucasian | 9,598 | 78.2% |
| Two or more Races | 903 | 7.4% |
| Some other Race | 373 | 3.0% |
| Total | 12,276 | 100.0% |
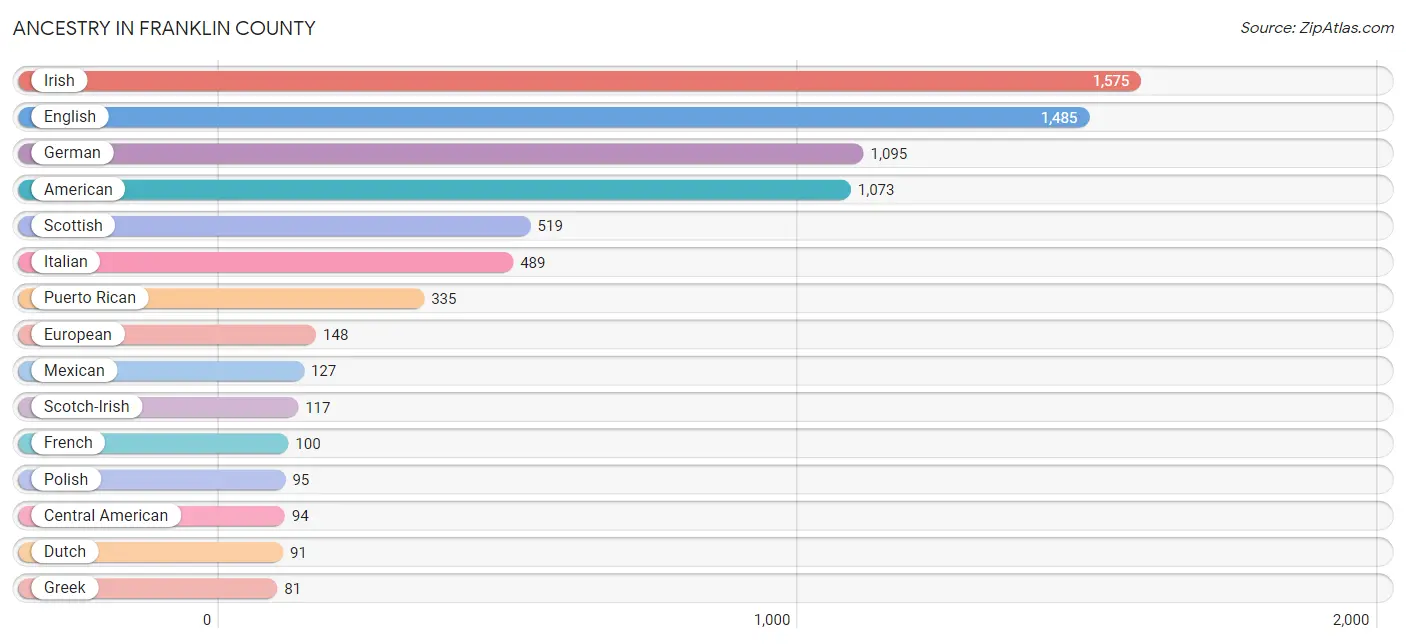
Ancestry in Franklin County
The most populous ancestries reported in Franklin County are Irish (1,575 | 12.8%), English (1,485 | 12.1%), German (1,095 | 8.9%), American (1,073 | 8.7%), and Scottish (519 | 4.2%), together accounting for 46.8% of all Franklin County residents.
| Ancestry | # Population | % Population |
| African | 76 | 0.6% |
| American | 1,073 | 8.7% |
| Arab | 76 | 0.6% |
| Australian | 10 | 0.1% |
| Austrian | 11 | 0.1% |
| Belgian | 9 | 0.1% |
| Bhutanese | 7 | 0.1% |
| Blackfeet | 17 | 0.1% |
| Brazilian | 6 | 0.1% |
| British | 56 | 0.5% |
| Cajun | 5 | 0.0% |
| Central American | 94 | 0.8% |
| Central American Indian | 1 | 0.0% |
| Cherokee | 64 | 0.5% |
| Chilean | 11 | 0.1% |
| Creek | 24 | 0.2% |
| Cuban | 35 | 0.3% |
| Czech | 3 | 0.0% |
| Danish | 45 | 0.4% |
| Dominican | 33 | 0.3% |
| Dutch | 91 | 0.7% |
| Eastern European | 49 | 0.4% |
| Ecuadorian | 5 | 0.0% |
| English | 1,485 | 12.1% |
| European | 148 | 1.2% |
| Finnish | 4 | 0.0% |
| French | 100 | 0.8% |
| French Canadian | 59 | 0.5% |
| German | 1,095 | 8.9% |
| Greek | 81 | 0.7% |
| Guatemalan | 60 | 0.5% |
| Haitian | 49 | 0.4% |
| Hungarian | 15 | 0.1% |
| Iranian | 3 | 0.0% |
| Irish | 1,575 | 12.8% |
| Italian | 489 | 4.0% |
| Jamaican | 27 | 0.2% |
| Lebanese | 76 | 0.6% |
| Lithuanian | 10 | 0.1% |
| Luxembourger | 3 | 0.0% |
| Mexican | 127 | 1.0% |
| Nicaraguan | 3 | 0.0% |
| Northern European | 26 | 0.2% |
| Norwegian | 9 | 0.1% |
| Pakistani | 34 | 0.3% |
| Panamanian | 18 | 0.2% |
| Polish | 95 | 0.8% |
| Portuguese | 66 | 0.5% |
| Puerto Rican | 335 | 2.7% |
| Romanian | 22 | 0.2% |
| Russian | 66 | 0.5% |
| Salvadoran | 13 | 0.1% |
| Scandinavian | 60 | 0.5% |
| Scotch-Irish | 117 | 0.9% |
| Scottish | 519 | 4.2% |
| Sioux | 3 | 0.0% |
| Slovene | 14 | 0.1% |
| South American | 32 | 0.3% |
| Spaniard | 15 | 0.1% |
| Spanish | 3 | 0.0% |
| Subsaharan African | 76 | 0.6% |
| Swedish | 11 | 0.1% |
| Swiss | 17 | 0.1% |
| Trinidadian and Tobagonian | 8 | 0.1% |
| U.S. Virgin Islander | 3 | 0.0% |
| Venezuelan | 16 | 0.1% |
| Welsh | 51 | 0.4% |
| West Indian | 5 | 0.0% |
| Yaqui | 7 | 0.1% | View All 69 Rows |
Immigrants in Franklin County
The most numerous immigrant groups reported in Franklin County came from Latin America (275 | 2.2%), Europe (120 | 1.0%), Central America (114 | 0.9%), Caribbean (111 | 0.9%), and Northern Europe (95 | 0.8%), together accounting for 5.8% of all Franklin County residents.
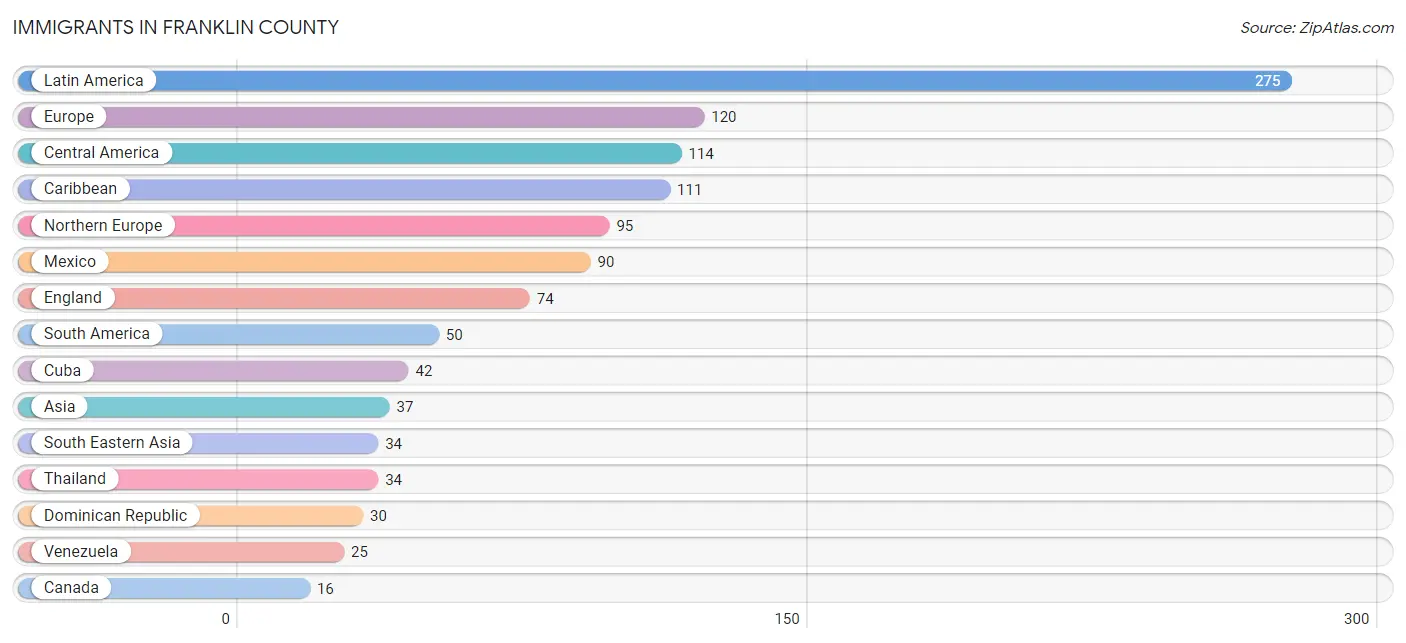
| Immigration Origin | # Population | % Population |
| Asia | 37 | 0.3% |
| Australia | 10 | 0.1% |
| Brazil | 9 | 0.1% |
| Canada | 16 | 0.1% |
| Caribbean | 111 | 0.9% |
| Central America | 114 | 0.9% |
| Chile | 11 | 0.1% |
| Cuba | 42 | 0.3% |
| Dominican Republic | 30 | 0.2% |
| Eastern Europe | 13 | 0.1% |
| Ecuador | 5 | 0.0% |
| El Salvador | 11 | 0.1% |
| England | 74 | 0.6% |
| Europe | 120 | 1.0% |
| Guatemala | 6 | 0.1% |
| Haiti | 16 | 0.1% |
| Iran | 3 | 0.0% |
| Jamaica | 15 | 0.1% |
| Latin America | 275 | 2.2% |
| Mexico | 90 | 0.7% |
| Netherlands | 10 | 0.1% |
| Nicaragua | 3 | 0.0% |
| Northern Europe | 95 | 0.8% |
| Oceania | 10 | 0.1% |
| Panama | 4 | 0.0% |
| Romania | 13 | 0.1% |
| Scotland | 12 | 0.1% |
| South America | 50 | 0.4% |
| South Central Asia | 3 | 0.0% |
| South Eastern Asia | 34 | 0.3% |
| Southern Europe | 2 | 0.0% |
| Spain | 2 | 0.0% |
| Thailand | 34 | 0.3% |
| Trinidad and Tobago | 8 | 0.1% |
| Venezuela | 25 | 0.2% |
| Western Europe | 10 | 0.1% | View All 36 Rows |
Sex and Age in Franklin County
Sex and Age in Franklin County
The most populous age groups in Franklin County are 30 to 34 Years (600 | 8.8%) for men and 55 to 59 Years (576 | 10.6%) for women.
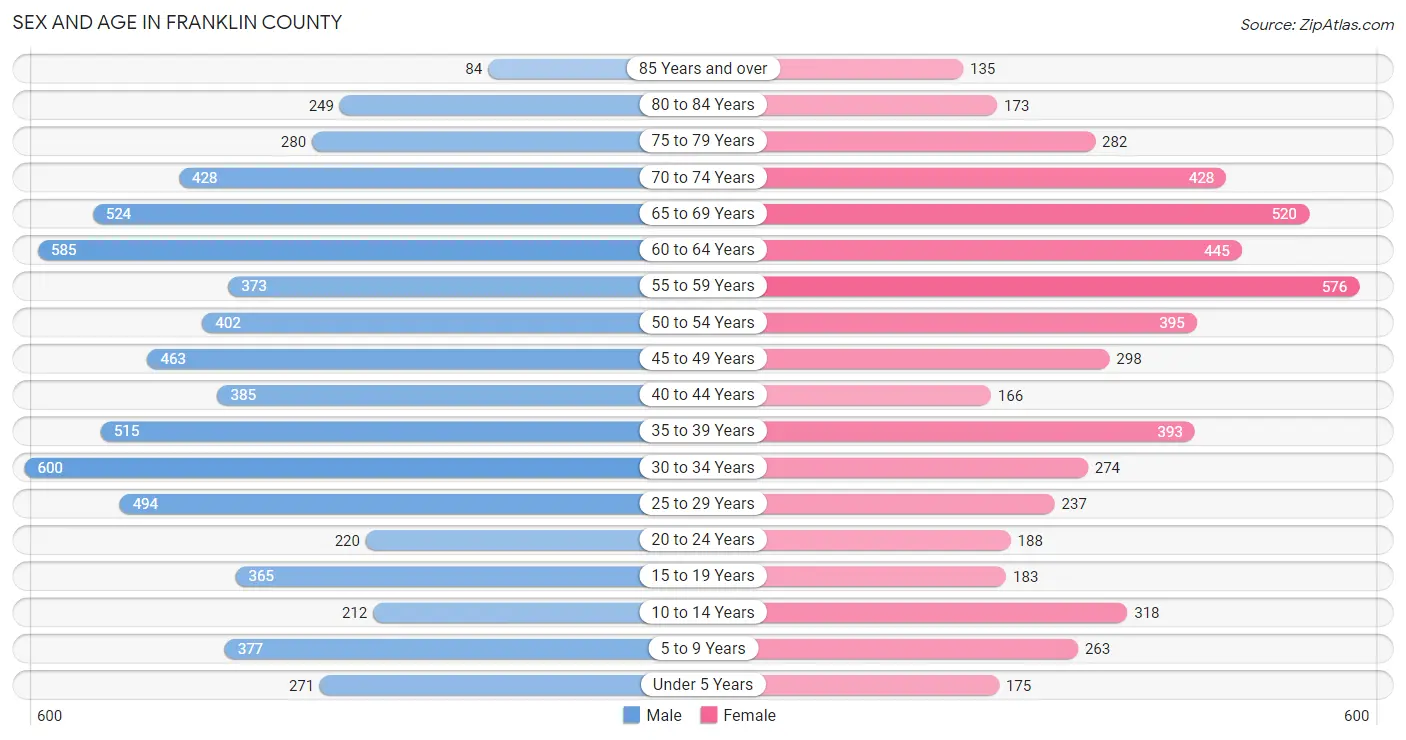
| Age Bracket | Male | Female |
| Under 5 Years | 271 (4.0%) | 175 (3.2%) |
| 5 to 9 Years | 377 (5.5%) | 263 (4.8%) |
| 10 to 14 Years | 212 (3.1%) | 318 (5.8%) |
| 15 to 19 Years | 365 (5.3%) | 183 (3.4%) |
| 20 to 24 Years | 220 (3.2%) | 188 (3.5%) |
| 25 to 29 Years | 494 (7.2%) | 237 (4.3%) |
| 30 to 34 Years | 600 (8.8%) | 274 (5.0%) |
| 35 to 39 Years | 515 (7.5%) | 393 (7.2%) |
| 40 to 44 Years | 385 (5.6%) | 166 (3.0%) |
| 45 to 49 Years | 463 (6.8%) | 298 (5.5%) |
| 50 to 54 Years | 402 (5.9%) | 395 (7.2%) |
| 55 to 59 Years | 373 (5.5%) | 576 (10.6%) |
| 60 to 64 Years | 585 (8.6%) | 445 (8.2%) |
| 65 to 69 Years | 524 (7.7%) | 520 (9.5%) |
| 70 to 74 Years | 428 (6.3%) | 428 (7.9%) |
| 75 to 79 Years | 280 (4.1%) | 282 (5.2%) |
| 80 to 84 Years | 249 (3.6%) | 173 (3.2%) |
| 85 Years and over | 84 (1.2%) | 135 (2.5%) |
| Total | 6,827 (100.0%) | 5,449 (100.0%) |
Families and Households in Franklin County
Median Family Size in Franklin County
The median family size in Franklin County is 2.79 persons per family, with single female/mother families (645 | 21.8%) accounting for the largest median family size of 3.34 persons per family. On the other hand, married-couple families (2,163 | 73.0%) represent the smallest median family size with 2.61 persons per family.
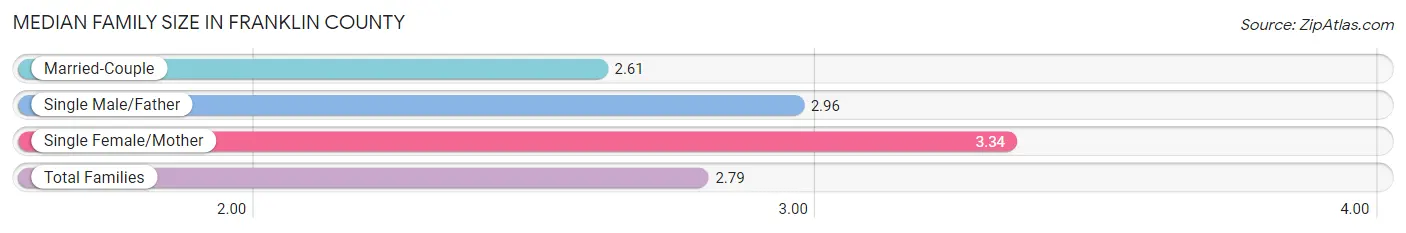
| Family Type | # Families | Family Size |
| Married-Couple | 2,163 (73.0%) | 2.61 |
| Single Male/Father | 155 (5.2%) | 2.96 |
| Single Female/Mother | 645 (21.8%) | 3.34 |
| Total Families | 2,963 (100.0%) | 2.79 |
Median Household Size in Franklin County
The median household size in Franklin County is 2.25 persons per household, with single female/mother households (645 | 13.6%) accounting for the largest median household size of 3.78 persons per household. non-family households (1,798 | 37.8%) represent the smallest median household size with 1.20 persons per household.
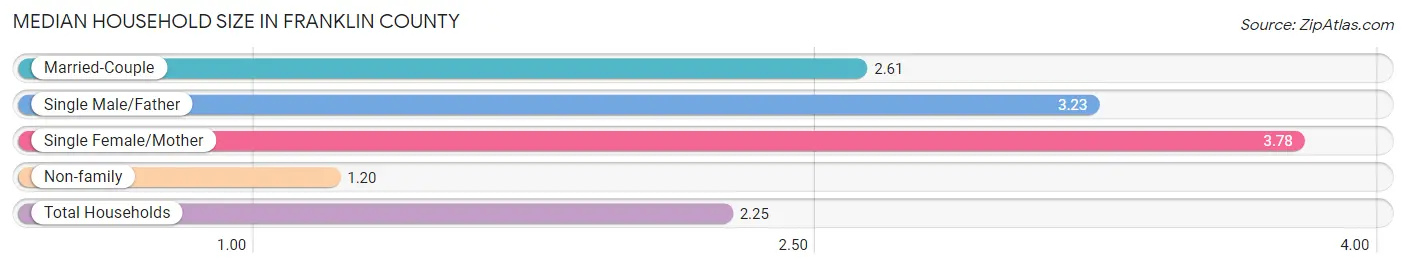
| Household Type | # Households | Household Size |
| Married-Couple | 2,163 (45.4%) | 2.61 |
| Single Male/Father | 155 (3.3%) | 3.23 |
| Single Female/Mother | 645 (13.6%) | 3.78 |
| Non-family | 1,798 (37.8%) | 1.20 |
| Total Households | 4,761 (100.0%) | 2.25 |
Household Size by Marriage Status in Franklin County
Out of a total of 4,761 households in Franklin County, 2,963 (62.2%) are family households, while 1,798 (37.8%) are nonfamily households. The most numerous type of family households are 2-person households, comprising 1,797, and the most common type of nonfamily households are 1-person households, comprising 1,513.
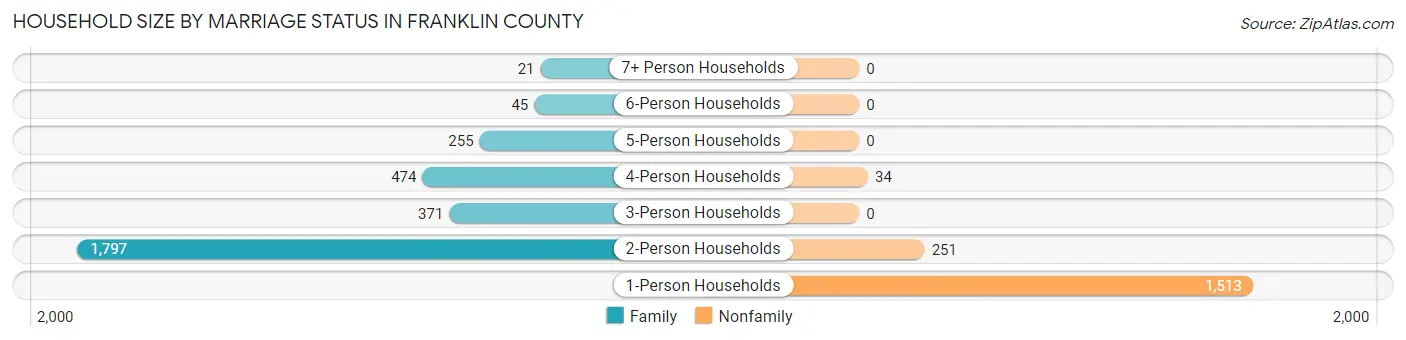
| Household Size | Family Households | Nonfamily Households |
| 1-Person Households | - | 1,513 (31.8%) |
| 2-Person Households | 1,797 (37.7%) | 251 (5.3%) |
| 3-Person Households | 371 (7.8%) | 0 (0.0%) |
| 4-Person Households | 474 (10.0%) | 34 (0.7%) |
| 5-Person Households | 255 (5.4%) | 0 (0.0%) |
| 6-Person Households | 45 (0.9%) | 0 (0.0%) |
| 7+ Person Households | 21 (0.4%) | 0 (0.0%) |
| Total | 2,963 (62.2%) | 1,798 (37.8%) |
Female Fertility in Franklin County
Fertility by Age in Franklin County
Average fertility rate in Franklin County is 31.0 births per 1,000 women. Women in the age bracket of 20 to 34 years have the highest fertility rate with 47.0 births per 1,000 women. Women in the age bracket of 20 to 34 years acount for 58.9% of all women with births.
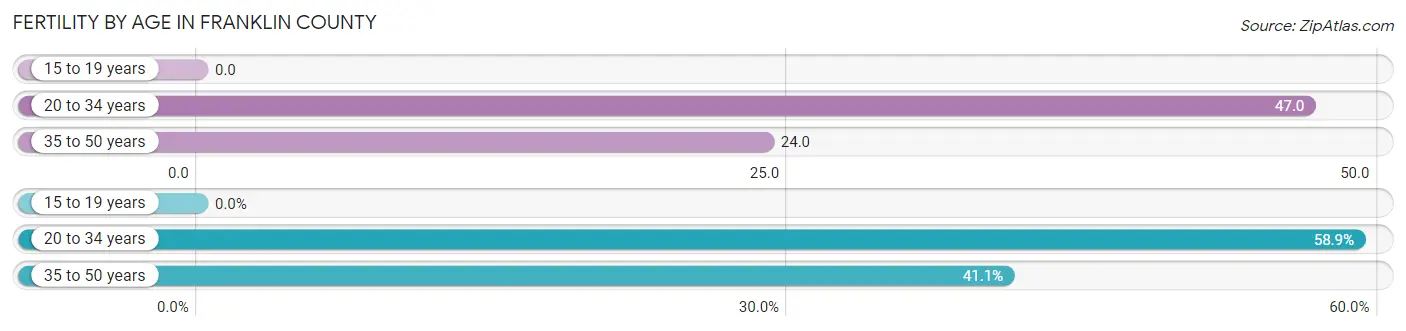
| Age Bracket | Women with Births | Births / 1,000 Women |
| 15 to 19 years | 0 (0.0%) | 0.0 |
| 20 to 34 years | 33 (58.9%) | 47.0 |
| 35 to 50 years | 23 (41.1%) | 24.0 |
| Total | 56 (100.0%) | 31.0 |
Fertility by Age by Marriage Status in Franklin County
41.1% of women with births (56) in Franklin County are married. The highest percentage of unmarried women with births falls into 20 to 34 years age bracket with 100.0% of them unmarried at the time of birth, while the lowest percentage of unmarried women with births belong to 35 to 50 years age bracket with 0.0% of them unmarried.
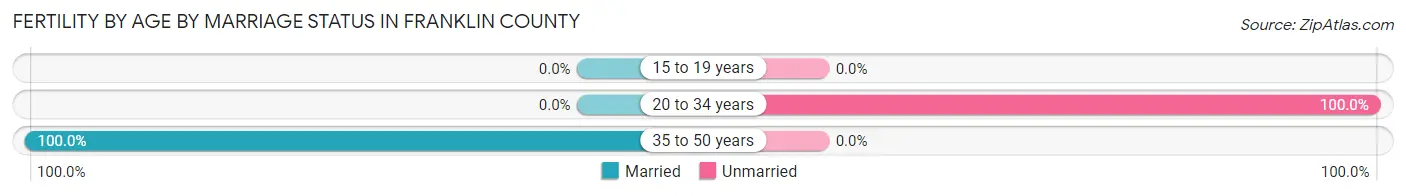
| Age Bracket | Married | Unmarried |
| 15 to 19 years | 0 (0.0%) | 0 (0.0%) |
| 20 to 34 years | 0 (0.0%) | 33 (100.0%) |
| 35 to 50 years | 23 (100.0%) | 0 (0.0%) |
| Total | 23 (41.1%) | 33 (58.9%) |
Fertility by Education in Franklin County
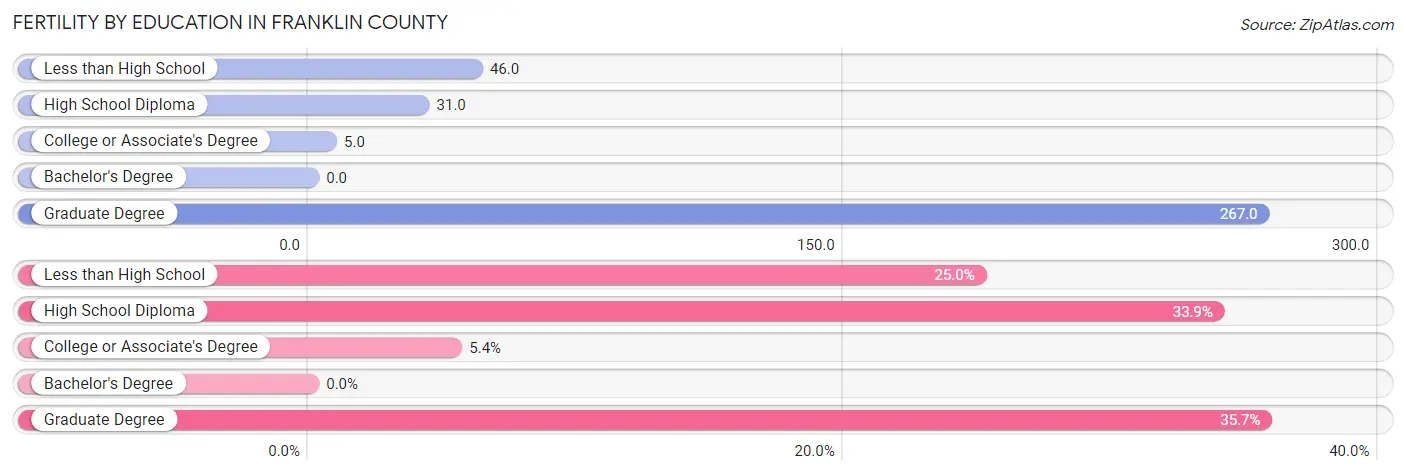
| Educational Attainment | Women with Births | Births / 1,000 Women |
| Less than High School | 14 (25.0%) | 46.0 |
| High School Diploma | 19 (33.9%) | 31.0 |
| College or Associate's Degree | 3 (5.4%) | 5.0 |
| Bachelor's Degree | 0 (0.0%) | 0.0 |
| Graduate Degree | 20 (35.7%) | 267.0 |
| Total | 56 (100.0%) | 31.0 |
Fertility by Education by Marriage Status in Franklin County
58.9% of women with births in Franklin County are unmarried. Women with the educational attainment of college or associate's degree are most likely to be married with 100.0% of them married at childbirth, while women with the educational attainment of less than high school are least likely to be married with 100.0% of them unmarried at childbirth.
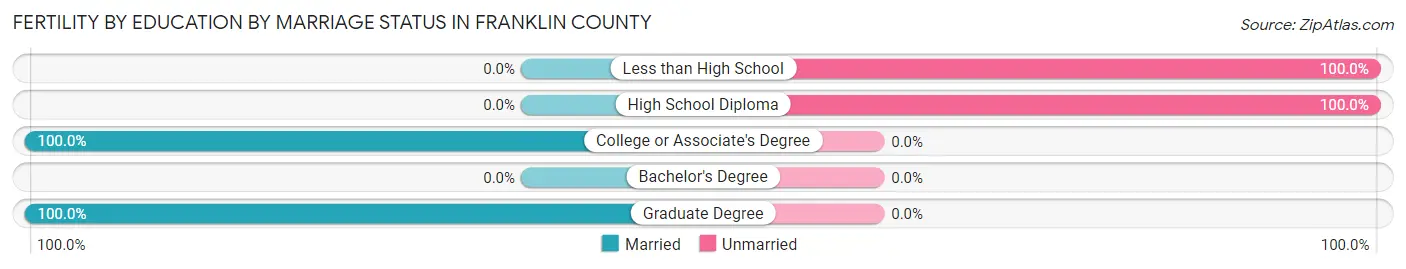
| Educational Attainment | Married | Unmarried |
| Less than High School | 0 (0.0%) | 14 (100.0%) |
| High School Diploma | 0 (0.0%) | 19 (100.0%) |
| College or Associate's Degree | 3 (100.0%) | 0 (0.0%) |
| Bachelor's Degree | 0 (0.0%) | 0 (0.0%) |
| Graduate Degree | 20 (100.0%) | 0 (0.0%) |
| Total | 23 (41.1%) | 33 (58.9%) |
Employment Characteristics in Franklin County
Employment by Class of Employer in Franklin County
Among the 4,116 employed individuals in Franklin County, private company employees (2,133 | 51.8%), self-employed (incorporated) (559 | 13.6%), and state government employees (416 | 10.1%) make up the most common classes of employment.
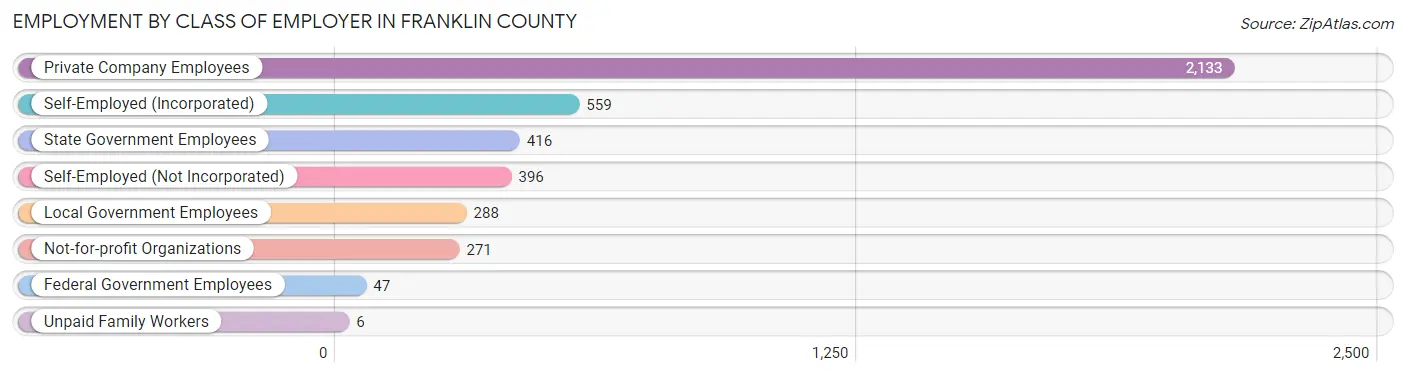
| Employer Class | # Employees | % Employees |
| Private Company Employees | 2,133 | 51.8% |
| Self-Employed (Incorporated) | 559 | 13.6% |
| Self-Employed (Not Incorporated) | 396 | 9.6% |
| Not-for-profit Organizations | 271 | 6.6% |
| Local Government Employees | 288 | 7.0% |
| State Government Employees | 416 | 10.1% |
| Federal Government Employees | 47 | 1.1% |
| Unpaid Family Workers | 6 | 0.2% |
| Total | 4,116 | 100.0% |
Employment Status by Age in Franklin County
According to the labor force statistics for Franklin County, out of the total population over 16 years of age (10,473), 44.6% or 4,671 individuals are in the labor force, with 8.9% or 416 of them unemployed. The age group with the highest labor force participation rate is 20 to 24 years, with 69.6% or 284 individuals in the labor force. Within the labor force, the 20 to 24 years age range has the highest percentage of unemployed individuals, with 31.3% or 89 of them being unemployed.
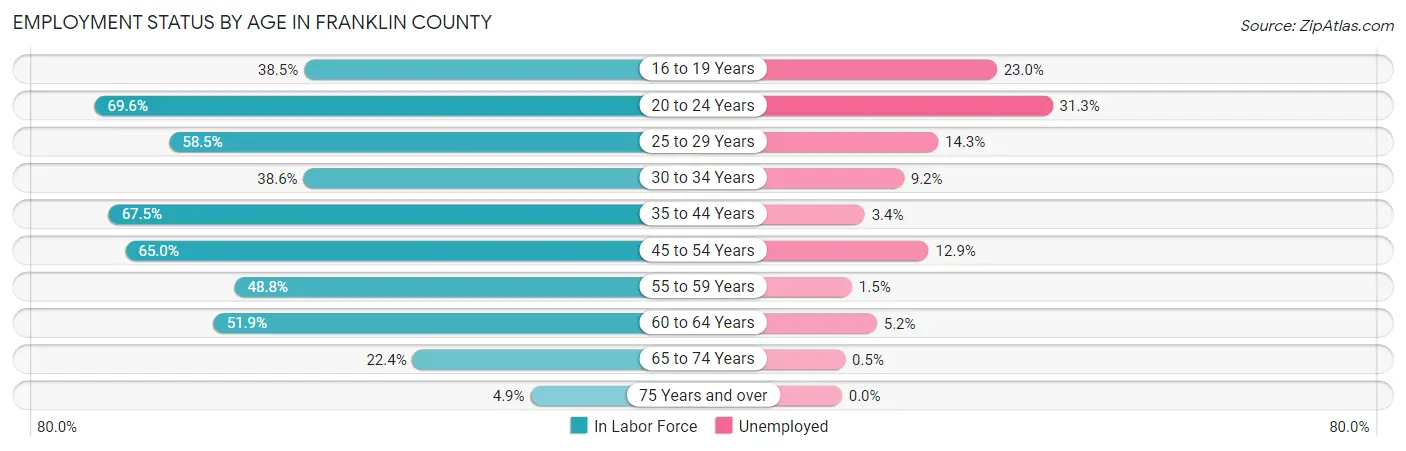
| Age Bracket | In Labor Force | Unemployed |
| 16 to 19 Years | 139 (38.5%) | 32 (23.0%) |
| 20 to 24 Years | 284 (69.6%) | 89 (31.3%) |
| 25 to 29 Years | 428 (58.5%) | 61 (14.3%) |
| 30 to 34 Years | 337 (38.6%) | 31 (9.2%) |
| 35 to 44 Years | 985 (67.5%) | 33 (3.4%) |
| 45 to 54 Years | 1,013 (65.0%) | 131 (12.9%) |
| 55 to 59 Years | 463 (48.8%) | 7 (1.5%) |
| 60 to 64 Years | 535 (51.9%) | 28 (5.2%) |
| 65 to 74 Years | 426 (22.4%) | 2 (0.5%) |
| 75 Years and over | 59 (4.9%) | 0 (0.0%) |
| Total | 4,671 (44.6%) | 416 (8.9%) |
Employment Status by Educational Attainment in Franklin County
According to labor force statistics for Franklin County, 57.0% of individuals (3,763) out of the total population between 25 and 64 years of age (6,601) are in the labor force, with 7.7% or 290 of them being unemployed. The group with the highest labor force participation rate are those with the educational attainment of bachelor's degree or higher, with 73.2% or 796 individuals in the labor force. Within the labor force, individuals with bachelor's degree or higher education have the highest percentage of unemployment, with 12.8% or 102 of them being unemployed.
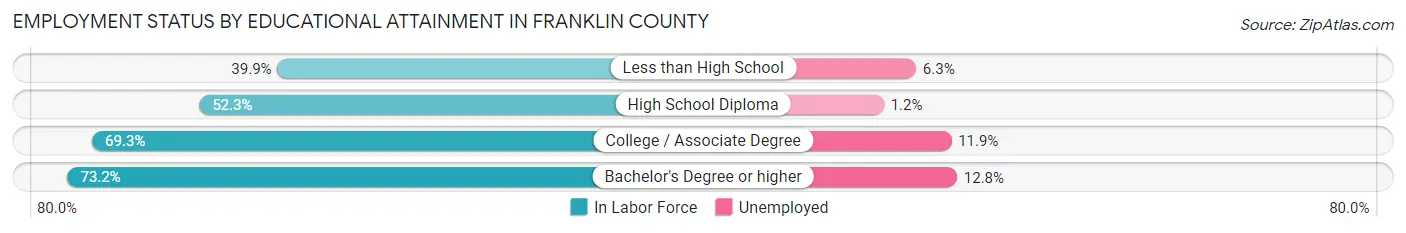
| Educational Attainment | In Labor Force | Unemployed |
| Less than High School | 630 (39.9%) | 100 (6.3%) |
| High School Diploma | 1,206 (52.3%) | 28 (1.2%) |
| College / Associate Degree | 1,128 (69.3%) | 194 (11.9%) |
| Bachelor's Degree or higher | 796 (73.2%) | 139 (12.8%) |
| Total | 3,763 (57.0%) | 508 (7.7%) |
Employment Occupations by Sex in Franklin County
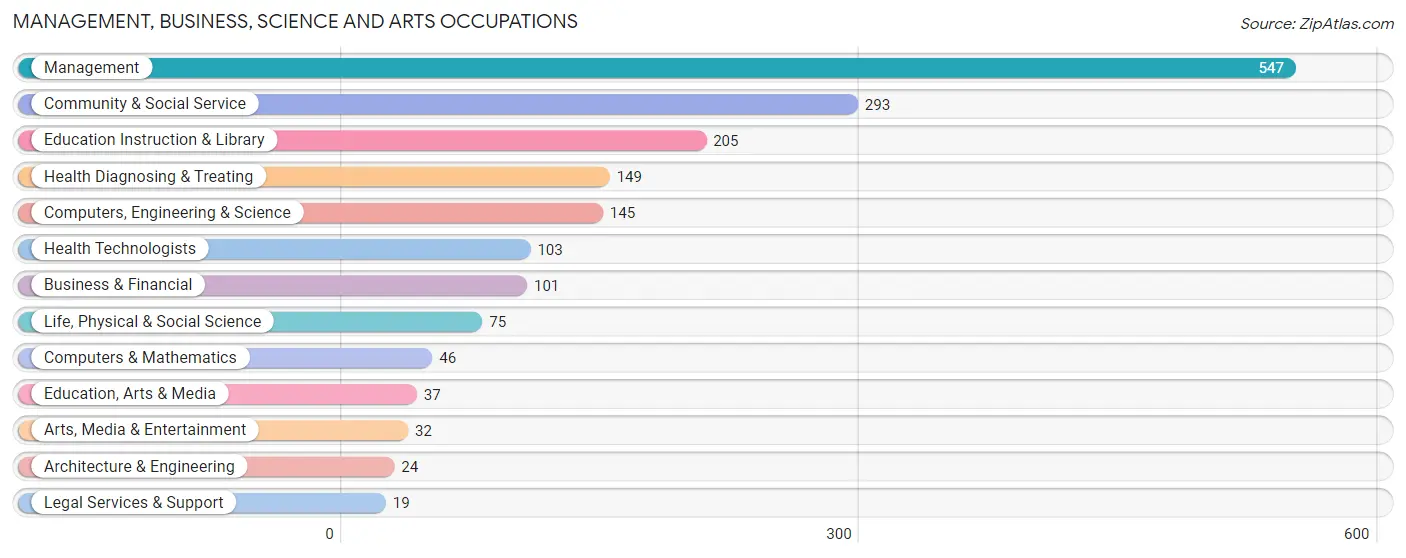
Management, Business, Science and Arts Occupations
The most common Management, Business, Science and Arts occupations in Franklin County are Management (547 | 12.9%), Community & Social Service (293 | 6.9%), Education Instruction & Library (205 | 4.8%), Health Diagnosing & Treating (149 | 3.5%), and Computers, Engineering & Science (145 | 3.4%).
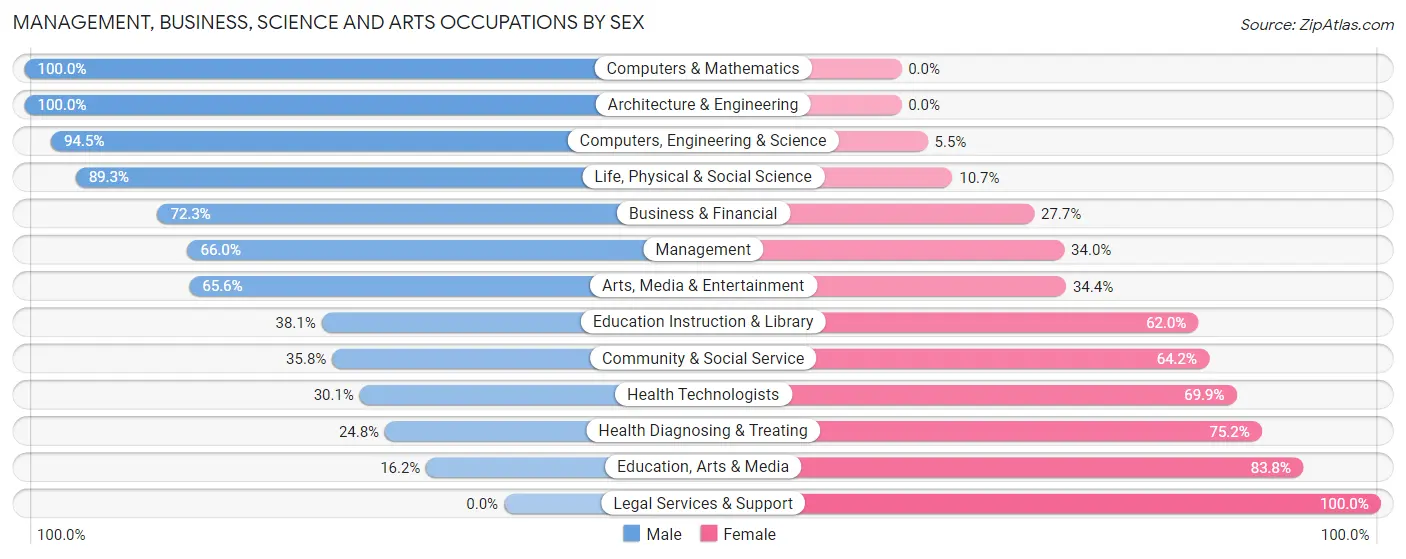
Management, Business, Science and Arts Occupations by Sex
Within the Management, Business, Science and Arts occupations in Franklin County, the most male-oriented occupations are Computers & Mathematics (100.0%), Architecture & Engineering (100.0%), and Computers, Engineering & Science (94.5%), while the most female-oriented occupations are Legal Services & Support (100.0%), Education, Arts & Media (83.8%), and Health Diagnosing & Treating (75.2%).
| Occupation | Male | Female |
| Management | 361 (66.0%) | 186 (34.0%) |
| Business & Financial | 73 (72.3%) | 28 (27.7%) |
| Computers, Engineering & Science | 137 (94.5%) | 8 (5.5%) |
| Computers & Mathematics | 46 (100.0%) | 0 (0.0%) |
| Architecture & Engineering | 24 (100.0%) | 0 (0.0%) |
| Life, Physical & Social Science | 67 (89.3%) | 8 (10.7%) |
| Community & Social Service | 105 (35.8%) | 188 (64.2%) |
| Education, Arts & Media | 6 (16.2%) | 31 (83.8%) |
| Legal Services & Support | 0 (0.0%) | 19 (100.0%) |
| Education Instruction & Library | 78 (38.1%) | 127 (62.0%) |
| Arts, Media & Entertainment | 21 (65.6%) | 11 (34.4%) |
| Health Diagnosing & Treating | 37 (24.8%) | 112 (75.2%) |
| Health Technologists | 31 (30.1%) | 72 (69.9%) |
| Total (Category) | 713 (57.7%) | 522 (42.3%) |
| Total (Overall) | 2,297 (54.0%) | 1,958 (46.0%) |
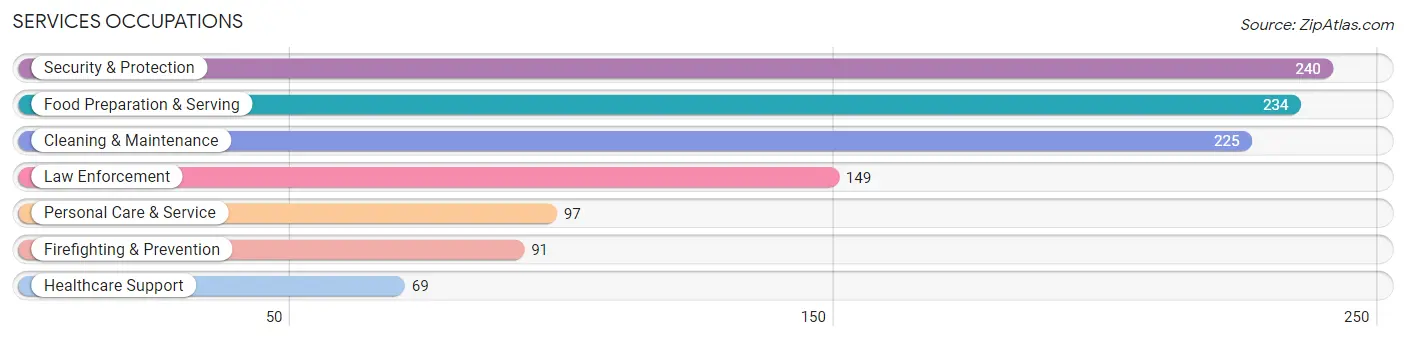
Services Occupations
The most common Services occupations in Franklin County are Security & Protection (240 | 5.6%), Food Preparation & Serving (234 | 5.5%), Cleaning & Maintenance (225 | 5.3%), Law Enforcement (149 | 3.5%), and Personal Care & Service (97 | 2.3%).
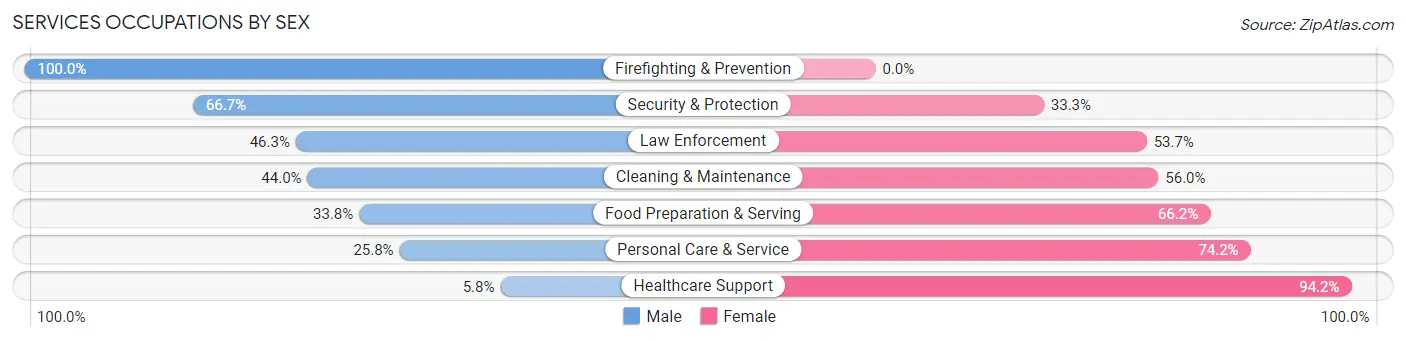
Services Occupations by Sex
Within the Services occupations in Franklin County, the most male-oriented occupations are Firefighting & Prevention (100.0%), Security & Protection (66.7%), and Law Enforcement (46.3%), while the most female-oriented occupations are Healthcare Support (94.2%), Personal Care & Service (74.2%), and Food Preparation & Serving (66.2%).
| Occupation | Male | Female |
| Healthcare Support | 4 (5.8%) | 65 (94.2%) |
| Security & Protection | 160 (66.7%) | 80 (33.3%) |
| Firefighting & Prevention | 91 (100.0%) | 0 (0.0%) |
| Law Enforcement | 69 (46.3%) | 80 (53.7%) |
| Food Preparation & Serving | 79 (33.8%) | 155 (66.2%) |
| Cleaning & Maintenance | 99 (44.0%) | 126 (56.0%) |
| Personal Care & Service | 25 (25.8%) | 72 (74.2%) |
| Total (Category) | 367 (42.4%) | 498 (57.6%) |
| Total (Overall) | 2,297 (54.0%) | 1,958 (46.0%) |
Sales and Office Occupations
The most common Sales and Office occupations in Franklin County are Sales & Related (537 | 12.6%), and Office & Administration (498 | 11.7%).

Sales and Office Occupations by Sex

| Occupation | Male | Female |
| Sales & Related | 187 (34.8%) | 350 (65.2%) |
| Office & Administration | 14 (2.8%) | 484 (97.2%) |
| Total (Category) | 201 (19.4%) | 834 (80.6%) |
| Total (Overall) | 2,297 (54.0%) | 1,958 (46.0%) |
Natural Resources, Construction and Maintenance Occupations
The most common Natural Resources, Construction and Maintenance occupations in Franklin County are Construction & Extraction (465 | 10.9%), Farming, Fishing & Forestry (174 | 4.1%), and Installation, Maintenance & Repair (117 | 2.8%).
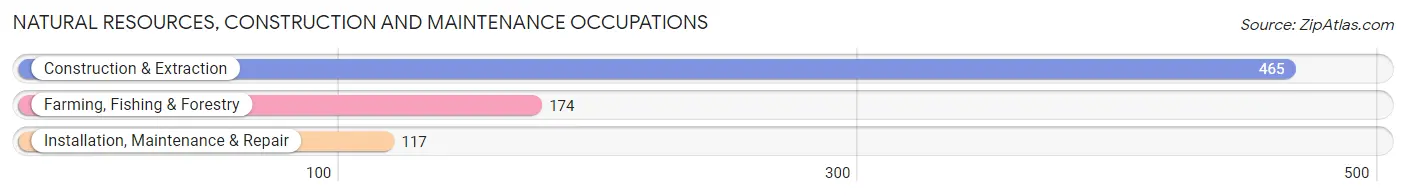
Natural Resources, Construction and Maintenance Occupations by Sex
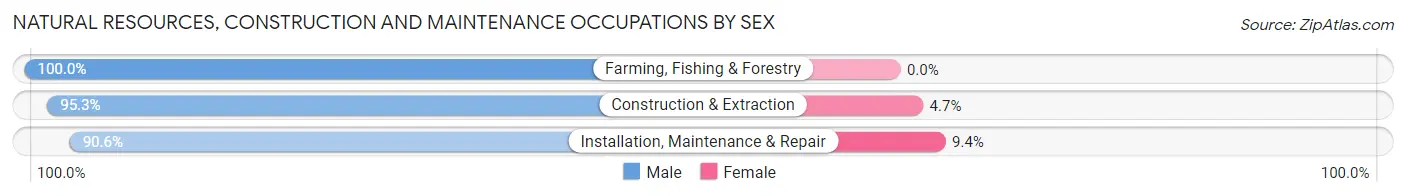
| Occupation | Male | Female |
| Farming, Fishing & Forestry | 174 (100.0%) | 0 (0.0%) |
| Construction & Extraction | 443 (95.3%) | 22 (4.7%) |
| Installation, Maintenance & Repair | 106 (90.6%) | 11 (9.4%) |
| Total (Category) | 723 (95.6%) | 33 (4.4%) |
| Total (Overall) | 2,297 (54.0%) | 1,958 (46.0%) |
Production, Transportation and Moving Occupations
The most common Production, Transportation and Moving occupations in Franklin County are Production (214 | 5.0%), Material Moving (91 | 2.1%), and Transportation (59 | 1.4%).
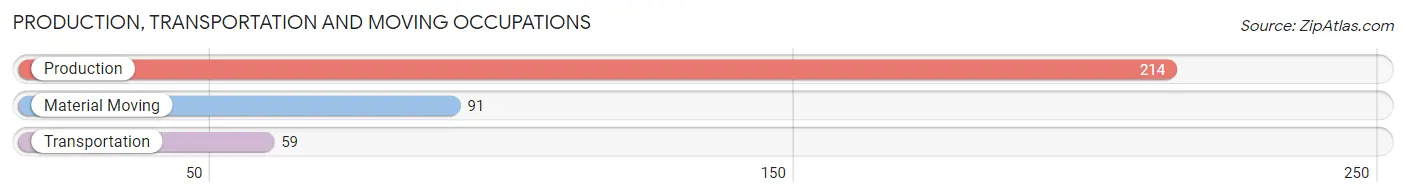
Production, Transportation and Moving Occupations by Sex
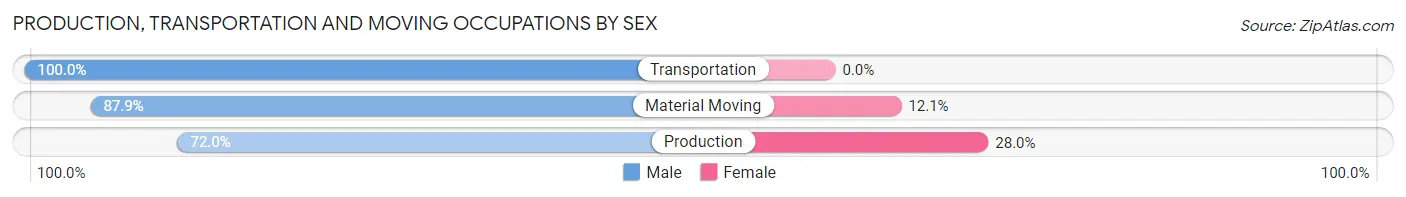
| Occupation | Male | Female |
| Production | 154 (72.0%) | 60 (28.0%) |
| Transportation | 59 (100.0%) | 0 (0.0%) |
| Material Moving | 80 (87.9%) | 11 (12.1%) |
| Total (Category) | 293 (80.5%) | 71 (19.5%) |
| Total (Overall) | 2,297 (54.0%) | 1,958 (46.0%) |
Employment Industries by Sex in Franklin County
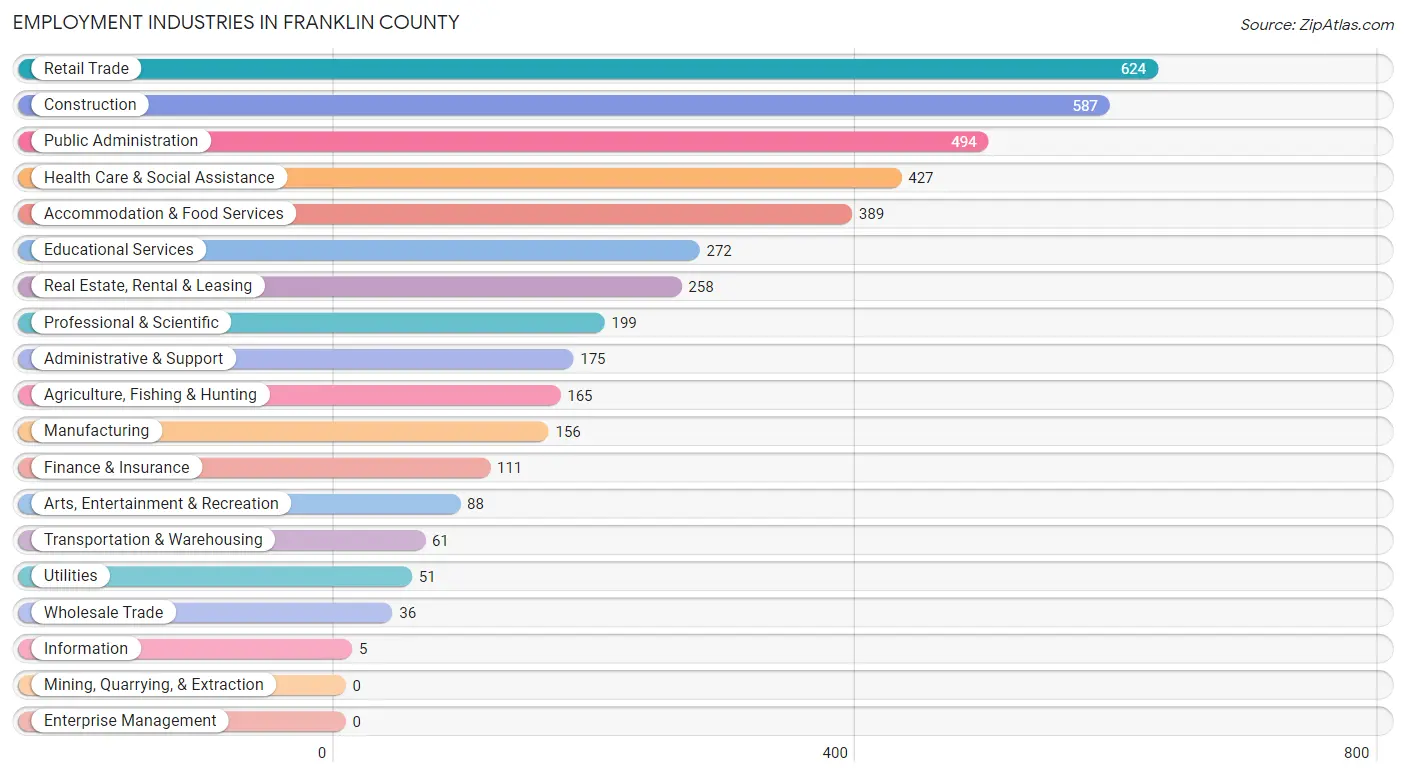
Employment Industries in Franklin County
The major employment industries in Franklin County include Retail Trade (624 | 14.7%), Construction (587 | 13.8%), Public Administration (494 | 11.6%), Health Care & Social Assistance (427 | 10.0%), and Accommodation & Food Services (389 | 9.1%).
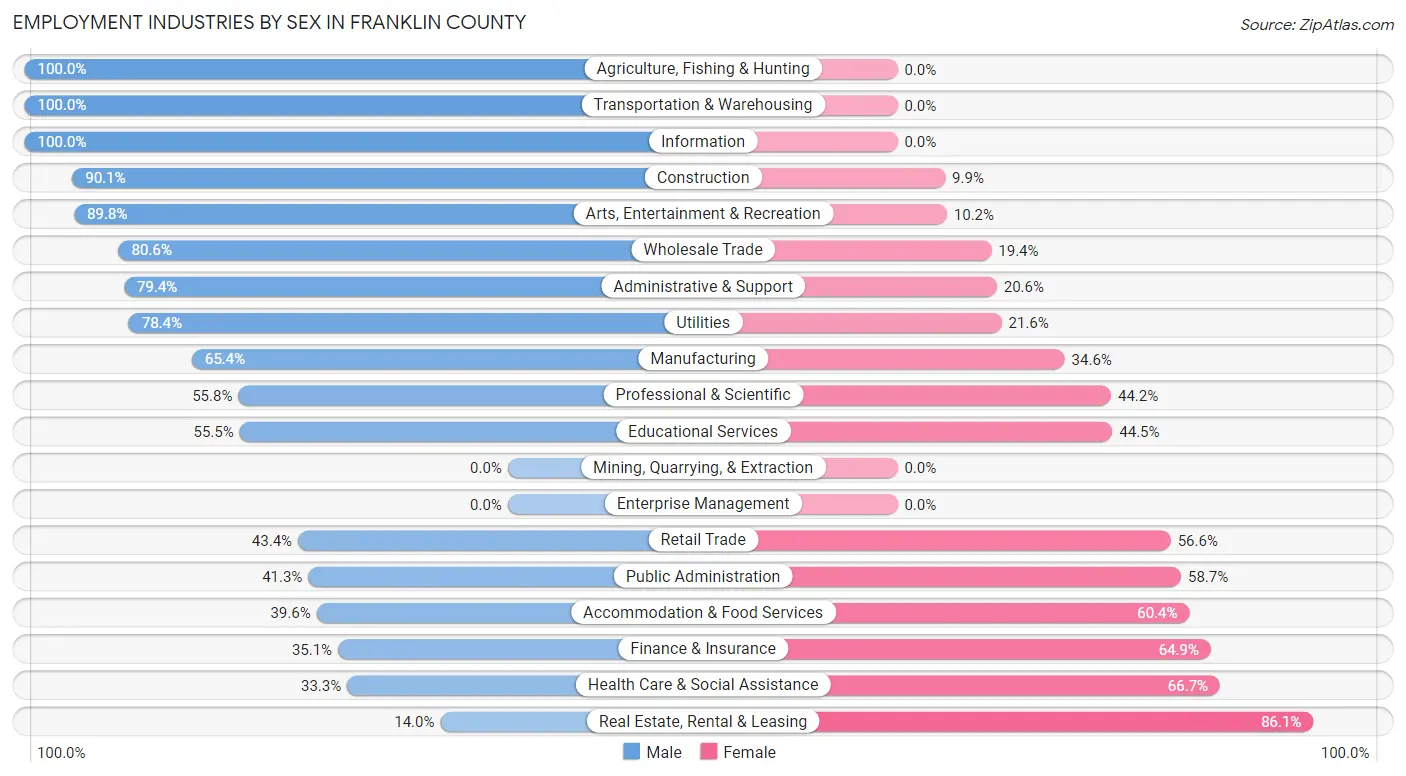
Employment Industries by Sex in Franklin County
The Franklin County industries that see more men than women are Agriculture, Fishing & Hunting (100.0%), Transportation & Warehousing (100.0%), and Information (100.0%), whereas the industries that tend to have a higher number of women are Real Estate, Rental & Leasing (86.1%), Health Care & Social Assistance (66.7%), and Finance & Insurance (64.9%).
| Industry | Male | Female |
| Agriculture, Fishing & Hunting | 165 (100.0%) | 0 (0.0%) |
| Mining, Quarrying, & Extraction | 0 (0.0%) | 0 (0.0%) |
| Construction | 529 (90.1%) | 58 (9.9%) |
| Manufacturing | 102 (65.4%) | 54 (34.6%) |
| Wholesale Trade | 29 (80.6%) | 7 (19.4%) |
| Retail Trade | 271 (43.4%) | 353 (56.6%) |
| Transportation & Warehousing | 61 (100.0%) | 0 (0.0%) |
| Utilities | 40 (78.4%) | 11 (21.6%) |
| Information | 5 (100.0%) | 0 (0.0%) |
| Finance & Insurance | 39 (35.1%) | 72 (64.9%) |
| Real Estate, Rental & Leasing | 36 (14.0%) | 222 (86.1%) |
| Professional & Scientific | 111 (55.8%) | 88 (44.2%) |
| Enterprise Management | 0 (0.0%) | 0 (0.0%) |
| Administrative & Support | 139 (79.4%) | 36 (20.6%) |
| Educational Services | 151 (55.5%) | 121 (44.5%) |
| Health Care & Social Assistance | 142 (33.3%) | 285 (66.7%) |
| Arts, Entertainment & Recreation | 79 (89.8%) | 9 (10.2%) |
| Accommodation & Food Services | 154 (39.6%) | 235 (60.4%) |
| Public Administration | 204 (41.3%) | 290 (58.7%) |
| Total | 2,297 (54.0%) | 1,958 (46.0%) |
Education in Franklin County
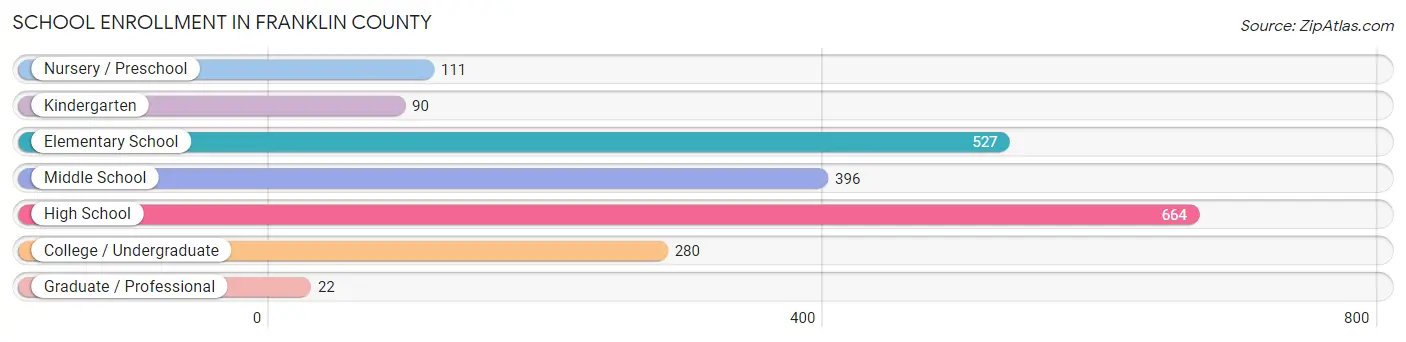
School Enrollment in Franklin County
The most common levels of schooling among the 2,090 students in Franklin County are high school (664 | 31.8%), elementary school (527 | 25.2%), and middle school (396 | 19.0%).
| School Level | # Students | % Students |
| Nursery / Preschool | 111 | 5.3% |
| Kindergarten | 90 | 4.3% |
| Elementary School | 527 | 25.2% |
| Middle School | 396 | 19.0% |
| High School | 664 | 31.8% |
| College / Undergraduate | 280 | 13.4% |
| Graduate / Professional | 22 | 1.1% |
| Total | 2,090 | 100.0% |
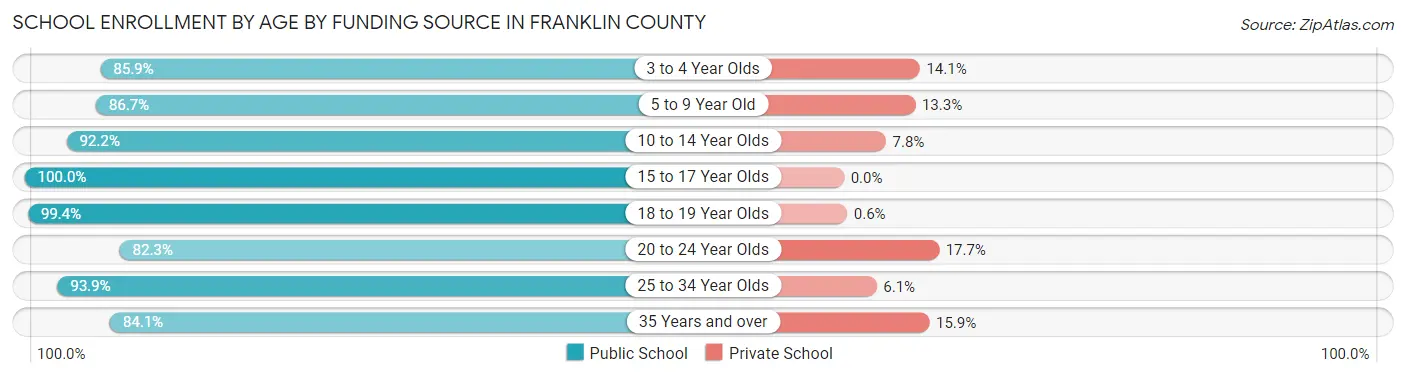
School Enrollment by Age by Funding Source in Franklin County
Out of a total of 2,090 students who are enrolled in schools in Franklin County, 192 (9.2%) attend a private institution, while the remaining 1,898 (90.8%) are enrolled in public schools. The age group of 20 to 24 year olds has the highest likelihood of being enrolled in private schools, with 20 (17.7% in the age bracket) enrolled. Conversely, the age group of 15 to 17 year olds has the lowest likelihood of being enrolled in a private school, with 293 (100.0% in the age bracket) attending a public institution.
| Age Bracket | Public School | Private School |
| 3 to 4 Year Olds | 73 (85.9%) | 12 (14.1%) |
| 5 to 9 Year Old | 529 (86.7%) | 81 (13.3%) |
| 10 to 14 Year Olds | 472 (92.2%) | 40 (7.8%) |
| 15 to 17 Year Olds | 293 (100.0%) | 0 (0.0%) |
| 18 to 19 Year Olds | 166 (99.4%) | 1 (0.6%) |
| 20 to 24 Year Olds | 93 (82.3%) | 20 (17.7%) |
| 25 to 34 Year Olds | 108 (93.9%) | 7 (6.1%) |
| 35 Years and over | 164 (84.1%) | 31 (15.9%) |
| Total | 1,898 (90.8%) | 192 (9.2%) |
Educational Attainment by Field of Study in Franklin County
Business (476 | 22.2%), education (341 | 15.9%), science & technology (255 | 11.9%), bio, nature & agricultural (174 | 8.1%), and social sciences (161 | 7.5%) are the most common fields of study among 2,148 individuals in Franklin County who have obtained a bachelor's degree or higher.
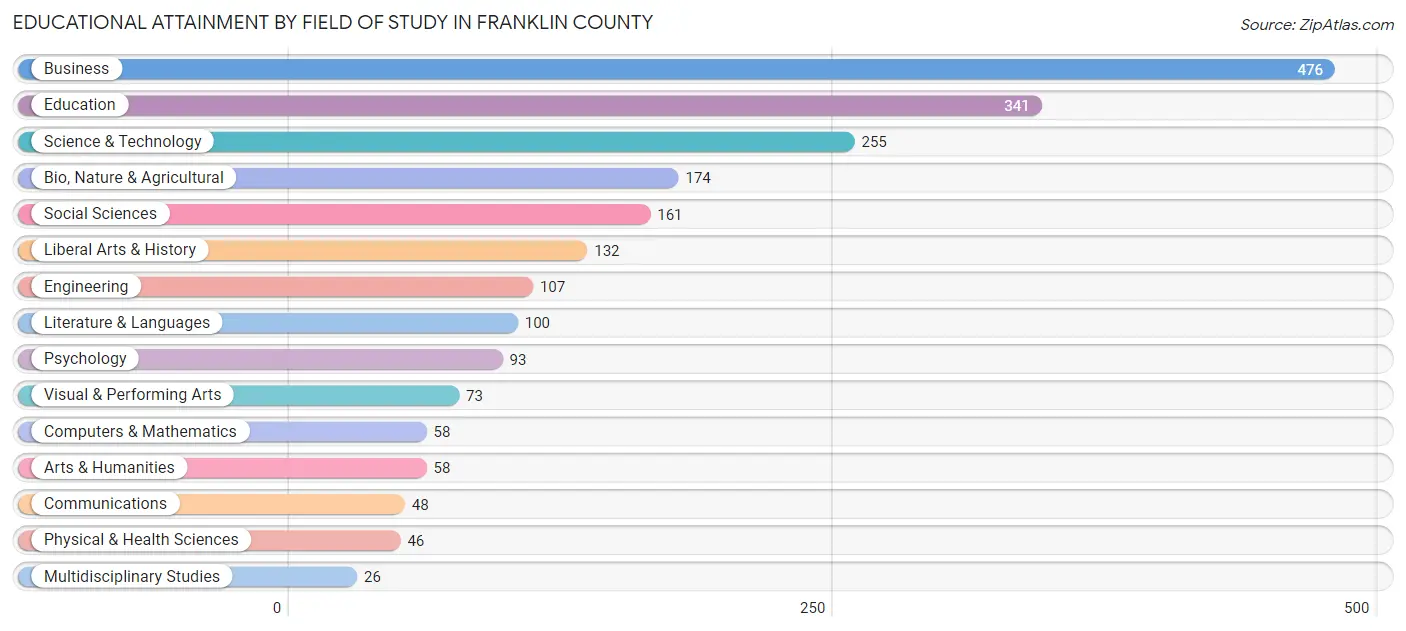
| Field of Study | # Graduates | % Graduates |
| Computers & Mathematics | 58 | 2.7% |
| Bio, Nature & Agricultural | 174 | 8.1% |
| Physical & Health Sciences | 46 | 2.1% |
| Psychology | 93 | 4.3% |
| Social Sciences | 161 | 7.5% |
| Engineering | 107 | 5.0% |
| Multidisciplinary Studies | 26 | 1.2% |
| Science & Technology | 255 | 11.9% |
| Business | 476 | 22.2% |
| Education | 341 | 15.9% |
| Literature & Languages | 100 | 4.7% |
| Liberal Arts & History | 132 | 6.1% |
| Visual & Performing Arts | 73 | 3.4% |
| Communications | 48 | 2.2% |
| Arts & Humanities | 58 | 2.7% |
| Total | 2,148 | 100.0% |
Transportation & Commute in Franklin County
Vehicle Availability by Sex in Franklin County
The most prevalent vehicle ownership categories in Franklin County are males with 2 vehicles (1,078, accounting for 47.5%) and females with 2 vehicles (1,016, making up 58.6%).
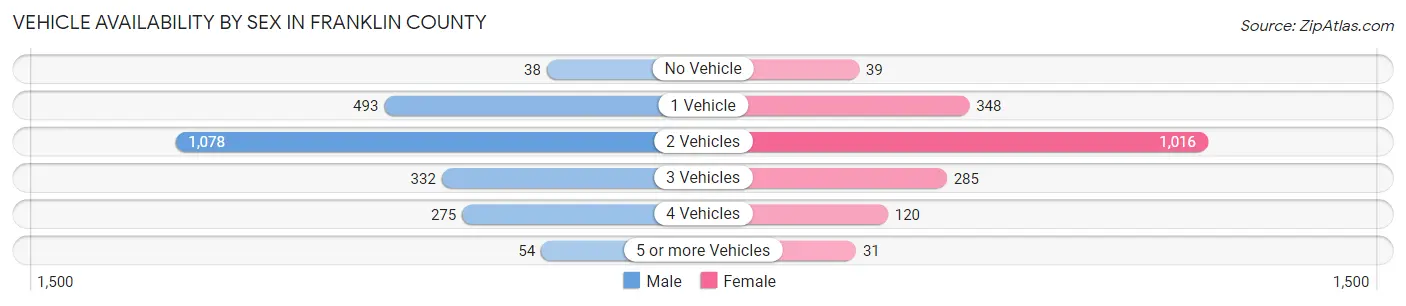
| Vehicles Available | Male | Female |
| No Vehicle | 38 (1.7%) | 39 (2.1%) |
| 1 Vehicle | 493 (21.7%) | 348 (18.9%) |
| 2 Vehicles | 1,078 (47.5%) | 1,016 (55.2%) |
| 3 Vehicles | 332 (14.6%) | 285 (15.5%) |
| 4 Vehicles | 275 (12.1%) | 120 (6.5%) |
| 5 or more Vehicles | 54 (2.4%) | 31 (1.7%) |
| Total | 2,270 (100.0%) | 1,839 (100.0%) |
Commute Time in Franklin County
The most frequently occuring commute durations in Franklin County are 5 to 9 minutes (732 commuters, 18.8%), 10 to 14 minutes (586 commuters, 15.1%), and 15 to 19 minutes (550 commuters, 14.1%).
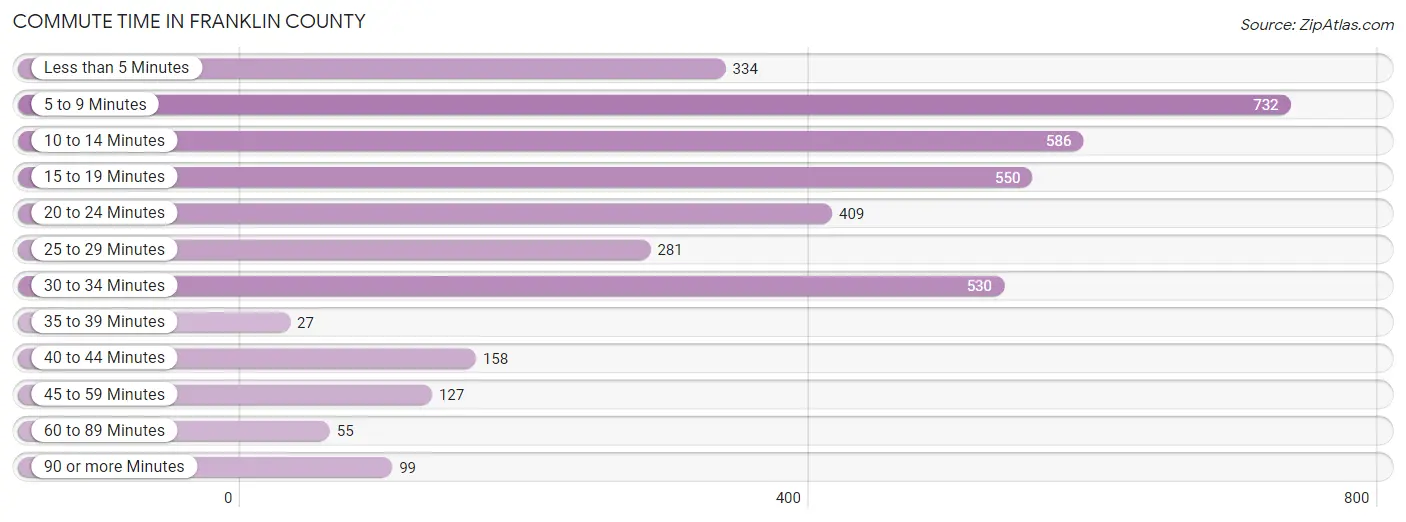
| Commute Time | # Commuters | % Commuters |
| Less than 5 Minutes | 334 | 8.6% |
| 5 to 9 Minutes | 732 | 18.8% |
| 10 to 14 Minutes | 586 | 15.1% |
| 15 to 19 Minutes | 550 | 14.1% |
| 20 to 24 Minutes | 409 | 10.5% |
| 25 to 29 Minutes | 281 | 7.2% |
| 30 to 34 Minutes | 530 | 13.6% |
| 35 to 39 Minutes | 27 | 0.7% |
| 40 to 44 Minutes | 158 | 4.1% |
| 45 to 59 Minutes | 127 | 3.3% |
| 60 to 89 Minutes | 55 | 1.4% |
| 90 or more Minutes | 99 | 2.5% |
Commute Time by Sex in Franklin County
The most common commute times in Franklin County are 15 to 19 minutes (366 commuters, 16.9%) for males and 5 to 9 minutes (414 commuters, 24.1%) for females.
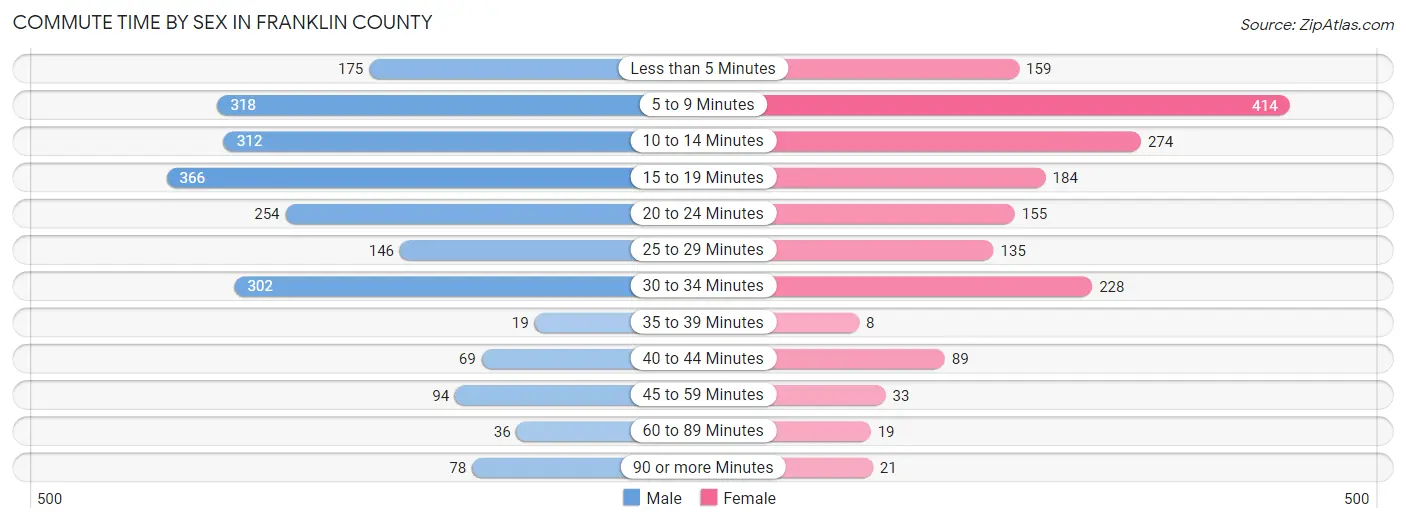
| Commute Time | Male | Female |
| Less than 5 Minutes | 175 (8.1%) | 159 (9.2%) |
| 5 to 9 Minutes | 318 (14.7%) | 414 (24.1%) |
| 10 to 14 Minutes | 312 (14.4%) | 274 (15.9%) |
| 15 to 19 Minutes | 366 (16.9%) | 184 (10.7%) |
| 20 to 24 Minutes | 254 (11.7%) | 155 (9.0%) |
| 25 to 29 Minutes | 146 (6.7%) | 135 (7.9%) |
| 30 to 34 Minutes | 302 (13.9%) | 228 (13.3%) |
| 35 to 39 Minutes | 19 (0.9%) | 8 (0.5%) |
| 40 to 44 Minutes | 69 (3.2%) | 89 (5.2%) |
| 45 to 59 Minutes | 94 (4.3%) | 33 (1.9%) |
| 60 to 89 Minutes | 36 (1.7%) | 19 (1.1%) |
| 90 or more Minutes | 78 (3.6%) | 21 (1.2%) |
Time of Departure to Work by Sex in Franklin County
The most frequent times of departure to work in Franklin County are 7:00 AM to 7:29 AM (438, 20.2%) for males and 8:00 AM to 8:29 AM (336, 19.6%) for females.
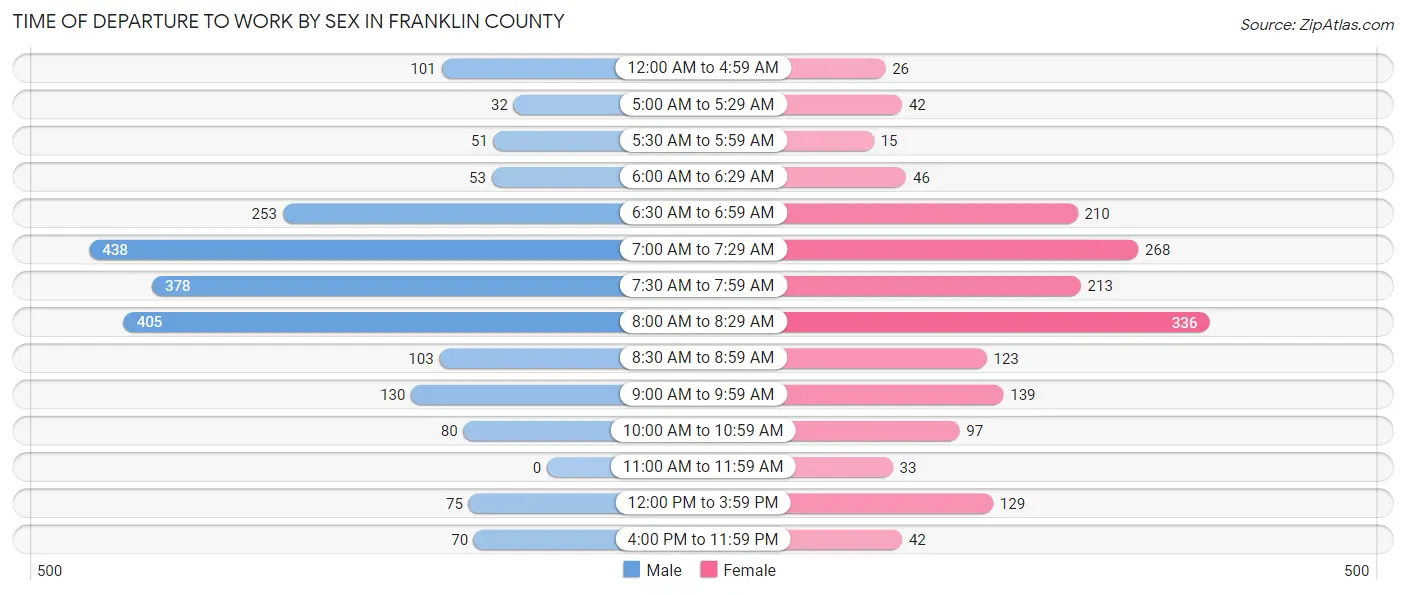
| Time of Departure | Male | Female |
| 12:00 AM to 4:59 AM | 101 (4.7%) | 26 (1.5%) |
| 5:00 AM to 5:29 AM | 32 (1.5%) | 42 (2.4%) |
| 5:30 AM to 5:59 AM | 51 (2.4%) | 15 (0.9%) |
| 6:00 AM to 6:29 AM | 53 (2.4%) | 46 (2.7%) |
| 6:30 AM to 6:59 AM | 253 (11.7%) | 210 (12.2%) |
| 7:00 AM to 7:29 AM | 438 (20.2%) | 268 (15.6%) |
| 7:30 AM to 7:59 AM | 378 (17.4%) | 213 (12.4%) |
| 8:00 AM to 8:29 AM | 405 (18.7%) | 336 (19.6%) |
| 8:30 AM to 8:59 AM | 103 (4.8%) | 123 (7.2%) |
| 9:00 AM to 9:59 AM | 130 (6.0%) | 139 (8.1%) |
| 10:00 AM to 10:59 AM | 80 (3.7%) | 97 (5.6%) |
| 11:00 AM to 11:59 AM | 0 (0.0%) | 33 (1.9%) |
| 12:00 PM to 3:59 PM | 75 (3.5%) | 129 (7.5%) |
| 4:00 PM to 11:59 PM | 70 (3.2%) | 42 (2.4%) |
| Total | 2,169 (100.0%) | 1,719 (100.0%) |
Housing Occupancy in Franklin County
Occupancy by Ownership in Franklin County
Of the total 4,761 dwellings in Franklin County, owner-occupied units account for 3,840 (80.7%), while renter-occupied units make up 921 (19.3%).
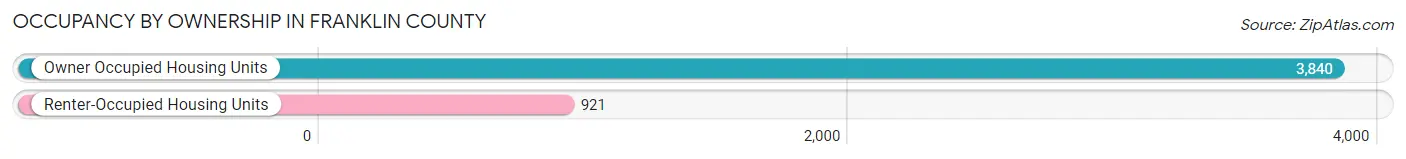
| Occupancy | # Housing Units | % Housing Units |
| Owner Occupied Housing Units | 3,840 | 80.7% |
| Renter-Occupied Housing Units | 921 | 19.3% |
| Total Occupied Housing Units | 4,761 | 100.0% |
Occupancy by Household Size in Franklin County
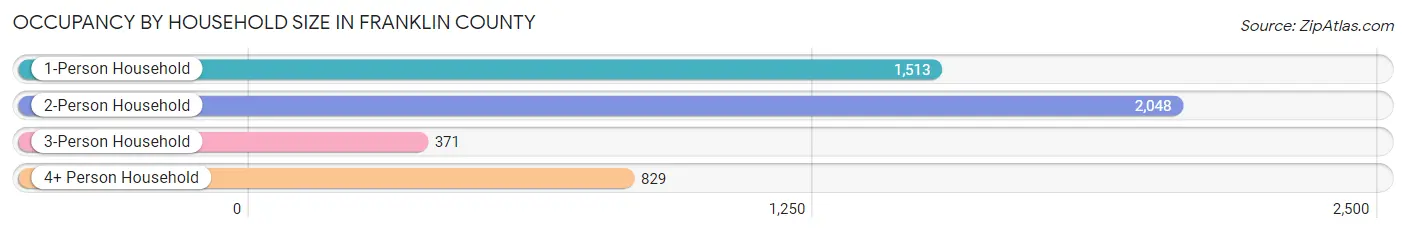
| Household Size | # Housing Units | % Housing Units |
| 1-Person Household | 1,513 | 31.8% |
| 2-Person Household | 2,048 | 43.0% |
| 3-Person Household | 371 | 7.8% |
| 4+ Person Household | 829 | 17.4% |
| Total Housing Units | 4,761 | 100.0% |
Occupancy by Ownership by Household Size in Franklin County
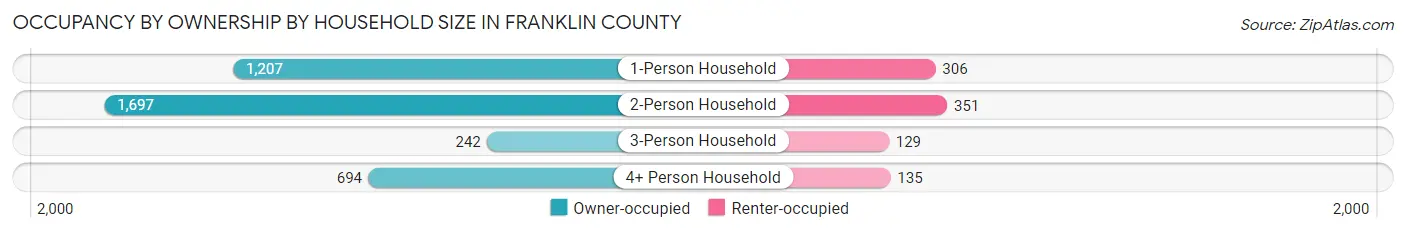
| Household Size | Owner-occupied | Renter-occupied |
| 1-Person Household | 1,207 (79.8%) | 306 (20.2%) |
| 2-Person Household | 1,697 (82.9%) | 351 (17.1%) |
| 3-Person Household | 242 (65.2%) | 129 (34.8%) |
| 4+ Person Household | 694 (83.7%) | 135 (16.3%) |
| Total Housing Units | 3,840 (80.7%) | 921 (19.3%) |
Occupancy by Educational Attainment in Franklin County
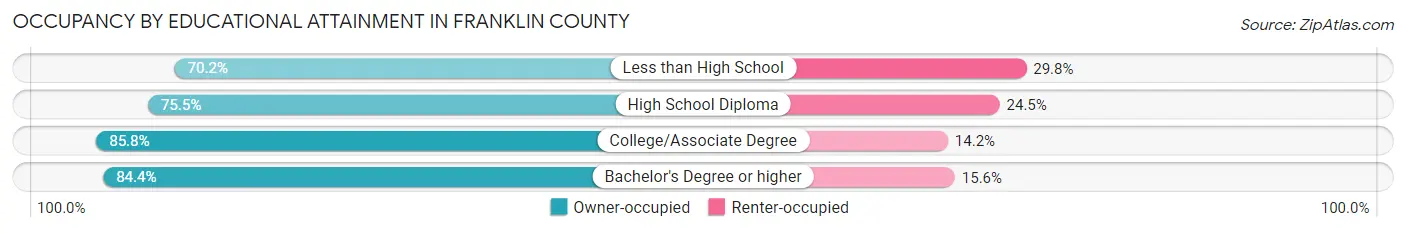
| Household Size | Owner-occupied | Renter-occupied |
| Less than High School | 406 (70.2%) | 172 (29.8%) |
| High School Diploma | 997 (75.5%) | 323 (24.5%) |
| College/Associate Degree | 1,279 (85.8%) | 212 (14.2%) |
| Bachelor's Degree or higher | 1,158 (84.4%) | 214 (15.6%) |
Occupancy by Age of Householder in Franklin County
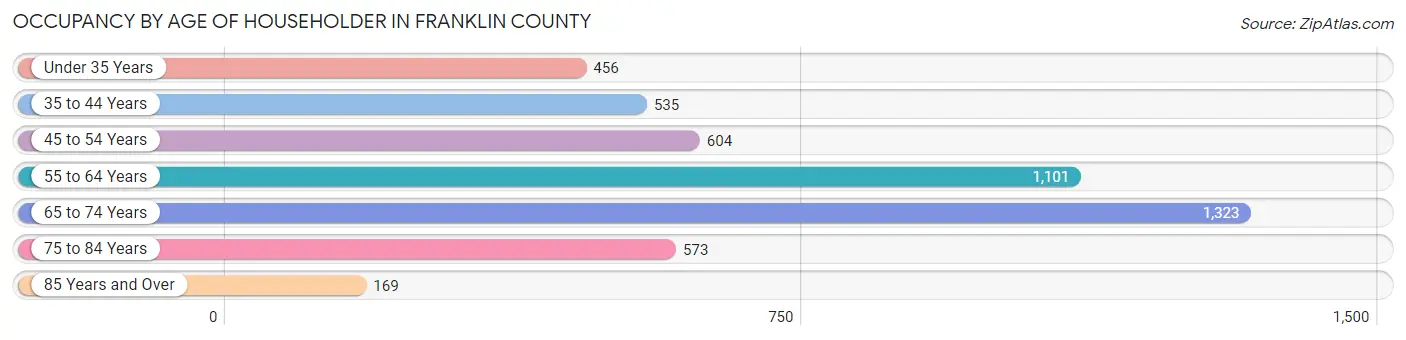
| Age Bracket | # Households | % Households |
| Under 35 Years | 456 | 9.6% |
| 35 to 44 Years | 535 | 11.2% |
| 45 to 54 Years | 604 | 12.7% |
| 55 to 64 Years | 1,101 | 23.1% |
| 65 to 74 Years | 1,323 | 27.8% |
| 75 to 84 Years | 573 | 12.0% |
| 85 Years and Over | 169 | 3.5% |
| Total | 4,761 | 100.0% |
Housing Finances in Franklin County
Median Income by Occupancy in Franklin County
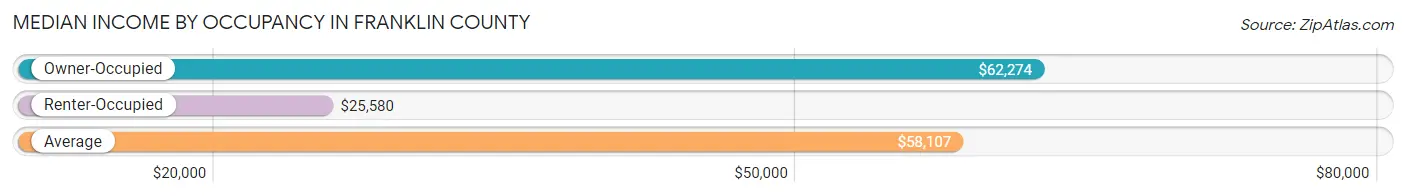
| Occupancy Type | # Households | Median Income |
| Owner-Occupied | 3,840 (80.7%) | $62,274 |
| Renter-Occupied | 921 (19.3%) | $25,580 |
| Average | 4,761 (100.0%) | $58,107 |
Occupancy by Householder Income Bracket in Franklin County
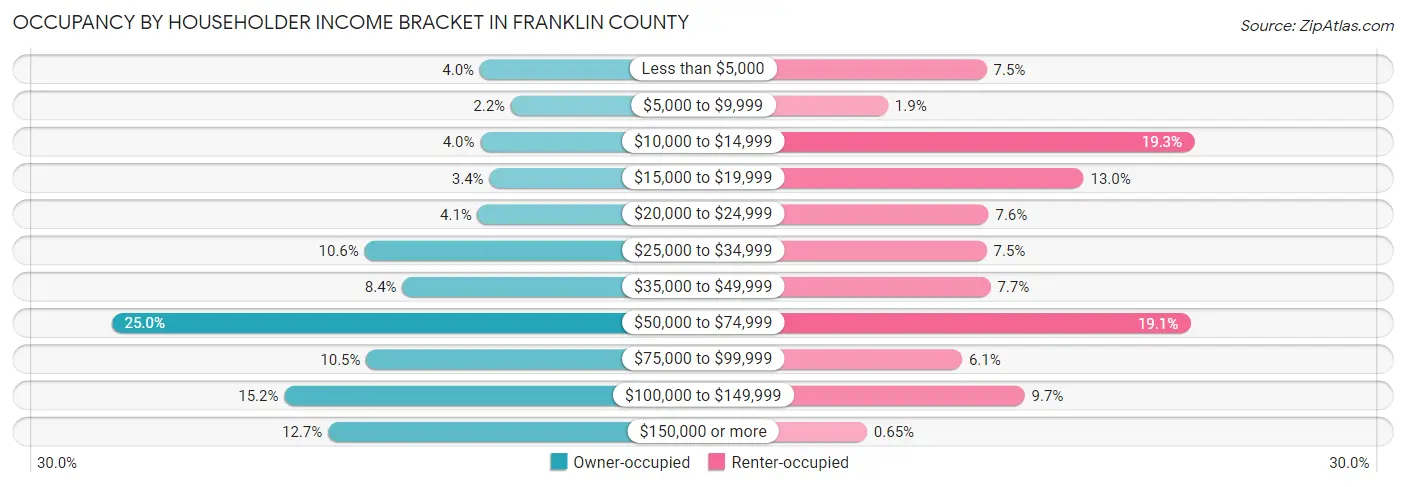
| Income Bracket | Owner-occupied | Renter-occupied |
| Less than $5,000 | 153 (4.0%) | 69 (7.5%) |
| $5,000 to $9,999 | 85 (2.2%) | 17 (1.8%) |
| $10,000 to $14,999 | 152 (4.0%) | 178 (19.3%) |
| $15,000 to $19,999 | 132 (3.4%) | 120 (13.0%) |
| $20,000 to $24,999 | 158 (4.1%) | 70 (7.6%) |
| $25,000 to $34,999 | 406 (10.6%) | 69 (7.5%) |
| $35,000 to $49,999 | 323 (8.4%) | 71 (7.7%) |
| $50,000 to $74,999 | 961 (25.0%) | 176 (19.1%) |
| $75,000 to $99,999 | 402 (10.5%) | 56 (6.1%) |
| $100,000 to $149,999 | 582 (15.2%) | 89 (9.7%) |
| $150,000 or more | 486 (12.7%) | 6 (0.6%) |
| Total | 3,840 (100.0%) | 921 (100.0%) |
Monthly Housing Cost Tiers in Franklin County
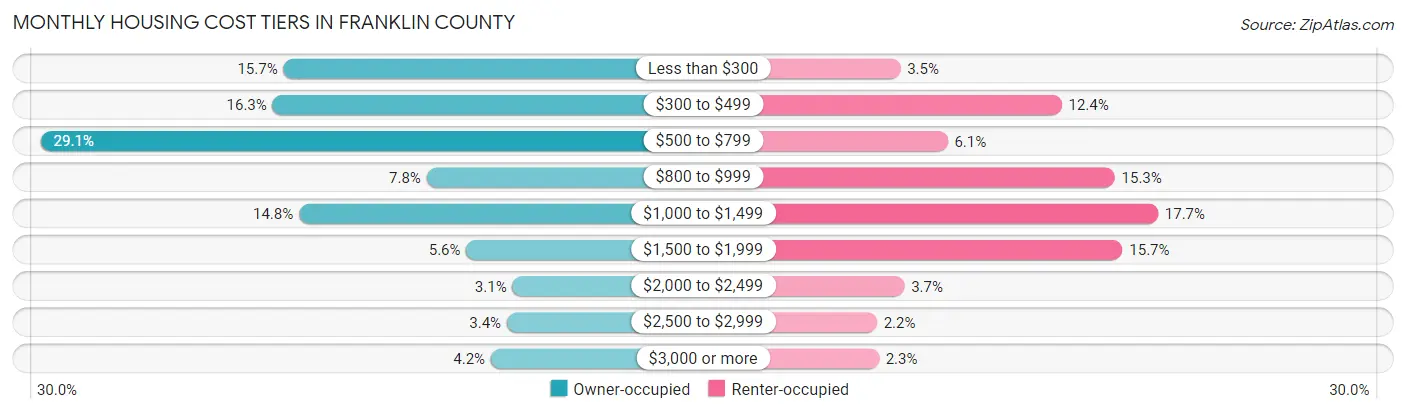
| Monthly Cost | Owner-occupied | Renter-occupied |
| Less than $300 | 603 (15.7%) | 32 (3.5%) |
| $300 to $499 | 626 (16.3%) | 114 (12.4%) |
| $500 to $799 | 1,118 (29.1%) | 56 (6.1%) |
| $800 to $999 | 299 (7.8%) | 141 (15.3%) |
| $1,000 to $1,499 | 570 (14.8%) | 163 (17.7%) |
| $1,500 to $1,999 | 215 (5.6%) | 145 (15.7%) |
| $2,000 to $2,499 | 117 (3.0%) | 34 (3.7%) |
| $2,500 to $2,999 | 129 (3.4%) | 20 (2.2%) |
| $3,000 or more | 163 (4.2%) | 21 (2.3%) |
| Total | 3,840 (100.0%) | 921 (100.0%) |
Physical Housing Characteristics in Franklin County
Housing Structures in Franklin County
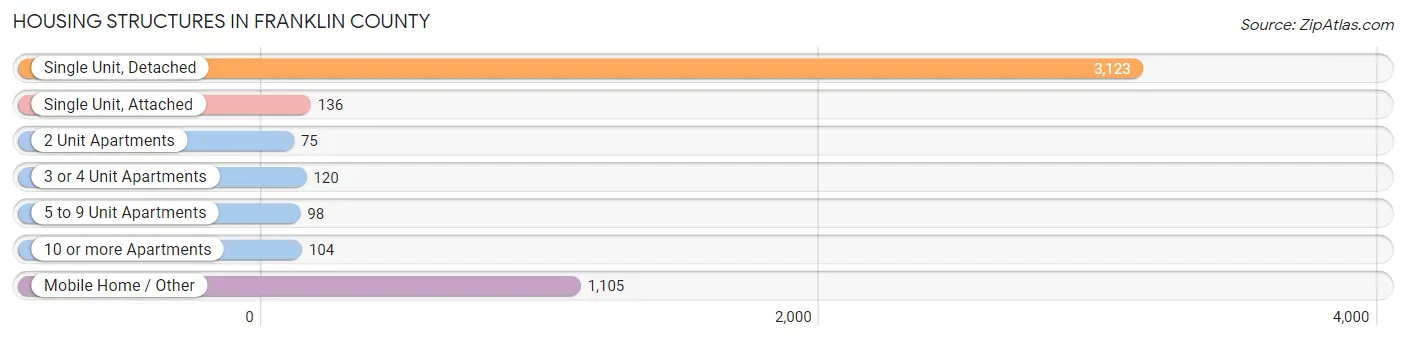
| Structure Type | # Housing Units | % Housing Units |
| Single Unit, Detached | 3,123 | 65.6% |
| Single Unit, Attached | 136 | 2.9% |
| 2 Unit Apartments | 75 | 1.6% |
| 3 or 4 Unit Apartments | 120 | 2.5% |
| 5 to 9 Unit Apartments | 98 | 2.1% |
| 10 or more Apartments | 104 | 2.2% |
| Mobile Home / Other | 1,105 | 23.2% |
| Total | 4,761 | 100.0% |
Housing Structures by Occupancy in Franklin County
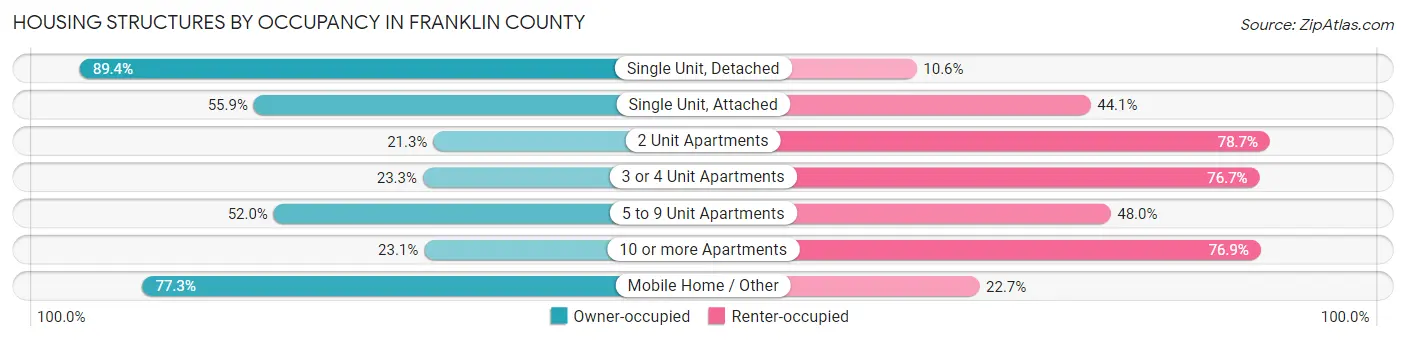
| Structure Type | Owner-occupied | Renter-occupied |
| Single Unit, Detached | 2,791 (89.4%) | 332 (10.6%) |
| Single Unit, Attached | 76 (55.9%) | 60 (44.1%) |
| 2 Unit Apartments | 16 (21.3%) | 59 (78.7%) |
| 3 or 4 Unit Apartments | 28 (23.3%) | 92 (76.7%) |
| 5 to 9 Unit Apartments | 51 (52.0%) | 47 (48.0%) |
| 10 or more Apartments | 24 (23.1%) | 80 (76.9%) |
| Mobile Home / Other | 854 (77.3%) | 251 (22.7%) |
| Total | 3,840 (80.7%) | 921 (19.3%) |
Housing Structures by Number of Rooms in Franklin County
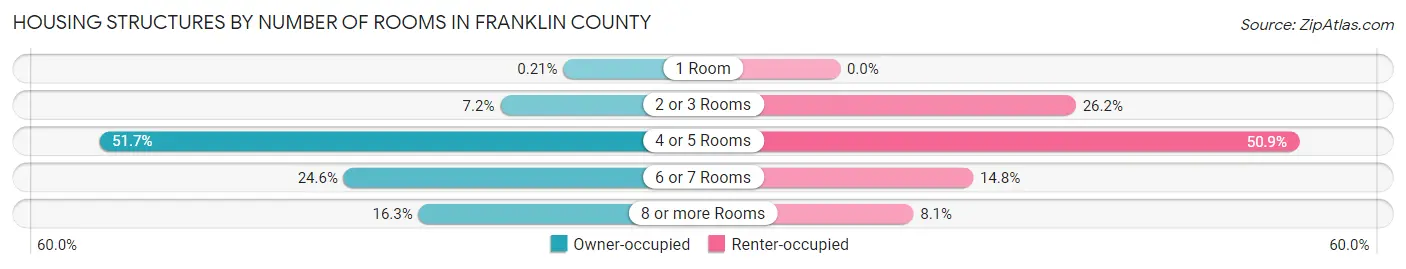
| Number of Rooms | Owner-occupied | Renter-occupied |
| 1 Room | 8 (0.2%) | 0 (0.0%) |
| 2 or 3 Rooms | 277 (7.2%) | 241 (26.2%) |
| 4 or 5 Rooms | 1,986 (51.7%) | 469 (50.9%) |
| 6 or 7 Rooms | 944 (24.6%) | 136 (14.8%) |
| 8 or more Rooms | 625 (16.3%) | 75 (8.1%) |
| Total | 3,840 (100.0%) | 921 (100.0%) |
Housing Structure by Heating Type in Franklin County
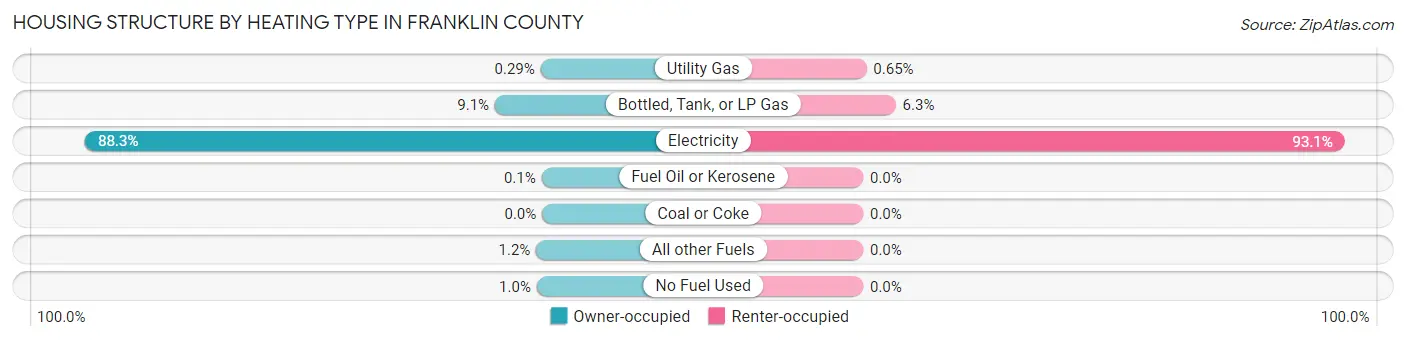
| Heating Type | Owner-occupied | Renter-occupied |
| Utility Gas | 11 (0.3%) | 6 (0.6%) |
| Bottled, Tank, or LP Gas | 350 (9.1%) | 58 (6.3%) |
| Electricity | 3,391 (88.3%) | 857 (93.0%) |
| Fuel Oil or Kerosene | 4 (0.1%) | 0 (0.0%) |
| Coal or Coke | 0 (0.0%) | 0 (0.0%) |
| All other Fuels | 44 (1.1%) | 0 (0.0%) |
| No Fuel Used | 40 (1.0%) | 0 (0.0%) |
| Total | 3,840 (100.0%) | 921 (100.0%) |
Household Vehicle Usage in Franklin County
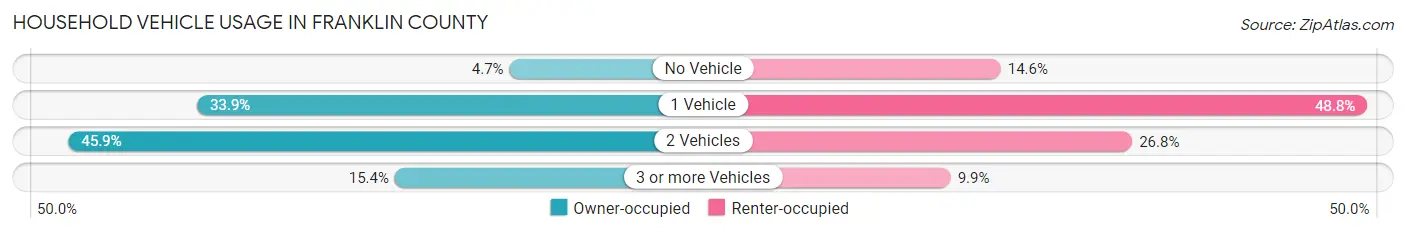
| Vehicles per Household | Owner-occupied | Renter-occupied |
| No Vehicle | 182 (4.7%) | 134 (14.5%) |
| 1 Vehicle | 1,302 (33.9%) | 449 (48.7%) |
| 2 Vehicles | 1,763 (45.9%) | 247 (26.8%) |
| 3 or more Vehicles | 593 (15.4%) | 91 (9.9%) |
| Total | 3,840 (100.0%) | 921 (100.0%) |
Real Estate & Mortgages in Franklin County
Real Estate and Mortgage Overview in Franklin County
| Characteristic | Without Mortgage | With Mortgage |
| Housing Units | 2,509 | 1,331 |
| Median Property Value | $229,900 | $242,100 |
| Median Household Income | $56,581 | $262 |
| Monthly Housing Costs | $509 | $163 |
| Real Estate Taxes | $1,147 | $48 |
Property Value by Mortgage Status in Franklin County
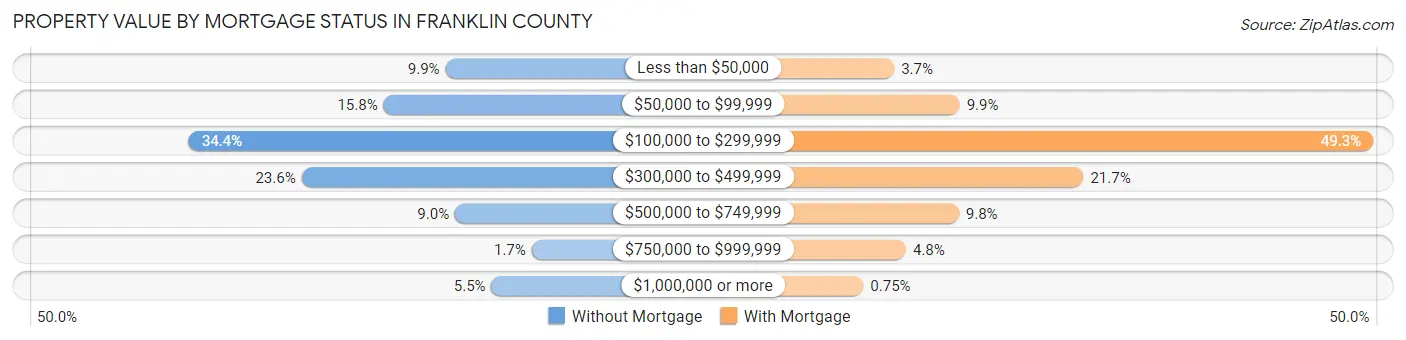
| Property Value | Without Mortgage | With Mortgage |
| Less than $50,000 | 249 (9.9%) | 49 (3.7%) |
| $50,000 to $99,999 | 397 (15.8%) | 132 (9.9%) |
| $100,000 to $299,999 | 862 (34.4%) | 656 (49.3%) |
| $300,000 to $499,999 | 593 (23.6%) | 289 (21.7%) |
| $500,000 to $749,999 | 226 (9.0%) | 131 (9.8%) |
| $750,000 to $999,999 | 43 (1.7%) | 64 (4.8%) |
| $1,000,000 or more | 139 (5.5%) | 10 (0.7%) |
| Total | 2,509 (100.0%) | 1,331 (100.0%) |
Household Income by Mortgage Status in Franklin County
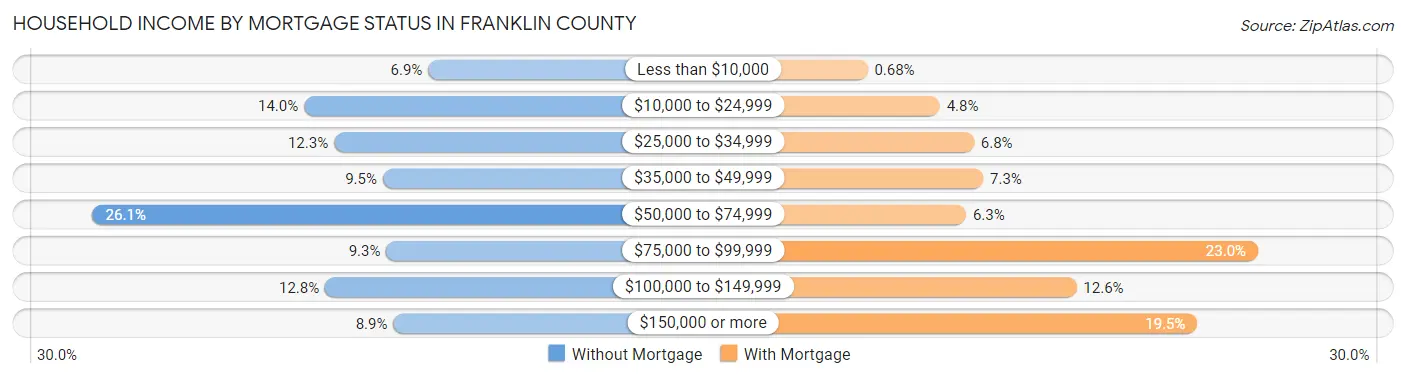
| Household Income | Without Mortgage | With Mortgage |
| Less than $10,000 | 174 (6.9%) | 9 (0.7%) |
| $10,000 to $24,999 | 352 (14.0%) | 64 (4.8%) |
| $25,000 to $34,999 | 309 (12.3%) | 90 (6.8%) |
| $35,000 to $49,999 | 239 (9.5%) | 97 (7.3%) |
| $50,000 to $74,999 | 655 (26.1%) | 84 (6.3%) |
| $75,000 to $99,999 | 234 (9.3%) | 306 (23.0%) |
| $100,000 to $149,999 | 322 (12.8%) | 168 (12.6%) |
| $150,000 or more | 224 (8.9%) | 260 (19.5%) |
| Total | 2,509 (100.0%) | 1,331 (100.0%) |
Property Value to Household Income Ratio in Franklin County
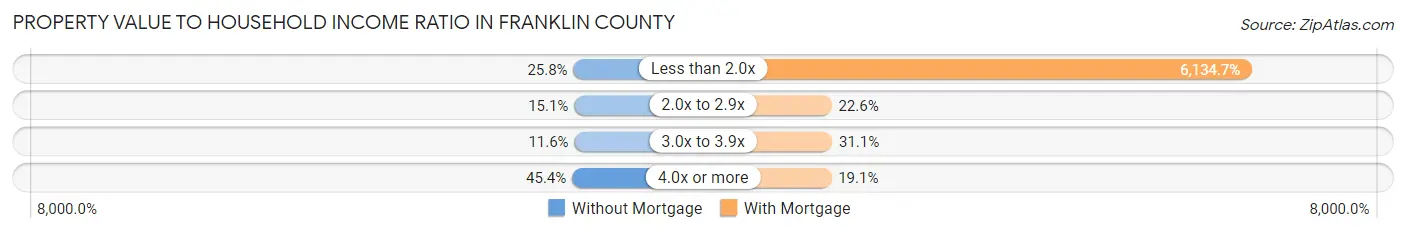
| Value-to-Income Ratio | Without Mortgage | With Mortgage |
| Less than 2.0x | 647 (25.8%) | 81,653 (6,134.7%) |
| 2.0x to 2.9x | 378 (15.1%) | 301 (22.6%) |
| 3.0x to 3.9x | 290 (11.6%) | 414 (31.1%) |
| 4.0x or more | 1,140 (45.4%) | 254 (19.1%) |
| Total | 2,509 (100.0%) | 1,331 (100.0%) |
Real Estate Taxes by Mortgage Status in Franklin County
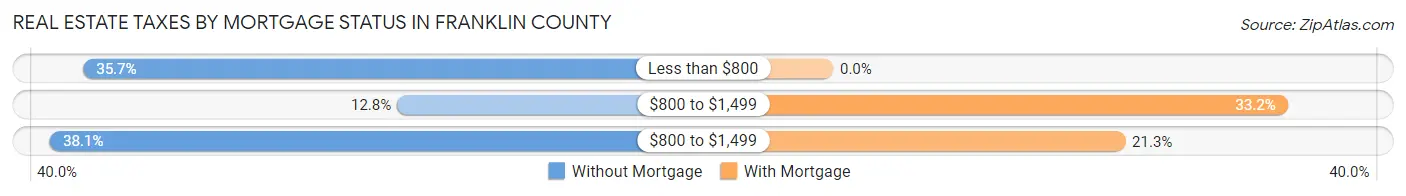
| Property Taxes | Without Mortgage | With Mortgage |
| Less than $800 | 896 (35.7%) | 0 (0.0%) |
| $800 to $1,499 | 321 (12.8%) | 442 (33.2%) |
| $800 to $1,499 | 957 (38.1%) | 284 (21.3%) |
| Total | 2,509 (100.0%) | 1,331 (100.0%) |
Health & Disability in Franklin County
Health Insurance Coverage by Age in Franklin County
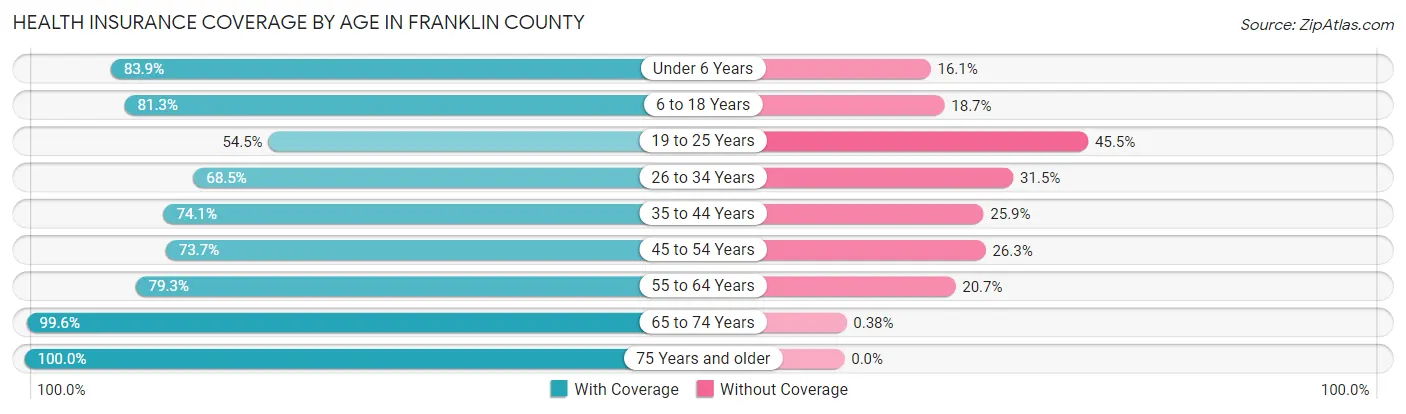
| Age Bracket | With Coverage | Without Coverage |
| Under 6 Years | 407 (83.9%) | 78 (16.1%) |
| 6 to 18 Years | 1,312 (81.3%) | 301 (18.7%) |
| 19 to 25 Years | 271 (54.5%) | 226 (45.5%) |
| 26 to 34 Years | 607 (68.5%) | 279 (31.5%) |
| 35 to 44 Years | 794 (74.1%) | 278 (25.9%) |
| 45 to 54 Years | 957 (73.7%) | 342 (26.3%) |
| 55 to 64 Years | 1,498 (79.3%) | 391 (20.7%) |
| 65 to 74 Years | 1,851 (99.6%) | 7 (0.4%) |
| 75 Years and older | 1,153 (100.0%) | 0 (0.0%) |
| Total | 8,850 (82.3%) | 1,902 (17.7%) |
Health Insurance Coverage by Citizenship Status in Franklin County
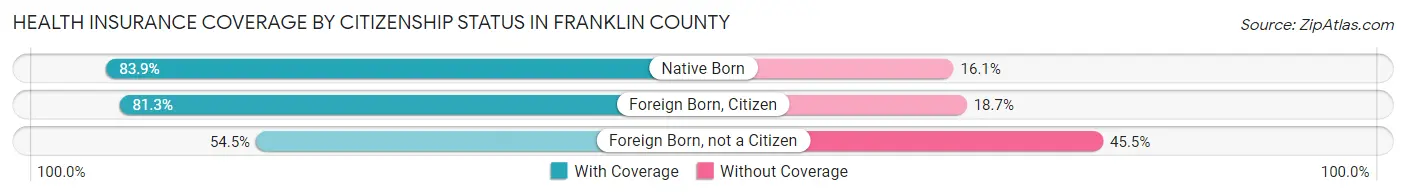
| Citizenship Status | With Coverage | Without Coverage |
| Native Born | 407 (83.9%) | 78 (16.1%) |
| Foreign Born, Citizen | 1,312 (81.3%) | 301 (18.7%) |
| Foreign Born, not a Citizen | 271 (54.5%) | 226 (45.5%) |
Health Insurance Coverage by Household Income in Franklin County
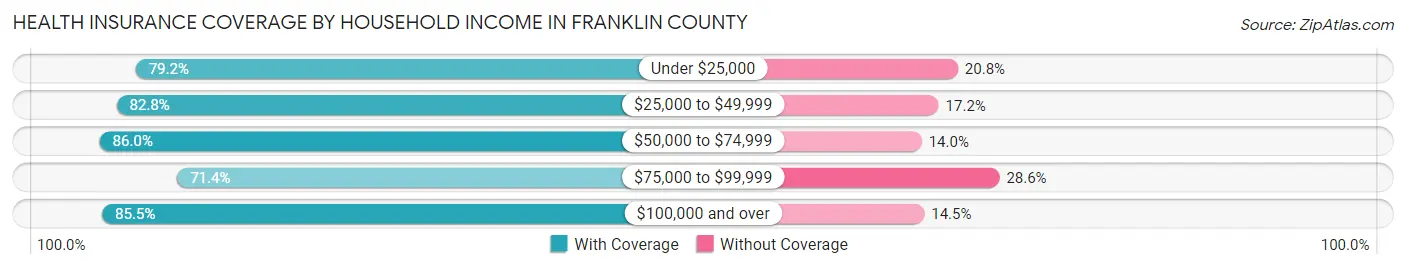
| Household Income | With Coverage | Without Coverage |
| Under $25,000 | 1,825 (79.2%) | 480 (20.8%) |
| $25,000 to $49,999 | 1,357 (82.8%) | 282 (17.2%) |
| $50,000 to $74,999 | 2,369 (86.0%) | 387 (14.0%) |
| $75,000 to $99,999 | 794 (71.4%) | 318 (28.6%) |
| $100,000 and over | 2,496 (85.5%) | 424 (14.5%) |
Public vs Private Health Insurance Coverage by Age in Franklin County
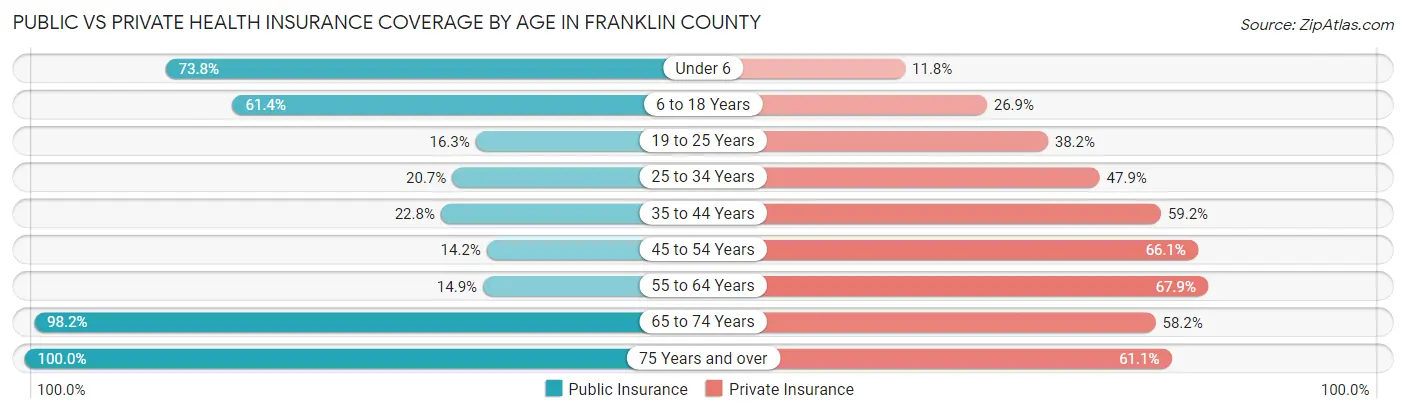
| Age Bracket | Public Insurance | Private Insurance |
| Under 6 | 358 (73.8%) | 57 (11.7%) |
| 6 to 18 Years | 990 (61.4%) | 434 (26.9%) |
| 19 to 25 Years | 81 (16.3%) | 190 (38.2%) |
| 25 to 34 Years | 183 (20.6%) | 424 (47.9%) |
| 35 to 44 Years | 244 (22.8%) | 635 (59.2%) |
| 45 to 54 Years | 185 (14.2%) | 858 (66.0%) |
| 55 to 64 Years | 282 (14.9%) | 1,283 (67.9%) |
| 65 to 74 Years | 1,825 (98.2%) | 1,082 (58.2%) |
| 75 Years and over | 1,153 (100.0%) | 705 (61.1%) |
| Total | 5,301 (49.3%) | 5,668 (52.7%) |
Disability Status by Sex by Age in Franklin County
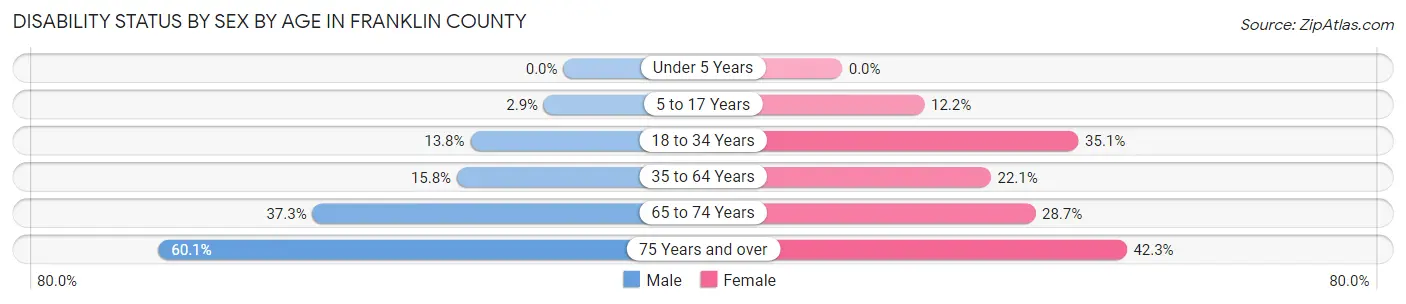
| Age Bracket | Male | Female |
| Under 5 Years | 0 (0.0%) | 0 (0.0%) |
| 5 to 17 Years | 23 (2.9%) | 84 (12.2%) |
| 18 to 34 Years | 107 (13.8%) | 272 (35.1%) |
| 35 to 64 Years | 314 (15.8%) | 502 (22.1%) |
| 65 to 74 Years | 339 (37.2%) | 272 (28.7%) |
| 75 Years and over | 359 (60.1%) | 235 (42.3%) |
Disability Class by Sex by Age in Franklin County
Disability Class: Hearing Difficulty
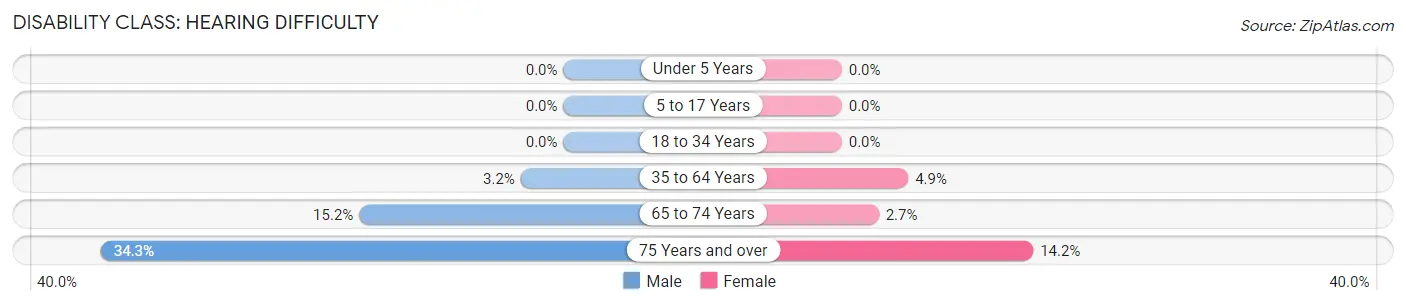
| Age Bracket | Male | Female |
| Under 5 Years | 0 (0.0%) | 0 (0.0%) |
| 5 to 17 Years | 0 (0.0%) | 0 (0.0%) |
| 18 to 34 Years | 0 (0.0%) | 0 (0.0%) |
| 35 to 64 Years | 63 (3.2%) | 112 (4.9%) |
| 65 to 74 Years | 138 (15.2%) | 26 (2.7%) |
| 75 Years and over | 205 (34.3%) | 79 (14.2%) |
Disability Class: Vision Difficulty
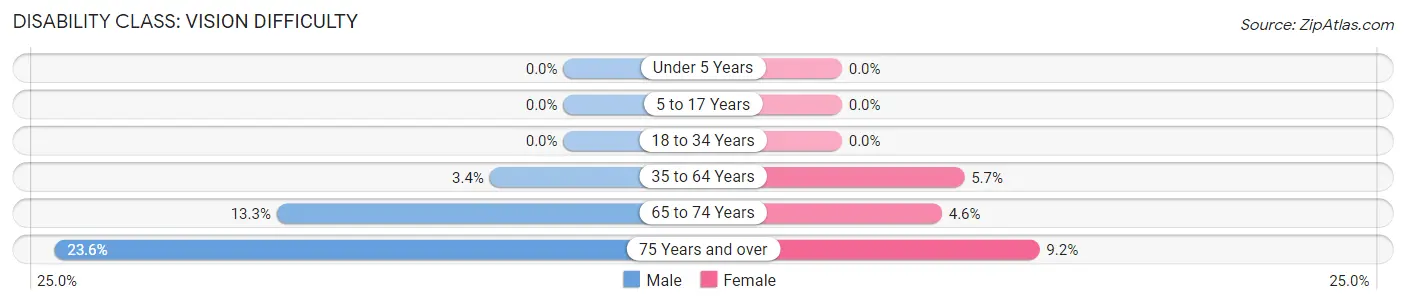
| Age Bracket | Male | Female |
| Under 5 Years | 0 (0.0%) | 0 (0.0%) |
| 5 to 17 Years | 0 (0.0%) | 0 (0.0%) |
| 18 to 34 Years | 0 (0.0%) | 0 (0.0%) |
| 35 to 64 Years | 68 (3.4%) | 129 (5.7%) |
| 65 to 74 Years | 121 (13.3%) | 44 (4.6%) |
| 75 Years and over | 141 (23.6%) | 51 (9.2%) |
Disability Class: Cognitive Difficulty
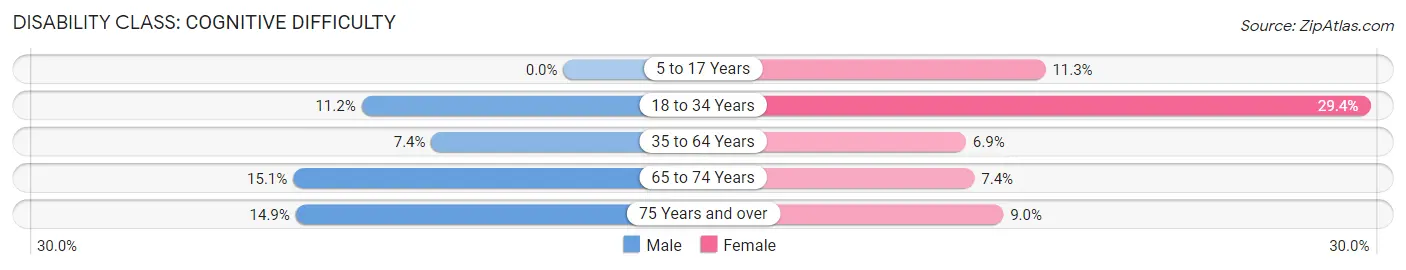
| Age Bracket | Male | Female |
| 5 to 17 Years | 0 (0.0%) | 78 (11.3%) |
| 18 to 34 Years | 87 (11.2%) | 228 (29.4%) |
| 35 to 64 Years | 146 (7.3%) | 157 (6.9%) |
| 65 to 74 Years | 137 (15.0%) | 70 (7.4%) |
| 75 Years and over | 89 (14.9%) | 50 (9.0%) |
Disability Class: Ambulatory Difficulty
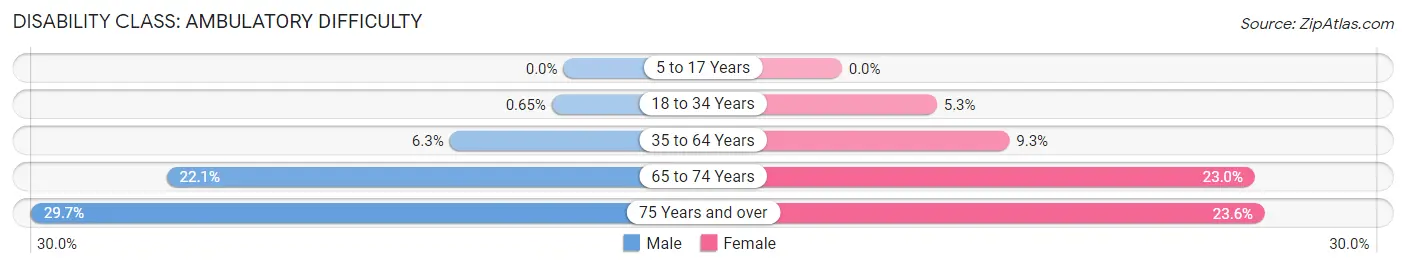
| Age Bracket | Male | Female |
| 5 to 17 Years | 0 (0.0%) | 0 (0.0%) |
| 18 to 34 Years | 5 (0.6%) | 41 (5.3%) |
| 35 to 64 Years | 126 (6.3%) | 212 (9.3%) |
| 65 to 74 Years | 201 (22.1%) | 218 (23.0%) |
| 75 Years and over | 177 (29.6%) | 131 (23.6%) |
Disability Class: Self-Care Difficulty
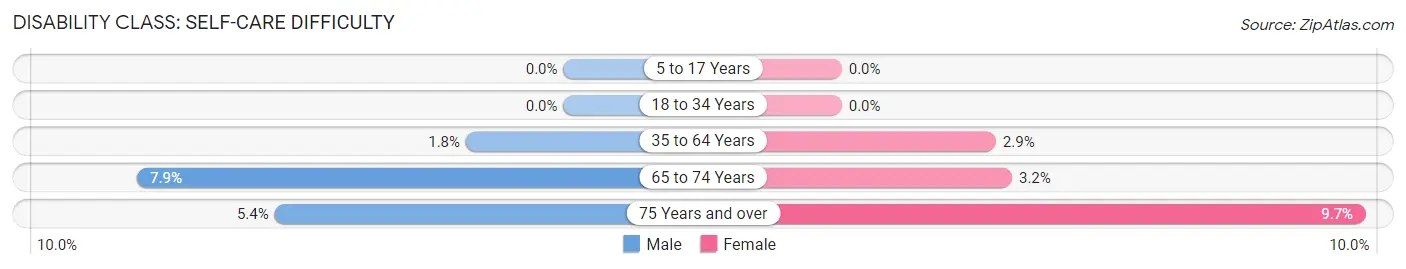
| Age Bracket | Male | Female |
| 5 to 17 Years | 0 (0.0%) | 0 (0.0%) |
| 18 to 34 Years | 0 (0.0%) | 0 (0.0%) |
| 35 to 64 Years | 36 (1.8%) | 65 (2.9%) |
| 65 to 74 Years | 72 (7.9%) | 30 (3.2%) |
| 75 Years and over | 32 (5.4%) | 54 (9.7%) |
Technology Access in Franklin County
Computing Device Access in Franklin County
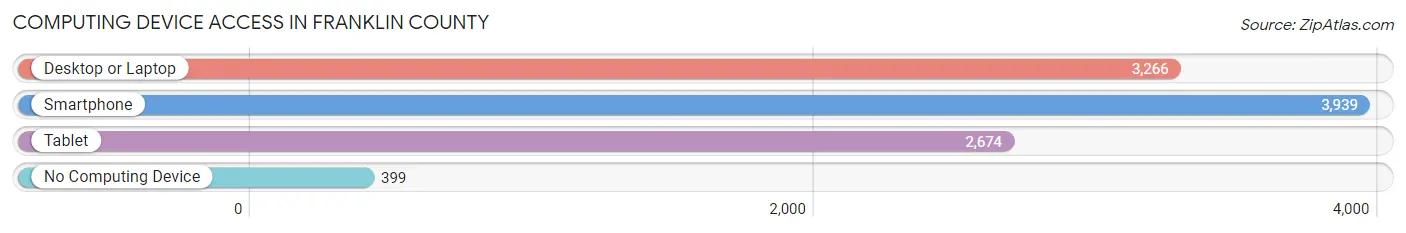
| Device Type | # Households | % Households |
| Desktop or Laptop | 3,266 | 68.6% |
| Smartphone | 3,939 | 82.7% |
| Tablet | 2,674 | 56.2% |
| No Computing Device | 399 | 8.4% |
| Total | 4,761 | 100.0% |
Internet Access in Franklin County
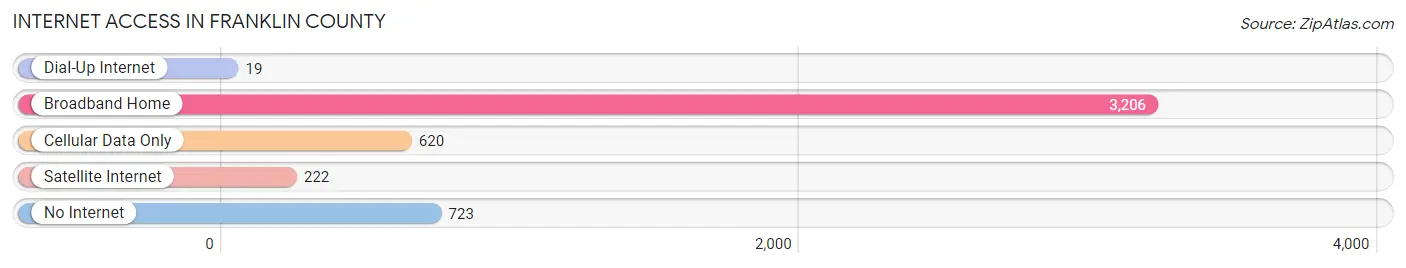
| Internet Type | # Households | % Households |
| Dial-Up Internet | 19 | 0.4% |
| Broadband Home | 3,206 | 67.3% |
| Cellular Data Only | 620 | 13.0% |
| Satellite Internet | 222 | 4.7% |
| No Internet | 723 | 15.2% |
| Total | 4,761 | 100.0% |
Franklin County Summary
Franklin County is located in the Florida Panhandle, along the Gulf of Mexico. It is bordered by Wakulla County to the north, Liberty County to the east, Gulf County to the south, and Bay County to the west. The county seat is Apalachicola, and the largest city is Carrabelle. The county has a total area of 626 square miles, of which 590 square miles is land and 36 square miles is water.
History
Franklin County was created in 1832 from parts of Escambia and Walton counties. It was named for Benjamin Franklin, one of the Founding Fathers of the United States. The county was originally part of the Apalachee Province, which was inhabited by Native American tribes such as the Apalachee, Creek, and Seminole.
In the early 19th century, the area was settled by European Americans, primarily from Georgia and the Carolinas. The county was developed for cotton plantations, and the port of Apalachicola became an important center for the cotton trade. The county was also home to a large number of African Americans, who were brought to the area as slaves to work on the plantations.
Geography
Franklin County is located in the Florida Panhandle, along the Gulf of Mexico. It is bordered by Wakulla County to the north, Liberty County to the east, Gulf County to the south, and Bay County to the west. The county has a total area of 626 square miles, of which 590 square miles is land and 36 square miles is water.
The county is mostly flat, with some rolling hills in the northern part. The Apalachicola River forms the western boundary of the county, and the Ochlockonee River forms the eastern boundary. The county is home to several lakes, including Lake Wimico, Lake Talquin, and Lake Miccosukee.
Economy
The economy of Franklin County is largely based on agriculture and tourism. The county is home to several large farms, which produce cotton, peanuts, corn, soybeans, and other crops. The county is also home to several seafood processing plants, which process oysters, shrimp, and other seafood.
Tourism is an important part of the economy, as the county is home to several popular beaches and fishing spots. The county is also home to several state parks, including St. George Island State Park and Apalachicola National Forest.
Demographics
As of the 2010 census, there were 11,549 people, 4,717 households, and 3,092 families living in Franklin County. The population density was 19.5 people per square mile. The racial makeup of the county was 79.2% White, 17.3% African American, 0.5% Native American, 0.3% Asian, 0.1% Pacific Islander, 1.2% from other races, and 1.5% from two or more races. Hispanic or Latino of any race were 3.3% of the population.
The median income for a household in the county was $32,845, and the median income for a family was $41,845. The per capita income for the county was $19,845. About 17.2% of families and 22.2% of the population were below the poverty line, including 28.2% of those under age 18 and 16.2% of those age 65 or over.
Common Questions
What is Per Capita Income in Franklin County?
Per Capita income in Franklin County is $31,433.
What is the Median Family Income in Franklin County?
Median Family Income in Franklin County is $65,462.
What is the Median Household income in Franklin County?
Median Household Income in Franklin County is $58,107.
What is Income or Wage Gap in Franklin County?
Income or Wage Gap in Franklin County is 15.9%.
Women in Franklin County earn 84.1 cents for every dollar earned by a man.
What is Family Income Deficit in Franklin County?
Family Income Deficit in Franklin County is $9,330.
Families that are below poverty line in Franklin County earn $9,330 less on average than the poverty threshold level.
What is Inequality or Gini Index in Franklin County?
Inequality or Gini Index in Franklin County is 0.48.
What is the Total Population of Franklin County?
Total Population of Franklin County is 12,276.
What is the Total Male Population of Franklin County?
Total Male Population of Franklin County is 6,827.
What is the Total Female Population of Franklin County?
Total Female Population of Franklin County is 5,449.
What is the Ratio of Males per 100 Females in Franklin County?
There are 125.29 Males per 100 Females in Franklin County.
What is the Ratio of Females per 100 Males in Franklin County?
There are 79.82 Females per 100 Males in Franklin County.
What is the Median Population Age in Franklin County?
Median Population Age in Franklin County is 48.7 Years.
What is the Average Family Size in Franklin County
Average Family Size in Franklin County is 2.8 People.
What is the Average Household Size in Franklin County
Average Household Size in Franklin County is 2.2 People.
How Large is the Labor Force in Franklin County?
There are 4,671 People in the Labor Forcein in Franklin County.
What is the Percentage of People in the Labor Force in Franklin County?
44.6% of People are in the Labor Force in Franklin County.
What is the Unemployment Rate in Franklin County?
Unemployment Rate in Franklin County is 8.9%.