Flagler County, FL Map & Demographics
Flagler County Map
Flagler County Overview
$40,463
PER CAPITA INCOME
$80,702
AVG FAMILY INCOME
$69,251
AVG HOUSEHOLD INCOME
21.4%
WAGE / INCOME GAP [ % ]
78.6¢/ $1
WAGE / INCOME GAP [ $ ]
$10,057
FAMILY INCOME DEFICIT
0.46
INEQUALITY / GINI INDEX
117,515
TOTAL POPULATION
56,801
MALE POPULATION
60,714
FEMALE POPULATION
93.56
MALES / 100 FEMALES
106.89
FEMALES / 100 MALES
52.4
MEDIAN AGE
2.8
AVG FAMILY SIZE
2.5
AVG HOUSEHOLD SIZE
50,198
LABOR FORCE [ PEOPLE ]
50.0%
PERCENT IN LABOR FORCE
3.8%
UNEMPLOYMENT RATE
Flagler County Area Codes
Income in Flagler County
Income Overview in Flagler County
Per Capita Income in Flagler County is $40,463, while median incomes of families and households are $80,702 and $69,251 respectively.
| Characteristic | Number | Measure |
| Per Capita Income | 117,515 | $40,463 |
| Median Family Income | 34,390 | $80,702 |
| Mean Family Income | 34,390 | $109,147 |
| Median Household Income | 47,549 | $69,251 |
| Mean Household Income | 47,549 | $97,079 |
| Income Deficit | 34,390 | $10,057 |
| Wage / Income Gap (%) | 117,515 | 21.39% |
| Wage / Income Gap ($) | 117,515 | 78.61¢ per $1 |
| Gini / Inequality Index | 117,515 | 0.46 |
Earnings by Sex in Flagler County
Average Earnings in Flagler County are $37,751, $42,609 for men and $33,494 for women, a difference of 21.4%.
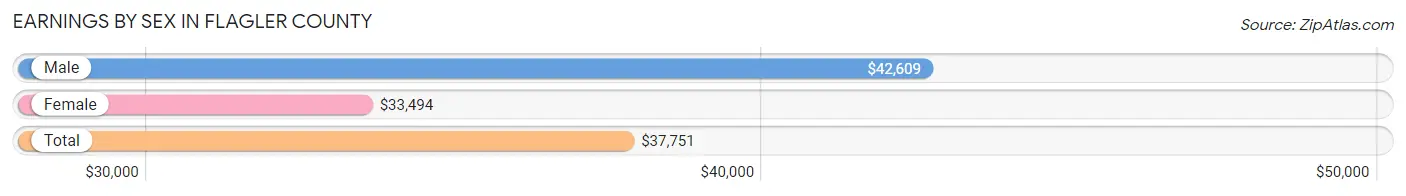
| Sex | Number | Average Earnings |
| Male | 26,543 (50.9%) | $42,609 |
| Female | 25,562 (49.1%) | $33,494 |
| Total | 52,105 (100.0%) | $37,751 |
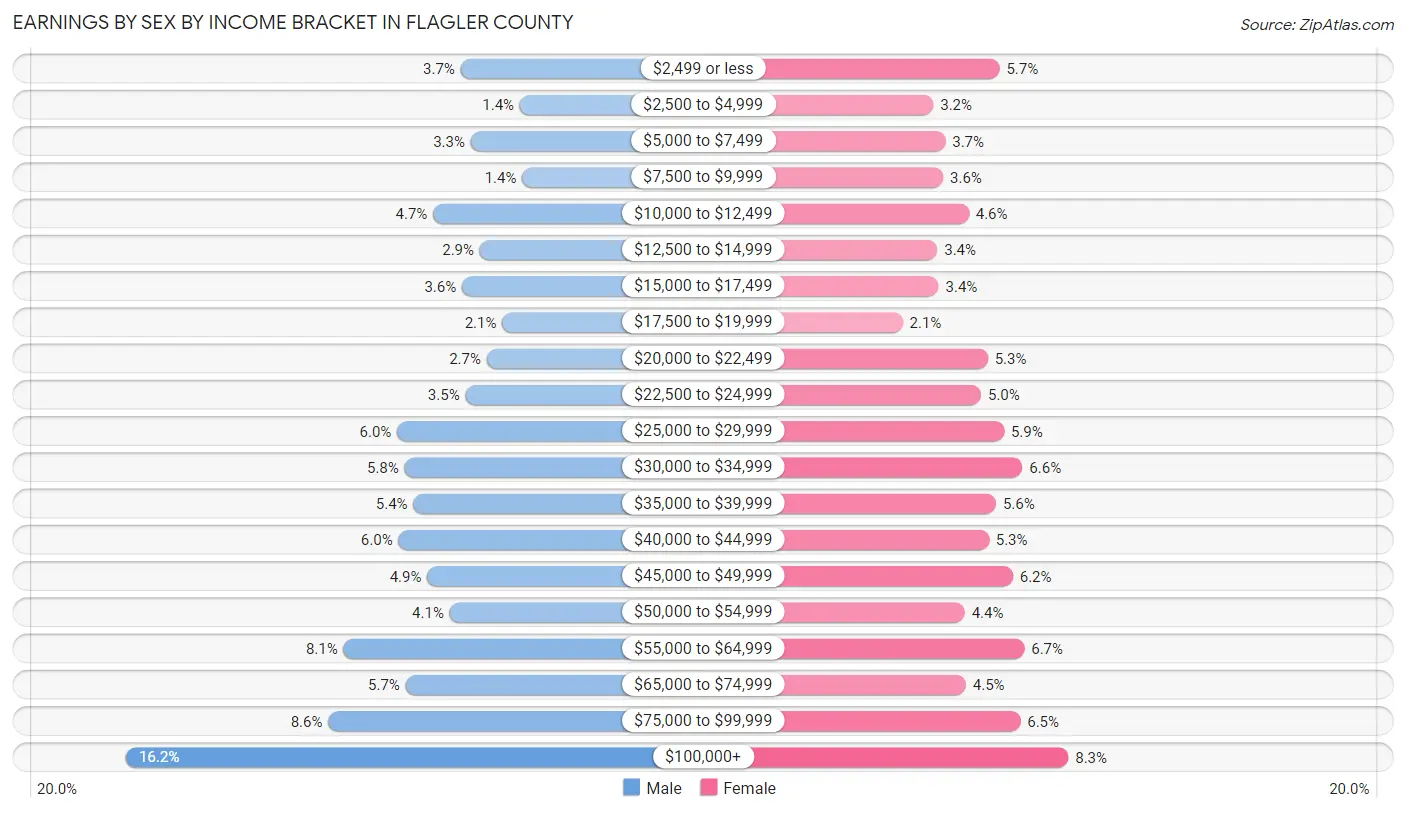
Earnings by Sex by Income Bracket in Flagler County
The most common earnings brackets in Flagler County are $100,000+ for men (4,300 | 16.2%) and $100,000+ for women (2,122 | 8.3%).
| Income | Male | Female |
| $2,499 or less | 971 (3.7%) | 1,462 (5.7%) |
| $2,500 to $4,999 | 381 (1.4%) | 828 (3.2%) |
| $5,000 to $7,499 | 870 (3.3%) | 943 (3.7%) |
| $7,500 to $9,999 | 358 (1.3%) | 924 (3.6%) |
| $10,000 to $12,499 | 1,244 (4.7%) | 1,169 (4.6%) |
| $12,500 to $14,999 | 780 (2.9%) | 867 (3.4%) |
| $15,000 to $17,499 | 958 (3.6%) | 879 (3.4%) |
| $17,500 to $19,999 | 558 (2.1%) | 533 (2.1%) |
| $20,000 to $22,499 | 711 (2.7%) | 1,350 (5.3%) |
| $22,500 to $24,999 | 925 (3.5%) | 1,286 (5.0%) |
| $25,000 to $29,999 | 1,604 (6.0%) | 1,506 (5.9%) |
| $30,000 to $34,999 | 1,528 (5.8%) | 1,681 (6.6%) |
| $35,000 to $39,999 | 1,440 (5.4%) | 1,429 (5.6%) |
| $40,000 to $44,999 | 1,590 (6.0%) | 1,361 (5.3%) |
| $45,000 to $49,999 | 1,302 (4.9%) | 1,589 (6.2%) |
| $50,000 to $54,999 | 1,079 (4.1%) | 1,131 (4.4%) |
| $55,000 to $64,999 | 2,138 (8.1%) | 1,700 (6.7%) |
| $65,000 to $74,999 | 1,518 (5.7%) | 1,141 (4.5%) |
| $75,000 to $99,999 | 2,288 (8.6%) | 1,661 (6.5%) |
| $100,000+ | 4,300 (16.2%) | 2,122 (8.3%) |
| Total | 26,543 (100.0%) | 25,562 (100.0%) |
Earnings by Sex by Educational Attainment in Flagler County
Average earnings in Flagler County are $47,088 for men and $37,299 for women, a difference of 20.8%. Men with an educational attainment of graduate degree enjoy the highest average annual earnings of $71,691, while those with less than high school education earn the least with $34,560. Women with an educational attainment of graduate degree earn the most with the average annual earnings of $61,411, while those with less than high school education have the smallest earnings of $22,237.
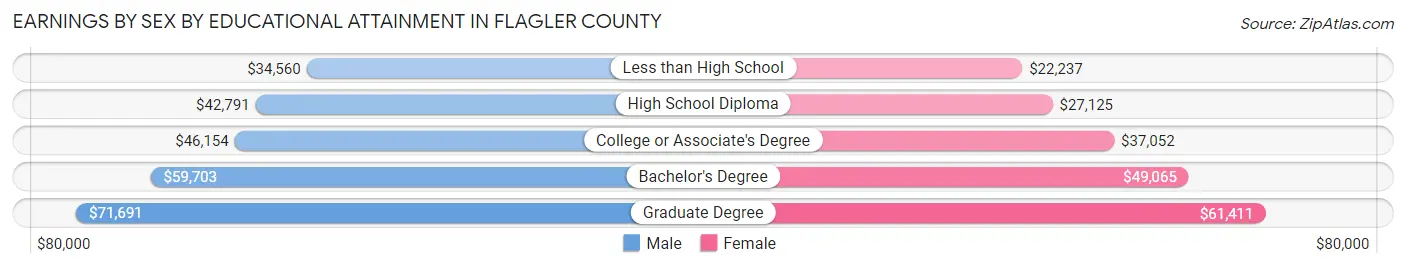
| Educational Attainment | Male Income | Female Income |
| Less than High School | $34,560 | $22,237 |
| High School Diploma | $42,791 | $27,125 |
| College or Associate's Degree | $46,154 | $37,052 |
| Bachelor's Degree | $59,703 | $49,065 |
| Graduate Degree | $71,691 | $61,411 |
| Total | $47,088 | $37,299 |
Family Income in Flagler County
Family Income Brackets in Flagler County
According to the Flagler County family income data, there are 6,775 families falling into the $100,000 to $149,999 income range, which is the most common income bracket and makes up 19.7% of all families. Conversely, the $10,000 to $14,999 income bracket is the least frequent group with only 447 families (1.3%) belonging to this category.
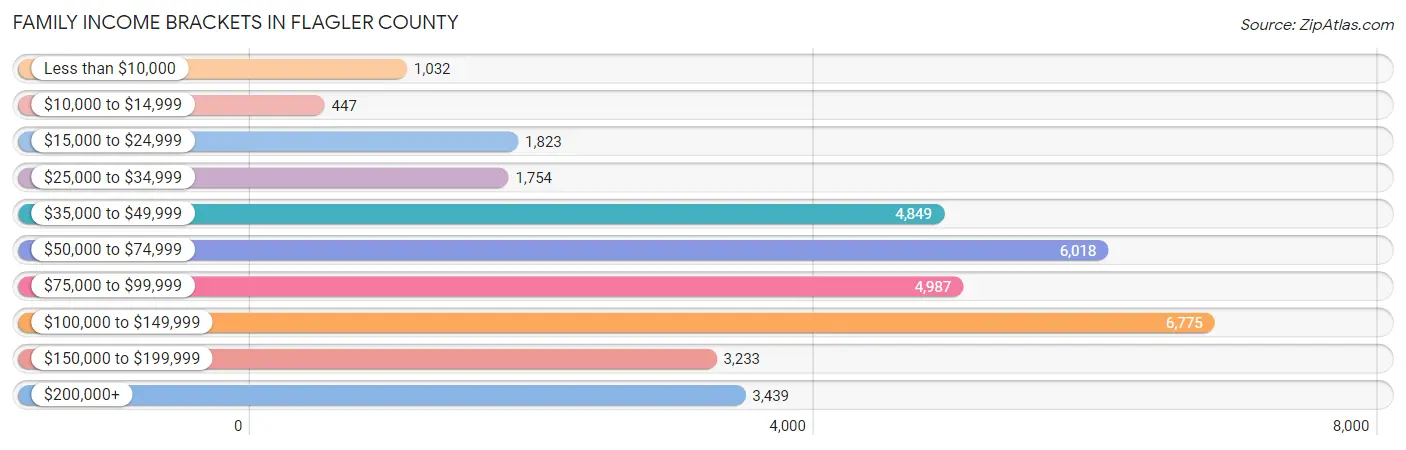
| Income Bracket | # Families | % Families |
| Less than $10,000 | 1,032 | 3.0% |
| $10,000 to $14,999 | 447 | 1.3% |
| $15,000 to $24,999 | 1,823 | 5.3% |
| $25,000 to $34,999 | 1,754 | 5.1% |
| $35,000 to $49,999 | 4,849 | 14.1% |
| $50,000 to $74,999 | 6,018 | 17.5% |
| $75,000 to $99,999 | 4,987 | 14.5% |
| $100,000 to $149,999 | 6,775 | 19.7% |
| $150,000 to $199,999 | 3,233 | 9.4% |
| $200,000+ | 3,439 | 10.0% |
Family Income by Famaliy Size in Flagler County
6-person families (667 | 1.9%) account for the highest median family income in Flagler County with $111,021 per family, while 2-person families (21,119 | 61.4%) have the highest median income of $34,520 per family member.
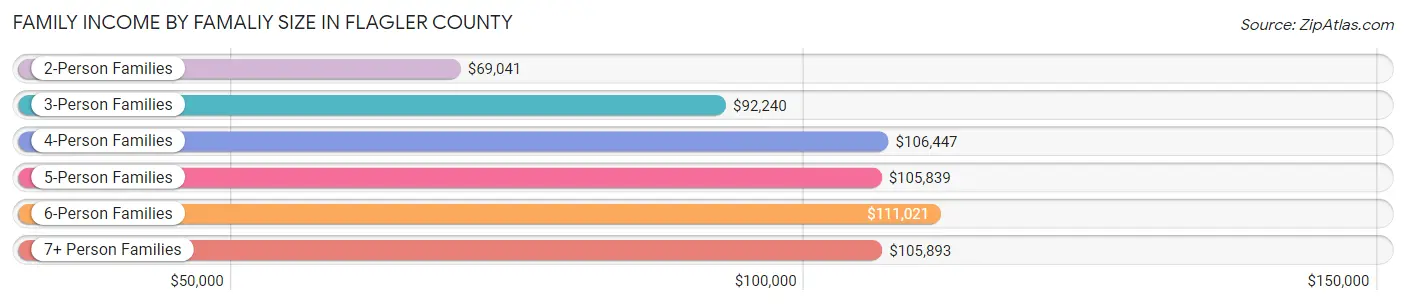
| Income Bracket | # Families | Median Income |
| 2-Person Families | 21,119 (61.4%) | $69,041 |
| 3-Person Families | 6,285 (18.3%) | $92,240 |
| 4-Person Families | 4,224 (12.3%) | $106,447 |
| 5-Person Families | 1,765 (5.1%) | $105,839 |
| 6-Person Families | 667 (1.9%) | $111,021 |
| 7+ Person Families | 330 (1.0%) | $105,893 |
| Total | 34,390 (100.0%) | $80,702 |
Family Income by Number of Earners in Flagler County
The median family income in Flagler County is $80,702, with families comprising 3+ earners (2,939) having the highest median family income of $126,371, while families with no earners (11,199) have the lowest median family income of $55,579, accounting for 8.6% and 32.6% of families, respectively.
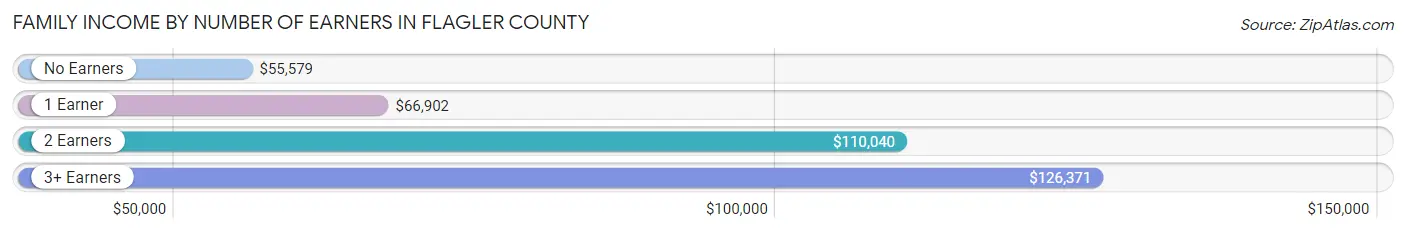
| Number of Earners | # Families | Median Income |
| No Earners | 11,199 (32.6%) | $55,579 |
| 1 Earner | 9,522 (27.7%) | $66,902 |
| 2 Earners | 10,730 (31.2%) | $110,040 |
| 3+ Earners | 2,939 (8.6%) | $126,371 |
| Total | 34,390 (100.0%) | $80,702 |
Household Income in Flagler County
Household Income Brackets in Flagler County
With 8,464 households falling in the category, the $50,000 to $74,999 income range is the most frequent in Flagler County, accounting for 17.8% of all households. In contrast, only 1,189 households (2.5%) fall into the $10,000 to $14,999 income bracket, making it the least populous group.
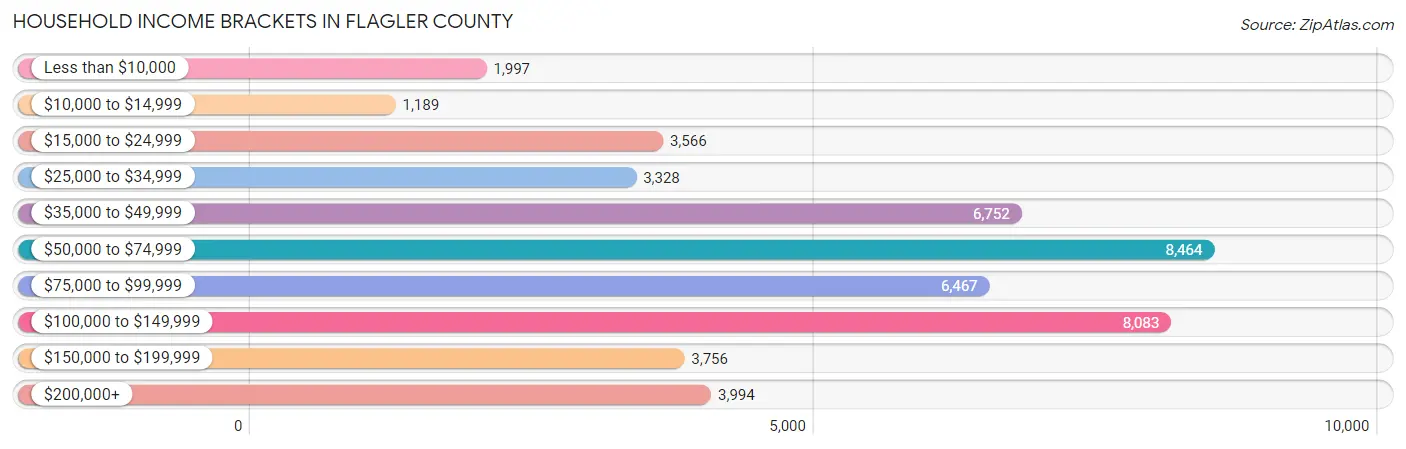
| Income Bracket | # Households | % Households |
| Less than $10,000 | 1,997 | 4.2% |
| $10,000 to $14,999 | 1,189 | 2.5% |
| $15,000 to $24,999 | 3,566 | 7.5% |
| $25,000 to $34,999 | 3,328 | 7.0% |
| $35,000 to $49,999 | 6,752 | 14.2% |
| $50,000 to $74,999 | 8,464 | 17.8% |
| $75,000 to $99,999 | 6,467 | 13.6% |
| $100,000 to $149,999 | 8,083 | 17.0% |
| $150,000 to $199,999 | 3,756 | 7.9% |
| $200,000+ | 3,994 | 8.4% |
Household Income by Householder Age in Flagler County
The median household income in Flagler County is $69,251, with the highest median household income of $82,217 found in the 45 to 64 years age bracket for the primary householder. A total of 16,749 households (35.2%) fall into this category. Meanwhile, the 15 to 24 years age bracket for the primary householder has the lowest median household income of $43,901, with 697 households (1.5%) in this group.
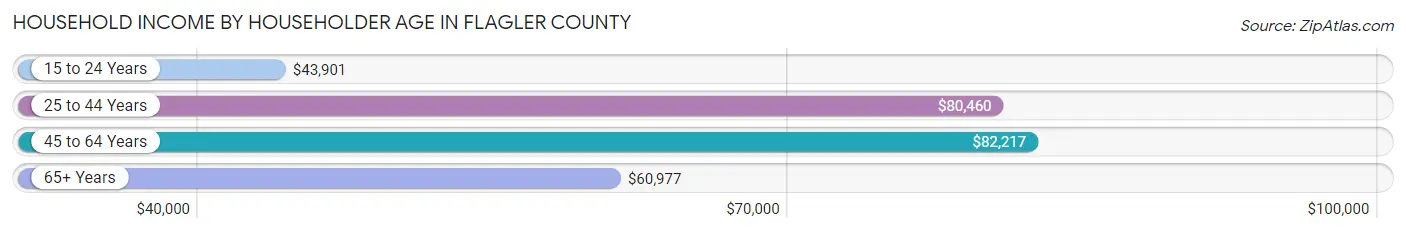
| Income Bracket | # Households | Median Income |
| 15 to 24 Years | 697 (1.5%) | $43,901 |
| 25 to 44 Years | 9,306 (19.6%) | $80,460 |
| 45 to 64 Years | 16,749 (35.2%) | $82,217 |
| 65+ Years | 20,797 (43.7%) | $60,977 |
| Total | 47,549 (100.0%) | $69,251 |
Poverty in Flagler County
Income Below Poverty by Sex and Age in Flagler County
With 9.5% poverty level for males and 10.0% for females among the residents of Flagler County, 5 year old males and 16 and 17 year old females are the most vulnerable to poverty, with 82 males (25.8%) and 299 females (25.4%) in their respective age groups living below the poverty level.
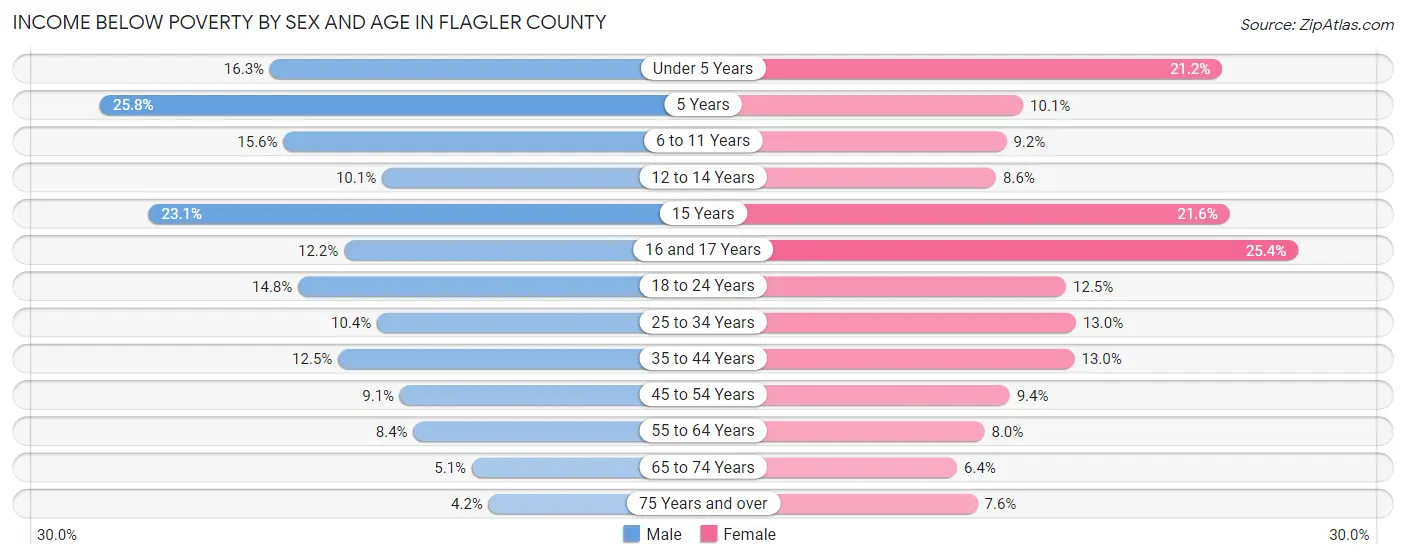
| Age Bracket | Male | Female |
| Under 5 Years | 308 (16.3%) | 440 (21.2%) |
| 5 Years | 82 (25.8%) | 63 (10.1%) |
| 6 to 11 Years | 535 (15.6%) | 314 (9.2%) |
| 12 to 14 Years | 197 (10.1%) | 132 (8.6%) |
| 15 Years | 203 (23.1%) | 103 (21.6%) |
| 16 and 17 Years | 123 (12.2%) | 299 (25.4%) |
| 18 to 24 Years | 549 (14.8%) | 452 (12.5%) |
| 25 to 34 Years | 542 (10.4%) | 653 (13.0%) |
| 35 to 44 Years | 714 (12.5%) | 790 (13.0%) |
| 45 to 54 Years | 585 (9.1%) | 671 (9.3%) |
| 55 to 64 Years | 717 (8.4%) | 807 (8.0%) |
| 65 to 74 Years | 500 (5.1%) | 701 (6.4%) |
| 75 Years and over | 304 (4.2%) | 598 (7.6%) |
| Total | 5,359 (9.5%) | 6,023 (10.0%) |
Income Above Poverty by Sex and Age in Flagler County
According to the poverty statistics in Flagler County, males aged 75 years and over and females aged 65 to 74 years are the age groups that are most secure financially, with 95.8% of males and 93.6% of females in these age groups living above the poverty line.
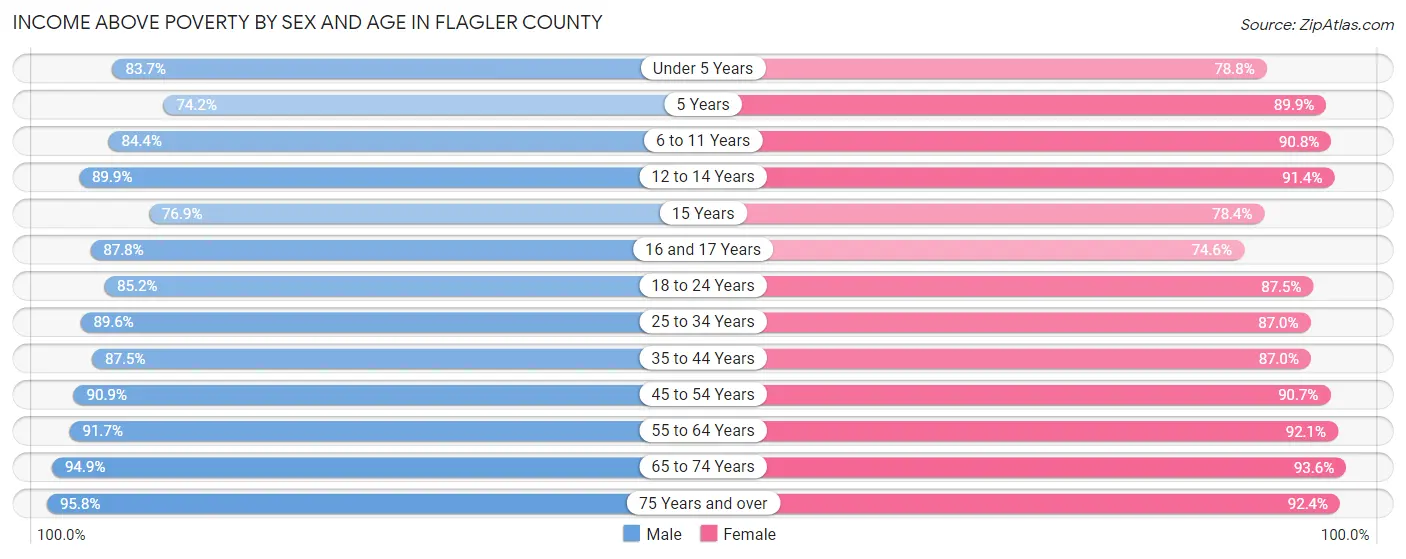
| Age Bracket | Male | Female |
| Under 5 Years | 1,577 (83.7%) | 1,637 (78.8%) |
| 5 Years | 236 (74.2%) | 561 (89.9%) |
| 6 to 11 Years | 2,896 (84.4%) | 3,111 (90.8%) |
| 12 to 14 Years | 1,753 (89.9%) | 1,404 (91.4%) |
| 15 Years | 676 (76.9%) | 374 (78.4%) |
| 16 and 17 Years | 884 (87.8%) | 878 (74.6%) |
| 18 to 24 Years | 3,169 (85.2%) | 3,167 (87.5%) |
| 25 to 34 Years | 4,685 (89.6%) | 4,354 (87.0%) |
| 35 to 44 Years | 4,979 (87.5%) | 5,307 (87.0%) |
| 45 to 54 Years | 5,843 (90.9%) | 6,504 (90.6%) |
| 55 to 64 Years | 7,867 (91.6%) | 9,350 (92.0%) |
| 65 to 74 Years | 9,322 (94.9%) | 10,219 (93.6%) |
| 75 Years and over | 6,997 (95.8%) | 7,310 (92.4%) |
| Total | 50,884 (90.5%) | 54,176 (90.0%) |
Income Below Poverty Among Married-Couple Families in Flagler County
The poverty statistics for married-couple families in Flagler County show that 4.0% or 1,093 of the total 27,433 families live below the poverty line. Families with 3 or 4 children have the highest poverty rate of 12.5%, comprising of 172 families. On the other hand, families with 5 or more children have the lowest poverty rate of 0.0%, which includes 0 families.
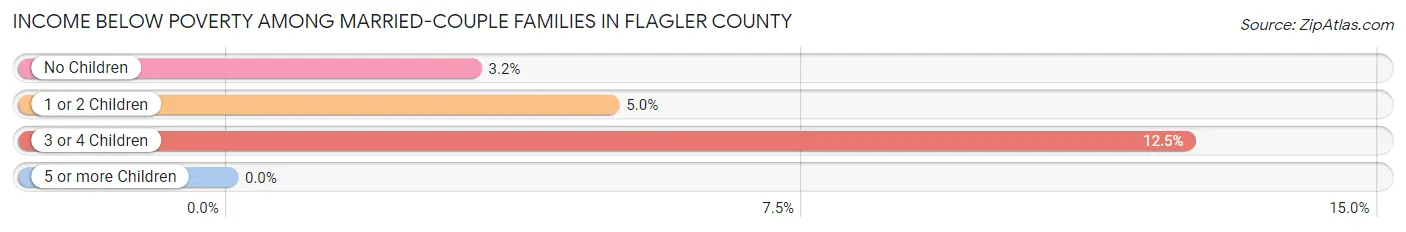
| Children | Above Poverty | Below Poverty |
| No Children | 20,127 (96.8%) | 661 (3.2%) |
| 1 or 2 Children | 4,956 (95.0%) | 260 (5.0%) |
| 3 or 4 Children | 1,204 (87.5%) | 172 (12.5%) |
| 5 or more Children | 53 (100.0%) | 0 (0.0%) |
| Total | 26,340 (96.0%) | 1,093 (4.0%) |
Income Below Poverty Among Single-Parent Households in Flagler County
According to the poverty data in Flagler County, 6.8% or 132 single-father households and 23.5% or 1,181 single-mother households are living below the poverty line. Among single-father households, those with no children have the highest poverty rate, with 68 households (7.2%) experiencing poverty. Likewise, among single-mother households, those with 3 or 4 children have the highest poverty rate, with 124 households (57.9%) falling below the poverty line.
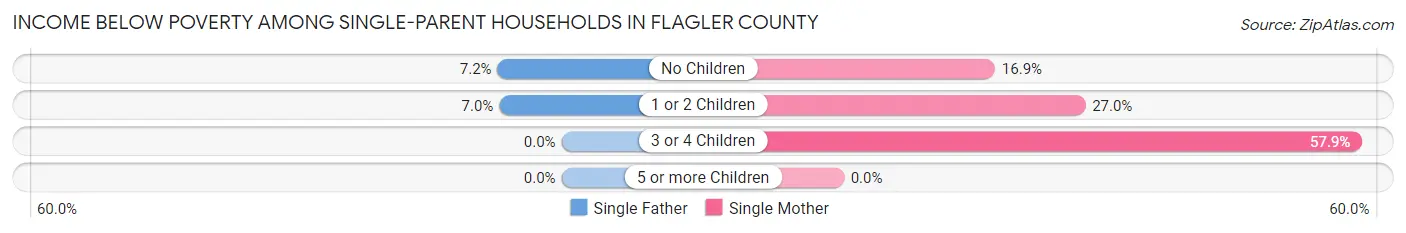
| Children | Single Father | Single Mother |
| No Children | 68 (7.2%) | 404 (16.9%) |
| 1 or 2 Children | 64 (7.0%) | 653 (27.0%) |
| 3 or 4 Children | 0 (0.0%) | 124 (57.9%) |
| 5 or more Children | 0 (0.0%) | 0 (0.0%) |
| Total | 132 (6.8%) | 1,181 (23.5%) |
Income Below Poverty Among Married-Couple vs Single-Parent Households in Flagler County
The poverty data for Flagler County shows that 1,093 of the married-couple family households (4.0%) and 1,313 of the single-parent households (18.9%) are living below the poverty level. Within the married-couple family households, those with 3 or 4 children have the highest poverty rate, with 172 households (12.5%) falling below the poverty line. Among the single-parent households, those with 3 or 4 children have the highest poverty rate, with 124 household (44.8%) living below poverty.
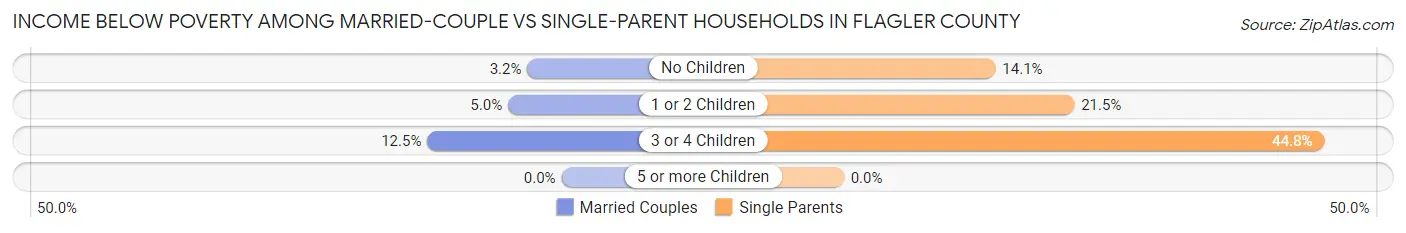
| Children | Married-Couple Families | Single-Parent Households |
| No Children | 661 (3.2%) | 472 (14.1%) |
| 1 or 2 Children | 260 (5.0%) | 717 (21.5%) |
| 3 or 4 Children | 172 (12.5%) | 124 (44.8%) |
| 5 or more Children | 0 (0.0%) | 0 (0.0%) |
| Total | 1,093 (4.0%) | 1,313 (18.9%) |
Race in Flagler County
The most populous races in Flagler County are White / Caucasian (91,349 | 77.7%), Hispanic or Latino (13,212 | 11.2%), and Black / African American (10,786 | 9.2%).
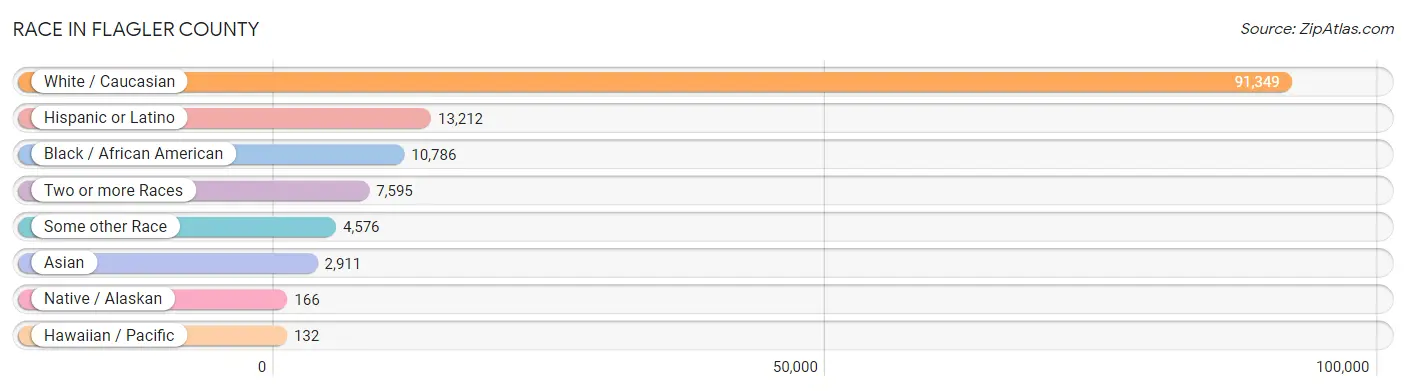
| Race | # Population | % Population |
| Asian | 2,911 | 2.5% |
| Black / African American | 10,786 | 9.2% |
| Hawaiian / Pacific | 132 | 0.1% |
| Hispanic or Latino | 13,212 | 11.2% |
| Native / Alaskan | 166 | 0.1% |
| White / Caucasian | 91,349 | 77.7% |
| Two or more Races | 7,595 | 6.5% |
| Some other Race | 4,576 | 3.9% |
| Total | 117,515 | 100.0% |
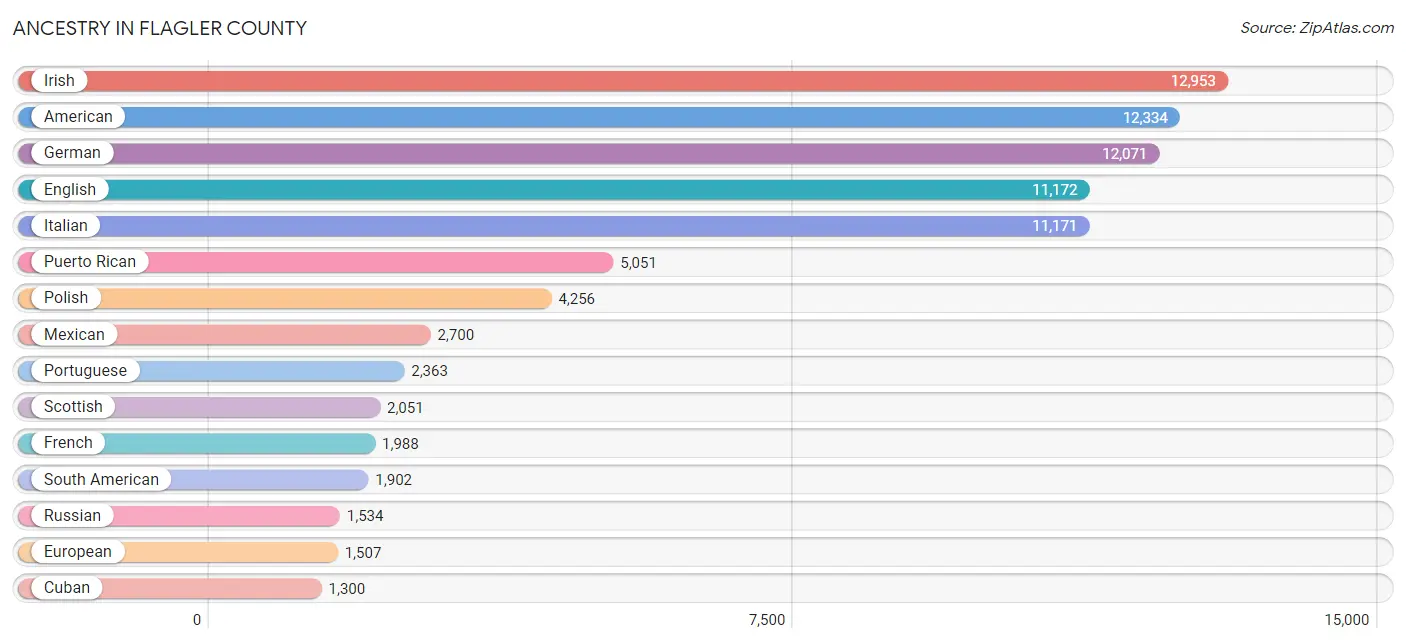
Ancestry in Flagler County
The most populous ancestries reported in Flagler County are Irish (12,953 | 11.0%), American (12,334 | 10.5%), German (12,071 | 10.3%), English (11,172 | 9.5%), and Italian (11,171 | 9.5%), together accounting for 50.8% of all Flagler County residents.
| Ancestry | # Population | % Population |
| African | 253 | 0.2% |
| Albanian | 59 | 0.1% |
| American | 12,334 | 10.5% |
| Arab | 292 | 0.3% |
| Argentinean | 178 | 0.2% |
| Armenian | 59 | 0.1% |
| Australian | 29 | 0.0% |
| Austrian | 173 | 0.2% |
| Barbadian | 8 | 0.0% |
| Belgian | 172 | 0.2% |
| Belizean | 22 | 0.0% |
| Bhutanese | 195 | 0.2% |
| Blackfeet | 122 | 0.1% |
| Bolivian | 37 | 0.0% |
| Brazilian | 367 | 0.3% |
| British | 849 | 0.7% |
| Burmese | 257 | 0.2% |
| Cajun | 22 | 0.0% |
| Cambodian | 97 | 0.1% |
| Canadian | 294 | 0.3% |
| Cape Verdean | 12 | 0.0% |
| Celtic | 33 | 0.0% |
| Central American | 849 | 0.7% |
| Cherokee | 291 | 0.3% |
| Chilean | 17 | 0.0% |
| Choctaw | 15 | 0.0% |
| Colombian | 960 | 0.8% |
| Costa Rican | 22 | 0.0% |
| Croatian | 31 | 0.0% |
| Cuban | 1,300 | 1.1% |
| Czech | 332 | 0.3% |
| Czechoslovakian | 188 | 0.2% |
| Danish | 238 | 0.2% |
| Dominican | 470 | 0.4% |
| Dutch | 1,122 | 0.9% |
| Eastern European | 176 | 0.2% |
| Ecuadorian | 162 | 0.1% |
| Egyptian | 17 | 0.0% |
| English | 11,172 | 9.5% |
| European | 1,507 | 1.3% |
| Finnish | 53 | 0.1% |
| French | 1,988 | 1.7% |
| French Canadian | 818 | 0.7% |
| German | 12,071 | 10.3% |
| Greek | 523 | 0.4% |
| Guatemalan | 164 | 0.1% |
| Guyanese | 397 | 0.3% |
| Haitian | 567 | 0.5% |
| Honduran | 196 | 0.2% |
| Hopi | 16 | 0.0% |
| Hungarian | 556 | 0.5% |
| Indian (Asian) | 783 | 0.7% |
| Iranian | 30 | 0.0% |
| Irish | 12,953 | 11.0% |
| Italian | 11,171 | 9.5% |
| Jamaican | 437 | 0.4% |
| Japanese | 40 | 0.0% |
| Jordanian | 12 | 0.0% |
| Korean | 1,050 | 0.9% |
| Laotian | 71 | 0.1% |
| Latvian | 60 | 0.1% |
| Lebanese | 58 | 0.1% |
| Lithuanian | 520 | 0.4% |
| Luxembourger | 32 | 0.0% |
| Maltese | 76 | 0.1% |
| Mexican | 2,700 | 2.3% |
| Navajo | 38 | 0.0% |
| New Zealander | 10 | 0.0% |
| Nicaraguan | 49 | 0.0% |
| Nigerian | 26 | 0.0% |
| Northern European | 218 | 0.2% |
| Norwegian | 932 | 0.8% |
| Pakistani | 228 | 0.2% |
| Panamanian | 86 | 0.1% |
| Pennsylvania German | 52 | 0.0% |
| Peruvian | 407 | 0.4% |
| Polish | 4,256 | 3.6% |
| Portuguese | 2,363 | 2.0% |
| Puerto Rican | 5,051 | 4.3% |
| Romanian | 44 | 0.0% |
| Russian | 1,534 | 1.3% |
| Salvadoran | 332 | 0.3% |
| Samoan | 73 | 0.1% |
| Scandinavian | 234 | 0.2% |
| Scotch-Irish | 836 | 0.7% |
| Scottish | 2,051 | 1.8% |
| Seminole | 9 | 0.0% |
| Slavic | 22 | 0.0% |
| Slovak | 336 | 0.3% |
| Slovene | 14 | 0.0% |
| South African | 7 | 0.0% |
| South American | 1,902 | 1.6% |
| South American Indian | 13 | 0.0% |
| Soviet Union | 39 | 0.0% |
| Spaniard | 236 | 0.2% |
| Spanish | 251 | 0.2% |
| Sri Lankan | 410 | 0.4% |
| Subsaharan African | 319 | 0.3% |
| Swedish | 846 | 0.7% |
| Swiss | 178 | 0.2% |
| Syrian | 95 | 0.1% |
| Thai | 515 | 0.4% |
| Trinidadian and Tobagonian | 165 | 0.1% |
| Turkish | 26 | 0.0% |
| Ukrainian | 743 | 0.6% |
| Uruguayan | 43 | 0.0% |
| Venezuelan | 70 | 0.1% |
| Welsh | 809 | 0.7% |
| West Indian | 138 | 0.1% |
| Yugoslavian | 121 | 0.1% | View All 110 Rows |
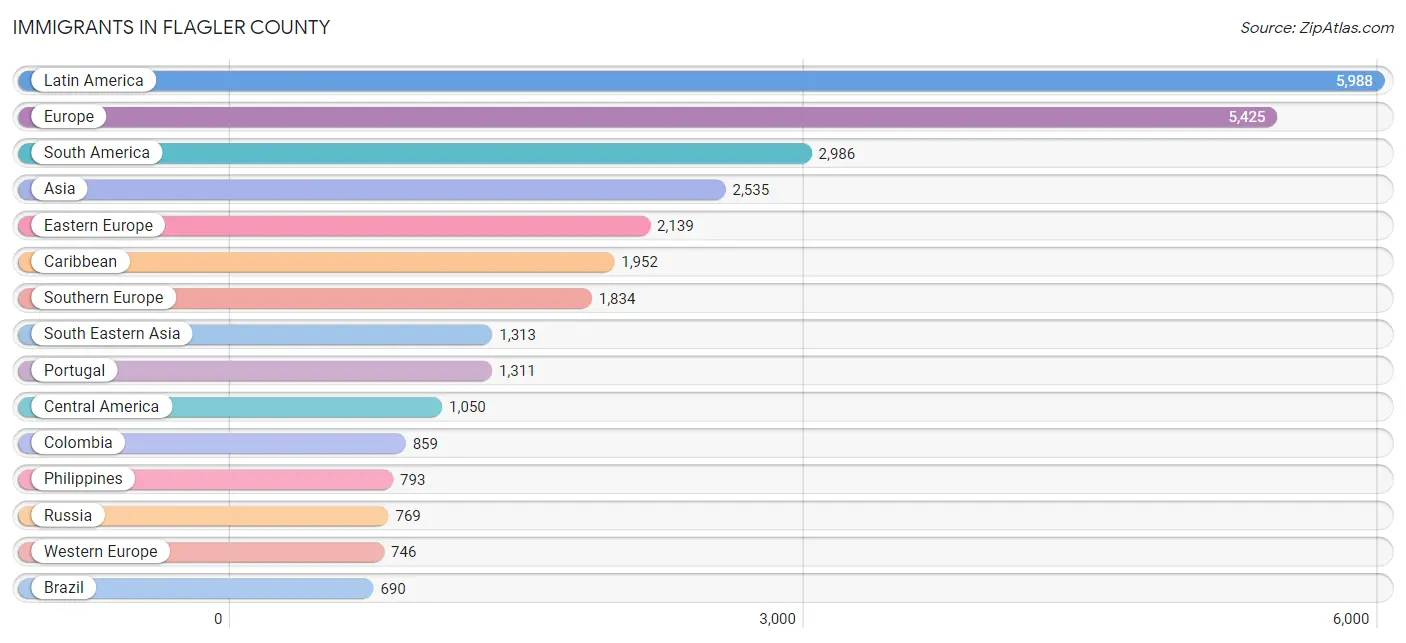
Immigrants in Flagler County
The most numerous immigrant groups reported in Flagler County came from Latin America (5,988 | 5.1%), Europe (5,425 | 4.6%), South America (2,986 | 2.5%), Asia (2,535 | 2.2%), and Eastern Europe (2,139 | 1.8%), together accounting for 16.2% of all Flagler County residents.
| Immigration Origin | # Population | % Population |
| Africa | 118 | 0.1% |
| Argentina | 102 | 0.1% |
| Armenia | 16 | 0.0% |
| Asia | 2,535 | 2.2% |
| Australia | 67 | 0.1% |
| Austria | 45 | 0.0% |
| Azores | 38 | 0.0% |
| Bangladesh | 74 | 0.1% |
| Barbados | 61 | 0.1% |
| Belarus | 71 | 0.1% |
| Belize | 12 | 0.0% |
| Brazil | 690 | 0.6% |
| Cambodia | 24 | 0.0% |
| Canada | 485 | 0.4% |
| Caribbean | 1,952 | 1.7% |
| Central America | 1,050 | 0.9% |
| China | 201 | 0.2% |
| Colombia | 859 | 0.7% |
| Costa Rica | 60 | 0.1% |
| Croatia | 16 | 0.0% |
| Cuba | 565 | 0.5% |
| Czechoslovakia | 87 | 0.1% |
| Denmark | 12 | 0.0% |
| Dominican Republic | 183 | 0.2% |
| Eastern Africa | 35 | 0.0% |
| Eastern Asia | 412 | 0.4% |
| Eastern Europe | 2,139 | 1.8% |
| Ecuador | 134 | 0.1% |
| Egypt | 17 | 0.0% |
| El Salvador | 330 | 0.3% |
| England | 174 | 0.2% |
| Europe | 5,425 | 4.6% |
| France | 33 | 0.0% |
| Germany | 666 | 0.6% |
| Greece | 45 | 0.0% |
| Guatemala | 166 | 0.1% |
| Guyana | 512 | 0.4% |
| Haiti | 466 | 0.4% |
| Honduras | 16 | 0.0% |
| Hungary | 30 | 0.0% |
| India | 107 | 0.1% |
| Indonesia | 71 | 0.1% |
| Iran | 30 | 0.0% |
| Ireland | 49 | 0.0% |
| Italy | 332 | 0.3% |
| Jamaica | 370 | 0.3% |
| Japan | 19 | 0.0% |
| Jordan | 15 | 0.0% |
| Kazakhstan | 247 | 0.2% |
| Korea | 95 | 0.1% |
| Latin America | 5,988 | 5.1% |
| Lithuania | 33 | 0.0% |
| Mexico | 347 | 0.3% |
| Middle Africa | 15 | 0.0% |
| Moldova | 24 | 0.0% |
| Nicaragua | 37 | 0.0% |
| Nigeria | 14 | 0.0% |
| Northern Africa | 28 | 0.0% |
| Northern Europe | 559 | 0.5% |
| Oceania | 67 | 0.1% |
| Pakistan | 149 | 0.1% |
| Panama | 82 | 0.1% |
| Peru | 534 | 0.4% |
| Philippines | 793 | 0.7% |
| Poland | 484 | 0.4% |
| Portugal | 1,311 | 1.1% |
| Romania | 27 | 0.0% |
| Russia | 769 | 0.6% |
| Saudi Arabia | 16 | 0.0% |
| Scotland | 53 | 0.1% |
| Sierra Leone | 19 | 0.0% |
| South Africa | 7 | 0.0% |
| South America | 2,986 | 2.5% |
| South Central Asia | 682 | 0.6% |
| South Eastern Asia | 1,313 | 1.1% |
| Southern Europe | 1,834 | 1.6% |
| Spain | 146 | 0.1% |
| Sri Lanka | 34 | 0.0% |
| Sweden | 19 | 0.0% |
| Switzerland | 2 | 0.0% |
| Syria | 49 | 0.0% |
| Thailand | 217 | 0.2% |
| Trinidad and Tobago | 268 | 0.2% |
| Turkey | 18 | 0.0% |
| Ukraine | 447 | 0.4% |
| Uruguay | 43 | 0.0% |
| Uzbekistan | 41 | 0.0% |
| Venezuela | 55 | 0.1% |
| Vietnam | 208 | 0.2% |
| Western Africa | 33 | 0.0% |
| Western Asia | 128 | 0.1% |
| Western Europe | 746 | 0.6% | View All 92 Rows |
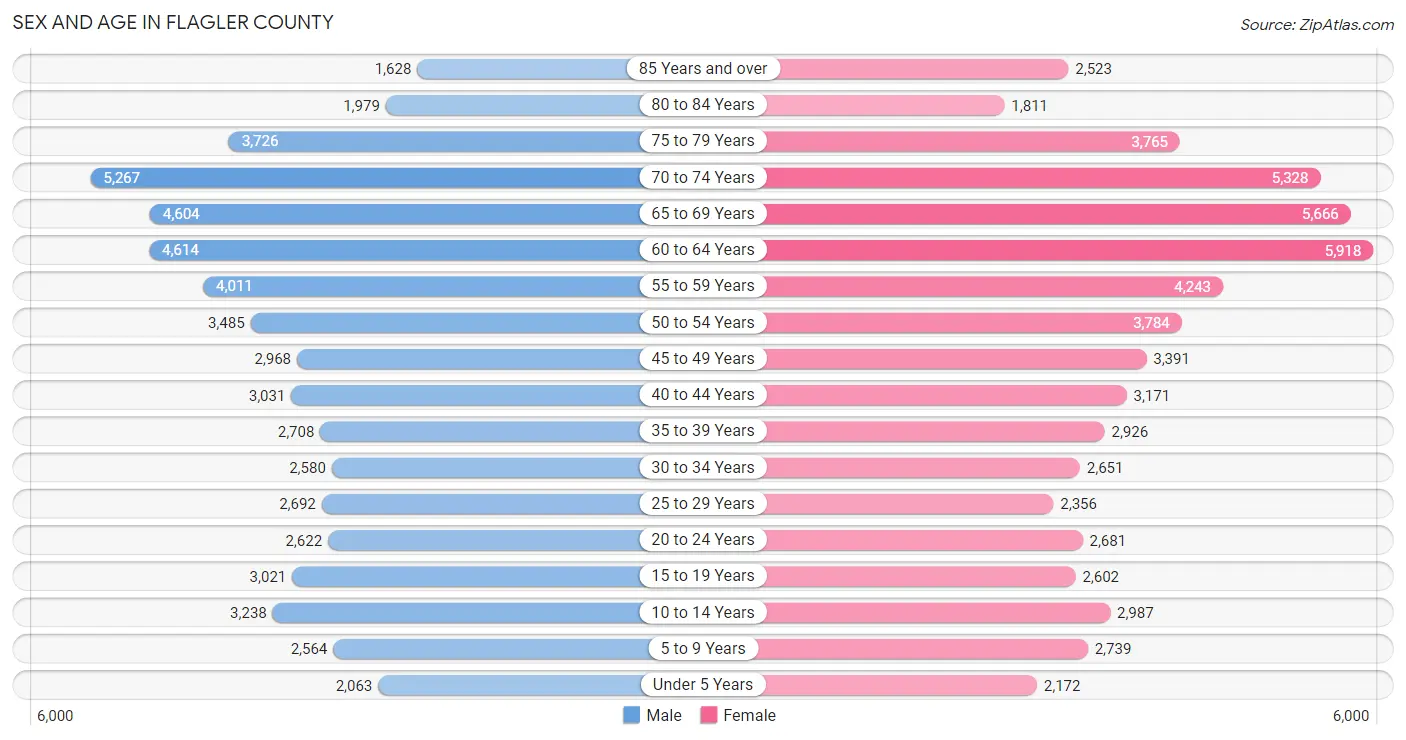
Sex and Age in Flagler County
Sex and Age in Flagler County
The most populous age groups in Flagler County are 70 to 74 Years (5,267 | 9.3%) for men and 60 to 64 Years (5,918 | 9.8%) for women.
| Age Bracket | Male | Female |
| Under 5 Years | 2,063 (3.6%) | 2,172 (3.6%) |
| 5 to 9 Years | 2,564 (4.5%) | 2,739 (4.5%) |
| 10 to 14 Years | 3,238 (5.7%) | 2,987 (4.9%) |
| 15 to 19 Years | 3,021 (5.3%) | 2,602 (4.3%) |
| 20 to 24 Years | 2,622 (4.6%) | 2,681 (4.4%) |
| 25 to 29 Years | 2,692 (4.7%) | 2,356 (3.9%) |
| 30 to 34 Years | 2,580 (4.5%) | 2,651 (4.4%) |
| 35 to 39 Years | 2,708 (4.8%) | 2,926 (4.8%) |
| 40 to 44 Years | 3,031 (5.3%) | 3,171 (5.2%) |
| 45 to 49 Years | 2,968 (5.2%) | 3,391 (5.6%) |
| 50 to 54 Years | 3,485 (6.1%) | 3,784 (6.2%) |
| 55 to 59 Years | 4,011 (7.1%) | 4,243 (7.0%) |
| 60 to 64 Years | 4,614 (8.1%) | 5,918 (9.8%) |
| 65 to 69 Years | 4,604 (8.1%) | 5,666 (9.3%) |
| 70 to 74 Years | 5,267 (9.3%) | 5,328 (8.8%) |
| 75 to 79 Years | 3,726 (6.6%) | 3,765 (6.2%) |
| 80 to 84 Years | 1,979 (3.5%) | 1,811 (3.0%) |
| 85 Years and over | 1,628 (2.9%) | 2,523 (4.2%) |
| Total | 56,801 (100.0%) | 60,714 (100.0%) |
Families and Households in Flagler County
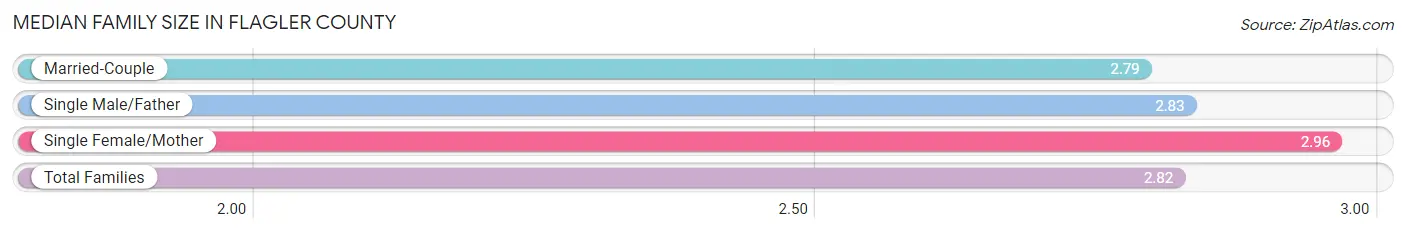
Median Family Size in Flagler County
The median family size in Flagler County is 2.82 persons per family, with single female/mother families (5,024 | 14.6%) accounting for the largest median family size of 2.96 persons per family. On the other hand, married-couple families (27,433 | 79.8%) represent the smallest median family size with 2.79 persons per family.
| Family Type | # Families | Family Size |
| Married-Couple | 27,433 (79.8%) | 2.79 |
| Single Male/Father | 1,933 (5.6%) | 2.83 |
| Single Female/Mother | 5,024 (14.6%) | 2.96 |
| Total Families | 34,390 (100.0%) | 2.82 |
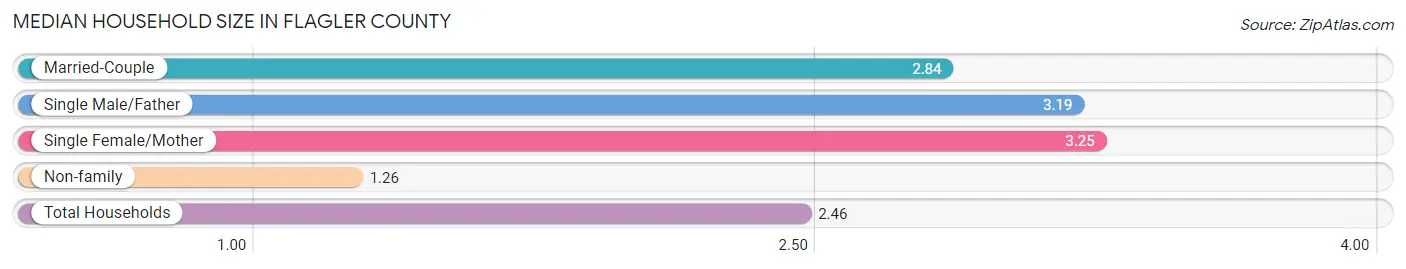
Median Household Size in Flagler County
The median household size in Flagler County is 2.46 persons per household, with single female/mother households (5,024 | 10.6%) accounting for the largest median household size of 3.25 persons per household. non-family households (13,159 | 27.7%) represent the smallest median household size with 1.26 persons per household.
| Household Type | # Households | Household Size |
| Married-Couple | 27,433 (57.7%) | 2.84 |
| Single Male/Father | 1,933 (4.1%) | 3.19 |
| Single Female/Mother | 5,024 (10.6%) | 3.25 |
| Non-family | 13,159 (27.7%) | 1.26 |
| Total Households | 47,549 (100.0%) | 2.46 |
Household Size by Marriage Status in Flagler County
Out of a total of 47,549 households in Flagler County, 34,390 (72.3%) are family households, while 13,159 (27.7%) are nonfamily households. The most numerous type of family households are 2-person households, comprising 20,084, and the most common type of nonfamily households are 1-person households, comprising 10,617.
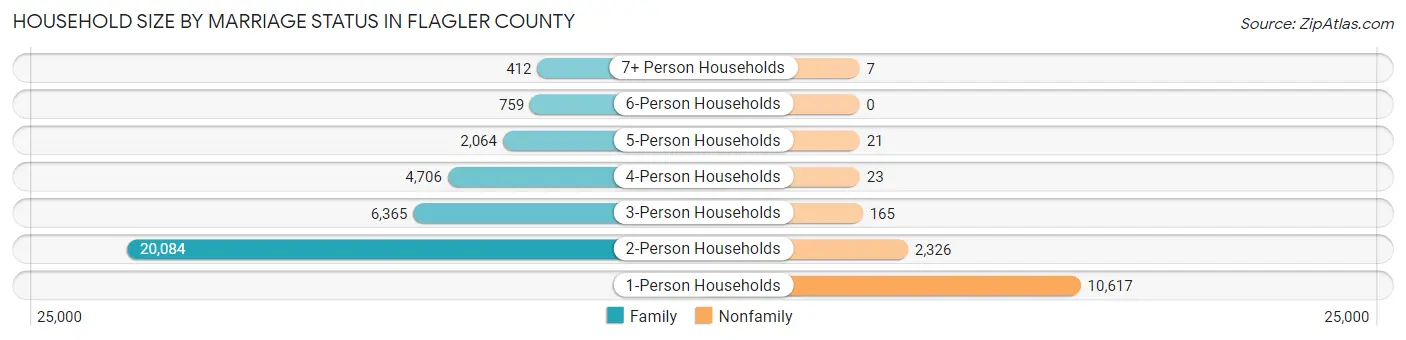
| Household Size | Family Households | Nonfamily Households |
| 1-Person Households | - | 10,617 (22.3%) |
| 2-Person Households | 20,084 (42.2%) | 2,326 (4.9%) |
| 3-Person Households | 6,365 (13.4%) | 165 (0.4%) |
| 4-Person Households | 4,706 (9.9%) | 23 (0.1%) |
| 5-Person Households | 2,064 (4.3%) | 21 (0.0%) |
| 6-Person Households | 759 (1.6%) | 0 (0.0%) |
| 7+ Person Households | 412 (0.9%) | 7 (0.0%) |
| Total | 34,390 (72.3%) | 13,159 (27.7%) |
Female Fertility in Flagler County
Fertility by Age in Flagler County
Average fertility rate in Flagler County is 25.0 births per 1,000 women. Women in the age bracket of 20 to 34 years have the highest fertility rate with 46.0 births per 1,000 women. Women in the age bracket of 20 to 34 years acount for 67.2% of all women with births.
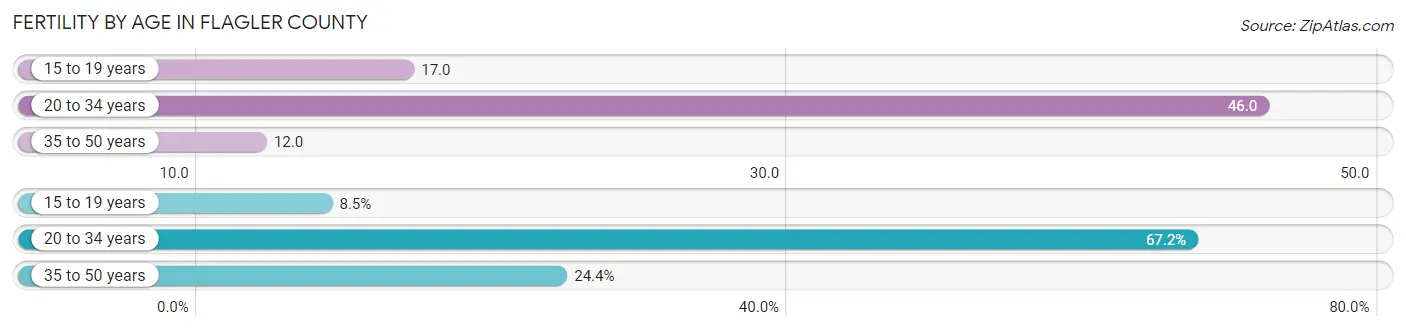
| Age Bracket | Women with Births | Births / 1,000 Women |
| 15 to 19 years | 44 (8.5%) | 17.0 |
| 20 to 34 years | 350 (67.2%) | 46.0 |
| 35 to 50 years | 127 (24.4%) | 12.0 |
| Total | 521 (100.0%) | 25.0 |
Fertility by Age by Marriage Status in Flagler County
65.3% of women with births (521) in Flagler County are married. The highest percentage of unmarried women with births falls into 15 to 19 years age bracket with 100.0% of them unmarried at the time of birth, while the lowest percentage of unmarried women with births belong to 35 to 50 years age bracket with 0.0% of them unmarried.
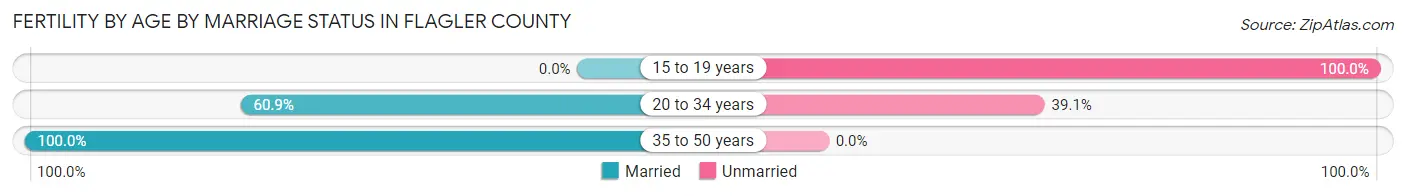
| Age Bracket | Married | Unmarried |
| 15 to 19 years | 0 (0.0%) | 44 (100.0%) |
| 20 to 34 years | 213 (60.9%) | 137 (39.1%) |
| 35 to 50 years | 127 (100.0%) | 0 (0.0%) |
| Total | 340 (65.3%) | 181 (34.7%) |
Fertility by Education in Flagler County
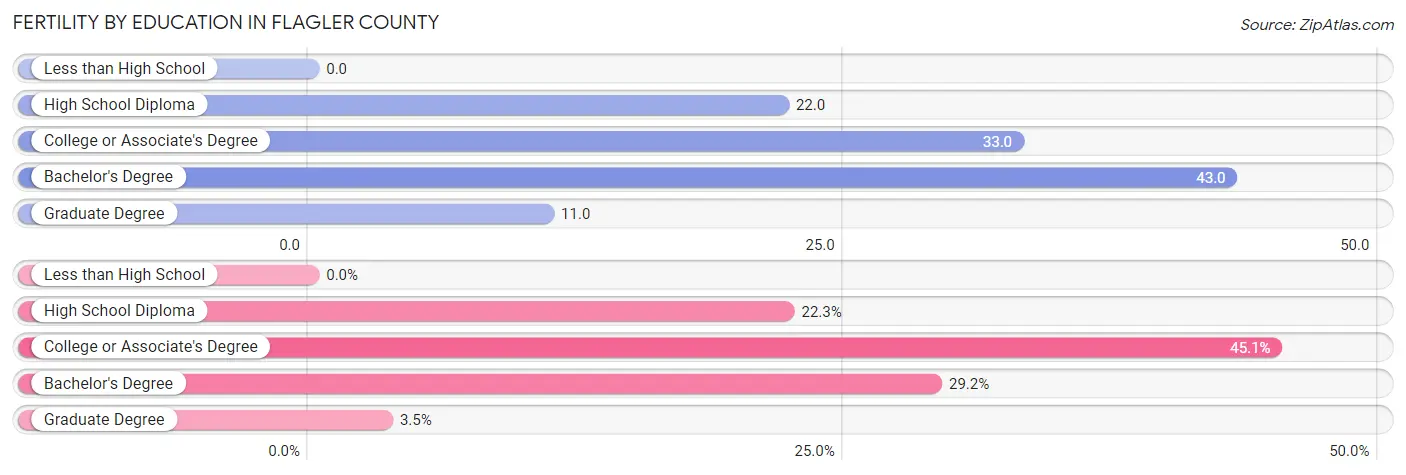
| Educational Attainment | Women with Births | Births / 1,000 Women |
| Less than High School | 0 (0.0%) | 0.0 |
| High School Diploma | 116 (22.3%) | 22.0 |
| College or Associate's Degree | 235 (45.1%) | 33.0 |
| Bachelor's Degree | 152 (29.2%) | 43.0 |
| Graduate Degree | 18 (3.5%) | 11.0 |
| Total | 521 (100.0%) | 25.0 |
Fertility by Education by Marriage Status in Flagler County
34.7% of women with births in Flagler County are unmarried. Women with the educational attainment of graduate degree are most likely to be married with 100.0% of them married at childbirth, while women with the educational attainment of high school diploma are least likely to be married with 66.4% of them unmarried at childbirth.
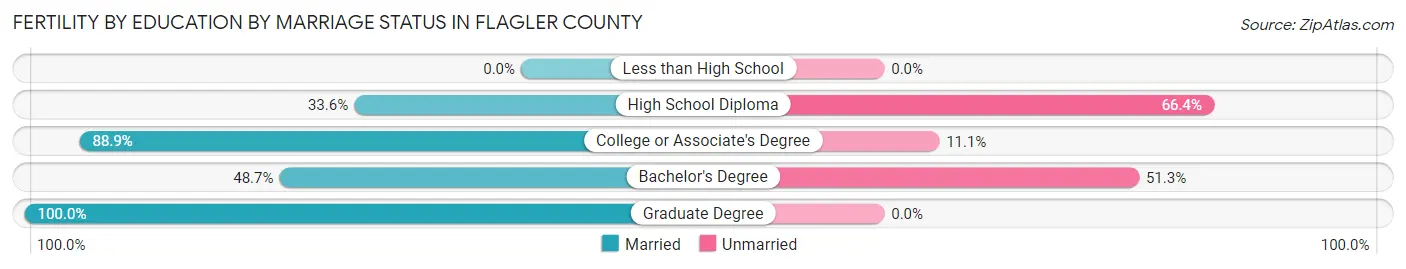
| Educational Attainment | Married | Unmarried |
| Less than High School | 0 (0.0%) | 0 (0.0%) |
| High School Diploma | 39 (33.6%) | 77 (66.4%) |
| College or Associate's Degree | 209 (88.9%) | 26 (11.1%) |
| Bachelor's Degree | 74 (48.7%) | 78 (51.3%) |
| Graduate Degree | 18 (100.0%) | 0 (0.0%) |
| Total | 340 (65.3%) | 181 (34.7%) |
Employment Characteristics in Flagler County
Employment by Class of Employer in Flagler County
Among the 47,069 employed individuals in Flagler County, private company employees (31,130 | 66.1%), local government employees (4,050 | 8.6%), and not-for-profit organizations (3,284 | 7.0%) make up the most common classes of employment.
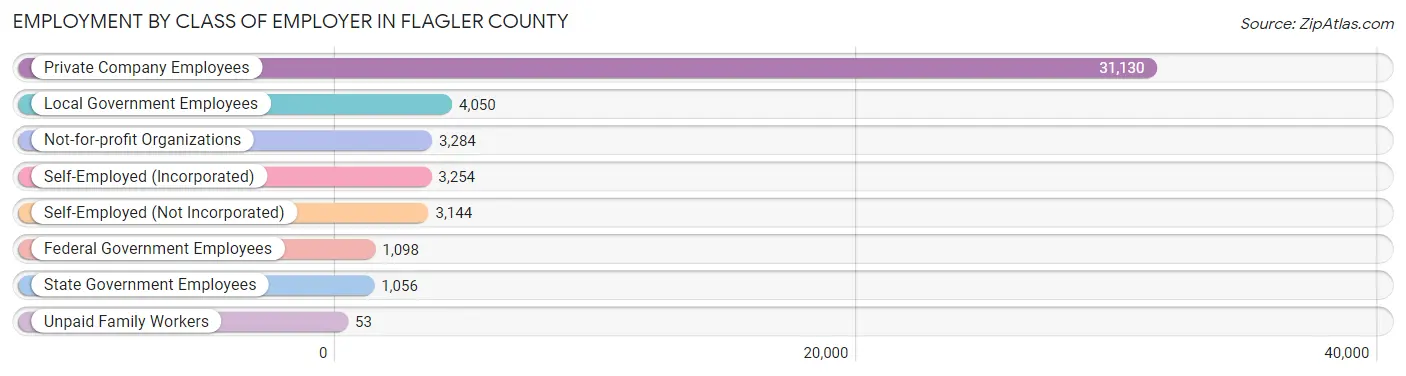
| Employer Class | # Employees | % Employees |
| Private Company Employees | 31,130 | 66.1% |
| Self-Employed (Incorporated) | 3,254 | 6.9% |
| Self-Employed (Not Incorporated) | 3,144 | 6.7% |
| Not-for-profit Organizations | 3,284 | 7.0% |
| Local Government Employees | 4,050 | 8.6% |
| State Government Employees | 1,056 | 2.2% |
| Federal Government Employees | 1,098 | 2.3% |
| Unpaid Family Workers | 53 | 0.1% |
| Total | 47,069 | 100.0% |
Employment Status by Age in Flagler County
According to the labor force statistics for Flagler County, out of the total population over 16 years of age (100,395), 50.0% or 50,198 individuals are in the labor force, with 3.8% or 1,908 of them unemployed. The age group with the highest labor force participation rate is 30 to 34 years, with 88.9% or 4,650 individuals in the labor force. Within the labor force, the 25 to 29 years age range has the highest percentage of unemployed individuals, with 8.7% or 330 of them being unemployed.
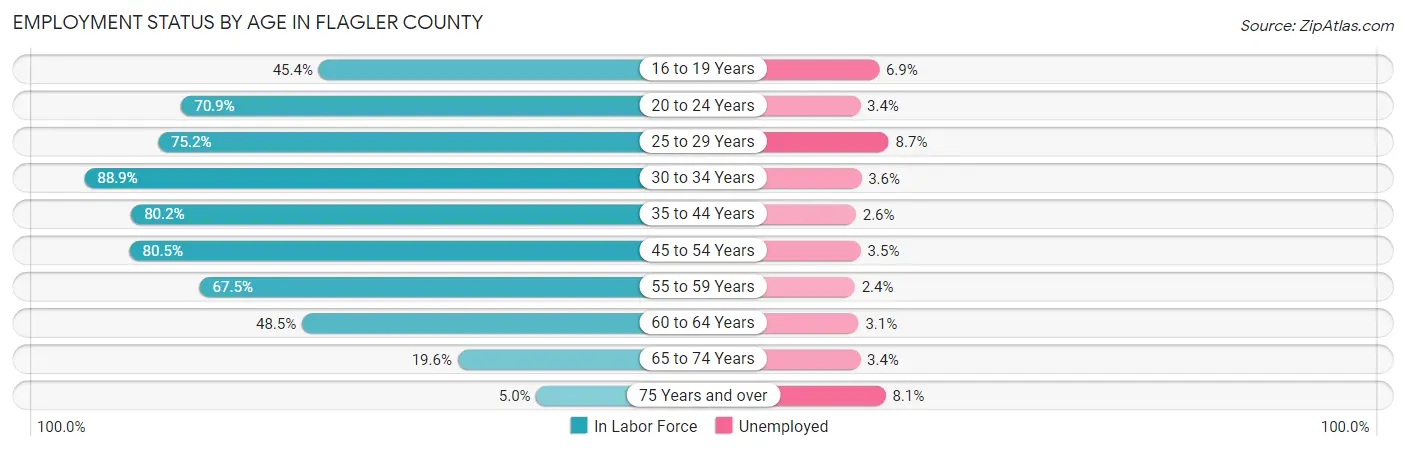
| Age Bracket | In Labor Force | Unemployed |
| 16 to 19 Years | 1,937 (45.4%) | 134 (6.9%) |
| 20 to 24 Years | 3,760 (70.9%) | 128 (3.4%) |
| 25 to 29 Years | 3,796 (75.2%) | 330 (8.7%) |
| 30 to 34 Years | 4,650 (88.9%) | 167 (3.6%) |
| 35 to 44 Years | 9,492 (80.2%) | 247 (2.6%) |
| 45 to 54 Years | 10,971 (80.5%) | 384 (3.5%) |
| 55 to 59 Years | 5,571 (67.5%) | 134 (2.4%) |
| 60 to 64 Years | 5,108 (48.5%) | 158 (3.1%) |
| 65 to 74 Years | 4,090 (19.6%) | 139 (3.4%) |
| 75 Years and over | 772 (5.0%) | 63 (8.1%) |
| Total | 50,198 (50.0%) | 1,908 (3.8%) |
Employment Status by Educational Attainment in Flagler County
According to labor force statistics for Flagler County, 72.6% of individuals (39,588) out of the total population between 25 and 64 years of age (54,529) are in the labor force, with 3.6% or 1,425 of them being unemployed. The group with the highest labor force participation rate are those with the educational attainment of bachelor's degree or higher, with 74.9% or 11,718 individuals in the labor force. Within the labor force, individuals with college / associate degree education have the highest percentage of unemployment, with 4.6% or 634 of them being unemployed.
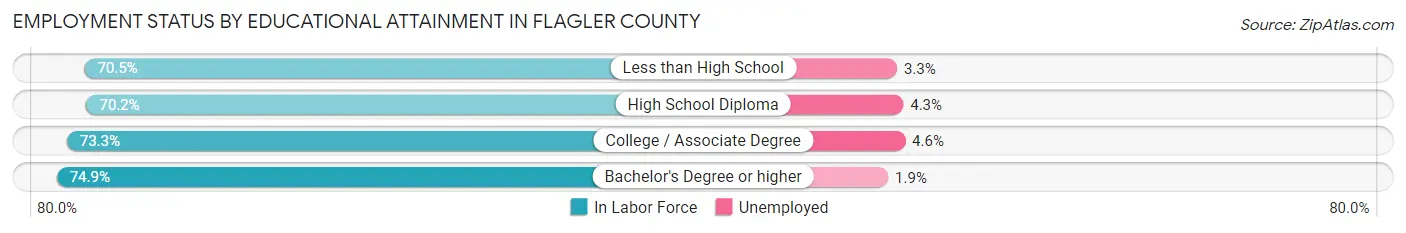
| Educational Attainment | In Labor Force | Unemployed |
| Less than High School | 2,226 (70.5%) | 104 (3.3%) |
| High School Diploma | 11,870 (70.2%) | 727 (4.3%) |
| College / Associate Degree | 13,793 (73.3%) | 866 (4.6%) |
| Bachelor's Degree or higher | 11,718 (74.9%) | 297 (1.9%) |
| Total | 39,588 (72.6%) | 1,963 (3.6%) |
Employment Occupations by Sex in Flagler County
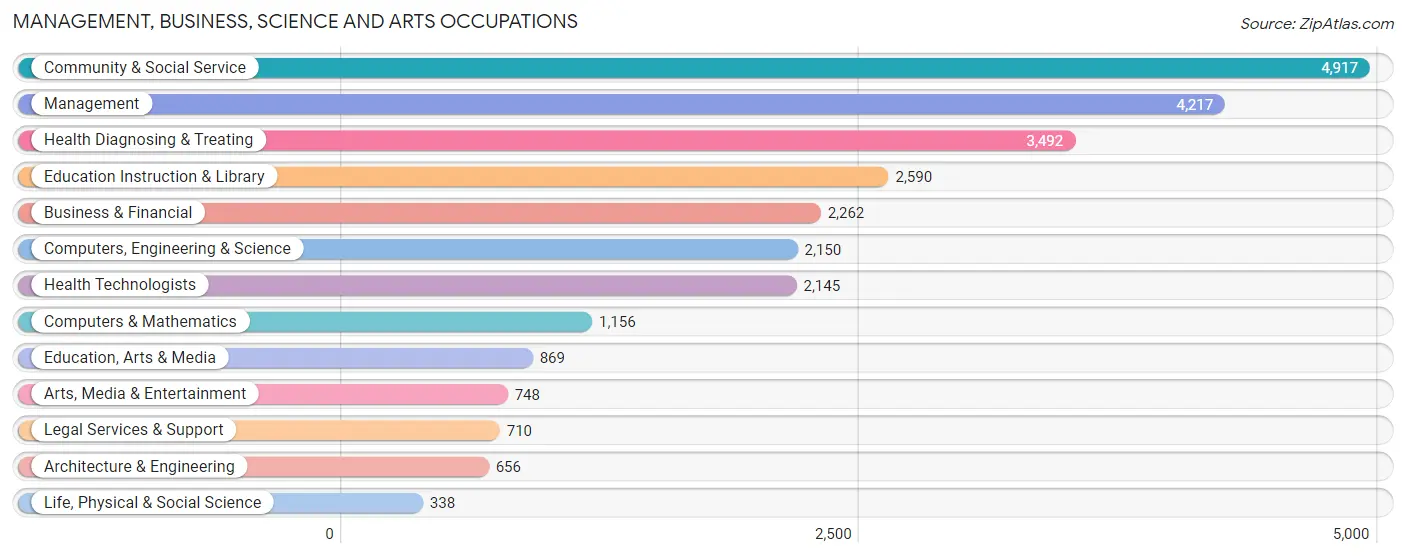
Management, Business, Science and Arts Occupations
The most common Management, Business, Science and Arts occupations in Flagler County are Community & Social Service (4,917 | 10.2%), Management (4,217 | 8.8%), Health Diagnosing & Treating (3,492 | 7.2%), Education Instruction & Library (2,590 | 5.4%), and Business & Financial (2,262 | 4.7%).
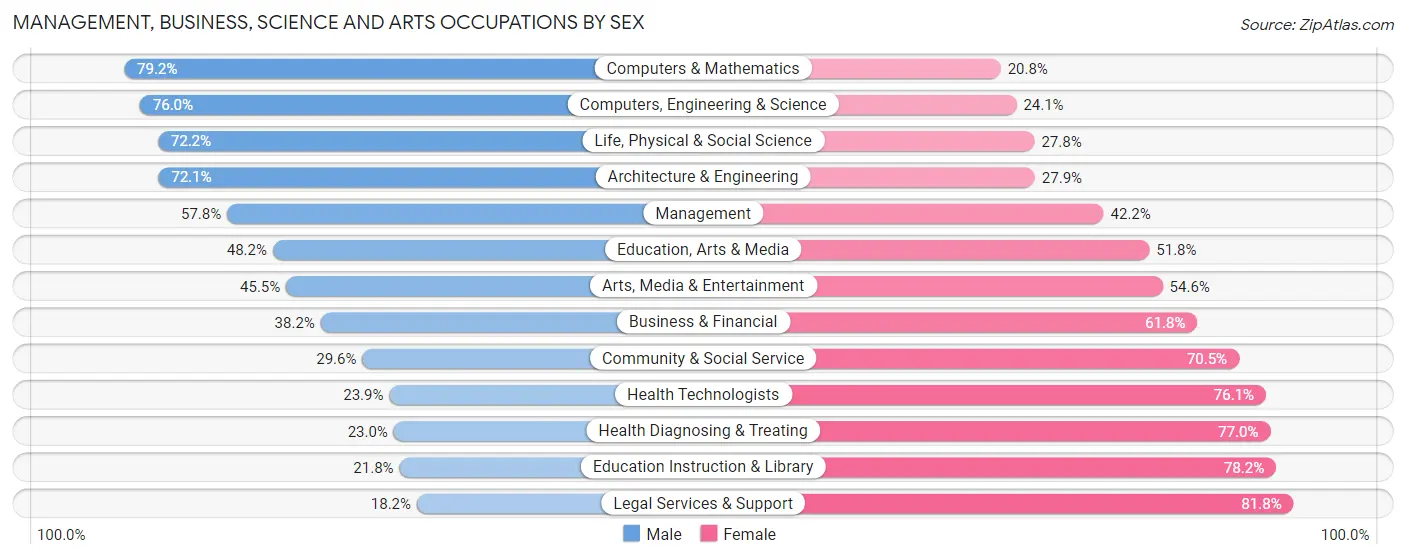
Management, Business, Science and Arts Occupations by Sex
Within the Management, Business, Science and Arts occupations in Flagler County, the most male-oriented occupations are Computers & Mathematics (79.2%), Computers, Engineering & Science (75.9%), and Life, Physical & Social Science (72.2%), while the most female-oriented occupations are Legal Services & Support (81.8%), Education Instruction & Library (78.2%), and Health Diagnosing & Treating (77.0%).
| Occupation | Male | Female |
| Management | 2,436 (57.8%) | 1,781 (42.2%) |
| Business & Financial | 865 (38.2%) | 1,397 (61.8%) |
| Computers, Engineering & Science | 1,633 (75.9%) | 517 (24.0%) |
| Computers & Mathematics | 916 (79.2%) | 240 (20.8%) |
| Architecture & Engineering | 473 (72.1%) | 183 (27.9%) |
| Life, Physical & Social Science | 244 (72.2%) | 94 (27.8%) |
| Community & Social Service | 1,453 (29.5%) | 3,464 (70.5%) |
| Education, Arts & Media | 419 (48.2%) | 450 (51.8%) |
| Legal Services & Support | 129 (18.2%) | 581 (81.8%) |
| Education Instruction & Library | 565 (21.8%) | 2,025 (78.2%) |
| Arts, Media & Entertainment | 340 (45.5%) | 408 (54.5%) |
| Health Diagnosing & Treating | 803 (23.0%) | 2,689 (77.0%) |
| Health Technologists | 513 (23.9%) | 1,632 (76.1%) |
| Total (Category) | 7,190 (42.2%) | 9,848 (57.8%) |
| Total (Overall) | 24,637 (51.2%) | 23,514 (48.8%) |
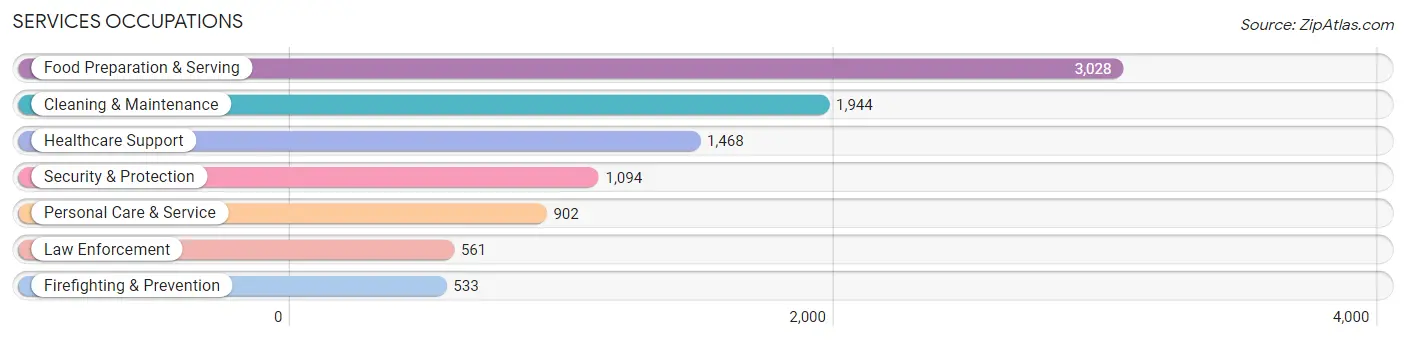
Services Occupations
The most common Services occupations in Flagler County are Food Preparation & Serving (3,028 | 6.3%), Cleaning & Maintenance (1,944 | 4.0%), Healthcare Support (1,468 | 3.0%), Security & Protection (1,094 | 2.3%), and Personal Care & Service (902 | 1.9%).
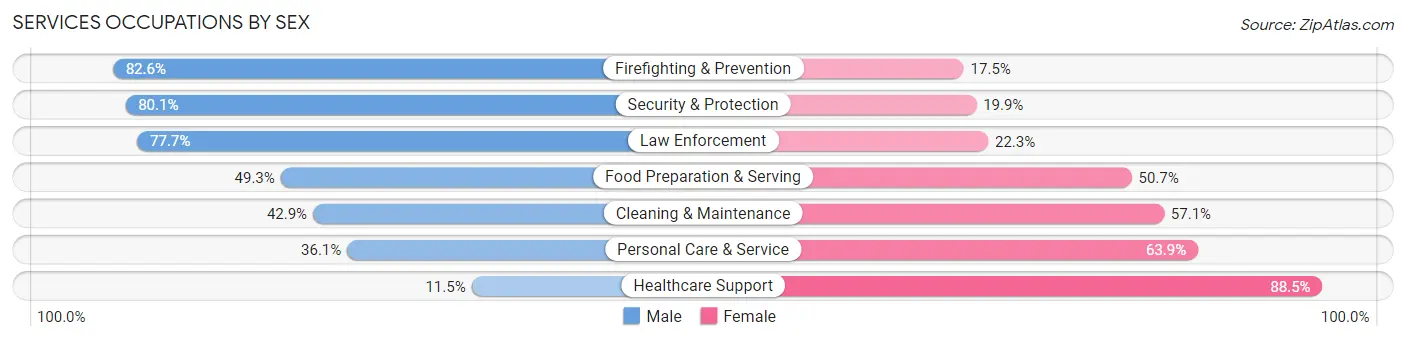
Services Occupations by Sex
Within the Services occupations in Flagler County, the most male-oriented occupations are Firefighting & Prevention (82.6%), Security & Protection (80.1%), and Law Enforcement (77.7%), while the most female-oriented occupations are Healthcare Support (88.5%), Personal Care & Service (63.9%), and Cleaning & Maintenance (57.1%).
| Occupation | Male | Female |
| Healthcare Support | 169 (11.5%) | 1,299 (88.5%) |
| Security & Protection | 876 (80.1%) | 218 (19.9%) |
| Firefighting & Prevention | 440 (82.6%) | 93 (17.4%) |
| Law Enforcement | 436 (77.7%) | 125 (22.3%) |
| Food Preparation & Serving | 1,493 (49.3%) | 1,535 (50.7%) |
| Cleaning & Maintenance | 834 (42.9%) | 1,110 (57.1%) |
| Personal Care & Service | 326 (36.1%) | 576 (63.9%) |
| Total (Category) | 3,698 (43.8%) | 4,738 (56.2%) |
| Total (Overall) | 24,637 (51.2%) | 23,514 (48.8%) |
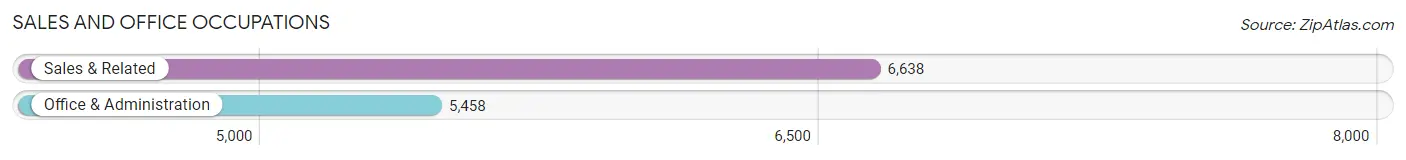
Sales and Office Occupations
The most common Sales and Office occupations in Flagler County are Sales & Related (6,638 | 13.8%), and Office & Administration (5,458 | 11.3%).
Sales and Office Occupations by Sex
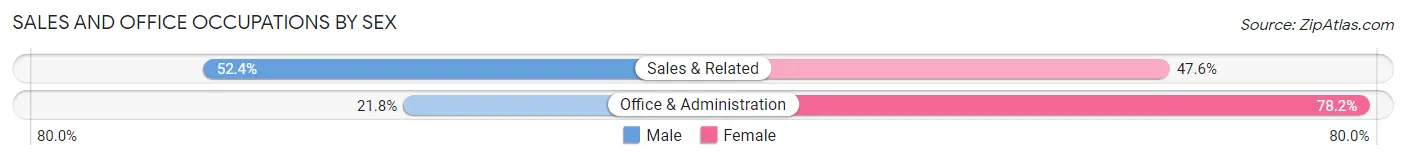
| Occupation | Male | Female |
| Sales & Related | 3,480 (52.4%) | 3,158 (47.6%) |
| Office & Administration | 1,189 (21.8%) | 4,269 (78.2%) |
| Total (Category) | 4,669 (38.6%) | 7,427 (61.4%) |
| Total (Overall) | 24,637 (51.2%) | 23,514 (48.8%) |
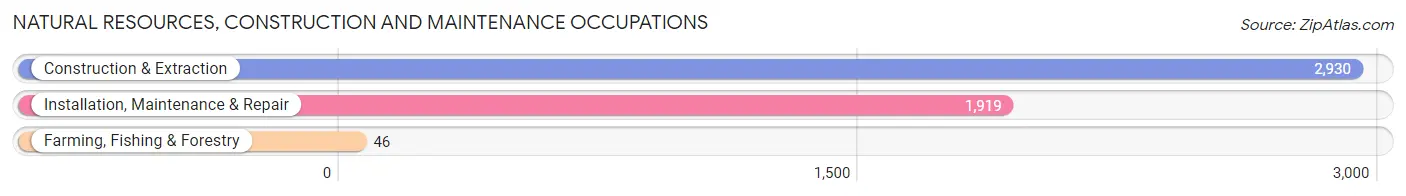
Natural Resources, Construction and Maintenance Occupations
The most common Natural Resources, Construction and Maintenance occupations in Flagler County are Construction & Extraction (2,930 | 6.1%), Installation, Maintenance & Repair (1,919 | 4.0%), and Farming, Fishing & Forestry (46 | 0.1%).
Natural Resources, Construction and Maintenance Occupations by Sex
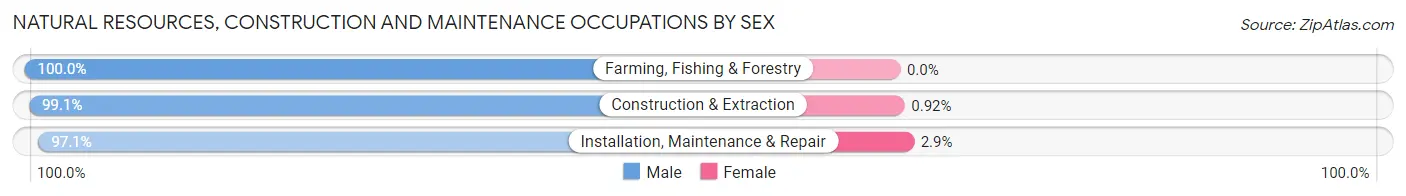
| Occupation | Male | Female |
| Farming, Fishing & Forestry | 46 (100.0%) | 0 (0.0%) |
| Construction & Extraction | 2,903 (99.1%) | 27 (0.9%) |
| Installation, Maintenance & Repair | 1,864 (97.1%) | 55 (2.9%) |
| Total (Category) | 4,813 (98.3%) | 82 (1.7%) |
| Total (Overall) | 24,637 (51.2%) | 23,514 (48.8%) |
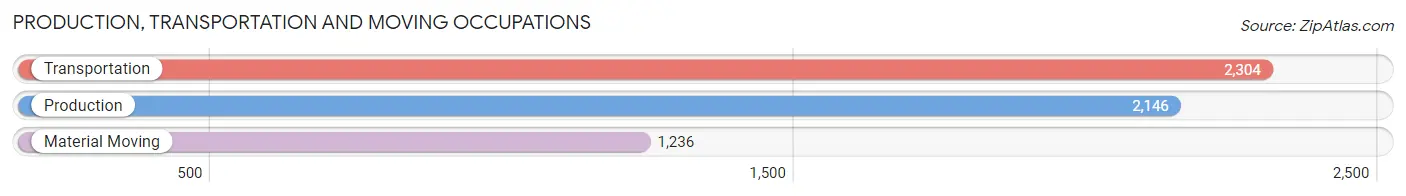
Production, Transportation and Moving Occupations
The most common Production, Transportation and Moving occupations in Flagler County are Transportation (2,304 | 4.8%), Production (2,146 | 4.5%), and Material Moving (1,236 | 2.6%).
Production, Transportation and Moving Occupations by Sex
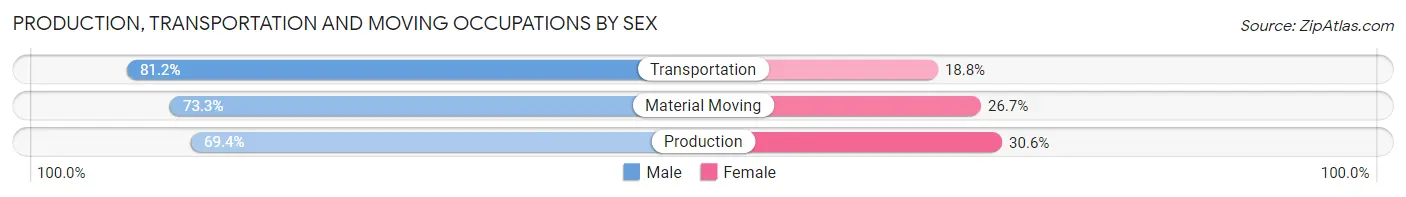
| Occupation | Male | Female |
| Production | 1,490 (69.4%) | 656 (30.6%) |
| Transportation | 1,871 (81.2%) | 433 (18.8%) |
| Material Moving | 906 (73.3%) | 330 (26.7%) |
| Total (Category) | 4,267 (75.0%) | 1,419 (25.0%) |
| Total (Overall) | 24,637 (51.2%) | 23,514 (48.8%) |
Employment Industries by Sex in Flagler County
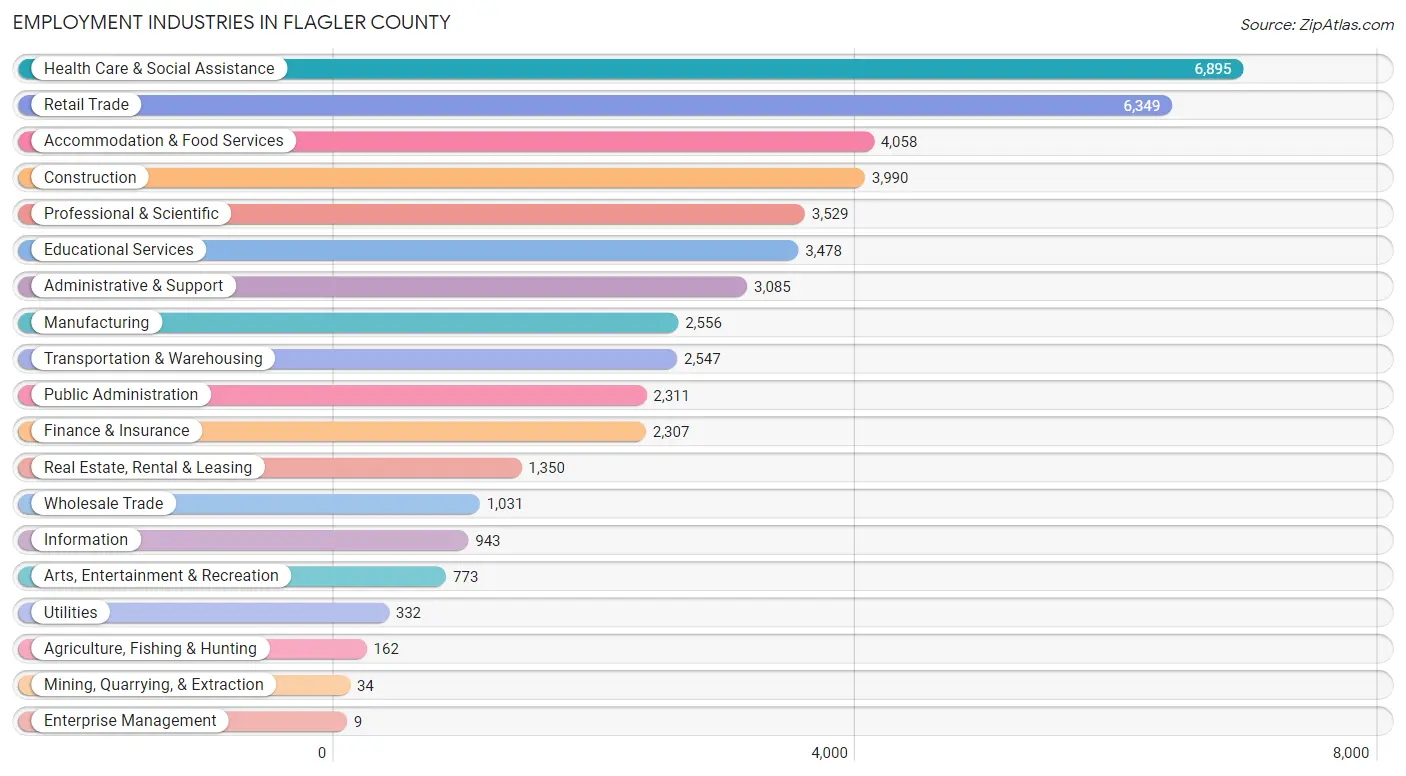
Employment Industries in Flagler County
The major employment industries in Flagler County include Health Care & Social Assistance (6,895 | 14.3%), Retail Trade (6,349 | 13.2%), Accommodation & Food Services (4,058 | 8.4%), Construction (3,990 | 8.3%), and Professional & Scientific (3,529 | 7.3%).
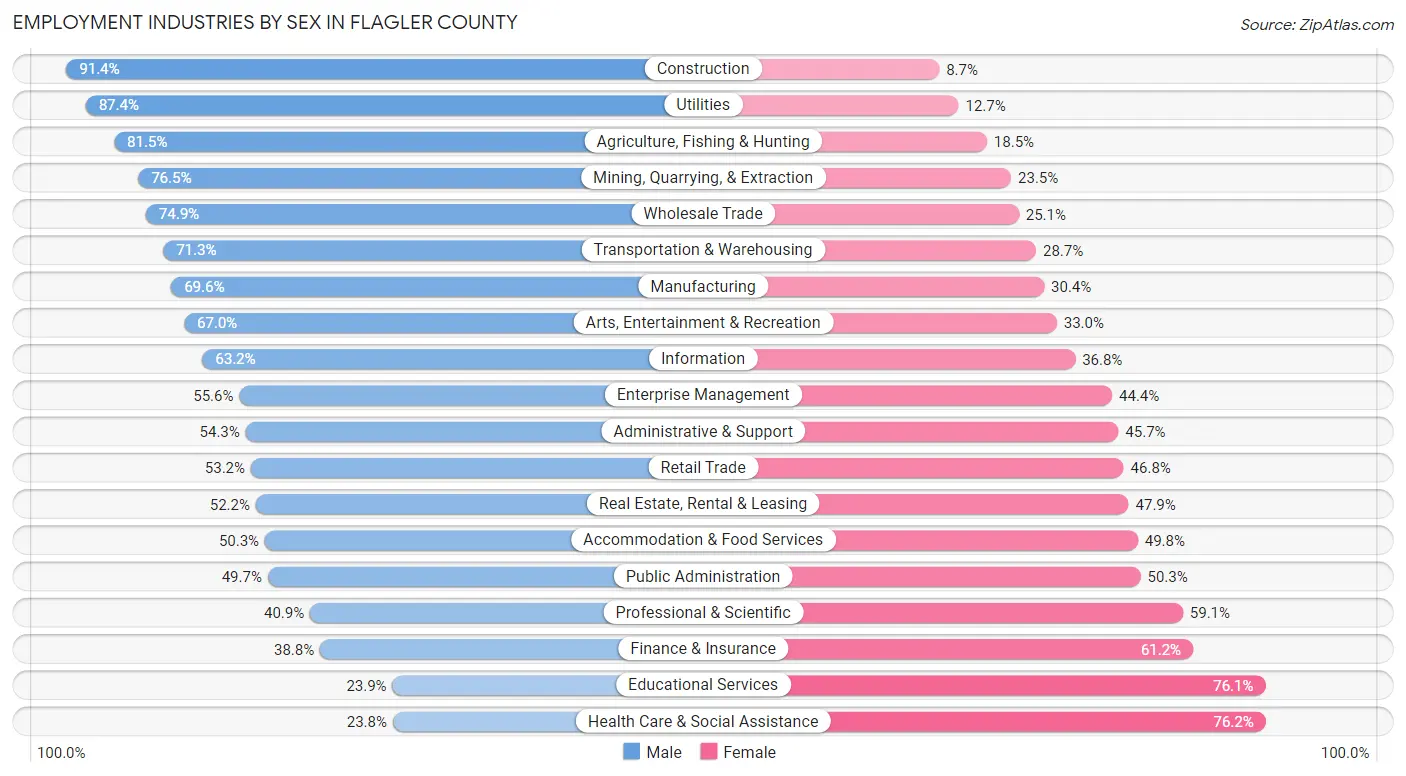
Employment Industries by Sex in Flagler County
The Flagler County industries that see more men than women are Construction (91.3%), Utilities (87.4%), and Agriculture, Fishing & Hunting (81.5%), whereas the industries that tend to have a higher number of women are Health Care & Social Assistance (76.2%), Educational Services (76.1%), and Finance & Insurance (61.2%).
| Industry | Male | Female |
| Agriculture, Fishing & Hunting | 132 (81.5%) | 30 (18.5%) |
| Mining, Quarrying, & Extraction | 26 (76.5%) | 8 (23.5%) |
| Construction | 3,645 (91.3%) | 345 (8.6%) |
| Manufacturing | 1,780 (69.6%) | 776 (30.4%) |
| Wholesale Trade | 772 (74.9%) | 259 (25.1%) |
| Retail Trade | 3,376 (53.2%) | 2,973 (46.8%) |
| Transportation & Warehousing | 1,816 (71.3%) | 731 (28.7%) |
| Utilities | 290 (87.4%) | 42 (12.7%) |
| Information | 596 (63.2%) | 347 (36.8%) |
| Finance & Insurance | 896 (38.8%) | 1,411 (61.2%) |
| Real Estate, Rental & Leasing | 704 (52.1%) | 646 (47.8%) |
| Professional & Scientific | 1,444 (40.9%) | 2,085 (59.1%) |
| Enterprise Management | 5 (55.6%) | 4 (44.4%) |
| Administrative & Support | 1,674 (54.3%) | 1,411 (45.7%) |
| Educational Services | 830 (23.9%) | 2,648 (76.1%) |
| Health Care & Social Assistance | 1,640 (23.8%) | 5,255 (76.2%) |
| Arts, Entertainment & Recreation | 518 (67.0%) | 255 (33.0%) |
| Accommodation & Food Services | 2,039 (50.2%) | 2,019 (49.7%) |
| Public Administration | 1,148 (49.7%) | 1,163 (50.3%) |
| Total | 24,637 (51.2%) | 23,514 (48.8%) |
Education in Flagler County
School Enrollment in Flagler County
The most common levels of schooling among the 21,975 students in Flagler County are middle school (5,039 | 22.9%), high school (4,793 | 21.8%), and elementary school (4,777 | 21.7%).
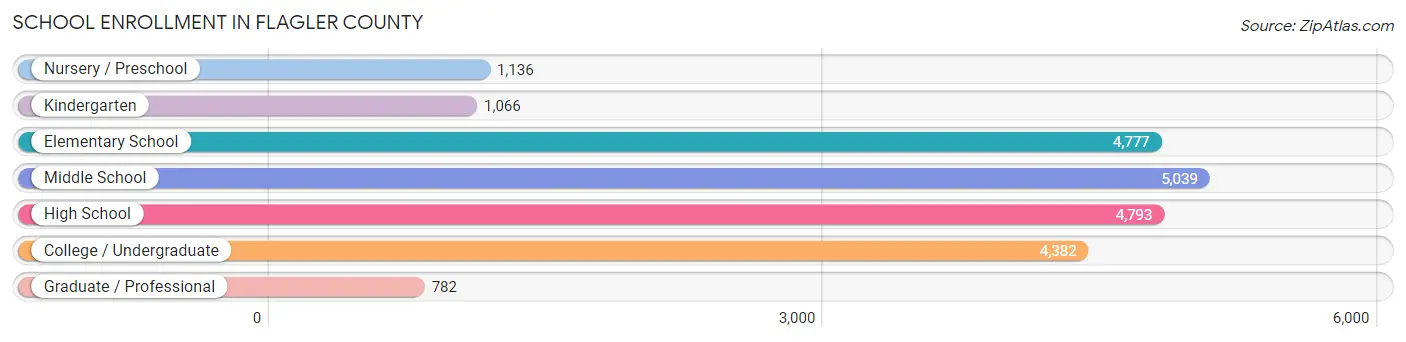
| School Level | # Students | % Students |
| Nursery / Preschool | 1,136 | 5.2% |
| Kindergarten | 1,066 | 4.9% |
| Elementary School | 4,777 | 21.7% |
| Middle School | 5,039 | 22.9% |
| High School | 4,793 | 21.8% |
| College / Undergraduate | 4,382 | 19.9% |
| Graduate / Professional | 782 | 3.6% |
| Total | 21,975 | 100.0% |
School Enrollment by Age by Funding Source in Flagler County
Out of a total of 21,975 students who are enrolled in schools in Flagler County, 3,494 (15.9%) attend a private institution, while the remaining 18,481 (84.1%) are enrolled in public schools. The age group of 35 years and over has the highest likelihood of being enrolled in private schools, with 575 (33.0% in the age bracket) enrolled. Conversely, the age group of 15 to 17 year olds has the lowest likelihood of being enrolled in a private school, with 3,258 (92.5% in the age bracket) attending a public institution.
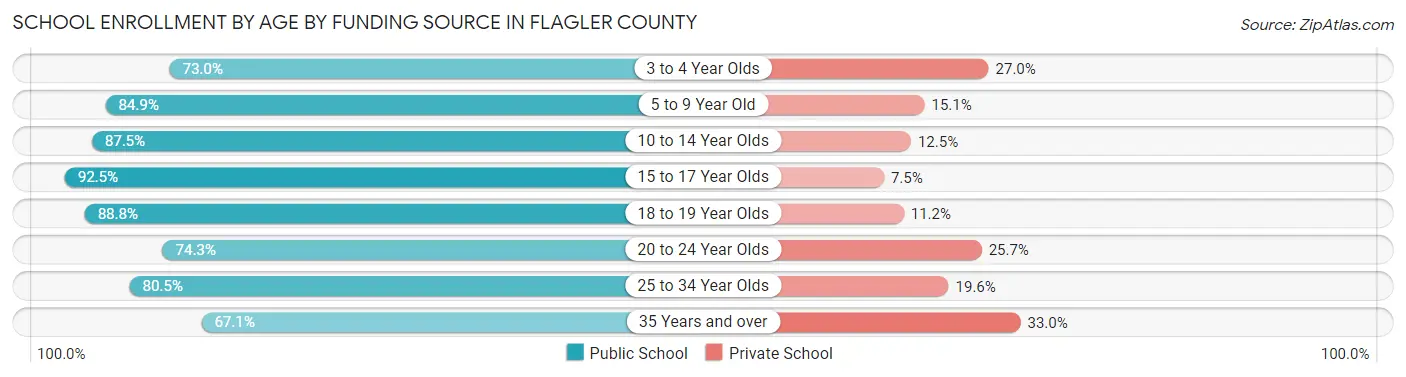
| Age Bracket | Public School | Private School |
| 3 to 4 Year Olds | 695 (73.0%) | 257 (27.0%) |
| 5 to 9 Year Old | 4,424 (84.9%) | 785 (15.1%) |
| 10 to 14 Year Olds | 5,405 (87.5%) | 775 (12.5%) |
| 15 to 17 Year Olds | 3,258 (92.5%) | 264 (7.5%) |
| 18 to 19 Year Olds | 1,404 (88.8%) | 177 (11.2%) |
| 20 to 24 Year Olds | 1,306 (74.3%) | 452 (25.7%) |
| 25 to 34 Year Olds | 827 (80.4%) | 201 (19.6%) |
| 35 Years and over | 1,170 (67.0%) | 575 (33.0%) |
| Total | 18,481 (84.1%) | 3,494 (15.9%) |
Educational Attainment by Field of Study in Flagler County
Business (5,924 | 21.2%), education (4,187 | 15.0%), science & technology (3,316 | 11.9%), engineering (2,339 | 8.4%), and arts & humanities (1,880 | 6.7%) are the most common fields of study among 27,925 individuals in Flagler County who have obtained a bachelor's degree or higher.
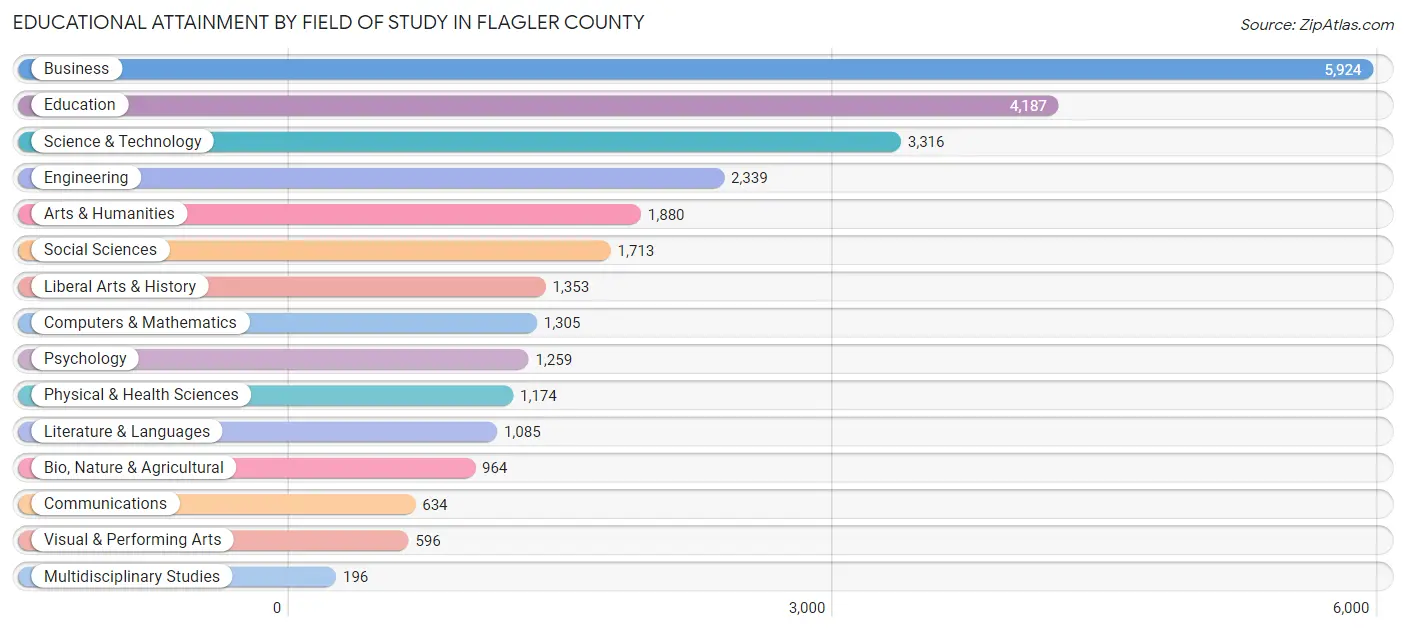
| Field of Study | # Graduates | % Graduates |
| Computers & Mathematics | 1,305 | 4.7% |
| Bio, Nature & Agricultural | 964 | 3.5% |
| Physical & Health Sciences | 1,174 | 4.2% |
| Psychology | 1,259 | 4.5% |
| Social Sciences | 1,713 | 6.1% |
| Engineering | 2,339 | 8.4% |
| Multidisciplinary Studies | 196 | 0.7% |
| Science & Technology | 3,316 | 11.9% |
| Business | 5,924 | 21.2% |
| Education | 4,187 | 15.0% |
| Literature & Languages | 1,085 | 3.9% |
| Liberal Arts & History | 1,353 | 4.9% |
| Visual & Performing Arts | 596 | 2.1% |
| Communications | 634 | 2.3% |
| Arts & Humanities | 1,880 | 6.7% |
| Total | 27,925 | 100.0% |
Transportation & Commute in Flagler County
Vehicle Availability by Sex in Flagler County
The most prevalent vehicle ownership categories in Flagler County are males with 2 vehicles (11,502, accounting for 47.8%) and females with 2 vehicles (11,150, making up 50.1%).
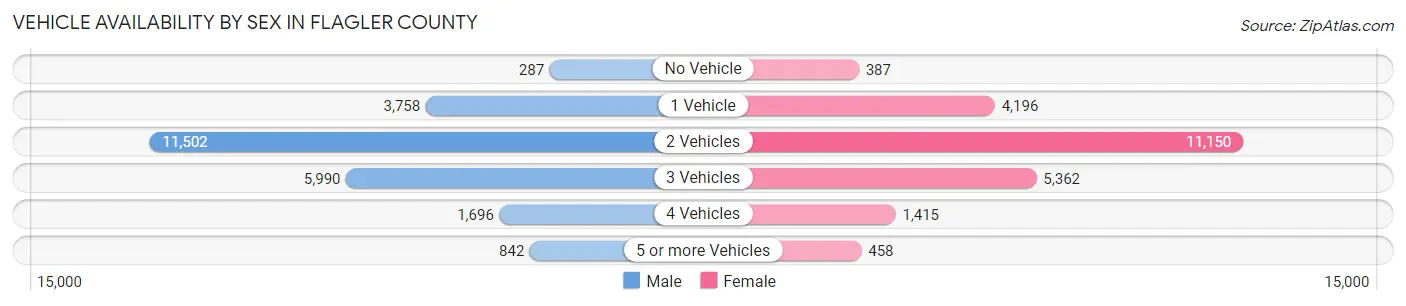
| Vehicles Available | Male | Female |
| No Vehicle | 287 (1.2%) | 387 (1.7%) |
| 1 Vehicle | 3,758 (15.6%) | 4,196 (18.3%) |
| 2 Vehicles | 11,502 (47.8%) | 11,150 (48.5%) |
| 3 Vehicles | 5,990 (24.9%) | 5,362 (23.4%) |
| 4 Vehicles | 1,696 (7.0%) | 1,415 (6.2%) |
| 5 or more Vehicles | 842 (3.5%) | 458 (2.0%) |
| Total | 24,075 (100.0%) | 22,968 (100.0%) |
Commute Time in Flagler County
The most frequently occuring commute durations in Flagler County are 10 to 14 minutes (7,000 commuters, 17.3%), 15 to 19 minutes (6,656 commuters, 16.5%), and 30 to 34 minutes (6,308 commuters, 15.6%).
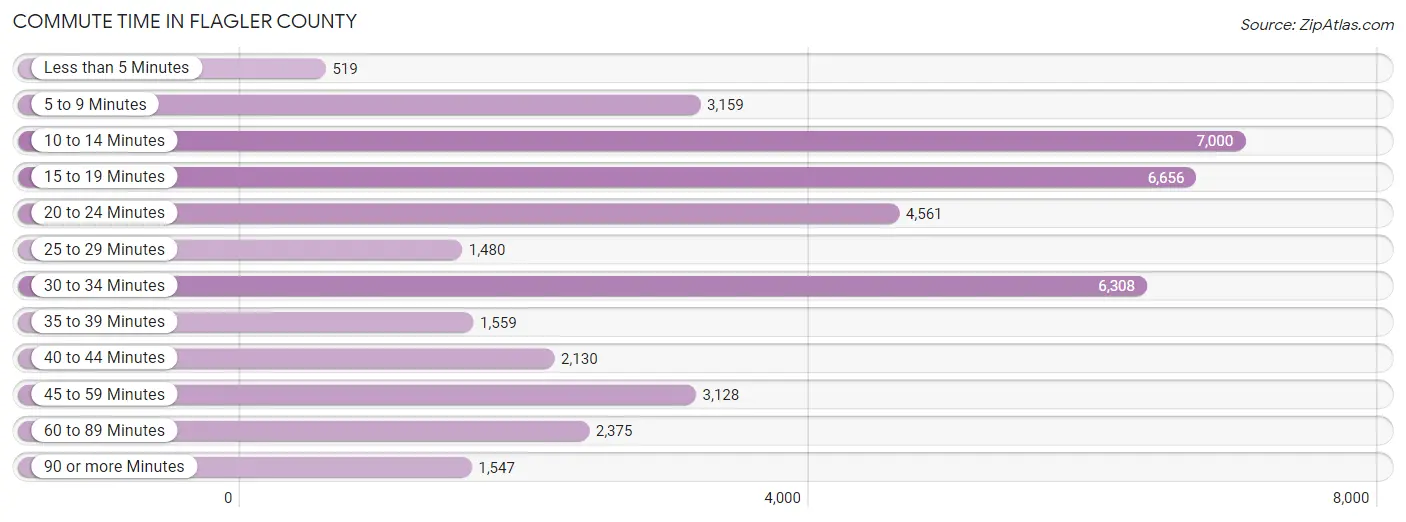
| Commute Time | # Commuters | % Commuters |
| Less than 5 Minutes | 519 | 1.3% |
| 5 to 9 Minutes | 3,159 | 7.8% |
| 10 to 14 Minutes | 7,000 | 17.3% |
| 15 to 19 Minutes | 6,656 | 16.5% |
| 20 to 24 Minutes | 4,561 | 11.3% |
| 25 to 29 Minutes | 1,480 | 3.7% |
| 30 to 34 Minutes | 6,308 | 15.6% |
| 35 to 39 Minutes | 1,559 | 3.9% |
| 40 to 44 Minutes | 2,130 | 5.3% |
| 45 to 59 Minutes | 3,128 | 7.7% |
| 60 to 89 Minutes | 2,375 | 5.9% |
| 90 or more Minutes | 1,547 | 3.8% |
Commute Time by Sex in Flagler County
The most common commute times in Flagler County are 30 to 34 minutes (3,540 commuters, 16.9%) for males and 10 to 14 minutes (3,862 commuters, 19.8%) for females.
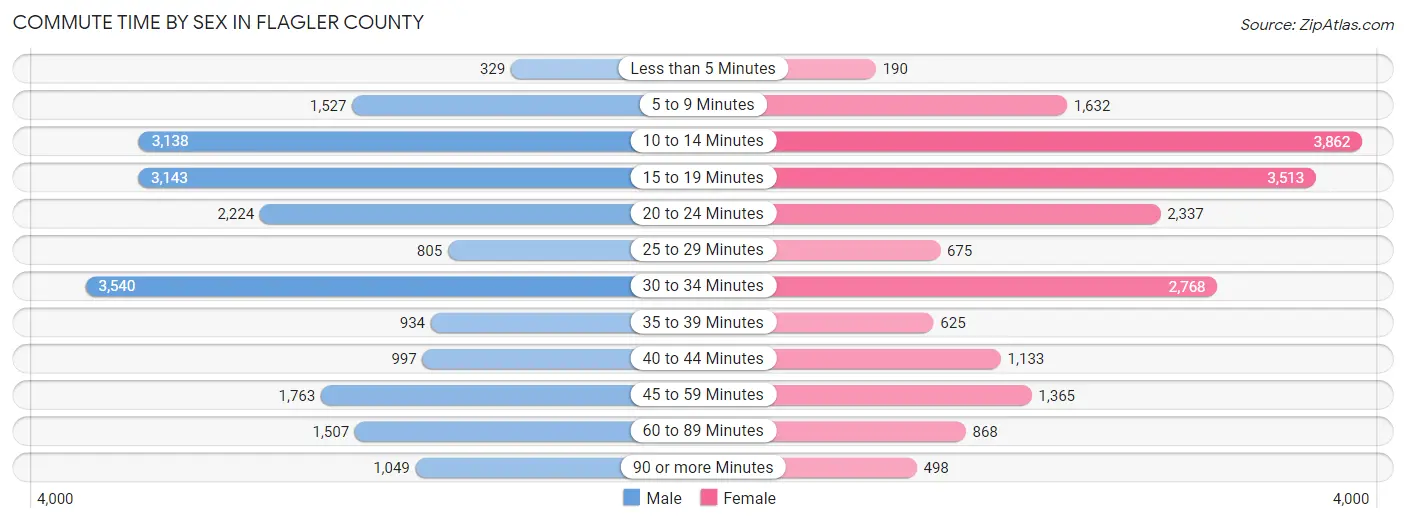
| Commute Time | Male | Female |
| Less than 5 Minutes | 329 (1.6%) | 190 (1.0%) |
| 5 to 9 Minutes | 1,527 (7.3%) | 1,632 (8.4%) |
| 10 to 14 Minutes | 3,138 (15.0%) | 3,862 (19.8%) |
| 15 to 19 Minutes | 3,143 (15.0%) | 3,513 (18.0%) |
| 20 to 24 Minutes | 2,224 (10.6%) | 2,337 (12.0%) |
| 25 to 29 Minutes | 805 (3.8%) | 675 (3.5%) |
| 30 to 34 Minutes | 3,540 (16.9%) | 2,768 (14.2%) |
| 35 to 39 Minutes | 934 (4.5%) | 625 (3.2%) |
| 40 to 44 Minutes | 997 (4.8%) | 1,133 (5.8%) |
| 45 to 59 Minutes | 1,763 (8.4%) | 1,365 (7.0%) |
| 60 to 89 Minutes | 1,507 (7.2%) | 868 (4.5%) |
| 90 or more Minutes | 1,049 (5.0%) | 498 (2.6%) |
Time of Departure to Work by Sex in Flagler County
The most frequent times of departure to work in Flagler County are 8:00 AM to 8:29 AM (5,007, 23.9%) for males and 8:00 AM to 8:29 AM (3,940, 20.2%) for females.
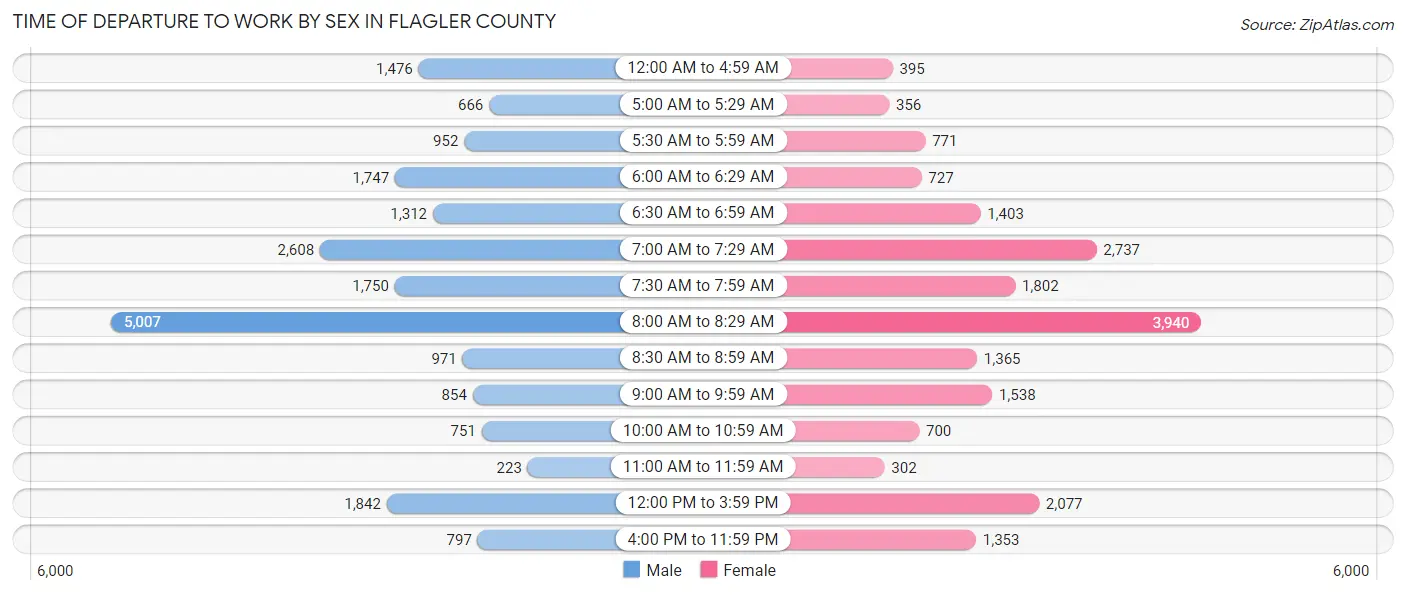
| Time of Departure | Male | Female |
| 12:00 AM to 4:59 AM | 1,476 (7.0%) | 395 (2.0%) |
| 5:00 AM to 5:29 AM | 666 (3.2%) | 356 (1.8%) |
| 5:30 AM to 5:59 AM | 952 (4.5%) | 771 (4.0%) |
| 6:00 AM to 6:29 AM | 1,747 (8.3%) | 727 (3.7%) |
| 6:30 AM to 6:59 AM | 1,312 (6.3%) | 1,403 (7.2%) |
| 7:00 AM to 7:29 AM | 2,608 (12.4%) | 2,737 (14.1%) |
| 7:30 AM to 7:59 AM | 1,750 (8.4%) | 1,802 (9.3%) |
| 8:00 AM to 8:29 AM | 5,007 (23.9%) | 3,940 (20.2%) |
| 8:30 AM to 8:59 AM | 971 (4.6%) | 1,365 (7.0%) |
| 9:00 AM to 9:59 AM | 854 (4.1%) | 1,538 (7.9%) |
| 10:00 AM to 10:59 AM | 751 (3.6%) | 700 (3.6%) |
| 11:00 AM to 11:59 AM | 223 (1.1%) | 302 (1.5%) |
| 12:00 PM to 3:59 PM | 1,842 (8.8%) | 2,077 (10.7%) |
| 4:00 PM to 11:59 PM | 797 (3.8%) | 1,353 (7.0%) |
| Total | 20,956 (100.0%) | 19,466 (100.0%) |
Housing Occupancy in Flagler County
Occupancy by Ownership in Flagler County
Of the total 47,549 dwellings in Flagler County, owner-occupied units account for 37,680 (79.2%), while renter-occupied units make up 9,869 (20.8%).
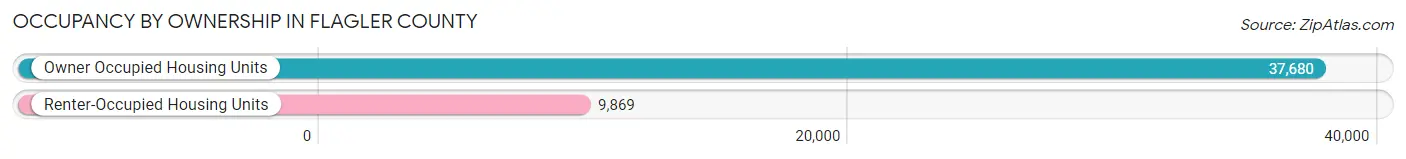
| Occupancy | # Housing Units | % Housing Units |
| Owner Occupied Housing Units | 37,680 | 79.2% |
| Renter-Occupied Housing Units | 9,869 | 20.8% |
| Total Occupied Housing Units | 47,549 | 100.0% |
Occupancy by Household Size in Flagler County
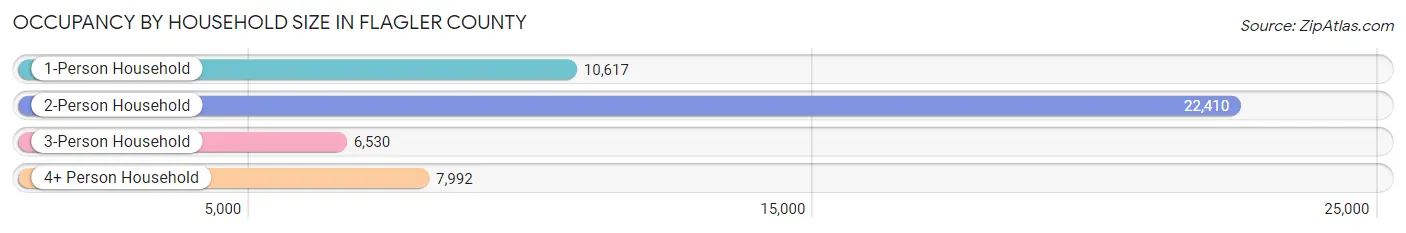
| Household Size | # Housing Units | % Housing Units |
| 1-Person Household | 10,617 | 22.3% |
| 2-Person Household | 22,410 | 47.1% |
| 3-Person Household | 6,530 | 13.7% |
| 4+ Person Household | 7,992 | 16.8% |
| Total Housing Units | 47,549 | 100.0% |
Occupancy by Ownership by Household Size in Flagler County
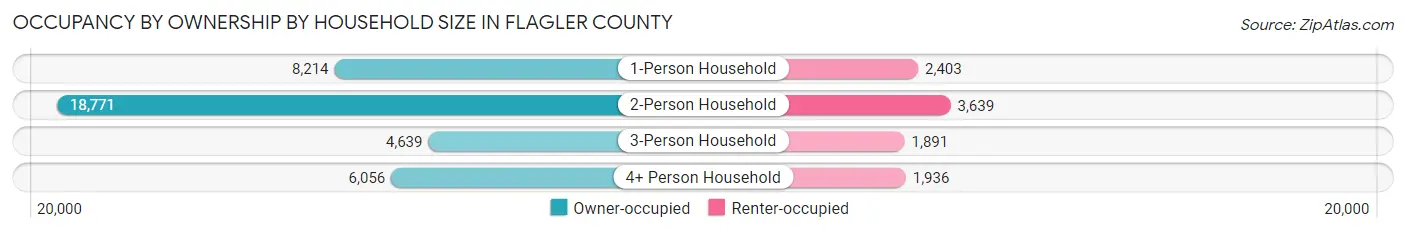
| Household Size | Owner-occupied | Renter-occupied |
| 1-Person Household | 8,214 (77.4%) | 2,403 (22.6%) |
| 2-Person Household | 18,771 (83.8%) | 3,639 (16.2%) |
| 3-Person Household | 4,639 (71.0%) | 1,891 (29.0%) |
| 4+ Person Household | 6,056 (75.8%) | 1,936 (24.2%) |
| Total Housing Units | 37,680 (79.2%) | 9,869 (20.8%) |
Occupancy by Educational Attainment in Flagler County
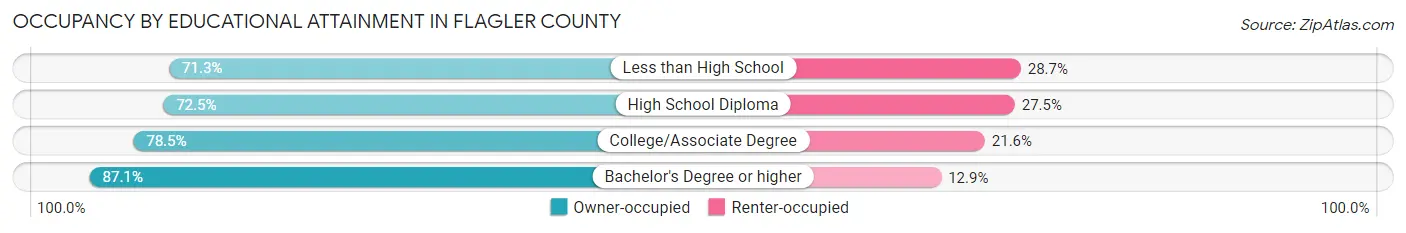
| Household Size | Owner-occupied | Renter-occupied |
| Less than High School | 2,197 (71.3%) | 883 (28.7%) |
| High School Diploma | 8,977 (72.5%) | 3,403 (27.5%) |
| College/Associate Degree | 13,082 (78.4%) | 3,594 (21.5%) |
| Bachelor's Degree or higher | 13,424 (87.1%) | 1,989 (12.9%) |
Occupancy by Age of Householder in Flagler County
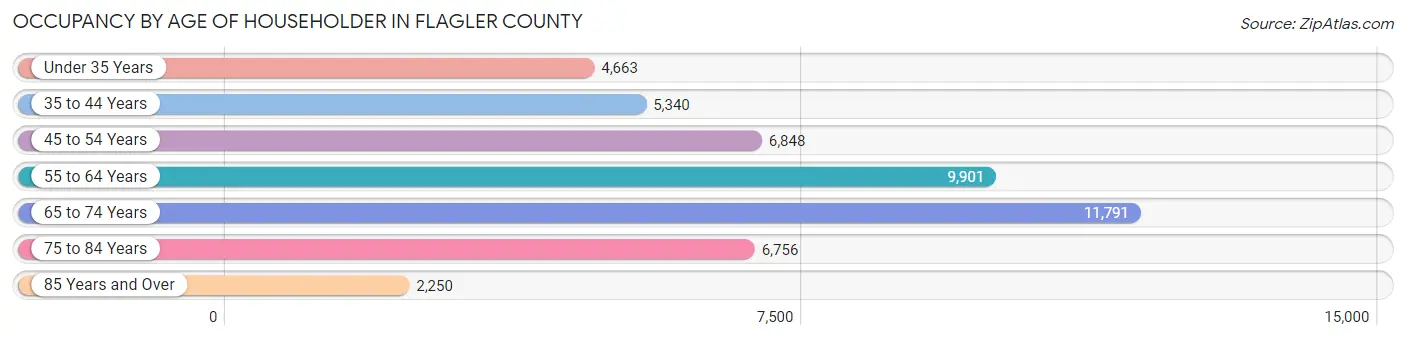
| Age Bracket | # Households | % Households |
| Under 35 Years | 4,663 | 9.8% |
| 35 to 44 Years | 5,340 | 11.2% |
| 45 to 54 Years | 6,848 | 14.4% |
| 55 to 64 Years | 9,901 | 20.8% |
| 65 to 74 Years | 11,791 | 24.8% |
| 75 to 84 Years | 6,756 | 14.2% |
| 85 Years and Over | 2,250 | 4.7% |
| Total | 47,549 | 100.0% |
Housing Finances in Flagler County
Median Income by Occupancy in Flagler County
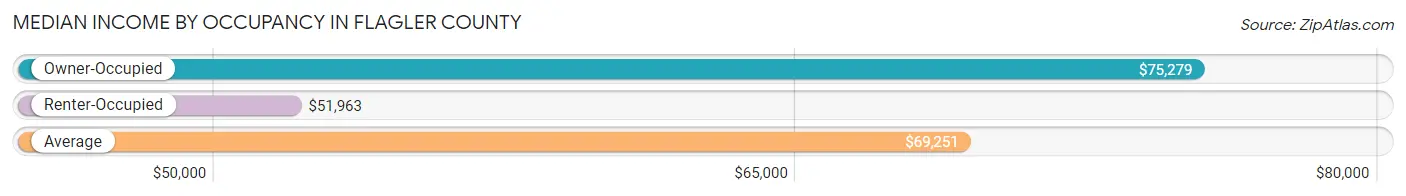
| Occupancy Type | # Households | Median Income |
| Owner-Occupied | 37,680 (79.2%) | $75,279 |
| Renter-Occupied | 9,869 (20.8%) | $51,963 |
| Average | 47,549 (100.0%) | $69,251 |
Occupancy by Householder Income Bracket in Flagler County
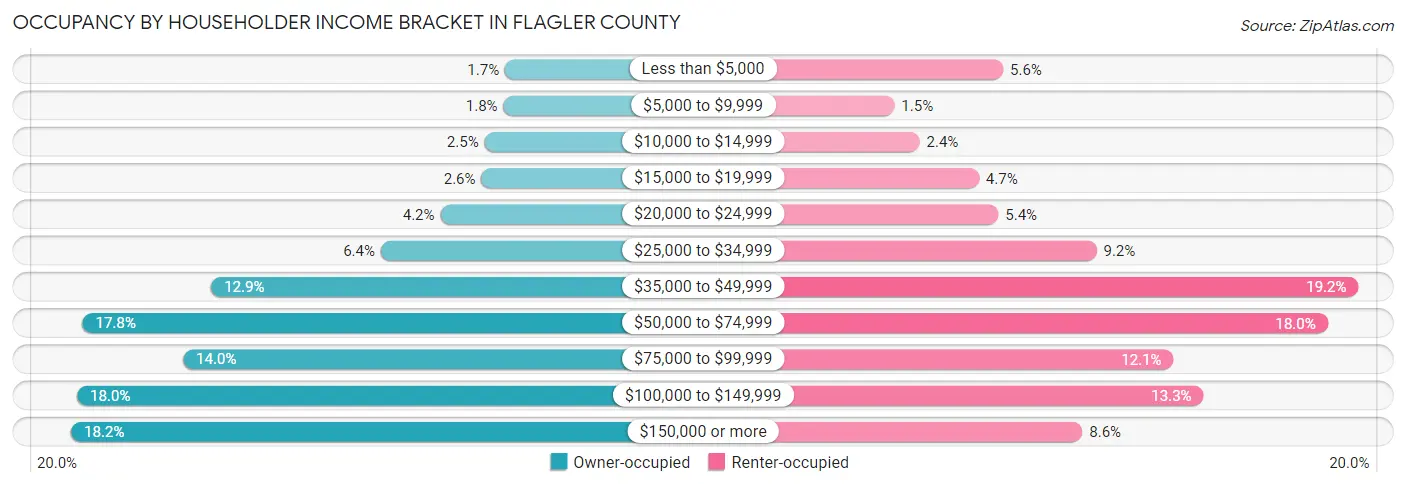
| Income Bracket | Owner-occupied | Renter-occupied |
| Less than $5,000 | 640 (1.7%) | 555 (5.6%) |
| $5,000 to $9,999 | 662 (1.8%) | 146 (1.5%) |
| $10,000 to $14,999 | 936 (2.5%) | 241 (2.4%) |
| $15,000 to $19,999 | 981 (2.6%) | 464 (4.7%) |
| $20,000 to $24,999 | 1,567 (4.2%) | 537 (5.4%) |
| $25,000 to $34,999 | 2,424 (6.4%) | 906 (9.2%) |
| $35,000 to $49,999 | 4,857 (12.9%) | 1,890 (19.2%) |
| $50,000 to $74,999 | 6,703 (17.8%) | 1,774 (18.0%) |
| $75,000 to $99,999 | 5,260 (14.0%) | 1,195 (12.1%) |
| $100,000 to $149,999 | 6,782 (18.0%) | 1,308 (13.3%) |
| $150,000 or more | 6,868 (18.2%) | 853 (8.6%) |
| Total | 37,680 (100.0%) | 9,869 (100.0%) |
Monthly Housing Cost Tiers in Flagler County
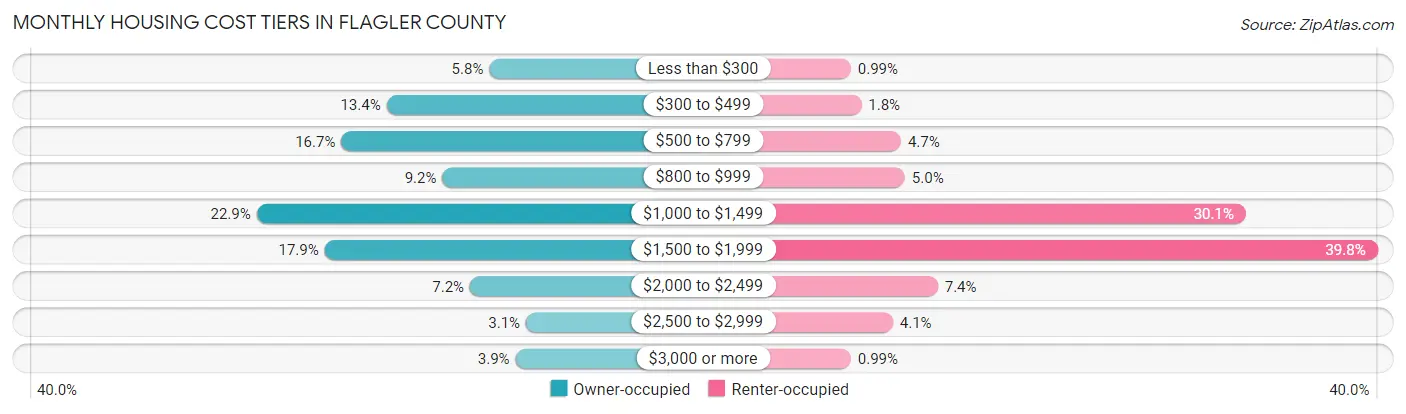
| Monthly Cost | Owner-occupied | Renter-occupied |
| Less than $300 | 2,179 (5.8%) | 98 (1.0%) |
| $300 to $499 | 5,029 (13.4%) | 174 (1.8%) |
| $500 to $799 | 6,285 (16.7%) | 462 (4.7%) |
| $800 to $999 | 3,480 (9.2%) | 490 (5.0%) |
| $1,000 to $1,499 | 8,636 (22.9%) | 2,968 (30.1%) |
| $1,500 to $1,999 | 6,748 (17.9%) | 3,925 (39.8%) |
| $2,000 to $2,499 | 2,713 (7.2%) | 729 (7.4%) |
| $2,500 to $2,999 | 1,159 (3.1%) | 403 (4.1%) |
| $3,000 or more | 1,451 (3.8%) | 98 (1.0%) |
| Total | 37,680 (100.0%) | 9,869 (100.0%) |
Physical Housing Characteristics in Flagler County
Housing Structures in Flagler County
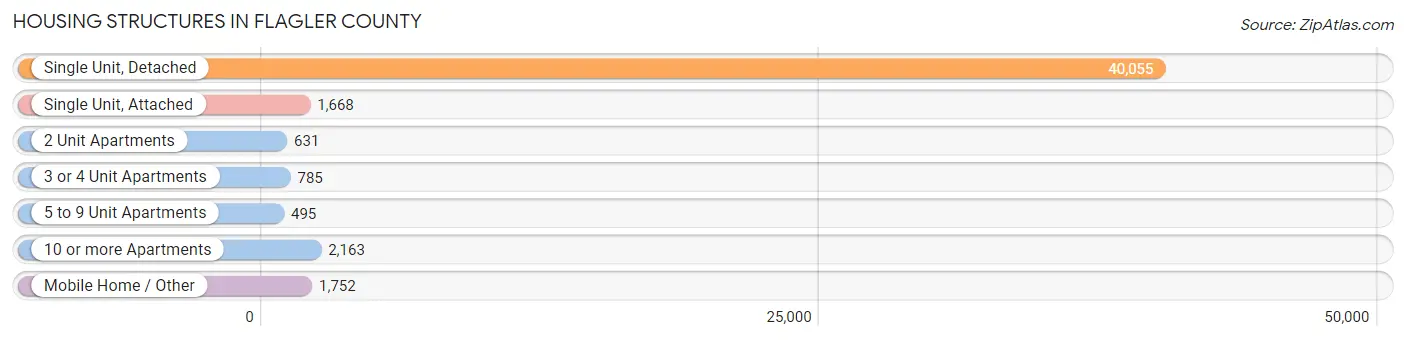
| Structure Type | # Housing Units | % Housing Units |
| Single Unit, Detached | 40,055 | 84.2% |
| Single Unit, Attached | 1,668 | 3.5% |
| 2 Unit Apartments | 631 | 1.3% |
| 3 or 4 Unit Apartments | 785 | 1.7% |
| 5 to 9 Unit Apartments | 495 | 1.0% |
| 10 or more Apartments | 2,163 | 4.5% |
| Mobile Home / Other | 1,752 | 3.7% |
| Total | 47,549 | 100.0% |
Housing Structures by Occupancy in Flagler County
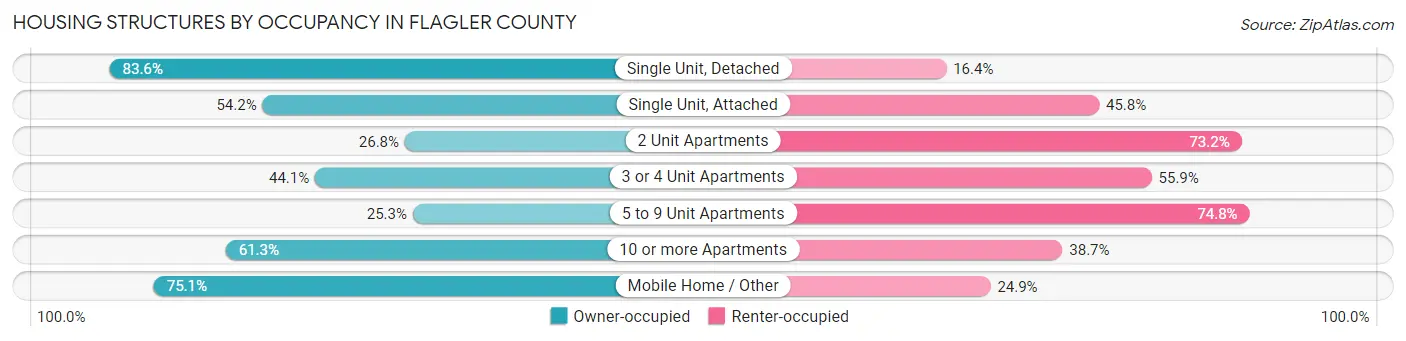
| Structure Type | Owner-occupied | Renter-occupied |
| Single Unit, Detached | 33,495 (83.6%) | 6,560 (16.4%) |
| Single Unit, Attached | 904 (54.2%) | 764 (45.8%) |
| 2 Unit Apartments | 169 (26.8%) | 462 (73.2%) |
| 3 or 4 Unit Apartments | 346 (44.1%) | 439 (55.9%) |
| 5 to 9 Unit Apartments | 125 (25.3%) | 370 (74.8%) |
| 10 or more Apartments | 1,325 (61.3%) | 838 (38.7%) |
| Mobile Home / Other | 1,316 (75.1%) | 436 (24.9%) |
| Total | 37,680 (79.2%) | 9,869 (20.8%) |
Housing Structures by Number of Rooms in Flagler County
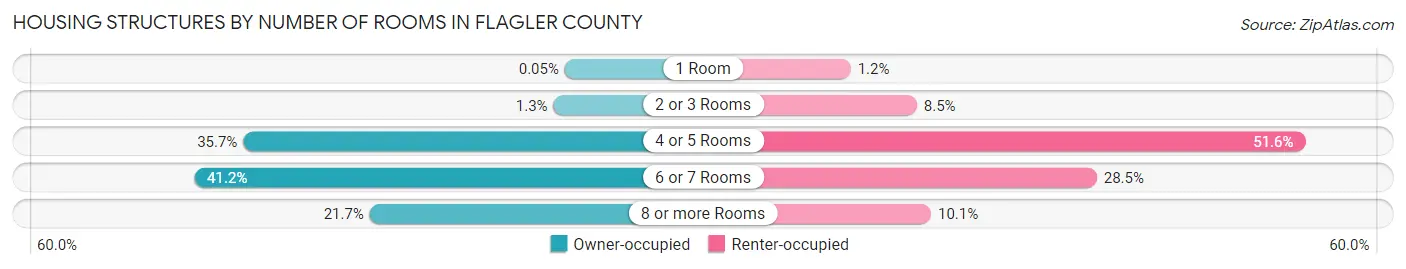
| Number of Rooms | Owner-occupied | Renter-occupied |
| 1 Room | 18 (0.1%) | 118 (1.2%) |
| 2 or 3 Rooms | 495 (1.3%) | 843 (8.5%) |
| 4 or 5 Rooms | 13,467 (35.7%) | 5,096 (51.6%) |
| 6 or 7 Rooms | 15,524 (41.2%) | 2,814 (28.5%) |
| 8 or more Rooms | 8,176 (21.7%) | 998 (10.1%) |
| Total | 37,680 (100.0%) | 9,869 (100.0%) |
Housing Structure by Heating Type in Flagler County
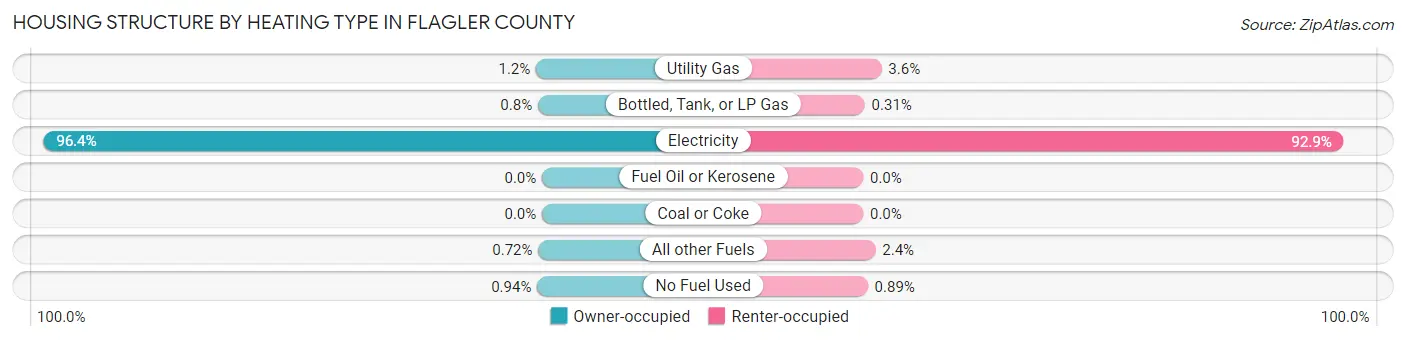
| Heating Type | Owner-occupied | Renter-occupied |
| Utility Gas | 436 (1.2%) | 350 (3.5%) |
| Bottled, Tank, or LP Gas | 302 (0.8%) | 31 (0.3%) |
| Electricity | 36,316 (96.4%) | 9,165 (92.9%) |
| Fuel Oil or Kerosene | 0 (0.0%) | 0 (0.0%) |
| Coal or Coke | 0 (0.0%) | 0 (0.0%) |
| All other Fuels | 272 (0.7%) | 235 (2.4%) |
| No Fuel Used | 354 (0.9%) | 88 (0.9%) |
| Total | 37,680 (100.0%) | 9,869 (100.0%) |
Household Vehicle Usage in Flagler County
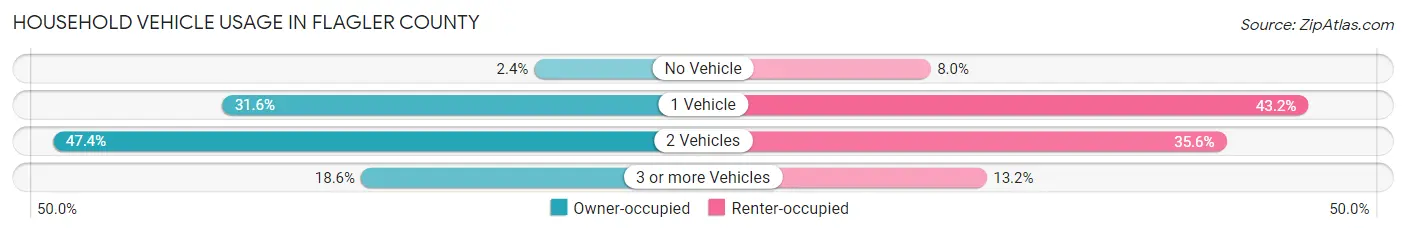
| Vehicles per Household | Owner-occupied | Renter-occupied |
| No Vehicle | 917 (2.4%) | 786 (8.0%) |
| 1 Vehicle | 11,905 (31.6%) | 4,267 (43.2%) |
| 2 Vehicles | 17,844 (47.4%) | 3,513 (35.6%) |
| 3 or more Vehicles | 7,014 (18.6%) | 1,303 (13.2%) |
| Total | 37,680 (100.0%) | 9,869 (100.0%) |
Real Estate & Mortgages in Flagler County
Real Estate and Mortgage Overview in Flagler County
| Characteristic | Without Mortgage | With Mortgage |
| Housing Units | 16,337 | 21,343 |
| Median Property Value | $292,600 | $294,400 |
| Median Household Income | $59,617 | $4,617 |
| Monthly Housing Costs | $542 | $1,408 |
| Real Estate Taxes | $2,388 | $741 |
Property Value by Mortgage Status in Flagler County
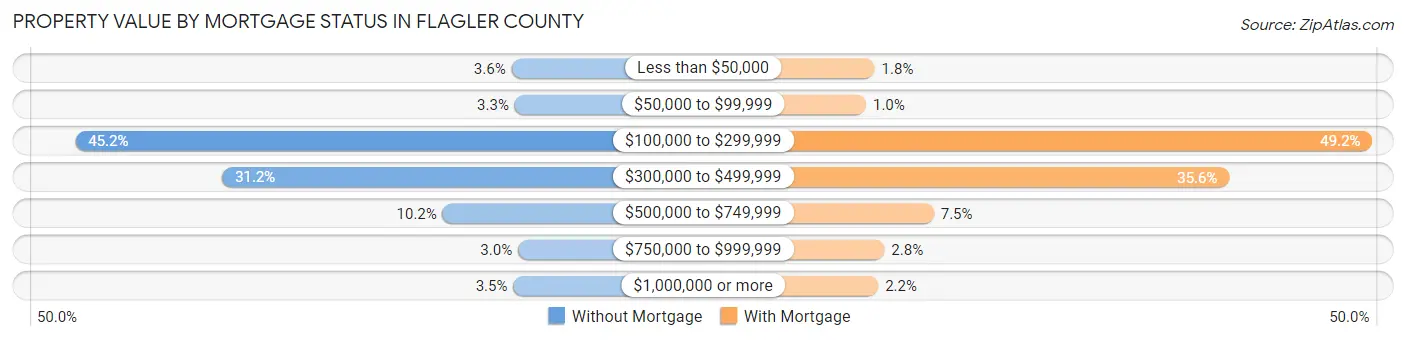
| Property Value | Without Mortgage | With Mortgage |
| Less than $50,000 | 593 (3.6%) | 388 (1.8%) |
| $50,000 to $99,999 | 543 (3.3%) | 213 (1.0%) |
| $100,000 to $299,999 | 7,381 (45.2%) | 10,505 (49.2%) |
| $300,000 to $499,999 | 5,097 (31.2%) | 7,597 (35.6%) |
| $500,000 to $749,999 | 1,665 (10.2%) | 1,591 (7.4%) |
| $750,000 to $999,999 | 492 (3.0%) | 587 (2.8%) |
| $1,000,000 or more | 566 (3.5%) | 462 (2.2%) |
| Total | 16,337 (100.0%) | 21,343 (100.0%) |
Household Income by Mortgage Status in Flagler County
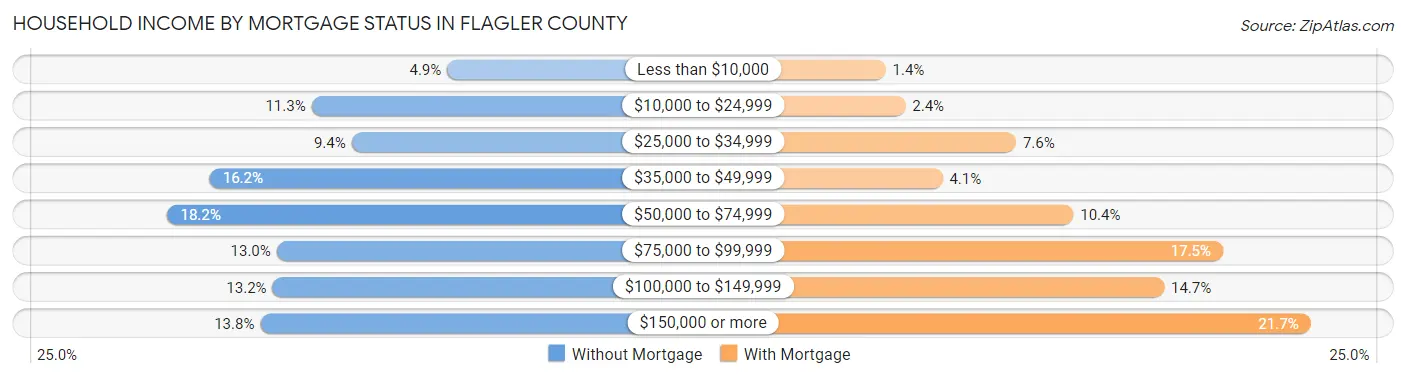
| Household Income | Without Mortgage | With Mortgage |
| Less than $10,000 | 797 (4.9%) | 305 (1.4%) |
| $10,000 to $24,999 | 1,853 (11.3%) | 505 (2.4%) |
| $25,000 to $34,999 | 1,540 (9.4%) | 1,631 (7.6%) |
| $35,000 to $49,999 | 2,644 (16.2%) | 884 (4.1%) |
| $50,000 to $74,999 | 2,971 (18.2%) | 2,213 (10.4%) |
| $75,000 to $99,999 | 2,124 (13.0%) | 3,732 (17.5%) |
| $100,000 to $149,999 | 2,157 (13.2%) | 3,136 (14.7%) |
| $150,000 or more | 2,251 (13.8%) | 4,625 (21.7%) |
| Total | 16,337 (100.0%) | 21,343 (100.0%) |
Property Value to Household Income Ratio in Flagler County
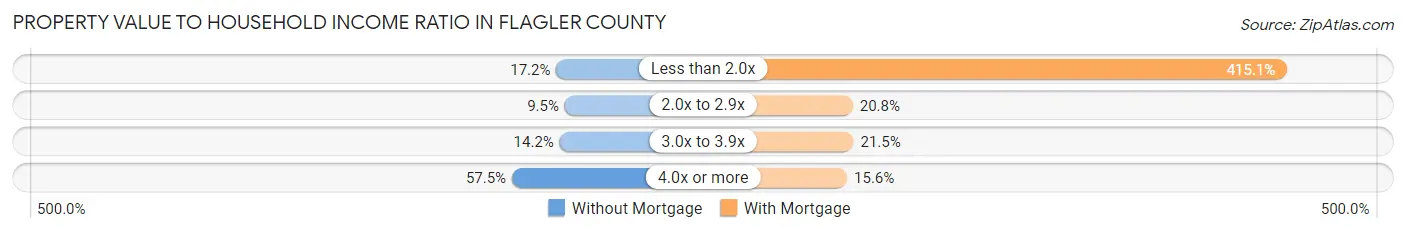
| Value-to-Income Ratio | Without Mortgage | With Mortgage |
| Less than 2.0x | 2,806 (17.2%) | 88,604 (415.1%) |
| 2.0x to 2.9x | 1,550 (9.5%) | 4,431 (20.8%) |
| 3.0x to 3.9x | 2,312 (14.1%) | 4,579 (21.4%) |
| 4.0x or more | 9,388 (57.5%) | 3,327 (15.6%) |
| Total | 16,337 (100.0%) | 21,343 (100.0%) |
Real Estate Taxes by Mortgage Status in Flagler County
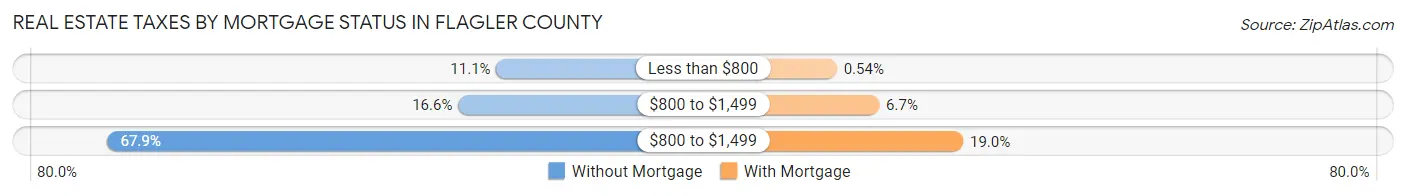
| Property Taxes | Without Mortgage | With Mortgage |
| Less than $800 | 1,807 (11.1%) | 115 (0.5%) |
| $800 to $1,499 | 2,719 (16.6%) | 1,438 (6.7%) |
| $800 to $1,499 | 11,088 (67.9%) | 4,054 (19.0%) |
| Total | 16,337 (100.0%) | 21,343 (100.0%) |
Health & Disability in Flagler County
Health Insurance Coverage by Age in Flagler County
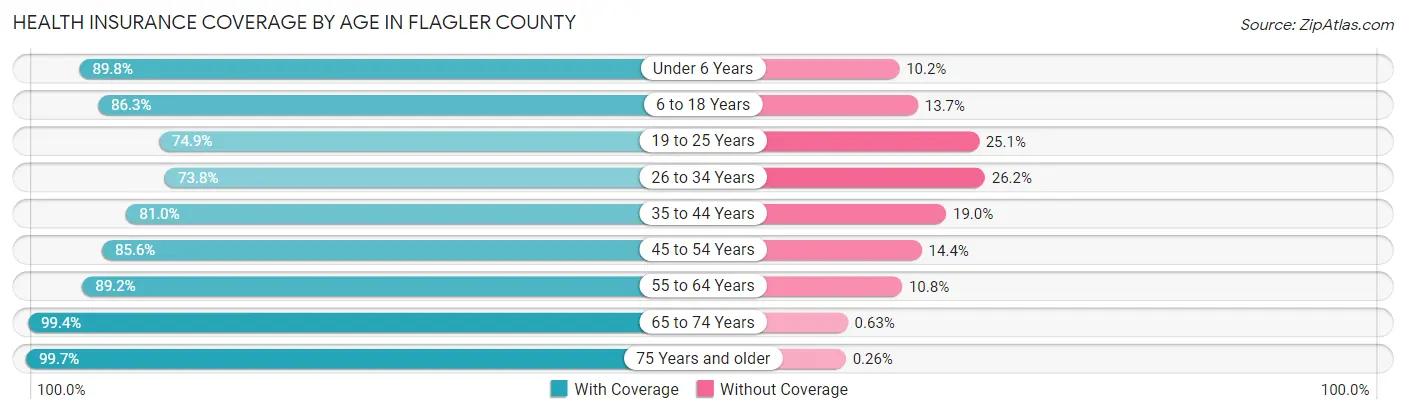
| Age Bracket | With Coverage | Without Coverage |
| Under 6 Years | 4,647 (89.8%) | 530 (10.2%) |
| 6 to 18 Years | 13,217 (86.3%) | 2,101 (13.7%) |
| 19 to 25 Years | 5,253 (74.9%) | 1,758 (25.1%) |
| 26 to 34 Years | 6,906 (73.8%) | 2,452 (26.2%) |
| 35 to 44 Years | 9,470 (81.0%) | 2,218 (19.0%) |
| 45 to 54 Years | 11,636 (85.6%) | 1,963 (14.4%) |
| 55 to 64 Years | 16,724 (89.2%) | 2,017 (10.8%) |
| 65 to 74 Years | 20,611 (99.4%) | 131 (0.6%) |
| 75 Years and older | 15,170 (99.7%) | 39 (0.3%) |
| Total | 103,634 (88.7%) | 13,209 (11.3%) |
Health Insurance Coverage by Citizenship Status in Flagler County
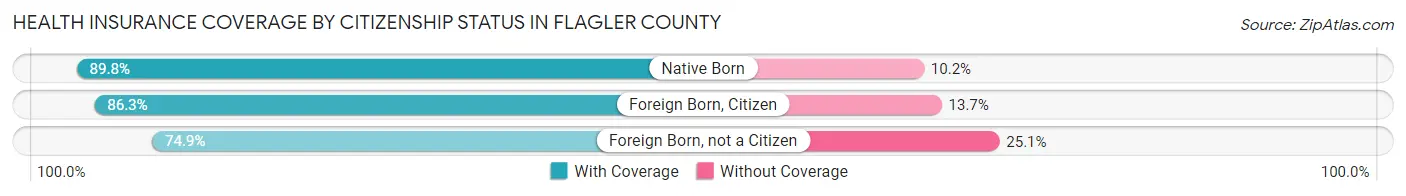
| Citizenship Status | With Coverage | Without Coverage |
| Native Born | 4,647 (89.8%) | 530 (10.2%) |
| Foreign Born, Citizen | 13,217 (86.3%) | 2,101 (13.7%) |
| Foreign Born, not a Citizen | 5,253 (74.9%) | 1,758 (25.1%) |
Health Insurance Coverage by Household Income in Flagler County
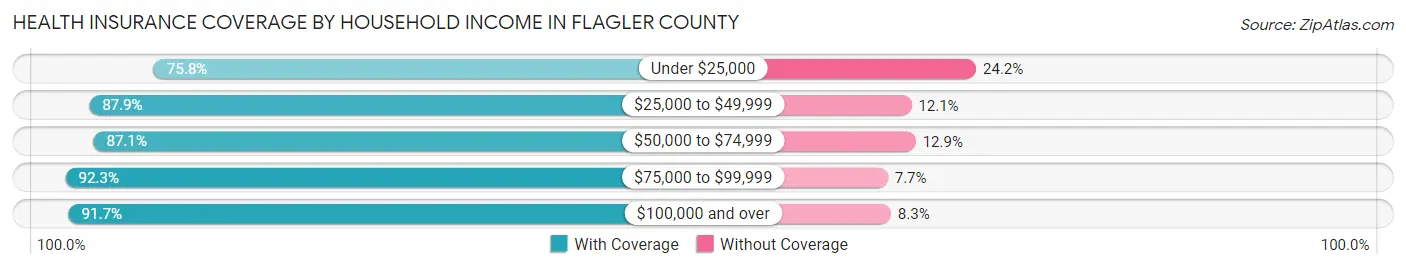
| Household Income | With Coverage | Without Coverage |
| Under $25,000 | 8,950 (75.8%) | 2,862 (24.2%) |
| $25,000 to $49,999 | 18,081 (87.9%) | 2,492 (12.1%) |
| $50,000 to $74,999 | 17,393 (87.1%) | 2,580 (12.9%) |
| $75,000 to $99,999 | 15,546 (92.3%) | 1,294 (7.7%) |
| $100,000 and over | 43,557 (91.7%) | 3,923 (8.3%) |
Public vs Private Health Insurance Coverage by Age in Flagler County
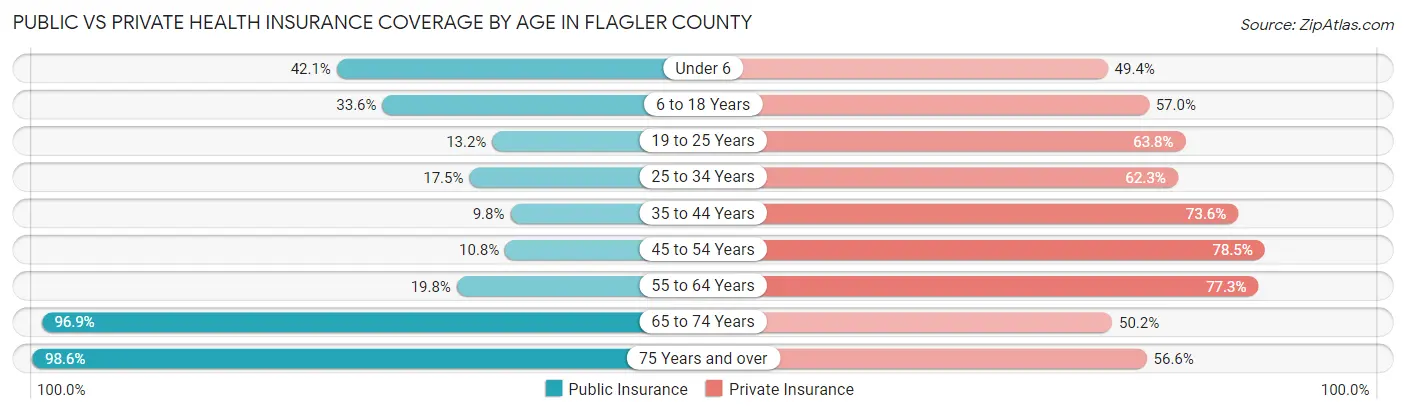
| Age Bracket | Public Insurance | Private Insurance |
| Under 6 | 2,178 (42.1%) | 2,555 (49.3%) |
| 6 to 18 Years | 5,145 (33.6%) | 8,727 (57.0%) |
| 19 to 25 Years | 926 (13.2%) | 4,470 (63.8%) |
| 25 to 34 Years | 1,634 (17.5%) | 5,833 (62.3%) |
| 35 to 44 Years | 1,150 (9.8%) | 8,598 (73.6%) |
| 45 to 54 Years | 1,470 (10.8%) | 10,673 (78.5%) |
| 55 to 64 Years | 3,711 (19.8%) | 14,485 (77.3%) |
| 65 to 74 Years | 20,093 (96.9%) | 10,404 (50.2%) |
| 75 Years and over | 14,997 (98.6%) | 8,606 (56.6%) |
| Total | 51,304 (43.9%) | 74,351 (63.6%) |
Disability Status by Sex by Age in Flagler County
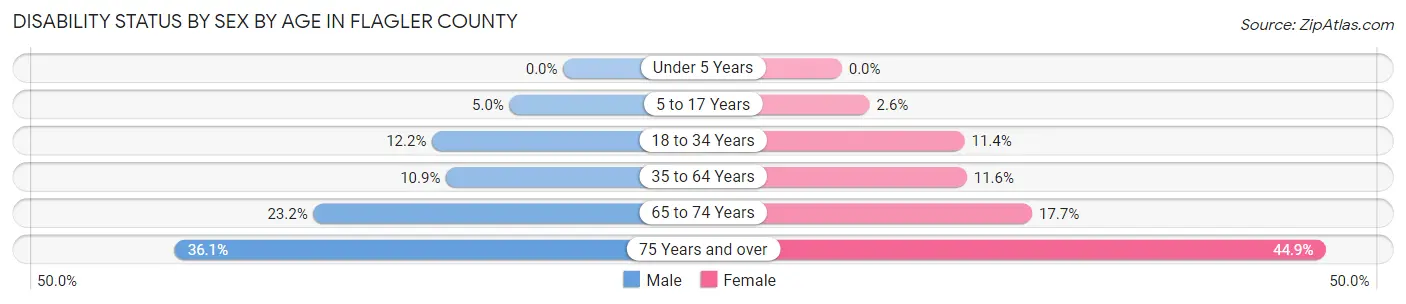
| Age Bracket | Male | Female |
| Under 5 Years | 0 (0.0%) | 0 (0.0%) |
| 5 to 17 Years | 383 (5.0%) | 190 (2.6%) |
| 18 to 34 Years | 1,087 (12.2%) | 983 (11.4%) |
| 35 to 64 Years | 2,240 (10.9%) | 2,718 (11.6%) |
| 65 to 74 Years | 2,278 (23.2%) | 1,929 (17.7%) |
| 75 Years and over | 2,633 (36.1%) | 3,548 (44.9%) |
Disability Class by Sex by Age in Flagler County
Disability Class: Hearing Difficulty
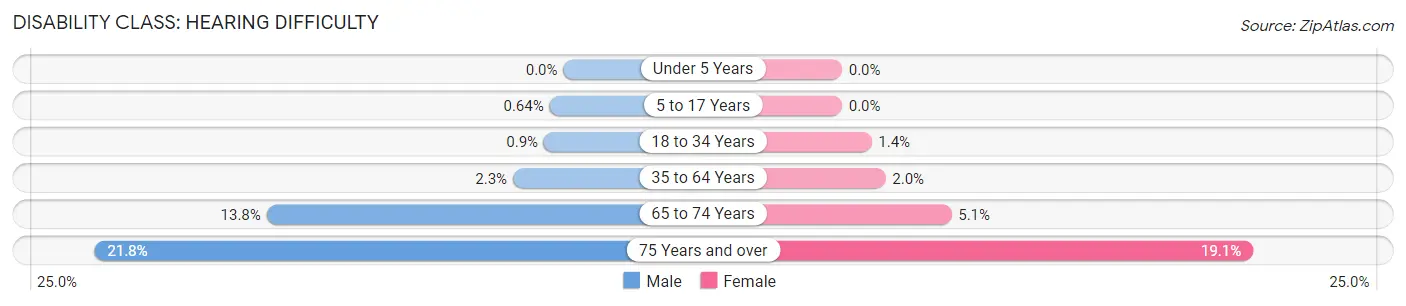
| Age Bracket | Male | Female |
| Under 5 Years | 0 (0.0%) | 0 (0.0%) |
| 5 to 17 Years | 49 (0.6%) | 0 (0.0%) |
| 18 to 34 Years | 80 (0.9%) | 118 (1.4%) |
| 35 to 64 Years | 482 (2.3%) | 473 (2.0%) |
| 65 to 74 Years | 1,352 (13.8%) | 555 (5.1%) |
| 75 Years and over | 1,589 (21.8%) | 1,509 (19.1%) |
Disability Class: Vision Difficulty
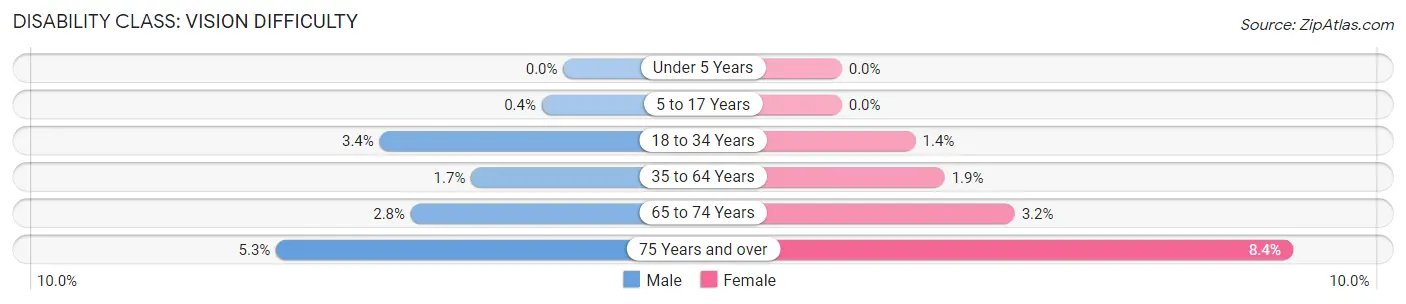
| Age Bracket | Male | Female |
| Under 5 Years | 0 (0.0%) | 0 (0.0%) |
| 5 to 17 Years | 31 (0.4%) | 0 (0.0%) |
| 18 to 34 Years | 305 (3.4%) | 118 (1.4%) |
| 35 to 64 Years | 353 (1.7%) | 447 (1.9%) |
| 65 to 74 Years | 278 (2.8%) | 351 (3.2%) |
| 75 Years and over | 389 (5.3%) | 662 (8.4%) |
Disability Class: Cognitive Difficulty
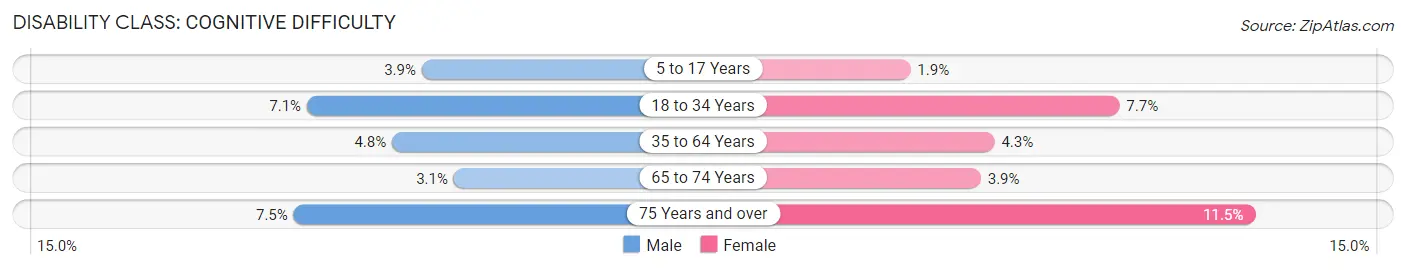
| Age Bracket | Male | Female |
| 5 to 17 Years | 303 (3.9%) | 141 (1.9%) |
| 18 to 34 Years | 638 (7.1%) | 667 (7.7%) |
| 35 to 64 Years | 982 (4.8%) | 995 (4.3%) |
| 65 to 74 Years | 300 (3.0%) | 423 (3.9%) |
| 75 Years and over | 548 (7.5%) | 910 (11.5%) |
Disability Class: Ambulatory Difficulty
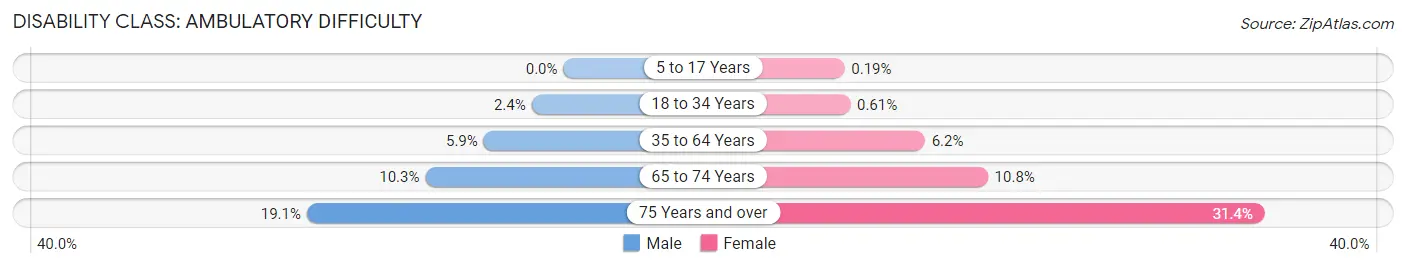
| Age Bracket | Male | Female |
| 5 to 17 Years | 0 (0.0%) | 14 (0.2%) |
| 18 to 34 Years | 211 (2.4%) | 53 (0.6%) |
| 35 to 64 Years | 1,220 (5.9%) | 1,442 (6.2%) |
| 65 to 74 Years | 1,007 (10.2%) | 1,183 (10.8%) |
| 75 Years and over | 1,391 (19.1%) | 2,483 (31.4%) |
Disability Class: Self-Care Difficulty
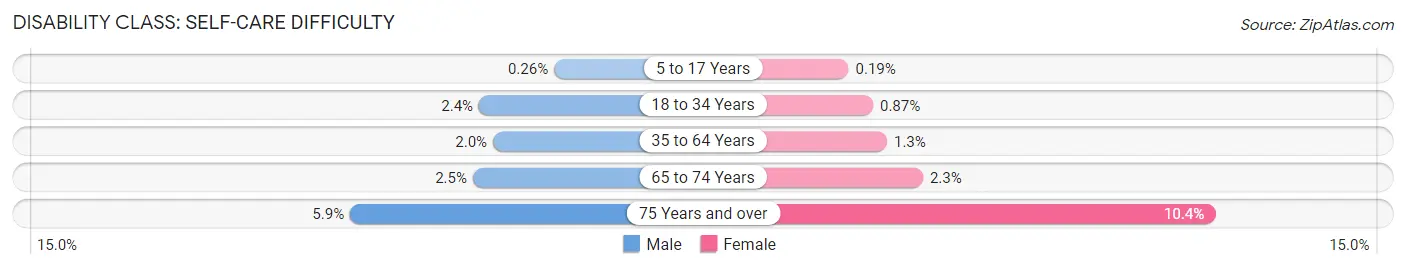
| Age Bracket | Male | Female |
| 5 to 17 Years | 20 (0.3%) | 14 (0.2%) |
| 18 to 34 Years | 210 (2.4%) | 75 (0.9%) |
| 35 to 64 Years | 404 (2.0%) | 294 (1.3%) |
| 65 to 74 Years | 248 (2.5%) | 247 (2.3%) |
| 75 Years and over | 434 (5.9%) | 824 (10.4%) |
Technology Access in Flagler County
Computing Device Access in Flagler County
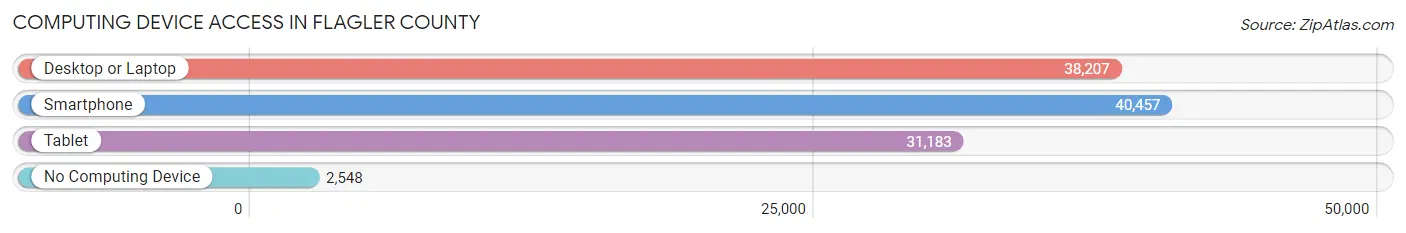
| Device Type | # Households | % Households |
| Desktop or Laptop | 38,207 | 80.3% |
| Smartphone | 40,457 | 85.1% |
| Tablet | 31,183 | 65.6% |
| No Computing Device | 2,548 | 5.4% |
| Total | 47,549 | 100.0% |
Internet Access in Flagler County
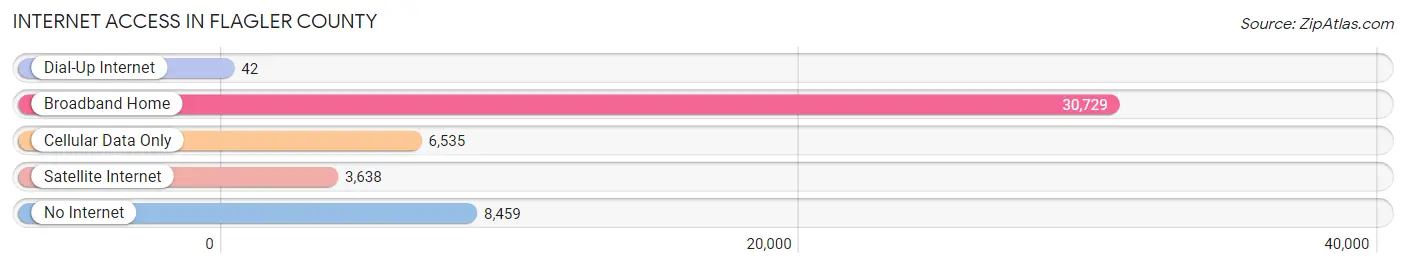
| Internet Type | # Households | % Households |
| Dial-Up Internet | 42 | 0.1% |
| Broadband Home | 30,729 | 64.6% |
| Cellular Data Only | 6,535 | 13.7% |
| Satellite Internet | 3,638 | 7.6% |
| No Internet | 8,459 | 17.8% |
| Total | 47,549 | 100.0% |
Flagler County Summary
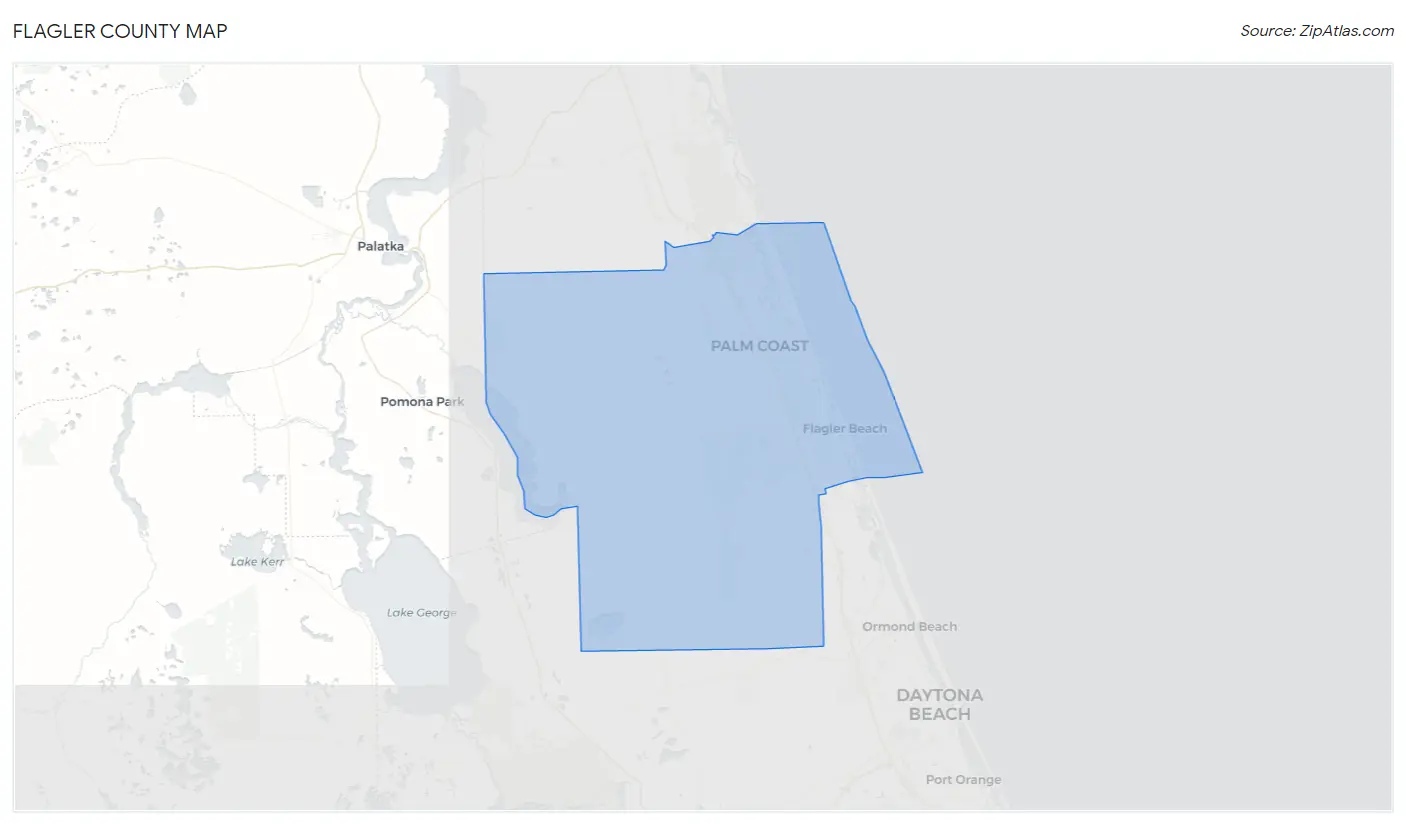
Flagler County is located in the northeast corner of Florida, along the Atlantic Coast. It is bordered by Volusia County to the north, St. Johns County to the east, Putnam County to the west, and the Atlantic Ocean to the south. The county seat is Bunnell, and the largest city is Palm Coast. Flagler County was created in 1917 from parts of St. Johns and Volusia counties.
Geography
Flagler County covers an area of 576 square miles, of which 545 square miles is land and 31 square miles is water. The county is located in the northeast corner of Florida, along the Atlantic Coast. It is bordered by Volusia County to the north, St. Johns County to the east, Putnam County to the west, and the Atlantic Ocean to the south. The county is divided into two distinct regions: the coastal region and the interior region. The coastal region is characterized by low-lying, sandy terrain, while the interior region is characterized by rolling hills and dense forests.
The county is home to several rivers, including the St. Johns River, the Halifax River, the Matanzas River, and the Tomoka River. The county also contains several lakes, including Lake George, Lake Dexter, and Lake Monroe.
Economy
Flagler County has a diverse economy, with a mix of industries including tourism, manufacturing, agriculture, and services. The county is home to several large employers, including Florida Hospital Flagler, Flagler County School Board, and Flagler County Government.
Tourism is a major industry in Flagler County, with visitors drawn to the area's beaches, parks, and other attractions. The county is home to several popular tourist destinations, including Flagler Beach, Marineland, and the Flagler County Historical Museum.
Agriculture is also an important part of the county's economy, with crops such as citrus, vegetables, and hay being grown in the area. The county is also home to several large cattle ranches.
Manufacturing is another important industry in Flagler County, with products such as paper, plastics, and chemicals being produced in the area.
Demographics
As of the 2010 census, Flagler County had a population of 95,696. The racial makeup of the county was 79.2% White, 11.3% African American, 0.5% Native American, 2.2% Asian, 0.1% Pacific Islander, 4.2% from other races, and 2.7% from two or more races. Hispanic or Latino of any race were 11.3% of the population.
The median household income in Flagler County was $45,945, and the median family income was $54,945. The per capita income was $25,945. About 11.3% of families and 14.2% of the population were below the poverty line, including 19.2% of those under age 18 and 8.2% of those age 65 or over.
Conclusion
Flagler County is a diverse and vibrant county located in the northeast corner of Florida. It is home to a mix of industries, including tourism, manufacturing, agriculture, and services. The county is also home to a diverse population, with a mix of races and ethnicities. Flagler County is a great place to live, work, and visit, and its economy is sure to continue to grow and thrive in the years to come.
Common Questions
What is Per Capita Income in Flagler County?
Per Capita income in Flagler County is $40,463.
What is the Median Family Income in Flagler County?
Median Family Income in Flagler County is $80,702.
What is the Median Household income in Flagler County?
Median Household Income in Flagler County is $69,251.
What is Income or Wage Gap in Flagler County?
Income or Wage Gap in Flagler County is 21.4%.
Women in Flagler County earn 78.6 cents for every dollar earned by a man.
What is Family Income Deficit in Flagler County?
Family Income Deficit in Flagler County is $10,057.
Families that are below poverty line in Flagler County earn $10,057 less on average than the poverty threshold level.
What is Inequality or Gini Index in Flagler County?
Inequality or Gini Index in Flagler County is 0.46.
What is the Total Population of Flagler County?
Total Population of Flagler County is 117,515.
What is the Total Male Population of Flagler County?
Total Male Population of Flagler County is 56,801.
What is the Total Female Population of Flagler County?
Total Female Population of Flagler County is 60,714.
What is the Ratio of Males per 100 Females in Flagler County?
There are 93.56 Males per 100 Females in Flagler County.
What is the Ratio of Females per 100 Males in Flagler County?
There are 106.89 Females per 100 Males in Flagler County.
What is the Median Population Age in Flagler County?
Median Population Age in Flagler County is 52.4 Years.
What is the Average Family Size in Flagler County
Average Family Size in Flagler County is 2.8 People.
What is the Average Household Size in Flagler County
Average Household Size in Flagler County is 2.5 People.
How Large is the Labor Force in Flagler County?
There are 50,198 People in the Labor Forcein in Flagler County.
What is the Percentage of People in the Labor Force in Flagler County?
50.0% of People are in the Labor Force in Flagler County.
What is the Unemployment Rate in Flagler County?
Unemployment Rate in Flagler County is 3.8%.