Dixie County, FL Map & Demographics
Dixie County Map
Dixie County Overview
$20,508
PER CAPITA INCOME
$49,404
AVG FAMILY INCOME
$45,057
AVG HOUSEHOLD INCOME
42.8%
WAGE / INCOME GAP [ % ]
57.2¢/ $1
WAGE / INCOME GAP [ $ ]
0.43
INEQUALITY / GINI INDEX
16,737
TOTAL POPULATION
9,323
MALE POPULATION
7,414
FEMALE POPULATION
125.75
MALES / 100 FEMALES
79.52
FEMALES / 100 MALES
45.8
MEDIAN AGE
3.0
AVG FAMILY SIZE
2.5
AVG HOUSEHOLD SIZE
5,742
LABOR FORCE [ PEOPLE ]
40.6%
PERCENT IN LABOR FORCE
5.1%
UNEMPLOYMENT RATE
Income in Dixie County
Income Overview in Dixie County
Per Capita Income in Dixie County is $20,508, while median incomes of families and households are $49,404 and $45,057 respectively.
| Characteristic | Number | Measure |
| Per Capita Income | 16,737 | $20,508 |
| Median Family Income | 4,250 | $49,404 |
| Mean Family Income | 4,250 | $67,750 |
| Median Household Income | 6,164 | $45,057 |
| Mean Household Income | 6,164 | $57,286 |
| Income Deficit | 4,250 | $0 |
| Wage / Income Gap (%) | 16,737 | 42.83% |
| Wage / Income Gap ($) | 16,737 | 57.17¢ per $1 |
| Gini / Inequality Index | 16,737 | 0.43 |
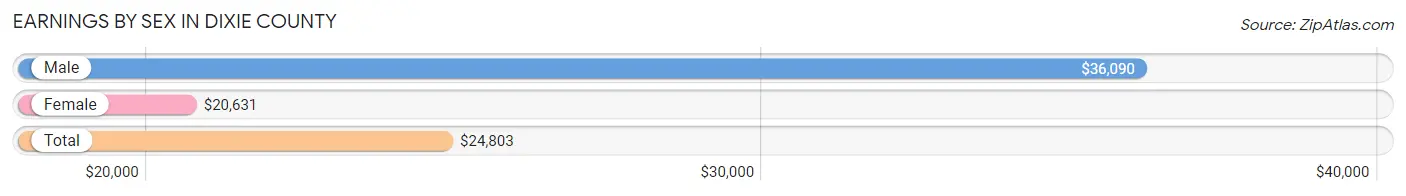
Earnings by Sex in Dixie County
Average Earnings in Dixie County are $24,803, $36,090 for men and $20,631 for women, a difference of 42.8%.
| Sex | Number | Average Earnings |
| Male | 2,979 (49.2%) | $36,090 |
| Female | 3,077 (50.8%) | $20,631 |
| Total | 6,056 (100.0%) | $24,803 |
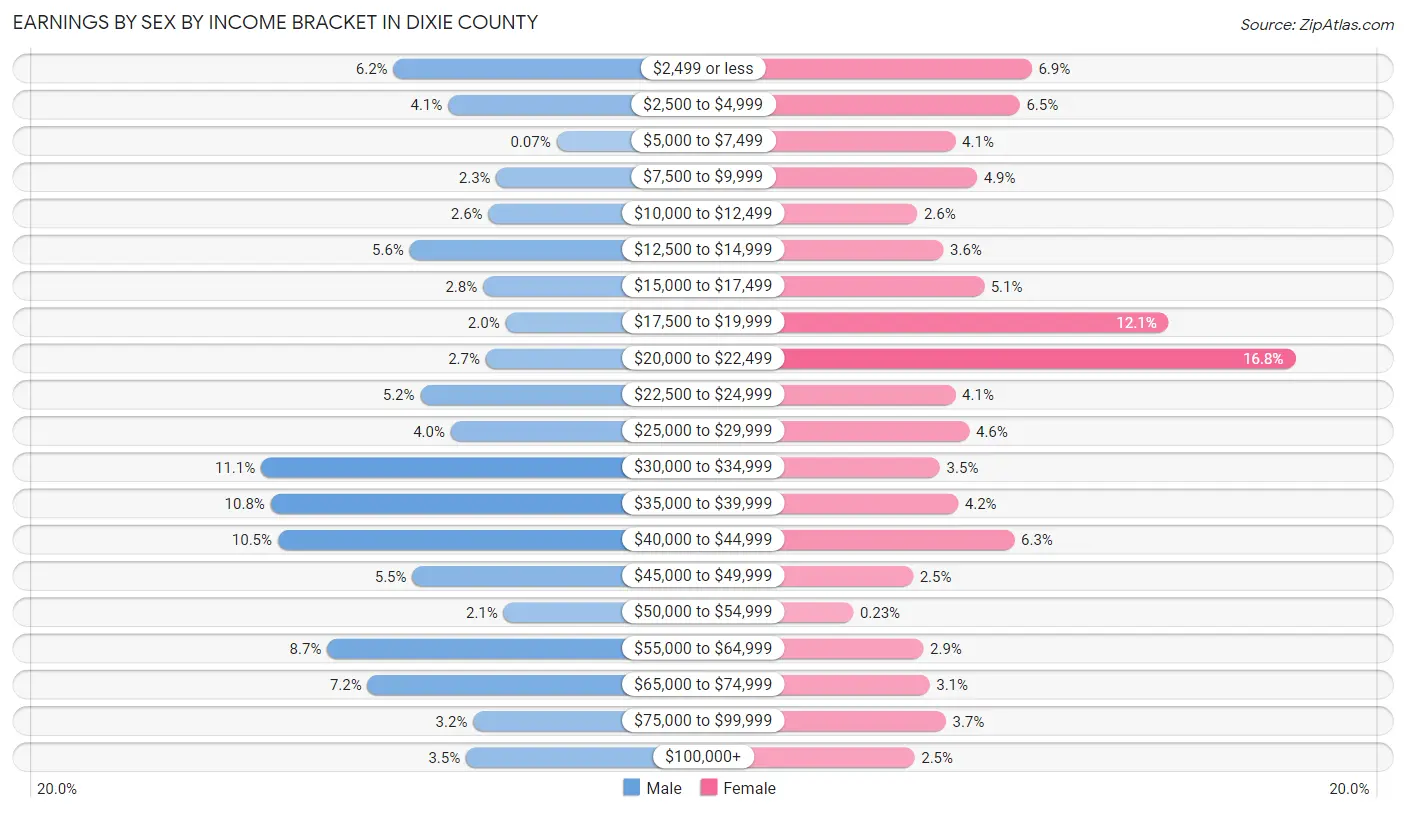
Earnings by Sex by Income Bracket in Dixie County
The most common earnings brackets in Dixie County are $30,000 to $34,999 for men (332 | 11.1%) and $20,000 to $22,499 for women (517 | 16.8%).
| Income | Male | Female |
| $2,499 or less | 184 (6.2%) | 213 (6.9%) |
| $2,500 to $4,999 | 123 (4.1%) | 199 (6.5%) |
| $5,000 to $7,499 | 2 (0.1%) | 125 (4.1%) |
| $7,500 to $9,999 | 69 (2.3%) | 150 (4.9%) |
| $10,000 to $12,499 | 78 (2.6%) | 81 (2.6%) |
| $12,500 to $14,999 | 166 (5.6%) | 111 (3.6%) |
| $15,000 to $17,499 | 84 (2.8%) | 158 (5.1%) |
| $17,500 to $19,999 | 59 (2.0%) | 371 (12.1%) |
| $20,000 to $22,499 | 81 (2.7%) | 517 (16.8%) |
| $22,500 to $24,999 | 154 (5.2%) | 125 (4.1%) |
| $25,000 to $29,999 | 120 (4.0%) | 141 (4.6%) |
| $30,000 to $34,999 | 332 (11.1%) | 107 (3.5%) |
| $35,000 to $39,999 | 321 (10.8%) | 128 (4.2%) |
| $40,000 to $44,999 | 313 (10.5%) | 193 (6.3%) |
| $45,000 to $49,999 | 163 (5.5%) | 76 (2.5%) |
| $50,000 to $54,999 | 61 (2.1%) | 7 (0.2%) |
| $55,000 to $64,999 | 258 (8.7%) | 88 (2.9%) |
| $65,000 to $74,999 | 213 (7.1%) | 95 (3.1%) |
| $75,000 to $99,999 | 95 (3.2%) | 114 (3.7%) |
| $100,000+ | 103 (3.5%) | 78 (2.5%) |
| Total | 2,979 (100.0%) | 3,077 (100.0%) |
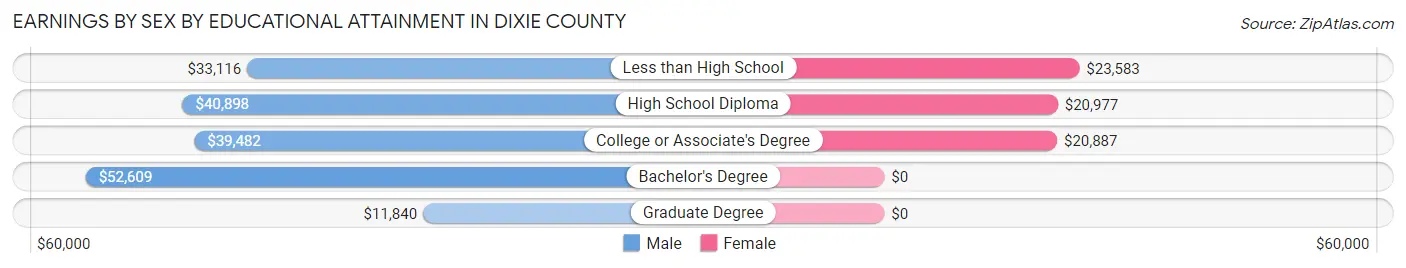
Earnings by Sex by Educational Attainment in Dixie County
Average earnings in Dixie County are $38,275 for men and $20,987 for women, a difference of 45.2%. Men with an educational attainment of bachelor's degree enjoy the highest average annual earnings of $52,609, while those with graduate degree education earn the least with $11,840. Women with an educational attainment of less than high school earn the most with the average annual earnings of $23,583, while those with college or associate's degree education have the smallest earnings of $20,887.
| Educational Attainment | Male Income | Female Income |
| Less than High School | $33,116 | $23,583 |
| High School Diploma | $40,898 | $20,977 |
| College or Associate's Degree | $39,482 | $20,887 |
| Bachelor's Degree | $52,609 | $0 |
| Graduate Degree | $11,840 | $0 |
| Total | $38,275 | $20,987 |
Family Income in Dixie County
Family Income Brackets in Dixie County
According to the Dixie County family income data, there are 1,075 families falling into the $35,000 to $49,999 income range, which is the most common income bracket and makes up 25.3% of all families. Conversely, the $10,000 to $14,999 income bracket is the least frequent group with only 94 families (2.2%) belonging to this category.
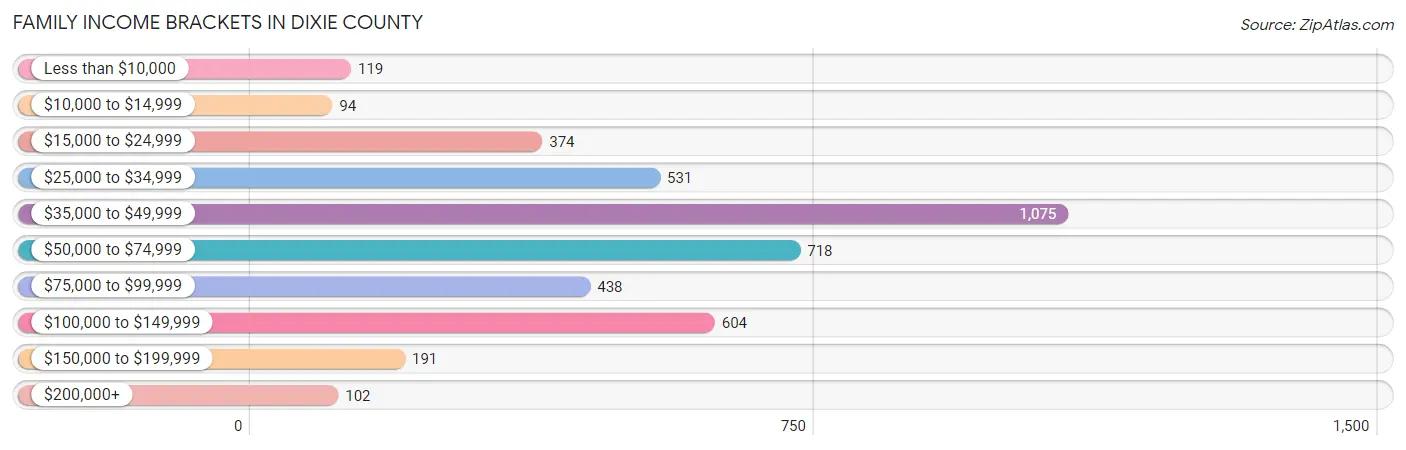
| Income Bracket | # Families | % Families |
| Less than $10,000 | 119 | 2.8% |
| $10,000 to $14,999 | 94 | 2.2% |
| $15,000 to $24,999 | 374 | 8.8% |
| $25,000 to $34,999 | 531 | 12.5% |
| $35,000 to $49,999 | 1,075 | 25.3% |
| $50,000 to $74,999 | 718 | 16.9% |
| $75,000 to $99,999 | 438 | 10.3% |
| $100,000 to $149,999 | 604 | 14.2% |
| $150,000 to $199,999 | 191 | 4.5% |
| $200,000+ | 102 | 2.4% |
Family Income by Famaliy Size in Dixie County
6-person families (394 | 9.3%) account for the highest median family income in Dixie County with $86,342 per family, while 2-person families (2,177 | 51.2%) have the highest median income of $20,843 per family member.
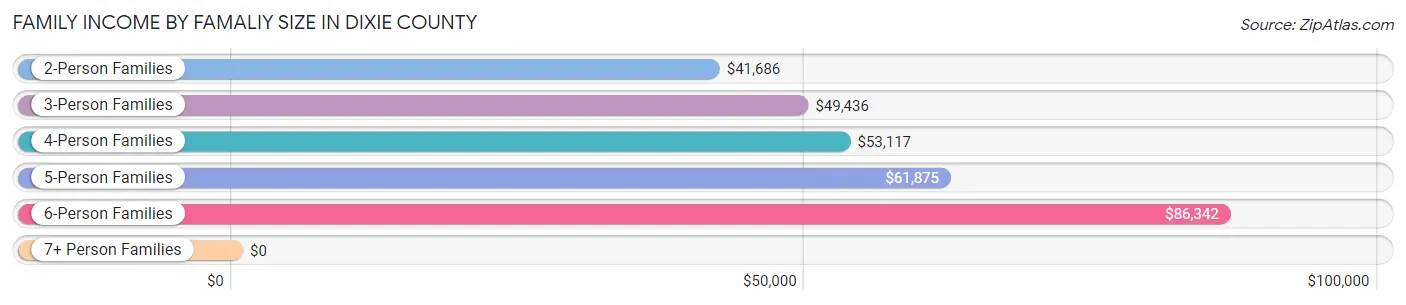
| Income Bracket | # Families | Median Income |
| 2-Person Families | 2,177 (51.2%) | $41,686 |
| 3-Person Families | 776 (18.3%) | $49,436 |
| 4-Person Families | 424 (10.0%) | $53,117 |
| 5-Person Families | 398 (9.4%) | $61,875 |
| 6-Person Families | 394 (9.3%) | $86,342 |
| 7+ Person Families | 81 (1.9%) | $0 |
| Total | 4,250 (100.0%) | $49,404 |
Family Income by Number of Earners in Dixie County
The median family income in Dixie County is $49,404, with families comprising 3+ earners (500) having the highest median family income of $132,188, while families with no earners (1,234) have the lowest median family income of $31,292, accounting for 11.8% and 29.0% of families, respectively.
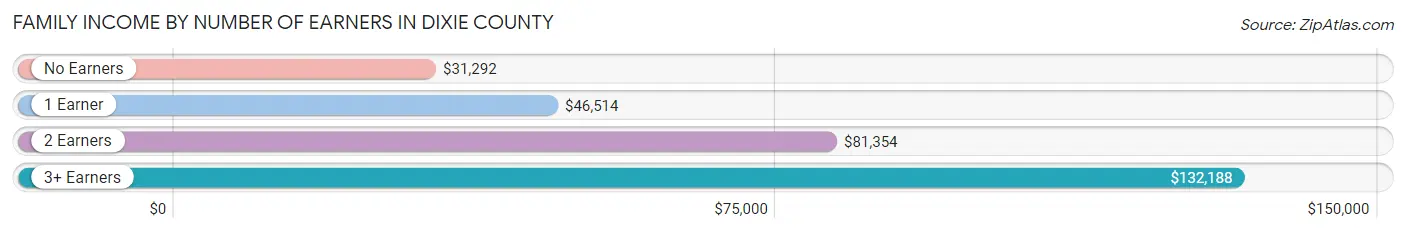
| Number of Earners | # Families | Median Income |
| No Earners | 1,234 (29.0%) | $31,292 |
| 1 Earner | 1,541 (36.3%) | $46,514 |
| 2 Earners | 975 (22.9%) | $81,354 |
| 3+ Earners | 500 (11.8%) | $132,188 |
| Total | 4,250 (100.0%) | $49,404 |
Household Income in Dixie County
Household Income Brackets in Dixie County
With 1,227 households falling in the category, the $35,000 to $49,999 income range is the most frequent in Dixie County, accounting for 19.9% of all households. In contrast, only 105 households (1.7%) fall into the $200,000+ income bracket, making it the least populous group.
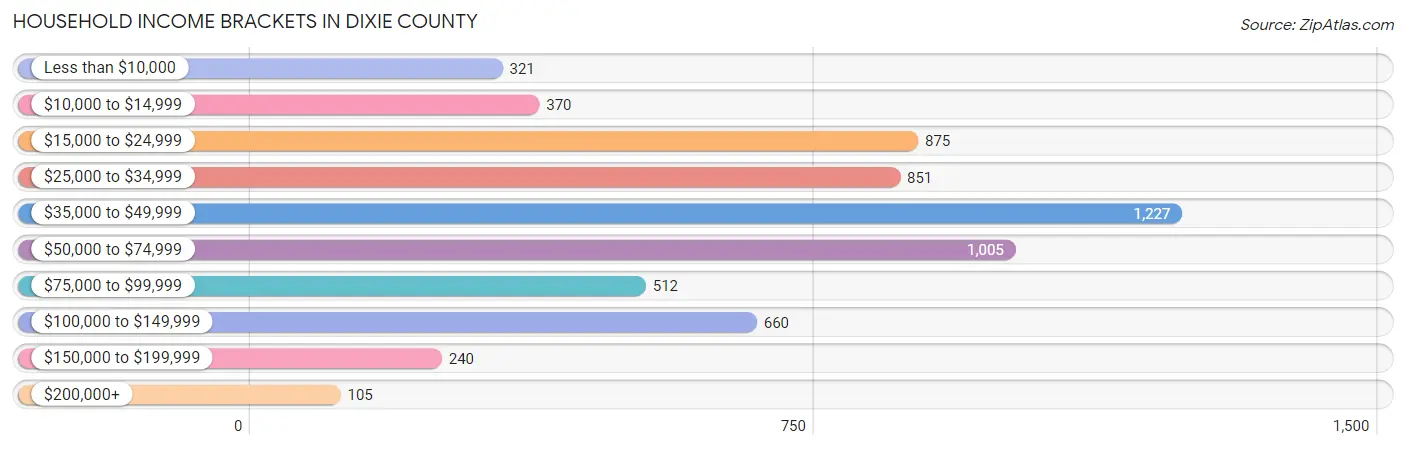
| Income Bracket | # Households | % Households |
| Less than $10,000 | 321 | 5.2% |
| $10,000 to $14,999 | 370 | 6.0% |
| $15,000 to $24,999 | 875 | 14.2% |
| $25,000 to $34,999 | 851 | 13.8% |
| $35,000 to $49,999 | 1,227 | 19.9% |
| $50,000 to $74,999 | 1,005 | 16.3% |
| $75,000 to $99,999 | 512 | 8.3% |
| $100,000 to $149,999 | 660 | 10.7% |
| $150,000 to $199,999 | 240 | 3.9% |
| $200,000+ | 105 | 1.7% |
Household Income by Householder Age in Dixie County
The median household income in Dixie County is $45,057, with the highest median household income of $48,042 found in the 25 to 44 years age bracket for the primary householder. A total of 1,449 households (23.5%) fall into this category. Meanwhile, the 15 to 24 years age bracket for the primary householder has the lowest median household income of $0, with 170 households (2.8%) in this group.
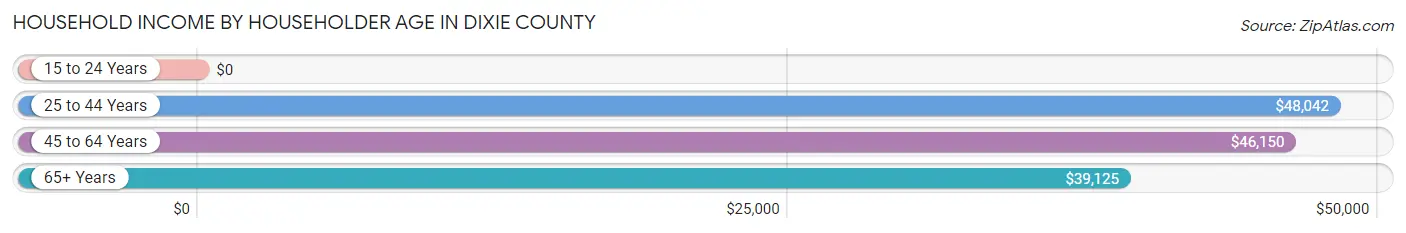
| Income Bracket | # Households | Median Income |
| 15 to 24 Years | 170 (2.8%) | $0 |
| 25 to 44 Years | 1,449 (23.5%) | $48,042 |
| 45 to 64 Years | 2,040 (33.1%) | $46,150 |
| 65+ Years | 2,505 (40.6%) | $39,125 |
| Total | 6,164 (100.0%) | $45,057 |
Poverty in Dixie County
Income Below Poverty by Sex and Age in Dixie County
With 15.7% poverty level for males and 16.7% for females among the residents of Dixie County, 12 to 14 year old males and 15 year old females are the most vulnerable to poverty, with 172 males (81.5%) and 46 females (68.7%) in their respective age groups living below the poverty level.
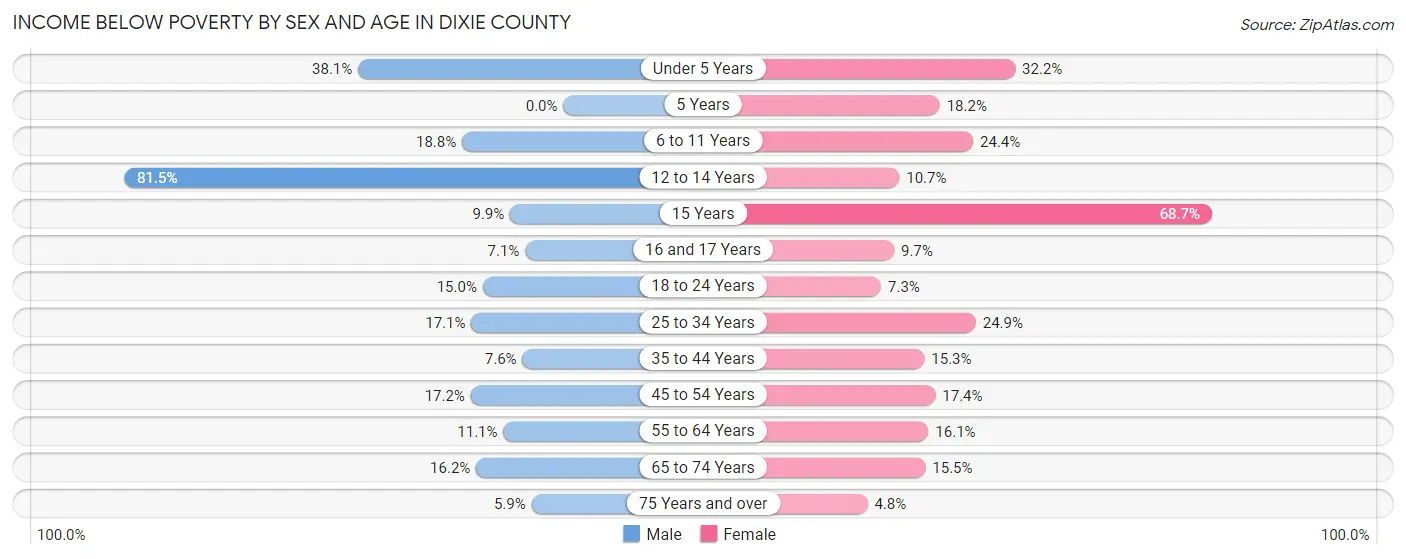
| Age Bracket | Male | Female |
| Under 5 Years | 112 (38.1%) | 112 (32.2%) |
| 5 Years | 0 (0.0%) | 12 (18.2%) |
| 6 to 11 Years | 119 (18.8%) | 108 (24.4%) |
| 12 to 14 Years | 172 (81.5%) | 24 (10.7%) |
| 15 Years | 16 (9.9%) | 46 (68.7%) |
| 16 and 17 Years | 16 (7.1%) | 16 (9.7%) |
| 18 to 24 Years | 95 (15.0%) | 39 (7.3%) |
| 25 to 34 Years | 108 (17.1%) | 195 (24.9%) |
| 35 to 44 Years | 76 (7.6%) | 124 (15.3%) |
| 45 to 54 Years | 150 (17.2%) | 152 (17.4%) |
| 55 to 64 Years | 120 (11.1%) | 193 (16.1%) |
| 65 to 74 Years | 190 (16.2%) | 167 (15.5%) |
| 75 Years and over | 47 (5.9%) | 36 (4.8%) |
| Total | 1,221 (15.7%) | 1,224 (16.7%) |
Income Above Poverty by Sex and Age in Dixie County
According to the poverty statistics in Dixie County, males aged 5 years and females aged 75 years and over are the age groups that are most secure financially, with 100.0% of males and 95.2% of females in these age groups living above the poverty line.
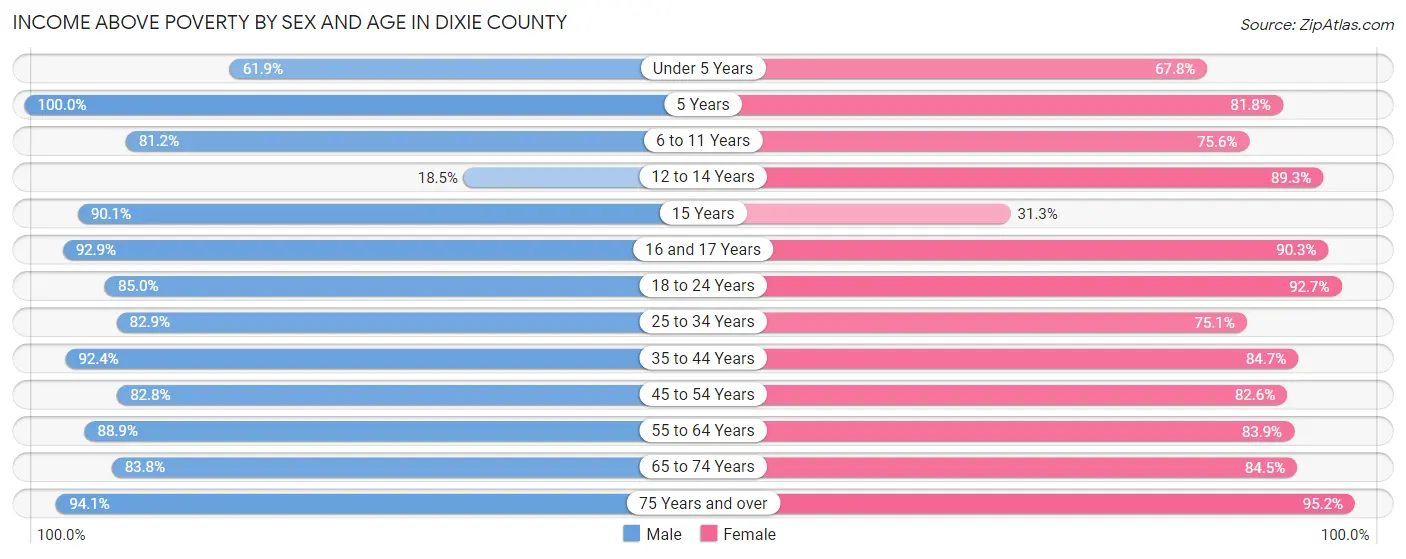
| Age Bracket | Male | Female |
| Under 5 Years | 182 (61.9%) | 236 (67.8%) |
| 5 Years | 84 (100.0%) | 54 (81.8%) |
| 6 to 11 Years | 514 (81.2%) | 335 (75.6%) |
| 12 to 14 Years | 39 (18.5%) | 201 (89.3%) |
| 15 Years | 146 (90.1%) | 21 (31.3%) |
| 16 and 17 Years | 210 (92.9%) | 149 (90.3%) |
| 18 to 24 Years | 540 (85.0%) | 495 (92.7%) |
| 25 to 34 Years | 524 (82.9%) | 589 (75.1%) |
| 35 to 44 Years | 925 (92.4%) | 685 (84.7%) |
| 45 to 54 Years | 722 (82.8%) | 723 (82.6%) |
| 55 to 64 Years | 957 (88.9%) | 1,007 (83.9%) |
| 65 to 74 Years | 984 (83.8%) | 910 (84.5%) |
| 75 Years and over | 749 (94.1%) | 718 (95.2%) |
| Total | 6,576 (84.3%) | 6,123 (83.3%) |
Income Below Poverty Among Married-Couple Families in Dixie County
The poverty statistics for married-couple families in Dixie County show that 8.3% or 275 of the total 3,317 families live below the poverty line. Families with 3 or 4 children have the highest poverty rate of 37.7%, comprising of 141 families. On the other hand, families with no children have the lowest poverty rate of 2.7%, which includes 62 families.
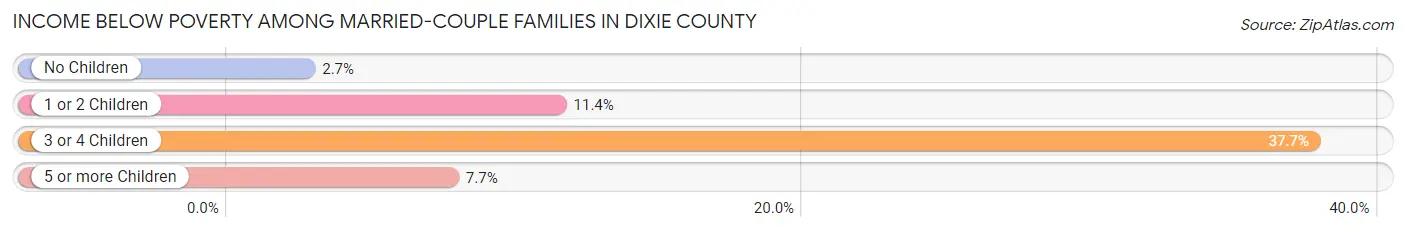
| Children | Above Poverty | Below Poverty |
| No Children | 2,243 (97.3%) | 62 (2.7%) |
| 1 or 2 Children | 542 (88.6%) | 70 (11.4%) |
| 3 or 4 Children | 233 (62.3%) | 141 (37.7%) |
| 5 or more Children | 24 (92.3%) | 2 (7.7%) |
| Total | 3,042 (91.7%) | 275 (8.3%) |
Income Below Poverty Among Single-Parent Households in Dixie County
According to the poverty data in Dixie County, 2.0% or 7 single-father households and 22.0% or 128 single-mother households are living below the poverty line. Among single-father households, those with 3 or 4 children have the highest poverty rate, with 7 households (14.6%) experiencing poverty. Likewise, among single-mother households, those with 3 or 4 children have the highest poverty rate, with 20 households (32.3%) falling below the poverty line.
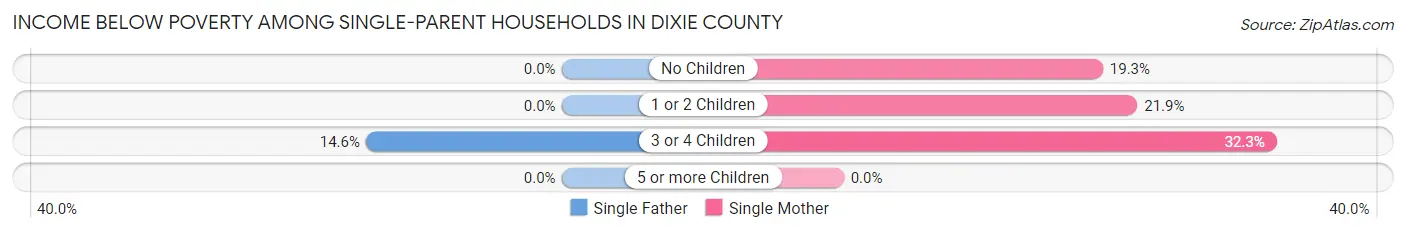
| Children | Single Father | Single Mother |
| No Children | 0 (0.0%) | 45 (19.3%) |
| 1 or 2 Children | 0 (0.0%) | 63 (21.9%) |
| 3 or 4 Children | 7 (14.6%) | 20 (32.3%) |
| 5 or more Children | 0 (0.0%) | 0 (0.0%) |
| Total | 7 (2.0%) | 128 (22.0%) |
Income Below Poverty Among Married-Couple vs Single-Parent Households in Dixie County
The poverty data for Dixie County shows that 275 of the married-couple family households (8.3%) and 135 of the single-parent households (14.5%) are living below the poverty level. Within the married-couple family households, those with 3 or 4 children have the highest poverty rate, with 141 households (37.7%) falling below the poverty line. Among the single-parent households, those with 3 or 4 children have the highest poverty rate, with 27 household (24.5%) living below poverty.
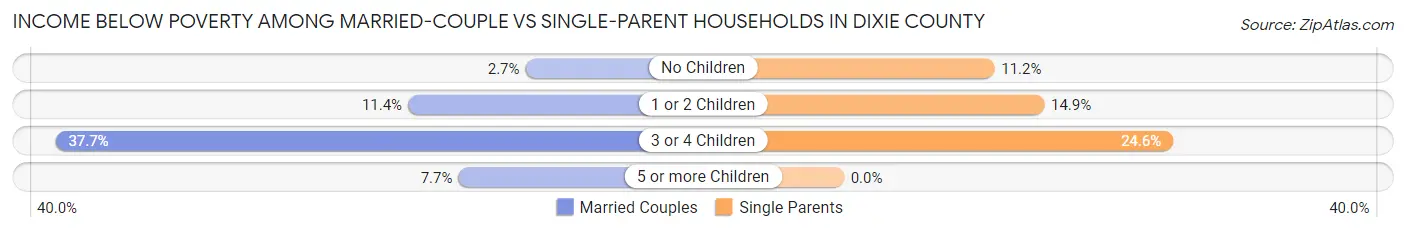
| Children | Married-Couple Families | Single-Parent Households |
| No Children | 62 (2.7%) | 45 (11.2%) |
| 1 or 2 Children | 70 (11.4%) | 63 (14.9%) |
| 3 or 4 Children | 141 (37.7%) | 27 (24.5%) |
| 5 or more Children | 2 (7.7%) | 0 (0.0%) |
| Total | 275 (8.3%) | 135 (14.5%) |
Race in Dixie County
The most populous races in Dixie County are White / Caucasian (14,265 | 85.2%), Black / African American (1,366 | 8.2%), and Two or more Races (897 | 5.4%).
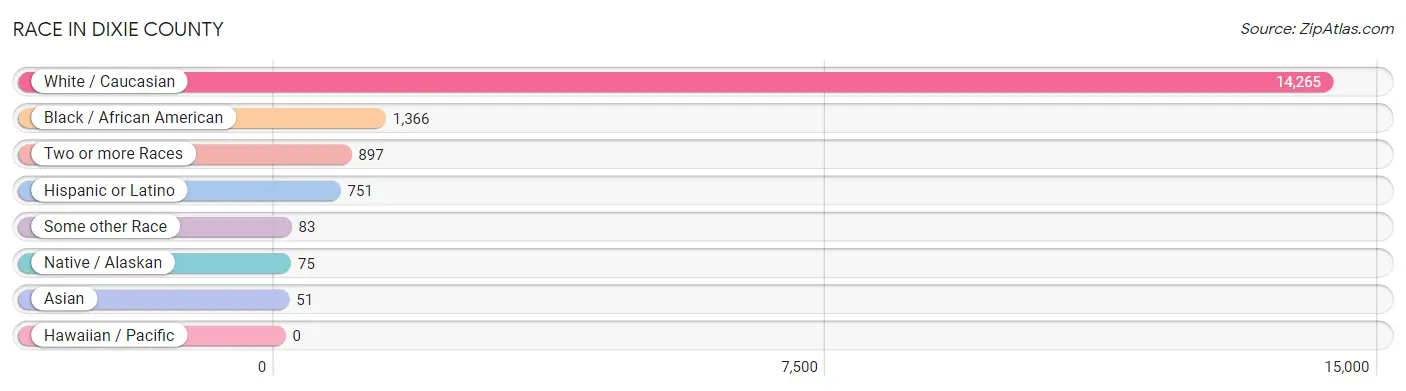
| Race | # Population | % Population |
| Asian | 51 | 0.3% |
| Black / African American | 1,366 | 8.2% |
| Hawaiian / Pacific | 0 | 0.0% |
| Hispanic or Latino | 751 | 4.5% |
| Native / Alaskan | 75 | 0.4% |
| White / Caucasian | 14,265 | 85.2% |
| Two or more Races | 897 | 5.4% |
| Some other Race | 83 | 0.5% |
| Total | 16,737 | 100.0% |
Ancestry in Dixie County
The most populous ancestries reported in Dixie County are English (1,432 | 8.6%), Irish (1,416 | 8.5%), American (1,308 | 7.8%), German (1,235 | 7.4%), and Italian (311 | 1.9%), together accounting for 34.1% of all Dixie County residents.
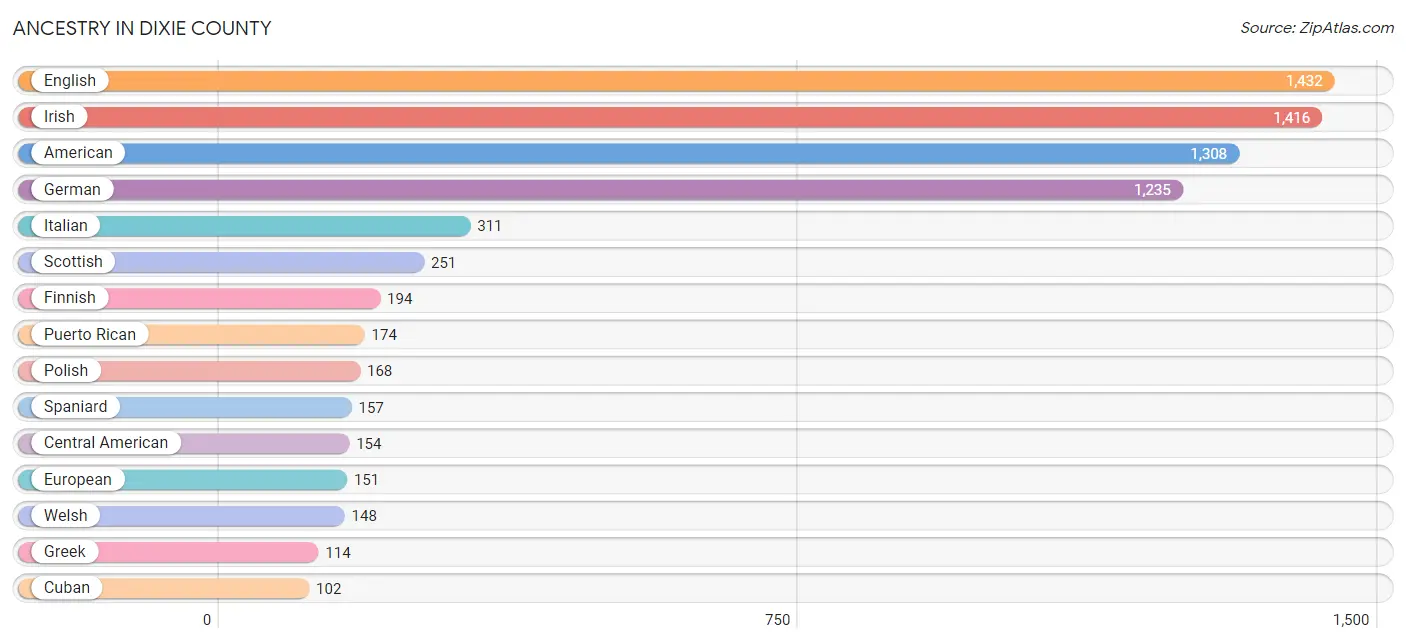
| Ancestry | # Population | % Population |
| African | 4 | 0.0% |
| American | 1,308 | 7.8% |
| Apache | 16 | 0.1% |
| Arab | 1 | 0.0% |
| Bhutanese | 11 | 0.1% |
| Blackfeet | 63 | 0.4% |
| British | 58 | 0.4% |
| Burmese | 34 | 0.2% |
| Canadian | 86 | 0.5% |
| Central American | 154 | 0.9% |
| Cherokee | 68 | 0.4% |
| Chippewa | 60 | 0.4% |
| Creek | 11 | 0.1% |
| Cuban | 102 | 0.6% |
| Czech | 24 | 0.1% |
| Danish | 9 | 0.1% |
| Dominican | 19 | 0.1% |
| Dutch | 46 | 0.3% |
| Eastern European | 29 | 0.2% |
| English | 1,432 | 8.6% |
| European | 151 | 0.9% |
| Finnish | 194 | 1.2% |
| French | 92 | 0.5% |
| French Canadian | 8 | 0.1% |
| German | 1,235 | 7.4% |
| Greek | 114 | 0.7% |
| Guatemalan | 101 | 0.6% |
| Haitian | 59 | 0.4% |
| Honduran | 53 | 0.3% |
| Hungarian | 9 | 0.1% |
| Indian (Asian) | 9 | 0.1% |
| Irish | 1,416 | 8.5% |
| Italian | 311 | 1.9% |
| Jamaican | 10 | 0.1% |
| Korean | 9 | 0.1% |
| Lithuanian | 5 | 0.0% |
| Mexican | 90 | 0.5% |
| Norwegian | 16 | 0.1% |
| Polish | 168 | 1.0% |
| Portuguese | 54 | 0.3% |
| Puerto Rican | 174 | 1.0% |
| Russian | 27 | 0.2% |
| Scandinavian | 20 | 0.1% |
| Scotch-Irish | 78 | 0.5% |
| Scottish | 251 | 1.5% |
| Seminole | 11 | 0.1% |
| Sioux | 16 | 0.1% |
| Slovak | 19 | 0.1% |
| South American | 13 | 0.1% |
| Spaniard | 157 | 0.9% |
| Spanish | 42 | 0.3% |
| Subsaharan African | 4 | 0.0% |
| Swedish | 35 | 0.2% |
| Thai | 52 | 0.3% |
| Venezuelan | 13 | 0.1% |
| Welsh | 148 | 0.9% | View All 56 Rows |
Immigrants in Dixie County
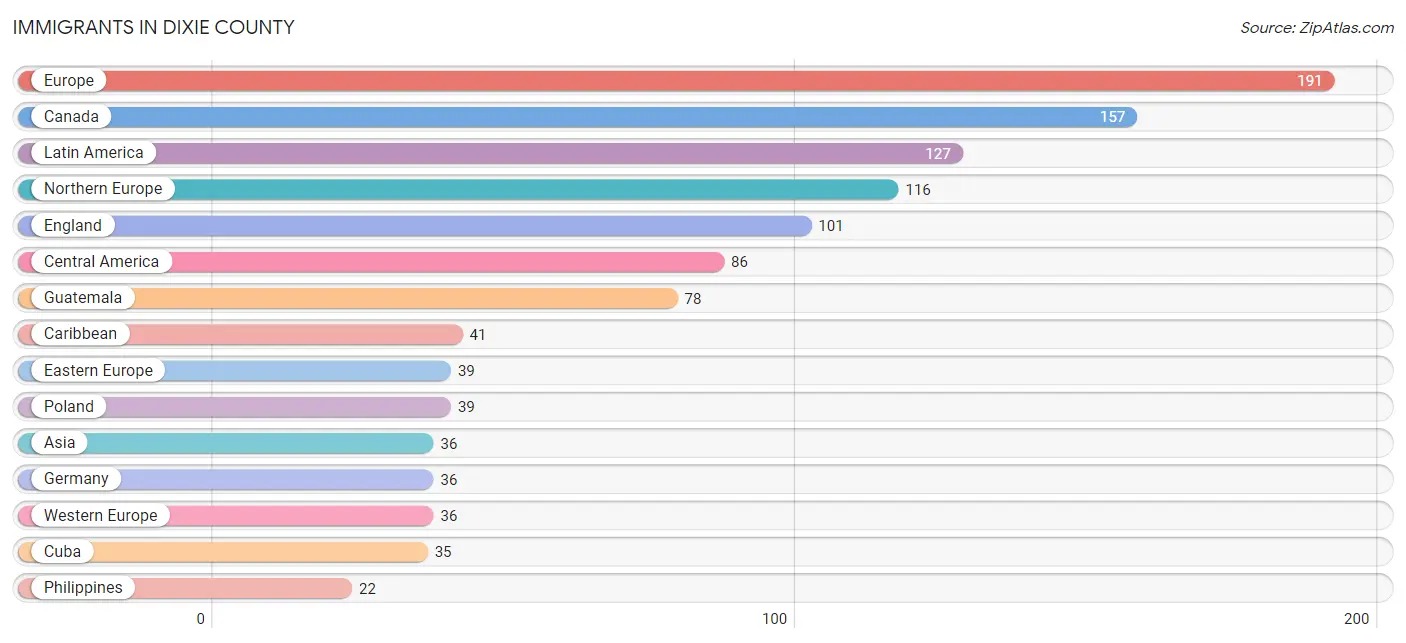
The most numerous immigrant groups reported in Dixie County came from Europe (191 | 1.1%), Canada (157 | 0.9%), Latin America (127 | 0.8%), Northern Europe (116 | 0.7%), and England (101 | 0.6%), together accounting for 4.1% of all Dixie County residents.
| Immigration Origin | # Population | % Population |
| Asia | 36 | 0.2% |
| Canada | 157 | 0.9% |
| Caribbean | 41 | 0.2% |
| Central America | 86 | 0.5% |
| Cuba | 35 | 0.2% |
| Denmark | 9 | 0.1% |
| Eastern Europe | 39 | 0.2% |
| England | 101 | 0.6% |
| Europe | 191 | 1.1% |
| Germany | 36 | 0.2% |
| Guatemala | 78 | 0.5% |
| Haiti | 1 | 0.0% |
| India | 14 | 0.1% |
| Latin America | 127 | 0.8% |
| Mexico | 8 | 0.1% |
| Northern Europe | 116 | 0.7% |
| Philippines | 22 | 0.1% |
| Poland | 39 | 0.2% |
| South Central Asia | 14 | 0.1% |
| South Eastern Asia | 22 | 0.1% |
| Western Europe | 36 | 0.2% | View All 21 Rows |
Sex and Age in Dixie County
Sex and Age in Dixie County
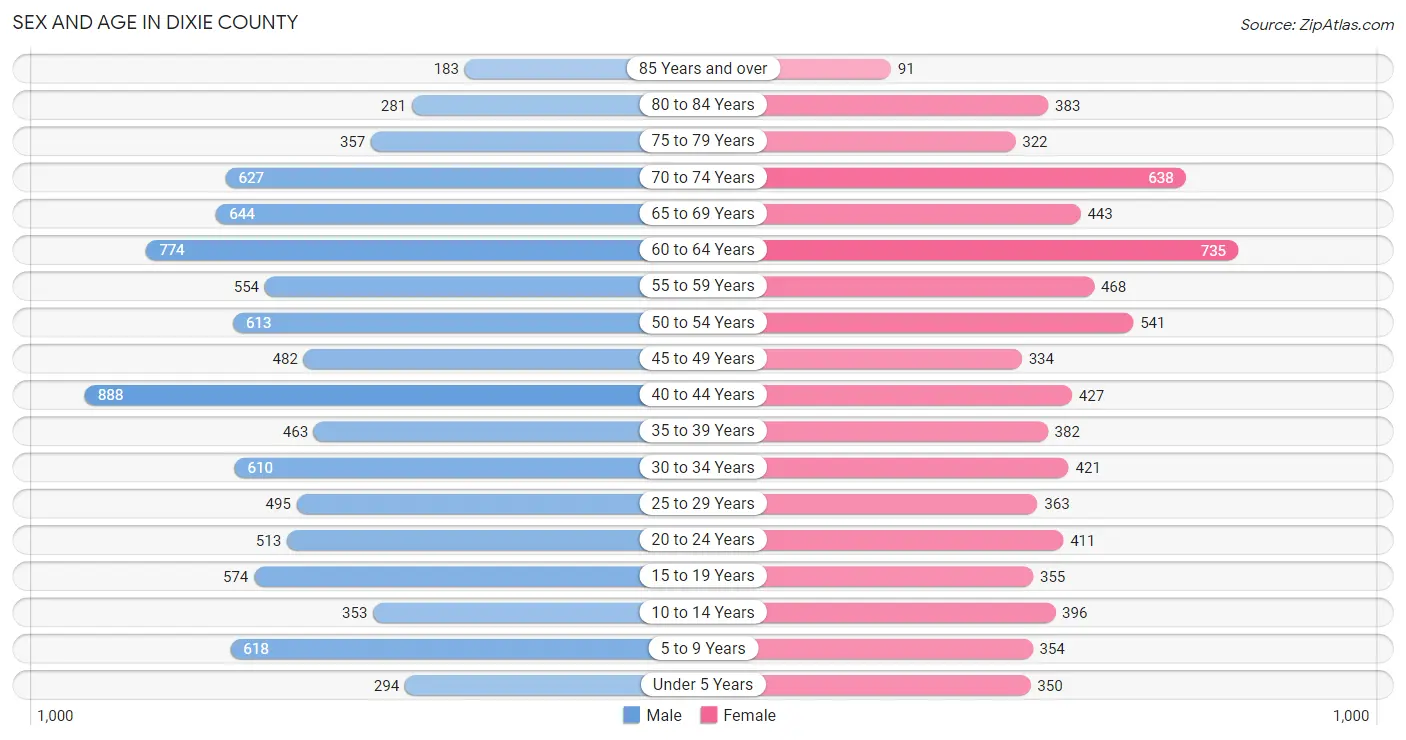
The most populous age groups in Dixie County are 40 to 44 Years (888 | 9.5%) for men and 60 to 64 Years (735 | 9.9%) for women.
| Age Bracket | Male | Female |
| Under 5 Years | 294 (3.2%) | 350 (4.7%) |
| 5 to 9 Years | 618 (6.6%) | 354 (4.8%) |
| 10 to 14 Years | 353 (3.8%) | 396 (5.3%) |
| 15 to 19 Years | 574 (6.2%) | 355 (4.8%) |
| 20 to 24 Years | 513 (5.5%) | 411 (5.5%) |
| 25 to 29 Years | 495 (5.3%) | 363 (4.9%) |
| 30 to 34 Years | 610 (6.5%) | 421 (5.7%) |
| 35 to 39 Years | 463 (5.0%) | 382 (5.1%) |
| 40 to 44 Years | 888 (9.5%) | 427 (5.8%) |
| 45 to 49 Years | 482 (5.2%) | 334 (4.5%) |
| 50 to 54 Years | 613 (6.6%) | 541 (7.3%) |
| 55 to 59 Years | 554 (5.9%) | 468 (6.3%) |
| 60 to 64 Years | 774 (8.3%) | 735 (9.9%) |
| 65 to 69 Years | 644 (6.9%) | 443 (6.0%) |
| 70 to 74 Years | 627 (6.7%) | 638 (8.6%) |
| 75 to 79 Years | 357 (3.8%) | 322 (4.3%) |
| 80 to 84 Years | 281 (3.0%) | 383 (5.2%) |
| 85 Years and over | 183 (2.0%) | 91 (1.2%) |
| Total | 9,323 (100.0%) | 7,414 (100.0%) |
Families and Households in Dixie County
Median Family Size in Dixie County
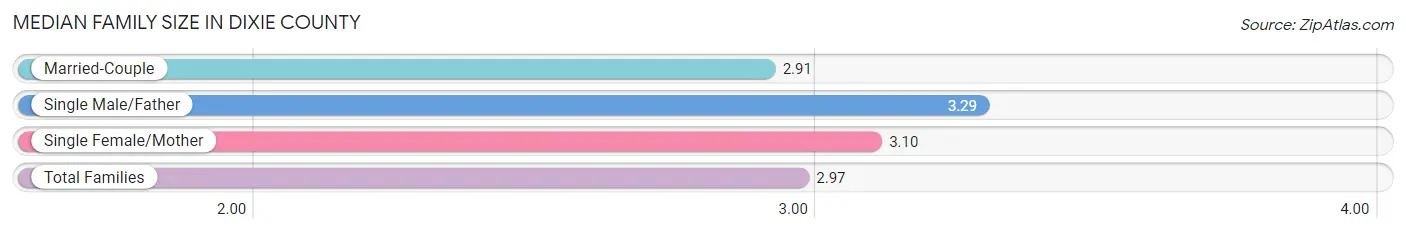
The median family size in Dixie County is 2.97 persons per family, with single male/father families (350 | 8.2%) accounting for the largest median family size of 3.29 persons per family. On the other hand, married-couple families (3,317 | 78.0%) represent the smallest median family size with 2.91 persons per family.
| Family Type | # Families | Family Size |
| Married-Couple | 3,317 (78.0%) | 2.91 |
| Single Male/Father | 350 (8.2%) | 3.29 |
| Single Female/Mother | 583 (13.7%) | 3.10 |
| Total Families | 4,250 (100.0%) | 2.97 |
Median Household Size in Dixie County
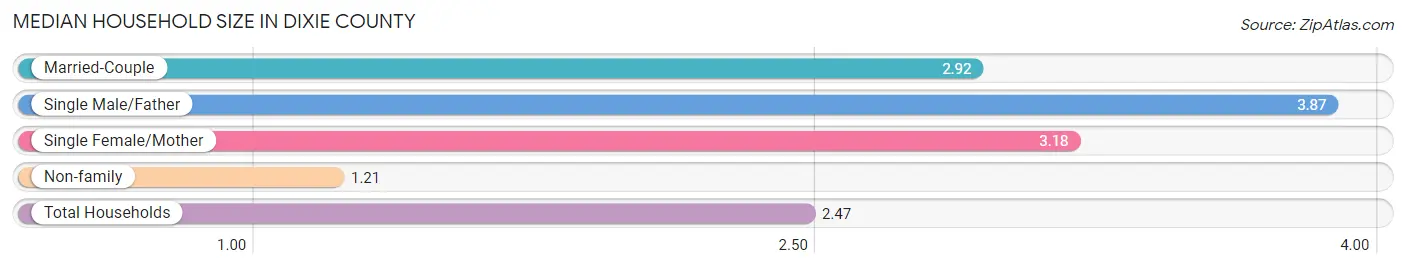
The median household size in Dixie County is 2.47 persons per household, with single male/father households (350 | 5.7%) accounting for the largest median household size of 3.87 persons per household. non-family households (1,914 | 31.0%) represent the smallest median household size with 1.21 persons per household.
| Household Type | # Households | Household Size |
| Married-Couple | 3,317 (53.8%) | 2.92 |
| Single Male/Father | 350 (5.7%) | 3.87 |
| Single Female/Mother | 583 (9.5%) | 3.18 |
| Non-family | 1,914 (31.0%) | 1.21 |
| Total Households | 6,164 (100.0%) | 2.47 |
Household Size by Marriage Status in Dixie County
Out of a total of 6,164 households in Dixie County, 4,250 (69.0%) are family households, while 1,914 (31.0%) are nonfamily households. The most numerous type of family households are 2-person households, comprising 2,042, and the most common type of nonfamily households are 1-person households, comprising 1,641.
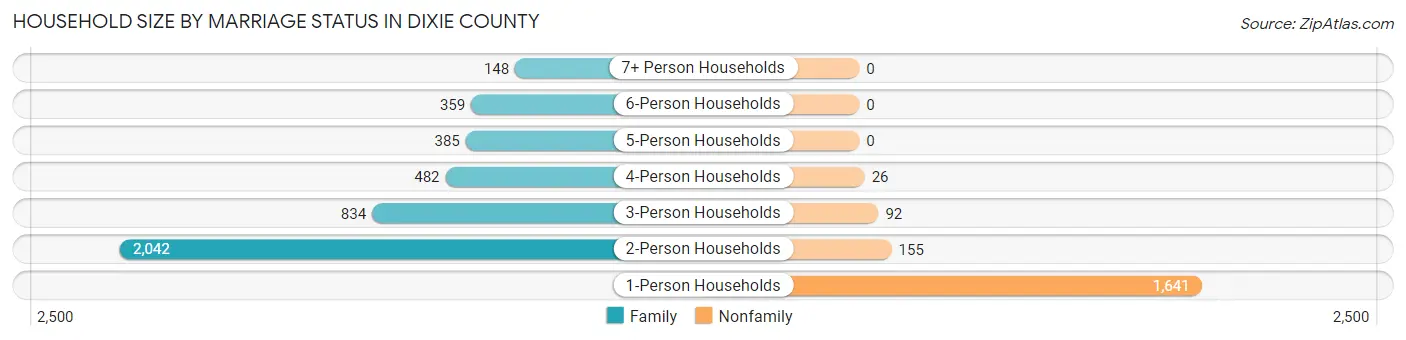
| Household Size | Family Households | Nonfamily Households |
| 1-Person Households | - | 1,641 (26.6%) |
| 2-Person Households | 2,042 (33.1%) | 155 (2.5%) |
| 3-Person Households | 834 (13.5%) | 92 (1.5%) |
| 4-Person Households | 482 (7.8%) | 26 (0.4%) |
| 5-Person Households | 385 (6.2%) | 0 (0.0%) |
| 6-Person Households | 359 (5.8%) | 0 (0.0%) |
| 7+ Person Households | 148 (2.4%) | 0 (0.0%) |
| Total | 4,250 (69.0%) | 1,914 (31.0%) |
Female Fertility in Dixie County
Fertility by Age in Dixie County
Average fertility rate in Dixie County is 73.0 births per 1,000 women. Women in the age bracket of 20 to 34 years have the highest fertility rate with 168.0 births per 1,000 women. Women in the age bracket of 20 to 34 years acount for 100.0% of all women with births.
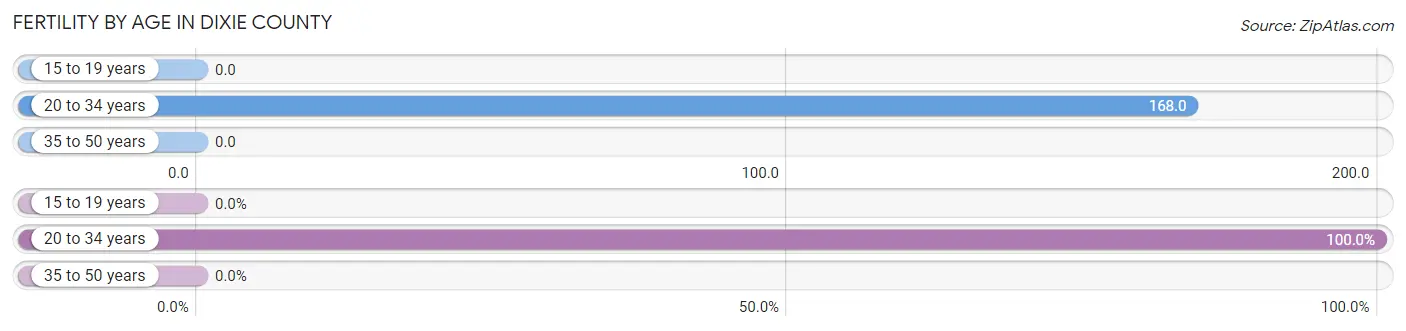
| Age Bracket | Women with Births | Births / 1,000 Women |
| 15 to 19 years | 0 (0.0%) | 0.0 |
| 20 to 34 years | 201 (100.0%) | 168.0 |
| 35 to 50 years | 0 (0.0%) | 0.0 |
| Total | 201 (100.0%) | 73.0 |
Fertility by Age by Marriage Status in Dixie County
85.1% of women with births (201) in Dixie County are married. The highest percentage of unmarried women with births falls into 20 to 34 years age bracket with 14.9% of them unmarried at the time of birth, while the lowest percentage of unmarried women with births belong to 20 to 34 years age bracket with 14.9% of them unmarried.
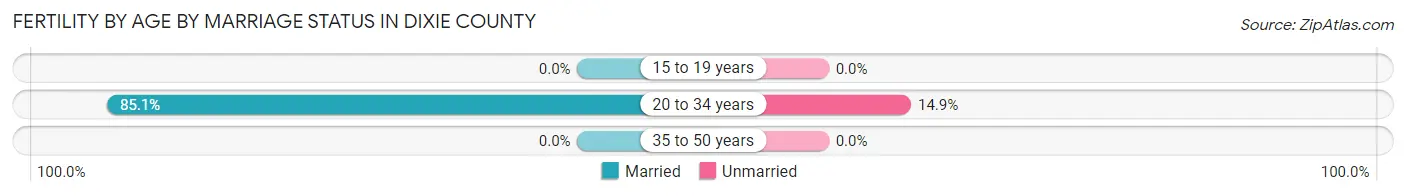
| Age Bracket | Married | Unmarried |
| 15 to 19 years | 0 (0.0%) | 0 (0.0%) |
| 20 to 34 years | 171 (85.1%) | 30 (14.9%) |
| 35 to 50 years | 0 (0.0%) | 0 (0.0%) |
| Total | 171 (85.1%) | 30 (14.9%) |
Fertility by Education in Dixie County
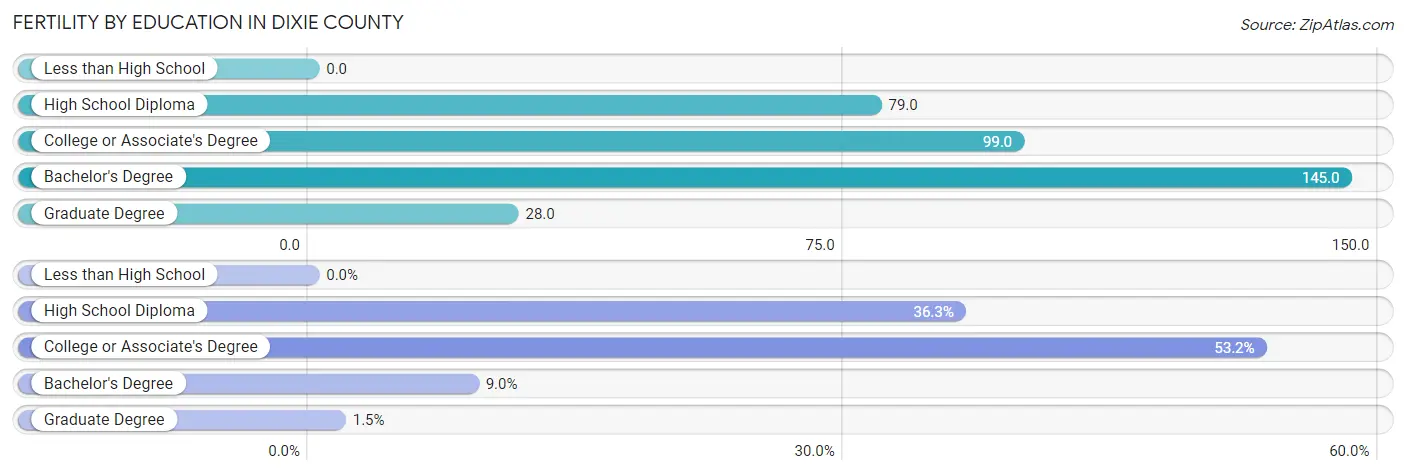
| Educational Attainment | Women with Births | Births / 1,000 Women |
| Less than High School | 0 (0.0%) | 0.0 |
| High School Diploma | 73 (36.3%) | 79.0 |
| College or Associate's Degree | 107 (53.2%) | 99.0 |
| Bachelor's Degree | 18 (9.0%) | 145.0 |
| Graduate Degree | 3 (1.5%) | 28.0 |
| Total | 201 (100.0%) | 73.0 |
Fertility by Education by Marriage Status in Dixie County
14.9% of women with births in Dixie County are unmarried. Women with the educational attainment of high school diploma are most likely to be married with 100.0% of them married at childbirth, while women with the educational attainment of graduate degree are least likely to be married with 100.0% of them unmarried at childbirth.
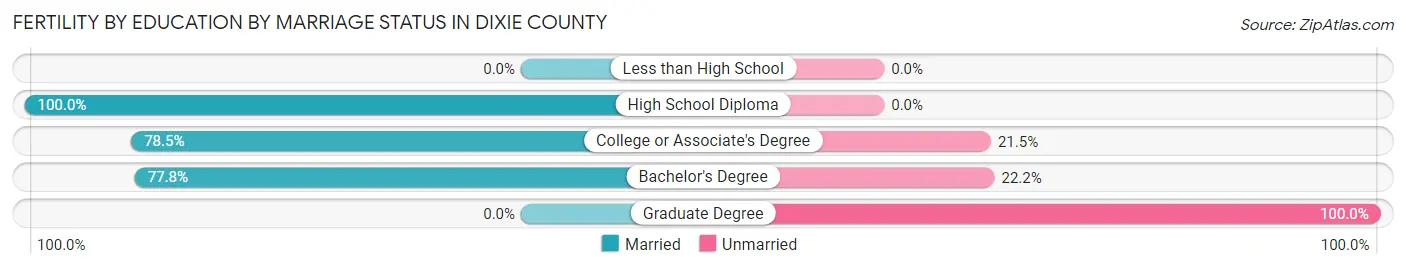
| Educational Attainment | Married | Unmarried |
| Less than High School | 0 (0.0%) | 0 (0.0%) |
| High School Diploma | 73 (100.0%) | 0 (0.0%) |
| College or Associate's Degree | 84 (78.5%) | 23 (21.5%) |
| Bachelor's Degree | 14 (77.8%) | 4 (22.2%) |
| Graduate Degree | 0 (0.0%) | 3 (100.0%) |
| Total | 171 (85.1%) | 30 (14.9%) |
Employment Characteristics in Dixie County
Employment by Class of Employer in Dixie County
Among the 5,345 employed individuals in Dixie County, private company employees (3,399 | 63.6%), self-employed (not incorporated) (618 | 11.6%), and local government employees (468 | 8.8%) make up the most common classes of employment.
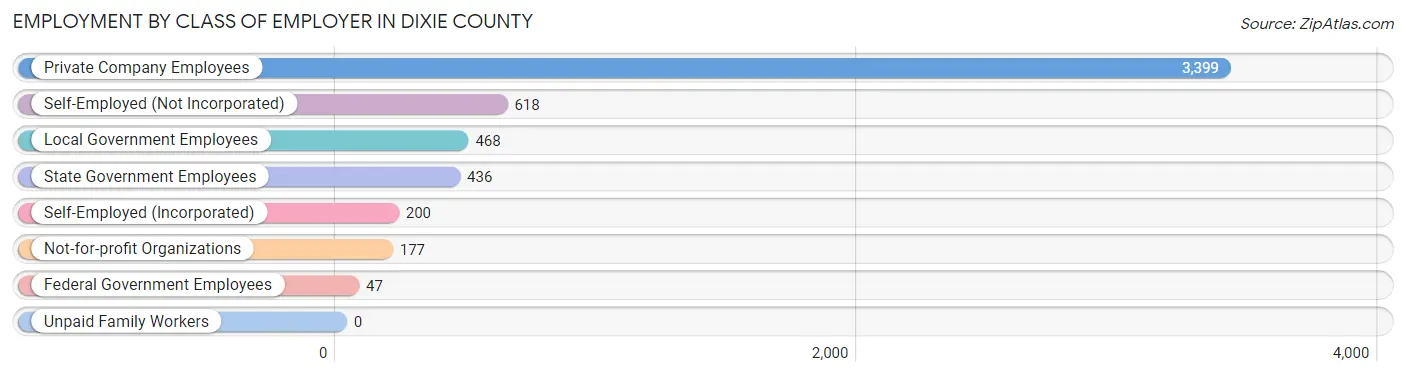
| Employer Class | # Employees | % Employees |
| Private Company Employees | 3,399 | 63.6% |
| Self-Employed (Incorporated) | 200 | 3.7% |
| Self-Employed (Not Incorporated) | 618 | 11.6% |
| Not-for-profit Organizations | 177 | 3.3% |
| Local Government Employees | 468 | 8.8% |
| State Government Employees | 436 | 8.2% |
| Federal Government Employees | 47 | 0.9% |
| Unpaid Family Workers | 0 | 0.0% |
| Total | 5,345 | 100.0% |
Employment Status by Age in Dixie County
According to the labor force statistics for Dixie County, out of the total population over 16 years of age (14,143), 40.6% or 5,742 individuals are in the labor force, with 5.1% or 293 of them unemployed. The age group with the highest labor force participation rate is 20 to 24 years, with 67.2% or 621 individuals in the labor force. Within the labor force, the 30 to 34 years age range has the highest percentage of unemployed individuals, with 19.8% or 117 of them being unemployed.
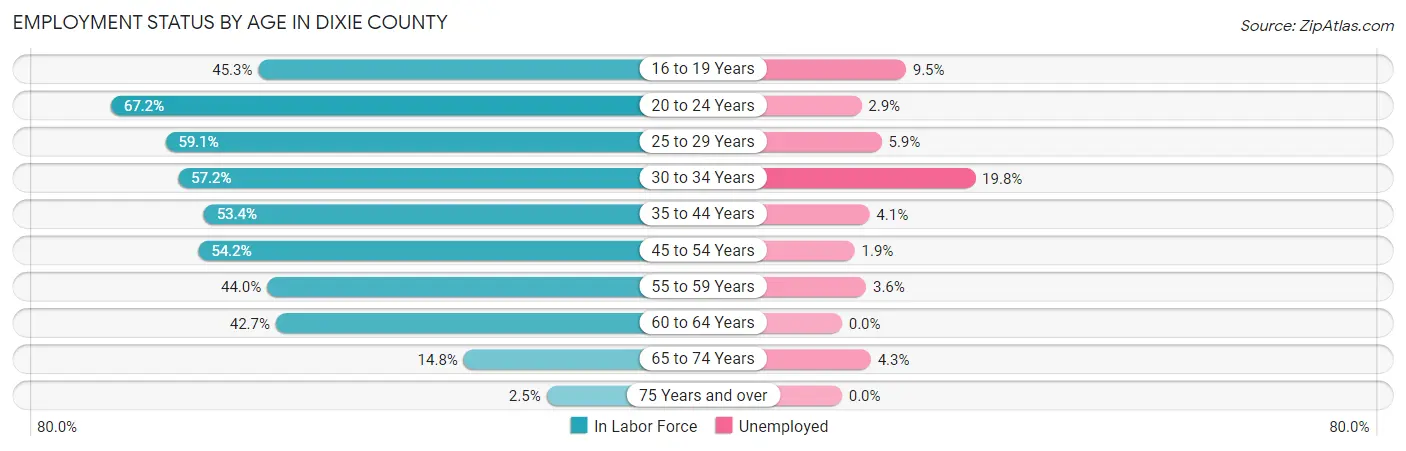
| Age Bracket | In Labor Force | Unemployed |
| 16 to 19 Years | 317 (45.3%) | 30 (9.5%) |
| 20 to 24 Years | 621 (67.2%) | 18 (2.9%) |
| 25 to 29 Years | 507 (59.1%) | 30 (5.9%) |
| 30 to 34 Years | 590 (57.2%) | 117 (19.8%) |
| 35 to 44 Years | 1,153 (53.4%) | 47 (4.1%) |
| 45 to 54 Years | 1,068 (54.2%) | 20 (1.9%) |
| 55 to 59 Years | 450 (44.0%) | 16 (3.6%) |
| 60 to 64 Years | 644 (42.7%) | 0 (0.0%) |
| 65 to 74 Years | 348 (14.8%) | 15 (4.3%) |
| 75 Years and over | 40 (2.5%) | 0 (0.0%) |
| Total | 5,742 (40.6%) | 293 (5.1%) |
Employment Status by Educational Attainment in Dixie County
According to labor force statistics for Dixie County, 51.6% of individuals (4,412) out of the total population between 25 and 64 years of age (8,550) are in the labor force, with 5.2% or 229 of them being unemployed. The group with the highest labor force participation rate are those with the educational attainment of college / associate degree, with 57.4% or 1,306 individuals in the labor force. Within the labor force, individuals with less than high school education have the highest percentage of unemployment, with 9.8% or 73 of them being unemployed.
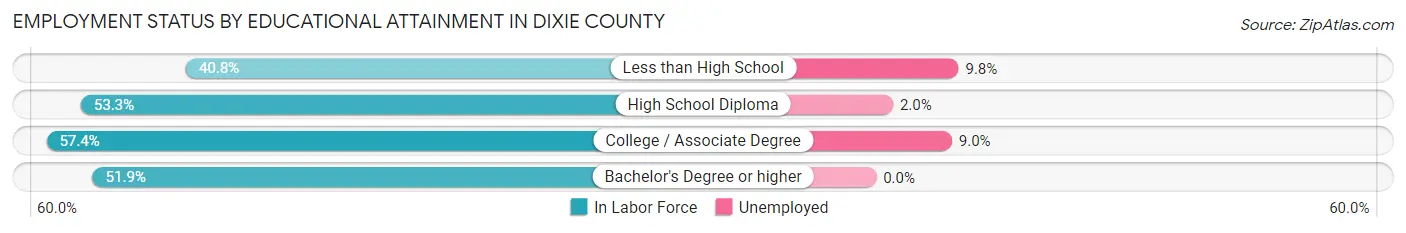
| Educational Attainment | In Labor Force | Unemployed |
| Less than High School | 743 (40.8%) | 178 (9.8%) |
| High School Diploma | 2,042 (53.3%) | 77 (2.0%) |
| College / Associate Degree | 1,306 (57.4%) | 205 (9.0%) |
| Bachelor's Degree or higher | 323 (51.9%) | 0 (0.0%) |
| Total | 4,412 (51.6%) | 445 (5.2%) |
Employment Occupations by Sex in Dixie County
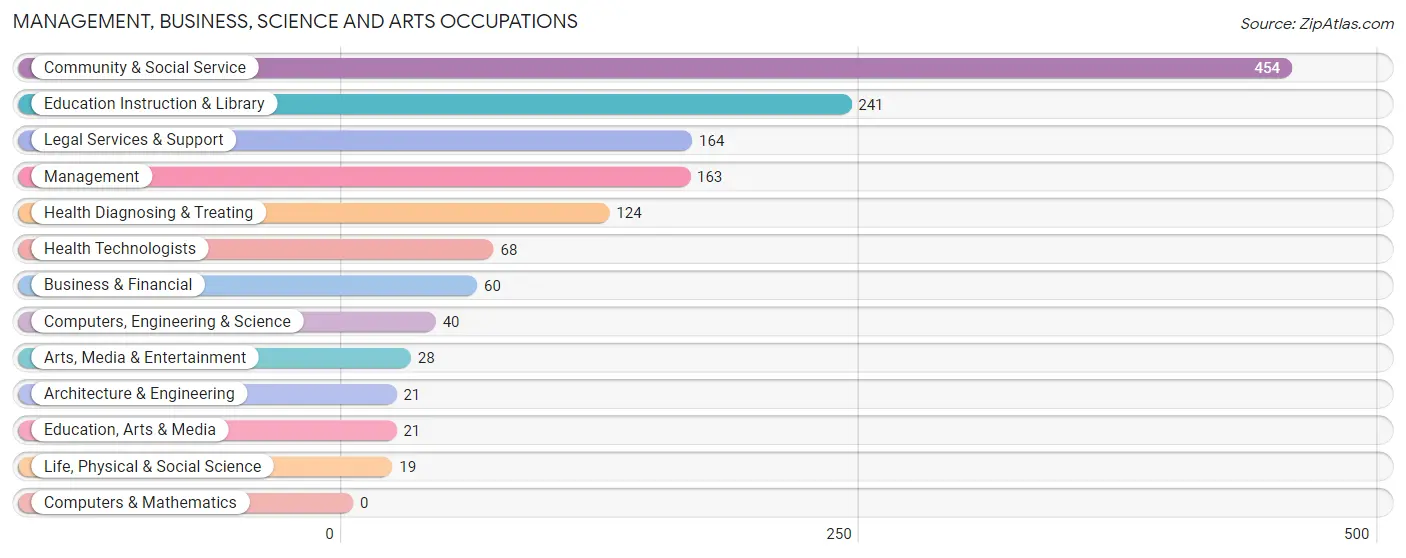
Management, Business, Science and Arts Occupations
The most common Management, Business, Science and Arts occupations in Dixie County are Community & Social Service (454 | 8.3%), Education Instruction & Library (241 | 4.4%), Legal Services & Support (164 | 3.0%), Management (163 | 3.0%), and Health Diagnosing & Treating (124 | 2.3%).
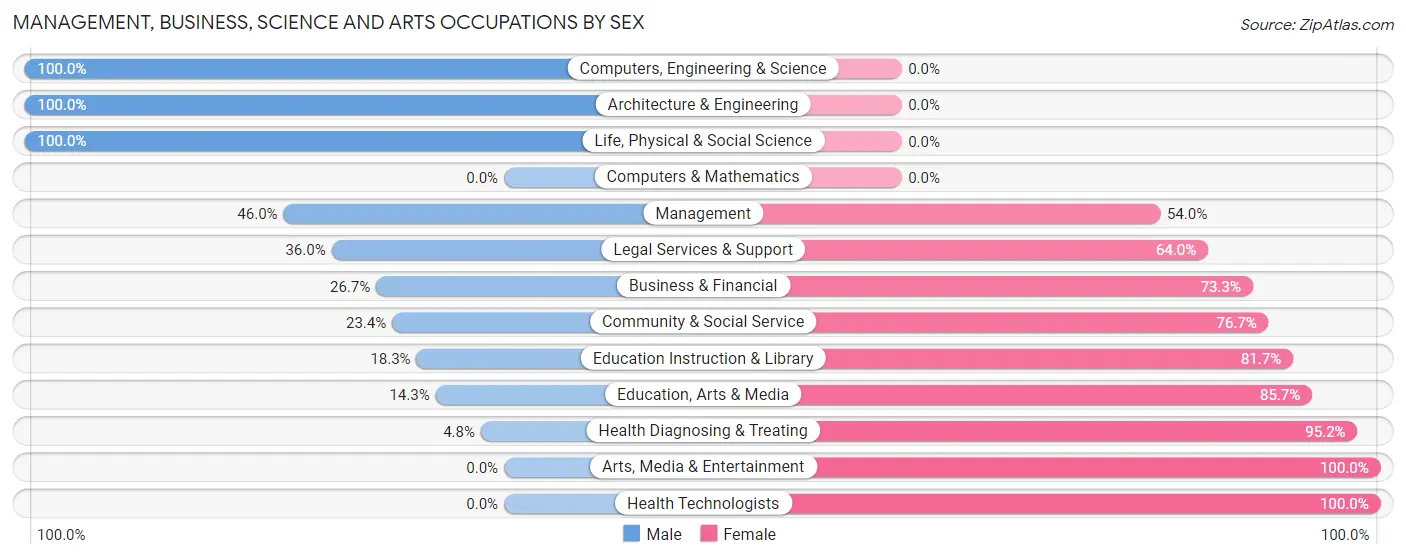
Management, Business, Science and Arts Occupations by Sex
Within the Management, Business, Science and Arts occupations in Dixie County, the most male-oriented occupations are Computers, Engineering & Science (100.0%), Architecture & Engineering (100.0%), and Life, Physical & Social Science (100.0%), while the most female-oriented occupations are Arts, Media & Entertainment (100.0%), Health Technologists (100.0%), and Health Diagnosing & Treating (95.2%).
| Occupation | Male | Female |
| Management | 75 (46.0%) | 88 (54.0%) |
| Business & Financial | 16 (26.7%) | 44 (73.3%) |
| Computers, Engineering & Science | 40 (100.0%) | 0 (0.0%) |
| Computers & Mathematics | 0 (0.0%) | 0 (0.0%) |
| Architecture & Engineering | 21 (100.0%) | 0 (0.0%) |
| Life, Physical & Social Science | 19 (100.0%) | 0 (0.0%) |
| Community & Social Service | 106 (23.4%) | 348 (76.6%) |
| Education, Arts & Media | 3 (14.3%) | 18 (85.7%) |
| Legal Services & Support | 59 (36.0%) | 105 (64.0%) |
| Education Instruction & Library | 44 (18.3%) | 197 (81.7%) |
| Arts, Media & Entertainment | 0 (0.0%) | 28 (100.0%) |
| Health Diagnosing & Treating | 6 (4.8%) | 118 (95.2%) |
| Health Technologists | 0 (0.0%) | 68 (100.0%) |
| Total (Category) | 243 (28.9%) | 598 (71.1%) |
| Total (Overall) | 2,679 (49.2%) | 2,768 (50.8%) |
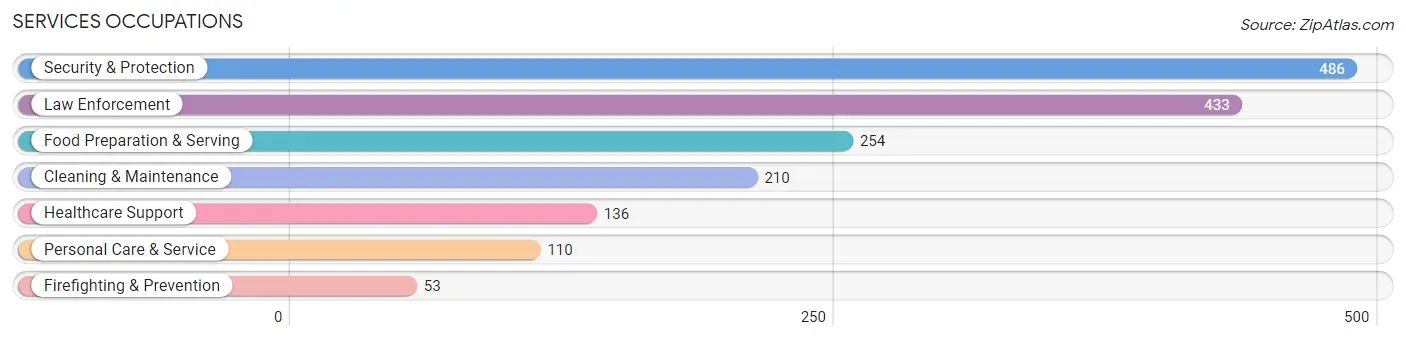
Services Occupations
The most common Services occupations in Dixie County are Security & Protection (486 | 8.9%), Law Enforcement (433 | 8.0%), Food Preparation & Serving (254 | 4.7%), Cleaning & Maintenance (210 | 3.9%), and Healthcare Support (136 | 2.5%).
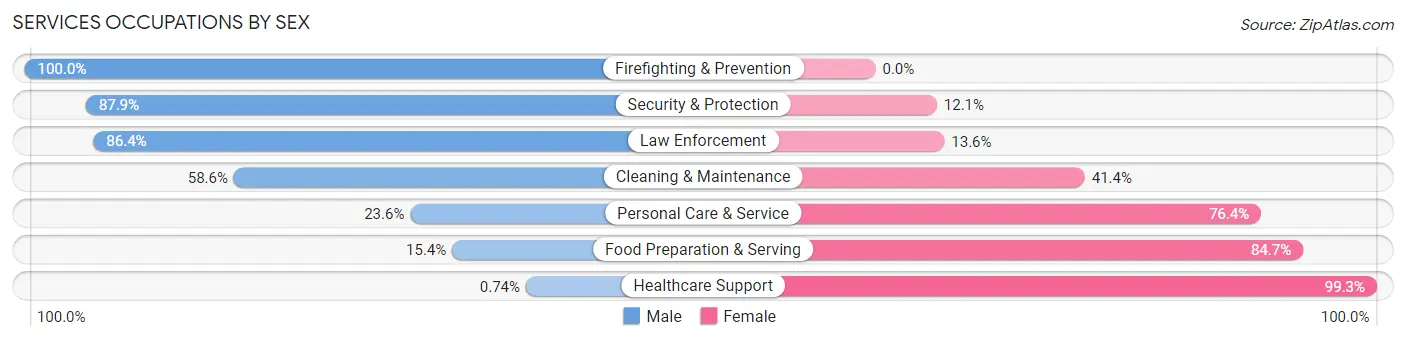
Services Occupations by Sex
Within the Services occupations in Dixie County, the most male-oriented occupations are Firefighting & Prevention (100.0%), Security & Protection (87.9%), and Law Enforcement (86.4%), while the most female-oriented occupations are Healthcare Support (99.3%), Food Preparation & Serving (84.7%), and Personal Care & Service (76.4%).
| Occupation | Male | Female |
| Healthcare Support | 1 (0.7%) | 135 (99.3%) |
| Security & Protection | 427 (87.9%) | 59 (12.1%) |
| Firefighting & Prevention | 53 (100.0%) | 0 (0.0%) |
| Law Enforcement | 374 (86.4%) | 59 (13.6%) |
| Food Preparation & Serving | 39 (15.3%) | 215 (84.7%) |
| Cleaning & Maintenance | 123 (58.6%) | 87 (41.4%) |
| Personal Care & Service | 26 (23.6%) | 84 (76.4%) |
| Total (Category) | 616 (51.5%) | 580 (48.5%) |
| Total (Overall) | 2,679 (49.2%) | 2,768 (50.8%) |
Sales and Office Occupations
The most common Sales and Office occupations in Dixie County are Office & Administration (1,038 | 19.1%), and Sales & Related (645 | 11.8%).
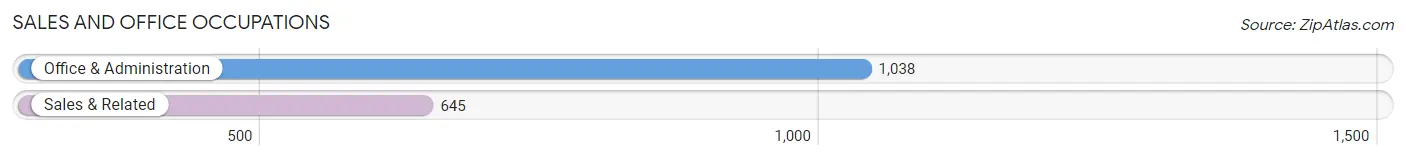
Sales and Office Occupations by Sex
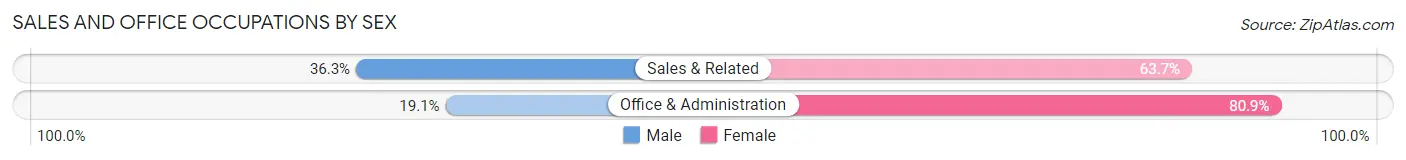
| Occupation | Male | Female |
| Sales & Related | 234 (36.3%) | 411 (63.7%) |
| Office & Administration | 198 (19.1%) | 840 (80.9%) |
| Total (Category) | 432 (25.7%) | 1,251 (74.3%) |
| Total (Overall) | 2,679 (49.2%) | 2,768 (50.8%) |
Natural Resources, Construction and Maintenance Occupations
The most common Natural Resources, Construction and Maintenance occupations in Dixie County are Construction & Extraction (342 | 6.3%), Installation, Maintenance & Repair (282 | 5.2%), and Farming, Fishing & Forestry (80 | 1.5%).
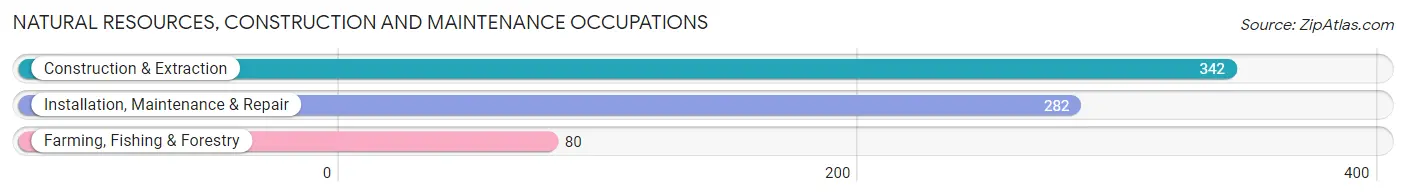
Natural Resources, Construction and Maintenance Occupations by Sex
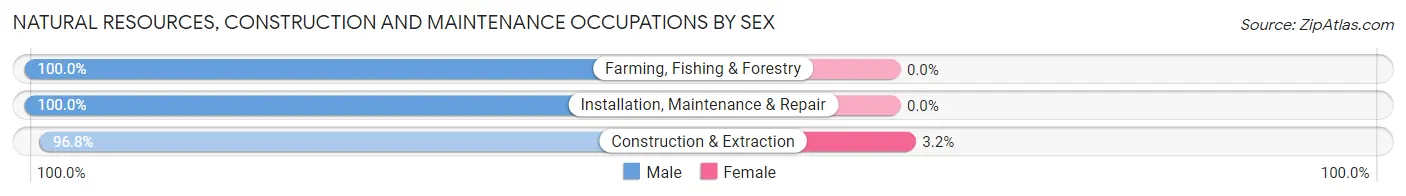
| Occupation | Male | Female |
| Farming, Fishing & Forestry | 80 (100.0%) | 0 (0.0%) |
| Construction & Extraction | 331 (96.8%) | 11 (3.2%) |
| Installation, Maintenance & Repair | 282 (100.0%) | 0 (0.0%) |
| Total (Category) | 693 (98.4%) | 11 (1.6%) |
| Total (Overall) | 2,679 (49.2%) | 2,768 (50.8%) |
Production, Transportation and Moving Occupations
The most common Production, Transportation and Moving occupations in Dixie County are Production (396 | 7.3%), Transportation (395 | 7.2%), and Material Moving (232 | 4.3%).
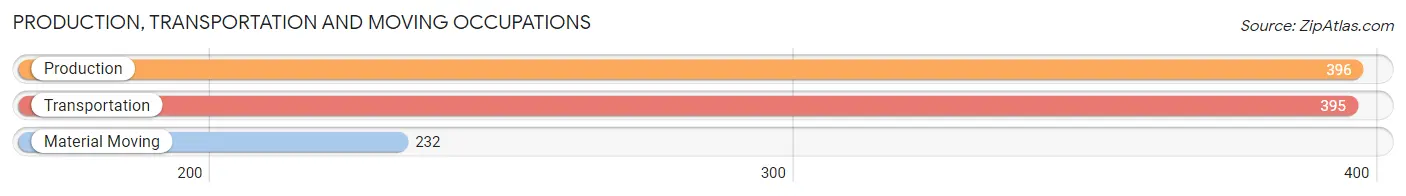
Production, Transportation and Moving Occupations by Sex
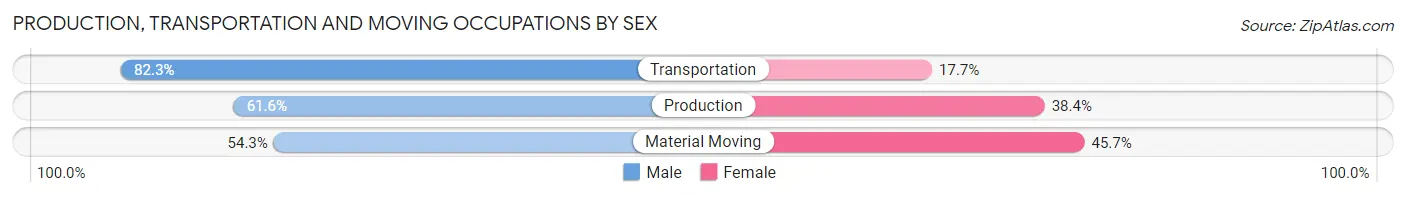
| Occupation | Male | Female |
| Production | 244 (61.6%) | 152 (38.4%) |
| Transportation | 325 (82.3%) | 70 (17.7%) |
| Material Moving | 126 (54.3%) | 106 (45.7%) |
| Total (Category) | 695 (67.9%) | 328 (32.1%) |
| Total (Overall) | 2,679 (49.2%) | 2,768 (50.8%) |
Employment Industries by Sex in Dixie County
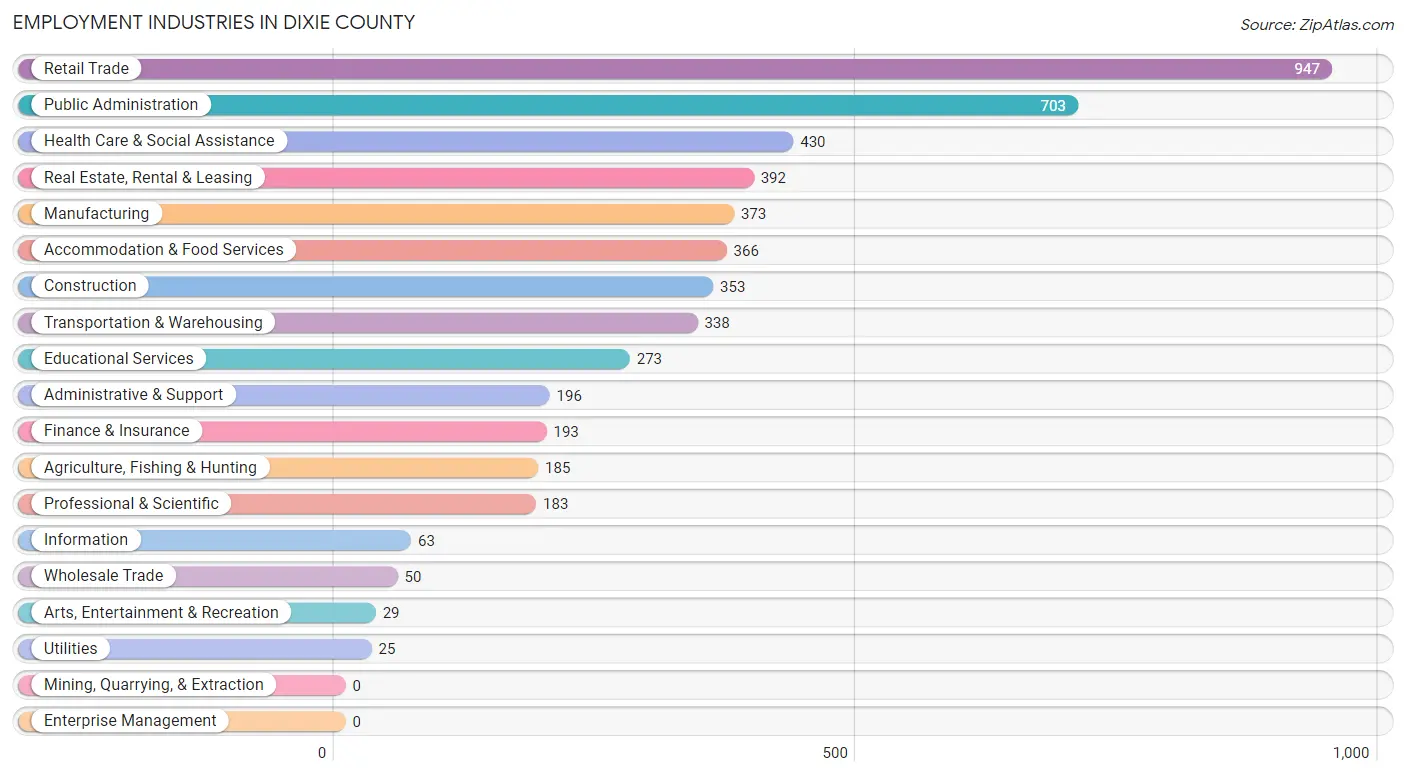
Employment Industries in Dixie County
The major employment industries in Dixie County include Retail Trade (947 | 17.4%), Public Administration (703 | 12.9%), Health Care & Social Assistance (430 | 7.9%), Real Estate, Rental & Leasing (392 | 7.2%), and Manufacturing (373 | 6.9%).
Employment Industries by Sex in Dixie County
The Dixie County industries that see more men than women are Agriculture, Fishing & Hunting (100.0%), Utilities (100.0%), and Arts, Entertainment & Recreation (100.0%), whereas the industries that tend to have a higher number of women are Information (100.0%), Real Estate, Rental & Leasing (93.1%), and Health Care & Social Assistance (86.7%).
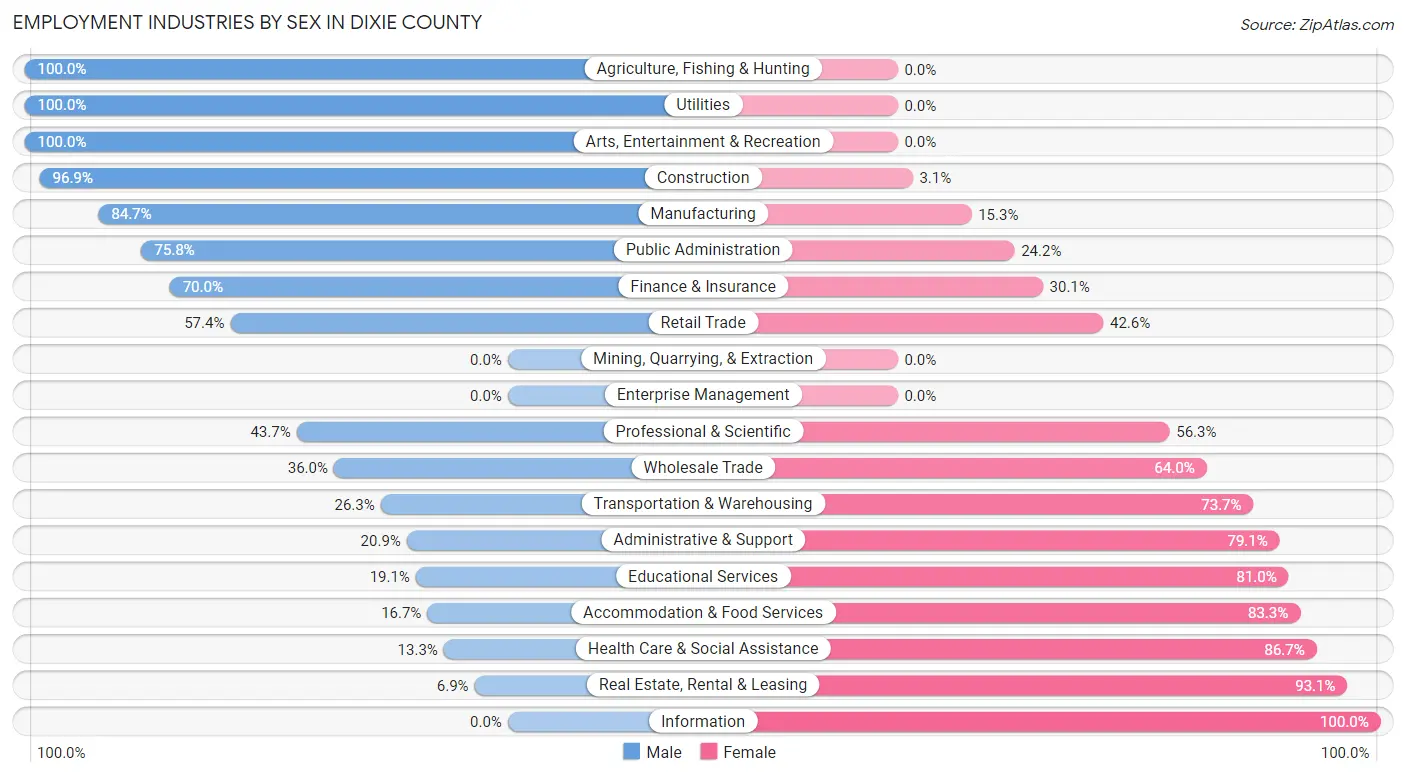
| Industry | Male | Female |
| Agriculture, Fishing & Hunting | 185 (100.0%) | 0 (0.0%) |
| Mining, Quarrying, & Extraction | 0 (0.0%) | 0 (0.0%) |
| Construction | 342 (96.9%) | 11 (3.1%) |
| Manufacturing | 316 (84.7%) | 57 (15.3%) |
| Wholesale Trade | 18 (36.0%) | 32 (64.0%) |
| Retail Trade | 544 (57.4%) | 403 (42.6%) |
| Transportation & Warehousing | 89 (26.3%) | 249 (73.7%) |
| Utilities | 25 (100.0%) | 0 (0.0%) |
| Information | 0 (0.0%) | 63 (100.0%) |
| Finance & Insurance | 135 (70.0%) | 58 (30.0%) |
| Real Estate, Rental & Leasing | 27 (6.9%) | 365 (93.1%) |
| Professional & Scientific | 80 (43.7%) | 103 (56.3%) |
| Enterprise Management | 0 (0.0%) | 0 (0.0%) |
| Administrative & Support | 41 (20.9%) | 155 (79.1%) |
| Educational Services | 52 (19.1%) | 221 (80.9%) |
| Health Care & Social Assistance | 57 (13.3%) | 373 (86.7%) |
| Arts, Entertainment & Recreation | 29 (100.0%) | 0 (0.0%) |
| Accommodation & Food Services | 61 (16.7%) | 305 (83.3%) |
| Public Administration | 533 (75.8%) | 170 (24.2%) |
| Total | 2,679 (49.2%) | 2,768 (50.8%) |
Education in Dixie County
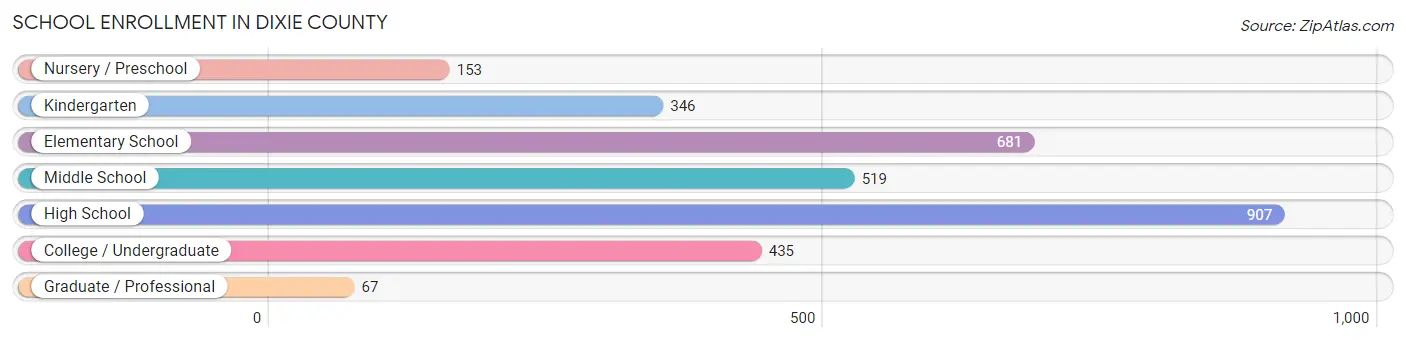
School Enrollment in Dixie County
The most common levels of schooling among the 3,108 students in Dixie County are high school (907 | 29.2%), elementary school (681 | 21.9%), and middle school (519 | 16.7%).
| School Level | # Students | % Students |
| Nursery / Preschool | 153 | 4.9% |
| Kindergarten | 346 | 11.1% |
| Elementary School | 681 | 21.9% |
| Middle School | 519 | 16.7% |
| High School | 907 | 29.2% |
| College / Undergraduate | 435 | 14.0% |
| Graduate / Professional | 67 | 2.2% |
| Total | 3,108 | 100.0% |
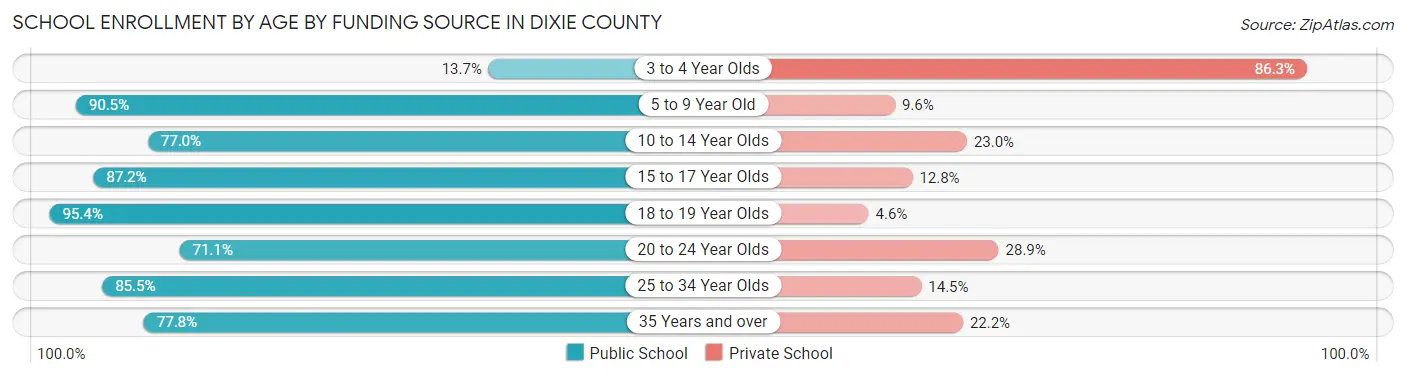
School Enrollment by Age by Funding Source in Dixie County
Out of a total of 3,108 students who are enrolled in schools in Dixie County, 550 (17.7%) attend a private institution, while the remaining 2,558 (82.3%) are enrolled in public schools. The age group of 3 to 4 year olds has the highest likelihood of being enrolled in private schools, with 88 (86.3% in the age bracket) enrolled. Conversely, the age group of 18 to 19 year olds has the lowest likelihood of being enrolled in a private school, with 226 (95.4% in the age bracket) attending a public institution.
| Age Bracket | Public School | Private School |
| 3 to 4 Year Olds | 14 (13.7%) | 88 (86.3%) |
| 5 to 9 Year Old | 871 (90.4%) | 92 (9.6%) |
| 10 to 14 Year Olds | 577 (77.0%) | 172 (23.0%) |
| 15 to 17 Year Olds | 531 (87.2%) | 78 (12.8%) |
| 18 to 19 Year Olds | 226 (95.4%) | 11 (4.6%) |
| 20 to 24 Year Olds | 175 (71.1%) | 71 (28.9%) |
| 25 to 34 Year Olds | 65 (85.5%) | 11 (14.5%) |
| 35 Years and over | 98 (77.8%) | 28 (22.2%) |
| Total | 2,558 (82.3%) | 550 (17.7%) |
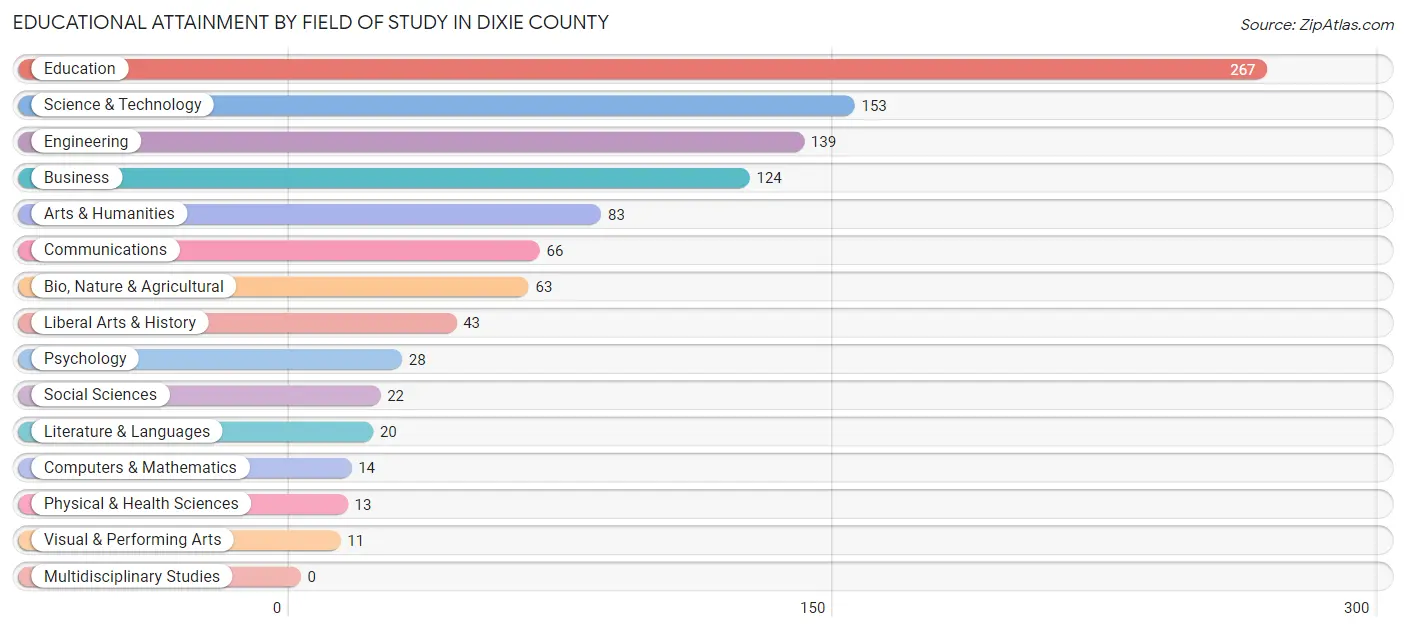
Educational Attainment by Field of Study in Dixie County
Education (267 | 25.5%), science & technology (153 | 14.6%), engineering (139 | 13.3%), business (124 | 11.8%), and arts & humanities (83 | 7.9%) are the most common fields of study among 1,046 individuals in Dixie County who have obtained a bachelor's degree or higher.
| Field of Study | # Graduates | % Graduates |
| Computers & Mathematics | 14 | 1.3% |
| Bio, Nature & Agricultural | 63 | 6.0% |
| Physical & Health Sciences | 13 | 1.2% |
| Psychology | 28 | 2.7% |
| Social Sciences | 22 | 2.1% |
| Engineering | 139 | 13.3% |
| Multidisciplinary Studies | 0 | 0.0% |
| Science & Technology | 153 | 14.6% |
| Business | 124 | 11.8% |
| Education | 267 | 25.5% |
| Literature & Languages | 20 | 1.9% |
| Liberal Arts & History | 43 | 4.1% |
| Visual & Performing Arts | 11 | 1.1% |
| Communications | 66 | 6.3% |
| Arts & Humanities | 83 | 7.9% |
| Total | 1,046 | 100.0% |
Transportation & Commute in Dixie County
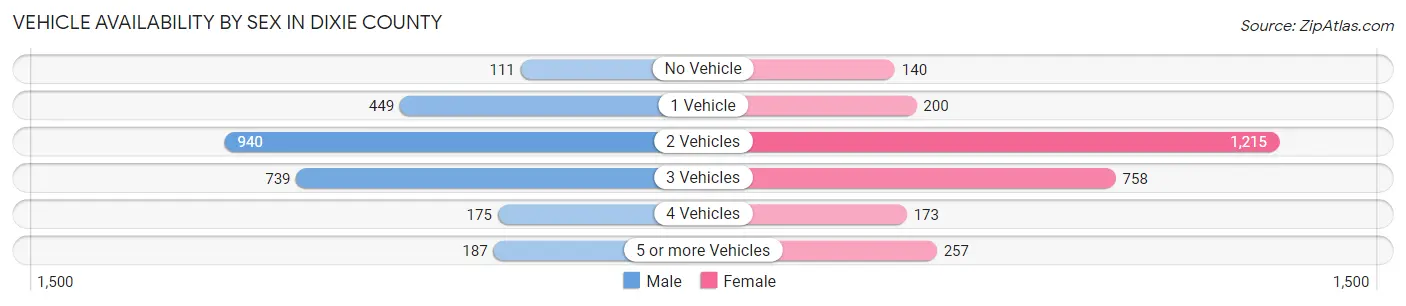
Vehicle Availability by Sex in Dixie County
The most prevalent vehicle ownership categories in Dixie County are males with 2 vehicles (940, accounting for 36.1%) and females with 2 vehicles (1,215, making up 34.3%).
| Vehicles Available | Male | Female |
| No Vehicle | 111 (4.3%) | 140 (5.1%) |
| 1 Vehicle | 449 (17.3%) | 200 (7.3%) |
| 2 Vehicles | 940 (36.1%) | 1,215 (44.3%) |
| 3 Vehicles | 739 (28.4%) | 758 (27.6%) |
| 4 Vehicles | 175 (6.7%) | 173 (6.3%) |
| 5 or more Vehicles | 187 (7.2%) | 257 (9.4%) |
| Total | 2,601 (100.0%) | 2,743 (100.0%) |
Commute Time in Dixie County
The most frequently occuring commute durations in Dixie County are 20 to 24 minutes (982 commuters, 19.7%), 15 to 19 minutes (865 commuters, 17.3%), and 5 to 9 minutes (709 commuters, 14.2%).
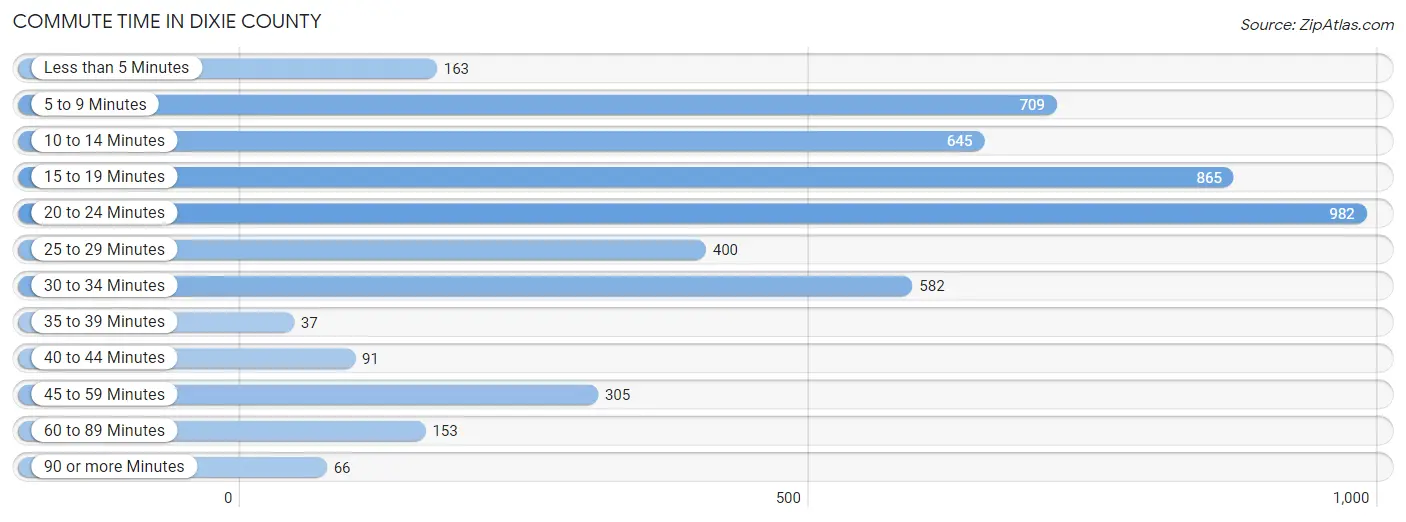
| Commute Time | # Commuters | % Commuters |
| Less than 5 Minutes | 163 | 3.3% |
| 5 to 9 Minutes | 709 | 14.2% |
| 10 to 14 Minutes | 645 | 12.9% |
| 15 to 19 Minutes | 865 | 17.3% |
| 20 to 24 Minutes | 982 | 19.7% |
| 25 to 29 Minutes | 400 | 8.0% |
| 30 to 34 Minutes | 582 | 11.6% |
| 35 to 39 Minutes | 37 | 0.7% |
| 40 to 44 Minutes | 91 | 1.8% |
| 45 to 59 Minutes | 305 | 6.1% |
| 60 to 89 Minutes | 153 | 3.1% |
| 90 or more Minutes | 66 | 1.3% |
Commute Time by Sex in Dixie County
The most common commute times in Dixie County are 15 to 19 minutes (473 commuters, 19.2%) for males and 20 to 24 minutes (605 commuters, 23.9%) for females.
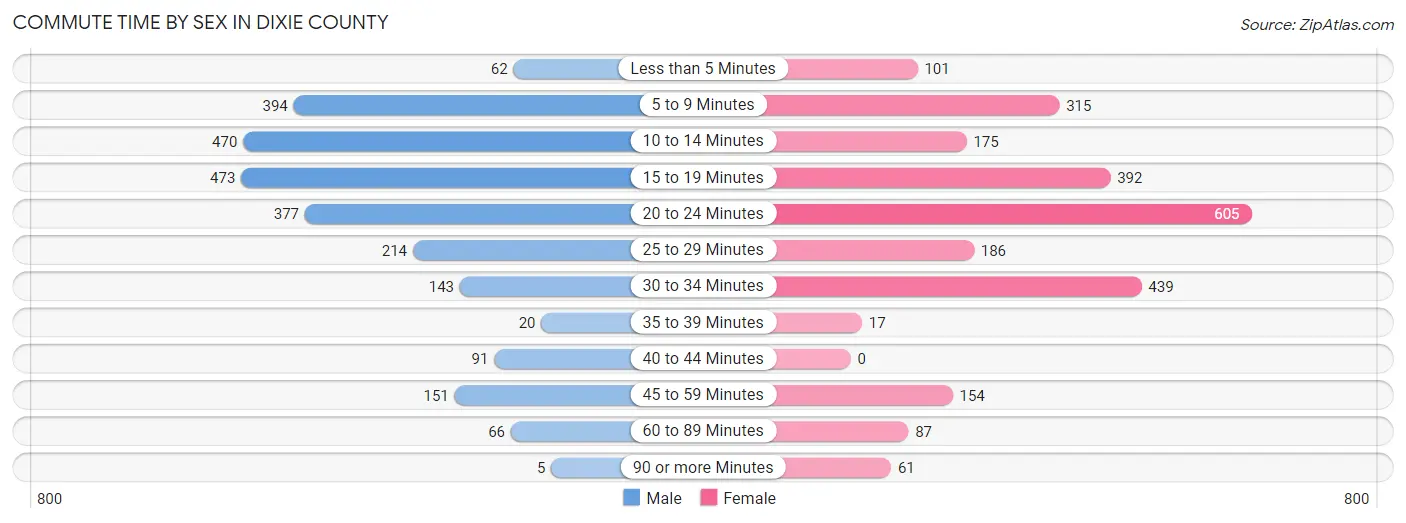
| Commute Time | Male | Female |
| Less than 5 Minutes | 62 (2.5%) | 101 (4.0%) |
| 5 to 9 Minutes | 394 (16.0%) | 315 (12.4%) |
| 10 to 14 Minutes | 470 (19.1%) | 175 (6.9%) |
| 15 to 19 Minutes | 473 (19.2%) | 392 (15.5%) |
| 20 to 24 Minutes | 377 (15.3%) | 605 (23.9%) |
| 25 to 29 Minutes | 214 (8.7%) | 186 (7.3%) |
| 30 to 34 Minutes | 143 (5.8%) | 439 (17.3%) |
| 35 to 39 Minutes | 20 (0.8%) | 17 (0.7%) |
| 40 to 44 Minutes | 91 (3.7%) | 0 (0.0%) |
| 45 to 59 Minutes | 151 (6.1%) | 154 (6.1%) |
| 60 to 89 Minutes | 66 (2.7%) | 87 (3.4%) |
| 90 or more Minutes | 5 (0.2%) | 61 (2.4%) |
Time of Departure to Work by Sex in Dixie County
The most frequent times of departure to work in Dixie County are 5:30 AM to 5:59 AM (448, 18.2%) for males and 8:30 AM to 8:59 AM (520, 20.5%) for females.
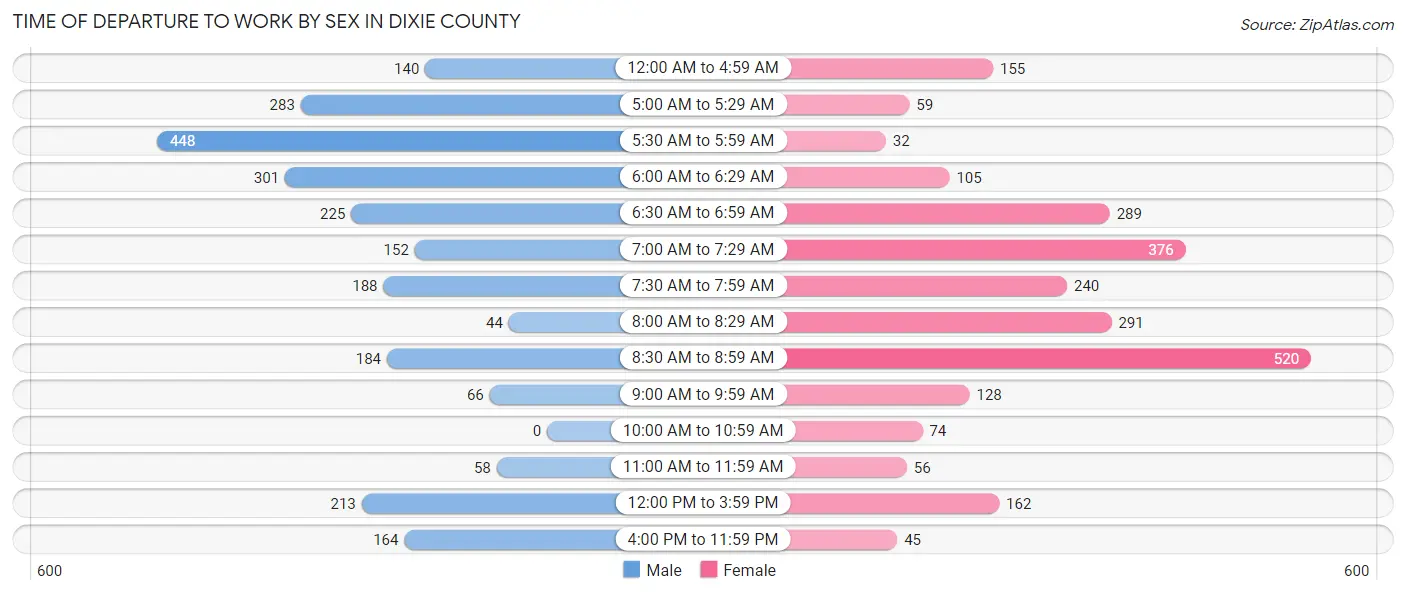
| Time of Departure | Male | Female |
| 12:00 AM to 4:59 AM | 140 (5.7%) | 155 (6.1%) |
| 5:00 AM to 5:29 AM | 283 (11.5%) | 59 (2.3%) |
| 5:30 AM to 5:59 AM | 448 (18.2%) | 32 (1.3%) |
| 6:00 AM to 6:29 AM | 301 (12.2%) | 105 (4.2%) |
| 6:30 AM to 6:59 AM | 225 (9.1%) | 289 (11.4%) |
| 7:00 AM to 7:29 AM | 152 (6.2%) | 376 (14.8%) |
| 7:30 AM to 7:59 AM | 188 (7.6%) | 240 (9.5%) |
| 8:00 AM to 8:29 AM | 44 (1.8%) | 291 (11.5%) |
| 8:30 AM to 8:59 AM | 184 (7.5%) | 520 (20.5%) |
| 9:00 AM to 9:59 AM | 66 (2.7%) | 128 (5.1%) |
| 10:00 AM to 10:59 AM | 0 (0.0%) | 74 (2.9%) |
| 11:00 AM to 11:59 AM | 58 (2.4%) | 56 (2.2%) |
| 12:00 PM to 3:59 PM | 213 (8.6%) | 162 (6.4%) |
| 4:00 PM to 11:59 PM | 164 (6.7%) | 45 (1.8%) |
| Total | 2,466 (100.0%) | 2,532 (100.0%) |
Housing Occupancy in Dixie County
Occupancy by Ownership in Dixie County
Of the total 6,164 dwellings in Dixie County, owner-occupied units account for 5,117 (83.0%), while renter-occupied units make up 1,047 (17.0%).
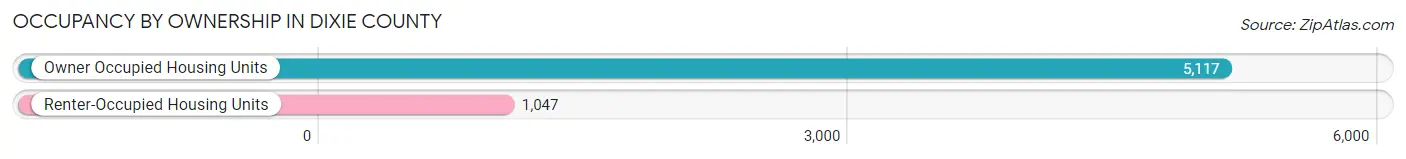
| Occupancy | # Housing Units | % Housing Units |
| Owner Occupied Housing Units | 5,117 | 83.0% |
| Renter-Occupied Housing Units | 1,047 | 17.0% |
| Total Occupied Housing Units | 6,164 | 100.0% |
Occupancy by Household Size in Dixie County
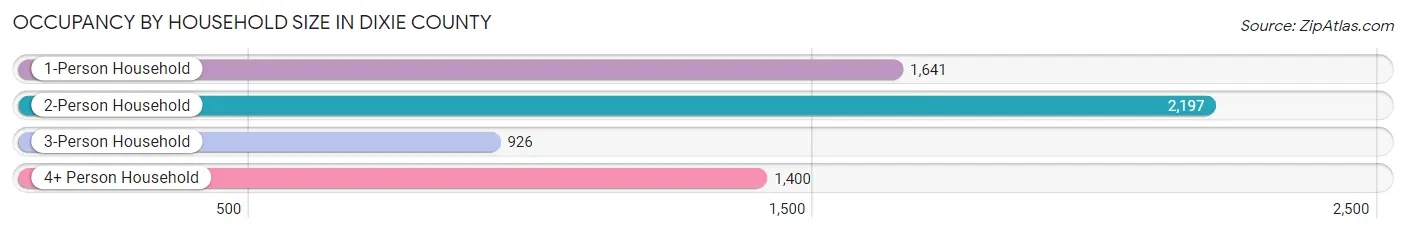
| Household Size | # Housing Units | % Housing Units |
| 1-Person Household | 1,641 | 26.6% |
| 2-Person Household | 2,197 | 35.6% |
| 3-Person Household | 926 | 15.0% |
| 4+ Person Household | 1,400 | 22.7% |
| Total Housing Units | 6,164 | 100.0% |
Occupancy by Ownership by Household Size in Dixie County
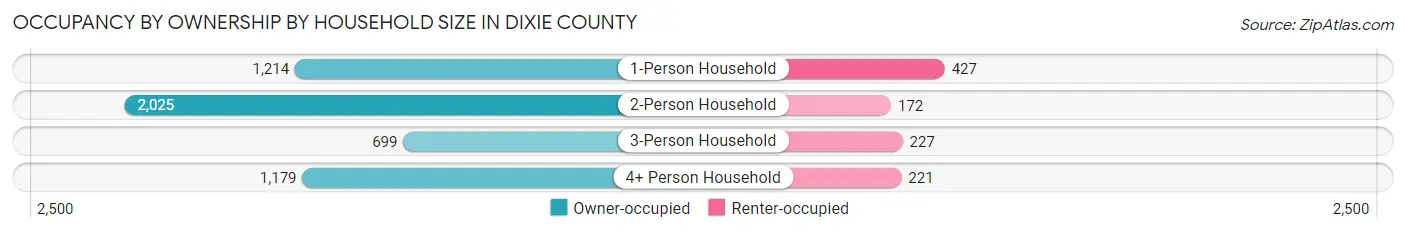
| Household Size | Owner-occupied | Renter-occupied |
| 1-Person Household | 1,214 (74.0%) | 427 (26.0%) |
| 2-Person Household | 2,025 (92.2%) | 172 (7.8%) |
| 3-Person Household | 699 (75.5%) | 227 (24.5%) |
| 4+ Person Household | 1,179 (84.2%) | 221 (15.8%) |
| Total Housing Units | 5,117 (83.0%) | 1,047 (17.0%) |
Occupancy by Educational Attainment in Dixie County
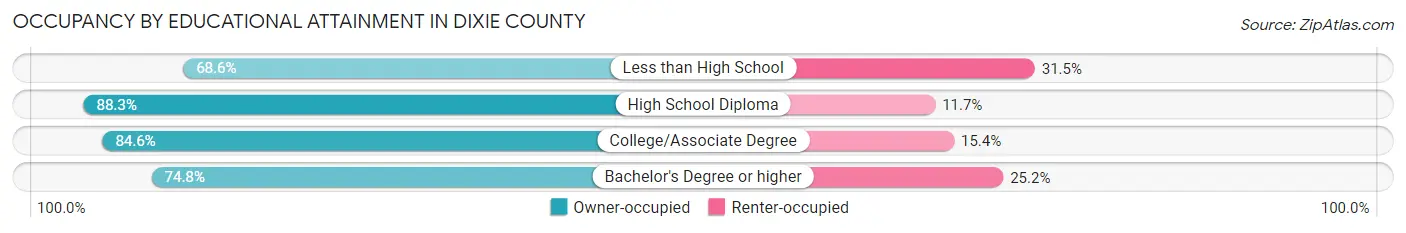
| Household Size | Owner-occupied | Renter-occupied |
| Less than High School | 643 (68.5%) | 295 (31.5%) |
| High School Diploma | 2,499 (88.3%) | 331 (11.7%) |
| College/Associate Degree | 1,583 (84.6%) | 289 (15.4%) |
| Bachelor's Degree or higher | 392 (74.8%) | 132 (25.2%) |
Occupancy by Age of Householder in Dixie County
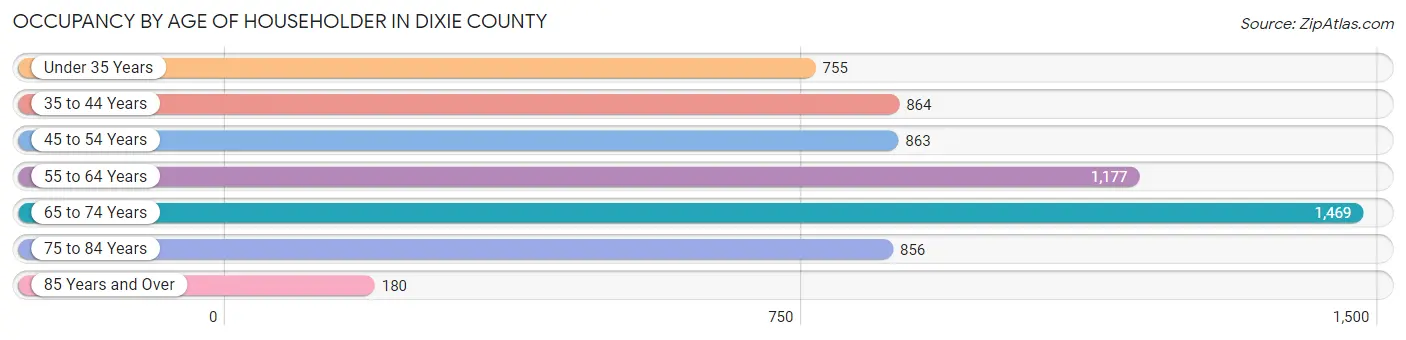
| Age Bracket | # Households | % Households |
| Under 35 Years | 755 | 12.2% |
| 35 to 44 Years | 864 | 14.0% |
| 45 to 54 Years | 863 | 14.0% |
| 55 to 64 Years | 1,177 | 19.1% |
| 65 to 74 Years | 1,469 | 23.8% |
| 75 to 84 Years | 856 | 13.9% |
| 85 Years and Over | 180 | 2.9% |
| Total | 6,164 | 100.0% |
Housing Finances in Dixie County
Median Income by Occupancy in Dixie County
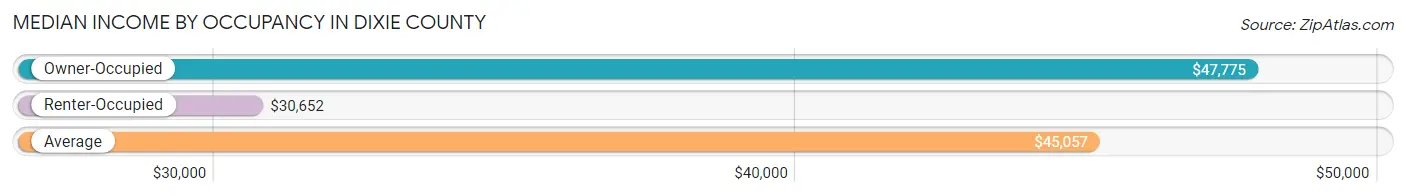
| Occupancy Type | # Households | Median Income |
| Owner-Occupied | 5,117 (83.0%) | $47,775 |
| Renter-Occupied | 1,047 (17.0%) | $30,652 |
| Average | 6,164 (100.0%) | $45,057 |
Occupancy by Householder Income Bracket in Dixie County
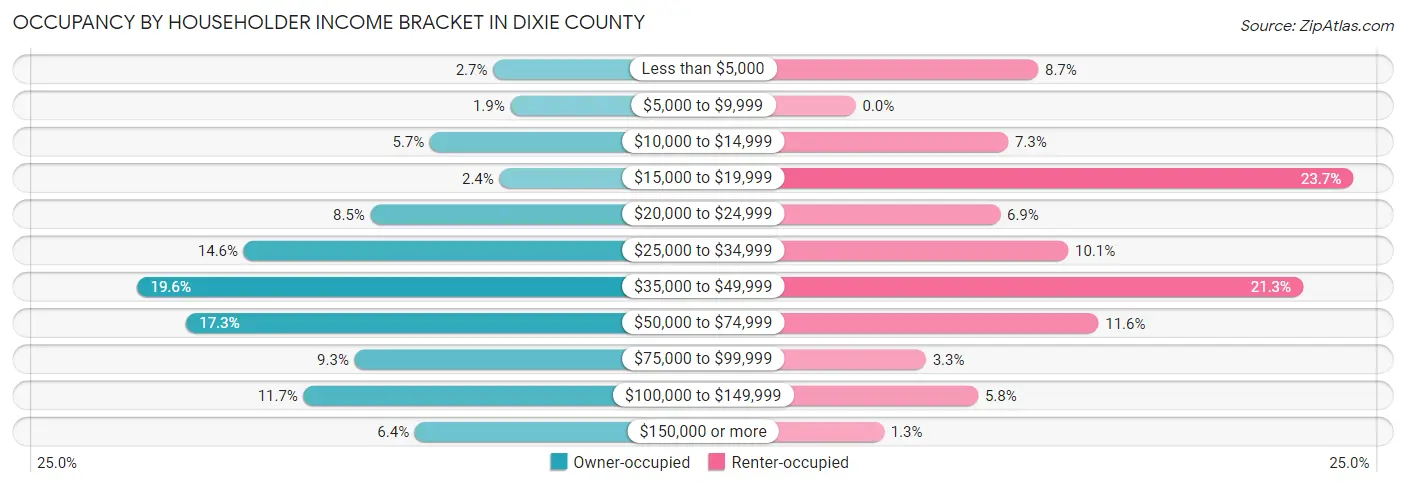
| Income Bracket | Owner-occupied | Renter-occupied |
| Less than $5,000 | 137 (2.7%) | 91 (8.7%) |
| $5,000 to $9,999 | 95 (1.9%) | 0 (0.0%) |
| $10,000 to $14,999 | 291 (5.7%) | 76 (7.3%) |
| $15,000 to $19,999 | 122 (2.4%) | 248 (23.7%) |
| $20,000 to $24,999 | 436 (8.5%) | 72 (6.9%) |
| $25,000 to $34,999 | 745 (14.6%) | 106 (10.1%) |
| $35,000 to $49,999 | 1,004 (19.6%) | 223 (21.3%) |
| $50,000 to $74,999 | 885 (17.3%) | 121 (11.6%) |
| $75,000 to $99,999 | 475 (9.3%) | 35 (3.3%) |
| $100,000 to $149,999 | 599 (11.7%) | 61 (5.8%) |
| $150,000 or more | 328 (6.4%) | 14 (1.3%) |
| Total | 5,117 (100.0%) | 1,047 (100.0%) |
Monthly Housing Cost Tiers in Dixie County
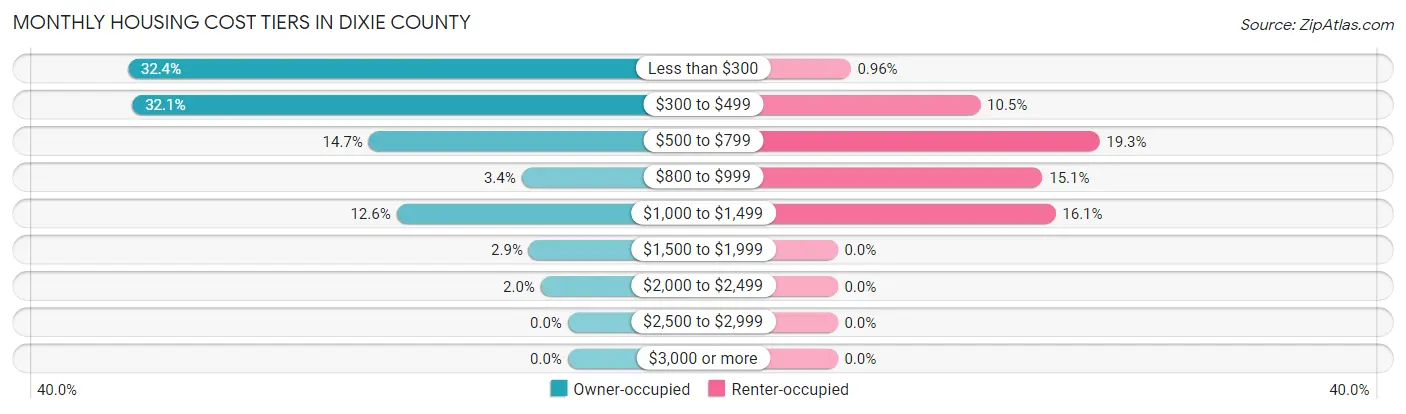
| Monthly Cost | Owner-occupied | Renter-occupied |
| Less than $300 | 1,658 (32.4%) | 10 (1.0%) |
| $300 to $499 | 1,641 (32.1%) | 110 (10.5%) |
| $500 to $799 | 750 (14.7%) | 202 (19.3%) |
| $800 to $999 | 174 (3.4%) | 158 (15.1%) |
| $1,000 to $1,499 | 645 (12.6%) | 168 (16.1%) |
| $1,500 to $1,999 | 147 (2.9%) | 0 (0.0%) |
| $2,000 to $2,499 | 102 (2.0%) | 0 (0.0%) |
| $2,500 to $2,999 | 0 (0.0%) | 0 (0.0%) |
| $3,000 or more | 0 (0.0%) | 0 (0.0%) |
| Total | 5,117 (100.0%) | 1,047 (100.0%) |
Physical Housing Characteristics in Dixie County
Housing Structures in Dixie County
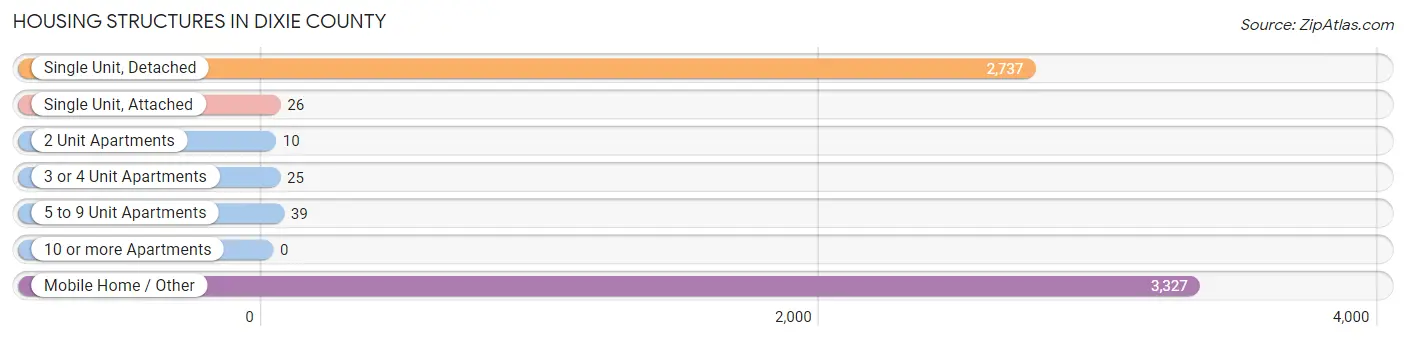
| Structure Type | # Housing Units | % Housing Units |
| Single Unit, Detached | 2,737 | 44.4% |
| Single Unit, Attached | 26 | 0.4% |
| 2 Unit Apartments | 10 | 0.2% |
| 3 or 4 Unit Apartments | 25 | 0.4% |
| 5 to 9 Unit Apartments | 39 | 0.6% |
| 10 or more Apartments | 0 | 0.0% |
| Mobile Home / Other | 3,327 | 54.0% |
| Total | 6,164 | 100.0% |
Housing Structures by Occupancy in Dixie County
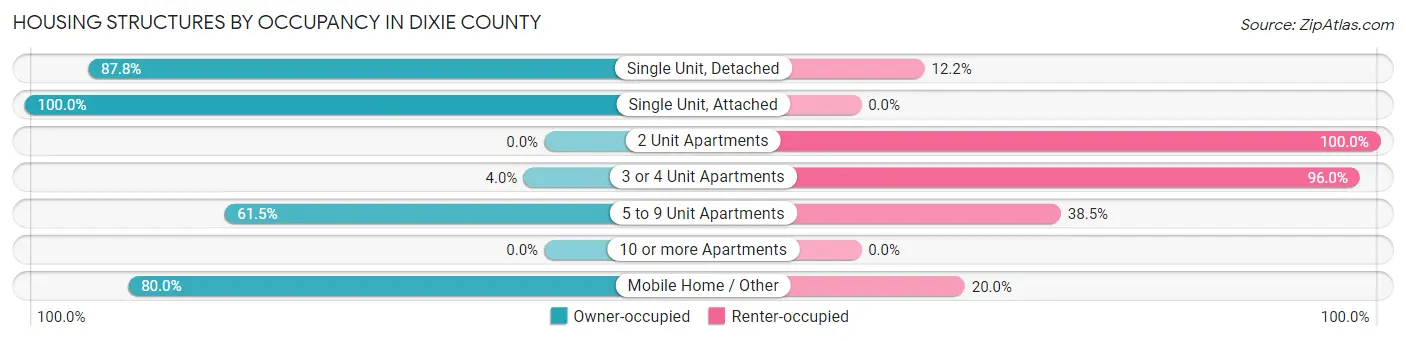
| Structure Type | Owner-occupied | Renter-occupied |
| Single Unit, Detached | 2,403 (87.8%) | 334 (12.2%) |
| Single Unit, Attached | 26 (100.0%) | 0 (0.0%) |
| 2 Unit Apartments | 0 (0.0%) | 10 (100.0%) |
| 3 or 4 Unit Apartments | 1 (4.0%) | 24 (96.0%) |
| 5 to 9 Unit Apartments | 24 (61.5%) | 15 (38.5%) |
| 10 or more Apartments | 0 (0.0%) | 0 (0.0%) |
| Mobile Home / Other | 2,663 (80.0%) | 664 (20.0%) |
| Total | 5,117 (83.0%) | 1,047 (17.0%) |
Housing Structures by Number of Rooms in Dixie County
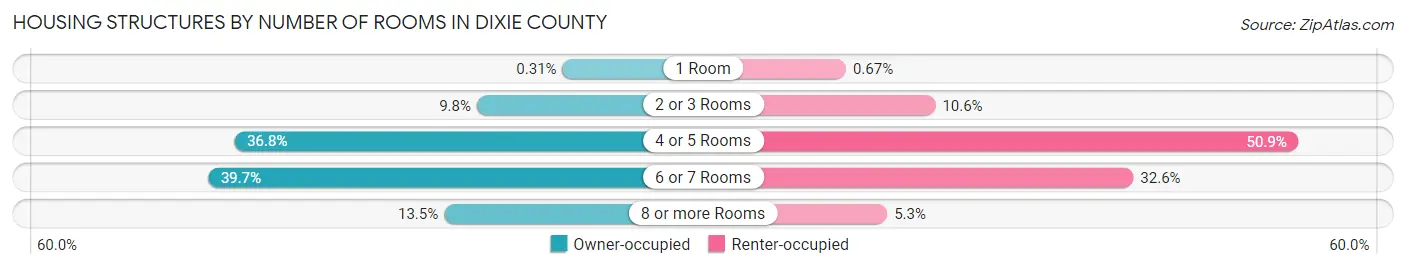
| Number of Rooms | Owner-occupied | Renter-occupied |
| 1 Room | 16 (0.3%) | 7 (0.7%) |
| 2 or 3 Rooms | 502 (9.8%) | 111 (10.6%) |
| 4 or 5 Rooms | 1,881 (36.8%) | 533 (50.9%) |
| 6 or 7 Rooms | 2,030 (39.7%) | 341 (32.6%) |
| 8 or more Rooms | 688 (13.5%) | 55 (5.2%) |
| Total | 5,117 (100.0%) | 1,047 (100.0%) |
Housing Structure by Heating Type in Dixie County
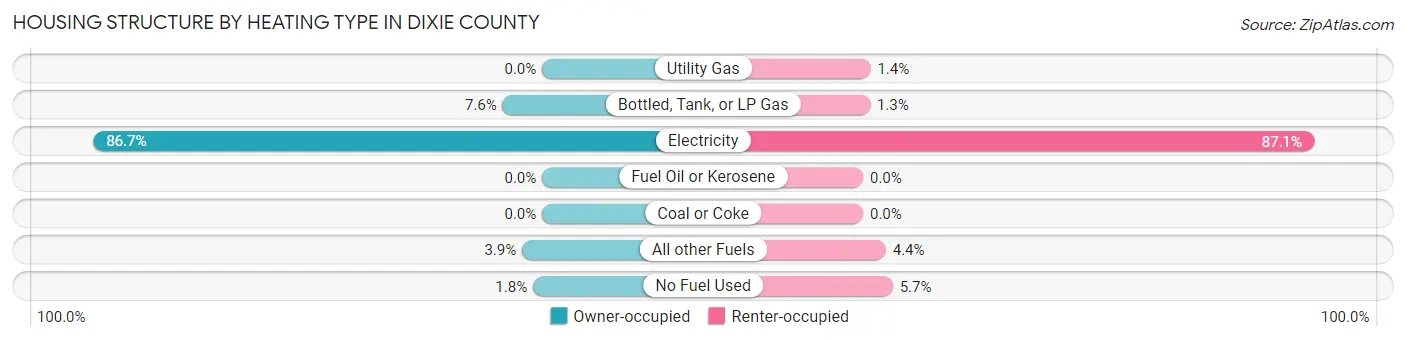
| Heating Type | Owner-occupied | Renter-occupied |
| Utility Gas | 0 (0.0%) | 15 (1.4%) |
| Bottled, Tank, or LP Gas | 391 (7.6%) | 14 (1.3%) |
| Electricity | 4,438 (86.7%) | 912 (87.1%) |
| Fuel Oil or Kerosene | 0 (0.0%) | 0 (0.0%) |
| Coal or Coke | 0 (0.0%) | 0 (0.0%) |
| All other Fuels | 198 (3.9%) | 46 (4.4%) |
| No Fuel Used | 90 (1.8%) | 60 (5.7%) |
| Total | 5,117 (100.0%) | 1,047 (100.0%) |
Household Vehicle Usage in Dixie County
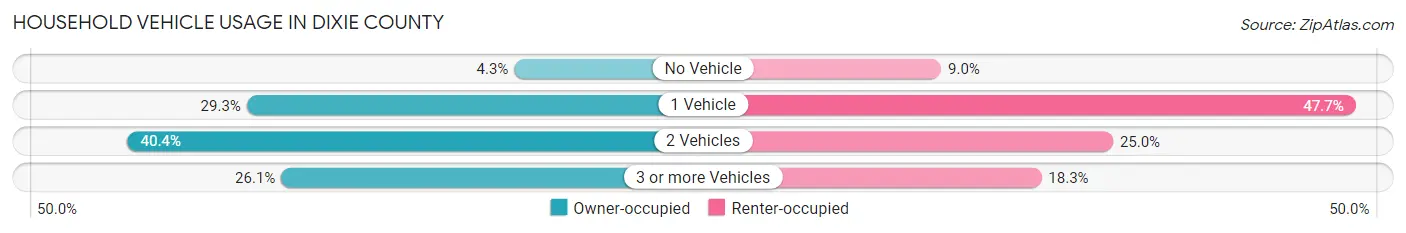
| Vehicles per Household | Owner-occupied | Renter-occupied |
| No Vehicle | 220 (4.3%) | 94 (9.0%) |
| 1 Vehicle | 1,498 (29.3%) | 499 (47.7%) |
| 2 Vehicles | 2,066 (40.4%) | 262 (25.0%) |
| 3 or more Vehicles | 1,333 (26.1%) | 192 (18.3%) |
| Total | 5,117 (100.0%) | 1,047 (100.0%) |
Real Estate & Mortgages in Dixie County
Real Estate and Mortgage Overview in Dixie County
| Characteristic | Without Mortgage | With Mortgage |
| Housing Units | 3,734 | 1,383 |
| Median Property Value | $86,000 | $128,700 |
| Median Household Income | $42,331 | $209 |
| Monthly Housing Costs | $313 | $0 |
| Real Estate Taxes | $512 | $37 |
Property Value by Mortgage Status in Dixie County
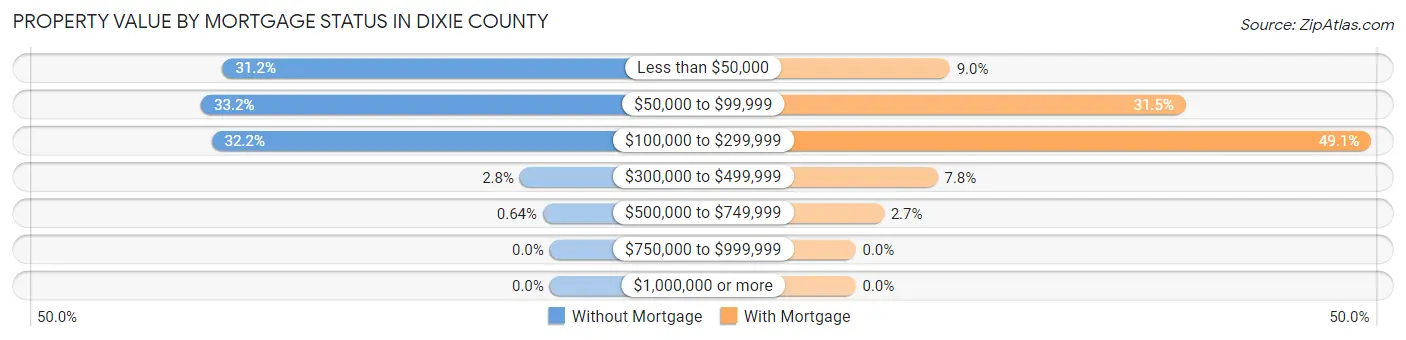
| Property Value | Without Mortgage | With Mortgage |
| Less than $50,000 | 1,163 (31.1%) | 124 (9.0%) |
| $50,000 to $99,999 | 1,239 (33.2%) | 435 (31.5%) |
| $100,000 to $299,999 | 1,202 (32.2%) | 679 (49.1%) |
| $300,000 to $499,999 | 106 (2.8%) | 108 (7.8%) |
| $500,000 to $749,999 | 24 (0.6%) | 37 (2.7%) |
| $750,000 to $999,999 | 0 (0.0%) | 0 (0.0%) |
| $1,000,000 or more | 0 (0.0%) | 0 (0.0%) |
| Total | 3,734 (100.0%) | 1,383 (100.0%) |
Household Income by Mortgage Status in Dixie County
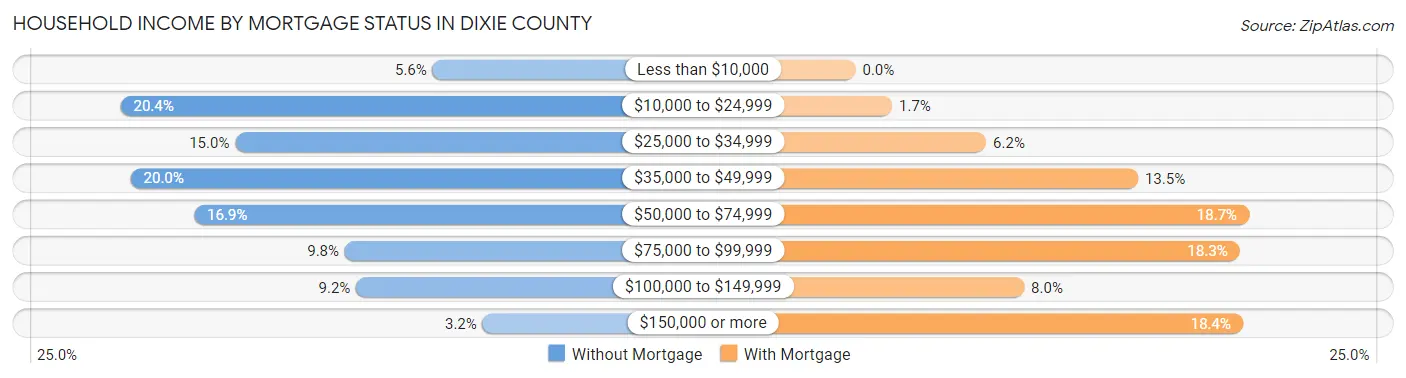
| Household Income | Without Mortgage | With Mortgage |
| Less than $10,000 | 208 (5.6%) | 0 (0.0%) |
| $10,000 to $24,999 | 763 (20.4%) | 24 (1.7%) |
| $25,000 to $34,999 | 559 (15.0%) | 86 (6.2%) |
| $35,000 to $49,999 | 745 (20.0%) | 186 (13.5%) |
| $50,000 to $74,999 | 632 (16.9%) | 259 (18.7%) |
| $75,000 to $99,999 | 364 (9.8%) | 253 (18.3%) |
| $100,000 to $149,999 | 344 (9.2%) | 111 (8.0%) |
| $150,000 or more | 119 (3.2%) | 255 (18.4%) |
| Total | 3,734 (100.0%) | 1,383 (100.0%) |
Property Value to Household Income Ratio in Dixie County
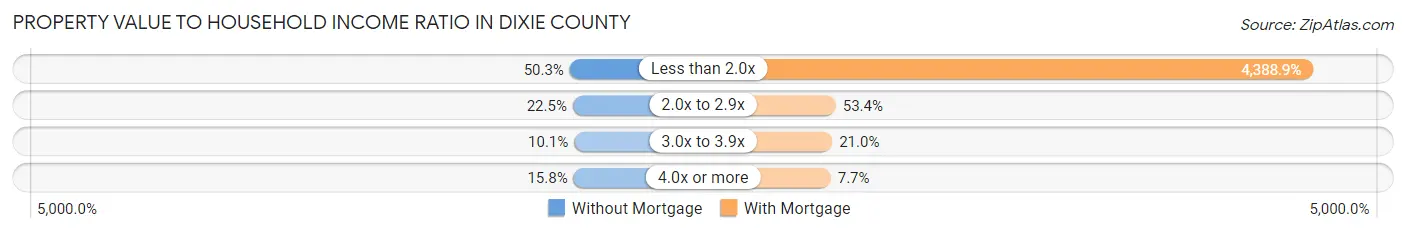
| Value-to-Income Ratio | Without Mortgage | With Mortgage |
| Less than 2.0x | 1,877 (50.3%) | 60,699 (4,388.9%) |
| 2.0x to 2.9x | 839 (22.5%) | 739 (53.4%) |
| 3.0x to 3.9x | 377 (10.1%) | 291 (21.0%) |
| 4.0x or more | 590 (15.8%) | 107 (7.7%) |
| Total | 3,734 (100.0%) | 1,383 (100.0%) |
Real Estate Taxes by Mortgage Status in Dixie County
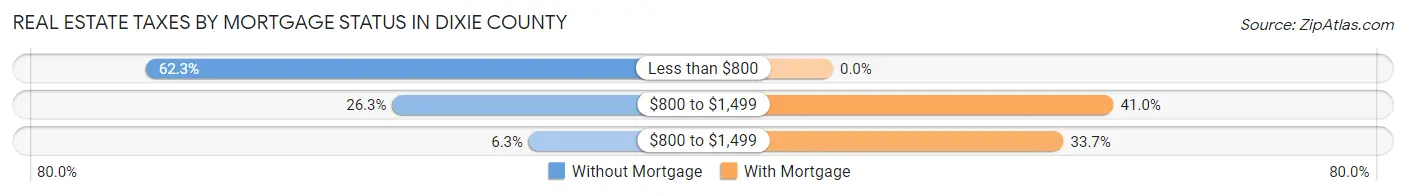
| Property Taxes | Without Mortgage | With Mortgage |
| Less than $800 | 2,326 (62.3%) | 0 (0.0%) |
| $800 to $1,499 | 981 (26.3%) | 567 (41.0%) |
| $800 to $1,499 | 236 (6.3%) | 466 (33.7%) |
| Total | 3,734 (100.0%) | 1,383 (100.0%) |
Health & Disability in Dixie County
Health Insurance Coverage by Age in Dixie County
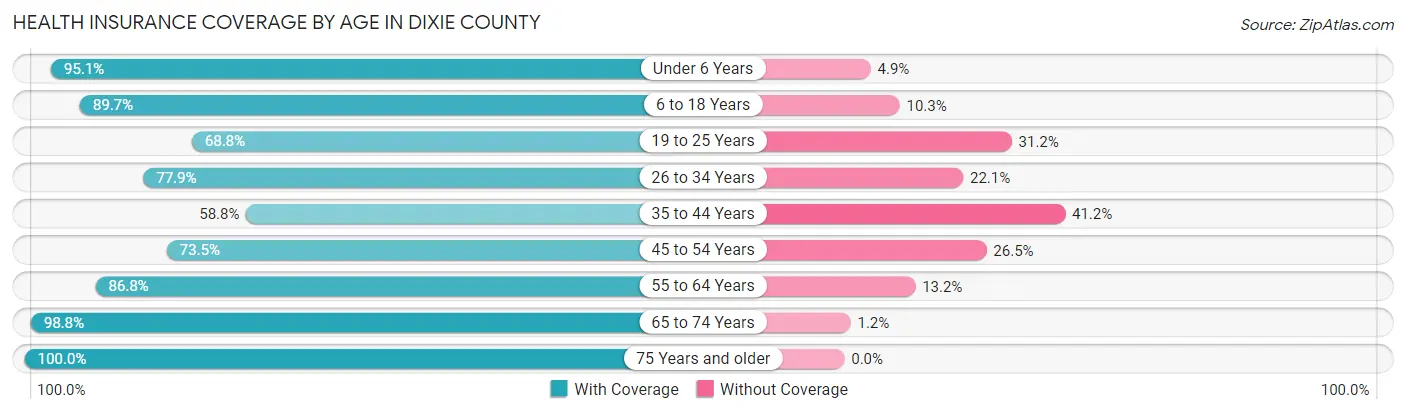
| Age Bracket | With Coverage | Without Coverage |
| Under 6 Years | 755 (95.1%) | 39 (4.9%) |
| 6 to 18 Years | 2,165 (89.7%) | 249 (10.3%) |
| 19 to 25 Years | 668 (68.8%) | 303 (31.2%) |
| 26 to 34 Years | 1,083 (77.9%) | 308 (22.1%) |
| 35 to 44 Years | 1,065 (58.8%) | 745 (41.2%) |
| 45 to 54 Years | 1,284 (73.5%) | 463 (26.5%) |
| 55 to 64 Years | 1,976 (86.8%) | 301 (13.2%) |
| 65 to 74 Years | 2,225 (98.8%) | 26 (1.2%) |
| 75 Years and older | 1,550 (100.0%) | 0 (0.0%) |
| Total | 12,771 (84.0%) | 2,434 (16.0%) |
Health Insurance Coverage by Citizenship Status in Dixie County
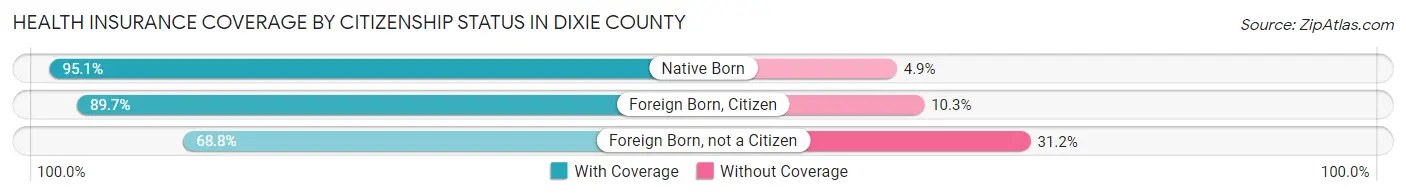
| Citizenship Status | With Coverage | Without Coverage |
| Native Born | 755 (95.1%) | 39 (4.9%) |
| Foreign Born, Citizen | 2,165 (89.7%) | 249 (10.3%) |
| Foreign Born, not a Citizen | 668 (68.8%) | 303 (31.2%) |
Health Insurance Coverage by Household Income in Dixie County
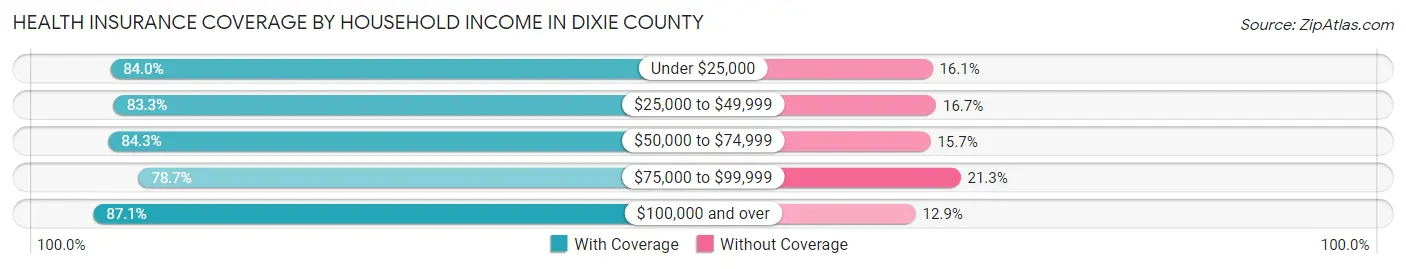
| Household Income | With Coverage | Without Coverage |
| Under $25,000 | 2,155 (84.0%) | 412 (16.1%) |
| $25,000 to $49,999 | 4,284 (83.3%) | 860 (16.7%) |
| $50,000 to $74,999 | 2,178 (84.3%) | 405 (15.7%) |
| $75,000 to $99,999 | 1,141 (78.7%) | 309 (21.3%) |
| $100,000 and over | 3,011 (87.1%) | 446 (12.9%) |
Public vs Private Health Insurance Coverage by Age in Dixie County
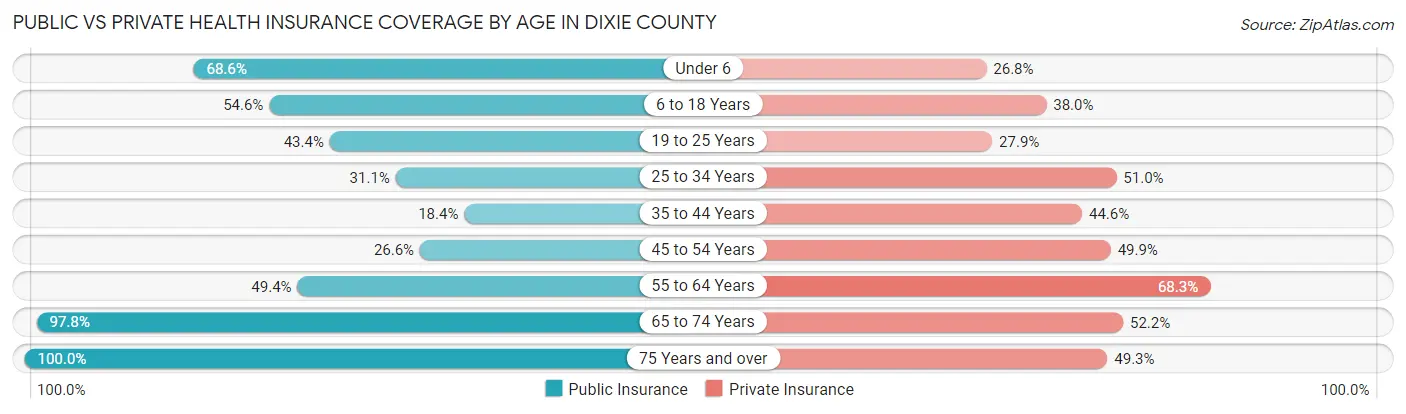
| Age Bracket | Public Insurance | Private Insurance |
| Under 6 | 545 (68.6%) | 213 (26.8%) |
| 6 to 18 Years | 1,318 (54.6%) | 916 (38.0%) |
| 19 to 25 Years | 421 (43.4%) | 271 (27.9%) |
| 25 to 34 Years | 433 (31.1%) | 709 (51.0%) |
| 35 to 44 Years | 333 (18.4%) | 807 (44.6%) |
| 45 to 54 Years | 465 (26.6%) | 872 (49.9%) |
| 55 to 64 Years | 1,124 (49.4%) | 1,556 (68.3%) |
| 65 to 74 Years | 2,201 (97.8%) | 1,175 (52.2%) |
| 75 Years and over | 1,550 (100.0%) | 764 (49.3%) |
| Total | 8,390 (55.2%) | 7,283 (47.9%) |
Disability Status by Sex by Age in Dixie County
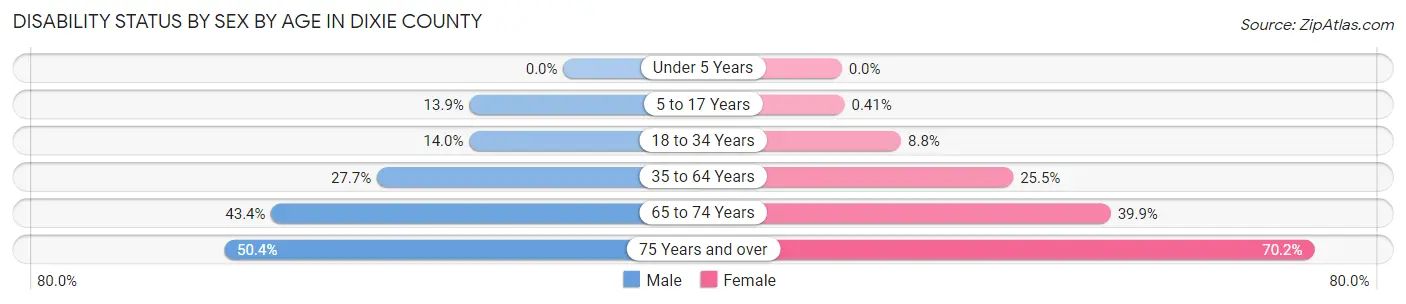
| Age Bracket | Male | Female |
| Under 5 Years | 0 (0.0%) | 0 (0.0%) |
| 5 to 17 Years | 189 (13.9%) | 4 (0.4%) |
| 18 to 34 Years | 177 (14.0%) | 116 (8.8%) |
| 35 to 64 Years | 816 (27.7%) | 734 (25.5%) |
| 65 to 74 Years | 509 (43.4%) | 430 (39.9%) |
| 75 Years and over | 401 (50.4%) | 529 (70.2%) |
Disability Class by Sex by Age in Dixie County
Disability Class: Hearing Difficulty
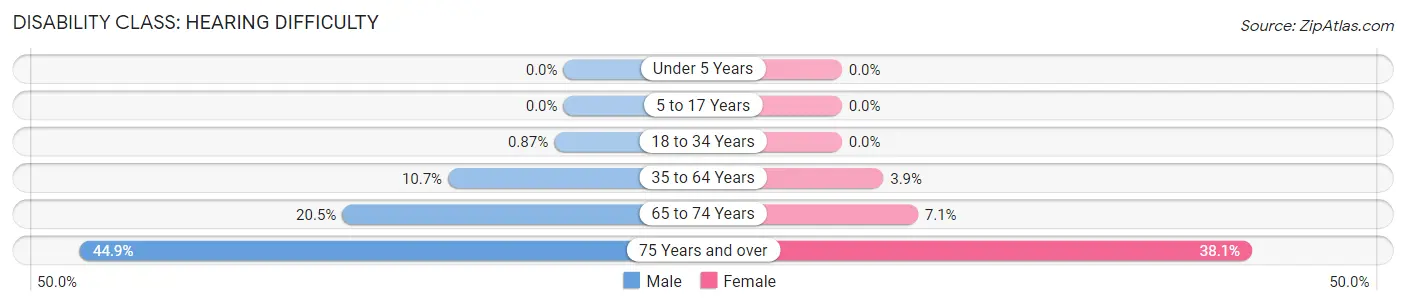
| Age Bracket | Male | Female |
| Under 5 Years | 0 (0.0%) | 0 (0.0%) |
| 5 to 17 Years | 0 (0.0%) | 0 (0.0%) |
| 18 to 34 Years | 11 (0.9%) | 0 (0.0%) |
| 35 to 64 Years | 316 (10.7%) | 111 (3.8%) |
| 65 to 74 Years | 241 (20.5%) | 76 (7.1%) |
| 75 Years and over | 357 (44.9%) | 287 (38.1%) |
Disability Class: Vision Difficulty
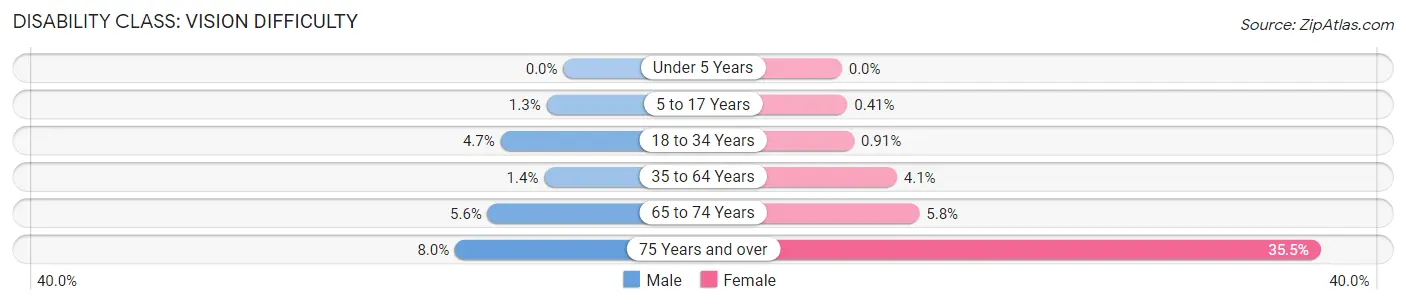
| Age Bracket | Male | Female |
| Under 5 Years | 0 (0.0%) | 0 (0.0%) |
| 5 to 17 Years | 17 (1.3%) | 4 (0.4%) |
| 18 to 34 Years | 59 (4.7%) | 12 (0.9%) |
| 35 to 64 Years | 42 (1.4%) | 118 (4.1%) |
| 65 to 74 Years | 66 (5.6%) | 62 (5.8%) |
| 75 Years and over | 64 (8.0%) | 268 (35.5%) |
Disability Class: Cognitive Difficulty
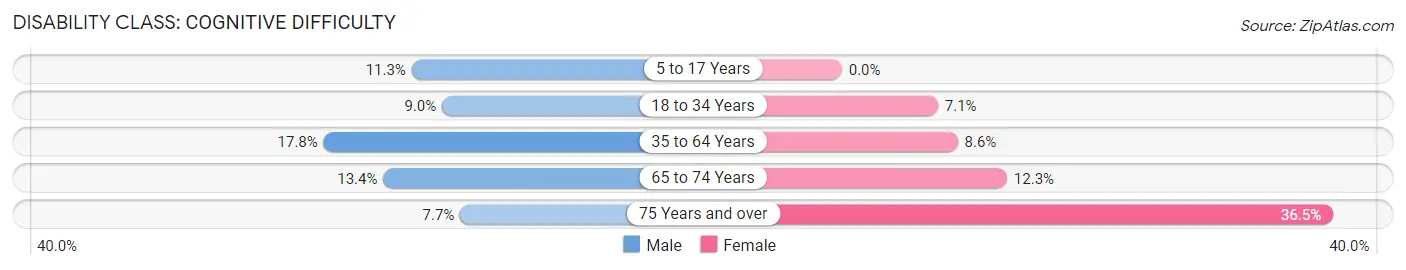
| Age Bracket | Male | Female |
| 5 to 17 Years | 153 (11.3%) | 0 (0.0%) |
| 18 to 34 Years | 114 (9.0%) | 94 (7.1%) |
| 35 to 64 Years | 525 (17.8%) | 248 (8.6%) |
| 65 to 74 Years | 157 (13.4%) | 132 (12.3%) |
| 75 Years and over | 61 (7.7%) | 275 (36.5%) |
Disability Class: Ambulatory Difficulty
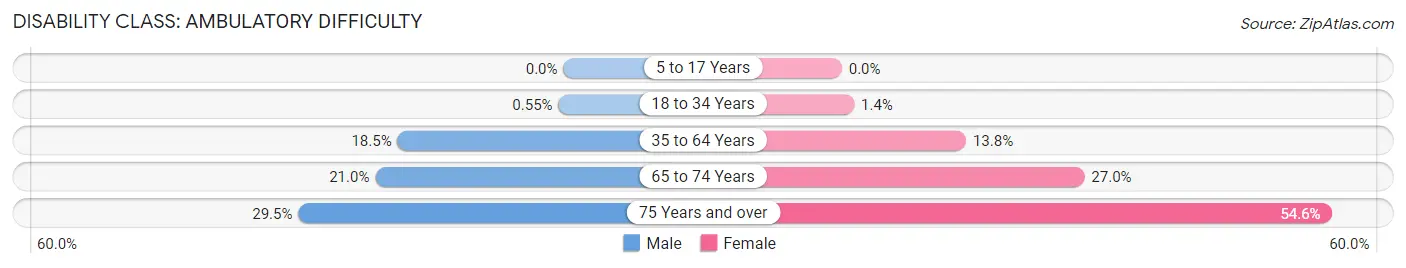
| Age Bracket | Male | Female |
| 5 to 17 Years | 0 (0.0%) | 0 (0.0%) |
| 18 to 34 Years | 7 (0.5%) | 18 (1.4%) |
| 35 to 64 Years | 545 (18.5%) | 399 (13.8%) |
| 65 to 74 Years | 246 (20.9%) | 291 (27.0%) |
| 75 Years and over | 235 (29.5%) | 412 (54.6%) |
Disability Class: Self-Care Difficulty
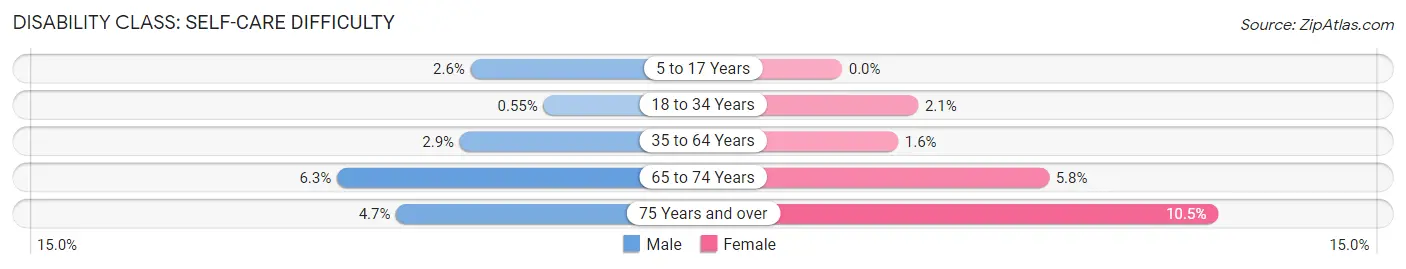
| Age Bracket | Male | Female |
| 5 to 17 Years | 35 (2.6%) | 0 (0.0%) |
| 18 to 34 Years | 7 (0.5%) | 28 (2.1%) |
| 35 to 64 Years | 85 (2.9%) | 45 (1.6%) |
| 65 to 74 Years | 74 (6.3%) | 62 (5.8%) |
| 75 Years and over | 37 (4.6%) | 79 (10.5%) |
Technology Access in Dixie County
Computing Device Access in Dixie County
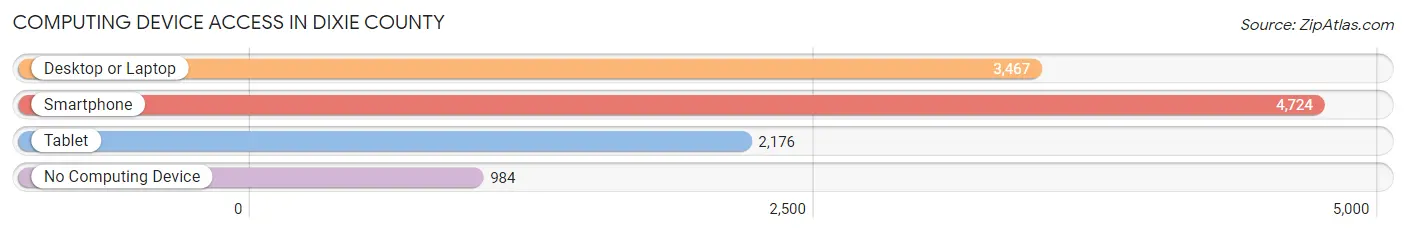
| Device Type | # Households | % Households |
| Desktop or Laptop | 3,467 | 56.2% |
| Smartphone | 4,724 | 76.6% |
| Tablet | 2,176 | 35.3% |
| No Computing Device | 984 | 16.0% |
| Total | 6,164 | 100.0% |
Internet Access in Dixie County
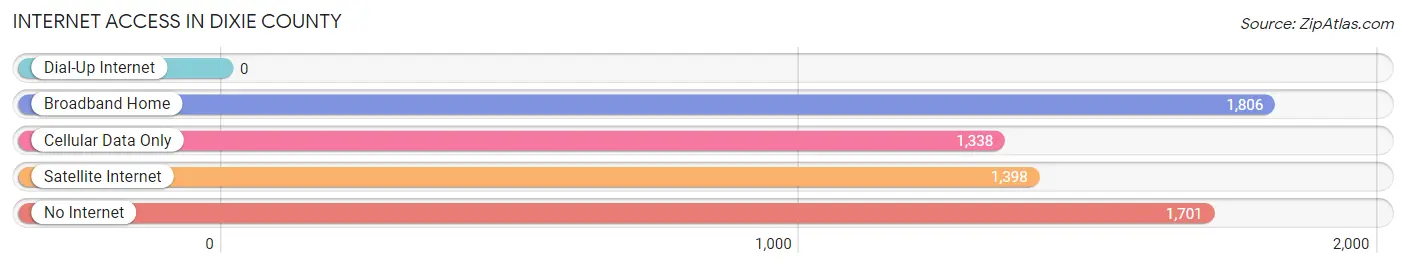
| Internet Type | # Households | % Households |
| Dial-Up Internet | 0 | 0.0% |
| Broadband Home | 1,806 | 29.3% |
| Cellular Data Only | 1,338 | 21.7% |
| Satellite Internet | 1,398 | 22.7% |
| No Internet | 1,701 | 27.6% |
| Total | 6,164 | 100.0% |
Dixie County Summary
Dixie County is a county located in the state of Florida in the United States. It is part of the Nature Coast region of the state and is bordered by Levy County to the north, Gilchrist County to the east, Lafayette County to the south, and Taylor County to the west. As of the 2010 census, the population was 16,422. The county seat is Cross City.
History
Dixie County was created in 1921 from the western portion of Lafayette County. It was named for the Dixie Highway, which ran through the county. The county was originally part of the Suwannee River Valley, which was inhabited by Native American tribes such as the Seminole and Miccosukee. The first European settlers arrived in the area in the early 19th century, and the county was officially established in 1921.
Geography
Dixie County is located in the Nature Coast region of Florida, and is bordered by Levy County to the north, Gilchrist County to the east, Lafayette County to the south, and Taylor County to the west. The county has a total area of 576 square miles, of which 571 square miles is land and 5.2 square miles (0.9%) is water. The county is located in the Big Bend region of Florida, and is home to the Suwannee River, which forms the western border of the county.
The county is home to several state parks, including the Lower Suwannee National Wildlife Refuge, the Big Bend Wildlife Management Area, and the Fanning Springs State Park. The county is also home to the Dixie County Historical Museum, which houses artifacts from the county's history.
Economy
The economy of Dixie County is largely based on agriculture and forestry. The county is home to several large timber companies, and the timber industry is the largest employer in the county. Other major industries in the county include tourism, fishing, and manufacturing.
The county is home to several large employers, including the Dixie County School District, the Dixie County Sheriff's Office, and the Dixie County Health Department. The county is also home to several small businesses, including restaurants, retail stores, and service providers.
Demographics
As of the 2010 census, there were 16,422 people, 6,717 households, and 4,717 families residing in the county. The population density was 28.7 people per square mile. There were 8,072 housing units at an average density of 14.1 per square mile. The racial makeup of the county was 87.3% White, 8.2% Black or African American, 0.6% Native American, 0.4% Asian, 0.1% Pacific Islander, 1.7% from other races, and 1.7% from two or more races. Hispanic or Latino of any race were 4.3% of the population.
The median income for a household in the county was $30,945, and the median income for a family was $36,945. The per capita income for the county was $15,945. About 17.2% of families and 21.2% of the population were below the poverty line, including 28.2% of those under age 18 and 14.2% of those age 65 or over.
Conclusion
Dixie County is a county located in the Nature Coast region of Florida. It is bordered by Levy County to the north, Gilchrist County to the east, Lafayette County to the south, and Taylor County to the west. The county has a total area of 576 square miles, and is home to the Suwannee River. The economy of the county is largely based on agriculture and forestry, and the county is home to several large employers. As of the 2010 census, the population was 16,422, with a median household income of $30,945.
Common Questions
What is Per Capita Income in Dixie County?
Per Capita income in Dixie County is $20,508.
What is the Median Family Income in Dixie County?
Median Family Income in Dixie County is $49,404.
What is the Median Household income in Dixie County?
Median Household Income in Dixie County is $45,057.
What is Income or Wage Gap in Dixie County?
Income or Wage Gap in Dixie County is 42.8%.
Women in Dixie County earn 57.2 cents for every dollar earned by a man.
What is Inequality or Gini Index in Dixie County?
Inequality or Gini Index in Dixie County is 0.43.
What is the Total Population of Dixie County?
Total Population of Dixie County is 16,737.
What is the Total Male Population of Dixie County?
Total Male Population of Dixie County is 9,323.
What is the Total Female Population of Dixie County?
Total Female Population of Dixie County is 7,414.
What is the Ratio of Males per 100 Females in Dixie County?
There are 125.75 Males per 100 Females in Dixie County.
What is the Ratio of Females per 100 Males in Dixie County?
There are 79.52 Females per 100 Males in Dixie County.
What is the Median Population Age in Dixie County?
Median Population Age in Dixie County is 45.8 Years.
What is the Average Family Size in Dixie County
Average Family Size in Dixie County is 3.0 People.
What is the Average Household Size in Dixie County
Average Household Size in Dixie County is 2.5 People.
How Large is the Labor Force in Dixie County?
There are 5,742 People in the Labor Forcein in Dixie County.
What is the Percentage of People in the Labor Force in Dixie County?
40.6% of People are in the Labor Force in Dixie County.
What is the Unemployment Rate in Dixie County?
Unemployment Rate in Dixie County is 5.1%.