Desoto County, FL Map & Demographics
Desoto County Map
Desoto County Overview
$21,726
PER CAPITA INCOME
$53,743
AVG FAMILY INCOME
$45,000
AVG HOUSEHOLD INCOME
21.7%
WAGE / INCOME GAP [ % ]
78.3¢/ $1
WAGE / INCOME GAP [ $ ]
$10,554
FAMILY INCOME DEFICIT
0.43
INEQUALITY / GINI INDEX
34,258
TOTAL POPULATION
19,234
MALE POPULATION
15,024
FEMALE POPULATION
128.02
MALES / 100 FEMALES
78.11
FEMALES / 100 MALES
41.7
MEDIAN AGE
3.0
AVG FAMILY SIZE
2.5
AVG HOUSEHOLD SIZE
13,733
LABOR FORCE [ PEOPLE ]
47.7%
PERCENT IN LABOR FORCE
9.7%
UNEMPLOYMENT RATE
Desoto County Area Codes
Income in Desoto County
Income Overview in Desoto County
Per Capita Income in Desoto County is $21,726, while median incomes of families and households are $53,743 and $45,000 respectively.
| Characteristic | Number | Measure |
| Per Capita Income | 34,258 | $21,726 |
| Median Family Income | 8,313 | $53,743 |
| Mean Family Income | 8,313 | $64,383 |
| Median Household Income | 12,340 | $45,000 |
| Mean Household Income | 12,340 | $56,356 |
| Income Deficit | 8,313 | $10,554 |
| Wage / Income Gap (%) | 34,258 | 21.72% |
| Wage / Income Gap ($) | 34,258 | 78.28¢ per $1 |
| Gini / Inequality Index | 34,258 | 0.43 |
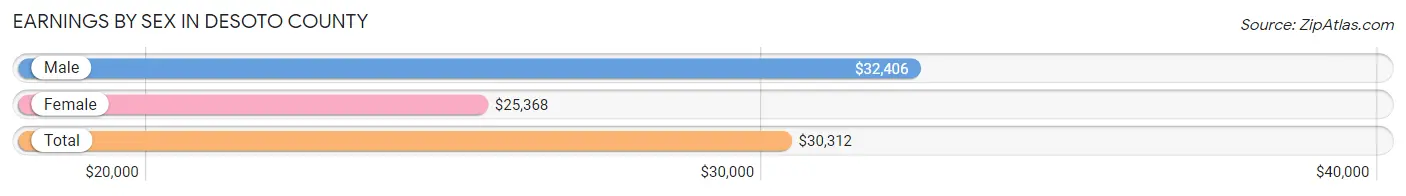
Earnings by Sex in Desoto County
Average Earnings in Desoto County are $30,312, $32,406 for men and $25,368 for women, a difference of 21.7%.
| Sex | Number | Average Earnings |
| Male | 8,572 (61.5%) | $32,406 |
| Female | 5,363 (38.5%) | $25,368 |
| Total | 13,935 (100.0%) | $30,312 |
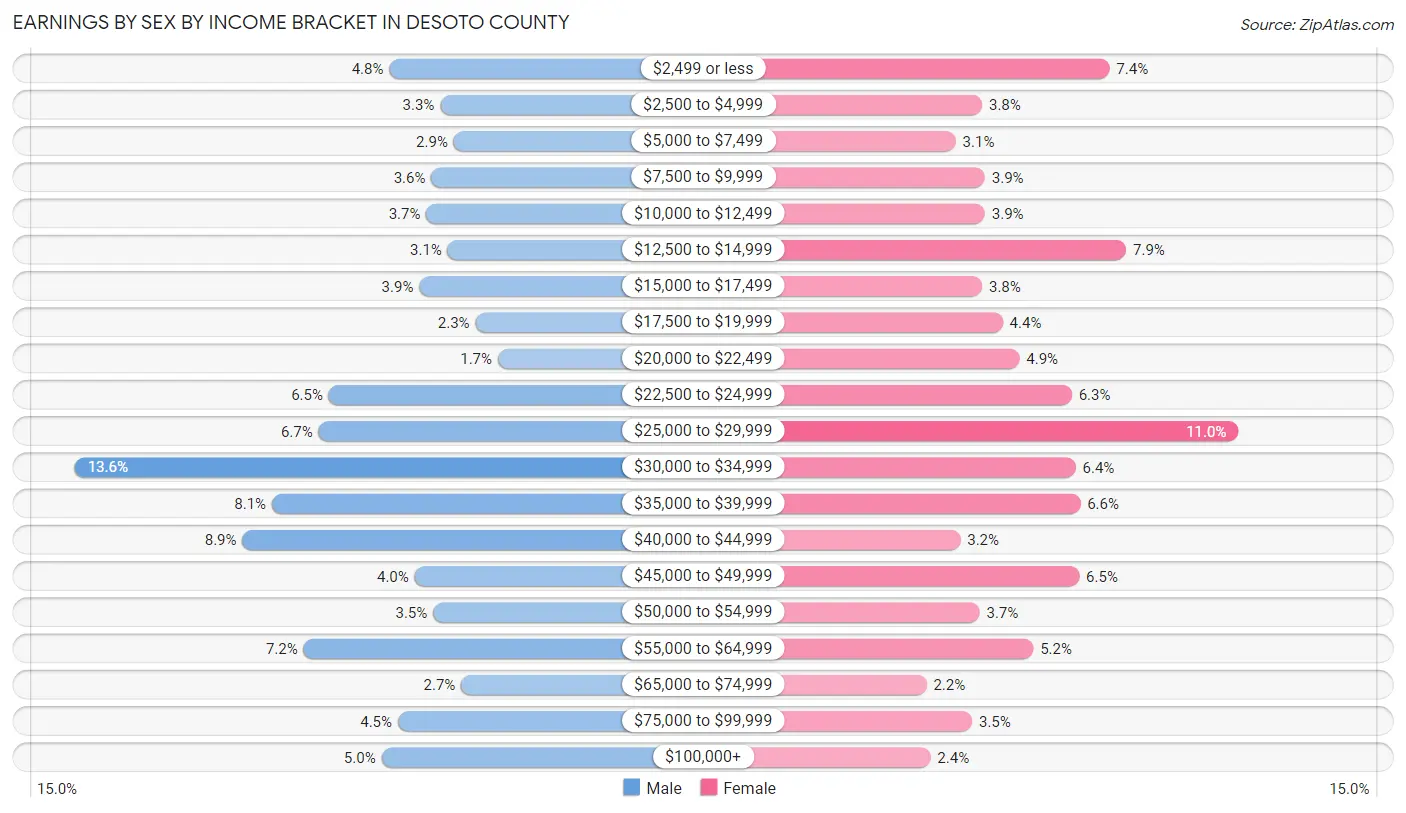
Earnings by Sex by Income Bracket in Desoto County
The most common earnings brackets in Desoto County are $30,000 to $34,999 for men (1,165 | 13.6%) and $25,000 to $29,999 for women (590 | 11.0%).
| Income | Male | Female |
| $2,499 or less | 407 (4.8%) | 396 (7.4%) |
| $2,500 to $4,999 | 285 (3.3%) | 204 (3.8%) |
| $5,000 to $7,499 | 252 (2.9%) | 164 (3.1%) |
| $7,500 to $9,999 | 306 (3.6%) | 208 (3.9%) |
| $10,000 to $12,499 | 318 (3.7%) | 208 (3.9%) |
| $12,500 to $14,999 | 267 (3.1%) | 421 (7.9%) |
| $15,000 to $17,499 | 335 (3.9%) | 204 (3.8%) |
| $17,500 to $19,999 | 200 (2.3%) | 235 (4.4%) |
| $20,000 to $22,499 | 146 (1.7%) | 260 (4.9%) |
| $22,500 to $24,999 | 553 (6.5%) | 339 (6.3%) |
| $25,000 to $29,999 | 578 (6.7%) | 590 (11.0%) |
| $30,000 to $34,999 | 1,165 (13.6%) | 345 (6.4%) |
| $35,000 to $39,999 | 690 (8.1%) | 352 (6.6%) |
| $40,000 to $44,999 | 761 (8.9%) | 171 (3.2%) |
| $45,000 to $49,999 | 346 (4.0%) | 350 (6.5%) |
| $50,000 to $54,999 | 302 (3.5%) | 200 (3.7%) |
| $55,000 to $64,999 | 614 (7.2%) | 281 (5.2%) |
| $65,000 to $74,999 | 234 (2.7%) | 120 (2.2%) |
| $75,000 to $99,999 | 387 (4.5%) | 189 (3.5%) |
| $100,000+ | 426 (5.0%) | 126 (2.4%) |
| Total | 8,572 (100.0%) | 5,363 (100.0%) |
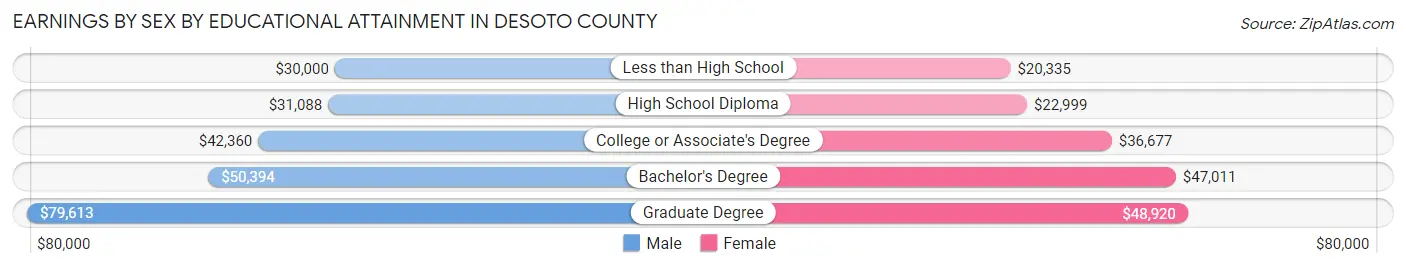
Earnings by Sex by Educational Attainment in Desoto County
Average earnings in Desoto County are $33,419 for men and $28,068 for women, a difference of 16.0%. Men with an educational attainment of graduate degree enjoy the highest average annual earnings of $79,613, while those with less than high school education earn the least with $30,000. Women with an educational attainment of graduate degree earn the most with the average annual earnings of $48,920, while those with less than high school education have the smallest earnings of $20,335.
| Educational Attainment | Male Income | Female Income |
| Less than High School | $30,000 | $20,335 |
| High School Diploma | $31,088 | $22,999 |
| College or Associate's Degree | $42,360 | $36,677 |
| Bachelor's Degree | $50,394 | $47,011 |
| Graduate Degree | $79,613 | $48,920 |
| Total | $33,419 | $28,068 |
Family Income in Desoto County
Family Income Brackets in Desoto County
According to the Desoto County family income data, there are 1,887 families falling into the $50,000 to $74,999 income range, which is the most common income bracket and makes up 22.7% of all families. Conversely, the $200,000+ income bracket is the least frequent group with only 175 families (2.1%) belonging to this category.
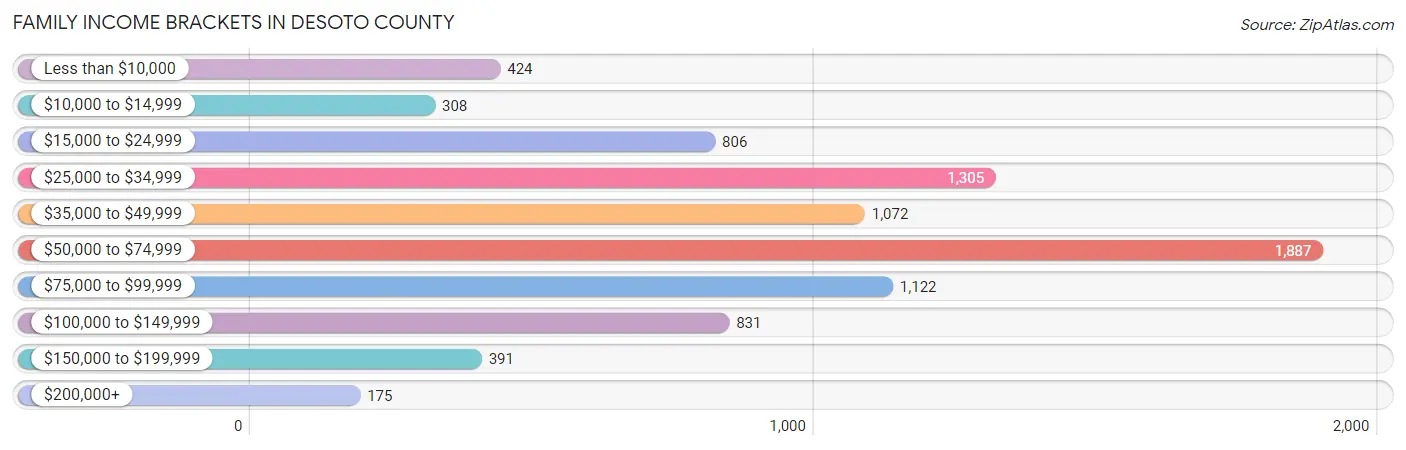
| Income Bracket | # Families | % Families |
| Less than $10,000 | 424 | 5.1% |
| $10,000 to $14,999 | 308 | 3.7% |
| $15,000 to $24,999 | 806 | 9.7% |
| $25,000 to $34,999 | 1,305 | 15.7% |
| $35,000 to $49,999 | 1,072 | 12.9% |
| $50,000 to $74,999 | 1,887 | 22.7% |
| $75,000 to $99,999 | 1,122 | 13.5% |
| $100,000 to $149,999 | 831 | 10.0% |
| $150,000 to $199,999 | 391 | 4.7% |
| $200,000+ | 175 | 2.1% |
Family Income by Famaliy Size in Desoto County
7+ person families (160 | 1.9%) account for the highest median family income in Desoto County with $84,750 per family, while 2-person families (4,461 | 53.7%) have the highest median income of $25,206 per family member.
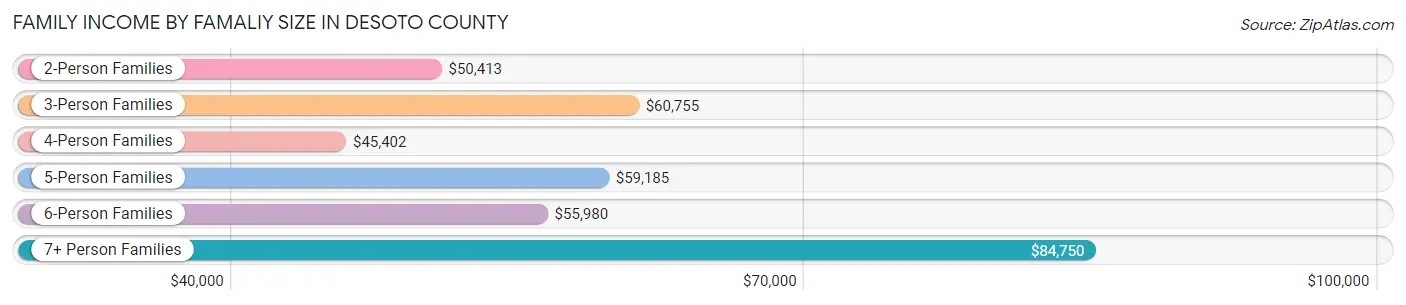
| Income Bracket | # Families | Median Income |
| 2-Person Families | 4,461 (53.7%) | $50,413 |
| 3-Person Families | 1,645 (19.8%) | $60,755 |
| 4-Person Families | 782 (9.4%) | $45,402 |
| 5-Person Families | 624 (7.5%) | $59,185 |
| 6-Person Families | 641 (7.7%) | $55,980 |
| 7+ Person Families | 160 (1.9%) | $84,750 |
| Total | 8,313 (100.0%) | $53,743 |
Family Income by Number of Earners in Desoto County
The median family income in Desoto County is $53,743, with families comprising 3+ earners (627) having the highest median family income of $92,526, while families with no earners (2,249) have the lowest median family income of $40,724, accounting for 7.5% and 27.1% of families, respectively.
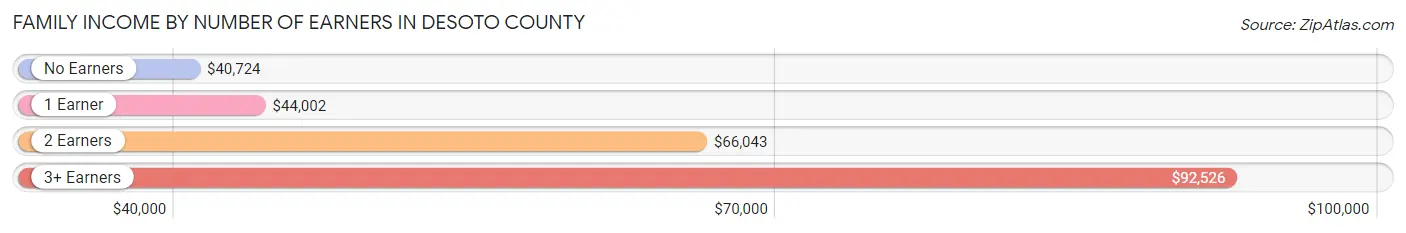
| Number of Earners | # Families | Median Income |
| No Earners | 2,249 (27.1%) | $40,724 |
| 1 Earner | 3,169 (38.1%) | $44,002 |
| 2 Earners | 2,268 (27.3%) | $66,043 |
| 3+ Earners | 627 (7.5%) | $92,526 |
| Total | 8,313 (100.0%) | $53,743 |
Household Income in Desoto County
Household Income Brackets in Desoto County
With 2,431 households falling in the category, the $50,000 to $74,999 income range is the most frequent in Desoto County, accounting for 19.7% of all households. In contrast, only 185 households (1.5%) fall into the $200,000+ income bracket, making it the least populous group.
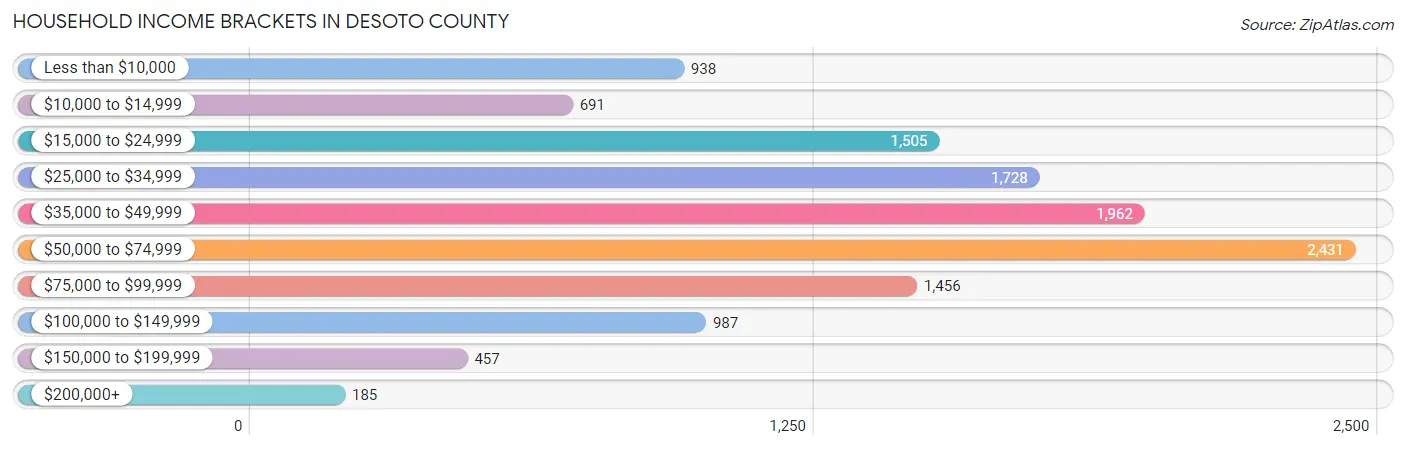
| Income Bracket | # Households | % Households |
| Less than $10,000 | 938 | 7.6% |
| $10,000 to $14,999 | 691 | 5.6% |
| $15,000 to $24,999 | 1,505 | 12.2% |
| $25,000 to $34,999 | 1,728 | 14.0% |
| $35,000 to $49,999 | 1,962 | 15.9% |
| $50,000 to $74,999 | 2,431 | 19.7% |
| $75,000 to $99,999 | 1,456 | 11.8% |
| $100,000 to $149,999 | 987 | 8.0% |
| $150,000 to $199,999 | 457 | 3.7% |
| $200,000+ | 185 | 1.5% |
Household Income by Householder Age in Desoto County
The median household income in Desoto County is $45,000, with the highest median household income of $47,889 found in the 45 to 64 years age bracket for the primary householder. A total of 3,735 households (30.3%) fall into this category. Meanwhile, the 15 to 24 years age bracket for the primary householder has the lowest median household income of $38,705, with 431 households (3.5%) in this group.
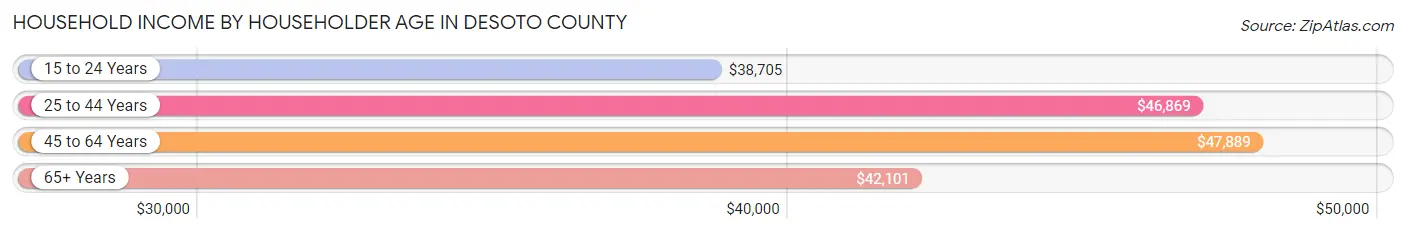
| Income Bracket | # Households | Median Income |
| 15 to 24 Years | 431 (3.5%) | $38,705 |
| 25 to 44 Years | 3,554 (28.8%) | $46,869 |
| 45 to 64 Years | 3,735 (30.3%) | $47,889 |
| 65+ Years | 4,620 (37.4%) | $42,101 |
| Total | 12,340 (100.0%) | $45,000 |
Poverty in Desoto County
Income Below Poverty by Sex and Age in Desoto County
With 25.6% poverty level for males and 27.3% for females among the residents of Desoto County, 6 to 11 year old males and under 5 year old females are the most vulnerable to poverty, with 470 males (43.0%) and 674 females (58.5%) in their respective age groups living below the poverty level.
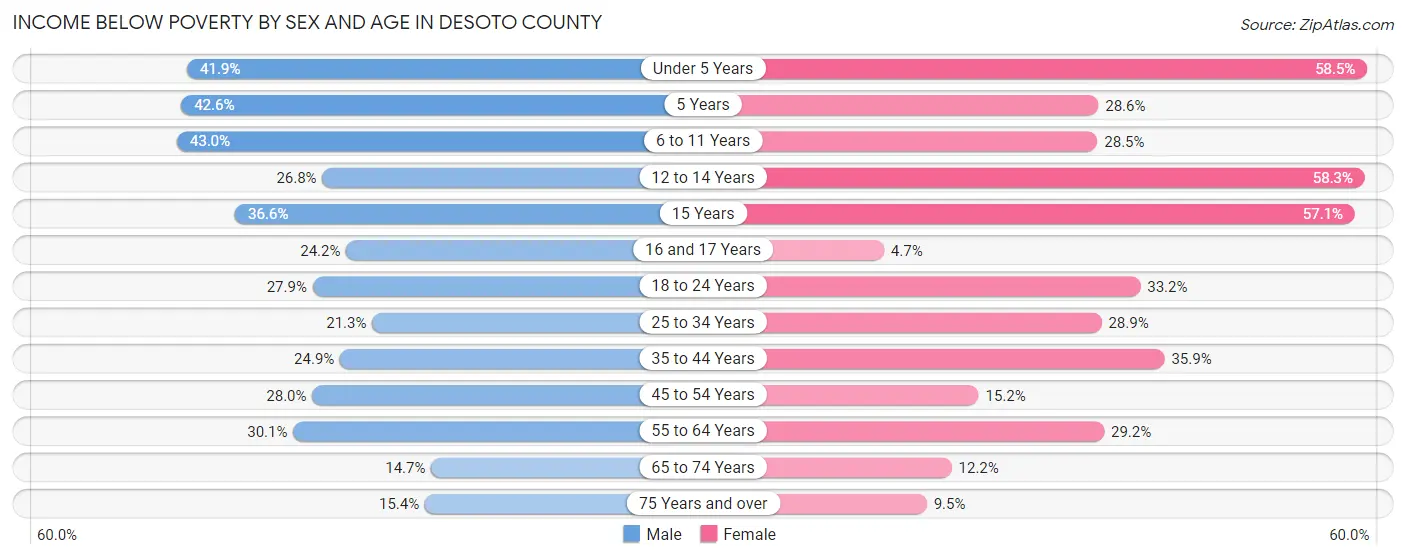
| Age Bracket | Male | Female |
| Under 5 Years | 225 (41.9%) | 674 (58.5%) |
| 5 Years | 80 (42.5%) | 34 (28.6%) |
| 6 to 11 Years | 470 (43.0%) | 226 (28.5%) |
| 12 to 14 Years | 110 (26.8%) | 385 (58.3%) |
| 15 Years | 121 (36.6%) | 72 (57.1%) |
| 16 and 17 Years | 116 (24.2%) | 12 (4.7%) |
| 18 to 24 Years | 461 (27.9%) | 372 (33.2%) |
| 25 to 34 Years | 559 (21.3%) | 457 (28.9%) |
| 35 to 44 Years | 594 (24.9%) | 575 (35.9%) |
| 45 to 54 Years | 620 (28.0%) | 256 (15.2%) |
| 55 to 64 Years | 625 (30.1%) | 583 (29.2%) |
| 65 to 74 Years | 289 (14.7%) | 258 (12.2%) |
| 75 Years and over | 265 (15.4%) | 162 (9.5%) |
| Total | 4,535 (25.6%) | 4,066 (27.3%) |
Income Above Poverty by Sex and Age in Desoto County
According to the poverty statistics in Desoto County, males aged 65 to 74 years and females aged 16 and 17 years are the age groups that are most secure financially, with 85.3% of males and 95.3% of females in these age groups living above the poverty line.
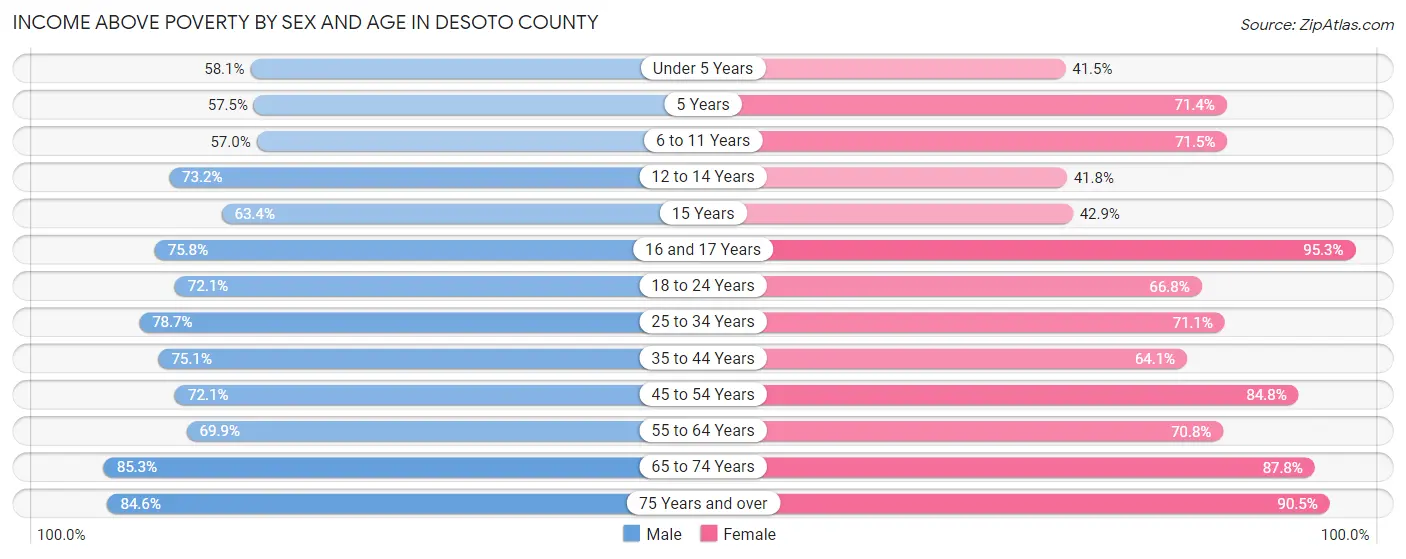
| Age Bracket | Male | Female |
| Under 5 Years | 312 (58.1%) | 478 (41.5%) |
| 5 Years | 108 (57.5%) | 85 (71.4%) |
| 6 to 11 Years | 622 (57.0%) | 568 (71.5%) |
| 12 to 14 Years | 300 (73.2%) | 276 (41.7%) |
| 15 Years | 210 (63.4%) | 54 (42.9%) |
| 16 and 17 Years | 364 (75.8%) | 244 (95.3%) |
| 18 to 24 Years | 1,191 (72.1%) | 747 (66.8%) |
| 25 to 34 Years | 2,068 (78.7%) | 1,123 (71.1%) |
| 35 to 44 Years | 1,795 (75.1%) | 1,025 (64.1%) |
| 45 to 54 Years | 1,598 (72.1%) | 1,425 (84.8%) |
| 55 to 64 Years | 1,453 (69.9%) | 1,413 (70.8%) |
| 65 to 74 Years | 1,675 (85.3%) | 1,852 (87.8%) |
| 75 Years and over | 1,456 (84.6%) | 1,551 (90.5%) |
| Total | 13,152 (74.4%) | 10,841 (72.7%) |
Income Below Poverty Among Married-Couple Families in Desoto County
The poverty statistics for married-couple families in Desoto County show that 13.7% or 749 of the total 5,475 families live below the poverty line. Families with 5 or more children have the highest poverty rate of 59.2%, comprising of 45 families. On the other hand, families with no children have the lowest poverty rate of 8.5%, which includes 298 families.
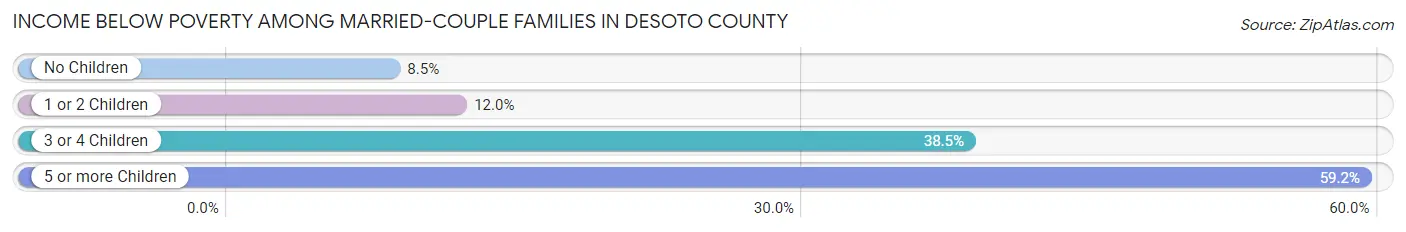
| Children | Above Poverty | Below Poverty |
| No Children | 3,218 (91.5%) | 298 (8.5%) |
| 1 or 2 Children | 1,059 (88.0%) | 144 (12.0%) |
| 3 or 4 Children | 418 (61.5%) | 262 (38.5%) |
| 5 or more Children | 31 (40.8%) | 45 (59.2%) |
| Total | 4,726 (86.3%) | 749 (13.7%) |
Income Below Poverty Among Single-Parent Households in Desoto County
According to the poverty data in Desoto County, 9.7% or 71 single-father households and 36.2% or 761 single-mother households are living below the poverty line. Among single-father households, those with no children have the highest poverty rate, with 45 households (12.3%) experiencing poverty. Likewise, among single-mother households, those with 5 or more children have the highest poverty rate, with 51 households (100.0%) falling below the poverty line.
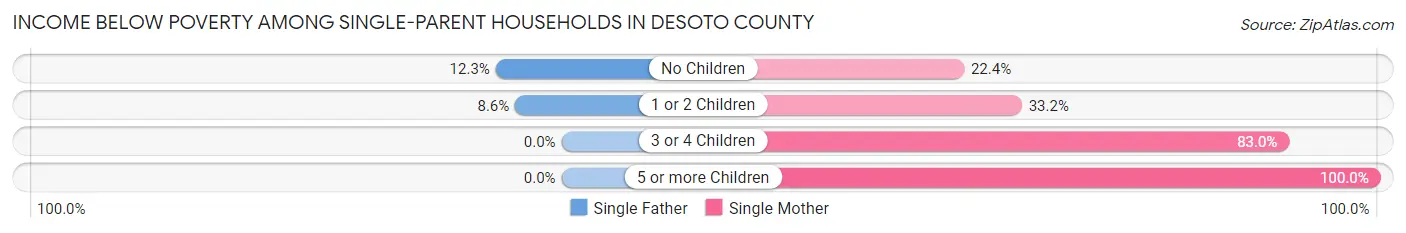
| Children | Single Father | Single Mother |
| No Children | 45 (12.3%) | 182 (22.4%) |
| 1 or 2 Children | 26 (8.6%) | 333 (33.2%) |
| 3 or 4 Children | 0 (0.0%) | 195 (83.0%) |
| 5 or more Children | 0 (0.0%) | 51 (100.0%) |
| Total | 71 (9.7%) | 761 (36.2%) |
Income Below Poverty Among Married-Couple vs Single-Parent Households in Desoto County
The poverty data for Desoto County shows that 749 of the married-couple family households (13.7%) and 832 of the single-parent households (29.3%) are living below the poverty level. Within the married-couple family households, those with 5 or more children have the highest poverty rate, with 45 households (59.2%) falling below the poverty line. Among the single-parent households, those with 5 or more children have the highest poverty rate, with 51 household (100.0%) living below poverty.
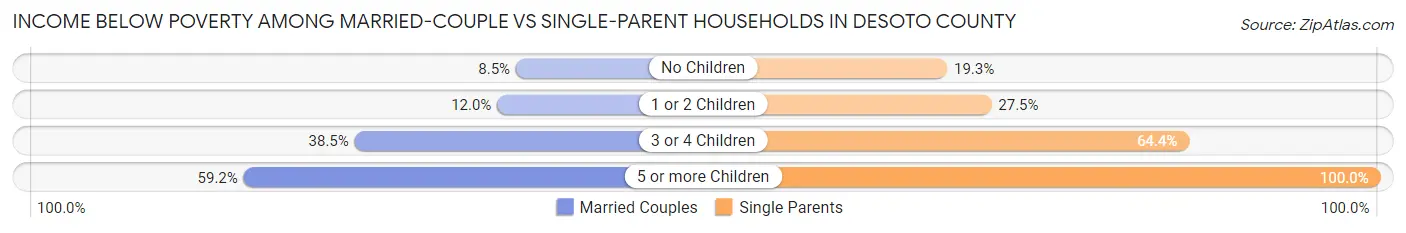
| Children | Married-Couple Families | Single-Parent Households |
| No Children | 298 (8.5%) | 227 (19.3%) |
| 1 or 2 Children | 144 (12.0%) | 359 (27.5%) |
| 3 or 4 Children | 262 (38.5%) | 195 (64.4%) |
| 5 or more Children | 45 (59.2%) | 51 (100.0%) |
| Total | 749 (13.7%) | 832 (29.3%) |
Race in Desoto County
The most populous races in Desoto County are White / Caucasian (24,790 | 72.4%), Hispanic or Latino (10,979 | 32.1%), and Black / African American (4,247 | 12.4%).
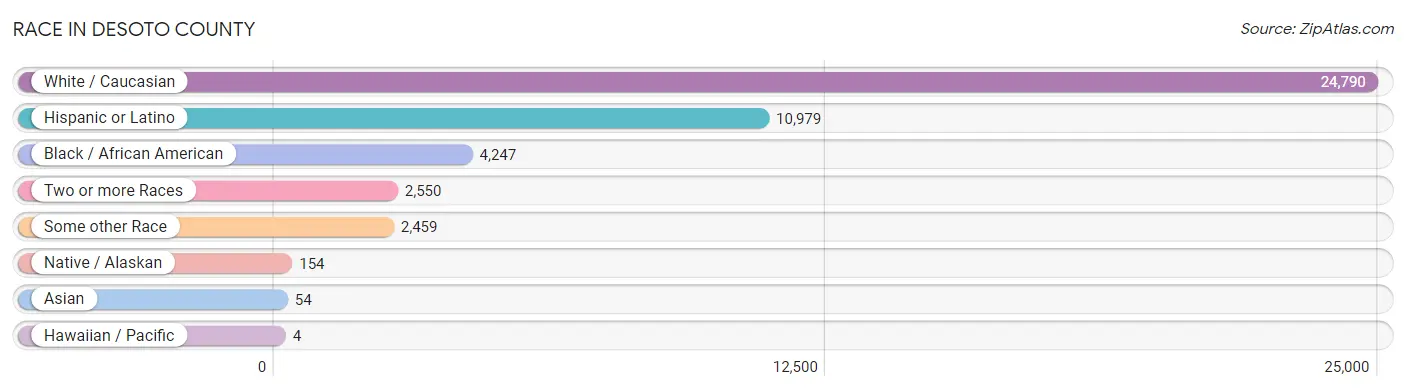
| Race | # Population | % Population |
| Asian | 54 | 0.2% |
| Black / African American | 4,247 | 12.4% |
| Hawaiian / Pacific | 4 | 0.0% |
| Hispanic or Latino | 10,979 | 32.1% |
| Native / Alaskan | 154 | 0.4% |
| White / Caucasian | 24,790 | 72.4% |
| Two or more Races | 2,550 | 7.4% |
| Some other Race | 2,459 | 7.2% |
| Total | 34,258 | 100.0% |
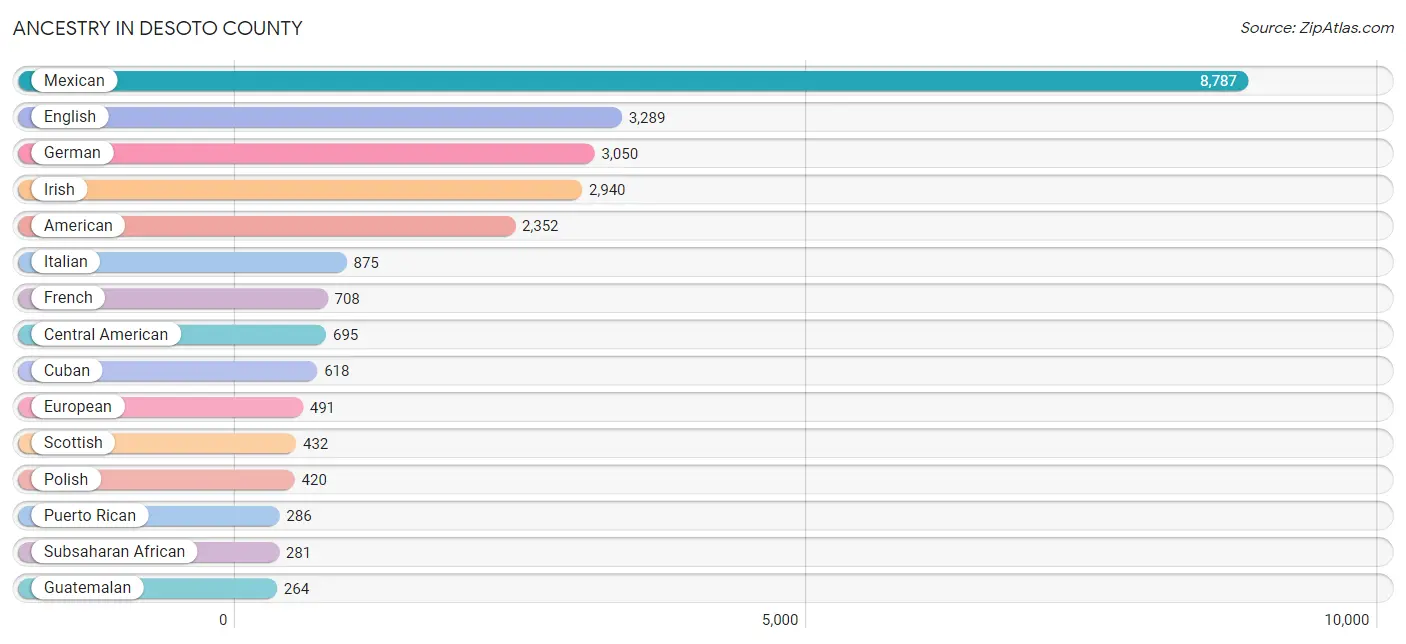
Ancestry in Desoto County
The most populous ancestries reported in Desoto County are Mexican (8,787 | 25.7%), English (3,289 | 9.6%), German (3,050 | 8.9%), Irish (2,940 | 8.6%), and American (2,352 | 6.9%), together accounting for 59.6% of all Desoto County residents.
| Ancestry | # Population | % Population |
| African | 219 | 0.6% |
| Albanian | 32 | 0.1% |
| American | 2,352 | 6.9% |
| Arab | 105 | 0.3% |
| Argentinean | 35 | 0.1% |
| Armenian | 11 | 0.0% |
| Austrian | 61 | 0.2% |
| Belgian | 14 | 0.0% |
| Bhutanese | 6 | 0.0% |
| Blackfeet | 8 | 0.0% |
| Brazilian | 12 | 0.0% |
| British | 48 | 0.1% |
| Burmese | 22 | 0.1% |
| Canadian | 107 | 0.3% |
| Central American | 695 | 2.0% |
| Cherokee | 81 | 0.2% |
| Cheyenne | 4 | 0.0% |
| Chippewa | 23 | 0.1% |
| Colombian | 23 | 0.1% |
| Cuban | 618 | 1.8% |
| Czech | 32 | 0.1% |
| Danish | 18 | 0.1% |
| Dominican | 167 | 0.5% |
| Dutch | 256 | 0.7% |
| Eastern European | 26 | 0.1% |
| Ecuadorian | 8 | 0.0% |
| English | 3,289 | 9.6% |
| Ethiopian | 62 | 0.2% |
| European | 491 | 1.4% |
| Finnish | 29 | 0.1% |
| French | 708 | 2.1% |
| French Canadian | 93 | 0.3% |
| German | 3,050 | 8.9% |
| Greek | 7 | 0.0% |
| Guatemalan | 264 | 0.8% |
| Haitian | 167 | 0.5% |
| Honduran | 239 | 0.7% |
| Hungarian | 198 | 0.6% |
| Indian (Asian) | 5 | 0.0% |
| Irish | 2,940 | 8.6% |
| Israeli | 10 | 0.0% |
| Italian | 875 | 2.5% |
| Jamaican | 127 | 0.4% |
| Korean | 45 | 0.1% |
| Lebanese | 31 | 0.1% |
| Lithuanian | 13 | 0.0% |
| Lumbee | 3 | 0.0% |
| Luxembourger | 8 | 0.0% |
| Maltese | 7 | 0.0% |
| Mexican | 8,787 | 25.7% |
| Mexican American Indian | 102 | 0.3% |
| Native Hawaiian | 11 | 0.0% |
| Northern European | 7 | 0.0% |
| Norwegian | 60 | 0.2% |
| Panamanian | 6 | 0.0% |
| Pennsylvania German | 7 | 0.0% |
| Peruvian | 17 | 0.1% |
| Polish | 420 | 1.2% |
| Portuguese | 39 | 0.1% |
| Puerto Rican | 286 | 0.8% |
| Russian | 135 | 0.4% |
| Salvadoran | 186 | 0.5% |
| Samoan | 4 | 0.0% |
| Scandinavian | 63 | 0.2% |
| Scotch-Irish | 147 | 0.4% |
| Scottish | 432 | 1.3% |
| Serbian | 9 | 0.0% |
| Slovak | 10 | 0.0% |
| South American | 83 | 0.2% |
| Spaniard | 48 | 0.1% |
| Spanish | 146 | 0.4% |
| Subsaharan African | 281 | 0.8% |
| Swedish | 193 | 0.6% |
| Swiss | 84 | 0.3% |
| Syrian | 66 | 0.2% |
| Thai | 33 | 0.1% |
| Turkish | 26 | 0.1% |
| Welsh | 104 | 0.3% | View All 78 Rows |
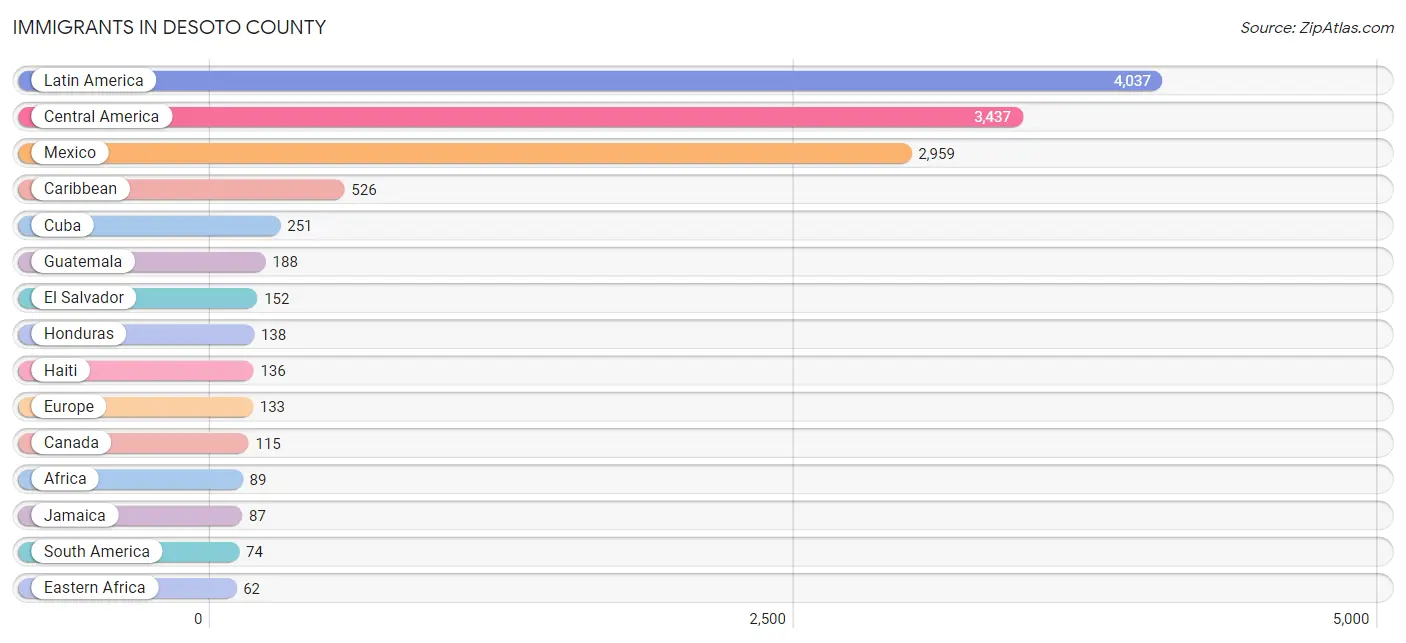
Immigrants in Desoto County
The most numerous immigrant groups reported in Desoto County came from Latin America (4,037 | 11.8%), Central America (3,437 | 10.0%), Mexico (2,959 | 8.6%), Caribbean (526 | 1.5%), and Cuba (251 | 0.7%), together accounting for 32.7% of all Desoto County residents.
| Immigration Origin | # Population | % Population |
| Africa | 89 | 0.3% |
| Argentina | 25 | 0.1% |
| Asia | 55 | 0.2% |
| Azores | 5 | 0.0% |
| Brazil | 12 | 0.0% |
| Canada | 115 | 0.3% |
| Caribbean | 526 | 1.5% |
| Central America | 3,437 | 10.0% |
| Colombia | 12 | 0.0% |
| Cuba | 251 | 0.7% |
| Dominican Republic | 48 | 0.1% |
| Eastern Africa | 62 | 0.2% |
| Eastern Asia | 5 | 0.0% |
| Eastern Europe | 33 | 0.1% |
| Ecuador | 8 | 0.0% |
| El Salvador | 152 | 0.4% |
| England | 21 | 0.1% |
| Ethiopia | 62 | 0.2% |
| Europe | 133 | 0.4% |
| France | 9 | 0.0% |
| Germany | 39 | 0.1% |
| Guatemala | 188 | 0.5% |
| Haiti | 136 | 0.4% |
| Honduras | 138 | 0.4% |
| Israel | 10 | 0.0% |
| Jamaica | 87 | 0.3% |
| Korea | 5 | 0.0% |
| Latin America | 4,037 | 11.8% |
| Mexico | 2,959 | 8.6% |
| Northern Europe | 47 | 0.1% |
| Peru | 17 | 0.1% |
| Philippines | 40 | 0.1% |
| Portugal | 5 | 0.0% |
| Russia | 31 | 0.1% |
| Scotland | 8 | 0.0% |
| South Africa | 27 | 0.1% |
| South America | 74 | 0.2% |
| South Eastern Asia | 40 | 0.1% |
| Southern Europe | 5 | 0.0% |
| Western Asia | 10 | 0.0% |
| Western Europe | 48 | 0.1% | View All 41 Rows |
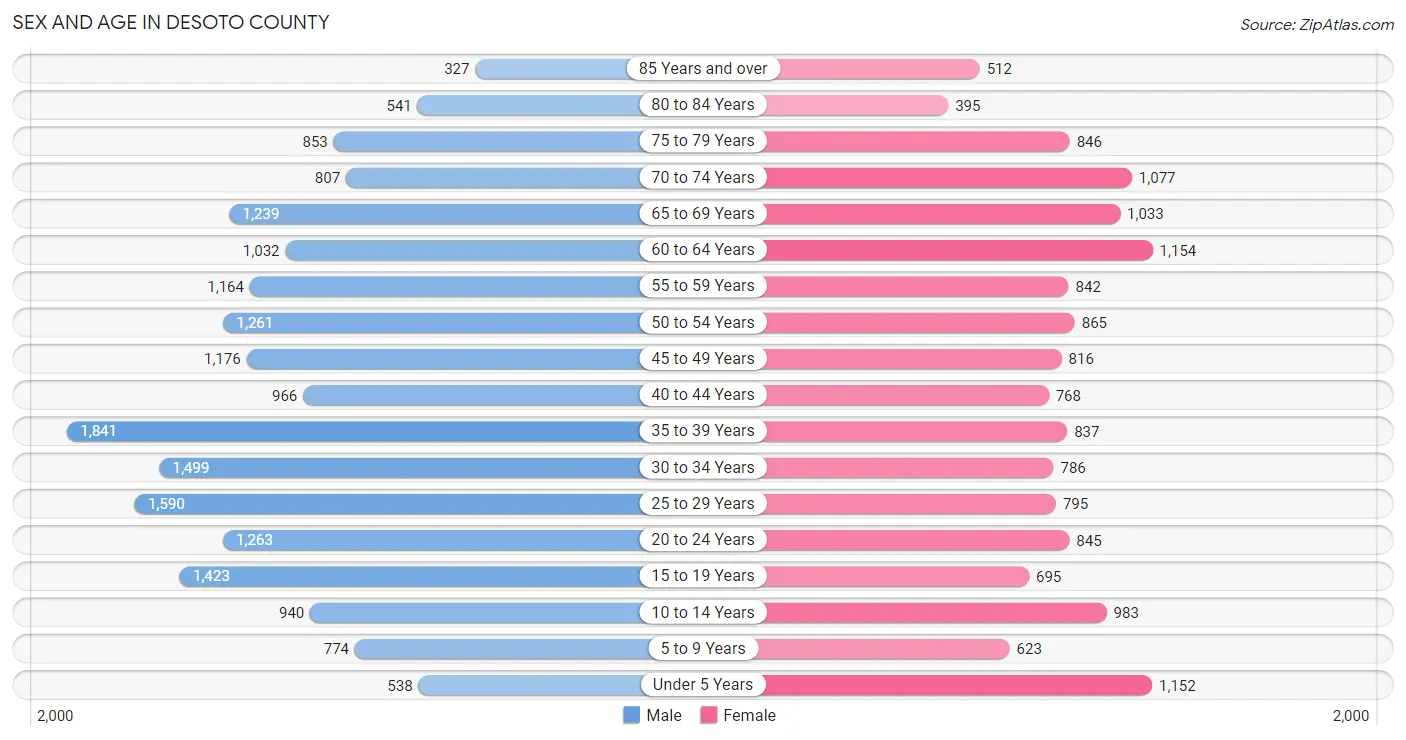
Sex and Age in Desoto County
Sex and Age in Desoto County
The most populous age groups in Desoto County are 35 to 39 Years (1,841 | 9.6%) for men and 60 to 64 Years (1,154 | 7.7%) for women.
| Age Bracket | Male | Female |
| Under 5 Years | 538 (2.8%) | 1,152 (7.7%) |
| 5 to 9 Years | 774 (4.0%) | 623 (4.2%) |
| 10 to 14 Years | 940 (4.9%) | 983 (6.5%) |
| 15 to 19 Years | 1,423 (7.4%) | 695 (4.6%) |
| 20 to 24 Years | 1,263 (6.6%) | 845 (5.6%) |
| 25 to 29 Years | 1,590 (8.3%) | 795 (5.3%) |
| 30 to 34 Years | 1,499 (7.8%) | 786 (5.2%) |
| 35 to 39 Years | 1,841 (9.6%) | 837 (5.6%) |
| 40 to 44 Years | 966 (5.0%) | 768 (5.1%) |
| 45 to 49 Years | 1,176 (6.1%) | 816 (5.4%) |
| 50 to 54 Years | 1,261 (6.6%) | 865 (5.8%) |
| 55 to 59 Years | 1,164 (6.0%) | 842 (5.6%) |
| 60 to 64 Years | 1,032 (5.4%) | 1,154 (7.7%) |
| 65 to 69 Years | 1,239 (6.4%) | 1,033 (6.9%) |
| 70 to 74 Years | 807 (4.2%) | 1,077 (7.2%) |
| 75 to 79 Years | 853 (4.4%) | 846 (5.6%) |
| 80 to 84 Years | 541 (2.8%) | 395 (2.6%) |
| 85 Years and over | 327 (1.7%) | 512 (3.4%) |
| Total | 19,234 (100.0%) | 15,024 (100.0%) |
Families and Households in Desoto County
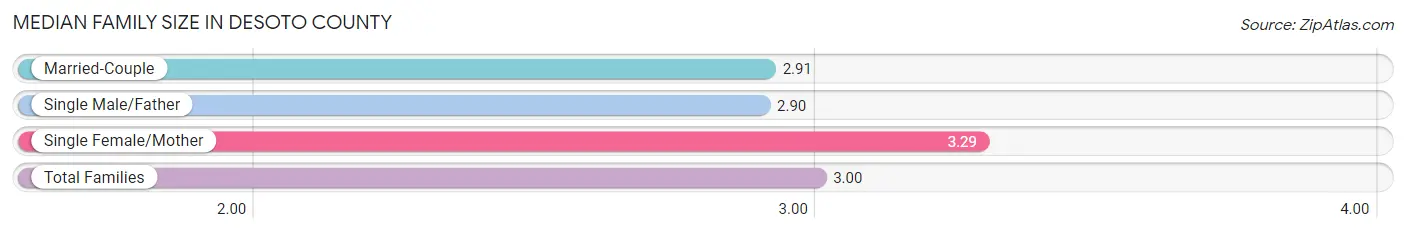
Median Family Size in Desoto County
The median family size in Desoto County is 3.00 persons per family, with single female/mother families (2,102 | 25.3%) accounting for the largest median family size of 3.29 persons per family. On the other hand, single male/father families (736 | 8.8%) represent the smallest median family size with 2.90 persons per family.
| Family Type | # Families | Family Size |
| Married-Couple | 5,475 (65.9%) | 2.91 |
| Single Male/Father | 736 (8.8%) | 2.90 |
| Single Female/Mother | 2,102 (25.3%) | 3.29 |
| Total Families | 8,313 (100.0%) | 3.00 |
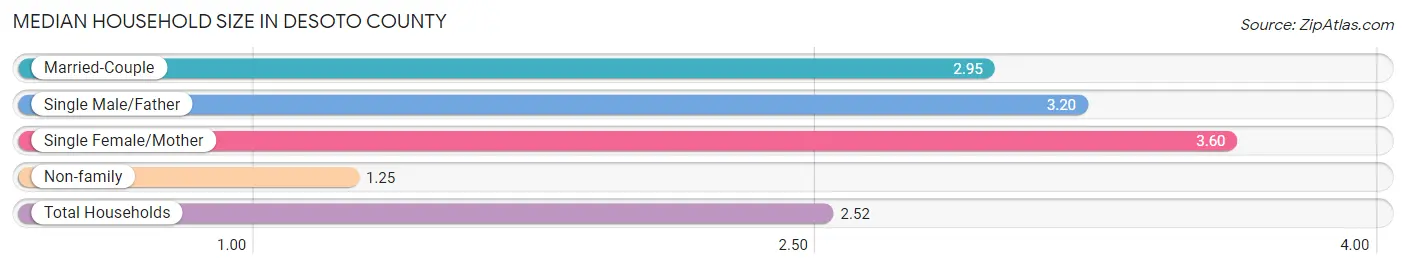
Median Household Size in Desoto County
The median household size in Desoto County is 2.52 persons per household, with single female/mother households (2,102 | 17.0%) accounting for the largest median household size of 3.6 persons per household. non-family households (4,027 | 32.6%) represent the smallest median household size with 1.25 persons per household.
| Household Type | # Households | Household Size |
| Married-Couple | 5,475 (44.4%) | 2.95 |
| Single Male/Father | 736 (6.0%) | 3.20 |
| Single Female/Mother | 2,102 (17.0%) | 3.60 |
| Non-family | 4,027 (32.6%) | 1.25 |
| Total Households | 12,340 (100.0%) | 2.52 |
Household Size by Marriage Status in Desoto County
Out of a total of 12,340 households in Desoto County, 8,313 (67.4%) are family households, while 4,027 (32.6%) are nonfamily households. The most numerous type of family households are 2-person households, comprising 4,140, and the most common type of nonfamily households are 1-person households, comprising 3,293.
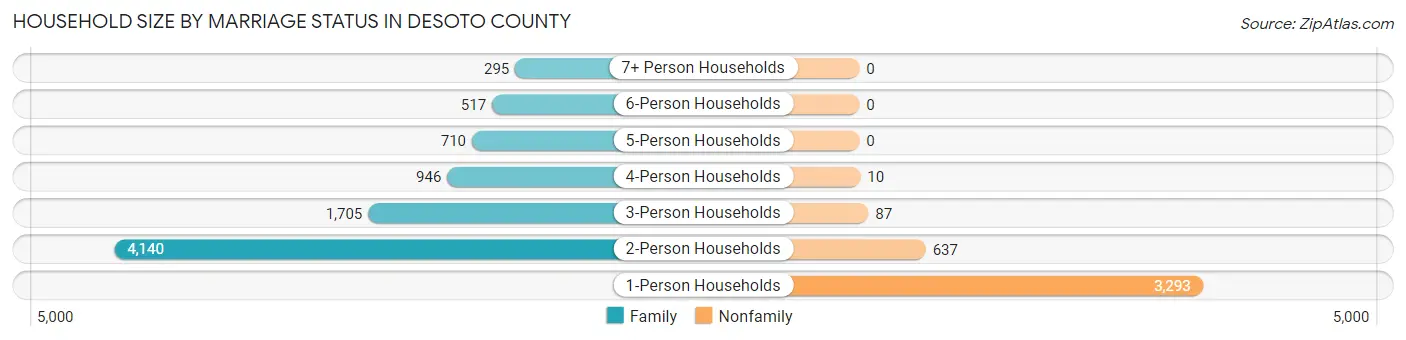
| Household Size | Family Households | Nonfamily Households |
| 1-Person Households | - | 3,293 (26.7%) |
| 2-Person Households | 4,140 (33.6%) | 637 (5.2%) |
| 3-Person Households | 1,705 (13.8%) | 87 (0.7%) |
| 4-Person Households | 946 (7.7%) | 10 (0.1%) |
| 5-Person Households | 710 (5.8%) | 0 (0.0%) |
| 6-Person Households | 517 (4.2%) | 0 (0.0%) |
| 7+ Person Households | 295 (2.4%) | 0 (0.0%) |
| Total | 8,313 (67.4%) | 4,027 (32.6%) |
Female Fertility in Desoto County
Fertility by Age in Desoto County
Average fertility rate in Desoto County is 30.0 births per 1,000 women. Women in the age bracket of 20 to 34 years have the highest fertility rate with 70.0 births per 1,000 women. Women in the age bracket of 20 to 34 years acount for 100.0% of all women with births.
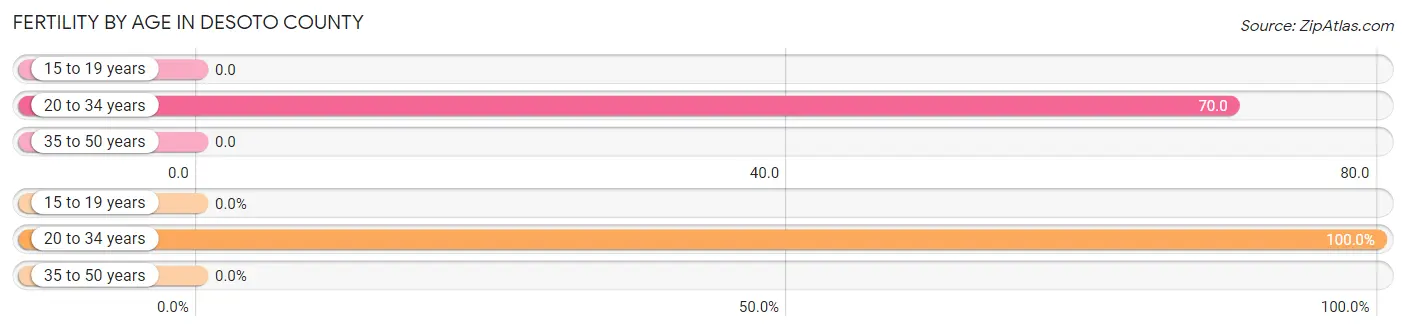
| Age Bracket | Women with Births | Births / 1,000 Women |
| 15 to 19 years | 0 (0.0%) | 0.0 |
| 20 to 34 years | 170 (100.0%) | 70.0 |
| 35 to 50 years | 0 (0.0%) | 0.0 |
| Total | 170 (100.0%) | 30.0 |
Fertility by Age by Marriage Status in Desoto County
39.4% of women with births (170) in Desoto County are married. The highest percentage of unmarried women with births falls into 20 to 34 years age bracket with 60.6% of them unmarried at the time of birth, while the lowest percentage of unmarried women with births belong to 20 to 34 years age bracket with 60.6% of them unmarried.
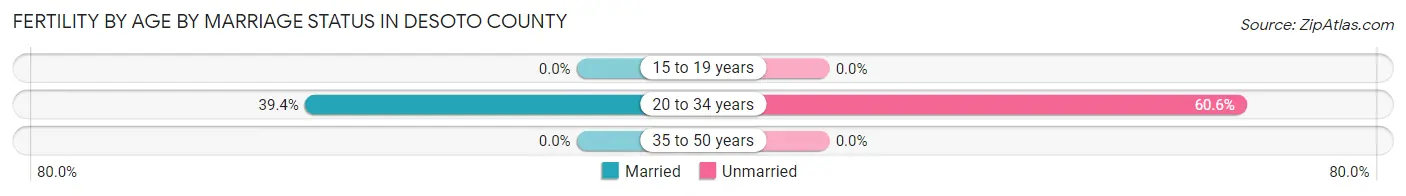
| Age Bracket | Married | Unmarried |
| 15 to 19 years | 0 (0.0%) | 0 (0.0%) |
| 20 to 34 years | 67 (39.4%) | 103 (60.6%) |
| 35 to 50 years | 0 (0.0%) | 0 (0.0%) |
| Total | 67 (39.4%) | 103 (60.6%) |
Fertility by Education in Desoto County
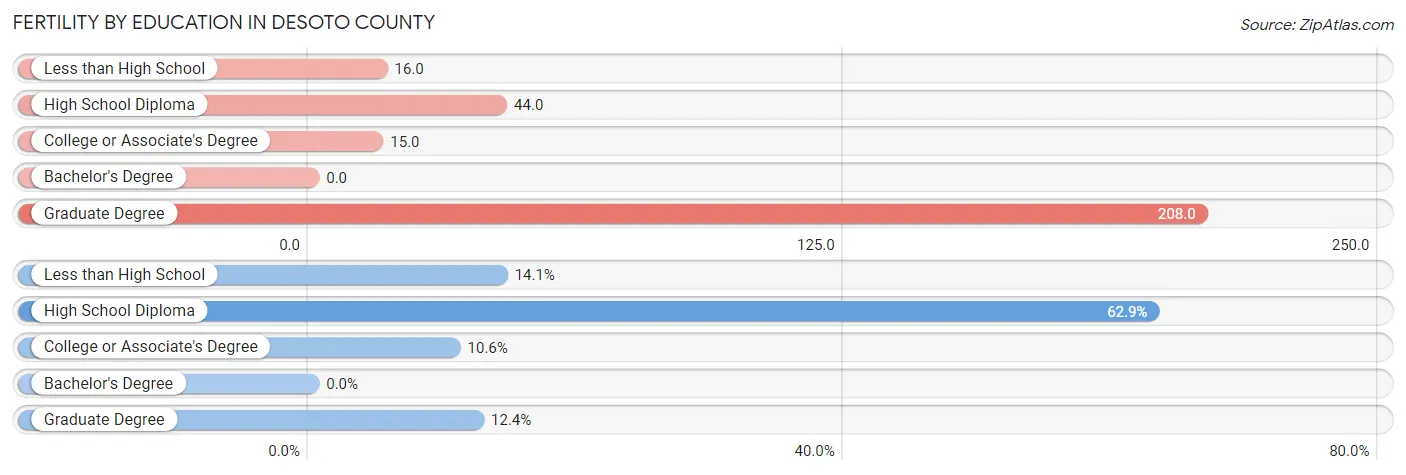
| Educational Attainment | Women with Births | Births / 1,000 Women |
| Less than High School | 24 (14.1%) | 16.0 |
| High School Diploma | 107 (62.9%) | 44.0 |
| College or Associate's Degree | 18 (10.6%) | 15.0 |
| Bachelor's Degree | 0 (0.0%) | 0.0 |
| Graduate Degree | 21 (12.3%) | 208.0 |
| Total | 170 (100.0%) | 30.0 |
Fertility by Education by Marriage Status in Desoto County
60.6% of women with births in Desoto County are unmarried. Women with the educational attainment of graduate degree are most likely to be married with 100.0% of them married at childbirth, while women with the educational attainment of less than high school are least likely to be married with 100.0% of them unmarried at childbirth.
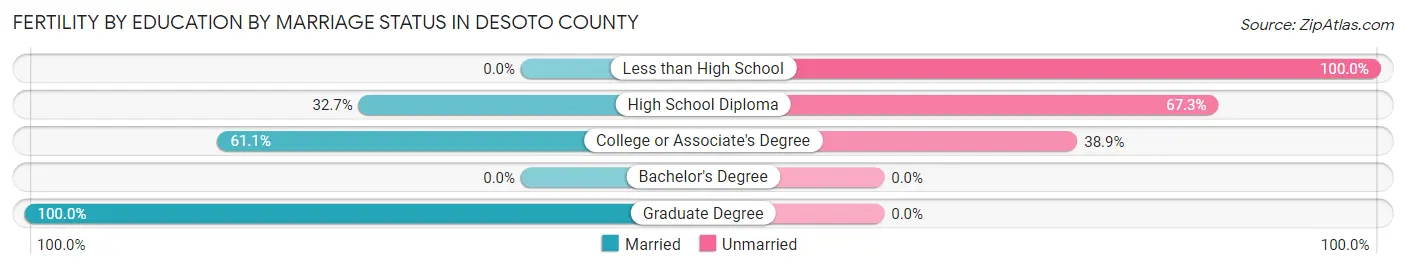
| Educational Attainment | Married | Unmarried |
| Less than High School | 0 (0.0%) | 24 (100.0%) |
| High School Diploma | 35 (32.7%) | 72 (67.3%) |
| College or Associate's Degree | 11 (61.1%) | 7 (38.9%) |
| Bachelor's Degree | 0 (0.0%) | 0 (0.0%) |
| Graduate Degree | 21 (100.0%) | 0 (0.0%) |
| Total | 67 (39.4%) | 103 (60.6%) |
Employment Characteristics in Desoto County
Employment by Class of Employer in Desoto County
Among the 12,092 employed individuals in Desoto County, private company employees (8,126 | 67.2%), local government employees (1,205 | 10.0%), and not-for-profit organizations (823 | 6.8%) make up the most common classes of employment.
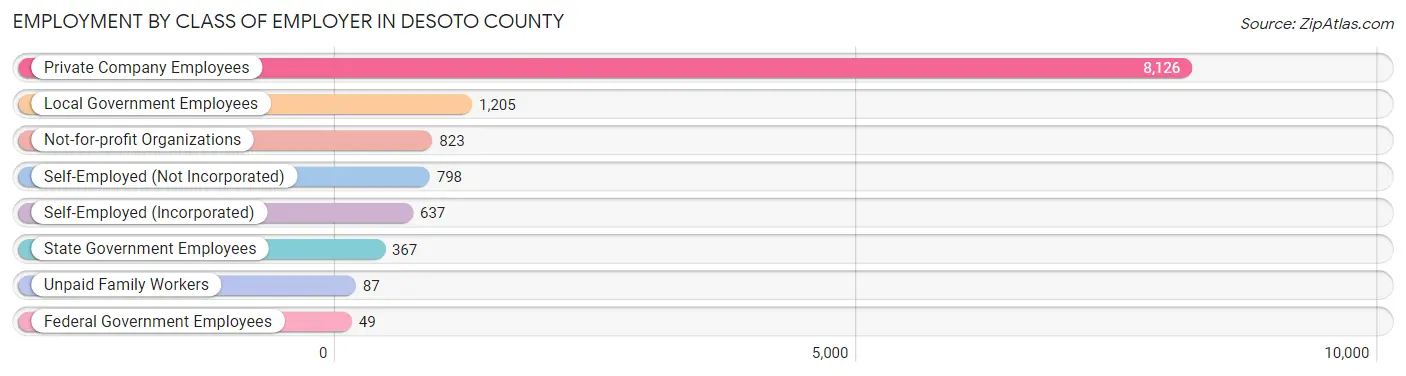
| Employer Class | # Employees | % Employees |
| Private Company Employees | 8,126 | 67.2% |
| Self-Employed (Incorporated) | 637 | 5.3% |
| Self-Employed (Not Incorporated) | 798 | 6.6% |
| Not-for-profit Organizations | 823 | 6.8% |
| Local Government Employees | 1,205 | 10.0% |
| State Government Employees | 367 | 3.0% |
| Federal Government Employees | 49 | 0.4% |
| Unpaid Family Workers | 87 | 0.7% |
| Total | 12,092 | 100.0% |
Employment Status by Age in Desoto County
According to the labor force statistics for Desoto County, out of the total population over 16 years of age (28,791), 47.7% or 13,733 individuals are in the labor force, with 9.7% or 1,332 of them unemployed. The age group with the highest labor force participation rate is 25 to 29 years, with 75.4% or 1,798 individuals in the labor force. Within the labor force, the 25 to 29 years age range has the highest percentage of unemployed individuals, with 21.7% or 390 of them being unemployed.
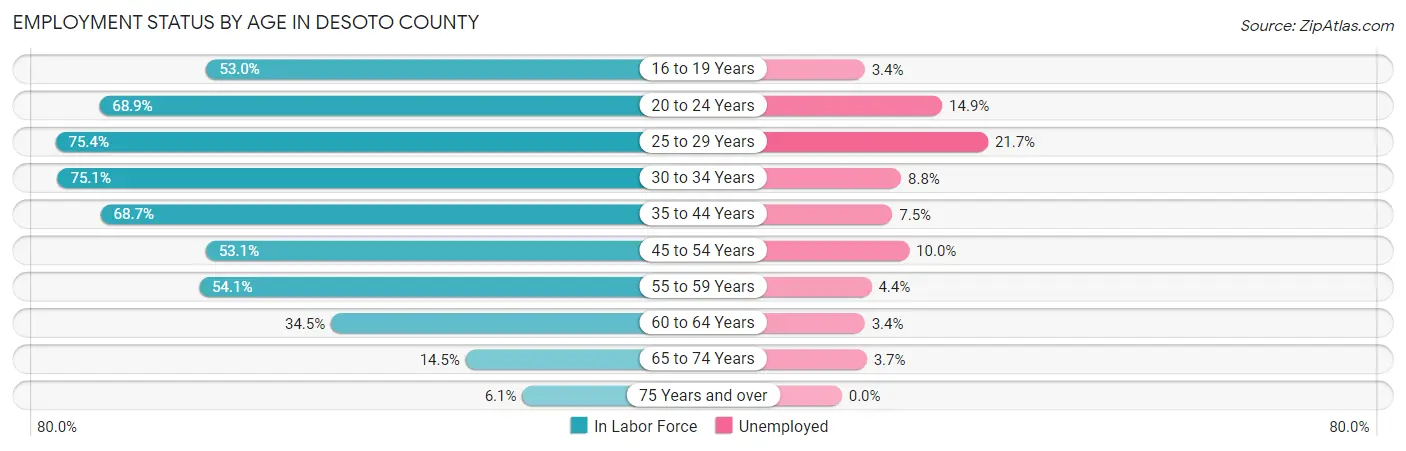
| Age Bracket | In Labor Force | Unemployed |
| 16 to 19 Years | 880 (53.0%) | 30 (3.4%) |
| 20 to 24 Years | 1,452 (68.9%) | 216 (14.9%) |
| 25 to 29 Years | 1,798 (75.4%) | 390 (21.7%) |
| 30 to 34 Years | 1,716 (75.1%) | 151 (8.8%) |
| 35 to 44 Years | 3,031 (68.7%) | 227 (7.5%) |
| 45 to 54 Years | 2,187 (53.1%) | 219 (10.0%) |
| 55 to 59 Years | 1,085 (54.1%) | 48 (4.4%) |
| 60 to 64 Years | 754 (34.5%) | 26 (3.4%) |
| 65 to 74 Years | 603 (14.5%) | 22 (3.7%) |
| 75 Years and over | 212 (6.1%) | 0 (0.0%) |
| Total | 13,733 (47.7%) | 1,332 (9.7%) |
Employment Status by Educational Attainment in Desoto County
According to labor force statistics for Desoto County, 60.8% of individuals (10,574) out of the total population between 25 and 64 years of age (17,392) are in the labor force, with 10.0% or 1,057 of them being unemployed. The group with the highest labor force participation rate are those with the educational attainment of bachelor's degree or higher, with 76.8% or 1,273 individuals in the labor force. Within the labor force, individuals with less than high school education have the highest percentage of unemployment, with 20.3% or 596 of them being unemployed.
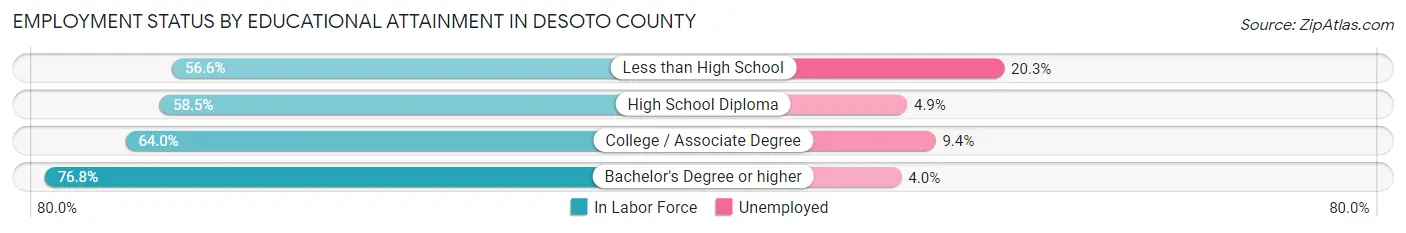
| Educational Attainment | In Labor Force | Unemployed |
| Less than High School | 2,935 (56.6%) | 1,053 (20.3%) |
| High School Diploma | 4,149 (58.5%) | 348 (4.9%) |
| College / Associate Degree | 2,212 (64.0%) | 325 (9.4%) |
| Bachelor's Degree or higher | 1,273 (76.8%) | 66 (4.0%) |
| Total | 10,574 (60.8%) | 1,739 (10.0%) |
Employment Occupations by Sex in Desoto County
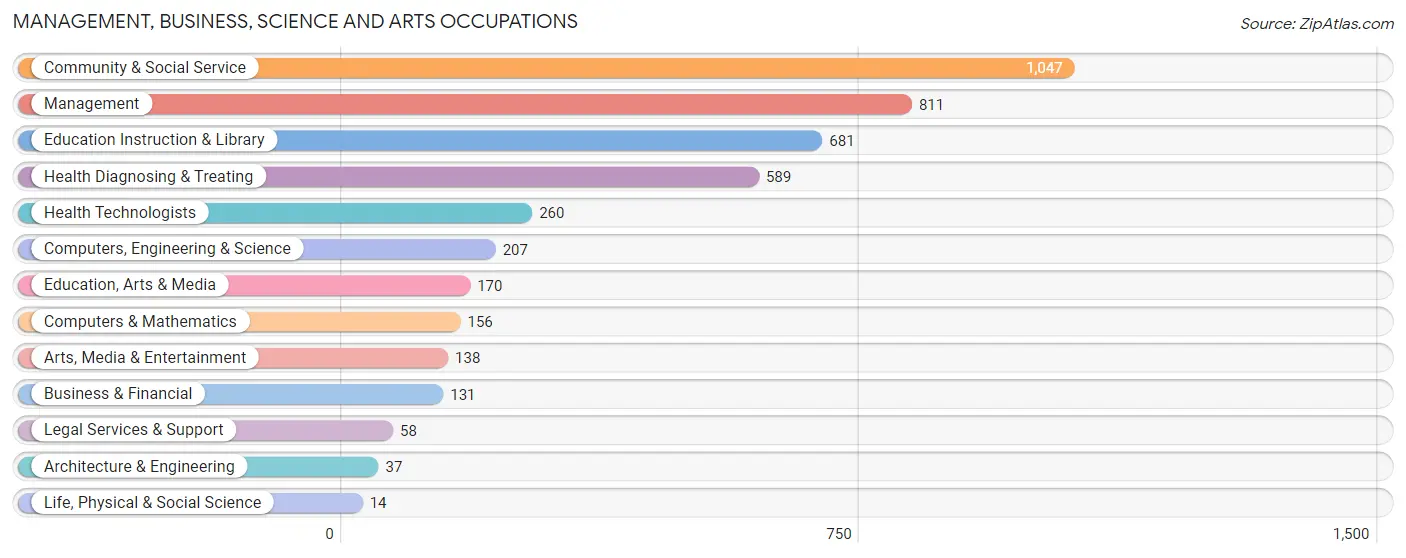
Management, Business, Science and Arts Occupations
The most common Management, Business, Science and Arts occupations in Desoto County are Community & Social Service (1,047 | 8.5%), Management (811 | 6.6%), Education Instruction & Library (681 | 5.5%), Health Diagnosing & Treating (589 | 4.8%), and Health Technologists (260 | 2.1%).
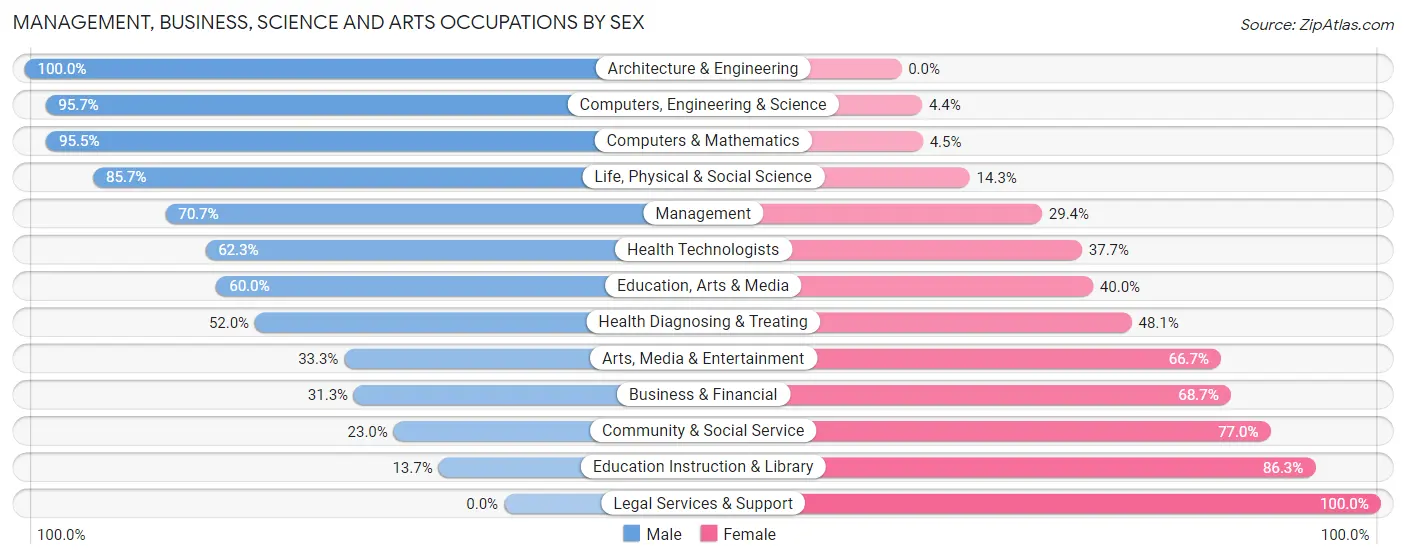
Management, Business, Science and Arts Occupations by Sex
Within the Management, Business, Science and Arts occupations in Desoto County, the most male-oriented occupations are Architecture & Engineering (100.0%), Computers, Engineering & Science (95.7%), and Computers & Mathematics (95.5%), while the most female-oriented occupations are Legal Services & Support (100.0%), Education Instruction & Library (86.3%), and Community & Social Service (77.0%).
| Occupation | Male | Female |
| Management | 573 (70.7%) | 238 (29.3%) |
| Business & Financial | 41 (31.3%) | 90 (68.7%) |
| Computers, Engineering & Science | 198 (95.7%) | 9 (4.3%) |
| Computers & Mathematics | 149 (95.5%) | 7 (4.5%) |
| Architecture & Engineering | 37 (100.0%) | 0 (0.0%) |
| Life, Physical & Social Science | 12 (85.7%) | 2 (14.3%) |
| Community & Social Service | 241 (23.0%) | 806 (77.0%) |
| Education, Arts & Media | 102 (60.0%) | 68 (40.0%) |
| Legal Services & Support | 0 (0.0%) | 58 (100.0%) |
| Education Instruction & Library | 93 (13.7%) | 588 (86.3%) |
| Arts, Media & Entertainment | 46 (33.3%) | 92 (66.7%) |
| Health Diagnosing & Treating | 306 (51.9%) | 283 (48.0%) |
| Health Technologists | 162 (62.3%) | 98 (37.7%) |
| Total (Category) | 1,359 (48.8%) | 1,426 (51.2%) |
| Total (Overall) | 7,790 (62.9%) | 4,600 (37.1%) |
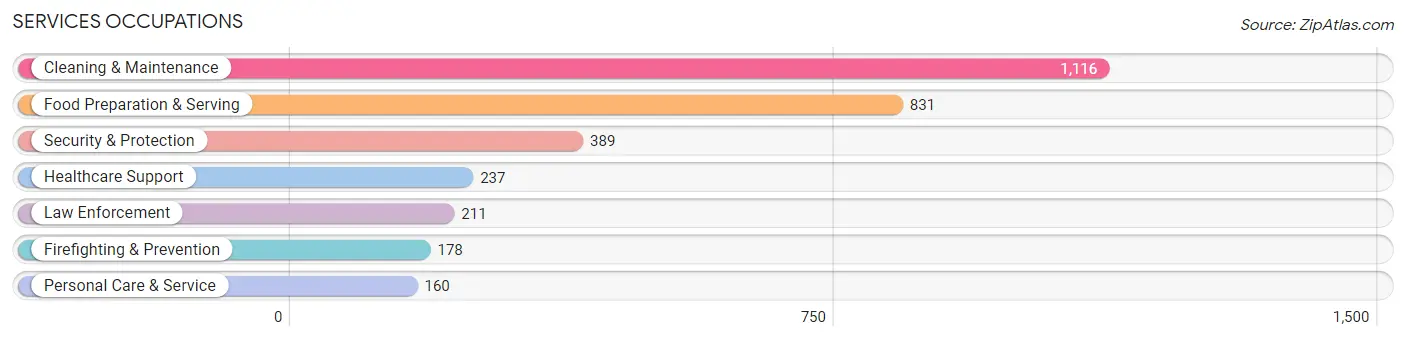
Services Occupations
The most common Services occupations in Desoto County are Cleaning & Maintenance (1,116 | 9.0%), Food Preparation & Serving (831 | 6.7%), Security & Protection (389 | 3.1%), Healthcare Support (237 | 1.9%), and Law Enforcement (211 | 1.7%).
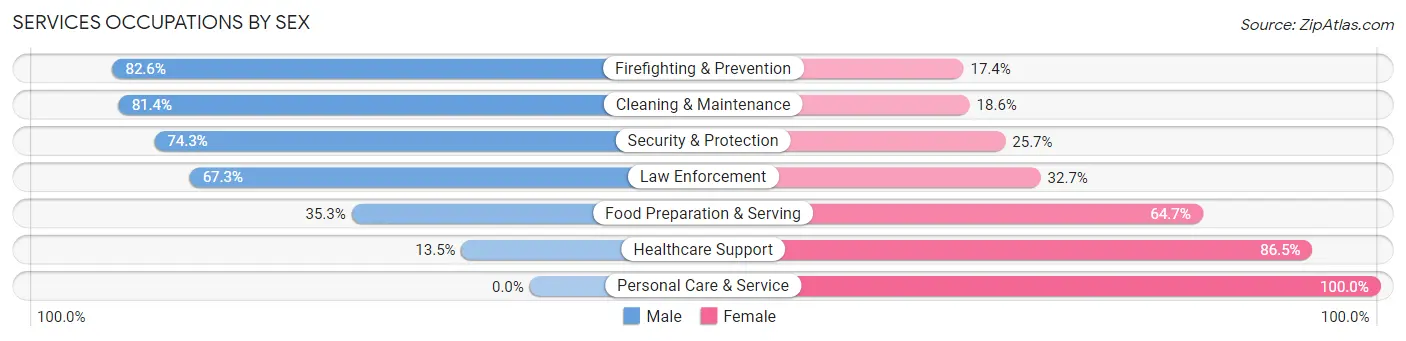
Services Occupations by Sex
Within the Services occupations in Desoto County, the most male-oriented occupations are Firefighting & Prevention (82.6%), Cleaning & Maintenance (81.4%), and Security & Protection (74.3%), while the most female-oriented occupations are Personal Care & Service (100.0%), Healthcare Support (86.5%), and Food Preparation & Serving (64.7%).
| Occupation | Male | Female |
| Healthcare Support | 32 (13.5%) | 205 (86.5%) |
| Security & Protection | 289 (74.3%) | 100 (25.7%) |
| Firefighting & Prevention | 147 (82.6%) | 31 (17.4%) |
| Law Enforcement | 142 (67.3%) | 69 (32.7%) |
| Food Preparation & Serving | 293 (35.3%) | 538 (64.7%) |
| Cleaning & Maintenance | 908 (81.4%) | 208 (18.6%) |
| Personal Care & Service | 0 (0.0%) | 160 (100.0%) |
| Total (Category) | 1,522 (55.7%) | 1,211 (44.3%) |
| Total (Overall) | 7,790 (62.9%) | 4,600 (37.1%) |
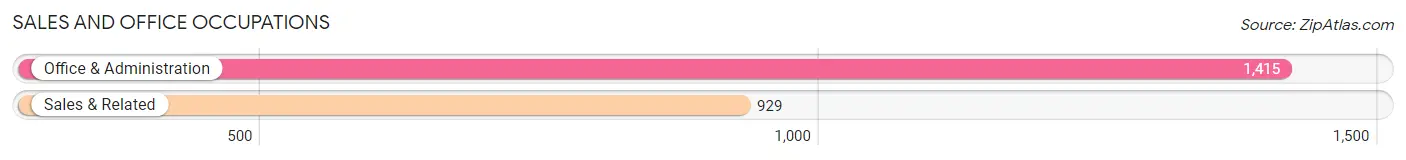
Sales and Office Occupations
The most common Sales and Office occupations in Desoto County are Office & Administration (1,415 | 11.4%), and Sales & Related (929 | 7.5%).
Sales and Office Occupations by Sex
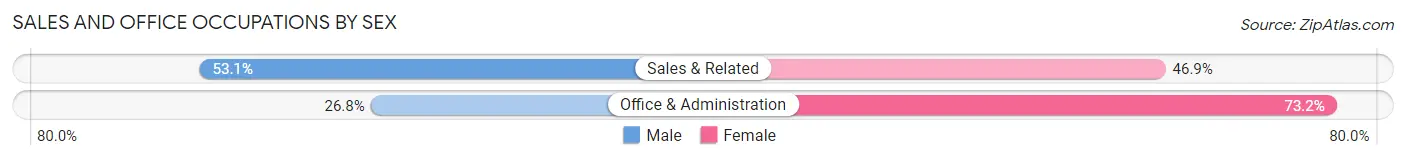
| Occupation | Male | Female |
| Sales & Related | 493 (53.1%) | 436 (46.9%) |
| Office & Administration | 379 (26.8%) | 1,036 (73.2%) |
| Total (Category) | 872 (37.2%) | 1,472 (62.8%) |
| Total (Overall) | 7,790 (62.9%) | 4,600 (37.1%) |
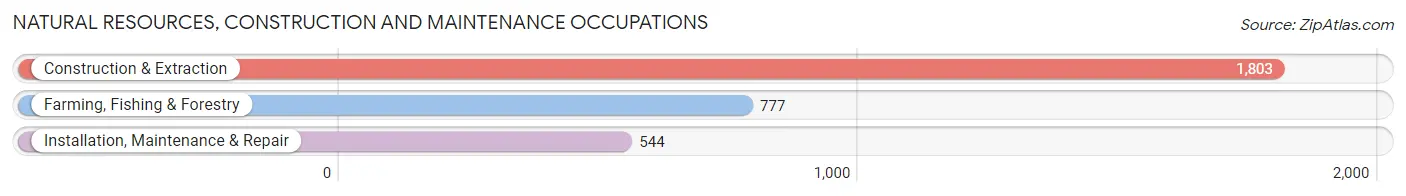
Natural Resources, Construction and Maintenance Occupations
The most common Natural Resources, Construction and Maintenance occupations in Desoto County are Construction & Extraction (1,803 | 14.5%), Farming, Fishing & Forestry (777 | 6.3%), and Installation, Maintenance & Repair (544 | 4.4%).
Natural Resources, Construction and Maintenance Occupations by Sex
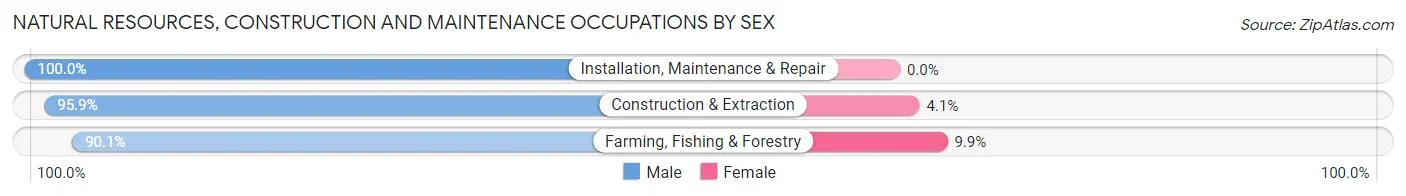
| Occupation | Male | Female |
| Farming, Fishing & Forestry | 700 (90.1%) | 77 (9.9%) |
| Construction & Extraction | 1,729 (95.9%) | 74 (4.1%) |
| Installation, Maintenance & Repair | 544 (100.0%) | 0 (0.0%) |
| Total (Category) | 2,973 (95.2%) | 151 (4.8%) |
| Total (Overall) | 7,790 (62.9%) | 4,600 (37.1%) |
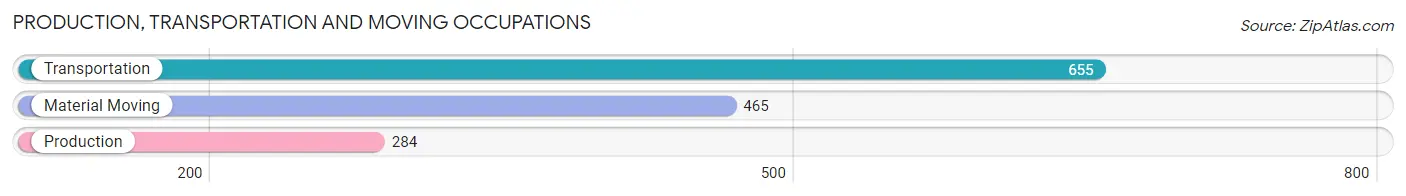
Production, Transportation and Moving Occupations
The most common Production, Transportation and Moving occupations in Desoto County are Transportation (655 | 5.3%), Material Moving (465 | 3.7%), and Production (284 | 2.3%).
Production, Transportation and Moving Occupations by Sex
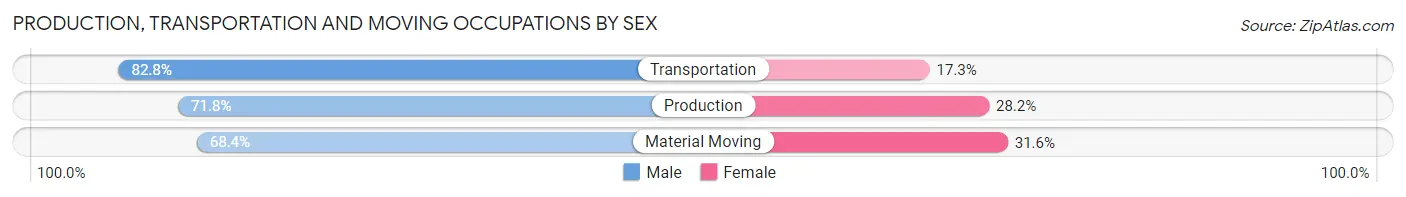
| Occupation | Male | Female |
| Production | 204 (71.8%) | 80 (28.2%) |
| Transportation | 542 (82.8%) | 113 (17.2%) |
| Material Moving | 318 (68.4%) | 147 (31.6%) |
| Total (Category) | 1,064 (75.8%) | 340 (24.2%) |
| Total (Overall) | 7,790 (62.9%) | 4,600 (37.1%) |
Employment Industries by Sex in Desoto County
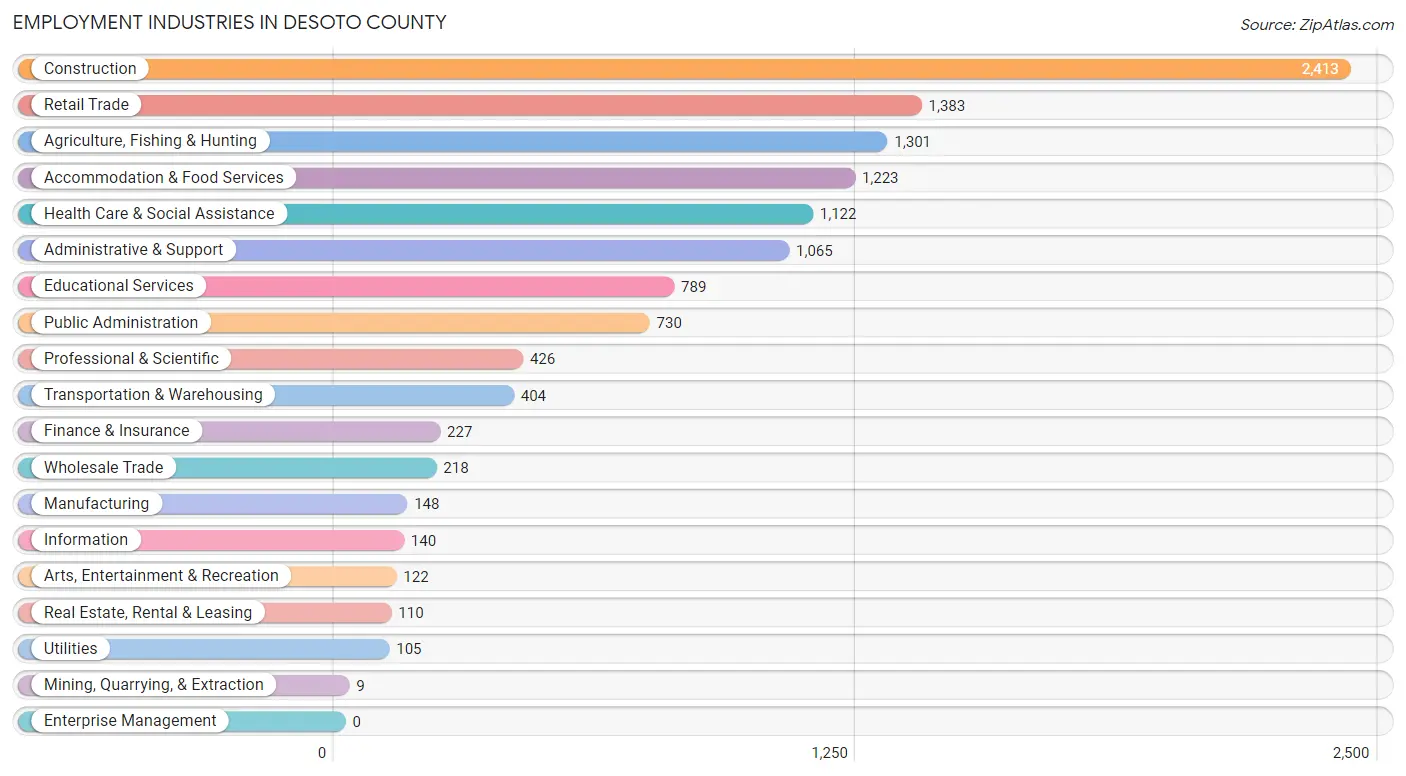
Employment Industries in Desoto County
The major employment industries in Desoto County include Construction (2,413 | 19.5%), Retail Trade (1,383 | 11.2%), Agriculture, Fishing & Hunting (1,301 | 10.5%), Accommodation & Food Services (1,223 | 9.9%), and Health Care & Social Assistance (1,122 | 9.1%).
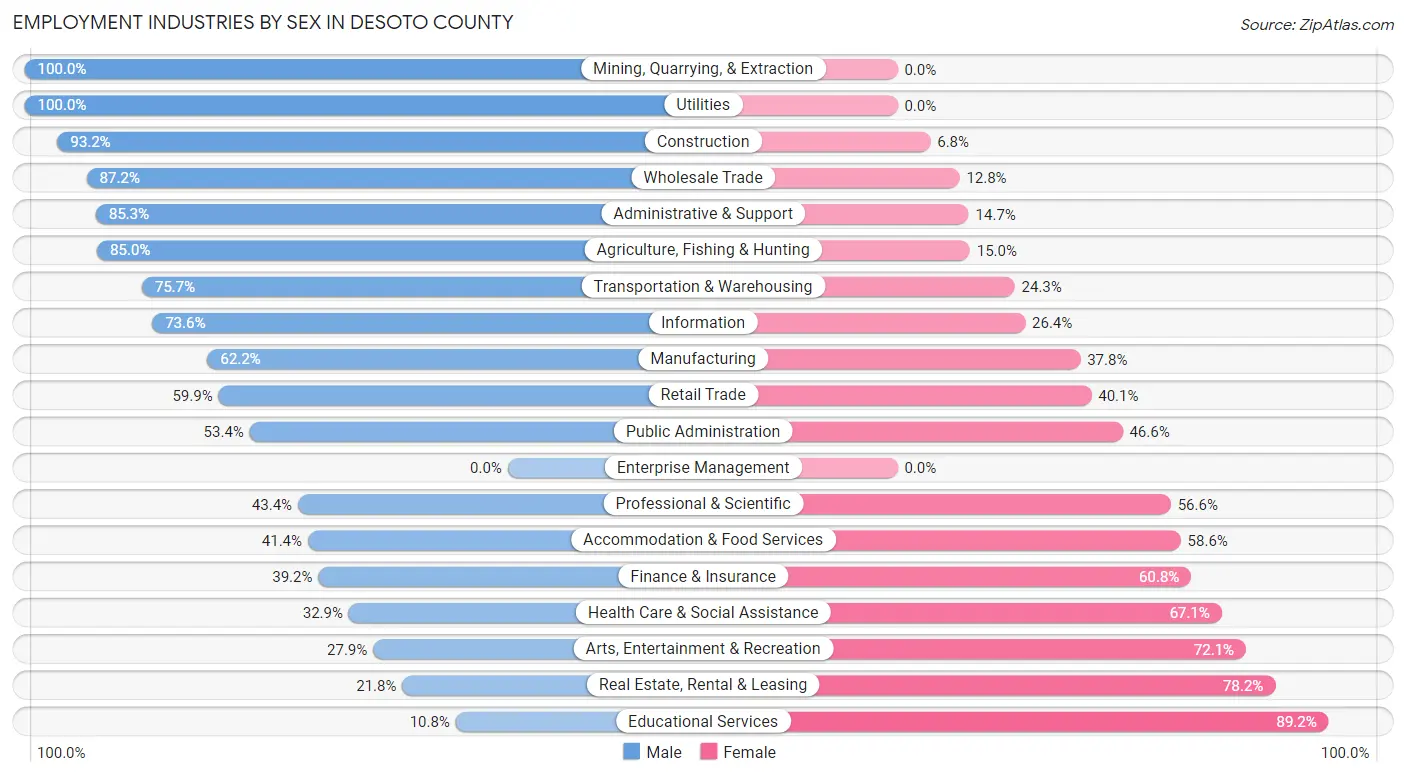
Employment Industries by Sex in Desoto County
The Desoto County industries that see more men than women are Mining, Quarrying, & Extraction (100.0%), Utilities (100.0%), and Construction (93.2%), whereas the industries that tend to have a higher number of women are Educational Services (89.2%), Real Estate, Rental & Leasing (78.2%), and Arts, Entertainment & Recreation (72.1%).
| Industry | Male | Female |
| Agriculture, Fishing & Hunting | 1,106 (85.0%) | 195 (15.0%) |
| Mining, Quarrying, & Extraction | 9 (100.0%) | 0 (0.0%) |
| Construction | 2,249 (93.2%) | 164 (6.8%) |
| Manufacturing | 92 (62.2%) | 56 (37.8%) |
| Wholesale Trade | 190 (87.2%) | 28 (12.8%) |
| Retail Trade | 828 (59.9%) | 555 (40.1%) |
| Transportation & Warehousing | 306 (75.7%) | 98 (24.3%) |
| Utilities | 105 (100.0%) | 0 (0.0%) |
| Information | 103 (73.6%) | 37 (26.4%) |
| Finance & Insurance | 89 (39.2%) | 138 (60.8%) |
| Real Estate, Rental & Leasing | 24 (21.8%) | 86 (78.2%) |
| Professional & Scientific | 185 (43.4%) | 241 (56.6%) |
| Enterprise Management | 0 (0.0%) | 0 (0.0%) |
| Administrative & Support | 908 (85.3%) | 157 (14.7%) |
| Educational Services | 85 (10.8%) | 704 (89.2%) |
| Health Care & Social Assistance | 369 (32.9%) | 753 (67.1%) |
| Arts, Entertainment & Recreation | 34 (27.9%) | 88 (72.1%) |
| Accommodation & Food Services | 506 (41.4%) | 717 (58.6%) |
| Public Administration | 390 (53.4%) | 340 (46.6%) |
| Total | 7,790 (62.9%) | 4,600 (37.1%) |
Education in Desoto County
School Enrollment in Desoto County
The most common levels of schooling among the 5,739 students in Desoto County are high school (1,599 | 27.9%), middle school (1,456 | 25.4%), and elementary school (1,359 | 23.7%).
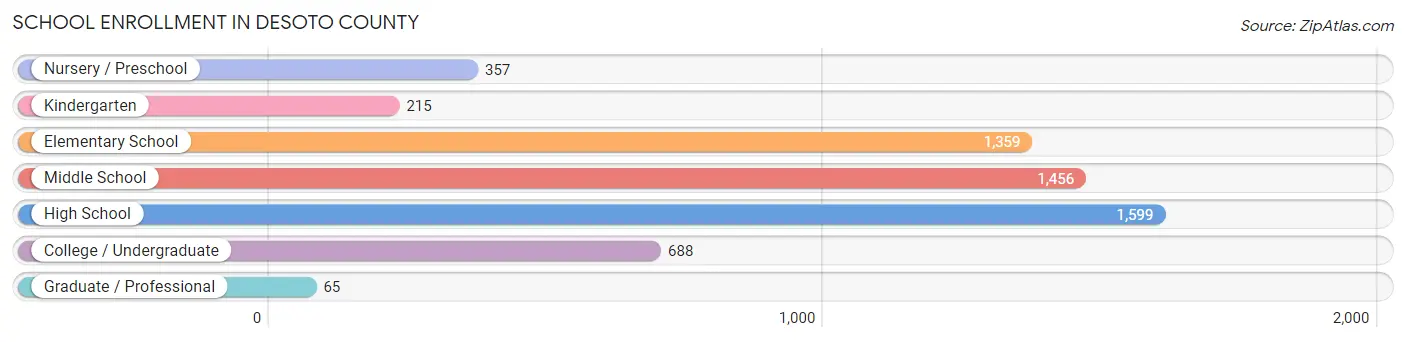
| School Level | # Students | % Students |
| Nursery / Preschool | 357 | 6.2% |
| Kindergarten | 215 | 3.7% |
| Elementary School | 1,359 | 23.7% |
| Middle School | 1,456 | 25.4% |
| High School | 1,599 | 27.9% |
| College / Undergraduate | 688 | 12.0% |
| Graduate / Professional | 65 | 1.1% |
| Total | 5,739 | 100.0% |
School Enrollment by Age by Funding Source in Desoto County
Out of a total of 5,739 students who are enrolled in schools in Desoto County, 844 (14.7%) attend a private institution, while the remaining 4,895 (85.3%) are enrolled in public schools. The age group of 3 to 4 year olds has the highest likelihood of being enrolled in private schools, with 107 (39.5% in the age bracket) enrolled. Conversely, the age group of 18 to 19 year olds has the lowest likelihood of being enrolled in a private school, with 451 (96.0% in the age bracket) attending a public institution.
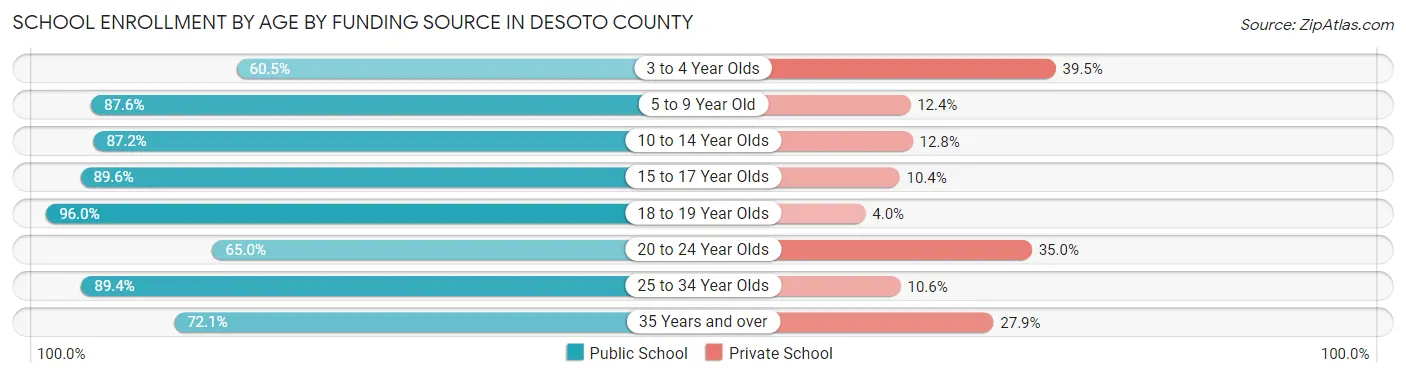
| Age Bracket | Public School | Private School |
| 3 to 4 Year Olds | 164 (60.5%) | 107 (39.5%) |
| 5 to 9 Year Old | 1,117 (87.6%) | 158 (12.4%) |
| 10 to 14 Year Olds | 1,658 (87.2%) | 244 (12.8%) |
| 15 to 17 Year Olds | 1,076 (89.6%) | 125 (10.4%) |
| 18 to 19 Year Olds | 451 (96.0%) | 19 (4.0%) |
| 20 to 24 Year Olds | 280 (65.0%) | 151 (35.0%) |
| 25 to 34 Year Olds | 76 (89.4%) | 9 (10.6%) |
| 35 Years and over | 75 (72.1%) | 29 (27.9%) |
| Total | 4,895 (85.3%) | 844 (14.7%) |
Educational Attainment by Field of Study in Desoto County
Education (640 | 21.0%), business (633 | 20.7%), liberal arts & history (343 | 11.2%), social sciences (240 | 7.9%), and arts & humanities (235 | 7.7%) are the most common fields of study among 3,052 individuals in Desoto County who have obtained a bachelor's degree or higher.
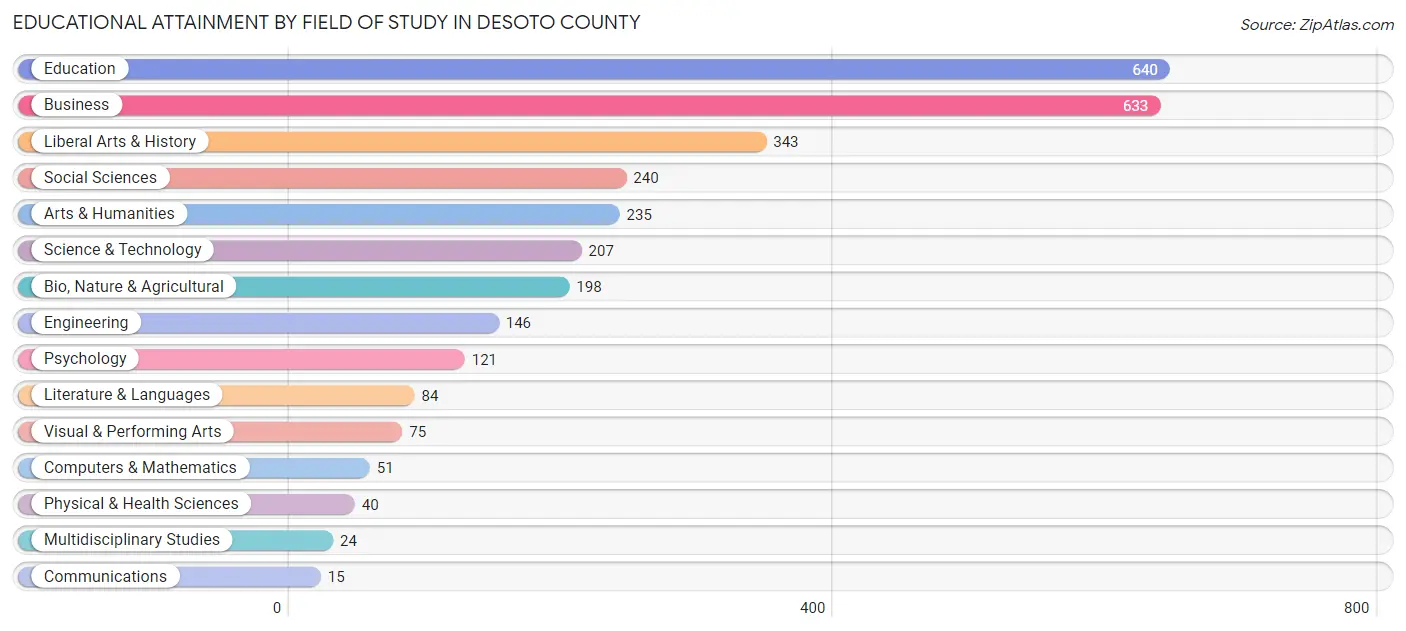
| Field of Study | # Graduates | % Graduates |
| Computers & Mathematics | 51 | 1.7% |
| Bio, Nature & Agricultural | 198 | 6.5% |
| Physical & Health Sciences | 40 | 1.3% |
| Psychology | 121 | 4.0% |
| Social Sciences | 240 | 7.9% |
| Engineering | 146 | 4.8% |
| Multidisciplinary Studies | 24 | 0.8% |
| Science & Technology | 207 | 6.8% |
| Business | 633 | 20.7% |
| Education | 640 | 21.0% |
| Literature & Languages | 84 | 2.8% |
| Liberal Arts & History | 343 | 11.2% |
| Visual & Performing Arts | 75 | 2.5% |
| Communications | 15 | 0.5% |
| Arts & Humanities | 235 | 7.7% |
| Total | 3,052 | 100.0% |
Transportation & Commute in Desoto County
Vehicle Availability by Sex in Desoto County
The most prevalent vehicle ownership categories in Desoto County are males with 2 vehicles (3,205, accounting for 43.8%) and females with 2 vehicles (1,801, making up 73.6%).
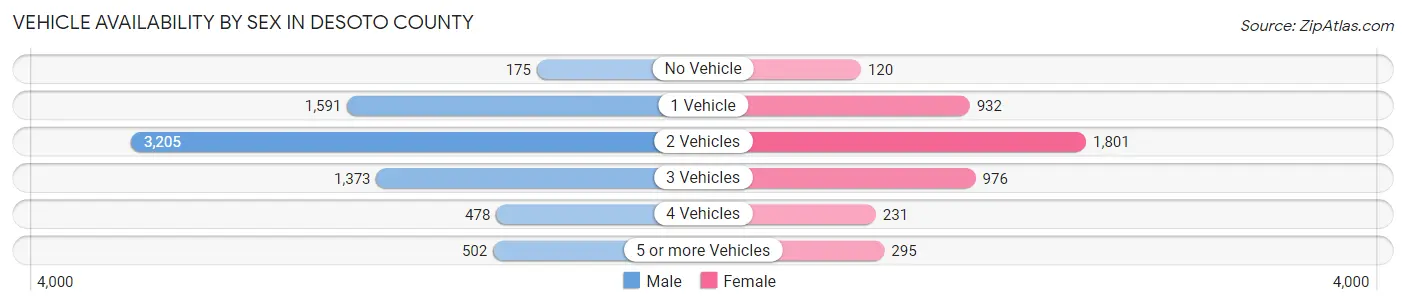
| Vehicles Available | Male | Female |
| No Vehicle | 175 (2.4%) | 120 (2.8%) |
| 1 Vehicle | 1,591 (21.7%) | 932 (21.4%) |
| 2 Vehicles | 3,205 (43.8%) | 1,801 (41.3%) |
| 3 Vehicles | 1,373 (18.8%) | 976 (22.4%) |
| 4 Vehicles | 478 (6.5%) | 231 (5.3%) |
| 5 or more Vehicles | 502 (6.9%) | 295 (6.8%) |
| Total | 7,324 (100.0%) | 4,355 (100.0%) |
Commute Time in Desoto County
The most frequently occuring commute durations in Desoto County are 20 to 24 minutes (2,207 commuters, 19.5%), 5 to 9 minutes (1,690 commuters, 14.9%), and 10 to 14 minutes (1,370 commuters, 12.1%).
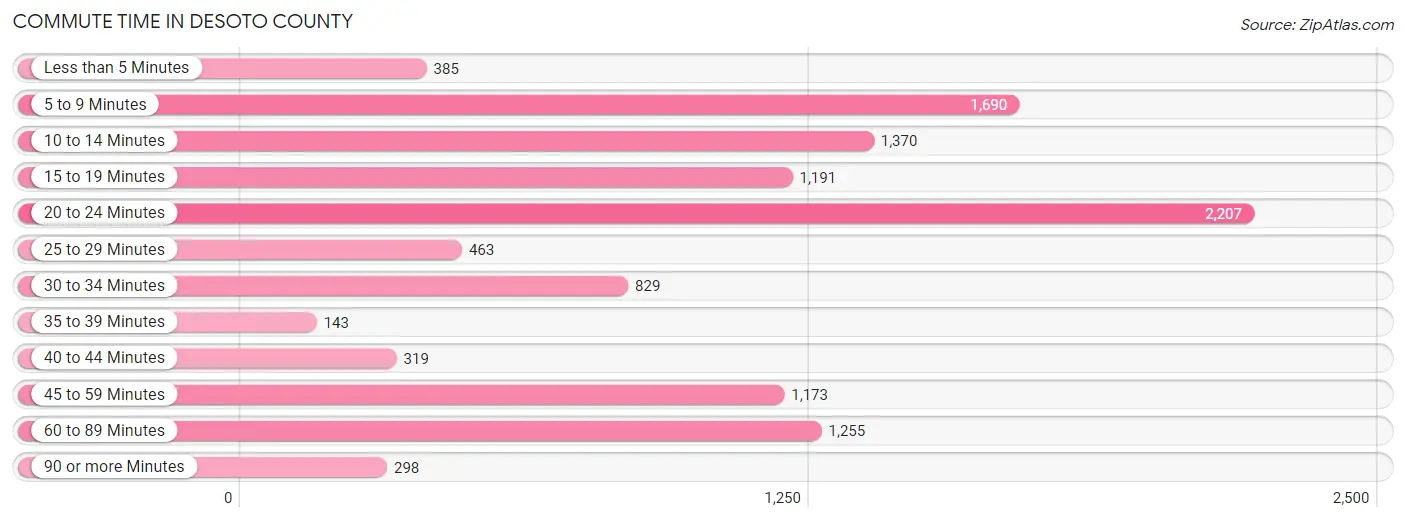
| Commute Time | # Commuters | % Commuters |
| Less than 5 Minutes | 385 | 3.4% |
| 5 to 9 Minutes | 1,690 | 14.9% |
| 10 to 14 Minutes | 1,370 | 12.1% |
| 15 to 19 Minutes | 1,191 | 10.5% |
| 20 to 24 Minutes | 2,207 | 19.5% |
| 25 to 29 Minutes | 463 | 4.1% |
| 30 to 34 Minutes | 829 | 7.3% |
| 35 to 39 Minutes | 143 | 1.3% |
| 40 to 44 Minutes | 319 | 2.8% |
| 45 to 59 Minutes | 1,173 | 10.4% |
| 60 to 89 Minutes | 1,255 | 11.1% |
| 90 or more Minutes | 298 | 2.6% |
Commute Time by Sex in Desoto County
The most common commute times in Desoto County are 20 to 24 minutes (1,690 commuters, 23.2%) for males and 5 to 9 minutes (801 commuters, 19.8%) for females.
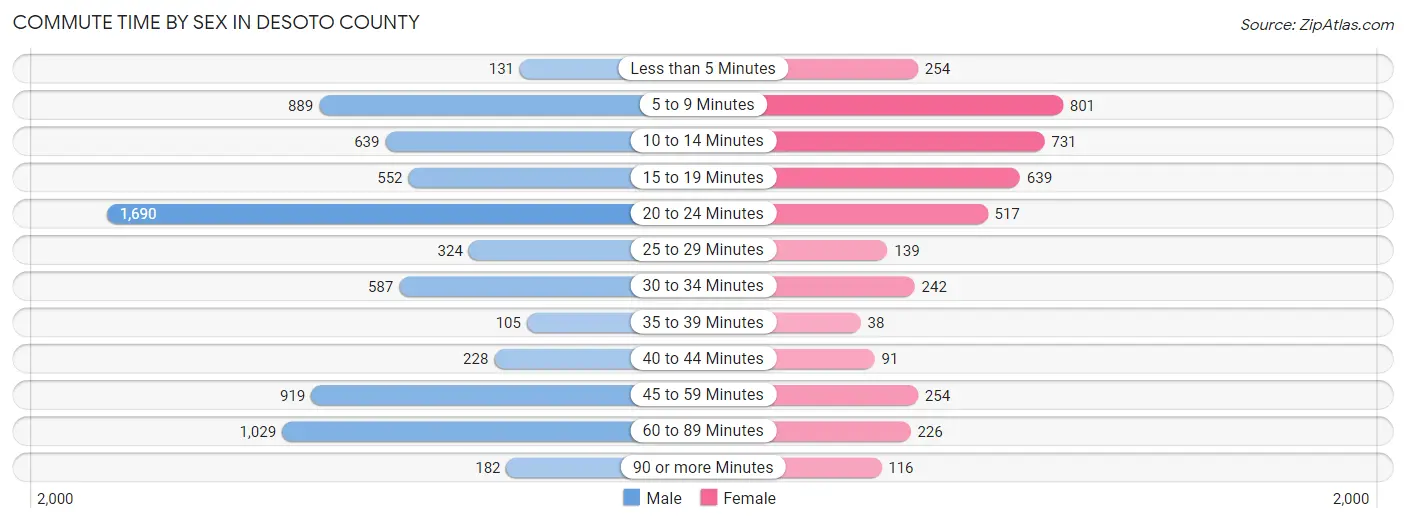
| Commute Time | Male | Female |
| Less than 5 Minutes | 131 (1.8%) | 254 (6.3%) |
| 5 to 9 Minutes | 889 (12.2%) | 801 (19.8%) |
| 10 to 14 Minutes | 639 (8.8%) | 731 (18.1%) |
| 15 to 19 Minutes | 552 (7.6%) | 639 (15.8%) |
| 20 to 24 Minutes | 1,690 (23.2%) | 517 (12.8%) |
| 25 to 29 Minutes | 324 (4.4%) | 139 (3.4%) |
| 30 to 34 Minutes | 587 (8.1%) | 242 (6.0%) |
| 35 to 39 Minutes | 105 (1.4%) | 38 (0.9%) |
| 40 to 44 Minutes | 228 (3.1%) | 91 (2.2%) |
| 45 to 59 Minutes | 919 (12.6%) | 254 (6.3%) |
| 60 to 89 Minutes | 1,029 (14.1%) | 226 (5.6%) |
| 90 or more Minutes | 182 (2.5%) | 116 (2.9%) |
Time of Departure to Work by Sex in Desoto County
The most frequent times of departure to work in Desoto County are 7:00 AM to 7:29 AM (1,269, 17.4%) for males and 8:00 AM to 8:29 AM (676, 16.7%) for females.
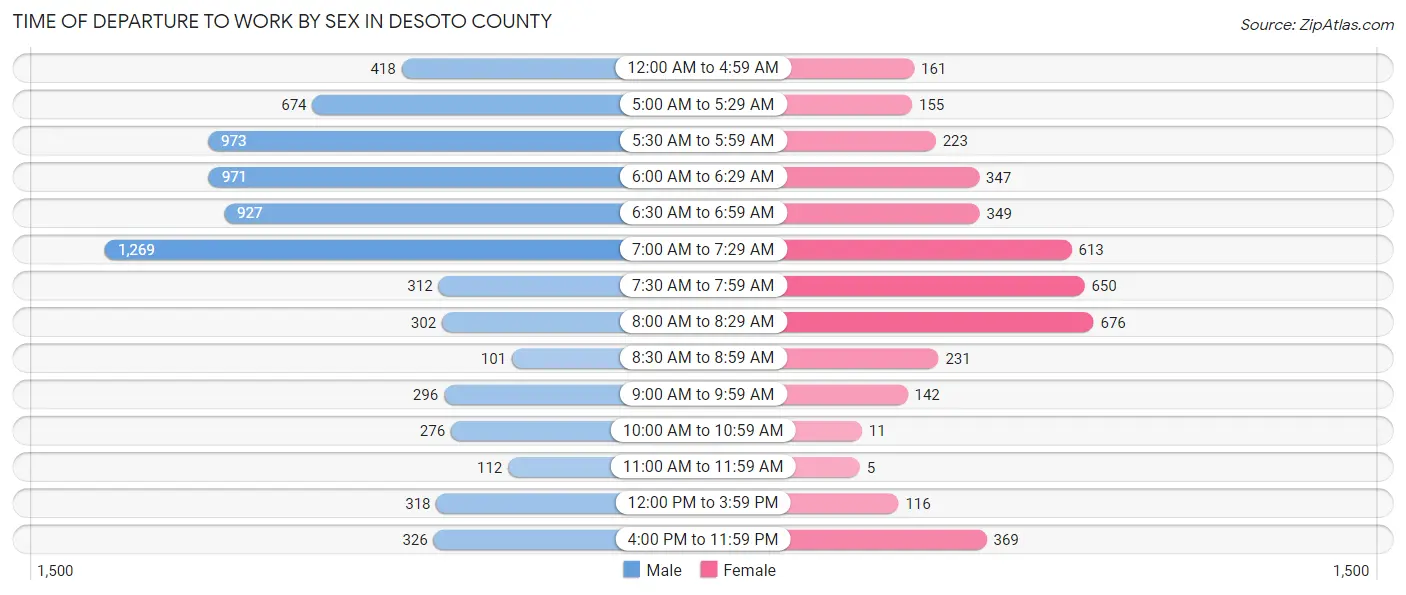
| Time of Departure | Male | Female |
| 12:00 AM to 4:59 AM | 418 (5.8%) | 161 (4.0%) |
| 5:00 AM to 5:29 AM | 674 (9.3%) | 155 (3.8%) |
| 5:30 AM to 5:59 AM | 973 (13.4%) | 223 (5.5%) |
| 6:00 AM to 6:29 AM | 971 (13.4%) | 347 (8.6%) |
| 6:30 AM to 6:59 AM | 927 (12.7%) | 349 (8.6%) |
| 7:00 AM to 7:29 AM | 1,269 (17.4%) | 613 (15.1%) |
| 7:30 AM to 7:59 AM | 312 (4.3%) | 650 (16.1%) |
| 8:00 AM to 8:29 AM | 302 (4.2%) | 676 (16.7%) |
| 8:30 AM to 8:59 AM | 101 (1.4%) | 231 (5.7%) |
| 9:00 AM to 9:59 AM | 296 (4.1%) | 142 (3.5%) |
| 10:00 AM to 10:59 AM | 276 (3.8%) | 11 (0.3%) |
| 11:00 AM to 11:59 AM | 112 (1.5%) | 5 (0.1%) |
| 12:00 PM to 3:59 PM | 318 (4.4%) | 116 (2.9%) |
| 4:00 PM to 11:59 PM | 326 (4.5%) | 369 (9.1%) |
| Total | 7,275 (100.0%) | 4,048 (100.0%) |
Housing Occupancy in Desoto County
Occupancy by Ownership in Desoto County
Of the total 12,340 dwellings in Desoto County, owner-occupied units account for 8,784 (71.2%), while renter-occupied units make up 3,556 (28.8%).
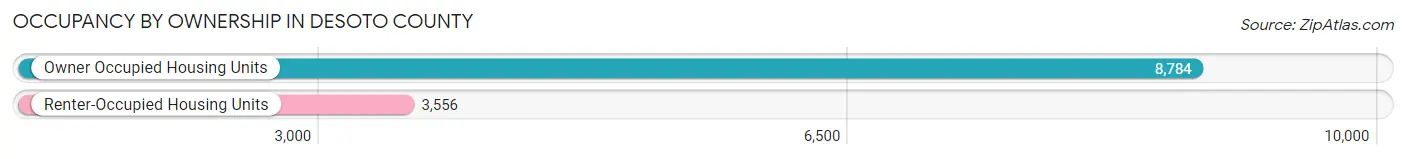
| Occupancy | # Housing Units | % Housing Units |
| Owner Occupied Housing Units | 8,784 | 71.2% |
| Renter-Occupied Housing Units | 3,556 | 28.8% |
| Total Occupied Housing Units | 12,340 | 100.0% |
Occupancy by Household Size in Desoto County
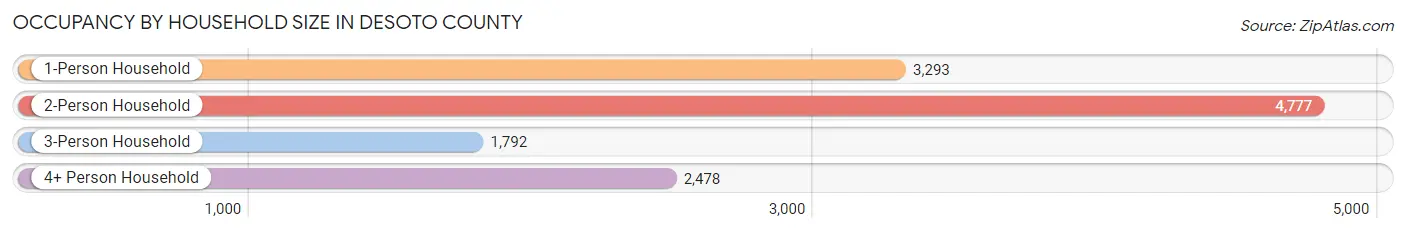
| Household Size | # Housing Units | % Housing Units |
| 1-Person Household | 3,293 | 26.7% |
| 2-Person Household | 4,777 | 38.7% |
| 3-Person Household | 1,792 | 14.5% |
| 4+ Person Household | 2,478 | 20.1% |
| Total Housing Units | 12,340 | 100.0% |
Occupancy by Ownership by Household Size in Desoto County
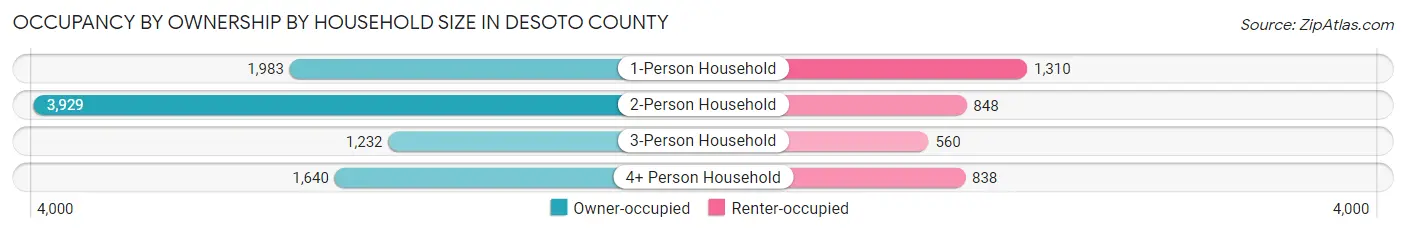
| Household Size | Owner-occupied | Renter-occupied |
| 1-Person Household | 1,983 (60.2%) | 1,310 (39.8%) |
| 2-Person Household | 3,929 (82.3%) | 848 (17.7%) |
| 3-Person Household | 1,232 (68.8%) | 560 (31.2%) |
| 4+ Person Household | 1,640 (66.2%) | 838 (33.8%) |
| Total Housing Units | 8,784 (71.2%) | 3,556 (28.8%) |
Occupancy by Educational Attainment in Desoto County
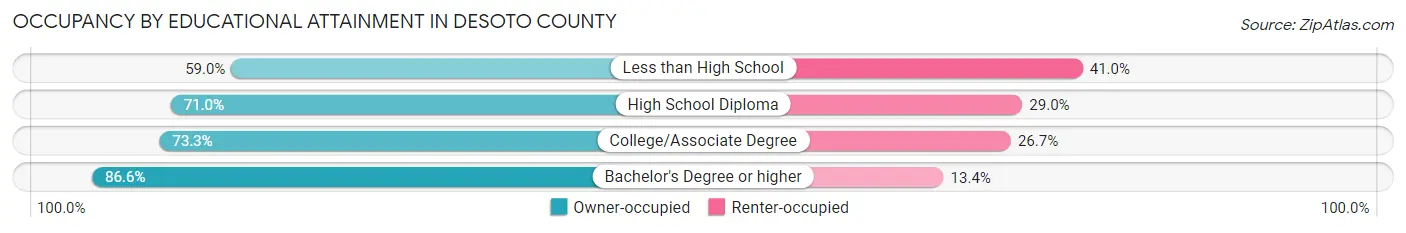
| Household Size | Owner-occupied | Renter-occupied |
| Less than High School | 1,632 (59.0%) | 1,132 (41.0%) |
| High School Diploma | 3,162 (71.0%) | 1,291 (29.0%) |
| College/Associate Degree | 2,456 (73.3%) | 896 (26.7%) |
| Bachelor's Degree or higher | 1,534 (86.6%) | 237 (13.4%) |
Occupancy by Age of Householder in Desoto County
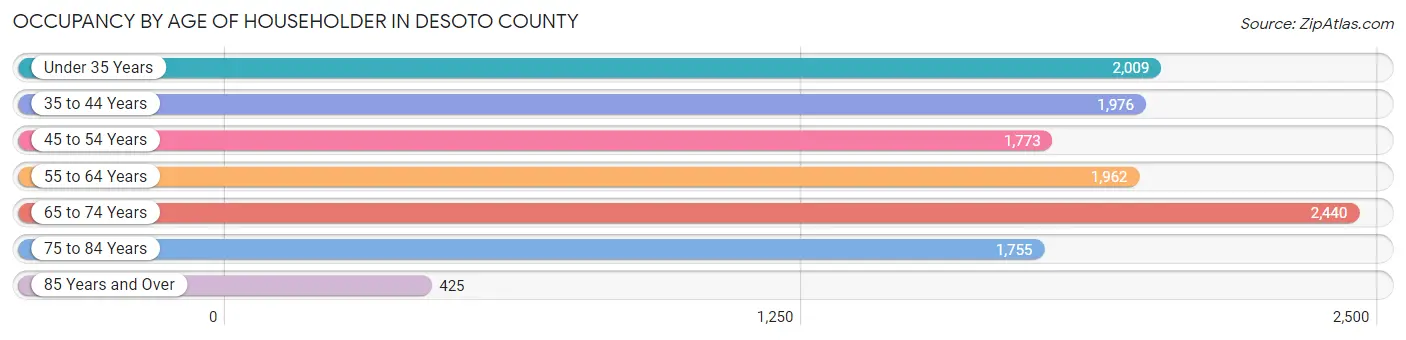
| Age Bracket | # Households | % Households |
| Under 35 Years | 2,009 | 16.3% |
| 35 to 44 Years | 1,976 | 16.0% |
| 45 to 54 Years | 1,773 | 14.4% |
| 55 to 64 Years | 1,962 | 15.9% |
| 65 to 74 Years | 2,440 | 19.8% |
| 75 to 84 Years | 1,755 | 14.2% |
| 85 Years and Over | 425 | 3.4% |
| Total | 12,340 | 100.0% |
Housing Finances in Desoto County
Median Income by Occupancy in Desoto County
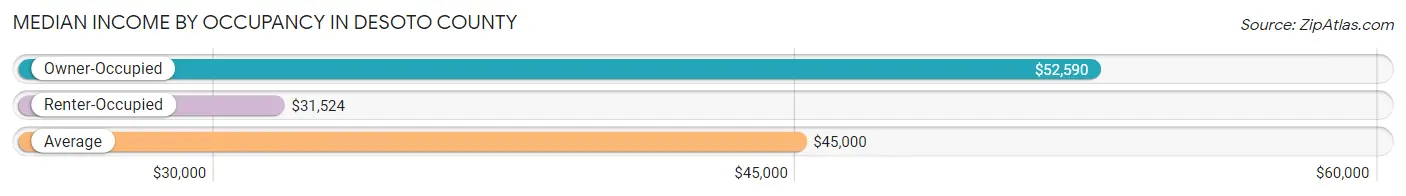
| Occupancy Type | # Households | Median Income |
| Owner-Occupied | 8,784 (71.2%) | $52,590 |
| Renter-Occupied | 3,556 (28.8%) | $31,524 |
| Average | 12,340 (100.0%) | $45,000 |
Occupancy by Householder Income Bracket in Desoto County
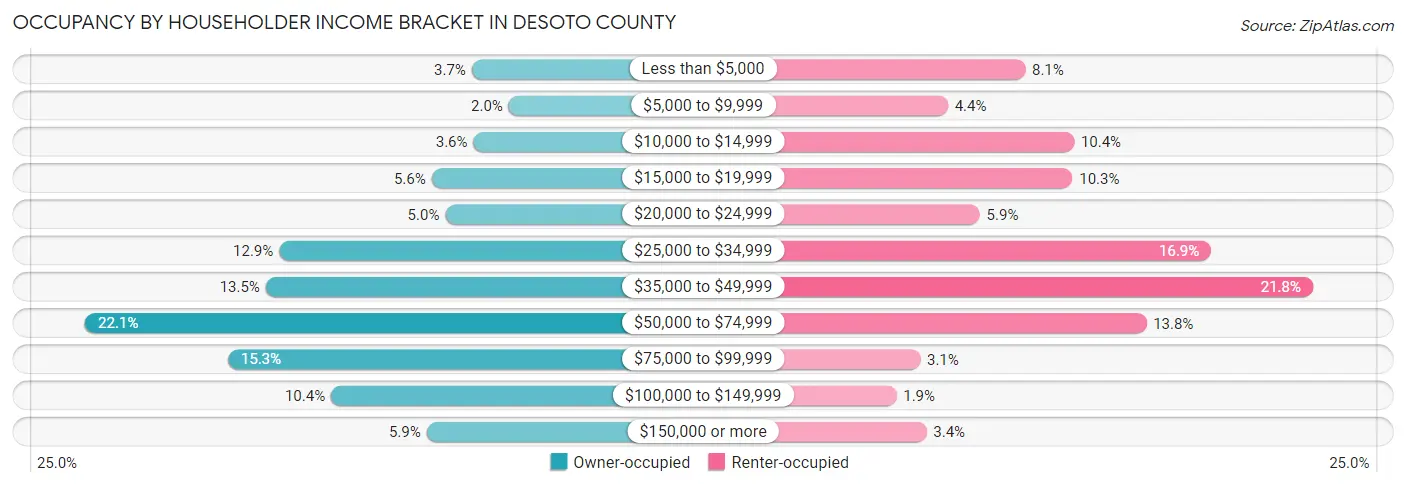
| Income Bracket | Owner-occupied | Renter-occupied |
| Less than $5,000 | 326 (3.7%) | 287 (8.1%) |
| $5,000 to $9,999 | 171 (1.9%) | 156 (4.4%) |
| $10,000 to $14,999 | 319 (3.6%) | 370 (10.4%) |
| $15,000 to $19,999 | 494 (5.6%) | 367 (10.3%) |
| $20,000 to $24,999 | 437 (5.0%) | 210 (5.9%) |
| $25,000 to $34,999 | 1,131 (12.9%) | 602 (16.9%) |
| $35,000 to $49,999 | 1,188 (13.5%) | 774 (21.8%) |
| $50,000 to $74,999 | 1,943 (22.1%) | 492 (13.8%) |
| $75,000 to $99,999 | 1,346 (15.3%) | 109 (3.1%) |
| $100,000 to $149,999 | 914 (10.4%) | 69 (1.9%) |
| $150,000 or more | 515 (5.9%) | 120 (3.4%) |
| Total | 8,784 (100.0%) | 3,556 (100.0%) |
Monthly Housing Cost Tiers in Desoto County
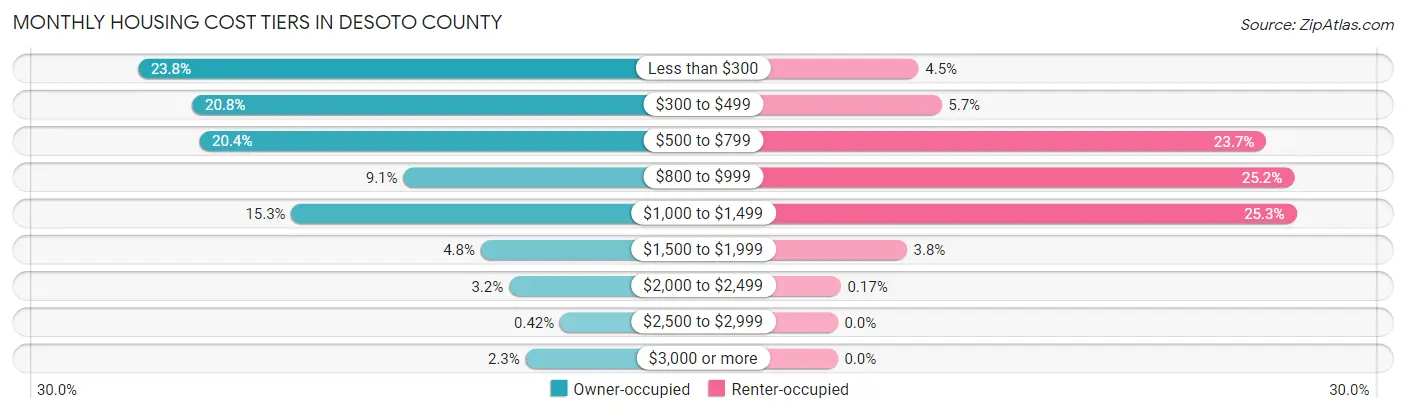
| Monthly Cost | Owner-occupied | Renter-occupied |
| Less than $300 | 2,086 (23.7%) | 159 (4.5%) |
| $300 to $499 | 1,823 (20.7%) | 204 (5.7%) |
| $500 to $799 | 1,788 (20.4%) | 842 (23.7%) |
| $800 to $999 | 798 (9.1%) | 897 (25.2%) |
| $1,000 to $1,499 | 1,340 (15.3%) | 901 (25.3%) |
| $1,500 to $1,999 | 422 (4.8%) | 136 (3.8%) |
| $2,000 to $2,499 | 285 (3.2%) | 6 (0.2%) |
| $2,500 to $2,999 | 37 (0.4%) | 0 (0.0%) |
| $3,000 or more | 205 (2.3%) | 0 (0.0%) |
| Total | 8,784 (100.0%) | 3,556 (100.0%) |
Physical Housing Characteristics in Desoto County
Housing Structures in Desoto County
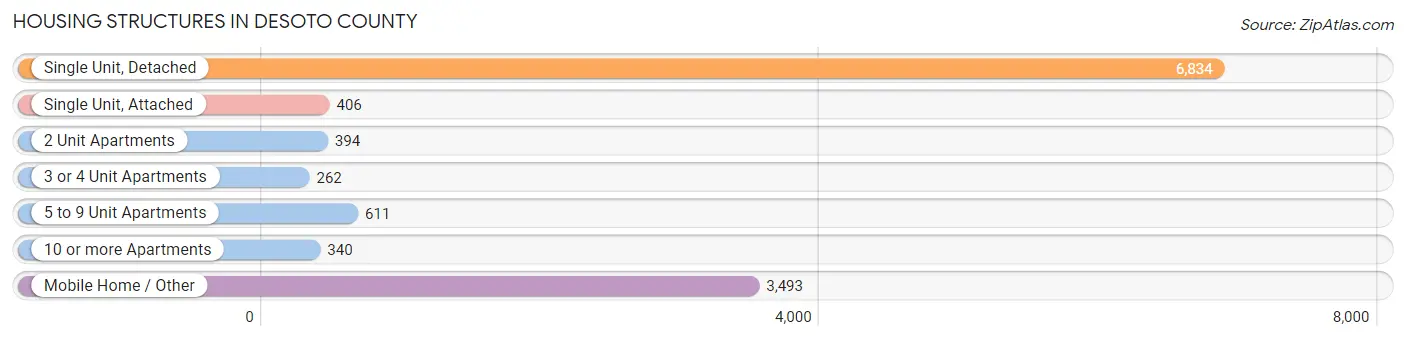
| Structure Type | # Housing Units | % Housing Units |
| Single Unit, Detached | 6,834 | 55.4% |
| Single Unit, Attached | 406 | 3.3% |
| 2 Unit Apartments | 394 | 3.2% |
| 3 or 4 Unit Apartments | 262 | 2.1% |
| 5 to 9 Unit Apartments | 611 | 5.0% |
| 10 or more Apartments | 340 | 2.8% |
| Mobile Home / Other | 3,493 | 28.3% |
| Total | 12,340 | 100.0% |
Housing Structures by Occupancy in Desoto County
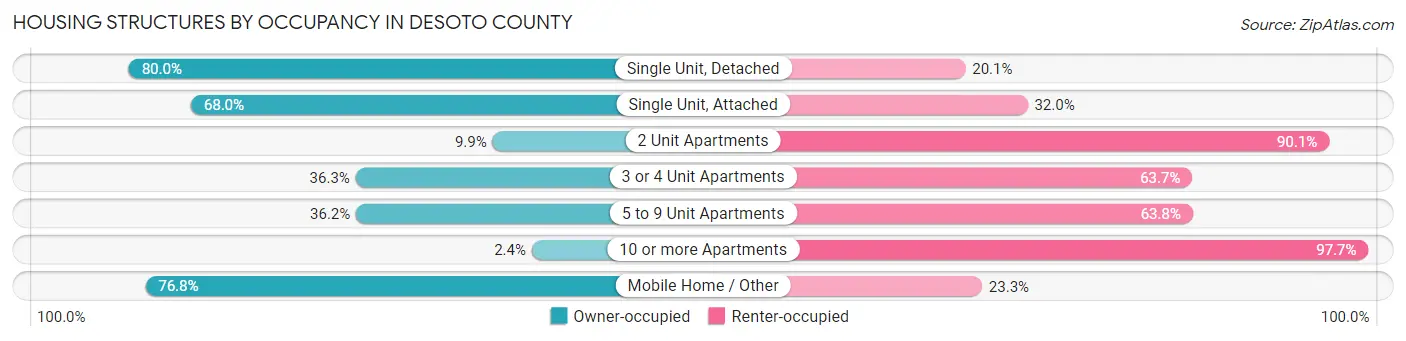
| Structure Type | Owner-occupied | Renter-occupied |
| Single Unit, Detached | 5,464 (79.9%) | 1,370 (20.1%) |
| Single Unit, Attached | 276 (68.0%) | 130 (32.0%) |
| 2 Unit Apartments | 39 (9.9%) | 355 (90.1%) |
| 3 or 4 Unit Apartments | 95 (36.3%) | 167 (63.7%) |
| 5 to 9 Unit Apartments | 221 (36.2%) | 390 (63.8%) |
| 10 or more Apartments | 8 (2.4%) | 332 (97.7%) |
| Mobile Home / Other | 2,681 (76.7%) | 812 (23.3%) |
| Total | 8,784 (71.2%) | 3,556 (28.8%) |
Housing Structures by Number of Rooms in Desoto County
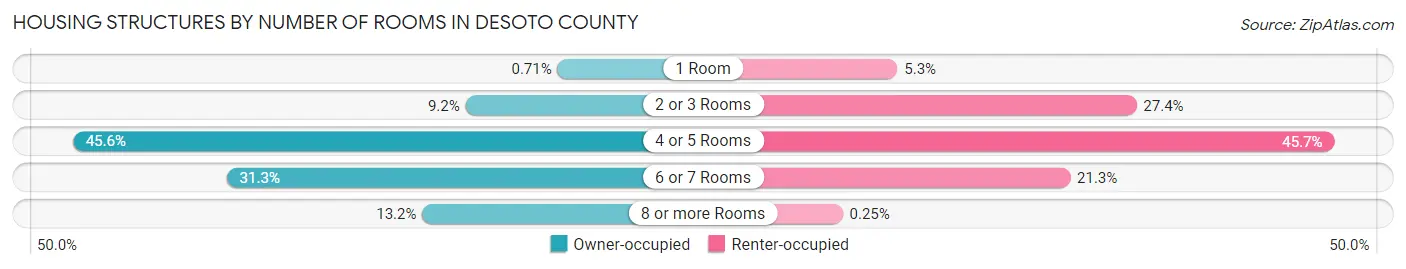
| Number of Rooms | Owner-occupied | Renter-occupied |
| 1 Room | 62 (0.7%) | 189 (5.3%) |
| 2 or 3 Rooms | 810 (9.2%) | 975 (27.4%) |
| 4 or 5 Rooms | 4,001 (45.6%) | 1,626 (45.7%) |
| 6 or 7 Rooms | 2,750 (31.3%) | 757 (21.3%) |
| 8 or more Rooms | 1,161 (13.2%) | 9 (0.3%) |
| Total | 8,784 (100.0%) | 3,556 (100.0%) |
Housing Structure by Heating Type in Desoto County
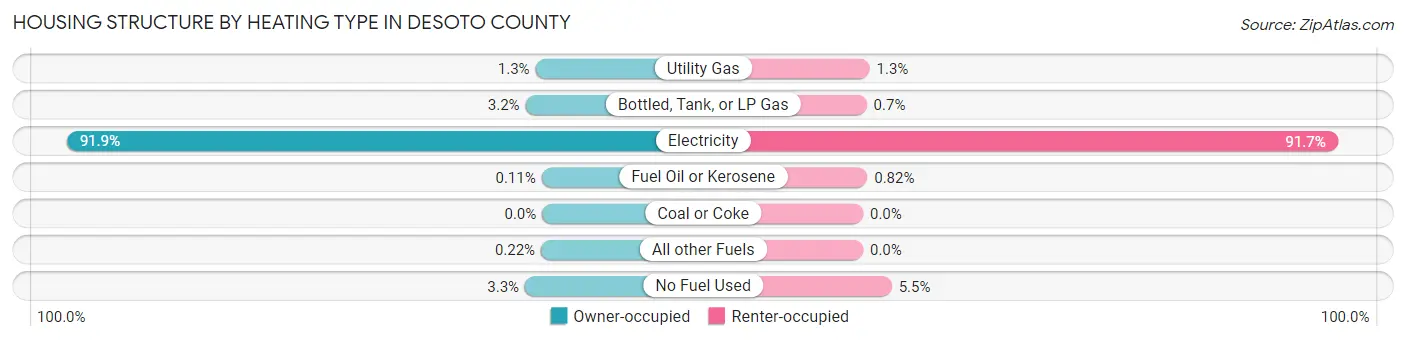
| Heating Type | Owner-occupied | Renter-occupied |
| Utility Gas | 113 (1.3%) | 45 (1.3%) |
| Bottled, Tank, or LP Gas | 283 (3.2%) | 25 (0.7%) |
| Electricity | 8,068 (91.8%) | 3,260 (91.7%) |
| Fuel Oil or Kerosene | 10 (0.1%) | 29 (0.8%) |
| Coal or Coke | 0 (0.0%) | 0 (0.0%) |
| All other Fuels | 19 (0.2%) | 0 (0.0%) |
| No Fuel Used | 291 (3.3%) | 197 (5.5%) |
| Total | 8,784 (100.0%) | 3,556 (100.0%) |
Household Vehicle Usage in Desoto County
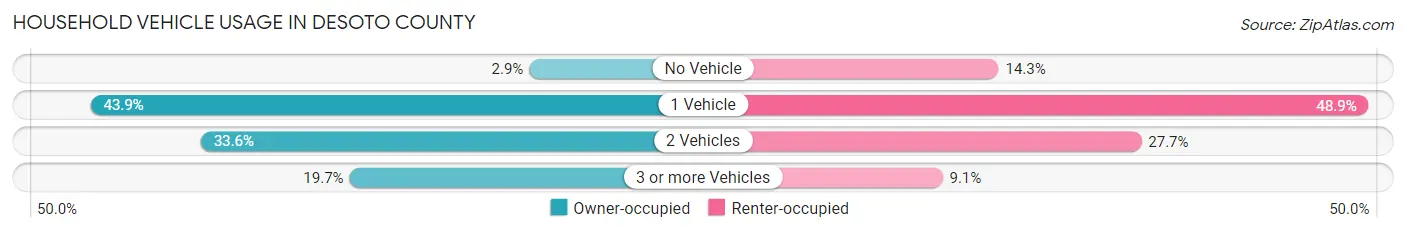
| Vehicles per Household | Owner-occupied | Renter-occupied |
| No Vehicle | 255 (2.9%) | 510 (14.3%) |
| 1 Vehicle | 3,852 (43.9%) | 1,738 (48.9%) |
| 2 Vehicles | 2,948 (33.6%) | 984 (27.7%) |
| 3 or more Vehicles | 1,729 (19.7%) | 324 (9.1%) |
| Total | 8,784 (100.0%) | 3,556 (100.0%) |
Real Estate & Mortgages in Desoto County
Real Estate and Mortgage Overview in Desoto County
| Characteristic | Without Mortgage | With Mortgage |
| Housing Units | 5,790 | 2,994 |
| Median Property Value | $109,400 | $169,200 |
| Median Household Income | $47,854 | $285 |
| Monthly Housing Costs | $392 | $101 |
| Real Estate Taxes | $1,207 | $235 |
Property Value by Mortgage Status in Desoto County
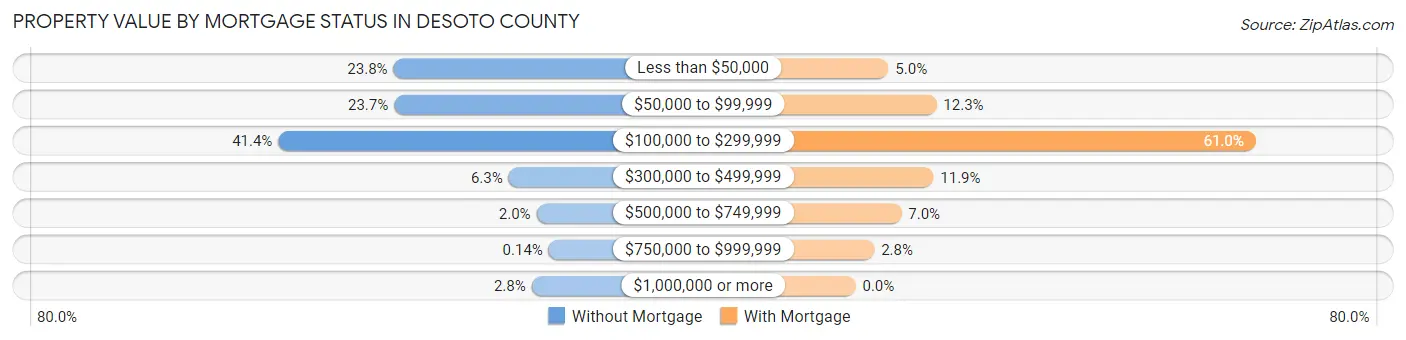
| Property Value | Without Mortgage | With Mortgage |
| Less than $50,000 | 1,378 (23.8%) | 150 (5.0%) |
| $50,000 to $99,999 | 1,372 (23.7%) | 369 (12.3%) |
| $100,000 to $299,999 | 2,395 (41.4%) | 1,826 (61.0%) |
| $300,000 to $499,999 | 362 (6.2%) | 355 (11.9%) |
| $500,000 to $749,999 | 116 (2.0%) | 209 (7.0%) |
| $750,000 to $999,999 | 8 (0.1%) | 85 (2.8%) |
| $1,000,000 or more | 159 (2.8%) | 0 (0.0%) |
| Total | 5,790 (100.0%) | 2,994 (100.0%) |
Household Income by Mortgage Status in Desoto County
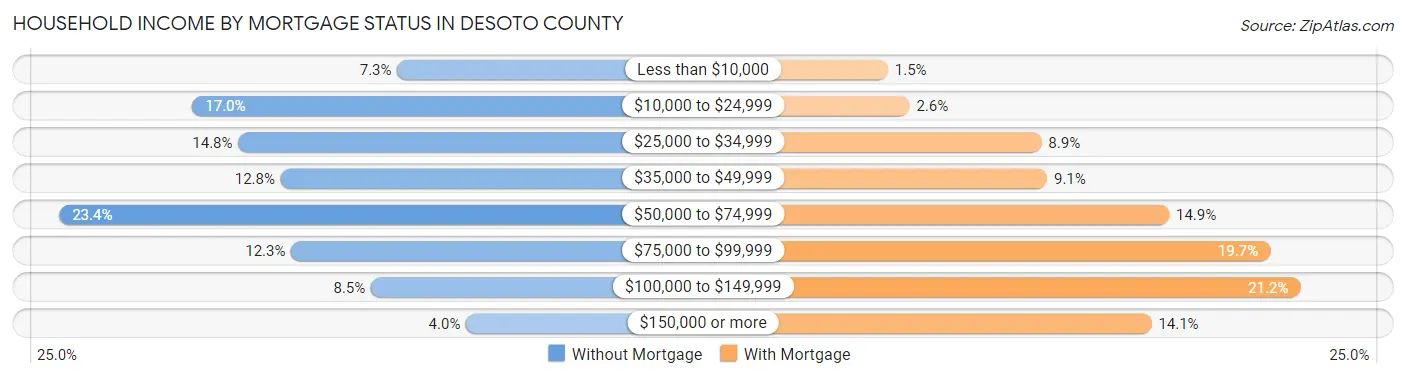
| Household Income | Without Mortgage | With Mortgage |
| Less than $10,000 | 420 (7.2%) | 46 (1.5%) |
| $10,000 to $24,999 | 985 (17.0%) | 77 (2.6%) |
| $25,000 to $34,999 | 858 (14.8%) | 265 (8.8%) |
| $35,000 to $49,999 | 741 (12.8%) | 273 (9.1%) |
| $50,000 to $74,999 | 1,352 (23.4%) | 447 (14.9%) |
| $75,000 to $99,999 | 712 (12.3%) | 591 (19.7%) |
| $100,000 to $149,999 | 492 (8.5%) | 634 (21.2%) |
| $150,000 or more | 230 (4.0%) | 422 (14.1%) |
| Total | 5,790 (100.0%) | 2,994 (100.0%) |
Property Value to Household Income Ratio in Desoto County
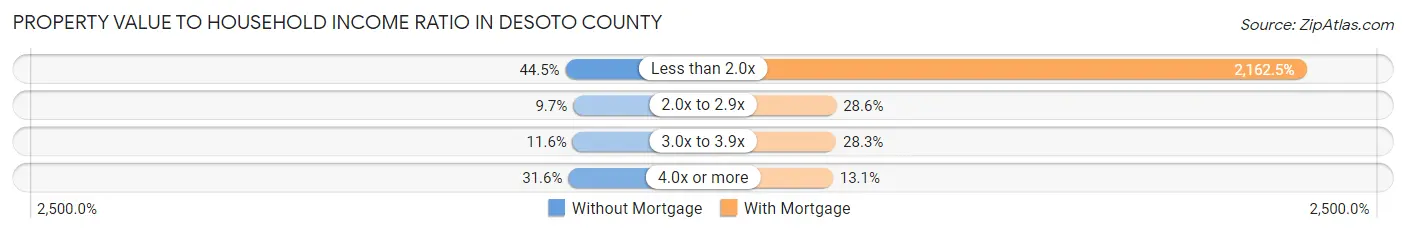
| Value-to-Income Ratio | Without Mortgage | With Mortgage |
| Less than 2.0x | 2,577 (44.5%) | 64,744 (2,162.5%) |
| 2.0x to 2.9x | 561 (9.7%) | 855 (28.6%) |
| 3.0x to 3.9x | 674 (11.6%) | 848 (28.3%) |
| 4.0x or more | 1,827 (31.6%) | 393 (13.1%) |
| Total | 5,790 (100.0%) | 2,994 (100.0%) |
Real Estate Taxes by Mortgage Status in Desoto County
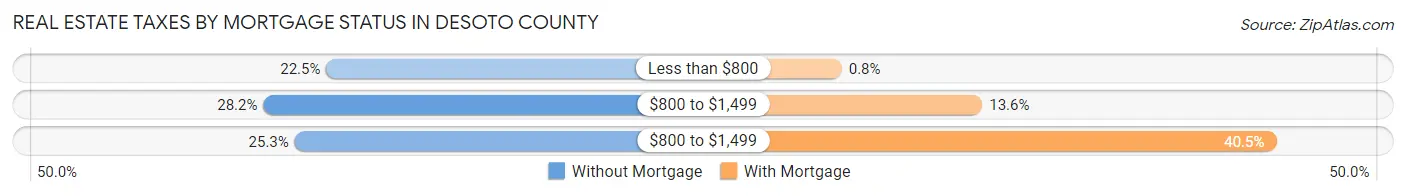
| Property Taxes | Without Mortgage | With Mortgage |
| Less than $800 | 1,300 (22.5%) | 24 (0.8%) |
| $800 to $1,499 | 1,633 (28.2%) | 408 (13.6%) |
| $800 to $1,499 | 1,467 (25.3%) | 1,212 (40.5%) |
| Total | 5,790 (100.0%) | 2,994 (100.0%) |
Health & Disability in Desoto County
Health Insurance Coverage by Age in Desoto County
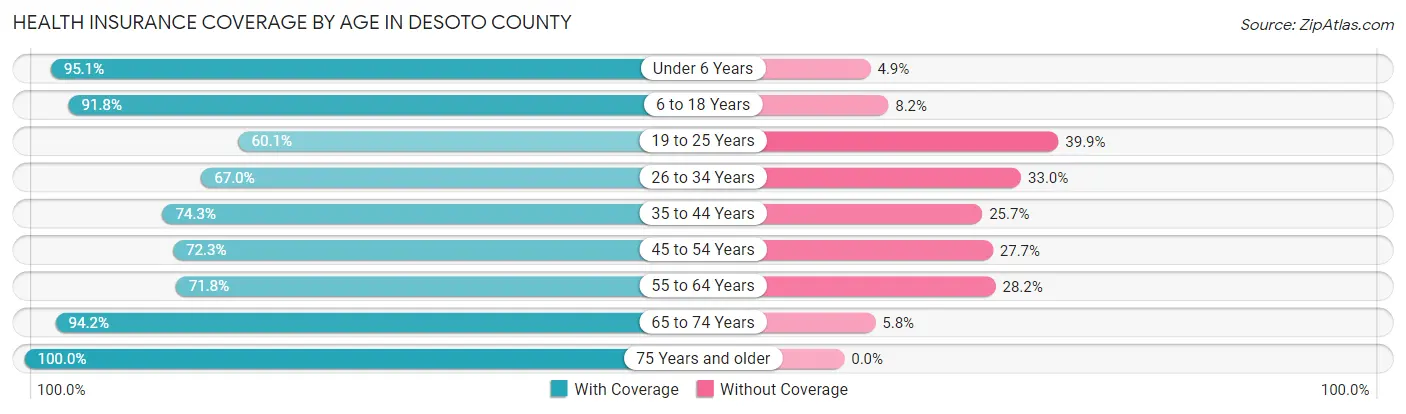
| Age Bracket | With Coverage | Without Coverage |
| Under 6 Years | 1,906 (95.1%) | 98 (4.9%) |
| 6 to 18 Years | 4,087 (91.8%) | 365 (8.2%) |
| 19 to 25 Years | 1,872 (60.1%) | 1,244 (39.9%) |
| 26 to 34 Years | 2,419 (67.0%) | 1,190 (33.0%) |
| 35 to 44 Years | 2,963 (74.3%) | 1,026 (25.7%) |
| 45 to 54 Years | 2,819 (72.3%) | 1,080 (27.7%) |
| 55 to 64 Years | 2,925 (71.8%) | 1,149 (28.2%) |
| 65 to 74 Years | 3,838 (94.2%) | 236 (5.8%) |
| 75 Years and older | 3,434 (100.0%) | 0 (0.0%) |
| Total | 26,263 (80.4%) | 6,388 (19.6%) |
Health Insurance Coverage by Citizenship Status in Desoto County
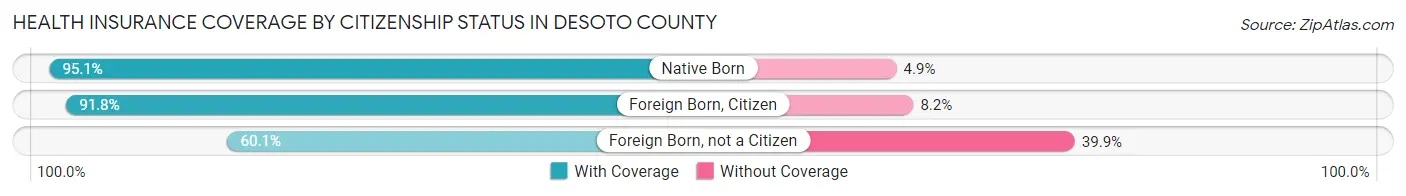
| Citizenship Status | With Coverage | Without Coverage |
| Native Born | 1,906 (95.1%) | 98 (4.9%) |
| Foreign Born, Citizen | 4,087 (91.8%) | 365 (8.2%) |
| Foreign Born, not a Citizen | 1,872 (60.1%) | 1,244 (39.9%) |
Health Insurance Coverage by Household Income in Desoto County
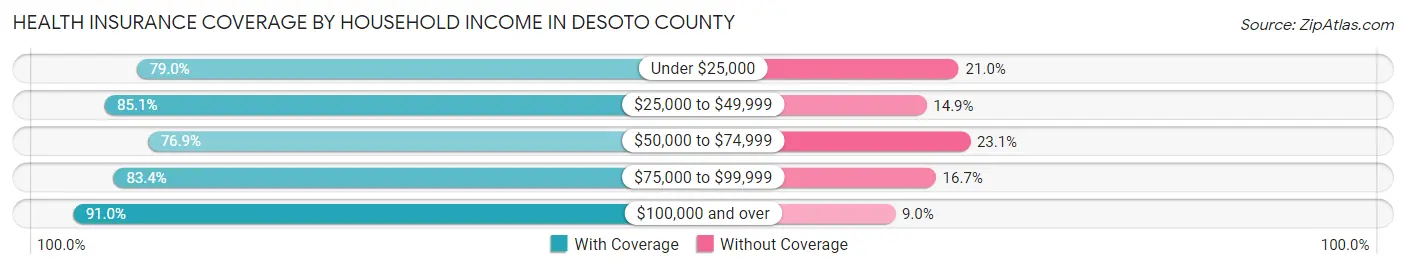
| Household Income | With Coverage | Without Coverage |
| Under $25,000 | 4,389 (79.0%) | 1,164 (21.0%) |
| $25,000 to $49,999 | 7,420 (85.1%) | 1,300 (14.9%) |
| $50,000 to $74,999 | 5,522 (76.9%) | 1,656 (23.1%) |
| $75,000 to $99,999 | 3,499 (83.4%) | 699 (16.7%) |
| $100,000 and over | 4,943 (91.0%) | 490 (9.0%) |
Public vs Private Health Insurance Coverage by Age in Desoto County
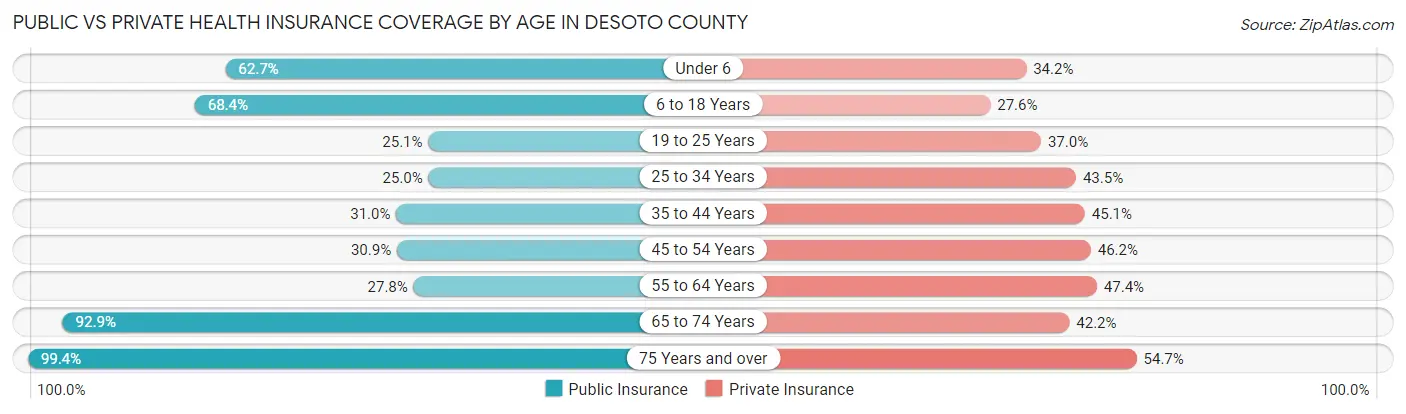
| Age Bracket | Public Insurance | Private Insurance |
| Under 6 | 1,257 (62.7%) | 686 (34.2%) |
| 6 to 18 Years | 3,045 (68.4%) | 1,227 (27.6%) |
| 19 to 25 Years | 781 (25.1%) | 1,152 (37.0%) |
| 25 to 34 Years | 903 (25.0%) | 1,569 (43.5%) |
| 35 to 44 Years | 1,237 (31.0%) | 1,800 (45.1%) |
| 45 to 54 Years | 1,204 (30.9%) | 1,802 (46.2%) |
| 55 to 64 Years | 1,132 (27.8%) | 1,929 (47.3%) |
| 65 to 74 Years | 3,786 (92.9%) | 1,721 (42.2%) |
| 75 Years and over | 3,413 (99.4%) | 1,879 (54.7%) |
| Total | 16,758 (51.3%) | 13,765 (42.2%) |
Disability Status by Sex by Age in Desoto County
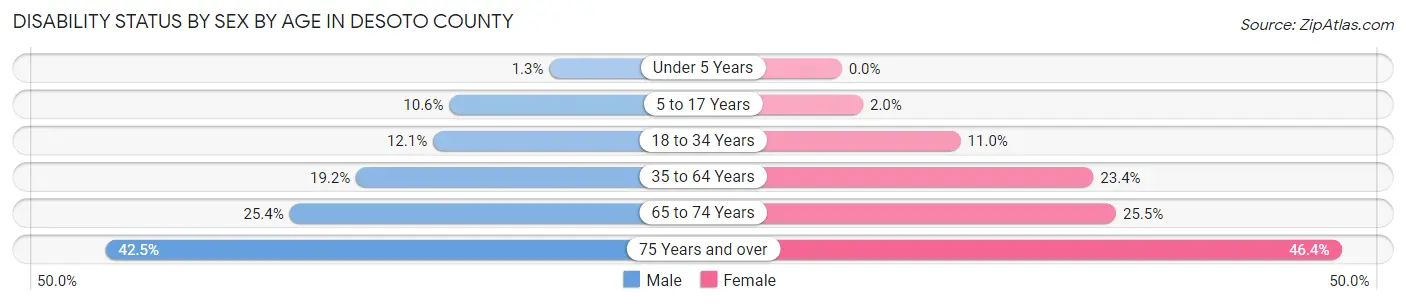
| Age Bracket | Male | Female |
| Under 5 Years | 7 (1.3%) | 0 (0.0%) |
| 5 to 17 Years | 267 (10.6%) | 39 (2.0%) |
| 18 to 34 Years | 519 (12.1%) | 298 (11.0%) |
| 35 to 64 Years | 1,286 (19.2%) | 1,232 (23.4%) |
| 65 to 74 Years | 499 (25.4%) | 537 (25.5%) |
| 75 Years and over | 731 (42.5%) | 794 (46.4%) |
Disability Class by Sex by Age in Desoto County
Disability Class: Hearing Difficulty
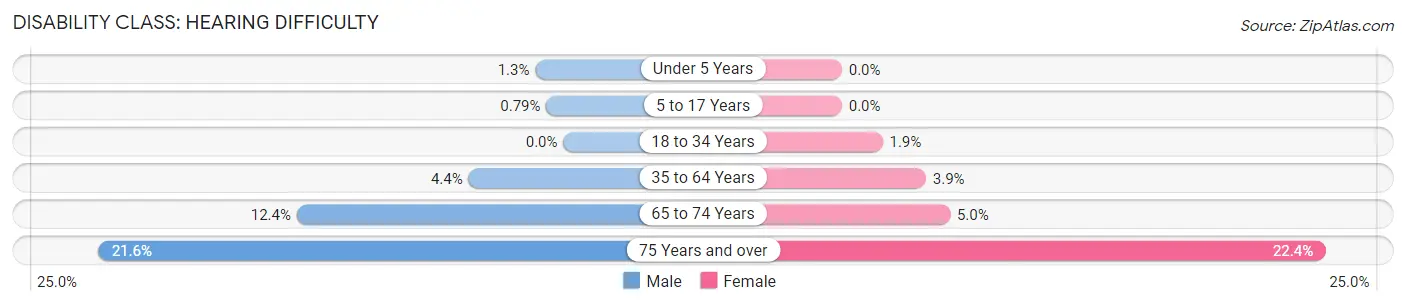
| Age Bracket | Male | Female |
| Under 5 Years | 7 (1.3%) | 0 (0.0%) |
| 5 to 17 Years | 20 (0.8%) | 0 (0.0%) |
| 18 to 34 Years | 0 (0.0%) | 51 (1.9%) |
| 35 to 64 Years | 294 (4.4%) | 206 (3.9%) |
| 65 to 74 Years | 243 (12.4%) | 106 (5.0%) |
| 75 Years and over | 371 (21.6%) | 384 (22.4%) |
Disability Class: Vision Difficulty
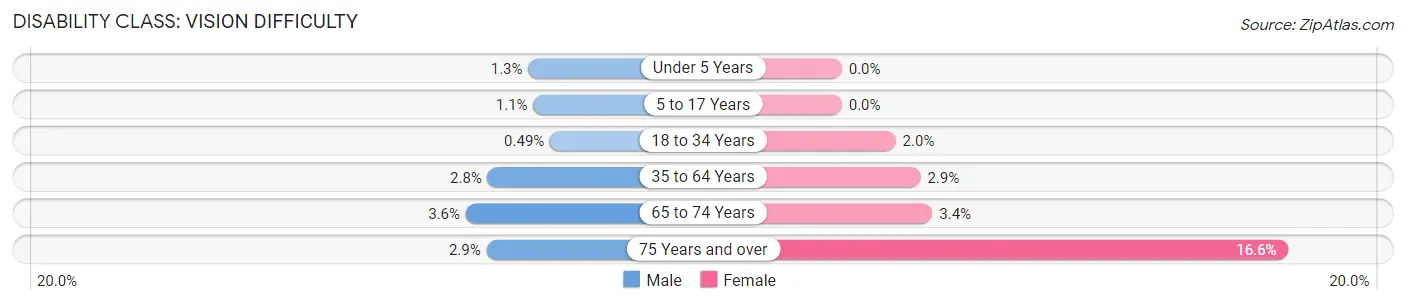
| Age Bracket | Male | Female |
| Under 5 Years | 7 (1.3%) | 0 (0.0%) |
| 5 to 17 Years | 28 (1.1%) | 0 (0.0%) |
| 18 to 34 Years | 21 (0.5%) | 54 (2.0%) |
| 35 to 64 Years | 188 (2.8%) | 154 (2.9%) |
| 65 to 74 Years | 71 (3.6%) | 71 (3.4%) |
| 75 Years and over | 49 (2.9%) | 284 (16.6%) |
Disability Class: Cognitive Difficulty
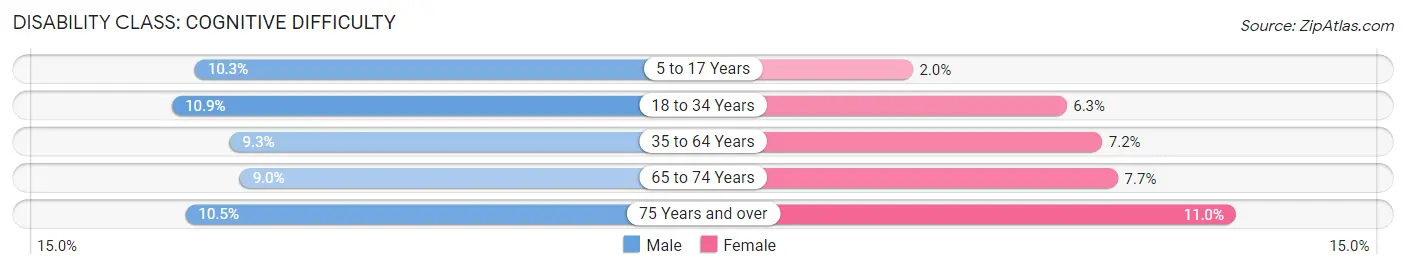
| Age Bracket | Male | Female |
| 5 to 17 Years | 259 (10.3%) | 39 (2.0%) |
| 18 to 34 Years | 467 (10.9%) | 169 (6.2%) |
| 35 to 64 Years | 621 (9.3%) | 382 (7.2%) |
| 65 to 74 Years | 177 (9.0%) | 162 (7.7%) |
| 75 Years and over | 181 (10.5%) | 188 (11.0%) |
Disability Class: Ambulatory Difficulty
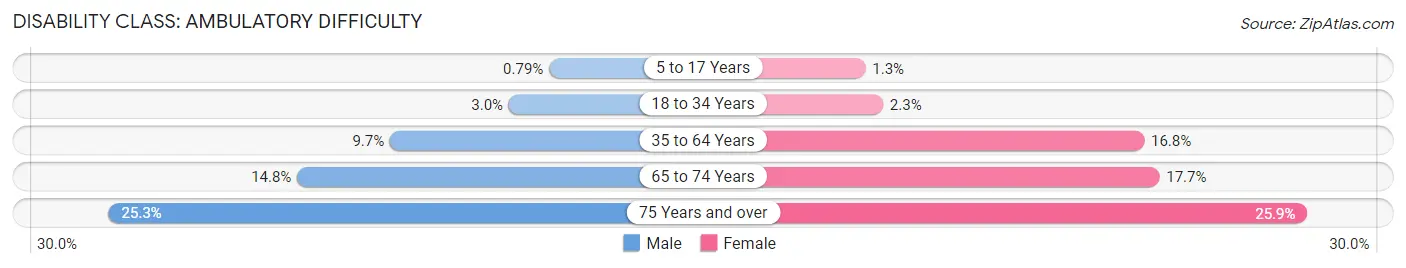
| Age Bracket | Male | Female |
| 5 to 17 Years | 20 (0.8%) | 26 (1.3%) |
| 18 to 34 Years | 130 (3.0%) | 62 (2.3%) |
| 35 to 64 Years | 645 (9.7%) | 888 (16.8%) |
| 65 to 74 Years | 291 (14.8%) | 373 (17.7%) |
| 75 Years and over | 436 (25.3%) | 444 (25.9%) |
Disability Class: Self-Care Difficulty
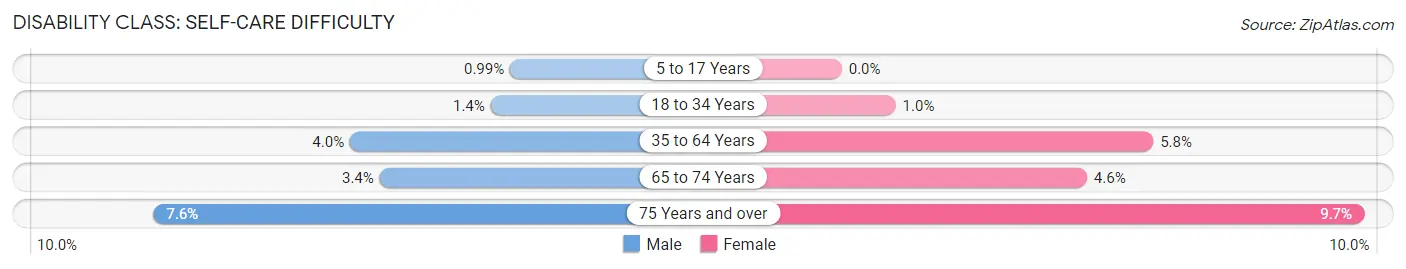
| Age Bracket | Male | Female |
| 5 to 17 Years | 25 (1.0%) | 0 (0.0%) |
| 18 to 34 Years | 58 (1.3%) | 27 (1.0%) |
| 35 to 64 Years | 265 (4.0%) | 305 (5.8%) |
| 65 to 74 Years | 67 (3.4%) | 96 (4.5%) |
| 75 Years and over | 131 (7.6%) | 166 (9.7%) |
Technology Access in Desoto County
Computing Device Access in Desoto County
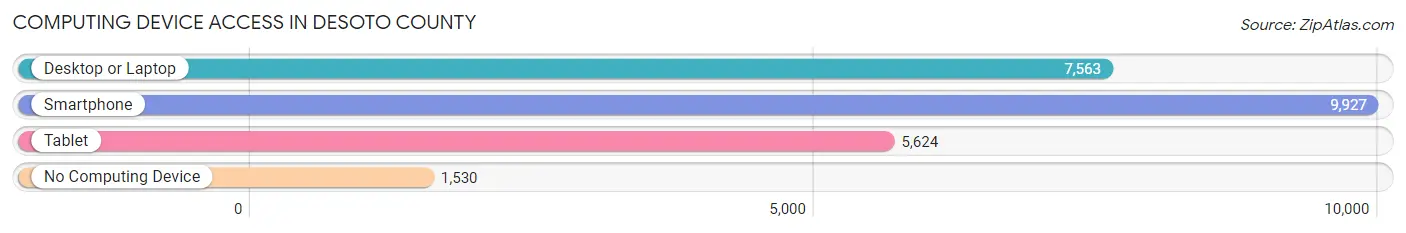
| Device Type | # Households | % Households |
| Desktop or Laptop | 7,563 | 61.3% |
| Smartphone | 9,927 | 80.4% |
| Tablet | 5,624 | 45.6% |
| No Computing Device | 1,530 | 12.4% |
| Total | 12,340 | 100.0% |
Internet Access in Desoto County
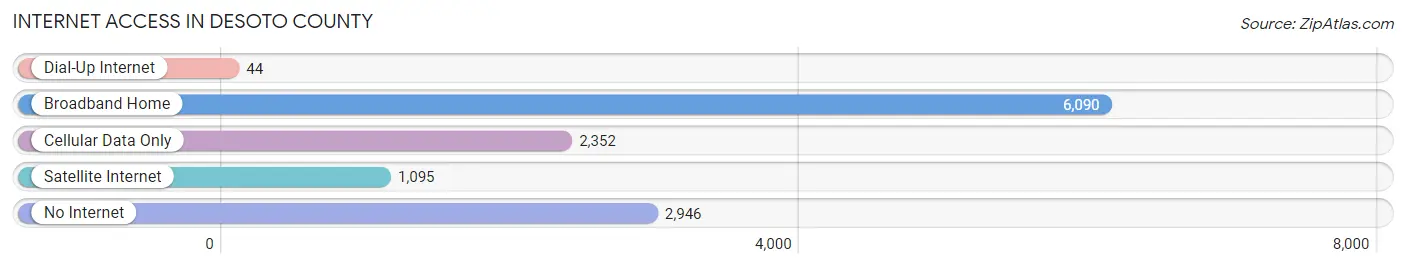
| Internet Type | # Households | % Households |
| Dial-Up Internet | 44 | 0.4% |
| Broadband Home | 6,090 | 49.3% |
| Cellular Data Only | 2,352 | 19.1% |
| Satellite Internet | 1,095 | 8.9% |
| No Internet | 2,946 | 23.9% |
| Total | 12,340 | 100.0% |
Desoto County Summary
DeSoto County is a county located in the southwestern part of the U.S. state of Florida. As of the 2010 census, the population was 34,862. Its county seat is Arcadia, Florida. The county was created in 1887 and named for Spanish explorer Hernando de Soto, whose name was also given to the nearby DeSoto National Memorial.
History
DeSoto County was created in 1887 from Manatee County. It was named for Spanish explorer Hernando de Soto, whose name was also given to the nearby DeSoto National Memorial. The county was originally part of Manatee County, but was split off in 1887.
The county was originally inhabited by the Calusa Indians, who were later displaced by the Seminole Indians. The first European settlers in the area were the Spanish, who established a mission in the area in the late 1700s.
Geography
DeSoto County is located in the southwestern part of the state of Florida. It is bordered by Charlotte County to the north, Sarasota County to the east, Hardee County to the south, and Polk County to the west. The county covers an area of 845 square miles, of which 817 square miles is land and 28 square miles is water.
The county is mostly flat, with some rolling hills in the northern part of the county. The highest point in the county is the summit of Iron Mountain, which is located in the northern part of the county and has an elevation of 140 feet.
The county is home to several rivers, including the Peace River, Myakka River, and the Manatee River. The county also contains several lakes, including Lake Suzy, Lake Istokpoga, and Lake June-in-Winter.
Economy
DeSoto County has a diverse economy, with a mix of agriculture, manufacturing, and tourism. The county is home to several large agricultural operations, including citrus groves, cattle ranches, and vegetable farms. The county is also home to several manufacturing companies, including a paper mill, a plastics plant, and a furniture factory.
Tourism is also an important part of the county's economy. The county is home to several popular attractions, including the DeSoto National Memorial, the Peace River Wildlife Center, and the Myakka River State Park.
Demographics
As of the 2010 census, there were 34,862 people, 12,845 households, and 9,072 families residing in the county. The population density was 42.7 people per square mile. There were 14,845 housing units at an average density of 18.1 per square mile. The racial makeup of the county was 79.2% White, 14.3% African American, 0.5% Native American, 0.7% Asian, 0.1% Pacific Islander, 3.7% from other races, and 1.4% from two or more races. Hispanic or Latino of any race were 11.2% of the population.
The median income for a household in the county was $37,845, and the median income for a family was $45,945. The per capita income for the county was $19,845. About 14.2% of families and 17.7% of the population were below the poverty line, including 25.2% of those under age 18 and 11.2% of those age 65 or over.
Common Questions
What is Per Capita Income in Desoto County?
Per Capita income in Desoto County is $21,726.
What is the Median Family Income in Desoto County?
Median Family Income in Desoto County is $53,743.
What is the Median Household income in Desoto County?
Median Household Income in Desoto County is $45,000.
What is Income or Wage Gap in Desoto County?
Income or Wage Gap in Desoto County is 21.7%.
Women in Desoto County earn 78.3 cents for every dollar earned by a man.
What is Family Income Deficit in Desoto County?
Family Income Deficit in Desoto County is $10,554.
Families that are below poverty line in Desoto County earn $10,554 less on average than the poverty threshold level.
What is Inequality or Gini Index in Desoto County?
Inequality or Gini Index in Desoto County is 0.43.
What is the Total Population of Desoto County?
Total Population of Desoto County is 34,258.
What is the Total Male Population of Desoto County?
Total Male Population of Desoto County is 19,234.
What is the Total Female Population of Desoto County?
Total Female Population of Desoto County is 15,024.
What is the Ratio of Males per 100 Females in Desoto County?
There are 128.02 Males per 100 Females in Desoto County.
What is the Ratio of Females per 100 Males in Desoto County?
There are 78.11 Females per 100 Males in Desoto County.
What is the Median Population Age in Desoto County?
Median Population Age in Desoto County is 41.7 Years.
What is the Average Family Size in Desoto County
Average Family Size in Desoto County is 3.0 People.
What is the Average Household Size in Desoto County
Average Household Size in Desoto County is 2.5 People.
How Large is the Labor Force in Desoto County?
There are 13,733 People in the Labor Forcein in Desoto County.
What is the Percentage of People in the Labor Force in Desoto County?
47.7% of People are in the Labor Force in Desoto County.
What is the Unemployment Rate in Desoto County?
Unemployment Rate in Desoto County is 9.7%.