Columbia County, FL Map & Demographics
Columbia County Map
Columbia County Overview
$28,317
PER CAPITA INCOME
$70,757
AVG FAMILY INCOME
$53,501
AVG HOUSEHOLD INCOME
25.4%
WAGE / INCOME GAP [ % ]
74.6¢/ $1
WAGE / INCOME GAP [ $ ]
$10,988
FAMILY INCOME DEFICIT
0.47
INEQUALITY / GINI INDEX
69,832
TOTAL POPULATION
35,762
MALE POPULATION
34,070
FEMALE POPULATION
104.97
MALES / 100 FEMALES
95.27
FEMALES / 100 MALES
40.7
MEDIAN AGE
3.1
AVG FAMILY SIZE
2.5
AVG HOUSEHOLD SIZE
29,626
LABOR FORCE [ PEOPLE ]
52.8%
PERCENT IN LABOR FORCE
6.9%
UNEMPLOYMENT RATE
Columbia County Area Codes
Income in Columbia County
Income Overview in Columbia County
Per Capita Income in Columbia County is $28,317, while median incomes of families and households are $70,757 and $53,501 respectively.
| Characteristic | Number | Measure |
| Per Capita Income | 69,832 | $28,317 |
| Median Family Income | 16,728 | $70,757 |
| Mean Family Income | 16,728 | $90,309 |
| Median Household Income | 26,391 | $53,501 |
| Mean Household Income | 26,391 | $74,233 |
| Income Deficit | 16,728 | $10,988 |
| Wage / Income Gap (%) | 69,832 | 25.37% |
| Wage / Income Gap ($) | 69,832 | 74.63¢ per $1 |
| Gini / Inequality Index | 69,832 | 0.47 |
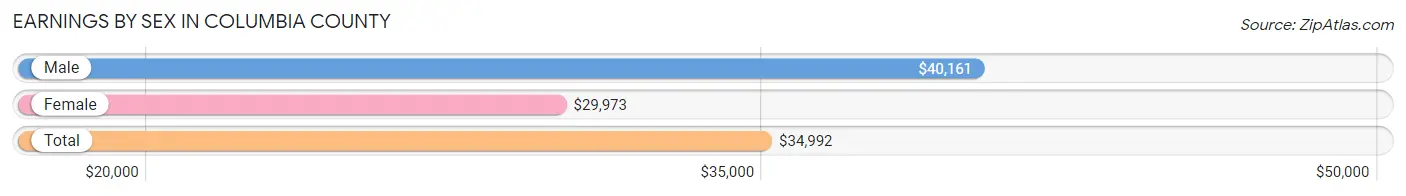
Earnings by Sex in Columbia County
Average Earnings in Columbia County are $34,992, $40,161 for men and $29,973 for women, a difference of 25.4%.
| Sex | Number | Average Earnings |
| Male | 15,676 (51.1%) | $40,161 |
| Female | 14,989 (48.9%) | $29,973 |
| Total | 30,665 (100.0%) | $34,992 |
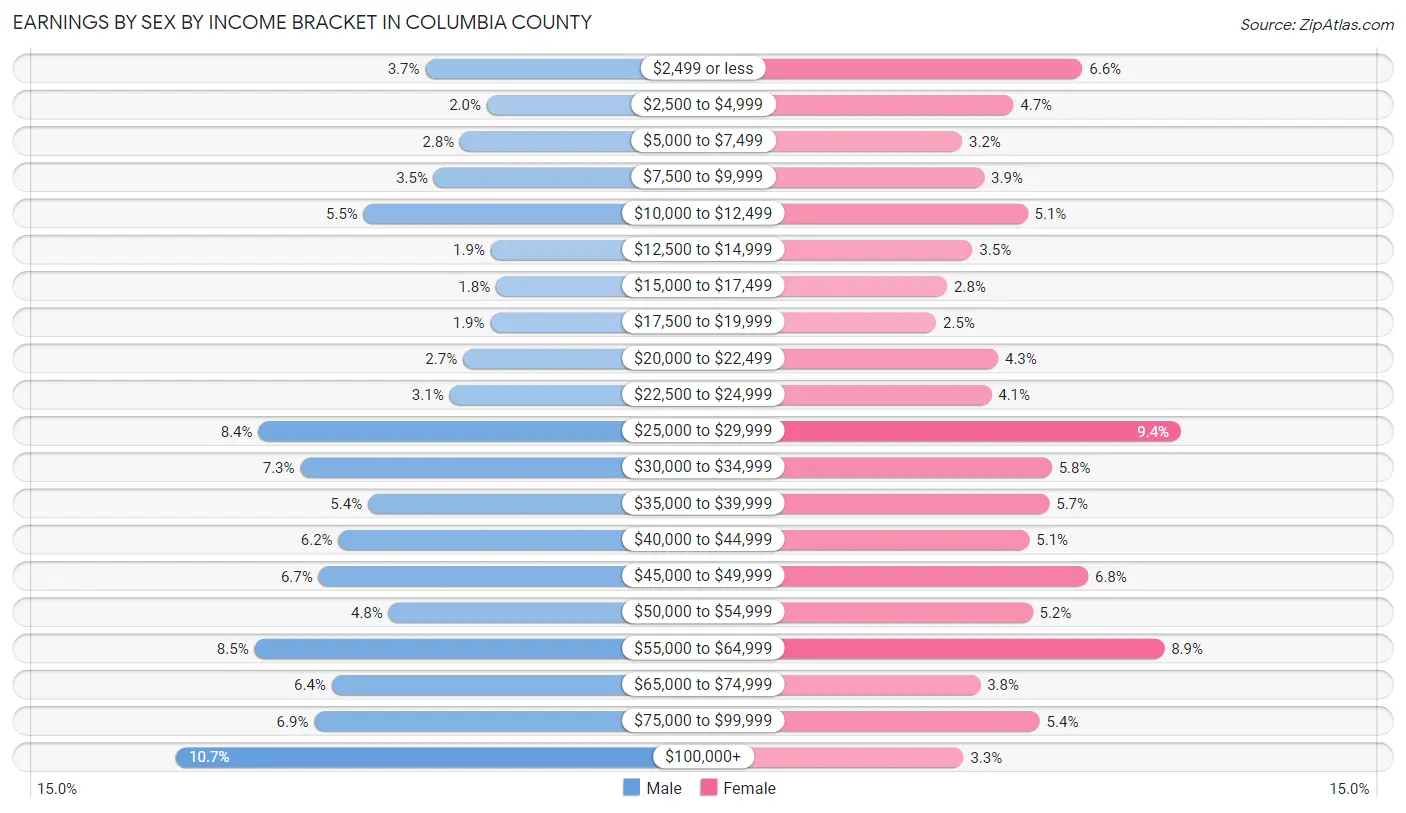
Earnings by Sex by Income Bracket in Columbia County
The most common earnings brackets in Columbia County are $100,000+ for men (1,684 | 10.7%) and $25,000 to $29,999 for women (1,407 | 9.4%).
| Income | Male | Female |
| $2,499 or less | 587 (3.7%) | 993 (6.6%) |
| $2,500 to $4,999 | 315 (2.0%) | 702 (4.7%) |
| $5,000 to $7,499 | 432 (2.8%) | 485 (3.2%) |
| $7,500 to $9,999 | 549 (3.5%) | 579 (3.9%) |
| $10,000 to $12,499 | 858 (5.5%) | 762 (5.1%) |
| $12,500 to $14,999 | 298 (1.9%) | 529 (3.5%) |
| $15,000 to $17,499 | 275 (1.8%) | 423 (2.8%) |
| $17,500 to $19,999 | 299 (1.9%) | 376 (2.5%) |
| $20,000 to $22,499 | 420 (2.7%) | 637 (4.3%) |
| $22,500 to $24,999 | 479 (3.1%) | 609 (4.1%) |
| $25,000 to $29,999 | 1,321 (8.4%) | 1,407 (9.4%) |
| $30,000 to $34,999 | 1,137 (7.2%) | 864 (5.8%) |
| $35,000 to $39,999 | 838 (5.3%) | 853 (5.7%) |
| $40,000 to $44,999 | 968 (6.2%) | 769 (5.1%) |
| $45,000 to $49,999 | 1,056 (6.7%) | 1,016 (6.8%) |
| $50,000 to $54,999 | 747 (4.8%) | 783 (5.2%) |
| $55,000 to $64,999 | 1,339 (8.5%) | 1,337 (8.9%) |
| $65,000 to $74,999 | 999 (6.4%) | 562 (3.7%) |
| $75,000 to $99,999 | 1,075 (6.9%) | 812 (5.4%) |
| $100,000+ | 1,684 (10.7%) | 491 (3.3%) |
| Total | 15,676 (100.0%) | 14,989 (100.0%) |
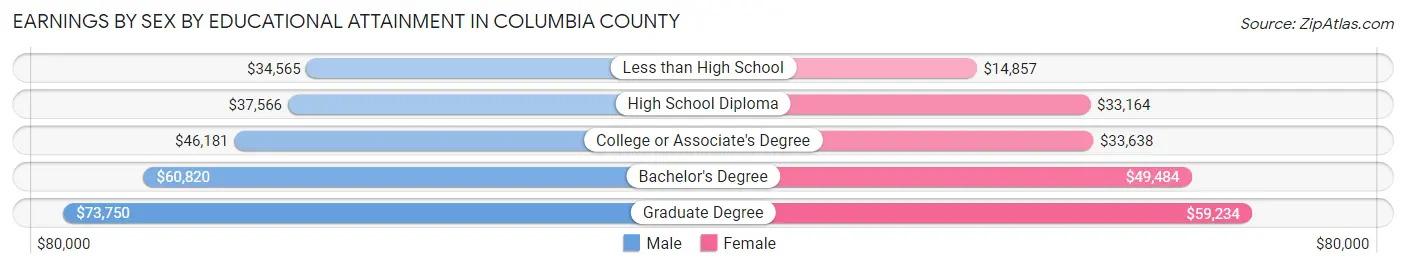
Earnings by Sex by Educational Attainment in Columbia County
Average earnings in Columbia County are $43,797 for men and $36,058 for women, a difference of 17.7%. Men with an educational attainment of graduate degree enjoy the highest average annual earnings of $73,750, while those with less than high school education earn the least with $34,565. Women with an educational attainment of graduate degree earn the most with the average annual earnings of $59,234, while those with less than high school education have the smallest earnings of $14,857.
| Educational Attainment | Male Income | Female Income |
| Less than High School | $34,565 | $14,857 |
| High School Diploma | $37,566 | $33,164 |
| College or Associate's Degree | $46,181 | $33,638 |
| Bachelor's Degree | $60,820 | $49,484 |
| Graduate Degree | $73,750 | $59,234 |
| Total | $43,797 | $36,058 |
Family Income in Columbia County
Family Income Brackets in Columbia County
According to the Columbia County family income data, there are 3,178 families falling into the $50,000 to $74,999 income range, which is the most common income bracket and makes up 19.0% of all families. Conversely, the less than $10,000 income bracket is the least frequent group with only 452 families (2.7%) belonging to this category.
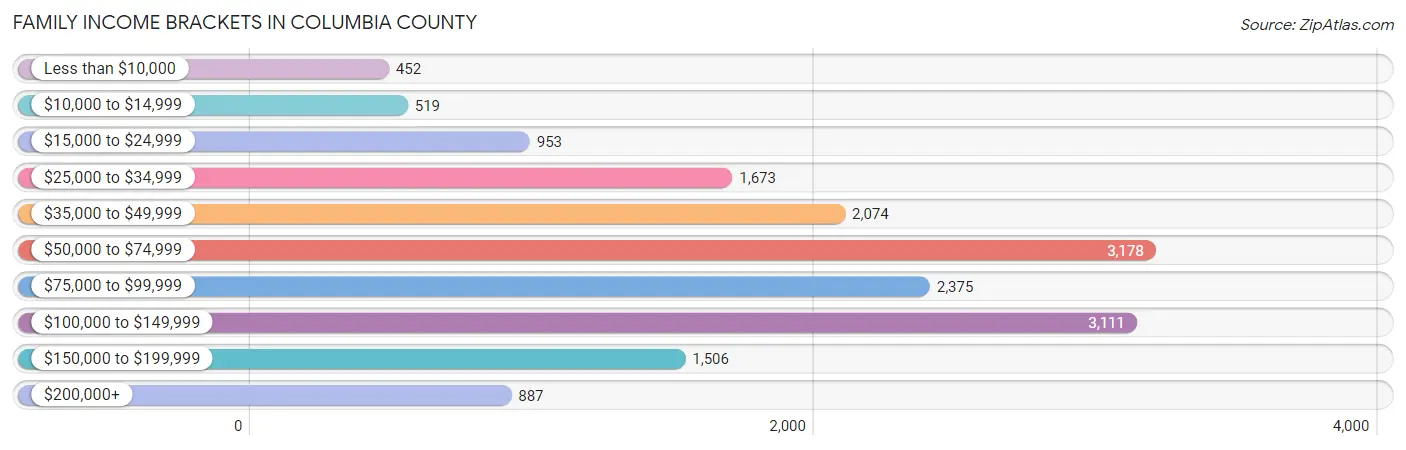
| Income Bracket | # Families | % Families |
| Less than $10,000 | 452 | 2.7% |
| $10,000 to $14,999 | 519 | 3.1% |
| $15,000 to $24,999 | 953 | 5.7% |
| $25,000 to $34,999 | 1,673 | 10.0% |
| $35,000 to $49,999 | 2,074 | 12.4% |
| $50,000 to $74,999 | 3,178 | 19.0% |
| $75,000 to $99,999 | 2,375 | 14.2% |
| $100,000 to $149,999 | 3,111 | 18.6% |
| $150,000 to $199,999 | 1,506 | 9.0% |
| $200,000+ | 887 | 5.3% |
Family Income by Famaliy Size in Columbia County
5-person families (1,196 | 7.1%) account for the highest median family income in Columbia County with $84,286 per family, while 2-person families (8,089 | 48.4%) have the highest median income of $31,285 per family member.
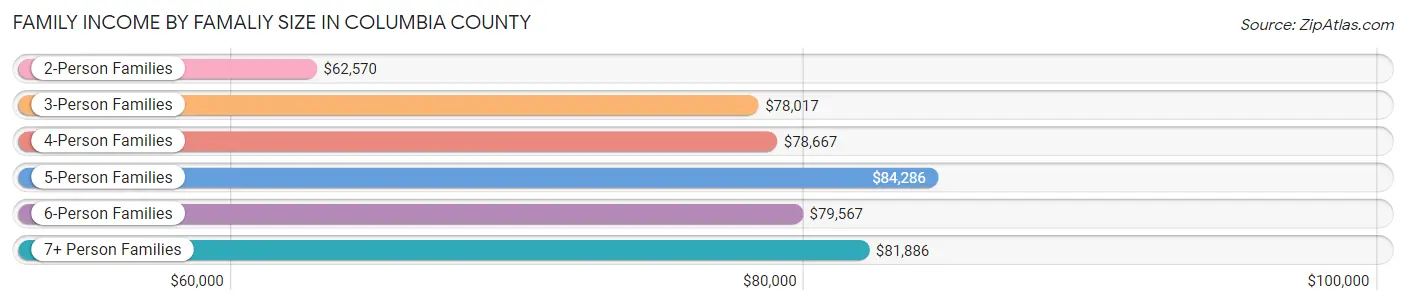
| Income Bracket | # Families | Median Income |
| 2-Person Families | 8,089 (48.4%) | $62,570 |
| 3-Person Families | 3,912 (23.4%) | $78,017 |
| 4-Person Families | 2,896 (17.3%) | $78,667 |
| 5-Person Families | 1,196 (7.1%) | $84,286 |
| 6-Person Families | 404 (2.4%) | $79,567 |
| 7+ Person Families | 231 (1.4%) | $81,886 |
| Total | 16,728 (100.0%) | $70,757 |
Family Income by Number of Earners in Columbia County
The median family income in Columbia County is $70,757, with families comprising 3+ earners (1,665) having the highest median family income of $157,986, while families with no earners (3,585) have the lowest median family income of $39,821, accounting for 10.0% and 21.4% of families, respectively.
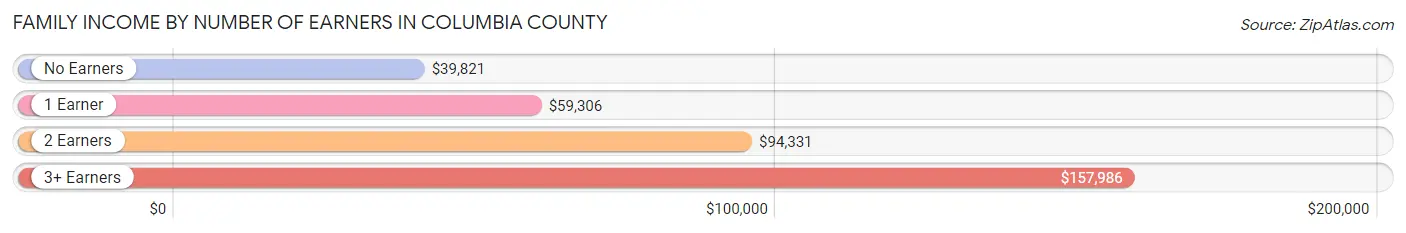
| Number of Earners | # Families | Median Income |
| No Earners | 3,585 (21.4%) | $39,821 |
| 1 Earner | 5,732 (34.3%) | $59,306 |
| 2 Earners | 5,746 (34.4%) | $94,331 |
| 3+ Earners | 1,665 (10.0%) | $157,986 |
| Total | 16,728 (100.0%) | $70,757 |
Household Income in Columbia County
Household Income Brackets in Columbia County
With 4,724 households falling in the category, the $50,000 to $74,999 income range is the most frequent in Columbia County, accounting for 17.9% of all households. In contrast, only 1,056 households (4.0%) fall into the $200,000+ income bracket, making it the least populous group.
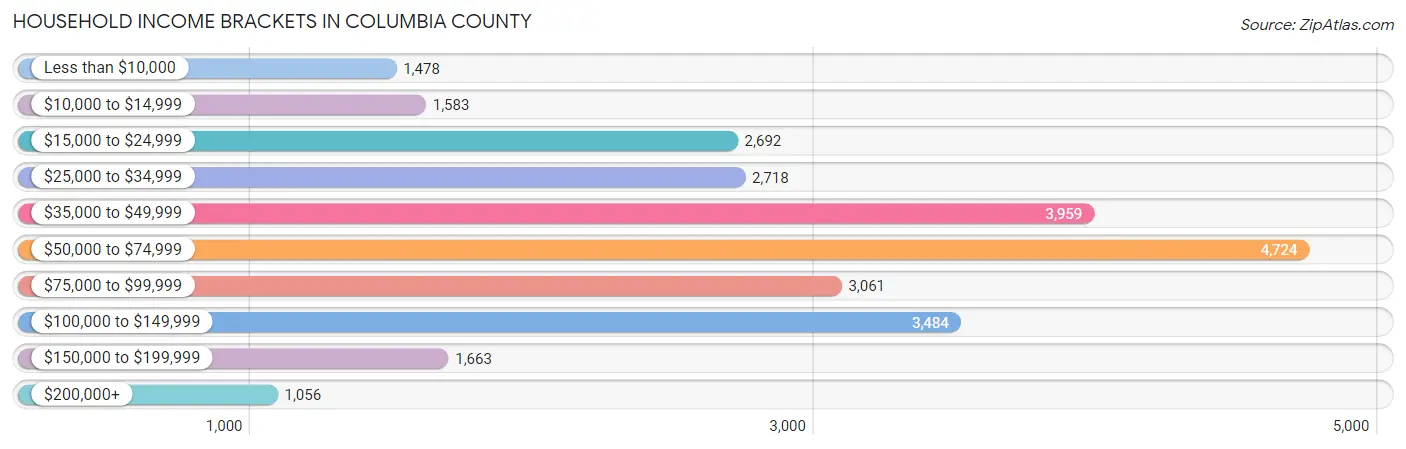
| Income Bracket | # Households | % Households |
| Less than $10,000 | 1,478 | 5.6% |
| $10,000 to $14,999 | 1,583 | 6.0% |
| $15,000 to $24,999 | 2,692 | 10.2% |
| $25,000 to $34,999 | 2,718 | 10.3% |
| $35,000 to $49,999 | 3,959 | 15.0% |
| $50,000 to $74,999 | 4,724 | 17.9% |
| $75,000 to $99,999 | 3,061 | 11.6% |
| $100,000 to $149,999 | 3,484 | 13.2% |
| $150,000 to $199,999 | 1,663 | 6.3% |
| $200,000+ | 1,056 | 4.0% |
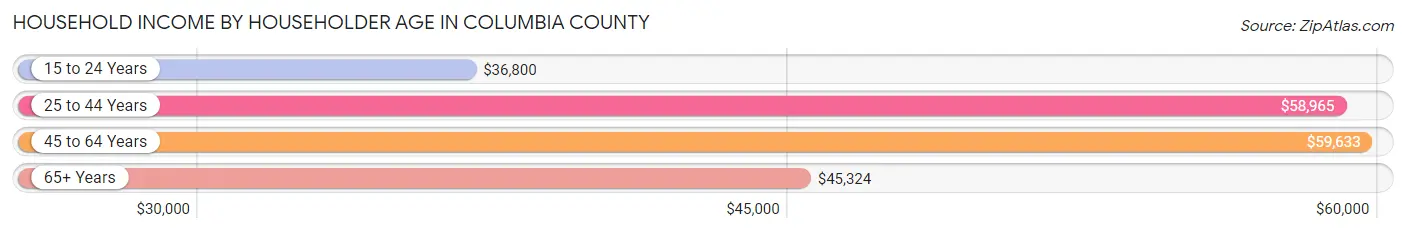
Household Income by Householder Age in Columbia County
The median household income in Columbia County is $53,501, with the highest median household income of $59,633 found in the 45 to 64 years age bracket for the primary householder. A total of 9,536 households (36.1%) fall into this category. Meanwhile, the 15 to 24 years age bracket for the primary householder has the lowest median household income of $36,800, with 734 households (2.8%) in this group.
| Income Bracket | # Households | Median Income |
| 15 to 24 Years | 734 (2.8%) | $36,800 |
| 25 to 44 Years | 7,829 (29.7%) | $58,965 |
| 45 to 64 Years | 9,536 (36.1%) | $59,633 |
| 65+ Years | 8,292 (31.4%) | $45,324 |
| Total | 26,391 (100.0%) | $53,501 |
Poverty in Columbia County
Income Below Poverty by Sex and Age in Columbia County
With 16.1% poverty level for males and 15.3% for females among the residents of Columbia County, 5 year old males and 18 to 24 year old females are the most vulnerable to poverty, with 131 males (36.9%) and 621 females (24.7%) in their respective age groups living below the poverty level.
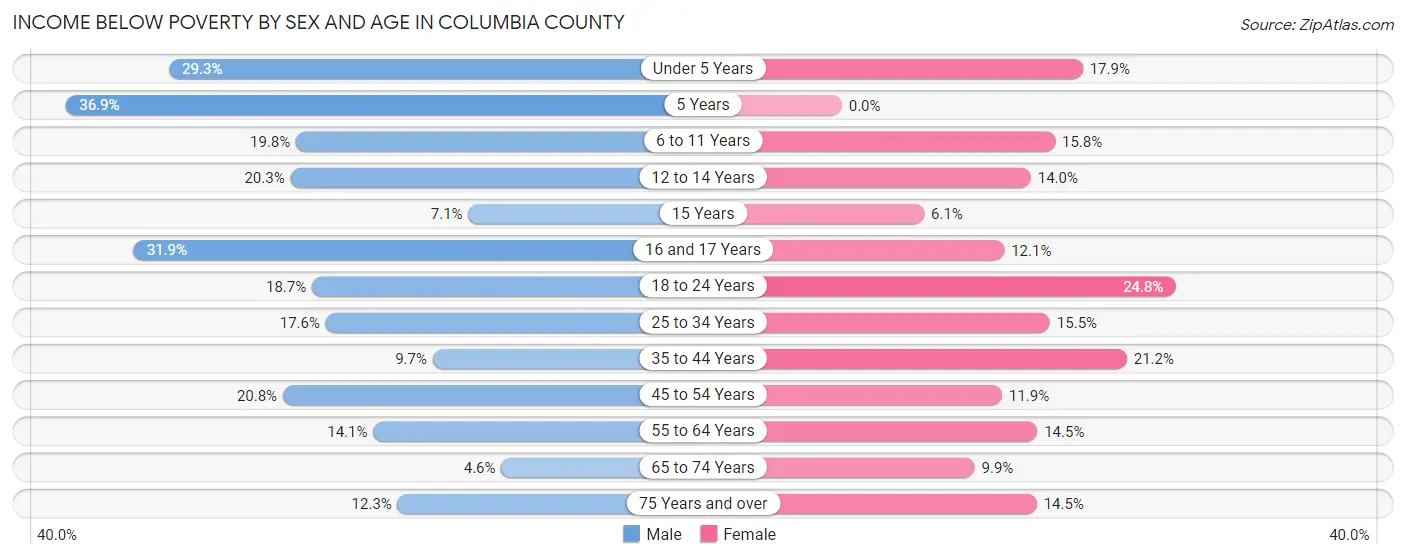
| Age Bracket | Male | Female |
| Under 5 Years | 516 (29.3%) | 362 (17.9%) |
| 5 Years | 131 (36.9%) | 0 (0.0%) |
| 6 to 11 Years | 591 (19.8%) | 408 (15.8%) |
| 12 to 14 Years | 246 (20.3%) | 167 (14.0%) |
| 15 Years | 38 (7.0%) | 19 (6.1%) |
| 16 and 17 Years | 280 (31.9%) | 104 (12.1%) |
| 18 to 24 Years | 405 (18.7%) | 621 (24.7%) |
| 25 to 34 Years | 597 (17.6%) | 605 (15.4%) |
| 35 to 44 Years | 387 (9.7%) | 838 (21.2%) |
| 45 to 54 Years | 796 (20.8%) | 470 (11.9%) |
| 55 to 64 Years | 616 (14.1%) | 710 (14.5%) |
| 65 to 74 Years | 166 (4.6%) | 407 (9.9%) |
| 75 Years and over | 287 (12.3%) | 429 (14.5%) |
| Total | 5,056 (16.1%) | 5,140 (15.3%) |
Income Above Poverty by Sex and Age in Columbia County
According to the poverty statistics in Columbia County, males aged 65 to 74 years and females aged 5 years are the age groups that are most secure financially, with 95.4% of males and 100.0% of females in these age groups living above the poverty line.
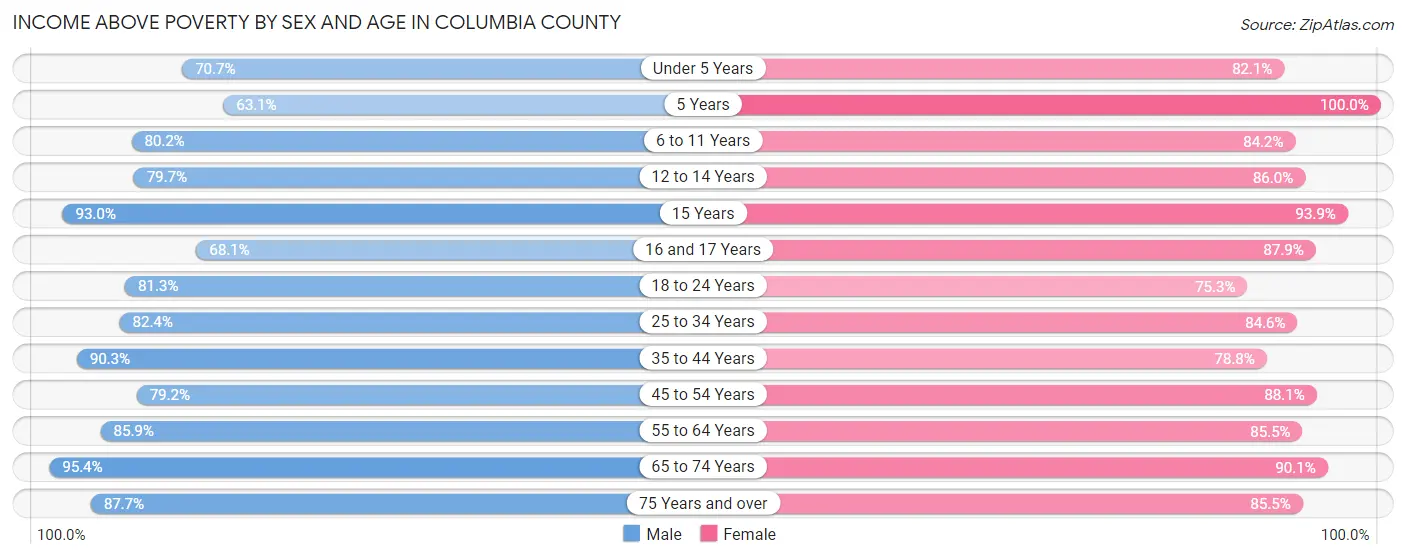
| Age Bracket | Male | Female |
| Under 5 Years | 1,247 (70.7%) | 1,661 (82.1%) |
| 5 Years | 224 (63.1%) | 311 (100.0%) |
| 6 to 11 Years | 2,388 (80.2%) | 2,169 (84.2%) |
| 12 to 14 Years | 968 (79.7%) | 1,023 (86.0%) |
| 15 Years | 501 (92.9%) | 292 (93.9%) |
| 16 and 17 Years | 598 (68.1%) | 758 (87.9%) |
| 18 to 24 Years | 1,765 (81.3%) | 1,888 (75.2%) |
| 25 to 34 Years | 2,788 (82.4%) | 3,311 (84.6%) |
| 35 to 44 Years | 3,608 (90.3%) | 3,123 (78.8%) |
| 45 to 54 Years | 3,028 (79.2%) | 3,478 (88.1%) |
| 55 to 64 Years | 3,751 (85.9%) | 4,184 (85.5%) |
| 65 to 74 Years | 3,443 (95.4%) | 3,720 (90.1%) |
| 75 Years and over | 2,046 (87.7%) | 2,535 (85.5%) |
| Total | 26,355 (83.9%) | 28,453 (84.7%) |
Income Below Poverty Among Married-Couple Families in Columbia County
The poverty statistics for married-couple families in Columbia County show that 5.1% or 607 of the total 11,971 families live below the poverty line. Families with 1 or 2 children have the highest poverty rate of 7.3%, comprising of 286 families. On the other hand, families with 5 or more children have the lowest poverty rate of 0.0%, which includes 0 families.
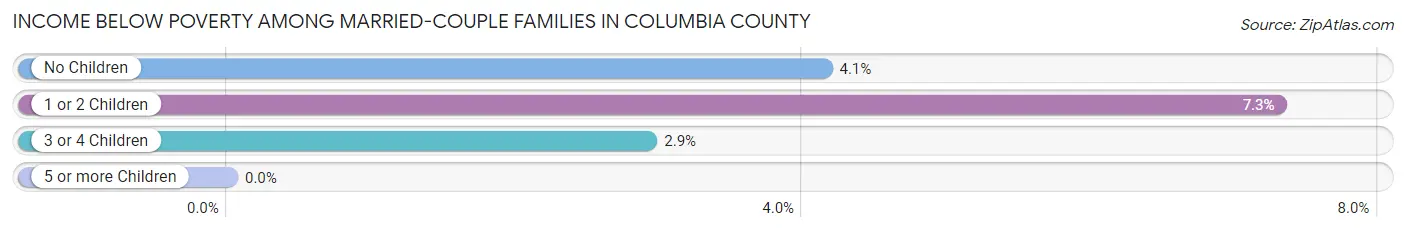
| Children | Above Poverty | Below Poverty |
| No Children | 7,020 (95.9%) | 303 (4.1%) |
| 1 or 2 Children | 3,631 (92.7%) | 286 (7.3%) |
| 3 or 4 Children | 598 (97.1%) | 18 (2.9%) |
| 5 or more Children | 115 (100.0%) | 0 (0.0%) |
| Total | 11,364 (94.9%) | 607 (5.1%) |
Income Below Poverty Among Single-Parent Households in Columbia County
According to the poverty data in Columbia County, 16.0% or 209 single-father households and 25.2% or 870 single-mother households are living below the poverty line. Among single-father households, those with 1 or 2 children have the highest poverty rate, with 118 households (16.8%) experiencing poverty. Likewise, among single-mother households, those with 5 or more children have the highest poverty rate, with 30 households (100.0%) falling below the poverty line.
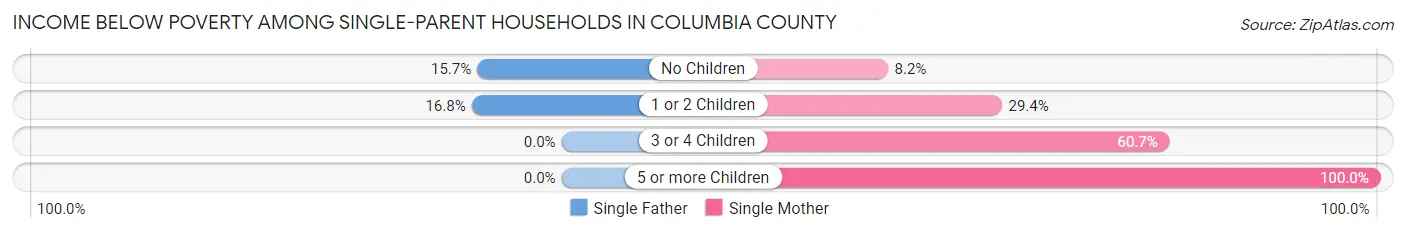
| Children | Single Father | Single Mother |
| No Children | 91 (15.7%) | 115 (8.2%) |
| 1 or 2 Children | 118 (16.8%) | 470 (29.4%) |
| 3 or 4 Children | 0 (0.0%) | 255 (60.7%) |
| 5 or more Children | 0 (0.0%) | 30 (100.0%) |
| Total | 209 (16.0%) | 870 (25.2%) |
Income Below Poverty Among Married-Couple vs Single-Parent Households in Columbia County
The poverty data for Columbia County shows that 607 of the married-couple family households (5.1%) and 1,079 of the single-parent households (22.7%) are living below the poverty level. Within the married-couple family households, those with 1 or 2 children have the highest poverty rate, with 286 households (7.3%) falling below the poverty line. Among the single-parent households, those with 5 or more children have the highest poverty rate, with 30 household (100.0%) living below poverty.
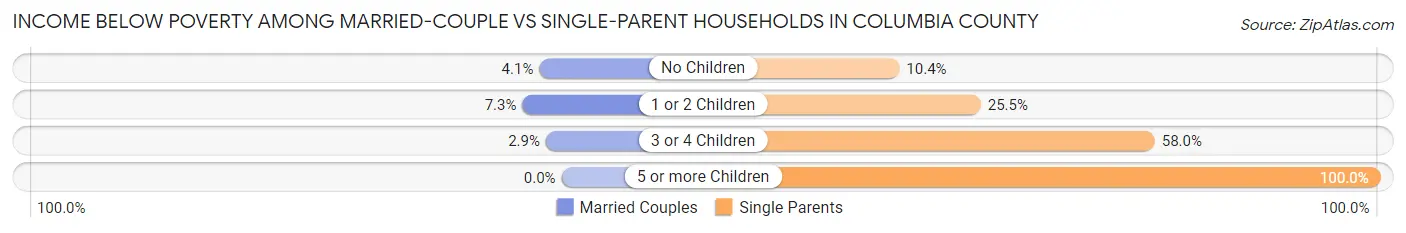
| Children | Married-Couple Families | Single-Parent Households |
| No Children | 303 (4.1%) | 206 (10.4%) |
| 1 or 2 Children | 286 (7.3%) | 588 (25.5%) |
| 3 or 4 Children | 18 (2.9%) | 255 (58.0%) |
| 5 or more Children | 0 (0.0%) | 30 (100.0%) |
| Total | 607 (5.1%) | 1,079 (22.7%) |
Race in Columbia County
The most populous races in Columbia County are White / Caucasian (51,489 | 73.7%), Black / African American (11,759 | 16.8%), and Hispanic or Latino (4,730 | 6.8%).
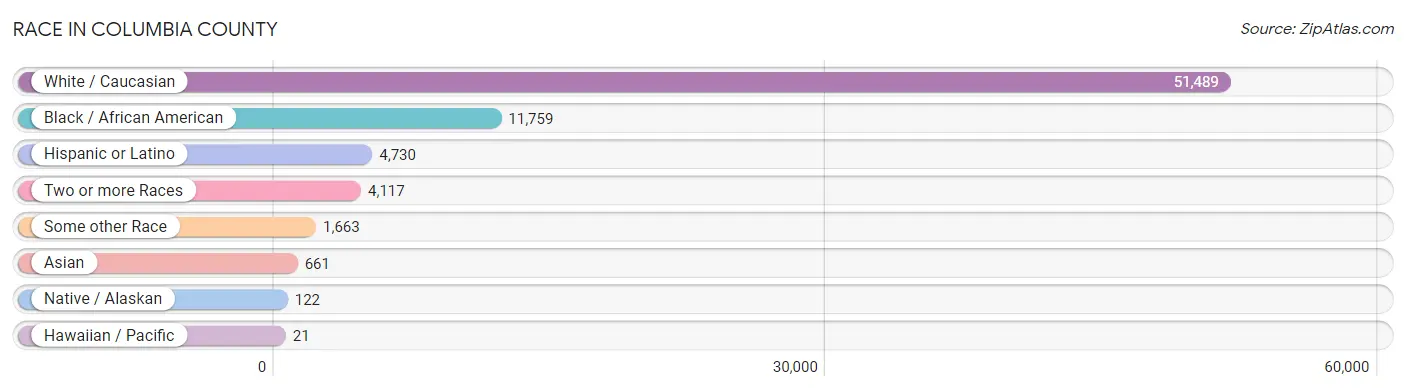
| Race | # Population | % Population |
| Asian | 661 | 0.9% |
| Black / African American | 11,759 | 16.8% |
| Hawaiian / Pacific | 21 | 0.0% |
| Hispanic or Latino | 4,730 | 6.8% |
| Native / Alaskan | 122 | 0.2% |
| White / Caucasian | 51,489 | 73.7% |
| Two or more Races | 4,117 | 5.9% |
| Some other Race | 1,663 | 2.4% |
| Total | 69,832 | 100.0% |
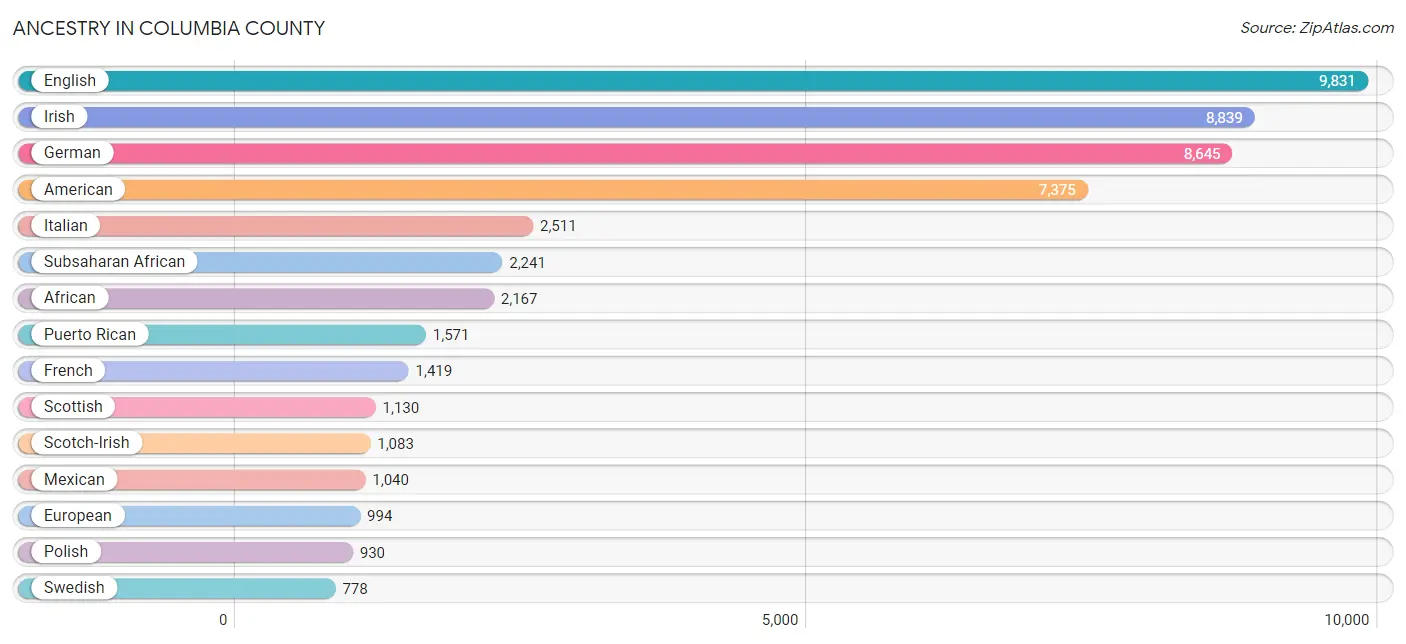
Ancestry in Columbia County
The most populous ancestries reported in Columbia County are English (9,831 | 14.1%), Irish (8,839 | 12.7%), German (8,645 | 12.4%), American (7,375 | 10.6%), and Italian (2,511 | 3.6%), together accounting for 53.3% of all Columbia County residents.
| Ancestry | # Population | % Population |
| African | 2,167 | 3.1% |
| American | 7,375 | 10.6% |
| Apache | 21 | 0.0% |
| Arab | 259 | 0.4% |
| Argentinean | 1 | 0.0% |
| Armenian | 88 | 0.1% |
| Australian | 39 | 0.1% |
| Austrian | 75 | 0.1% |
| Bahamian | 172 | 0.3% |
| Barbadian | 48 | 0.1% |
| Belgian | 95 | 0.1% |
| Bhutanese | 36 | 0.1% |
| Blackfeet | 17 | 0.0% |
| Bolivian | 70 | 0.1% |
| Brazilian | 46 | 0.1% |
| British | 336 | 0.5% |
| Burmese | 61 | 0.1% |
| Cajun | 55 | 0.1% |
| Canadian | 155 | 0.2% |
| Celtic | 10 | 0.0% |
| Central American | 561 | 0.8% |
| Central American Indian | 49 | 0.1% |
| Cherokee | 246 | 0.4% |
| Chilean | 13 | 0.0% |
| Chippewa | 12 | 0.0% |
| Choctaw | 9 | 0.0% |
| Colombian | 100 | 0.1% |
| Costa Rican | 30 | 0.0% |
| Creek | 18 | 0.0% |
| Croatian | 46 | 0.1% |
| Crow | 5 | 0.0% |
| Cuban | 693 | 1.0% |
| Czech | 249 | 0.4% |
| Czechoslovakian | 90 | 0.1% |
| Danish | 80 | 0.1% |
| Dominican | 157 | 0.2% |
| Dutch | 753 | 1.1% |
| Eastern European | 139 | 0.2% |
| Ecuadorian | 38 | 0.1% |
| English | 9,831 | 14.1% |
| European | 994 | 1.4% |
| Finnish | 34 | 0.1% |
| French | 1,419 | 2.0% |
| French American Indian | 20 | 0.0% |
| French Canadian | 242 | 0.4% |
| German | 8,645 | 12.4% |
| German Russian | 12 | 0.0% |
| Greek | 150 | 0.2% |
| Guatemalan | 54 | 0.1% |
| Haitian | 227 | 0.3% |
| Honduran | 346 | 0.5% |
| Hungarian | 208 | 0.3% |
| Icelander | 31 | 0.0% |
| Indian (Asian) | 29 | 0.0% |
| Iranian | 71 | 0.1% |
| Irish | 8,839 | 12.7% |
| Iroquois | 66 | 0.1% |
| Israeli | 16 | 0.0% |
| Italian | 2,511 | 3.6% |
| Jamaican | 335 | 0.5% |
| Korean | 320 | 0.5% |
| Laotian | 62 | 0.1% |
| Lithuanian | 86 | 0.1% |
| Mexican | 1,040 | 1.5% |
| Mexican American Indian | 1 | 0.0% |
| Moroccan | 249 | 0.4% |
| Native Hawaiian | 27 | 0.0% |
| New Zealander | 34 | 0.1% |
| Nicaraguan | 63 | 0.1% |
| Nigerian | 74 | 0.1% |
| Northern European | 128 | 0.2% |
| Norwegian | 484 | 0.7% |
| Pakistani | 32 | 0.1% |
| Pennsylvania German | 19 | 0.0% |
| Peruvian | 212 | 0.3% |
| Polish | 930 | 1.3% |
| Portuguese | 62 | 0.1% |
| Potawatomi | 23 | 0.0% |
| Puerto Rican | 1,571 | 2.2% |
| Romanian | 48 | 0.1% |
| Russian | 49 | 0.1% |
| Salvadoran | 68 | 0.1% |
| Scandinavian | 196 | 0.3% |
| Scotch-Irish | 1,083 | 1.5% |
| Scottish | 1,130 | 1.6% |
| Seminole | 32 | 0.1% |
| Shoshone | 4 | 0.0% |
| Sioux | 7 | 0.0% |
| Slavic | 2 | 0.0% |
| Slovak | 130 | 0.2% |
| South American | 434 | 0.6% |
| Spaniard | 169 | 0.2% |
| Spanish | 13 | 0.0% |
| Spanish American Indian | 6 | 0.0% |
| Sri Lankan | 158 | 0.2% |
| Subsaharan African | 2,241 | 3.2% |
| Swedish | 778 | 1.1% |
| Swiss | 100 | 0.1% |
| Syrian | 10 | 0.0% |
| Thai | 104 | 0.2% |
| Trinidadian and Tobagonian | 3 | 0.0% |
| Ukrainian | 96 | 0.1% |
| Welsh | 209 | 0.3% |
| West Indian | 17 | 0.0% | View All 104 Rows |
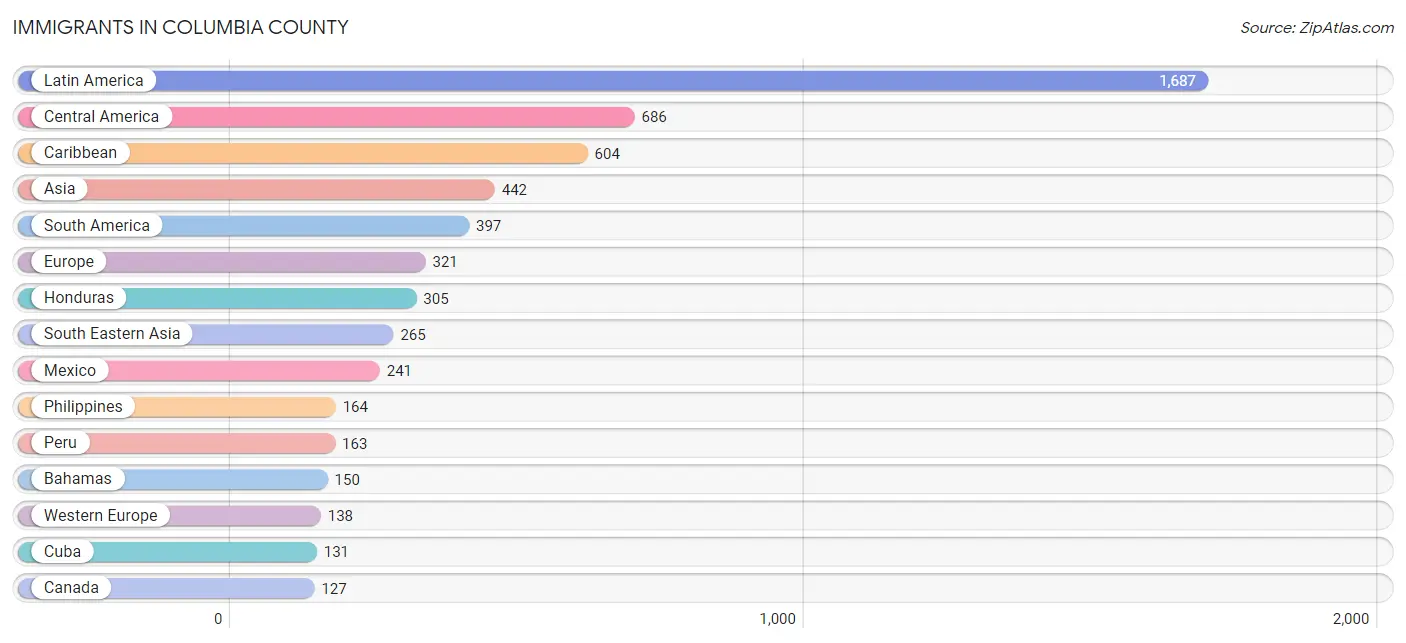
Immigrants in Columbia County
The most numerous immigrant groups reported in Columbia County came from Latin America (1,687 | 2.4%), Central America (686 | 1.0%), Caribbean (604 | 0.9%), Asia (442 | 0.6%), and South America (397 | 0.6%), together accounting for 5.5% of all Columbia County residents.
| Immigration Origin | # Population | % Population |
| Africa | 54 | 0.1% |
| Argentina | 1 | 0.0% |
| Asia | 442 | 0.6% |
| Australia | 16 | 0.0% |
| Bahamas | 150 | 0.2% |
| Bolivia | 38 | 0.1% |
| Brazil | 104 | 0.2% |
| Cambodia | 8 | 0.0% |
| Canada | 127 | 0.2% |
| Caribbean | 604 | 0.9% |
| Central America | 686 | 1.0% |
| Chile | 2 | 0.0% |
| China | 14 | 0.0% |
| Colombia | 53 | 0.1% |
| Costa Rica | 30 | 0.0% |
| Cuba | 131 | 0.2% |
| Denmark | 10 | 0.0% |
| Dominican Republic | 113 | 0.2% |
| Eastern Asia | 67 | 0.1% |
| Eastern Europe | 44 | 0.1% |
| Ecuador | 24 | 0.0% |
| El Salvador | 32 | 0.1% |
| England | 88 | 0.1% |
| Europe | 321 | 0.5% |
| France | 28 | 0.0% |
| Germany | 106 | 0.2% |
| Guatemala | 25 | 0.0% |
| Guyana | 12 | 0.0% |
| Haiti | 85 | 0.1% |
| Honduras | 305 | 0.4% |
| India | 40 | 0.1% |
| Iran | 65 | 0.1% |
| Ireland | 10 | 0.0% |
| Israel | 5 | 0.0% |
| Italy | 5 | 0.0% |
| Jamaica | 98 | 0.1% |
| Japan | 4 | 0.0% |
| Korea | 49 | 0.1% |
| Latin America | 1,687 | 2.4% |
| Mexico | 241 | 0.4% |
| Middle Africa | 13 | 0.0% |
| Morocco | 18 | 0.0% |
| Nicaragua | 53 | 0.1% |
| Northern Africa | 18 | 0.0% |
| Northern Europe | 116 | 0.2% |
| Oceania | 16 | 0.0% |
| Peru | 163 | 0.2% |
| Philippines | 164 | 0.2% |
| Romania | 40 | 0.1% |
| Russia | 4 | 0.0% |
| Scotland | 8 | 0.0% |
| South Africa | 23 | 0.0% |
| South America | 397 | 0.6% |
| South Central Asia | 105 | 0.2% |
| South Eastern Asia | 265 | 0.4% |
| Southern Europe | 23 | 0.0% |
| Spain | 18 | 0.0% |
| Thailand | 28 | 0.0% |
| Trinidad and Tobago | 19 | 0.0% |
| Vietnam | 50 | 0.1% |
| West Indies | 6 | 0.0% |
| Western Asia | 5 | 0.0% |
| Western Europe | 138 | 0.2% | View All 63 Rows |
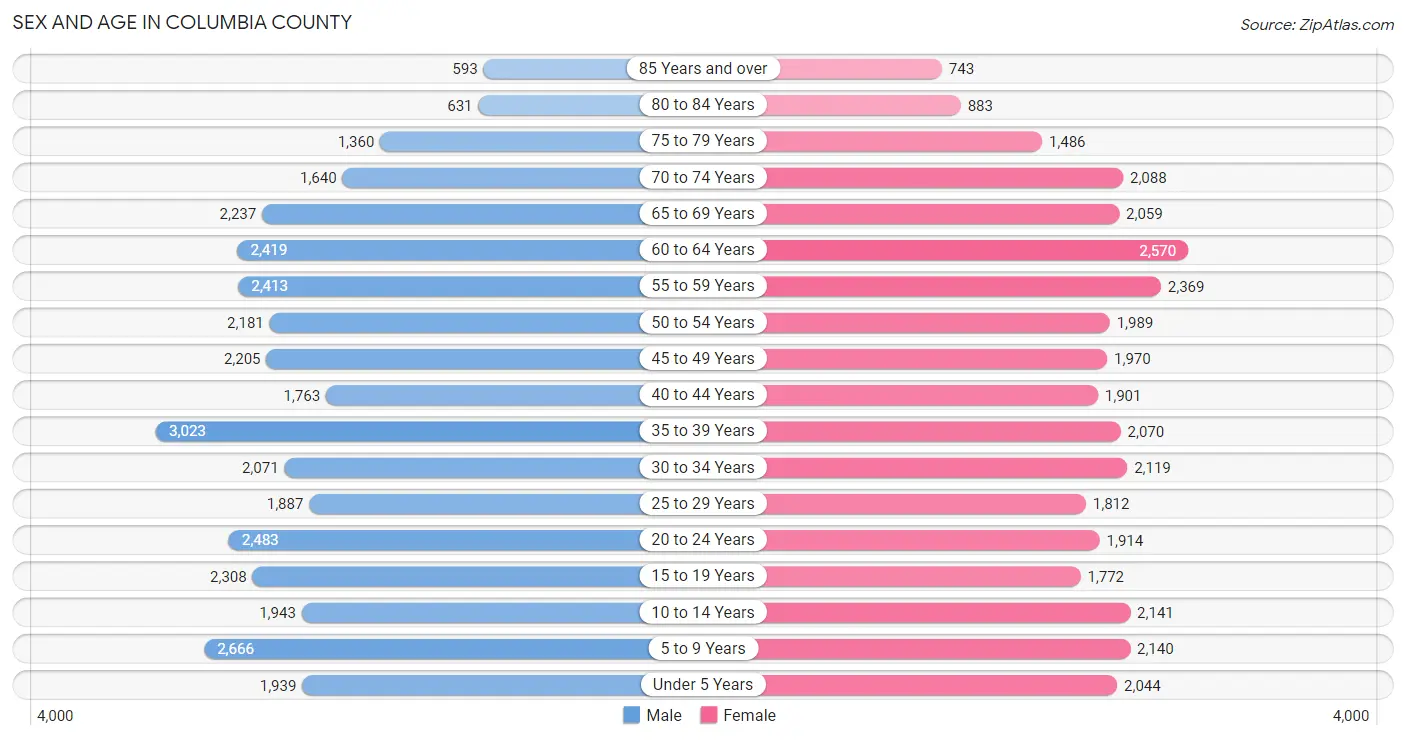
Sex and Age in Columbia County
Sex and Age in Columbia County
The most populous age groups in Columbia County are 35 to 39 Years (3,023 | 8.5%) for men and 60 to 64 Years (2,570 | 7.5%) for women.
| Age Bracket | Male | Female |
| Under 5 Years | 1,939 (5.4%) | 2,044 (6.0%) |
| 5 to 9 Years | 2,666 (7.4%) | 2,140 (6.3%) |
| 10 to 14 Years | 1,943 (5.4%) | 2,141 (6.3%) |
| 15 to 19 Years | 2,308 (6.5%) | 1,772 (5.2%) |
| 20 to 24 Years | 2,483 (6.9%) | 1,914 (5.6%) |
| 25 to 29 Years | 1,887 (5.3%) | 1,812 (5.3%) |
| 30 to 34 Years | 2,071 (5.8%) | 2,119 (6.2%) |
| 35 to 39 Years | 3,023 (8.5%) | 2,070 (6.1%) |
| 40 to 44 Years | 1,763 (4.9%) | 1,901 (5.6%) |
| 45 to 49 Years | 2,205 (6.2%) | 1,970 (5.8%) |
| 50 to 54 Years | 2,181 (6.1%) | 1,989 (5.8%) |
| 55 to 59 Years | 2,413 (6.8%) | 2,369 (7.0%) |
| 60 to 64 Years | 2,419 (6.8%) | 2,570 (7.5%) |
| 65 to 69 Years | 2,237 (6.3%) | 2,059 (6.0%) |
| 70 to 74 Years | 1,640 (4.6%) | 2,088 (6.1%) |
| 75 to 79 Years | 1,360 (3.8%) | 1,486 (4.4%) |
| 80 to 84 Years | 631 (1.8%) | 883 (2.6%) |
| 85 Years and over | 593 (1.7%) | 743 (2.2%) |
| Total | 35,762 (100.0%) | 34,070 (100.0%) |
Families and Households in Columbia County
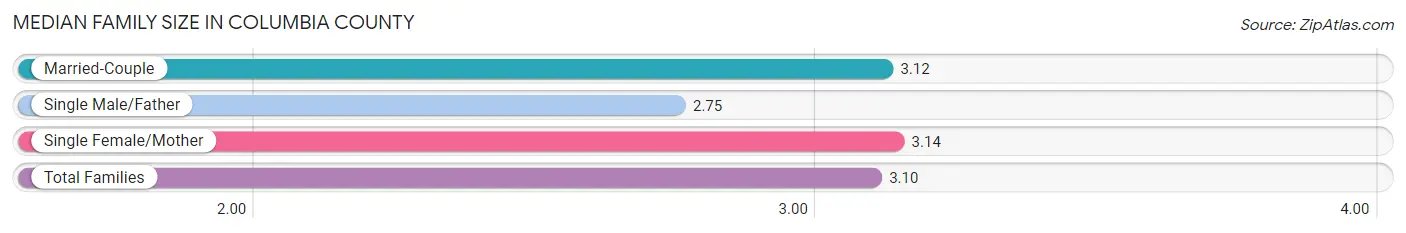
Median Family Size in Columbia County
The median family size in Columbia County is 3.10 persons per family, with single female/mother families (3,454 | 20.6%) accounting for the largest median family size of 3.14 persons per family. On the other hand, single male/father families (1,303 | 7.8%) represent the smallest median family size with 2.75 persons per family.
| Family Type | # Families | Family Size |
| Married-Couple | 11,971 (71.6%) | 3.12 |
| Single Male/Father | 1,303 (7.8%) | 2.75 |
| Single Female/Mother | 3,454 (20.6%) | 3.14 |
| Total Families | 16,728 (100.0%) | 3.10 |
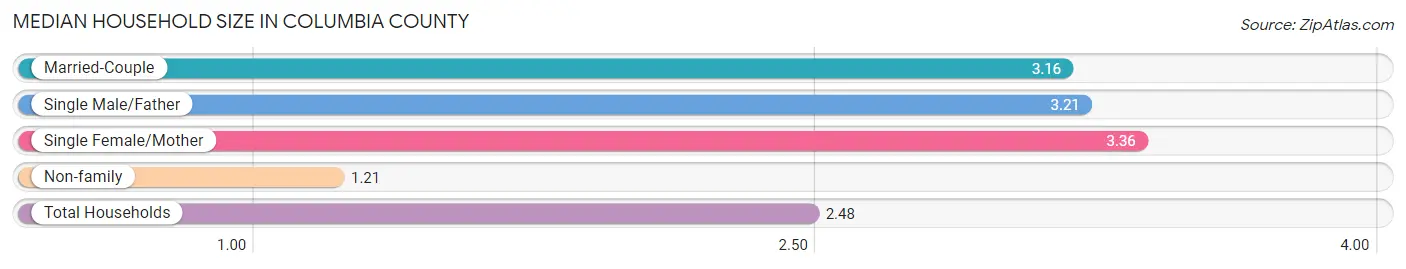
Median Household Size in Columbia County
The median household size in Columbia County is 2.48 persons per household, with single female/mother households (3,454 | 13.1%) accounting for the largest median household size of 3.36 persons per household. non-family households (9,663 | 36.6%) represent the smallest median household size with 1.21 persons per household.
| Household Type | # Households | Household Size |
| Married-Couple | 11,971 (45.4%) | 3.16 |
| Single Male/Father | 1,303 (4.9%) | 3.21 |
| Single Female/Mother | 3,454 (13.1%) | 3.36 |
| Non-family | 9,663 (36.6%) | 1.21 |
| Total Households | 26,391 (100.0%) | 2.48 |
Household Size by Marriage Status in Columbia County
Out of a total of 26,391 households in Columbia County, 16,728 (63.4%) are family households, while 9,663 (36.6%) are nonfamily households. The most numerous type of family households are 2-person households, comprising 7,526, and the most common type of nonfamily households are 1-person households, comprising 7,758.
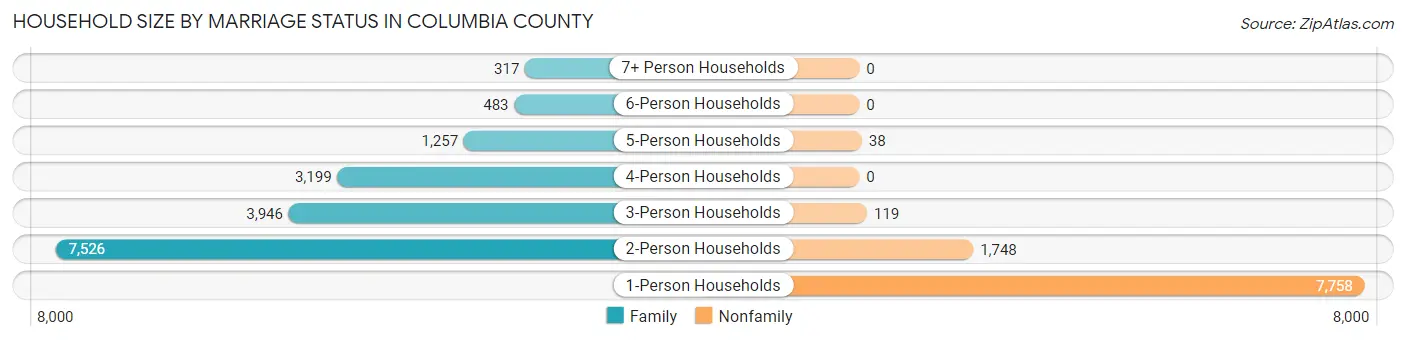
| Household Size | Family Households | Nonfamily Households |
| 1-Person Households | - | 7,758 (29.4%) |
| 2-Person Households | 7,526 (28.5%) | 1,748 (6.6%) |
| 3-Person Households | 3,946 (14.9%) | 119 (0.4%) |
| 4-Person Households | 3,199 (12.1%) | 0 (0.0%) |
| 5-Person Households | 1,257 (4.8%) | 38 (0.1%) |
| 6-Person Households | 483 (1.8%) | 0 (0.0%) |
| 7+ Person Households | 317 (1.2%) | 0 (0.0%) |
| Total | 16,728 (63.4%) | 9,663 (36.6%) |
Female Fertility in Columbia County
Fertility by Age in Columbia County
Average fertility rate in Columbia County is 46.0 births per 1,000 women. Women in the age bracket of 20 to 34 years have the highest fertility rate with 104.0 births per 1,000 women. Women in the age bracket of 20 to 34 years acount for 94.9% of all women with births.
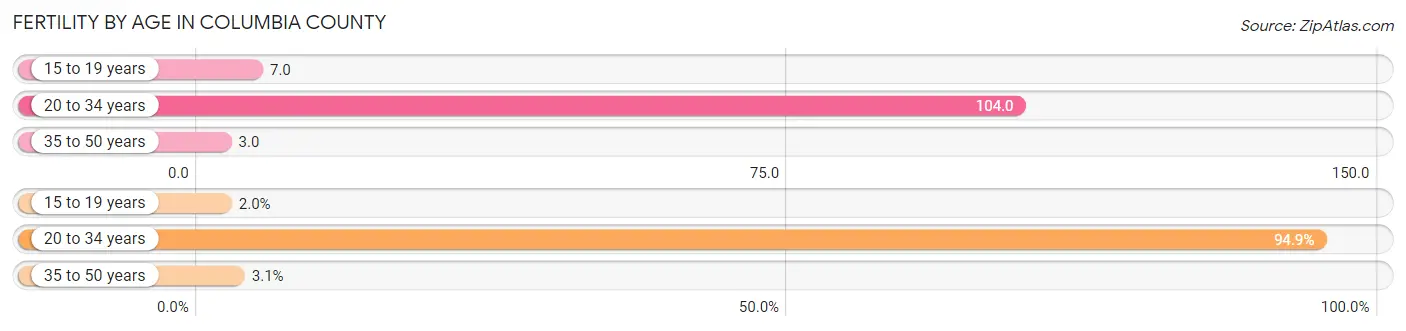
| Age Bracket | Women with Births | Births / 1,000 Women |
| 15 to 19 years | 13 (2.0%) | 7.0 |
| 20 to 34 years | 609 (94.9%) | 104.0 |
| 35 to 50 years | 20 (3.1%) | 3.0 |
| Total | 642 (100.0%) | 46.0 |
Fertility by Age by Marriage Status in Columbia County
55.6% of women with births (642) in Columbia County are married. The highest percentage of unmarried women with births falls into 15 to 19 years age bracket with 100.0% of them unmarried at the time of birth, while the lowest percentage of unmarried women with births belong to 35 to 50 years age bracket with 0.0% of them unmarried.
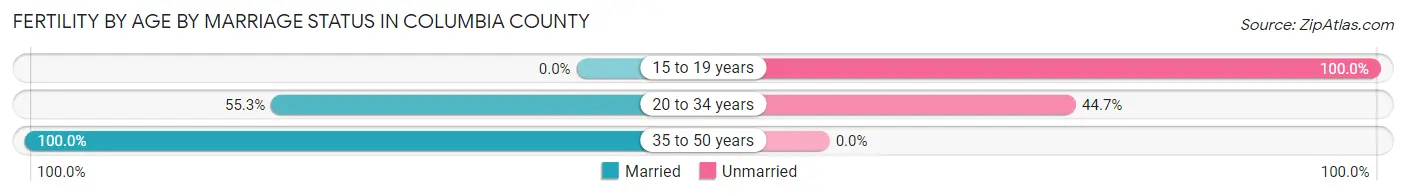
| Age Bracket | Married | Unmarried |
| 15 to 19 years | 0 (0.0%) | 13 (100.0%) |
| 20 to 34 years | 337 (55.3%) | 272 (44.7%) |
| 35 to 50 years | 20 (100.0%) | 0 (0.0%) |
| Total | 357 (55.6%) | 285 (44.4%) |
Fertility by Education in Columbia County
Average fertility rate in Columbia County is 46.0 births per 1,000 women. Women with the education attainment of high school diploma have the highest fertility rate of 82.0 births per 1,000 women, while women with the education attainment of graduate degree have the lowest fertility at 12.0 births per 1,000 women. Women with the education attainment of high school diploma represent 41.3% of all women with births.
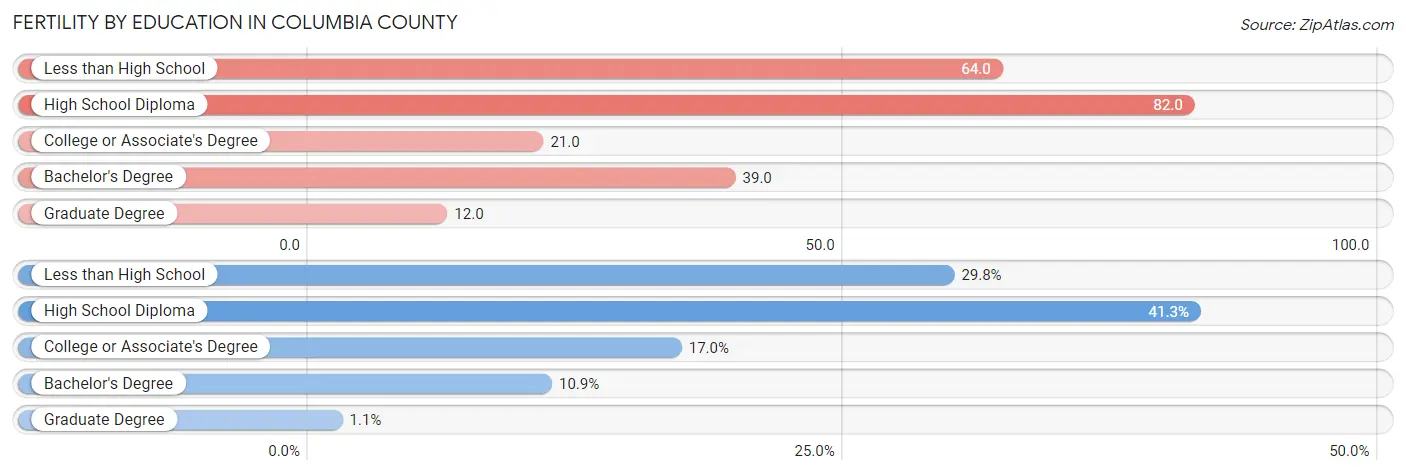
| Educational Attainment | Women with Births | Births / 1,000 Women |
| Less than High School | 191 (29.7%) | 64.0 |
| High School Diploma | 265 (41.3%) | 82.0 |
| College or Associate's Degree | 109 (17.0%) | 21.0 |
| Bachelor's Degree | 70 (10.9%) | 39.0 |
| Graduate Degree | 7 (1.1%) | 12.0 |
| Total | 642 (100.0%) | 46.0 |
Fertility by Education by Marriage Status in Columbia County
44.4% of women with births in Columbia County are unmarried. Women with the educational attainment of bachelor's degree are most likely to be married with 100.0% of them married at childbirth, while women with the educational attainment of less than high school are least likely to be married with 62.8% of them unmarried at childbirth.
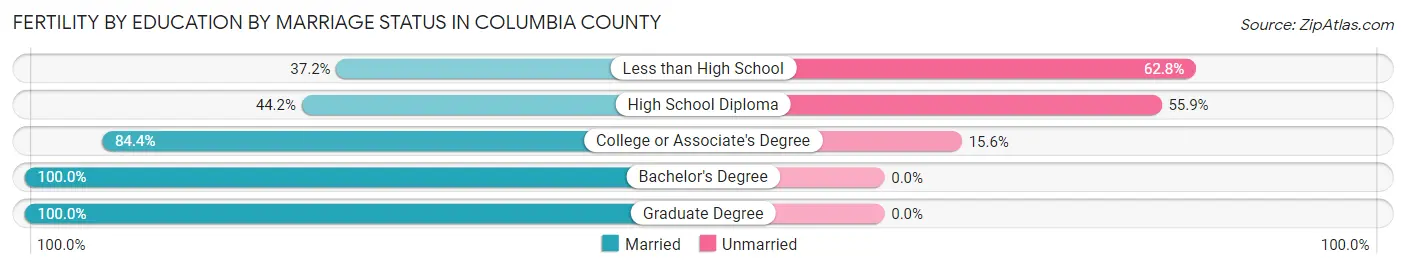
| Educational Attainment | Married | Unmarried |
| Less than High School | 71 (37.2%) | 120 (62.8%) |
| High School Diploma | 117 (44.2%) | 148 (55.8%) |
| College or Associate's Degree | 92 (84.4%) | 17 (15.6%) |
| Bachelor's Degree | 70 (100.0%) | 0 (0.0%) |
| Graduate Degree | 7 (100.0%) | 0 (0.0%) |
| Total | 357 (55.6%) | 285 (44.4%) |
Employment Characteristics in Columbia County
Employment by Class of Employer in Columbia County
Among the 26,940 employed individuals in Columbia County, private company employees (16,675 | 61.9%), state government employees (2,622 | 9.7%), and not-for-profit organizations (1,777 | 6.6%) make up the most common classes of employment.
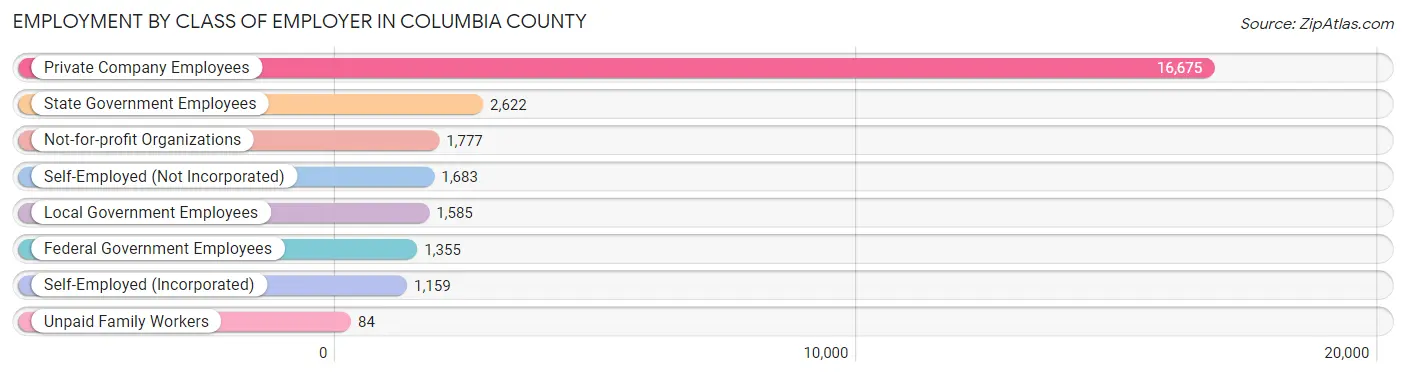
| Employer Class | # Employees | % Employees |
| Private Company Employees | 16,675 | 61.9% |
| Self-Employed (Incorporated) | 1,159 | 4.3% |
| Self-Employed (Not Incorporated) | 1,683 | 6.2% |
| Not-for-profit Organizations | 1,777 | 6.6% |
| Local Government Employees | 1,585 | 5.9% |
| State Government Employees | 2,622 | 9.7% |
| Federal Government Employees | 1,355 | 5.0% |
| Unpaid Family Workers | 84 | 0.3% |
| Total | 26,940 | 100.0% |
Employment Status by Age in Columbia County
According to the labor force statistics for Columbia County, out of the total population over 16 years of age (56,109), 52.8% or 29,626 individuals are in the labor force, with 6.9% or 2,044 of them unemployed. The age group with the highest labor force participation rate is 25 to 29 years, with 83.9% or 3,103 individuals in the labor force. Within the labor force, the 16 to 19 years age range has the highest percentage of unemployed individuals, with 23.7% or 356 of them being unemployed.
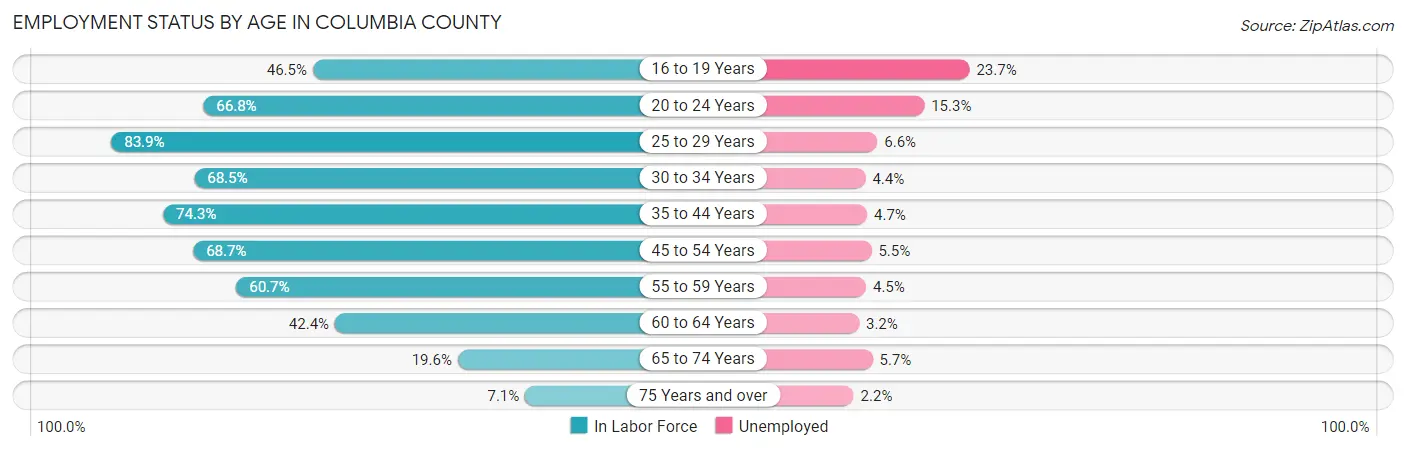
| Age Bracket | In Labor Force | Unemployed |
| 16 to 19 Years | 1,502 (46.5%) | 356 (23.7%) |
| 20 to 24 Years | 2,937 (66.8%) | 449 (15.3%) |
| 25 to 29 Years | 3,103 (83.9%) | 205 (6.6%) |
| 30 to 34 Years | 2,870 (68.5%) | 126 (4.4%) |
| 35 to 44 Years | 6,506 (74.3%) | 306 (4.7%) |
| 45 to 54 Years | 5,733 (68.7%) | 315 (5.5%) |
| 55 to 59 Years | 2,903 (60.7%) | 131 (4.5%) |
| 60 to 64 Years | 2,115 (42.4%) | 68 (3.2%) |
| 65 to 74 Years | 1,573 (19.6%) | 90 (5.7%) |
| 75 Years and over | 404 (7.1%) | 9 (2.2%) |
| Total | 29,626 (52.8%) | 2,044 (6.9%) |
Employment Status by Educational Attainment in Columbia County
According to labor force statistics for Columbia County, 66.8% of individuals (23,221) out of the total population between 25 and 64 years of age (34,762) are in the labor force, with 5.0% or 1,161 of them being unemployed. The group with the highest labor force participation rate are those with the educational attainment of bachelor's degree or higher, with 81.9% or 4,422 individuals in the labor force. Within the labor force, individuals with less than high school education have the highest percentage of unemployment, with 6.7% or 136 of them being unemployed.
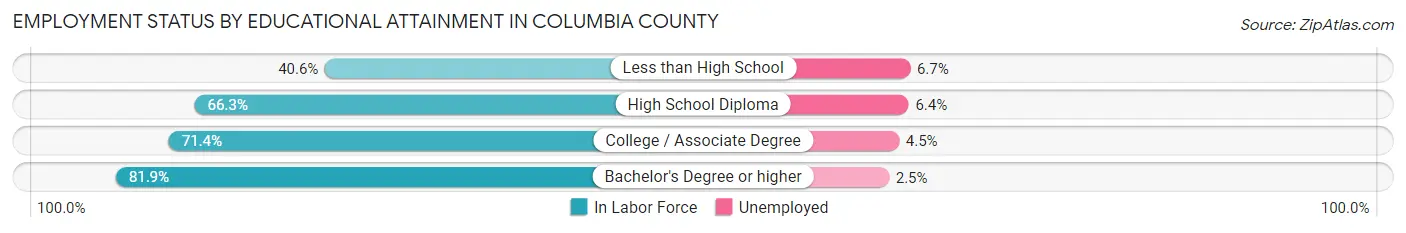
| Educational Attainment | In Labor Force | Unemployed |
| Less than High School | 2,026 (40.6%) | 334 (6.7%) |
| High School Diploma | 8,281 (66.3%) | 799 (6.4%) |
| College / Associate Degree | 8,485 (71.4%) | 535 (4.5%) |
| Bachelor's Degree or higher | 4,422 (81.9%) | 135 (2.5%) |
| Total | 23,221 (66.8%) | 1,738 (5.0%) |
Employment Occupations by Sex in Columbia County
Management, Business, Science and Arts Occupations
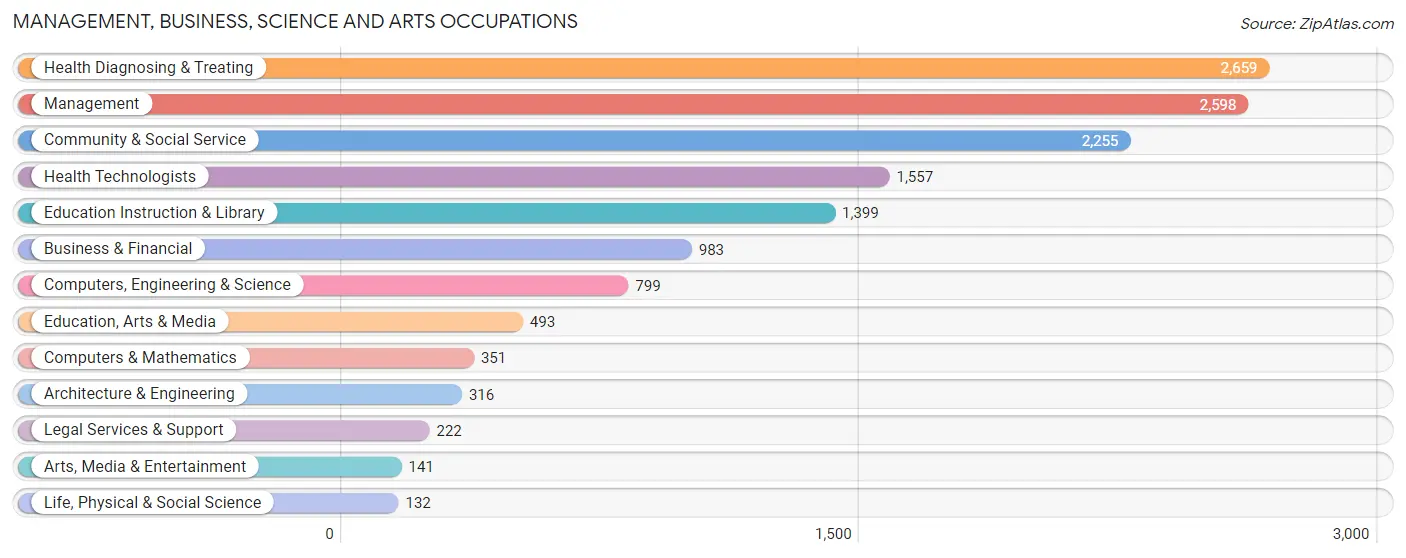
The most common Management, Business, Science and Arts occupations in Columbia County are Health Diagnosing & Treating (2,659 | 9.7%), Management (2,598 | 9.5%), Community & Social Service (2,255 | 8.2%), Health Technologists (1,557 | 5.7%), and Education Instruction & Library (1,399 | 5.1%).
Management, Business, Science and Arts Occupations by Sex
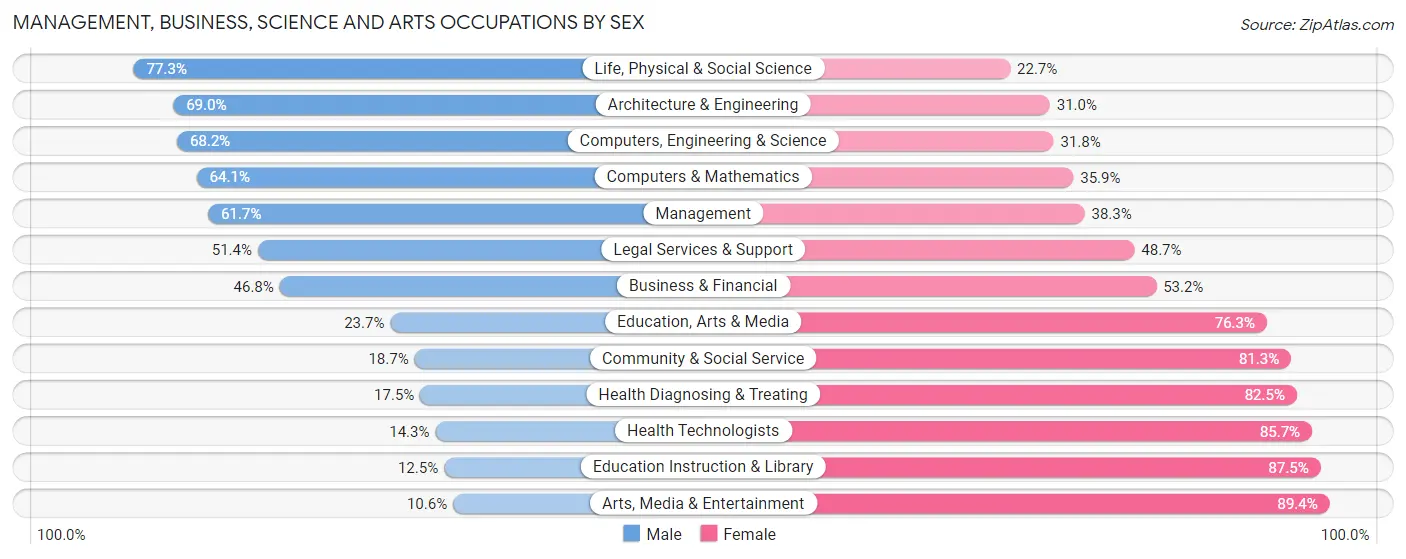
Within the Management, Business, Science and Arts occupations in Columbia County, the most male-oriented occupations are Life, Physical & Social Science (77.3%), Architecture & Engineering (69.0%), and Computers, Engineering & Science (68.2%), while the most female-oriented occupations are Arts, Media & Entertainment (89.4%), Education Instruction & Library (87.5%), and Health Technologists (85.7%).
| Occupation | Male | Female |
| Management | 1,604 (61.7%) | 994 (38.3%) |
| Business & Financial | 460 (46.8%) | 523 (53.2%) |
| Computers, Engineering & Science | 545 (68.2%) | 254 (31.8%) |
| Computers & Mathematics | 225 (64.1%) | 126 (35.9%) |
| Architecture & Engineering | 218 (69.0%) | 98 (31.0%) |
| Life, Physical & Social Science | 102 (77.3%) | 30 (22.7%) |
| Community & Social Service | 421 (18.7%) | 1,834 (81.3%) |
| Education, Arts & Media | 117 (23.7%) | 376 (76.3%) |
| Legal Services & Support | 114 (51.3%) | 108 (48.6%) |
| Education Instruction & Library | 175 (12.5%) | 1,224 (87.5%) |
| Arts, Media & Entertainment | 15 (10.6%) | 126 (89.4%) |
| Health Diagnosing & Treating | 465 (17.5%) | 2,194 (82.5%) |
| Health Technologists | 223 (14.3%) | 1,334 (85.7%) |
| Total (Category) | 3,495 (37.6%) | 5,799 (62.4%) |
| Total (Overall) | 13,864 (50.5%) | 13,586 (49.5%) |
Services Occupations
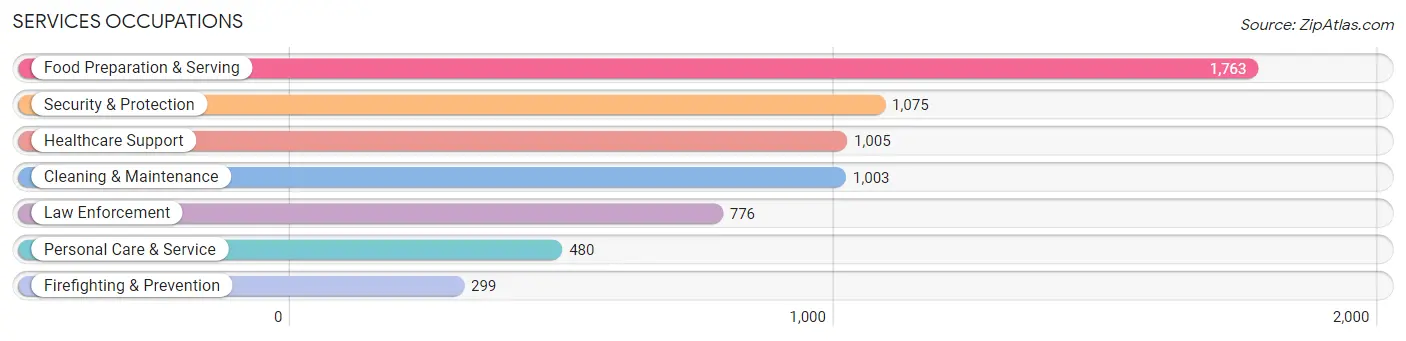
The most common Services occupations in Columbia County are Food Preparation & Serving (1,763 | 6.4%), Security & Protection (1,075 | 3.9%), Healthcare Support (1,005 | 3.7%), Cleaning & Maintenance (1,003 | 3.6%), and Law Enforcement (776 | 2.8%).
Services Occupations by Sex
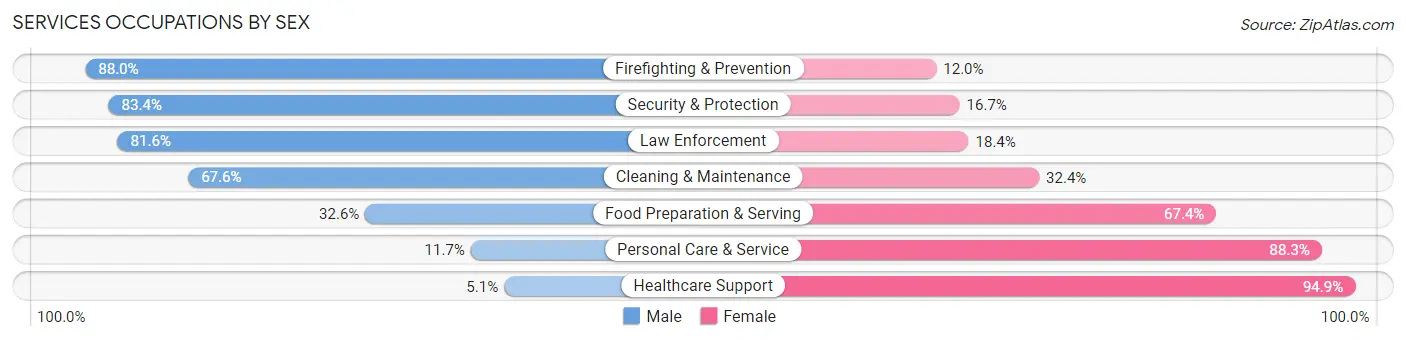
Within the Services occupations in Columbia County, the most male-oriented occupations are Firefighting & Prevention (88.0%), Security & Protection (83.4%), and Law Enforcement (81.6%), while the most female-oriented occupations are Healthcare Support (94.9%), Personal Care & Service (88.3%), and Food Preparation & Serving (67.4%).
| Occupation | Male | Female |
| Healthcare Support | 51 (5.1%) | 954 (94.9%) |
| Security & Protection | 896 (83.4%) | 179 (16.7%) |
| Firefighting & Prevention | 263 (88.0%) | 36 (12.0%) |
| Law Enforcement | 633 (81.6%) | 143 (18.4%) |
| Food Preparation & Serving | 574 (32.6%) | 1,189 (67.4%) |
| Cleaning & Maintenance | 678 (67.6%) | 325 (32.4%) |
| Personal Care & Service | 56 (11.7%) | 424 (88.3%) |
| Total (Category) | 2,255 (42.3%) | 3,071 (57.7%) |
| Total (Overall) | 13,864 (50.5%) | 13,586 (49.5%) |
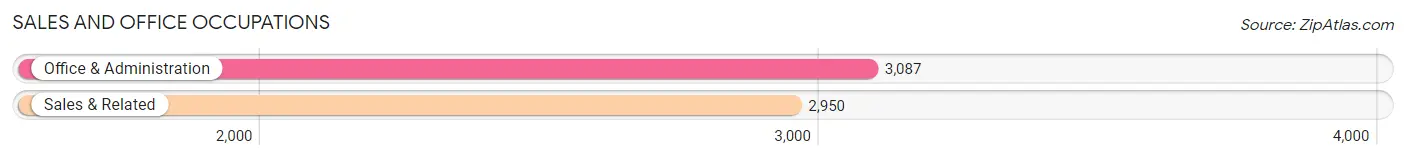
Sales and Office Occupations
The most common Sales and Office occupations in Columbia County are Office & Administration (3,087 | 11.3%), and Sales & Related (2,950 | 10.7%).
Sales and Office Occupations by Sex
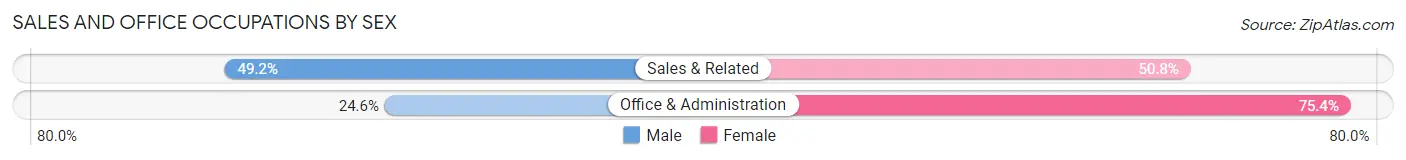
| Occupation | Male | Female |
| Sales & Related | 1,452 (49.2%) | 1,498 (50.8%) |
| Office & Administration | 759 (24.6%) | 2,328 (75.4%) |
| Total (Category) | 2,211 (36.6%) | 3,826 (63.4%) |
| Total (Overall) | 13,864 (50.5%) | 13,586 (49.5%) |
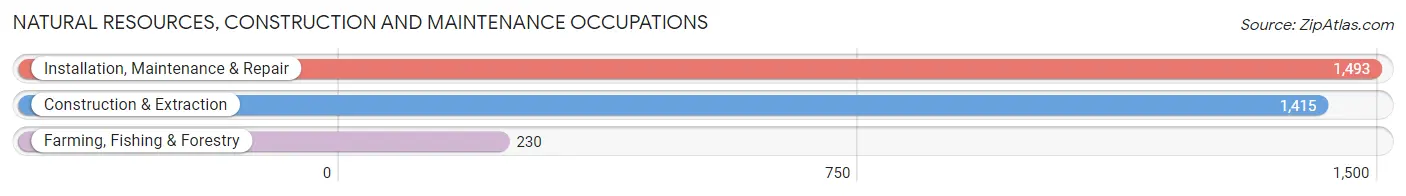
Natural Resources, Construction and Maintenance Occupations
The most common Natural Resources, Construction and Maintenance occupations in Columbia County are Installation, Maintenance & Repair (1,493 | 5.4%), Construction & Extraction (1,415 | 5.1%), and Farming, Fishing & Forestry (230 | 0.8%).
Natural Resources, Construction and Maintenance Occupations by Sex
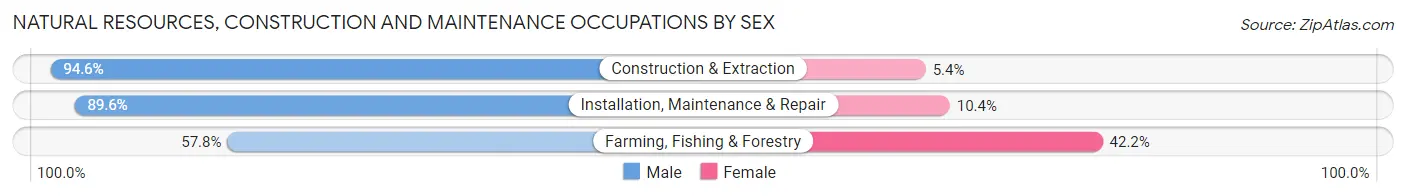
| Occupation | Male | Female |
| Farming, Fishing & Forestry | 133 (57.8%) | 97 (42.2%) |
| Construction & Extraction | 1,339 (94.6%) | 76 (5.4%) |
| Installation, Maintenance & Repair | 1,338 (89.6%) | 155 (10.4%) |
| Total (Category) | 2,810 (89.5%) | 328 (10.4%) |
| Total (Overall) | 13,864 (50.5%) | 13,586 (49.5%) |
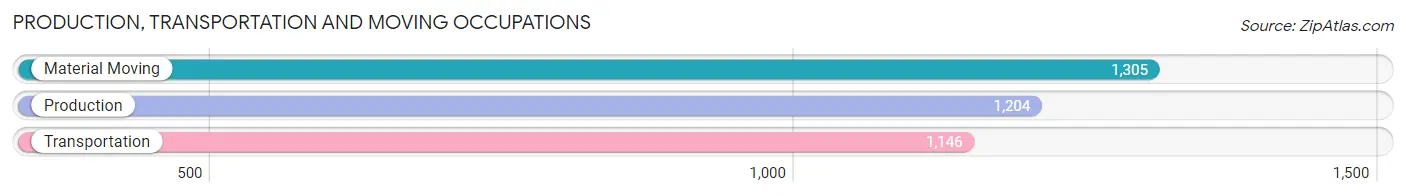
Production, Transportation and Moving Occupations
The most common Production, Transportation and Moving occupations in Columbia County are Material Moving (1,305 | 4.8%), Production (1,204 | 4.4%), and Transportation (1,146 | 4.2%).
Production, Transportation and Moving Occupations by Sex
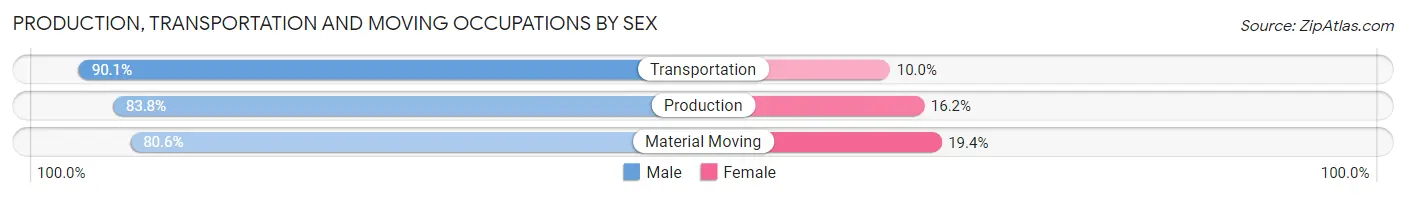
| Occupation | Male | Female |
| Production | 1,009 (83.8%) | 195 (16.2%) |
| Transportation | 1,032 (90.0%) | 114 (10.0%) |
| Material Moving | 1,052 (80.6%) | 253 (19.4%) |
| Total (Category) | 3,093 (84.6%) | 562 (15.4%) |
| Total (Overall) | 13,864 (50.5%) | 13,586 (49.5%) |
Employment Industries by Sex in Columbia County
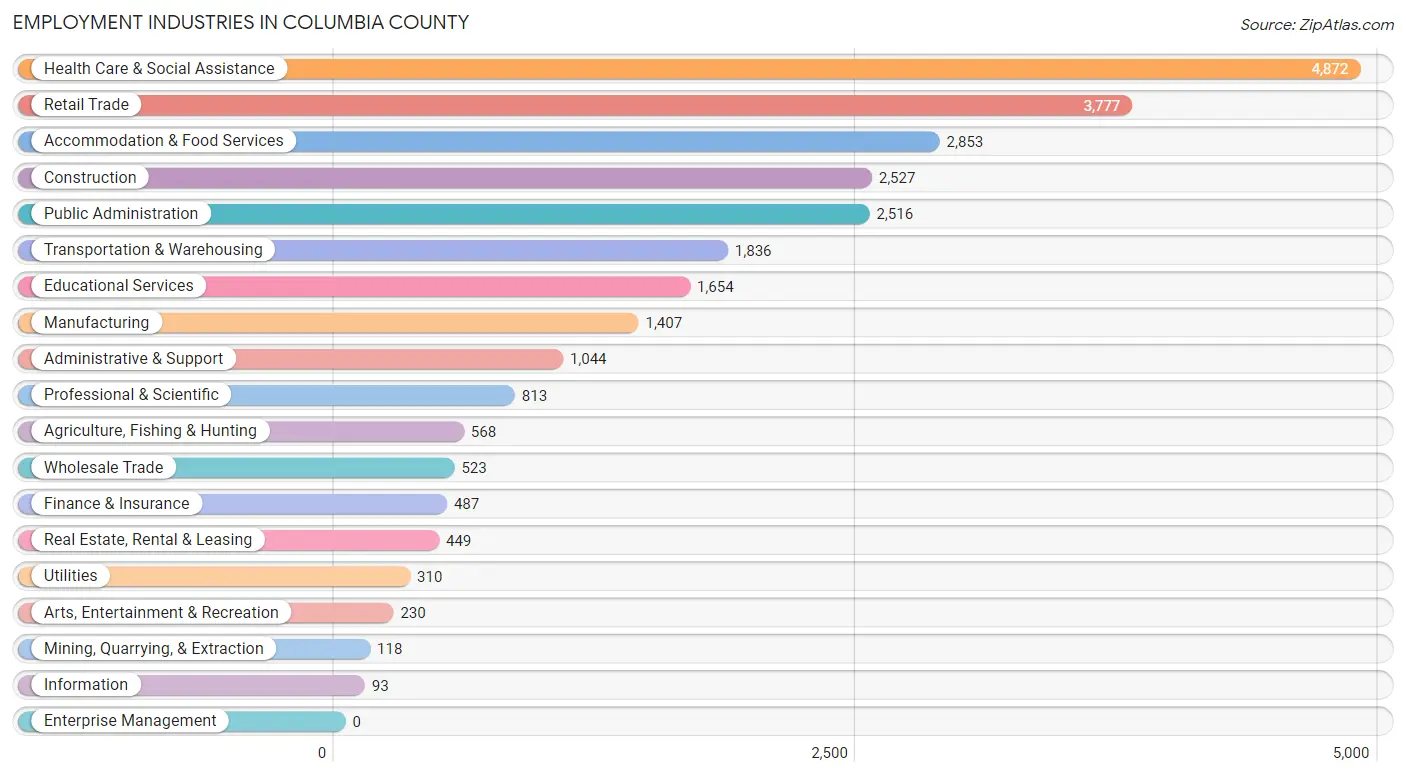
Employment Industries in Columbia County
The major employment industries in Columbia County include Health Care & Social Assistance (4,872 | 17.7%), Retail Trade (3,777 | 13.8%), Accommodation & Food Services (2,853 | 10.4%), Construction (2,527 | 9.2%), and Public Administration (2,516 | 9.2%).
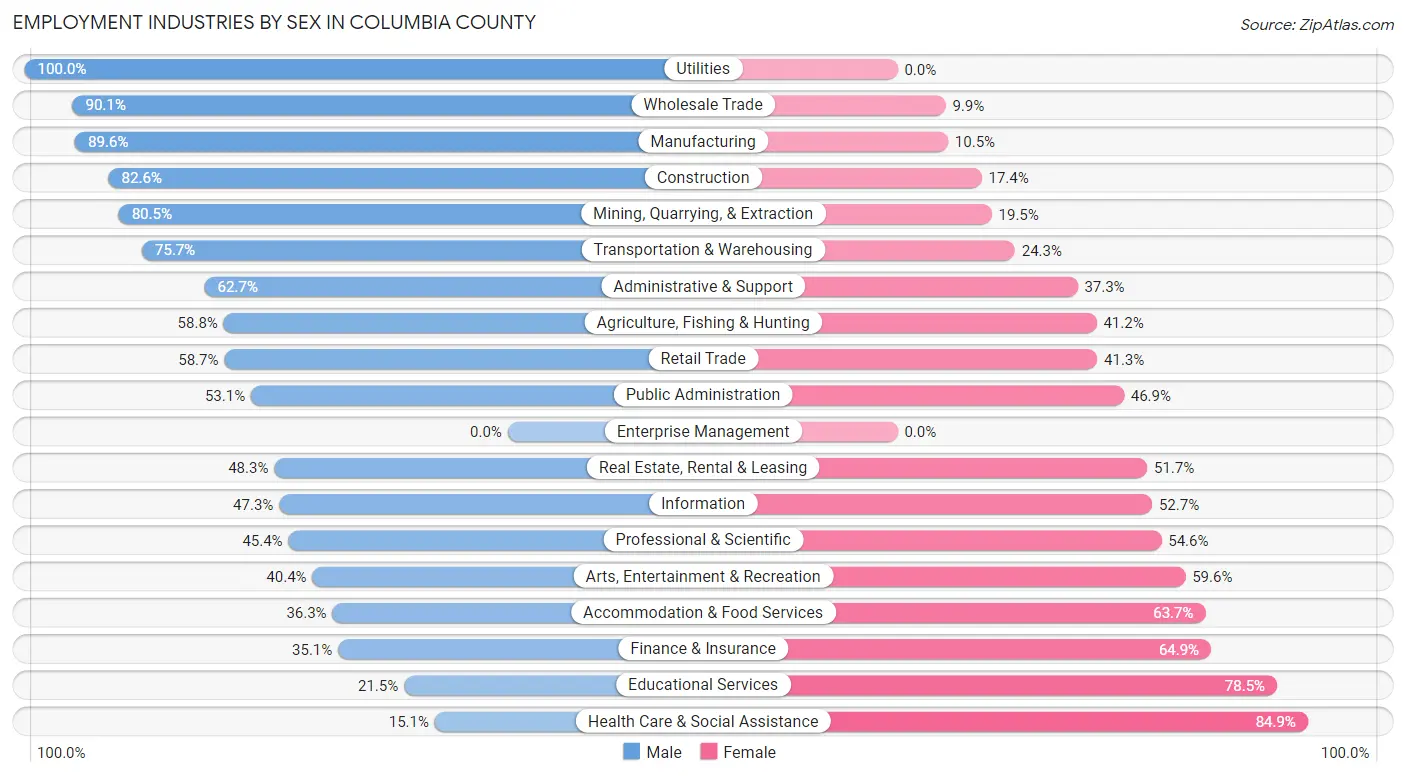
Employment Industries by Sex in Columbia County
The Columbia County industries that see more men than women are Utilities (100.0%), Wholesale Trade (90.1%), and Manufacturing (89.5%), whereas the industries that tend to have a higher number of women are Health Care & Social Assistance (84.9%), Educational Services (78.5%), and Finance & Insurance (64.9%).
| Industry | Male | Female |
| Agriculture, Fishing & Hunting | 334 (58.8%) | 234 (41.2%) |
| Mining, Quarrying, & Extraction | 95 (80.5%) | 23 (19.5%) |
| Construction | 2,087 (82.6%) | 440 (17.4%) |
| Manufacturing | 1,260 (89.5%) | 147 (10.4%) |
| Wholesale Trade | 471 (90.1%) | 52 (9.9%) |
| Retail Trade | 2,216 (58.7%) | 1,561 (41.3%) |
| Transportation & Warehousing | 1,390 (75.7%) | 446 (24.3%) |
| Utilities | 310 (100.0%) | 0 (0.0%) |
| Information | 44 (47.3%) | 49 (52.7%) |
| Finance & Insurance | 171 (35.1%) | 316 (64.9%) |
| Real Estate, Rental & Leasing | 217 (48.3%) | 232 (51.7%) |
| Professional & Scientific | 369 (45.4%) | 444 (54.6%) |
| Enterprise Management | 0 (0.0%) | 0 (0.0%) |
| Administrative & Support | 655 (62.7%) | 389 (37.3%) |
| Educational Services | 355 (21.5%) | 1,299 (78.5%) |
| Health Care & Social Assistance | 735 (15.1%) | 4,137 (84.9%) |
| Arts, Entertainment & Recreation | 93 (40.4%) | 137 (59.6%) |
| Accommodation & Food Services | 1,035 (36.3%) | 1,818 (63.7%) |
| Public Administration | 1,337 (53.1%) | 1,179 (46.9%) |
| Total | 13,864 (50.5%) | 13,586 (49.5%) |
Education in Columbia County
School Enrollment in Columbia County
The most common levels of schooling among the 14,906 students in Columbia County are high school (3,580 | 24.0%), elementary school (3,566 | 23.9%), and middle school (3,276 | 22.0%).
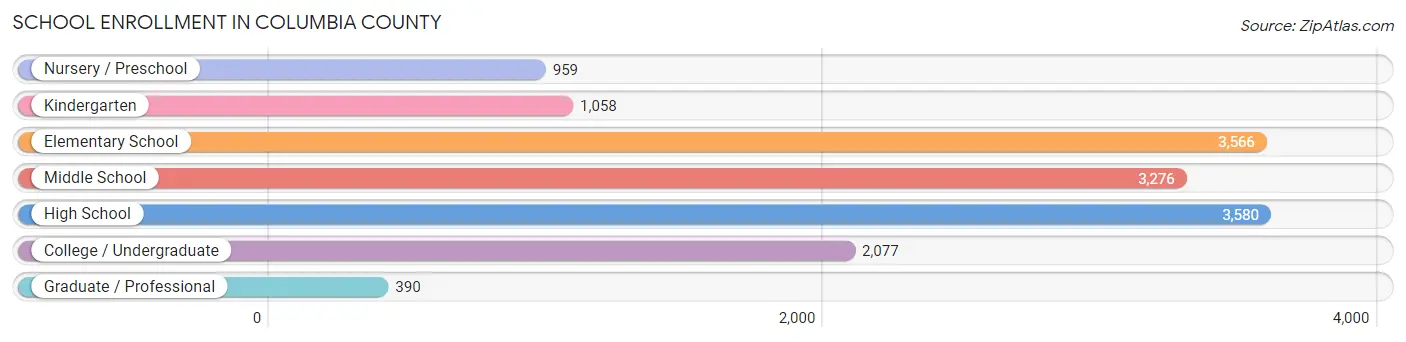
| School Level | # Students | % Students |
| Nursery / Preschool | 959 | 6.4% |
| Kindergarten | 1,058 | 7.1% |
| Elementary School | 3,566 | 23.9% |
| Middle School | 3,276 | 22.0% |
| High School | 3,580 | 24.0% |
| College / Undergraduate | 2,077 | 13.9% |
| Graduate / Professional | 390 | 2.6% |
| Total | 14,906 | 100.0% |
School Enrollment by Age by Funding Source in Columbia County
Out of a total of 14,906 students who are enrolled in schools in Columbia County, 2,623 (17.6%) attend a private institution, while the remaining 12,283 (82.4%) are enrolled in public schools. The age group of 3 to 4 year olds has the highest likelihood of being enrolled in private schools, with 192 (25.0% in the age bracket) enrolled. Conversely, the age group of 20 to 24 year olds has the lowest likelihood of being enrolled in a private school, with 1,187 (94.8% in the age bracket) attending a public institution.
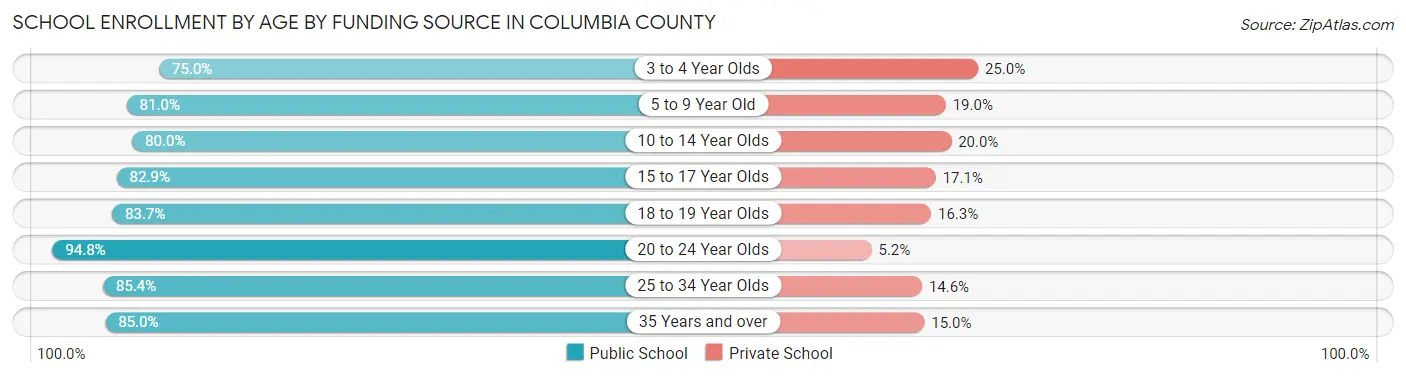
| Age Bracket | Public School | Private School |
| 3 to 4 Year Olds | 575 (75.0%) | 192 (25.0%) |
| 5 to 9 Year Old | 3,635 (81.0%) | 853 (19.0%) |
| 10 to 14 Year Olds | 3,039 (80.0%) | 761 (20.0%) |
| 15 to 17 Year Olds | 1,996 (82.9%) | 413 (17.1%) |
| 18 to 19 Year Olds | 571 (83.7%) | 111 (16.3%) |
| 20 to 24 Year Olds | 1,187 (94.8%) | 65 (5.2%) |
| 25 to 34 Year Olds | 492 (85.4%) | 84 (14.6%) |
| 35 Years and over | 792 (85.0%) | 140 (15.0%) |
| Total | 12,283 (82.4%) | 2,623 (17.6%) |
Educational Attainment by Field of Study in Columbia County
Science & technology (1,668 | 20.2%), business (1,370 | 16.6%), education (1,259 | 15.3%), arts & humanities (629 | 7.6%), and bio, nature & agricultural (610 | 7.4%) are the most common fields of study among 8,248 individuals in Columbia County who have obtained a bachelor's degree or higher.
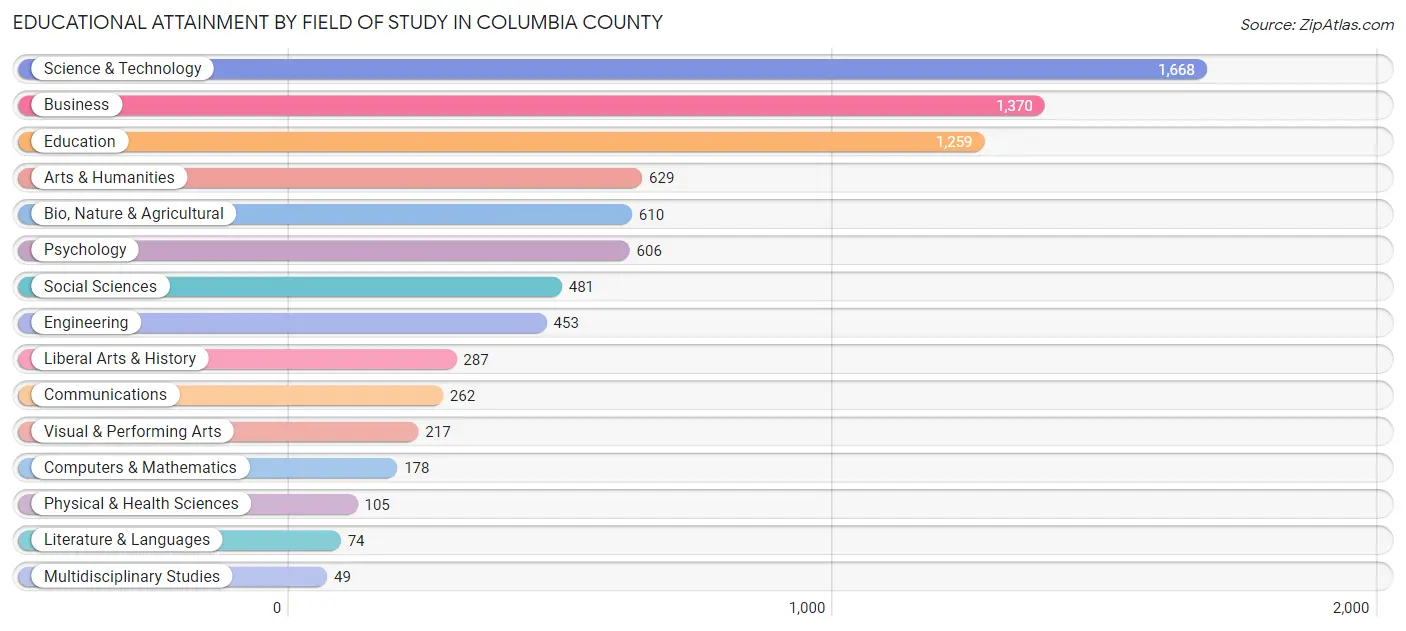
| Field of Study | # Graduates | % Graduates |
| Computers & Mathematics | 178 | 2.2% |
| Bio, Nature & Agricultural | 610 | 7.4% |
| Physical & Health Sciences | 105 | 1.3% |
| Psychology | 606 | 7.3% |
| Social Sciences | 481 | 5.8% |
| Engineering | 453 | 5.5% |
| Multidisciplinary Studies | 49 | 0.6% |
| Science & Technology | 1,668 | 20.2% |
| Business | 1,370 | 16.6% |
| Education | 1,259 | 15.3% |
| Literature & Languages | 74 | 0.9% |
| Liberal Arts & History | 287 | 3.5% |
| Visual & Performing Arts | 217 | 2.6% |
| Communications | 262 | 3.2% |
| Arts & Humanities | 629 | 7.6% |
| Total | 8,248 | 100.0% |
Transportation & Commute in Columbia County
Vehicle Availability by Sex in Columbia County
The most prevalent vehicle ownership categories in Columbia County are males with 2 vehicles (5,400, accounting for 39.6%) and females with 2 vehicles (4,772, making up 40.7%).
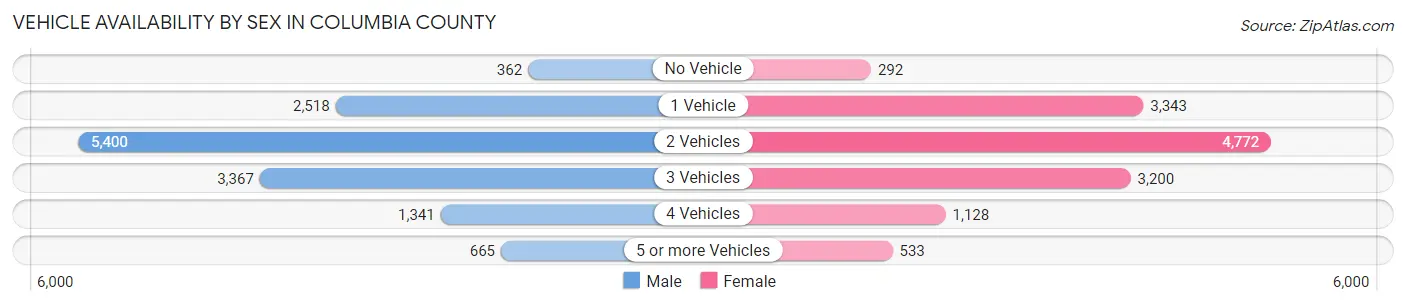
| Vehicles Available | Male | Female |
| No Vehicle | 362 (2.6%) | 292 (2.2%) |
| 1 Vehicle | 2,518 (18.4%) | 3,343 (25.2%) |
| 2 Vehicles | 5,400 (39.6%) | 4,772 (36.0%) |
| 3 Vehicles | 3,367 (24.7%) | 3,200 (24.1%) |
| 4 Vehicles | 1,341 (9.8%) | 1,128 (8.5%) |
| 5 or more Vehicles | 665 (4.9%) | 533 (4.0%) |
| Total | 13,653 (100.0%) | 13,268 (100.0%) |
Commute Time in Columbia County
The most frequently occuring commute durations in Columbia County are 15 to 19 minutes (5,422 commuters, 21.5%), 10 to 14 minutes (4,137 commuters, 16.4%), and 20 to 24 minutes (3,015 commuters, 11.9%).
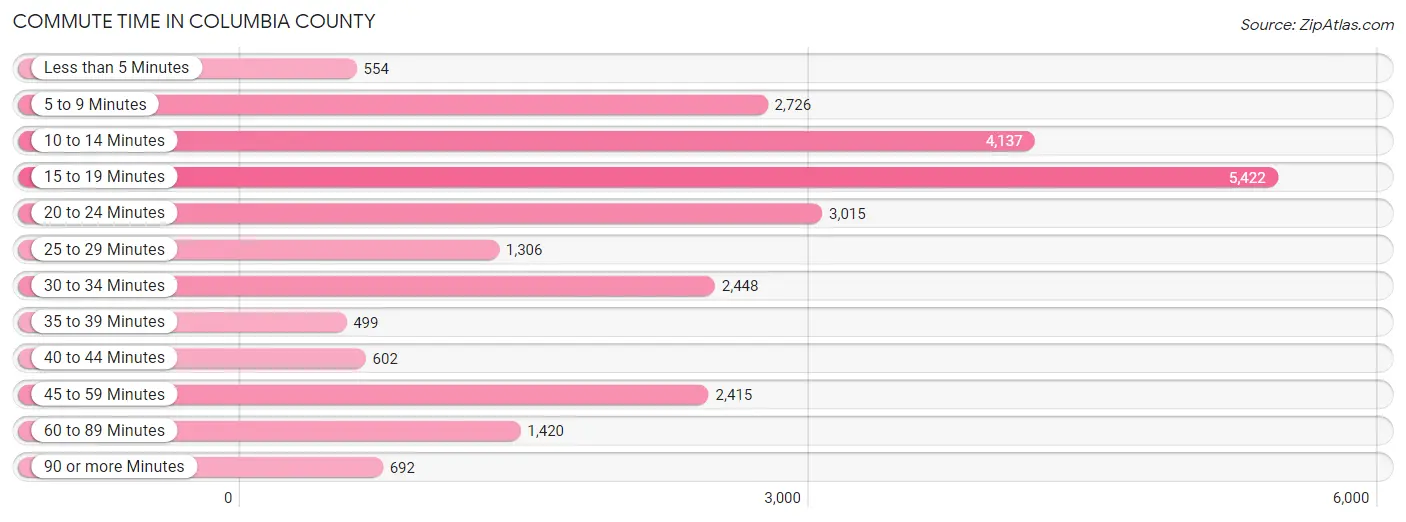
| Commute Time | # Commuters | % Commuters |
| Less than 5 Minutes | 554 | 2.2% |
| 5 to 9 Minutes | 2,726 | 10.8% |
| 10 to 14 Minutes | 4,137 | 16.4% |
| 15 to 19 Minutes | 5,422 | 21.5% |
| 20 to 24 Minutes | 3,015 | 11.9% |
| 25 to 29 Minutes | 1,306 | 5.2% |
| 30 to 34 Minutes | 2,448 | 9.7% |
| 35 to 39 Minutes | 499 | 2.0% |
| 40 to 44 Minutes | 602 | 2.4% |
| 45 to 59 Minutes | 2,415 | 9.6% |
| 60 to 89 Minutes | 1,420 | 5.6% |
| 90 or more Minutes | 692 | 2.7% |
Commute Time by Sex in Columbia County
The most common commute times in Columbia County are 15 to 19 minutes (3,082 commuters, 24.1%) for males and 15 to 19 minutes (2,340 commuters, 18.8%) for females.
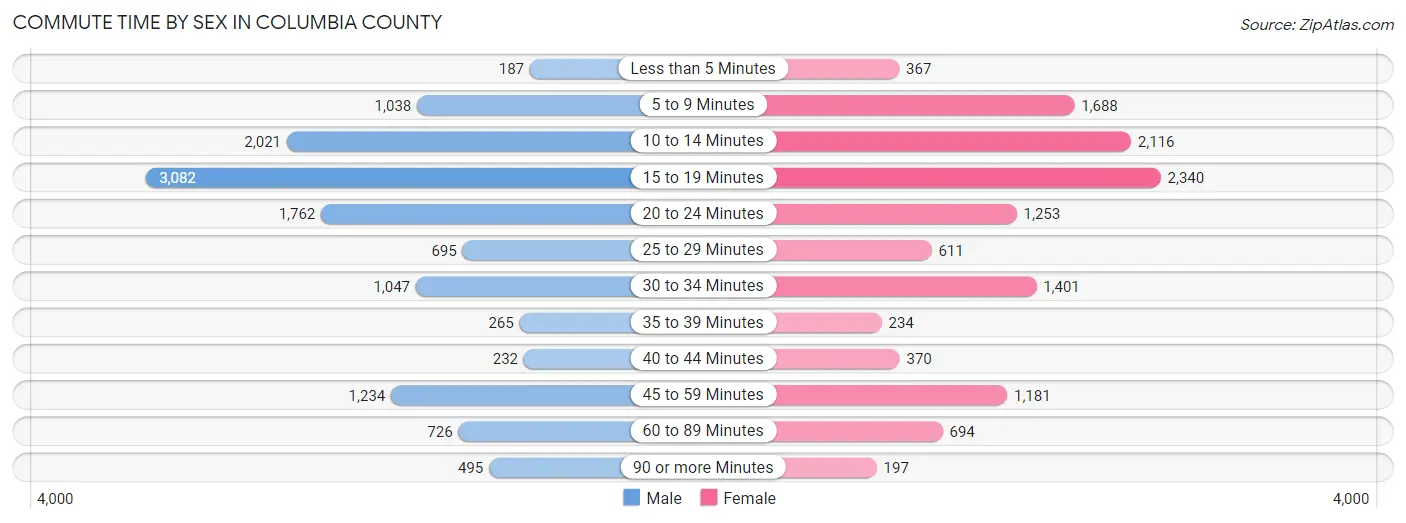
| Commute Time | Male | Female |
| Less than 5 Minutes | 187 (1.5%) | 367 (2.9%) |
| 5 to 9 Minutes | 1,038 (8.1%) | 1,688 (13.6%) |
| 10 to 14 Minutes | 2,021 (15.8%) | 2,116 (17.0%) |
| 15 to 19 Minutes | 3,082 (24.1%) | 2,340 (18.8%) |
| 20 to 24 Minutes | 1,762 (13.8%) | 1,253 (10.1%) |
| 25 to 29 Minutes | 695 (5.4%) | 611 (4.9%) |
| 30 to 34 Minutes | 1,047 (8.2%) | 1,401 (11.3%) |
| 35 to 39 Minutes | 265 (2.1%) | 234 (1.9%) |
| 40 to 44 Minutes | 232 (1.8%) | 370 (3.0%) |
| 45 to 59 Minutes | 1,234 (9.7%) | 1,181 (9.5%) |
| 60 to 89 Minutes | 726 (5.7%) | 694 (5.6%) |
| 90 or more Minutes | 495 (3.9%) | 197 (1.6%) |
Time of Departure to Work by Sex in Columbia County
The most frequent times of departure to work in Columbia County are 7:00 AM to 7:29 AM (1,857, 14.5%) for males and 7:00 AM to 7:29 AM (2,316, 18.6%) for females.
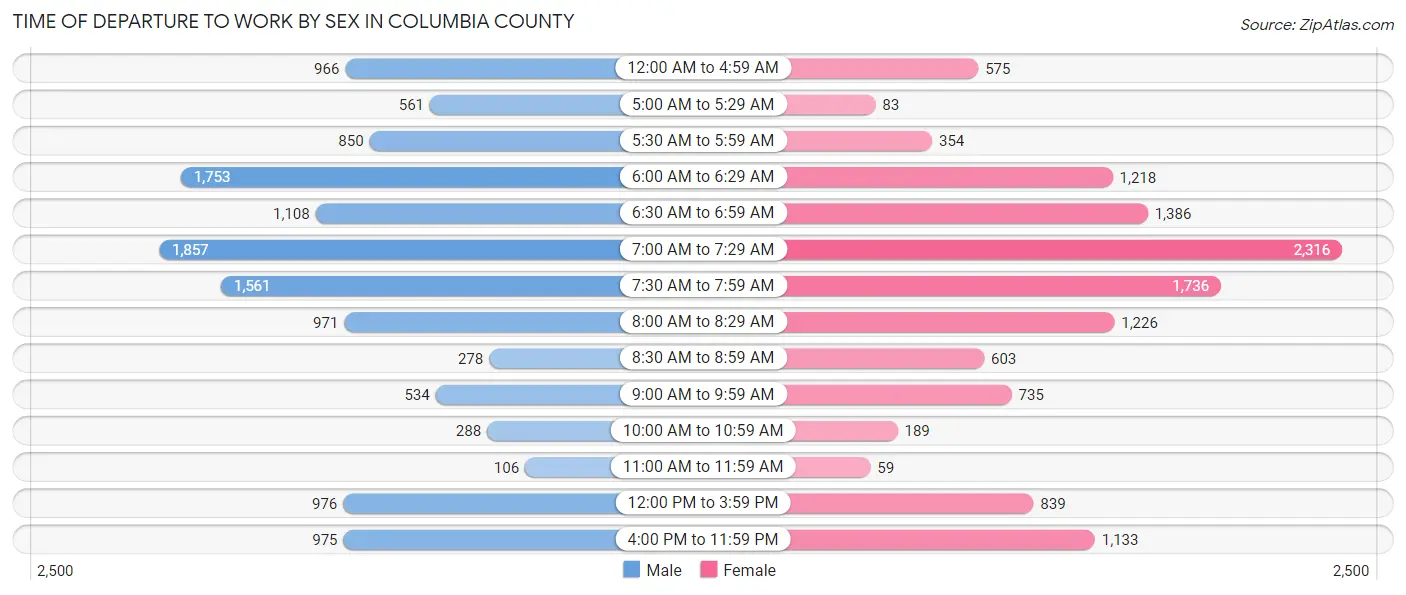
| Time of Departure | Male | Female |
| 12:00 AM to 4:59 AM | 966 (7.6%) | 575 (4.6%) |
| 5:00 AM to 5:29 AM | 561 (4.4%) | 83 (0.7%) |
| 5:30 AM to 5:59 AM | 850 (6.7%) | 354 (2.8%) |
| 6:00 AM to 6:29 AM | 1,753 (13.7%) | 1,218 (9.8%) |
| 6:30 AM to 6:59 AM | 1,108 (8.7%) | 1,386 (11.1%) |
| 7:00 AM to 7:29 AM | 1,857 (14.5%) | 2,316 (18.6%) |
| 7:30 AM to 7:59 AM | 1,561 (12.2%) | 1,736 (13.9%) |
| 8:00 AM to 8:29 AM | 971 (7.6%) | 1,226 (9.9%) |
| 8:30 AM to 8:59 AM | 278 (2.2%) | 603 (4.8%) |
| 9:00 AM to 9:59 AM | 534 (4.2%) | 735 (5.9%) |
| 10:00 AM to 10:59 AM | 288 (2.2%) | 189 (1.5%) |
| 11:00 AM to 11:59 AM | 106 (0.8%) | 59 (0.5%) |
| 12:00 PM to 3:59 PM | 976 (7.6%) | 839 (6.7%) |
| 4:00 PM to 11:59 PM | 975 (7.6%) | 1,133 (9.1%) |
| Total | 12,784 (100.0%) | 12,452 (100.0%) |
Housing Occupancy in Columbia County
Occupancy by Ownership in Columbia County
Of the total 26,391 dwellings in Columbia County, owner-occupied units account for 18,850 (71.4%), while renter-occupied units make up 7,541 (28.6%).
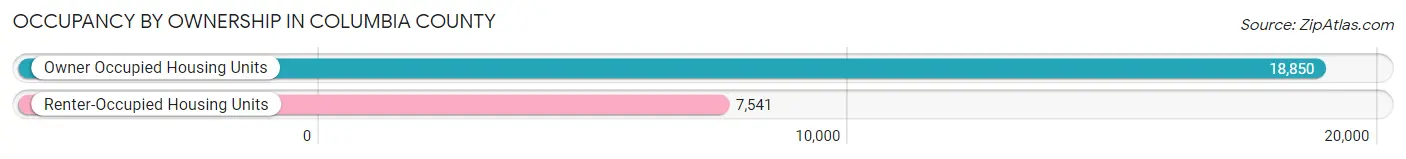
| Occupancy | # Housing Units | % Housing Units |
| Owner Occupied Housing Units | 18,850 | 71.4% |
| Renter-Occupied Housing Units | 7,541 | 28.6% |
| Total Occupied Housing Units | 26,391 | 100.0% |
Occupancy by Household Size in Columbia County
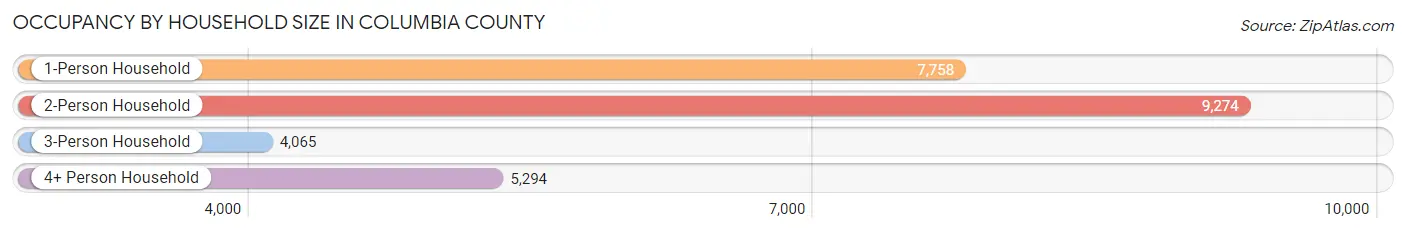
| Household Size | # Housing Units | % Housing Units |
| 1-Person Household | 7,758 | 29.4% |
| 2-Person Household | 9,274 | 35.1% |
| 3-Person Household | 4,065 | 15.4% |
| 4+ Person Household | 5,294 | 20.1% |
| Total Housing Units | 26,391 | 100.0% |
Occupancy by Ownership by Household Size in Columbia County
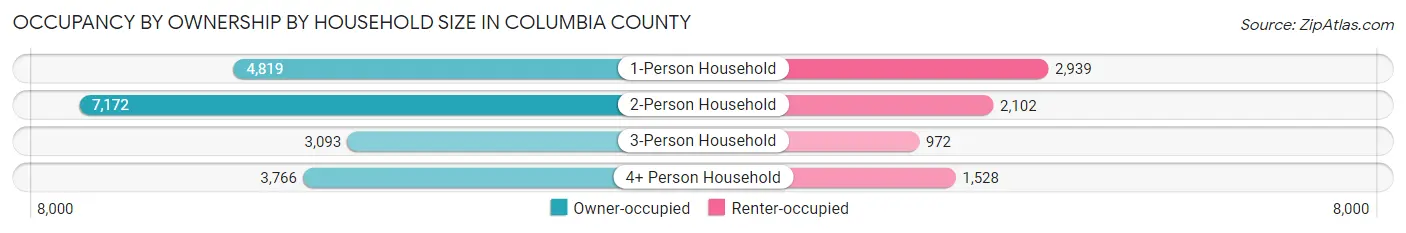
| Household Size | Owner-occupied | Renter-occupied |
| 1-Person Household | 4,819 (62.1%) | 2,939 (37.9%) |
| 2-Person Household | 7,172 (77.3%) | 2,102 (22.7%) |
| 3-Person Household | 3,093 (76.1%) | 972 (23.9%) |
| 4+ Person Household | 3,766 (71.1%) | 1,528 (28.9%) |
| Total Housing Units | 18,850 (71.4%) | 7,541 (28.6%) |
Occupancy by Educational Attainment in Columbia County
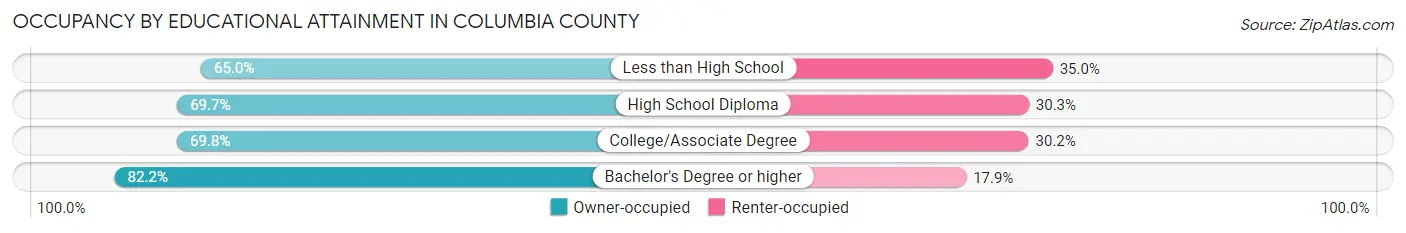
| Household Size | Owner-occupied | Renter-occupied |
| Less than High School | 2,008 (65.0%) | 1,081 (35.0%) |
| High School Diploma | 5,901 (69.7%) | 2,562 (30.3%) |
| College/Associate Degree | 7,048 (69.8%) | 3,052 (30.2%) |
| Bachelor's Degree or higher | 3,893 (82.2%) | 846 (17.8%) |
Occupancy by Age of Householder in Columbia County
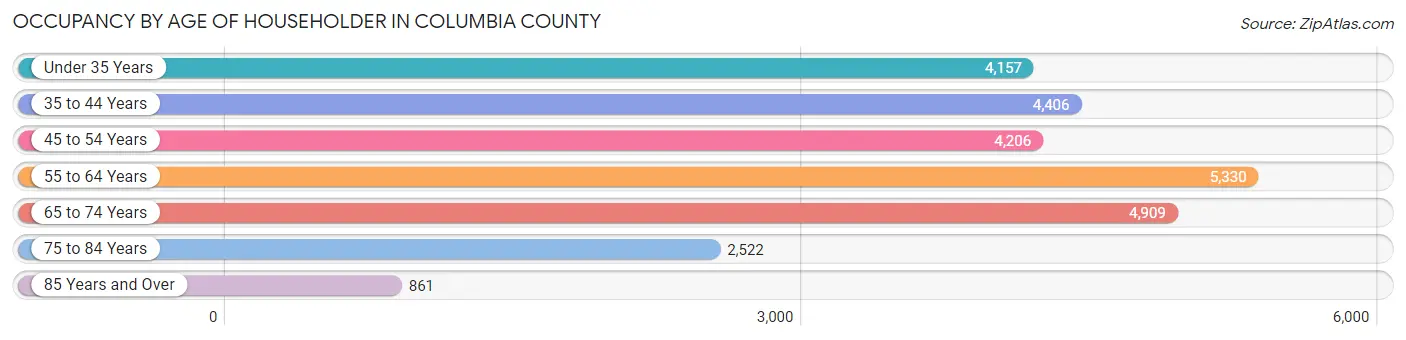
| Age Bracket | # Households | % Households |
| Under 35 Years | 4,157 | 15.8% |
| 35 to 44 Years | 4,406 | 16.7% |
| 45 to 54 Years | 4,206 | 15.9% |
| 55 to 64 Years | 5,330 | 20.2% |
| 65 to 74 Years | 4,909 | 18.6% |
| 75 to 84 Years | 2,522 | 9.6% |
| 85 Years and Over | 861 | 3.3% |
| Total | 26,391 | 100.0% |
Housing Finances in Columbia County
Median Income by Occupancy in Columbia County
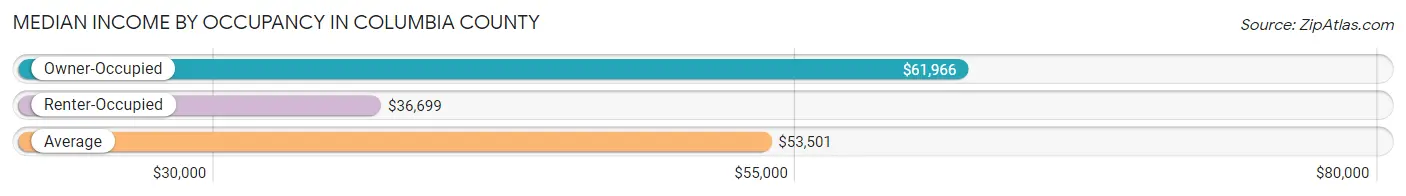
| Occupancy Type | # Households | Median Income |
| Owner-Occupied | 18,850 (71.4%) | $61,966 |
| Renter-Occupied | 7,541 (28.6%) | $36,699 |
| Average | 26,391 (100.0%) | $53,501 |
Occupancy by Householder Income Bracket in Columbia County
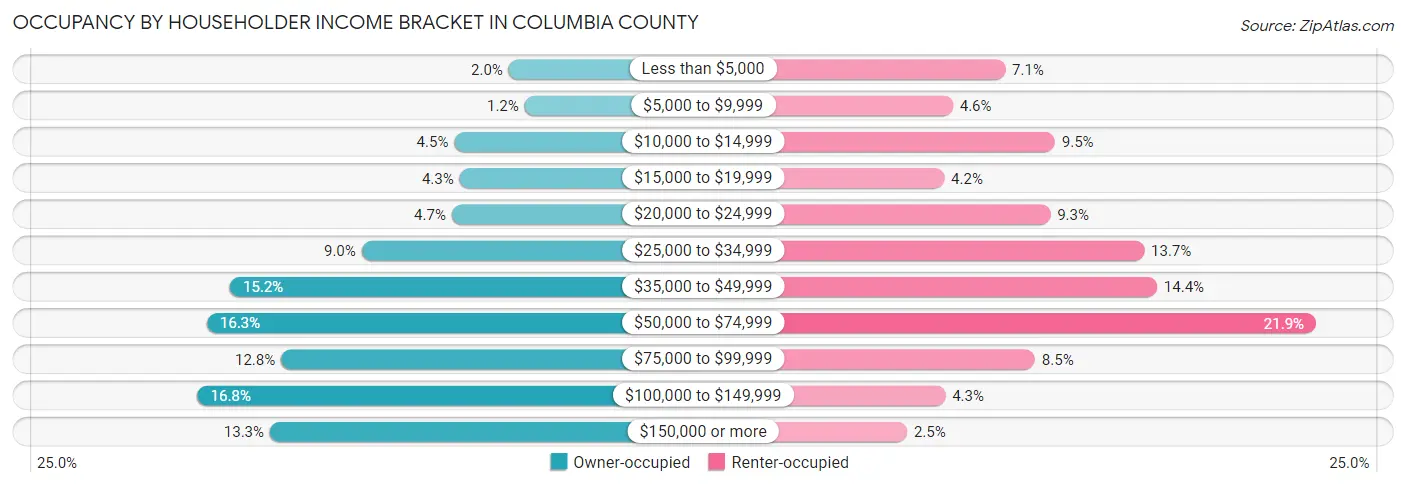
| Income Bracket | Owner-occupied | Renter-occupied |
| Less than $5,000 | 367 (1.9%) | 537 (7.1%) |
| $5,000 to $9,999 | 225 (1.2%) | 349 (4.6%) |
| $10,000 to $14,999 | 855 (4.5%) | 716 (9.5%) |
| $15,000 to $19,999 | 809 (4.3%) | 318 (4.2%) |
| $20,000 to $24,999 | 879 (4.7%) | 699 (9.3%) |
| $25,000 to $34,999 | 1,688 (8.9%) | 1,036 (13.7%) |
| $35,000 to $49,999 | 2,869 (15.2%) | 1,082 (14.3%) |
| $50,000 to $74,999 | 3,077 (16.3%) | 1,653 (21.9%) |
| $75,000 to $99,999 | 2,410 (12.8%) | 644 (8.5%) |
| $100,000 to $149,999 | 3,160 (16.8%) | 322 (4.3%) |
| $150,000 or more | 2,511 (13.3%) | 185 (2.5%) |
| Total | 18,850 (100.0%) | 7,541 (100.0%) |
Monthly Housing Cost Tiers in Columbia County
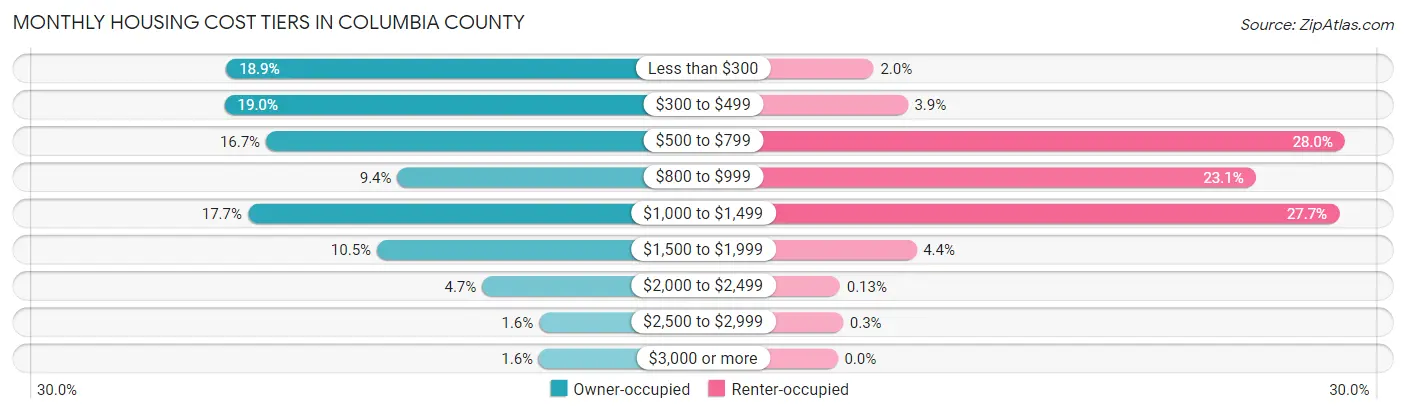
| Monthly Cost | Owner-occupied | Renter-occupied |
| Less than $300 | 3,556 (18.9%) | 150 (2.0%) |
| $300 to $499 | 3,573 (19.0%) | 292 (3.9%) |
| $500 to $799 | 3,143 (16.7%) | 2,113 (28.0%) |
| $800 to $999 | 1,774 (9.4%) | 1,741 (23.1%) |
| $1,000 to $1,499 | 3,330 (17.7%) | 2,089 (27.7%) |
| $1,500 to $1,999 | 1,986 (10.5%) | 328 (4.3%) |
| $2,000 to $2,499 | 891 (4.7%) | 10 (0.1%) |
| $2,500 to $2,999 | 297 (1.6%) | 23 (0.3%) |
| $3,000 or more | 300 (1.6%) | 0 (0.0%) |
| Total | 18,850 (100.0%) | 7,541 (100.0%) |
Physical Housing Characteristics in Columbia County
Housing Structures in Columbia County
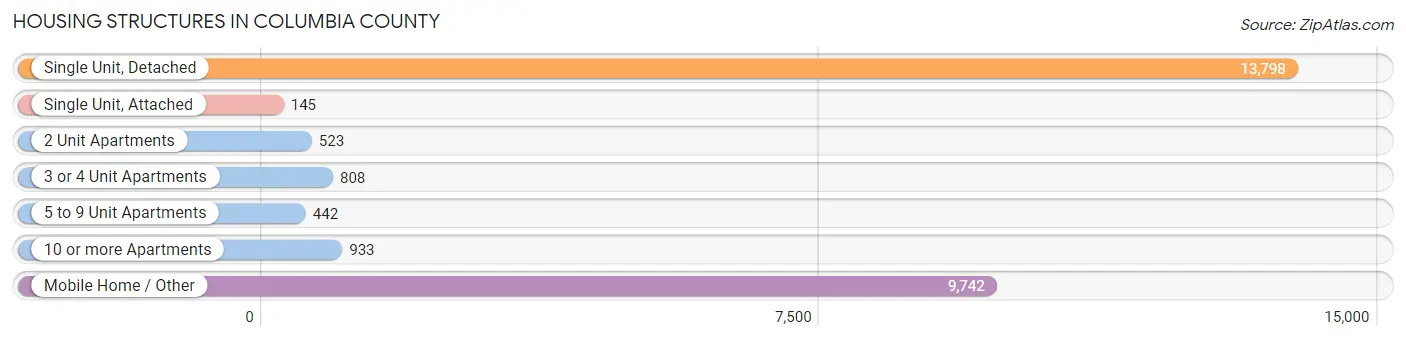
| Structure Type | # Housing Units | % Housing Units |
| Single Unit, Detached | 13,798 | 52.3% |
| Single Unit, Attached | 145 | 0.5% |
| 2 Unit Apartments | 523 | 2.0% |
| 3 or 4 Unit Apartments | 808 | 3.1% |
| 5 to 9 Unit Apartments | 442 | 1.7% |
| 10 or more Apartments | 933 | 3.5% |
| Mobile Home / Other | 9,742 | 36.9% |
| Total | 26,391 | 100.0% |
Housing Structures by Occupancy in Columbia County
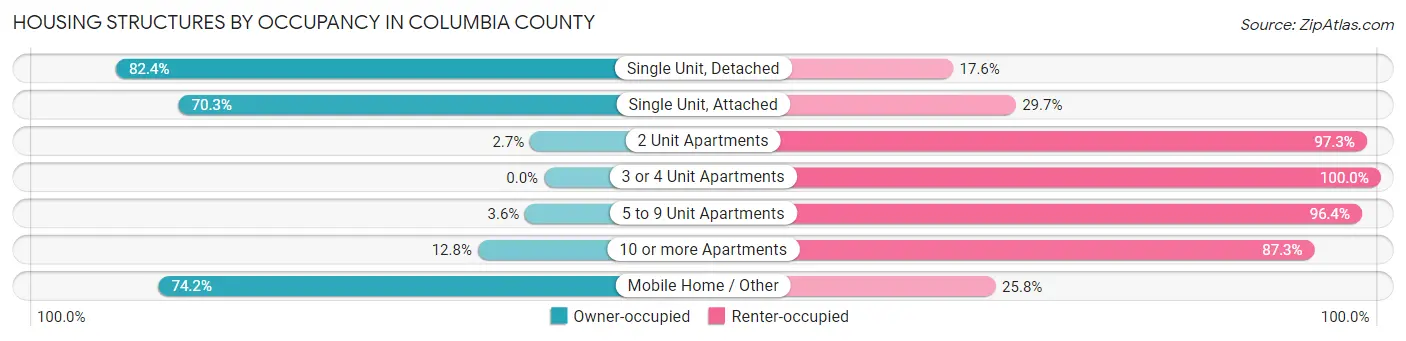
| Structure Type | Owner-occupied | Renter-occupied |
| Single Unit, Detached | 11,370 (82.4%) | 2,428 (17.6%) |
| Single Unit, Attached | 102 (70.3%) | 43 (29.7%) |
| 2 Unit Apartments | 14 (2.7%) | 509 (97.3%) |
| 3 or 4 Unit Apartments | 0 (0.0%) | 808 (100.0%) |
| 5 to 9 Unit Apartments | 16 (3.6%) | 426 (96.4%) |
| 10 or more Apartments | 119 (12.8%) | 814 (87.3%) |
| Mobile Home / Other | 7,229 (74.2%) | 2,513 (25.8%) |
| Total | 18,850 (71.4%) | 7,541 (28.6%) |
Housing Structures by Number of Rooms in Columbia County
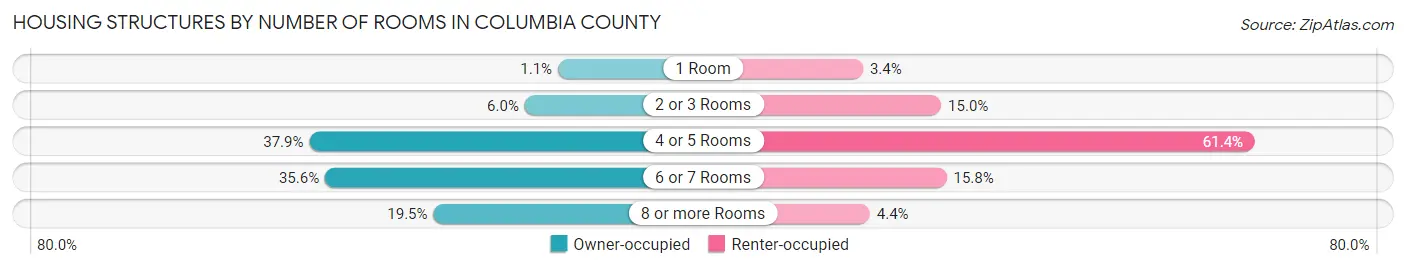
| Number of Rooms | Owner-occupied | Renter-occupied |
| 1 Room | 203 (1.1%) | 257 (3.4%) |
| 2 or 3 Rooms | 1,129 (6.0%) | 1,130 (15.0%) |
| 4 or 5 Rooms | 7,139 (37.9%) | 4,630 (61.4%) |
| 6 or 7 Rooms | 6,702 (35.5%) | 1,190 (15.8%) |
| 8 or more Rooms | 3,677 (19.5%) | 334 (4.4%) |
| Total | 18,850 (100.0%) | 7,541 (100.0%) |
Housing Structure by Heating Type in Columbia County
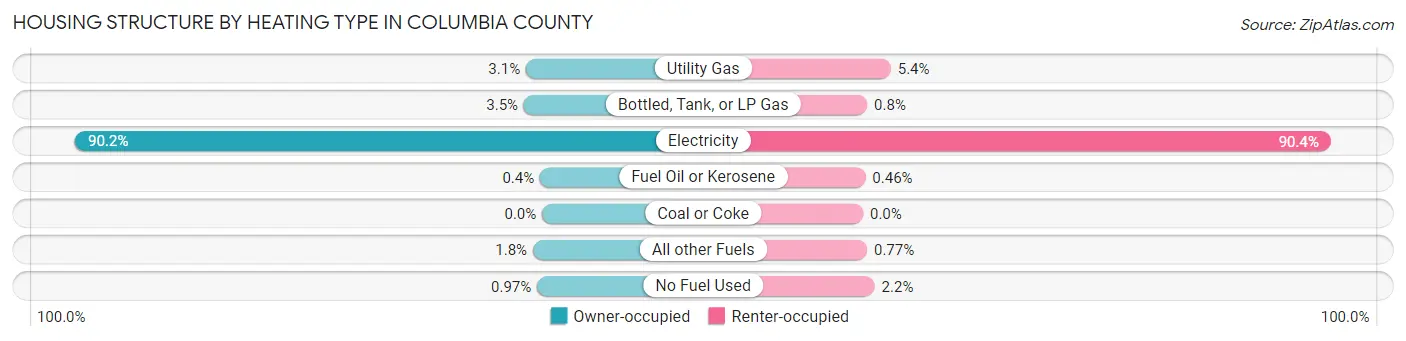
| Heating Type | Owner-occupied | Renter-occupied |
| Utility Gas | 586 (3.1%) | 404 (5.4%) |
| Bottled, Tank, or LP Gas | 661 (3.5%) | 60 (0.8%) |
| Electricity | 17,010 (90.2%) | 6,815 (90.4%) |
| Fuel Oil or Kerosene | 76 (0.4%) | 35 (0.5%) |
| Coal or Coke | 0 (0.0%) | 0 (0.0%) |
| All other Fuels | 334 (1.8%) | 58 (0.8%) |
| No Fuel Used | 183 (1.0%) | 169 (2.2%) |
| Total | 18,850 (100.0%) | 7,541 (100.0%) |
Household Vehicle Usage in Columbia County
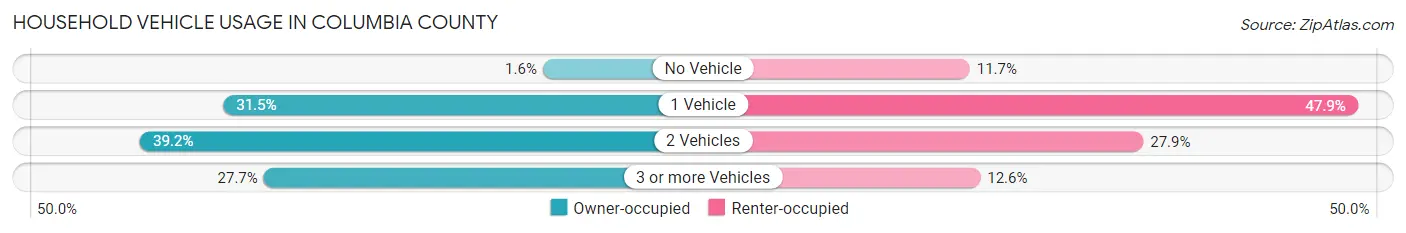
| Vehicles per Household | Owner-occupied | Renter-occupied |
| No Vehicle | 308 (1.6%) | 879 (11.7%) |
| 1 Vehicle | 5,929 (31.5%) | 3,609 (47.9%) |
| 2 Vehicles | 7,393 (39.2%) | 2,100 (27.9%) |
| 3 or more Vehicles | 5,220 (27.7%) | 953 (12.6%) |
| Total | 18,850 (100.0%) | 7,541 (100.0%) |
Real Estate & Mortgages in Columbia County
Real Estate and Mortgage Overview in Columbia County
| Characteristic | Without Mortgage | With Mortgage |
| Housing Units | 9,486 | 9,364 |
| Median Property Value | $124,500 | $191,600 |
| Median Household Income | $44,483 | $1,787 |
| Monthly Housing Costs | $360 | $300 |
| Real Estate Taxes | $1,204 | $457 |
Property Value by Mortgage Status in Columbia County
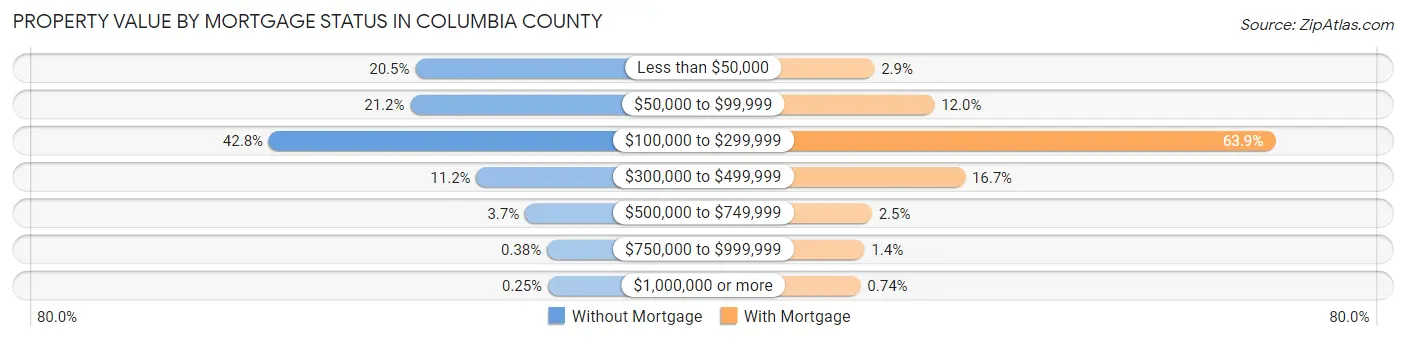
| Property Value | Without Mortgage | With Mortgage |
| Less than $50,000 | 1,942 (20.5%) | 267 (2.9%) |
| $50,000 to $99,999 | 2,014 (21.2%) | 1,123 (12.0%) |
| $100,000 to $299,999 | 4,057 (42.8%) | 5,986 (63.9%) |
| $300,000 to $499,999 | 1,058 (11.2%) | 1,561 (16.7%) |
| $500,000 to $749,999 | 355 (3.7%) | 231 (2.5%) |
| $750,000 to $999,999 | 36 (0.4%) | 127 (1.4%) |
| $1,000,000 or more | 24 (0.3%) | 69 (0.7%) |
| Total | 9,486 (100.0%) | 9,364 (100.0%) |
Household Income by Mortgage Status in Columbia County
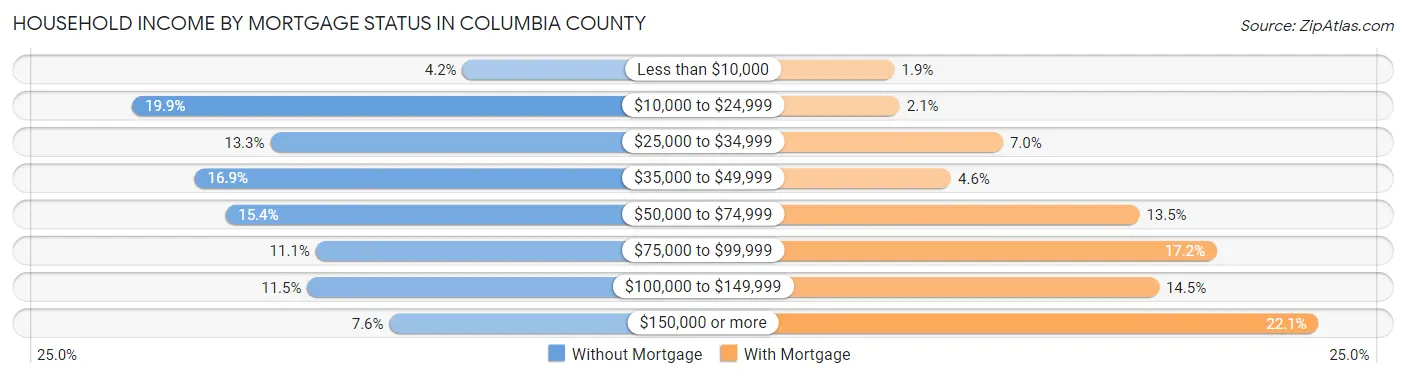
| Household Income | Without Mortgage | With Mortgage |
| Less than $10,000 | 394 (4.2%) | 174 (1.9%) |
| $10,000 to $24,999 | 1,886 (19.9%) | 198 (2.1%) |
| $25,000 to $34,999 | 1,262 (13.3%) | 657 (7.0%) |
| $35,000 to $49,999 | 1,603 (16.9%) | 426 (4.5%) |
| $50,000 to $74,999 | 1,465 (15.4%) | 1,266 (13.5%) |
| $75,000 to $99,999 | 1,057 (11.1%) | 1,612 (17.2%) |
| $100,000 to $149,999 | 1,095 (11.5%) | 1,353 (14.4%) |
| $150,000 or more | 724 (7.6%) | 2,065 (22.1%) |
| Total | 9,486 (100.0%) | 9,364 (100.0%) |
Property Value to Household Income Ratio in Columbia County
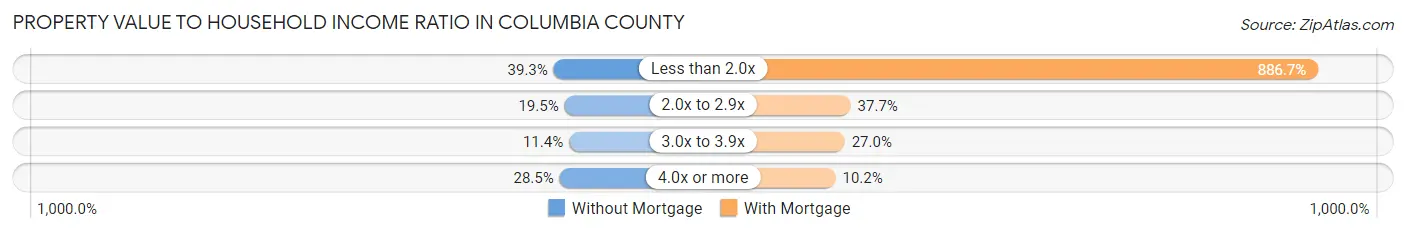
| Value-to-Income Ratio | Without Mortgage | With Mortgage |
| Less than 2.0x | 3,726 (39.3%) | 83,029 (886.7%) |
| 2.0x to 2.9x | 1,853 (19.5%) | 3,528 (37.7%) |
| 3.0x to 3.9x | 1,078 (11.4%) | 2,524 (27.0%) |
| 4.0x or more | 2,703 (28.5%) | 952 (10.2%) |
| Total | 9,486 (100.0%) | 9,364 (100.0%) |
Real Estate Taxes by Mortgage Status in Columbia County
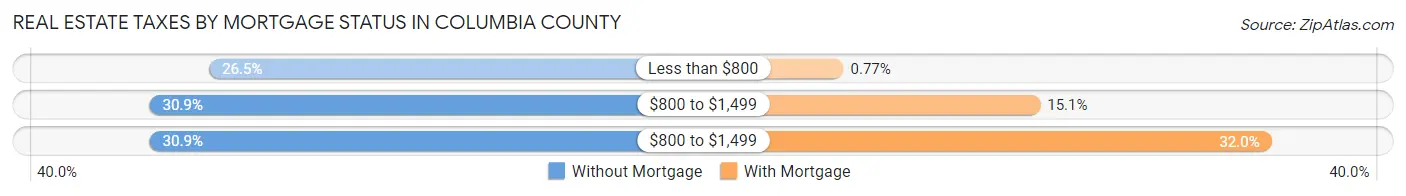
| Property Taxes | Without Mortgage | With Mortgage |
| Less than $800 | 2,516 (26.5%) | 72 (0.8%) |
| $800 to $1,499 | 2,928 (30.9%) | 1,418 (15.1%) |
| $800 to $1,499 | 2,927 (30.9%) | 2,999 (32.0%) |
| Total | 9,486 (100.0%) | 9,364 (100.0%) |
Health & Disability in Columbia County
Health Insurance Coverage by Age in Columbia County
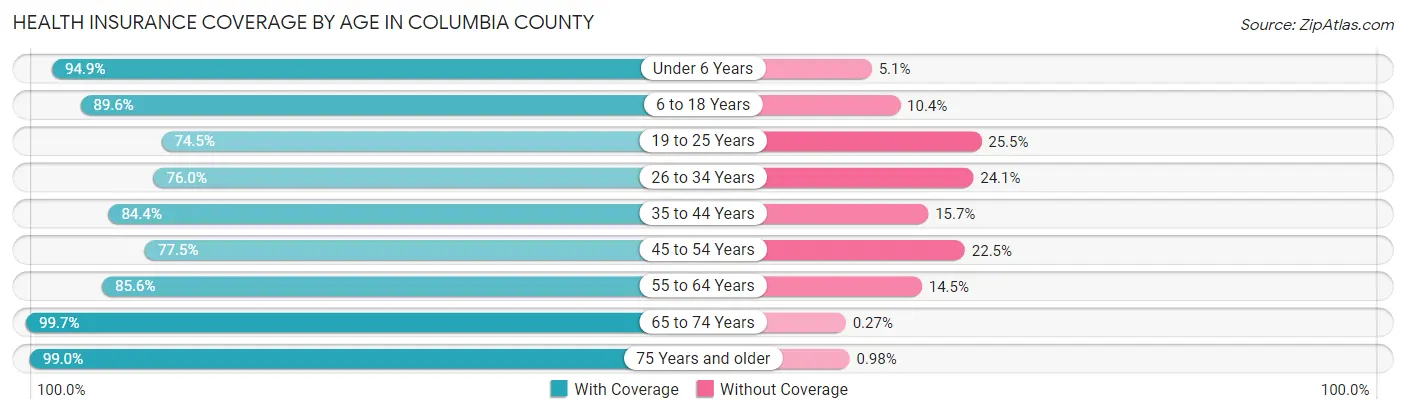
| Age Bracket | With Coverage | Without Coverage |
| Under 6 Years | 4,481 (94.9%) | 242 (5.1%) |
| 6 to 18 Years | 10,209 (89.6%) | 1,186 (10.4%) |
| 19 to 25 Years | 3,584 (74.5%) | 1,229 (25.5%) |
| 26 to 34 Years | 4,861 (75.9%) | 1,539 (24.0%) |
| 35 to 44 Years | 6,684 (84.4%) | 1,240 (15.7%) |
| 45 to 54 Years | 6,025 (77.5%) | 1,747 (22.5%) |
| 55 to 64 Years | 7,923 (85.6%) | 1,338 (14.4%) |
| 65 to 74 Years | 7,715 (99.7%) | 21 (0.3%) |
| 75 Years and older | 5,245 (99.0%) | 52 (1.0%) |
| Total | 56,727 (86.8%) | 8,594 (13.2%) |
Health Insurance Coverage by Citizenship Status in Columbia County
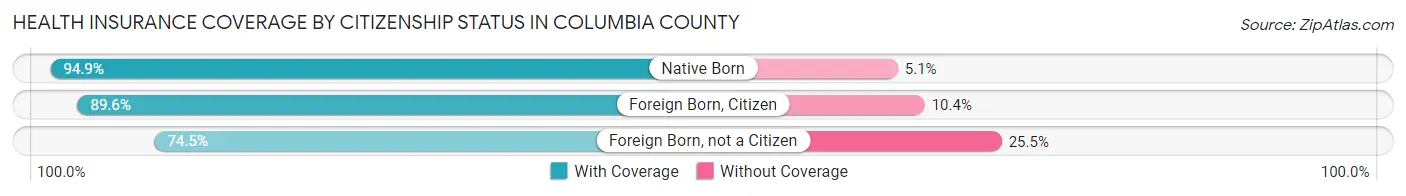
| Citizenship Status | With Coverage | Without Coverage |
| Native Born | 4,481 (94.9%) | 242 (5.1%) |
| Foreign Born, Citizen | 10,209 (89.6%) | 1,186 (10.4%) |
| Foreign Born, not a Citizen | 3,584 (74.5%) | 1,229 (25.5%) |
Health Insurance Coverage by Household Income in Columbia County
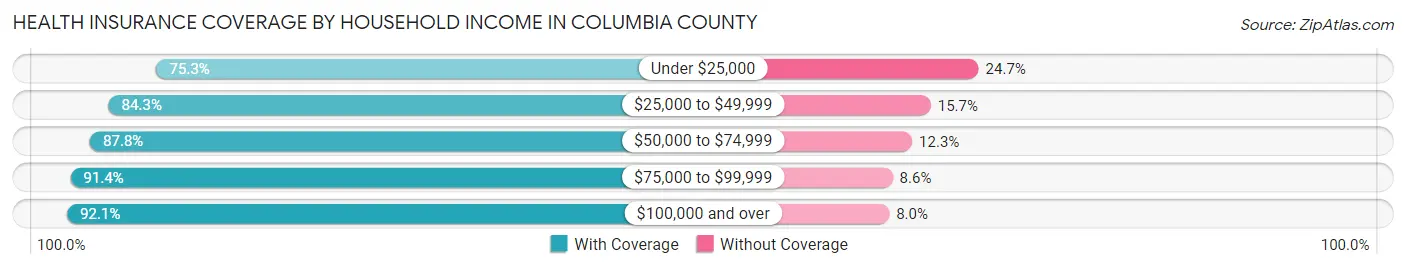
| Household Income | With Coverage | Without Coverage |
| Under $25,000 | 7,553 (75.3%) | 2,477 (24.7%) |
| $25,000 to $49,999 | 12,276 (84.3%) | 2,293 (15.7%) |
| $50,000 to $74,999 | 10,366 (87.7%) | 1,447 (12.2%) |
| $75,000 to $99,999 | 8,181 (91.4%) | 769 (8.6%) |
| $100,000 and over | 18,277 (92.0%) | 1,578 (8.0%) |
Public vs Private Health Insurance Coverage by Age in Columbia County
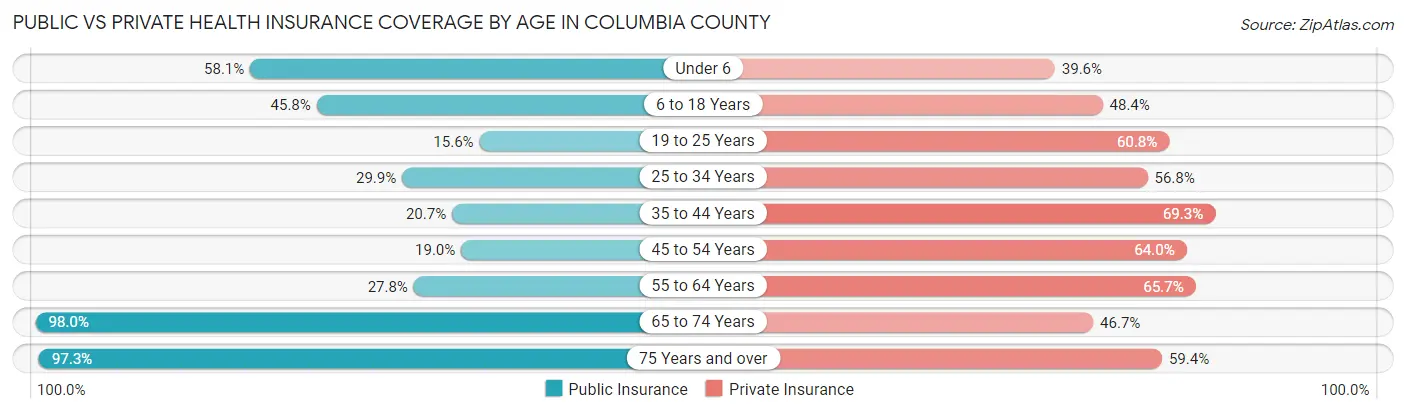
| Age Bracket | Public Insurance | Private Insurance |
| Under 6 | 2,746 (58.1%) | 1,868 (39.6%) |
| 6 to 18 Years | 5,219 (45.8%) | 5,516 (48.4%) |
| 19 to 25 Years | 750 (15.6%) | 2,924 (60.8%) |
| 25 to 34 Years | 1,916 (29.9%) | 3,632 (56.8%) |
| 35 to 44 Years | 1,638 (20.7%) | 5,488 (69.3%) |
| 45 to 54 Years | 1,475 (19.0%) | 4,972 (64.0%) |
| 55 to 64 Years | 2,573 (27.8%) | 6,080 (65.6%) |
| 65 to 74 Years | 7,579 (98.0%) | 3,610 (46.7%) |
| 75 Years and over | 5,156 (97.3%) | 3,148 (59.4%) |
| Total | 29,052 (44.5%) | 37,238 (57.0%) |
Disability Status by Sex by Age in Columbia County
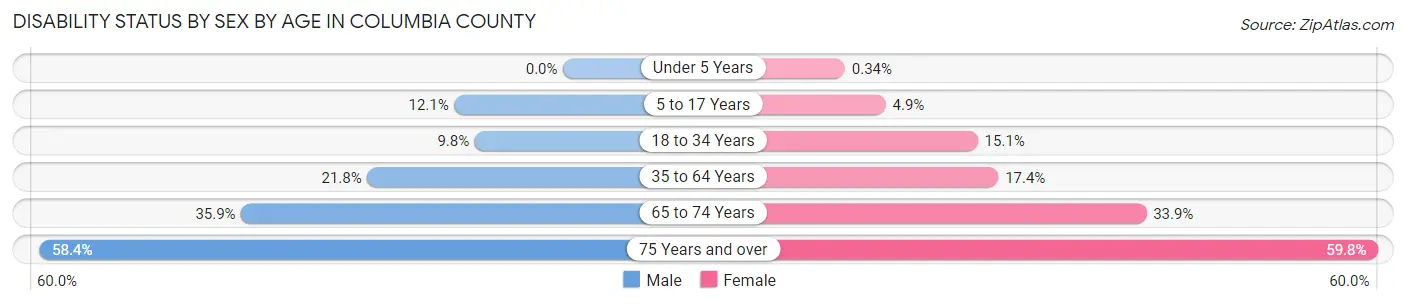
| Age Bracket | Male | Female |
| Under 5 Years | 0 (0.0%) | 7 (0.3%) |
| 5 to 17 Years | 730 (12.1%) | 266 (4.9%) |
| 18 to 34 Years | 538 (9.8%) | 968 (15.1%) |
| 35 to 64 Years | 2,651 (21.8%) | 2,230 (17.4%) |
| 65 to 74 Years | 1,294 (35.8%) | 1,399 (33.9%) |
| 75 Years and over | 1,362 (58.4%) | 1,771 (59.8%) |
Disability Class by Sex by Age in Columbia County
Disability Class: Hearing Difficulty
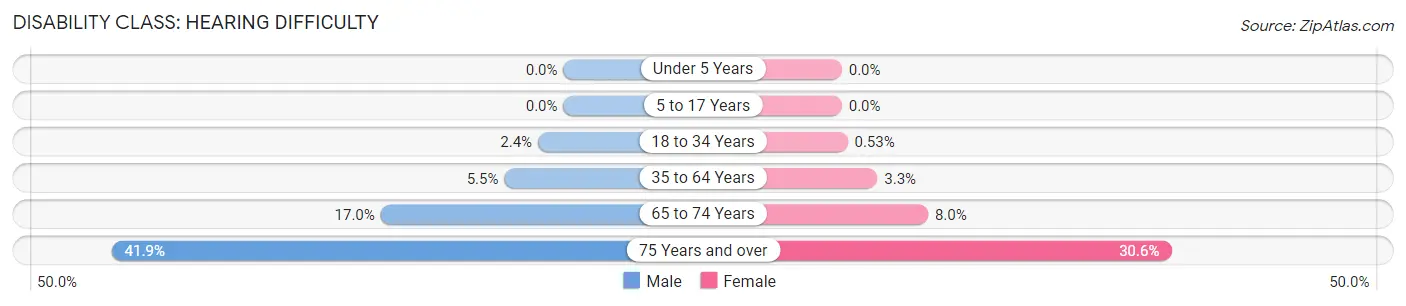
| Age Bracket | Male | Female |
| Under 5 Years | 0 (0.0%) | 0 (0.0%) |
| 5 to 17 Years | 0 (0.0%) | 0 (0.0%) |
| 18 to 34 Years | 129 (2.4%) | 34 (0.5%) |
| 35 to 64 Years | 666 (5.5%) | 423 (3.3%) |
| 65 to 74 Years | 612 (17.0%) | 330 (8.0%) |
| 75 Years and over | 978 (41.9%) | 906 (30.6%) |
Disability Class: Vision Difficulty
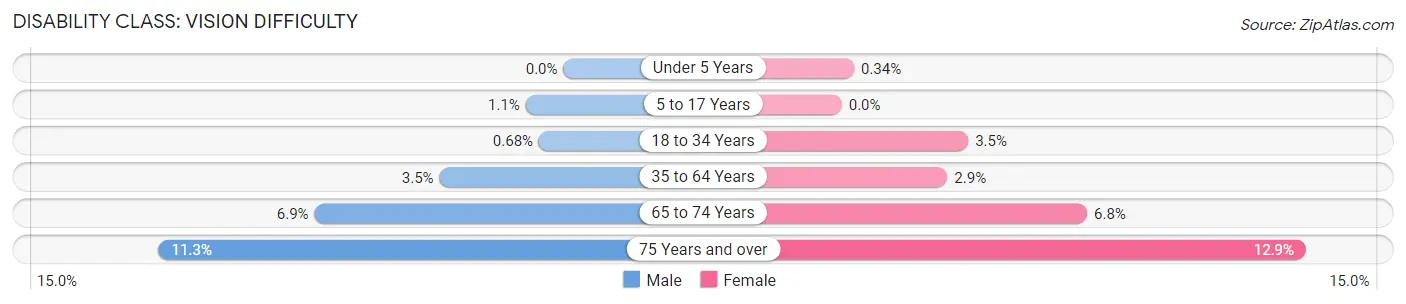
| Age Bracket | Male | Female |
| Under 5 Years | 0 (0.0%) | 7 (0.3%) |
| 5 to 17 Years | 63 (1.1%) | 0 (0.0%) |
| 18 to 34 Years | 37 (0.7%) | 225 (3.5%) |
| 35 to 64 Years | 419 (3.5%) | 377 (2.9%) |
| 65 to 74 Years | 250 (6.9%) | 282 (6.8%) |
| 75 Years and over | 263 (11.3%) | 383 (12.9%) |
Disability Class: Cognitive Difficulty
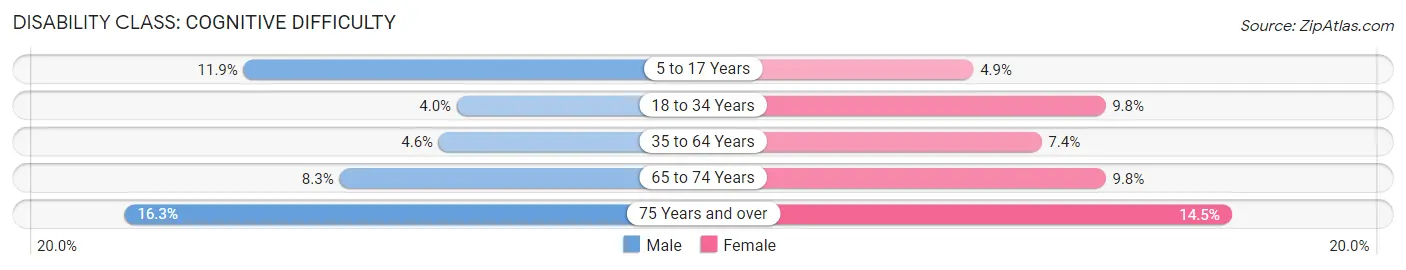
| Age Bracket | Male | Female |
| 5 to 17 Years | 715 (11.9%) | 266 (4.9%) |
| 18 to 34 Years | 216 (4.0%) | 626 (9.8%) |
| 35 to 64 Years | 561 (4.6%) | 949 (7.4%) |
| 65 to 74 Years | 300 (8.3%) | 404 (9.8%) |
| 75 Years and over | 380 (16.3%) | 429 (14.5%) |
Disability Class: Ambulatory Difficulty
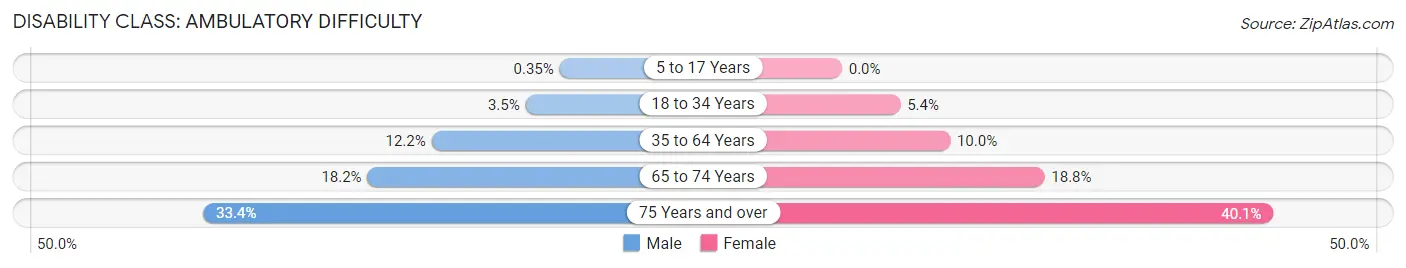
| Age Bracket | Male | Female |
| 5 to 17 Years | 21 (0.4%) | 0 (0.0%) |
| 18 to 34 Years | 192 (3.5%) | 347 (5.4%) |
| 35 to 64 Years | 1,487 (12.2%) | 1,285 (10.0%) |
| 65 to 74 Years | 656 (18.2%) | 776 (18.8%) |
| 75 Years and over | 780 (33.4%) | 1,187 (40.1%) |
Disability Class: Self-Care Difficulty
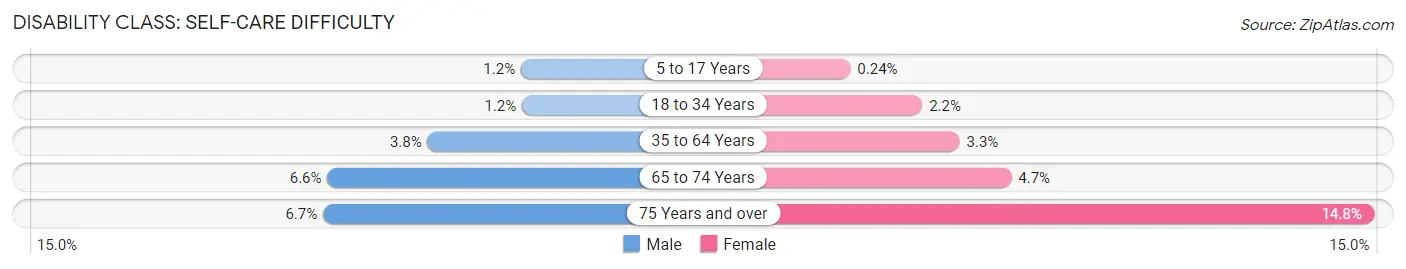
| Age Bracket | Male | Female |
| 5 to 17 Years | 71 (1.2%) | 13 (0.2%) |
| 18 to 34 Years | 63 (1.1%) | 143 (2.2%) |
| 35 to 64 Years | 459 (3.8%) | 420 (3.3%) |
| 65 to 74 Years | 237 (6.6%) | 195 (4.7%) |
| 75 Years and over | 156 (6.7%) | 439 (14.8%) |
Technology Access in Columbia County
Computing Device Access in Columbia County
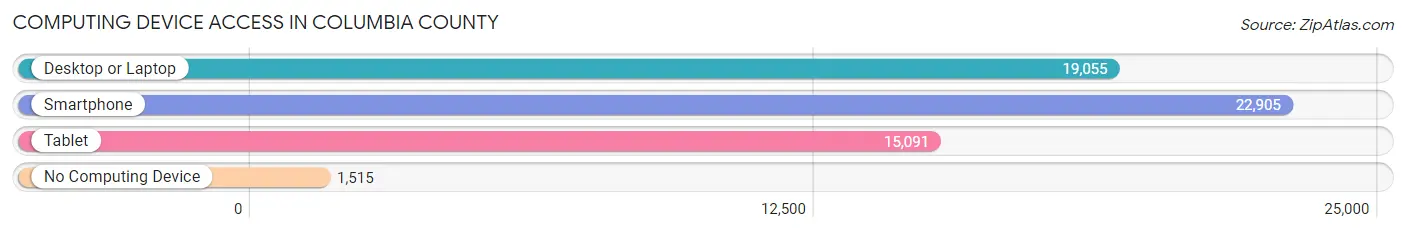
| Device Type | # Households | % Households |
| Desktop or Laptop | 19,055 | 72.2% |
| Smartphone | 22,905 | 86.8% |
| Tablet | 15,091 | 57.2% |
| No Computing Device | 1,515 | 5.7% |
| Total | 26,391 | 100.0% |
Internet Access in Columbia County
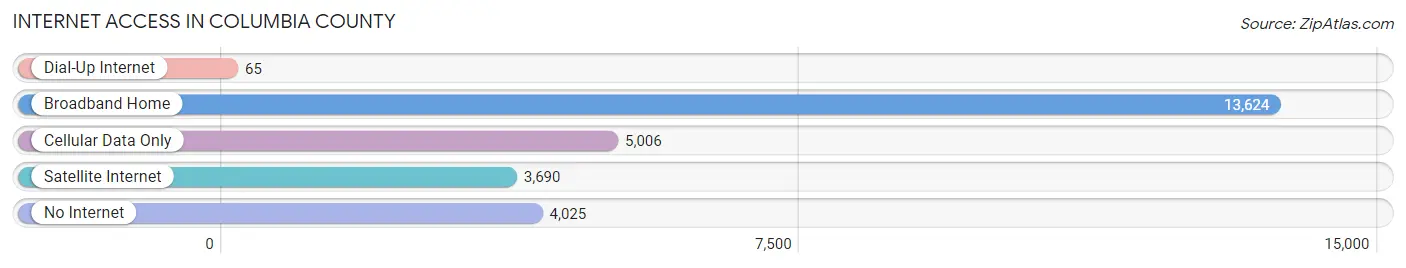
| Internet Type | # Households | % Households |
| Dial-Up Internet | 65 | 0.3% |
| Broadband Home | 13,624 | 51.6% |
| Cellular Data Only | 5,006 | 19.0% |
| Satellite Internet | 3,690 | 14.0% |
| No Internet | 4,025 | 15.2% |
| Total | 26,391 | 100.0% |
Columbia County Summary
Columbia County is located in the north-central part of the state of Florida, in the United States. It is bordered by Suwannee County to the north, Hamilton County to the west, Alachua County to the east, and Baker County to the south. The county seat is Lake City, and the largest city is Lake City. As of the 2010 census, the population was 67,531.
History
Columbia County was created in 1832 from a portion of Duval County. It was named for Christopher Columbus, the explorer who discovered the New World. The county was originally part of the Territory of Florida, which was established in 1822.
The county was home to several Native American tribes, including the Seminole, Timucua, and Apalachee. The first European settlers arrived in the area in the late 1700s. The county was largely agricultural, with cotton, tobacco, and citrus being the main crops.
In the late 1800s, the county began to develop as a tourist destination. Hotels and resorts were built along the Suwannee River, and the area became known as the "Gateway to the Suwannee."
Geography
Columbia County is located in the north-central part of the state of Florida. It is bordered by Suwannee County to the north, Hamilton County to the west, Alachua County to the east, and Baker County to the south. The county has a total area of 745 square miles, of which 741 square miles is land and 4.2 square miles is water.
The county is mostly flat, with some rolling hills in the northern part. The Suwannee River forms the northern border of the county, and the Santa Fe River forms the eastern border. The county is home to several lakes, including Lake City, Lake Desoto, and Lake Isabella.
Economy
The economy of Columbia County is largely based on agriculture, forestry, and tourism. The county is home to several large farms, which produce cotton, tobacco, and citrus. The county is also home to several timber companies, which harvest pine and cypress trees.
Tourism is an important part of the economy, with visitors coming to the area to enjoy the natural beauty of the Suwannee River and the many lakes in the county. The county is also home to several state parks, including Stephen Foster Folk Culture Center State Park and Olustee Battlefield Historic State Park.
Demographics
As of the 2010 census, there were 67,531 people, 25,845 households, and 17,945 families living in the county. The population density was 91.3 people per square mile. There were 28,945 housing units at an average density of 39.2 per square mile.
The racial makeup of the county was 75.2% White, 17.3% African American, 0.5% Native American, 1.2% Asian, 0.1% Pacific Islander, 3.7% from other races, and 2.1% from two or more races. Hispanic or Latino of any race were 8.7% of the population.
The median income for a household in the county was $37,845, and the median income for a family was $45,945. The per capita income for the county was $20,845. About 14.2% of families and 18.2% of the population were below the poverty line, including 25.2% of those under age 18 and 11.2% of those age 65 or over.
Common Questions
What is Per Capita Income in Columbia County?
Per Capita income in Columbia County is $28,317.
What is the Median Family Income in Columbia County?
Median Family Income in Columbia County is $70,757.
What is the Median Household income in Columbia County?
Median Household Income in Columbia County is $53,501.
What is Income or Wage Gap in Columbia County?
Income or Wage Gap in Columbia County is 25.4%.
Women in Columbia County earn 74.6 cents for every dollar earned by a man.
What is Family Income Deficit in Columbia County?
Family Income Deficit in Columbia County is $10,988.
Families that are below poverty line in Columbia County earn $10,988 less on average than the poverty threshold level.
What is Inequality or Gini Index in Columbia County?
Inequality or Gini Index in Columbia County is 0.47.
What is the Total Population of Columbia County?
Total Population of Columbia County is 69,832.
What is the Total Male Population of Columbia County?
Total Male Population of Columbia County is 35,762.
What is the Total Female Population of Columbia County?
Total Female Population of Columbia County is 34,070.
What is the Ratio of Males per 100 Females in Columbia County?
There are 104.97 Males per 100 Females in Columbia County.
What is the Ratio of Females per 100 Males in Columbia County?
There are 95.27 Females per 100 Males in Columbia County.
What is the Median Population Age in Columbia County?
Median Population Age in Columbia County is 40.7 Years.
What is the Average Family Size in Columbia County
Average Family Size in Columbia County is 3.1 People.
What is the Average Household Size in Columbia County
Average Household Size in Columbia County is 2.5 People.
How Large is the Labor Force in Columbia County?
There are 29,626 People in the Labor Forcein in Columbia County.
What is the Percentage of People in the Labor Force in Columbia County?
52.8% of People are in the Labor Force in Columbia County.
What is the Unemployment Rate in Columbia County?
Unemployment Rate in Columbia County is 6.9%.