Citrus County, FL Map & Demographics
Citrus County Map
Citrus County Overview
$33,514
PER CAPITA INCOME
$66,464
AVG FAMILY INCOME
$52,569
AVG HOUSEHOLD INCOME
21.4%
WAGE / INCOME GAP [ % ]
78.6¢/ $1
WAGE / INCOME GAP [ $ ]
$9,871
FAMILY INCOME DEFICIT
0.48
INEQUALITY / GINI INDEX
155,173
TOTAL POPULATION
76,008
MALE POPULATION
79,165
FEMALE POPULATION
96.01
MALES / 100 FEMALES
104.15
FEMALES / 100 MALES
56.9
MEDIAN AGE
2.8
AVG FAMILY SIZE
2.3
AVG HOUSEHOLD SIZE
53,249
LABOR FORCE [ PEOPLE ]
39.4%
PERCENT IN LABOR FORCE
7.2%
UNEMPLOYMENT RATE
Citrus County Area Codes
Income in Citrus County
Income Overview in Citrus County
Per Capita Income in Citrus County is $33,514, while median incomes of families and households are $66,464 and $52,569 respectively.
| Characteristic | Number | Measure |
| Per Capita Income | 155,173 | $33,514 |
| Median Family Income | 42,889 | $66,464 |
| Mean Family Income | 42,889 | $89,166 |
| Median Household Income | 67,551 | $52,569 |
| Mean Household Income | 67,551 | $74,579 |
| Income Deficit | 42,889 | $9,871 |
| Wage / Income Gap (%) | 155,173 | 21.36% |
| Wage / Income Gap ($) | 155,173 | 78.64¢ per $1 |
| Gini / Inequality Index | 155,173 | 0.48 |
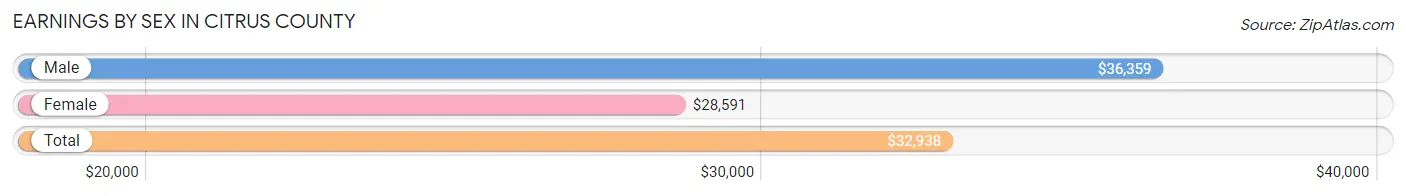
Earnings by Sex in Citrus County
Average Earnings in Citrus County are $32,938, $36,359 for men and $28,591 for women, a difference of 21.4%.
| Sex | Number | Average Earnings |
| Male | 29,694 (52.5%) | $36,359 |
| Female | 26,890 (47.5%) | $28,591 |
| Total | 56,584 (100.0%) | $32,938 |
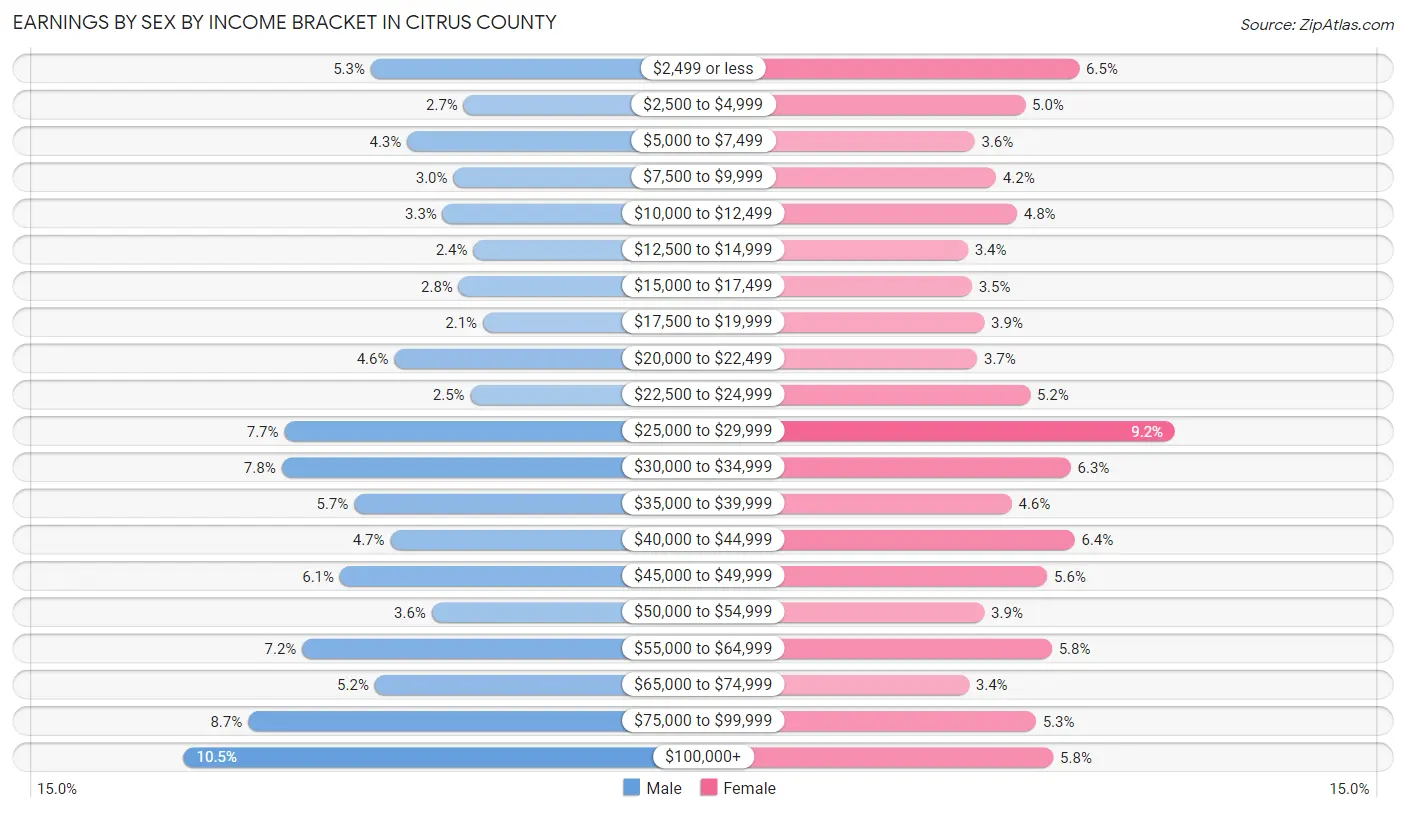
Earnings by Sex by Income Bracket in Citrus County
The most common earnings brackets in Citrus County are $100,000+ for men (3,126 | 10.5%) and $25,000 to $29,999 for women (2,479 | 9.2%).
| Income | Male | Female |
| $2,499 or less | 1,564 (5.3%) | 1,757 (6.5%) |
| $2,500 to $4,999 | 791 (2.7%) | 1,346 (5.0%) |
| $5,000 to $7,499 | 1,261 (4.3%) | 965 (3.6%) |
| $7,500 to $9,999 | 877 (2.9%) | 1,127 (4.2%) |
| $10,000 to $12,499 | 964 (3.3%) | 1,284 (4.8%) |
| $12,500 to $14,999 | 709 (2.4%) | 915 (3.4%) |
| $15,000 to $17,499 | 830 (2.8%) | 943 (3.5%) |
| $17,500 to $19,999 | 630 (2.1%) | 1,039 (3.9%) |
| $20,000 to $22,499 | 1,368 (4.6%) | 985 (3.7%) |
| $22,500 to $24,999 | 734 (2.5%) | 1,385 (5.1%) |
| $25,000 to $29,999 | 2,286 (7.7%) | 2,479 (9.2%) |
| $30,000 to $34,999 | 2,309 (7.8%) | 1,691 (6.3%) |
| $35,000 to $39,999 | 1,705 (5.7%) | 1,245 (4.6%) |
| $40,000 to $44,999 | 1,401 (4.7%) | 1,720 (6.4%) |
| $45,000 to $49,999 | 1,824 (6.1%) | 1,514 (5.6%) |
| $50,000 to $54,999 | 1,058 (3.6%) | 1,037 (3.9%) |
| $55,000 to $64,999 | 2,138 (7.2%) | 1,548 (5.8%) |
| $65,000 to $74,999 | 1,531 (5.2%) | 922 (3.4%) |
| $75,000 to $99,999 | 2,588 (8.7%) | 1,428 (5.3%) |
| $100,000+ | 3,126 (10.5%) | 1,560 (5.8%) |
| Total | 29,694 (100.0%) | 26,890 (100.0%) |
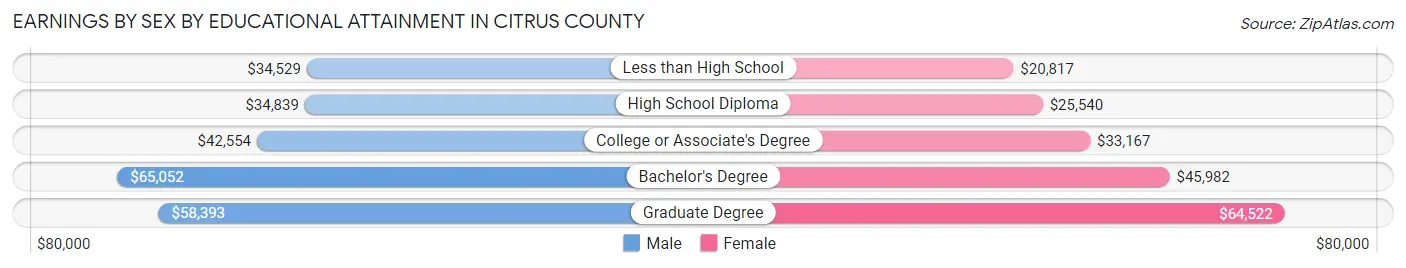
Earnings by Sex by Educational Attainment in Citrus County
Average earnings in Citrus County are $40,651 for men and $31,703 for women, a difference of 22.0%. Men with an educational attainment of bachelor's degree enjoy the highest average annual earnings of $65,052, while those with less than high school education earn the least with $34,529. Women with an educational attainment of graduate degree earn the most with the average annual earnings of $64,522, while those with less than high school education have the smallest earnings of $20,817.
| Educational Attainment | Male Income | Female Income |
| Less than High School | $34,529 | $20,817 |
| High School Diploma | $34,839 | $25,540 |
| College or Associate's Degree | $42,554 | $33,167 |
| Bachelor's Degree | $65,052 | $45,982 |
| Graduate Degree | $58,393 | $64,522 |
| Total | $40,651 | $31,703 |
Family Income in Citrus County
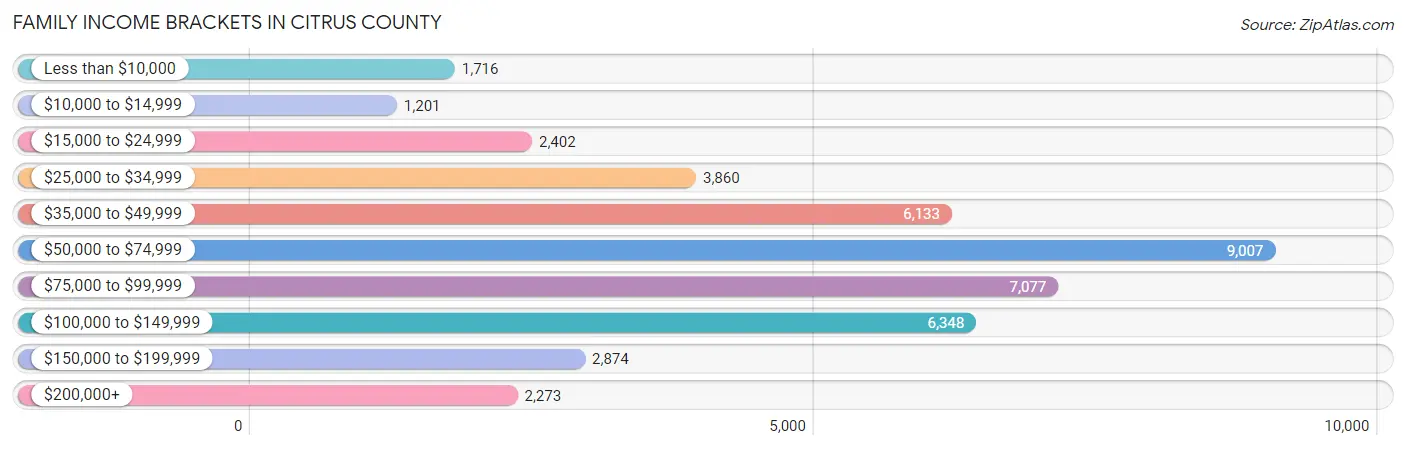
Family Income Brackets in Citrus County
According to the Citrus County family income data, there are 9,007 families falling into the $50,000 to $74,999 income range, which is the most common income bracket and makes up 21.0% of all families. Conversely, the $10,000 to $14,999 income bracket is the least frequent group with only 1,201 families (2.8%) belonging to this category.
| Income Bracket | # Families | % Families |
| Less than $10,000 | 1,716 | 4.0% |
| $10,000 to $14,999 | 1,201 | 2.8% |
| $15,000 to $24,999 | 2,402 | 5.6% |
| $25,000 to $34,999 | 3,860 | 9.0% |
| $35,000 to $49,999 | 6,133 | 14.3% |
| $50,000 to $74,999 | 9,007 | 21.0% |
| $75,000 to $99,999 | 7,077 | 16.5% |
| $100,000 to $149,999 | 6,348 | 14.8% |
| $150,000 to $199,999 | 2,874 | 6.7% |
| $200,000+ | 2,273 | 5.3% |
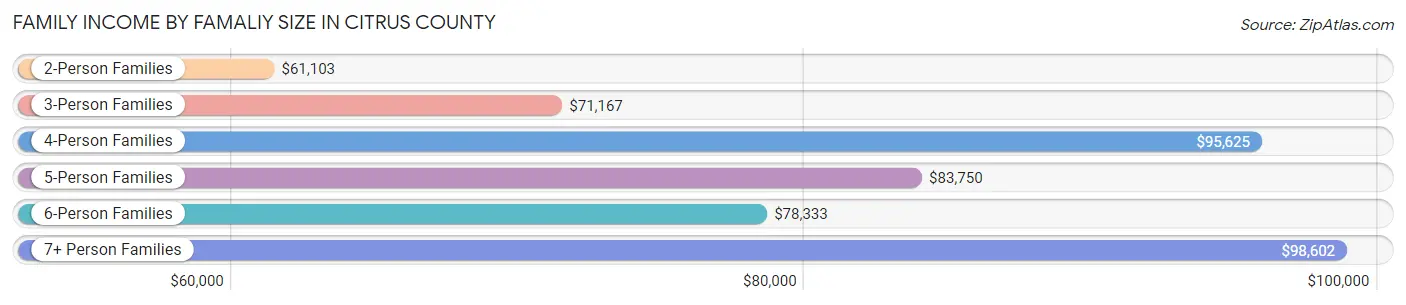
Family Income by Famaliy Size in Citrus County
7+ person families (372 | 0.9%) account for the highest median family income in Citrus County with $98,602 per family, while 2-person families (27,675 | 64.5%) have the highest median income of $30,552 per family member.
| Income Bracket | # Families | Median Income |
| 2-Person Families | 27,675 (64.5%) | $61,103 |
| 3-Person Families | 8,430 (19.7%) | $71,167 |
| 4-Person Families | 4,311 (10.1%) | $95,625 |
| 5-Person Families | 1,453 (3.4%) | $83,750 |
| 6-Person Families | 648 (1.5%) | $78,333 |
| 7+ Person Families | 372 (0.9%) | $98,602 |
| Total | 42,889 (100.0%) | $66,464 |
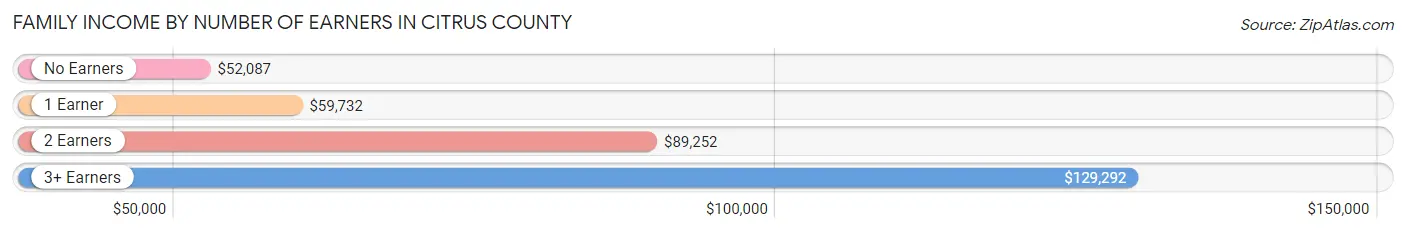
Family Income by Number of Earners in Citrus County
The median family income in Citrus County is $66,464, with families comprising 3+ earners (2,327) having the highest median family income of $129,292, while families with no earners (16,787) have the lowest median family income of $52,087, accounting for 5.4% and 39.1% of families, respectively.
| Number of Earners | # Families | Median Income |
| No Earners | 16,787 (39.1%) | $52,087 |
| 1 Earner | 14,122 (32.9%) | $59,732 |
| 2 Earners | 9,653 (22.5%) | $89,252 |
| 3+ Earners | 2,327 (5.4%) | $129,292 |
| Total | 42,889 (100.0%) | $66,464 |
Household Income in Citrus County
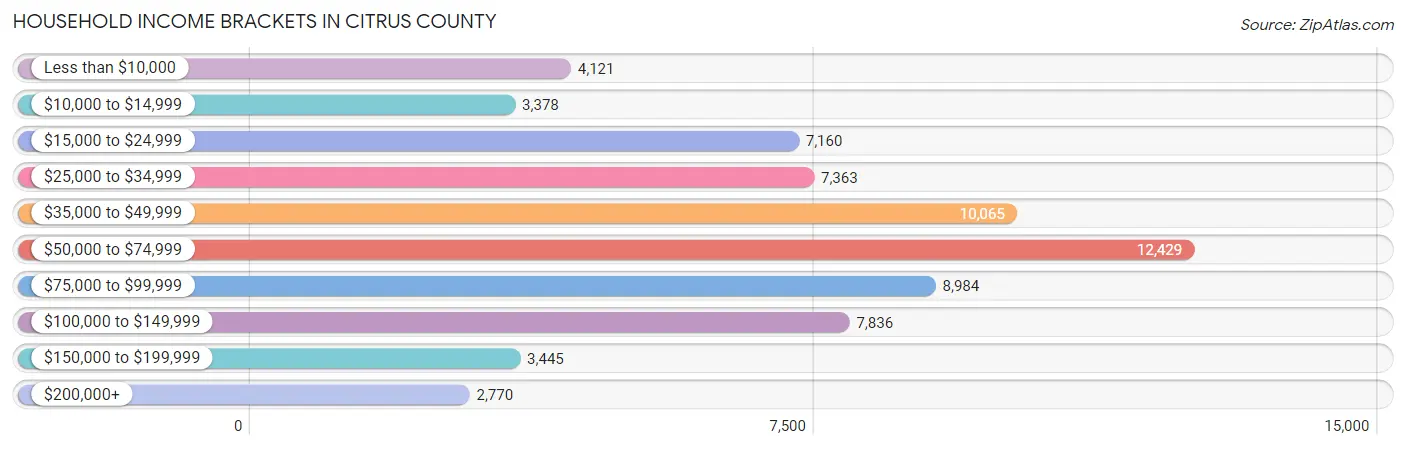
Household Income Brackets in Citrus County
With 12,429 households falling in the category, the $50,000 to $74,999 income range is the most frequent in Citrus County, accounting for 18.4% of all households. In contrast, only 2,770 households (4.1%) fall into the $200,000+ income bracket, making it the least populous group.
| Income Bracket | # Households | % Households |
| Less than $10,000 | 4,121 | 6.1% |
| $10,000 to $14,999 | 3,378 | 5.0% |
| $15,000 to $24,999 | 7,160 | 10.6% |
| $25,000 to $34,999 | 7,363 | 10.9% |
| $35,000 to $49,999 | 10,065 | 14.9% |
| $50,000 to $74,999 | 12,429 | 18.4% |
| $75,000 to $99,999 | 8,984 | 13.3% |
| $100,000 to $149,999 | 7,836 | 11.6% |
| $150,000 to $199,999 | 3,445 | 5.1% |
| $200,000+ | 2,770 | 4.1% |
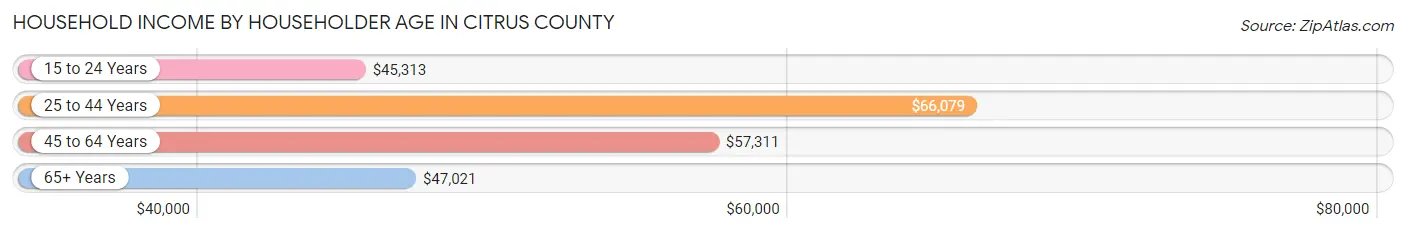
Household Income by Householder Age in Citrus County
The median household income in Citrus County is $52,569, with the highest median household income of $66,079 found in the 25 to 44 years age bracket for the primary householder. A total of 10,304 households (15.2%) fall into this category. Meanwhile, the 15 to 24 years age bracket for the primary householder has the lowest median household income of $45,313, with 902 households (1.3%) in this group.
| Income Bracket | # Households | Median Income |
| 15 to 24 Years | 902 (1.3%) | $45,313 |
| 25 to 44 Years | 10,304 (15.2%) | $66,079 |
| 45 to 64 Years | 21,472 (31.8%) | $57,311 |
| 65+ Years | 34,873 (51.6%) | $47,021 |
| Total | 67,551 (100.0%) | $52,569 |
Poverty in Citrus County
Income Below Poverty by Sex and Age in Citrus County
With 14.8% poverty level for males and 15.2% for females among the residents of Citrus County, under 5 year old males and 5 year old females are the most vulnerable to poverty, with 823 males (29.7%) and 260 females (35.1%) in their respective age groups living below the poverty level.
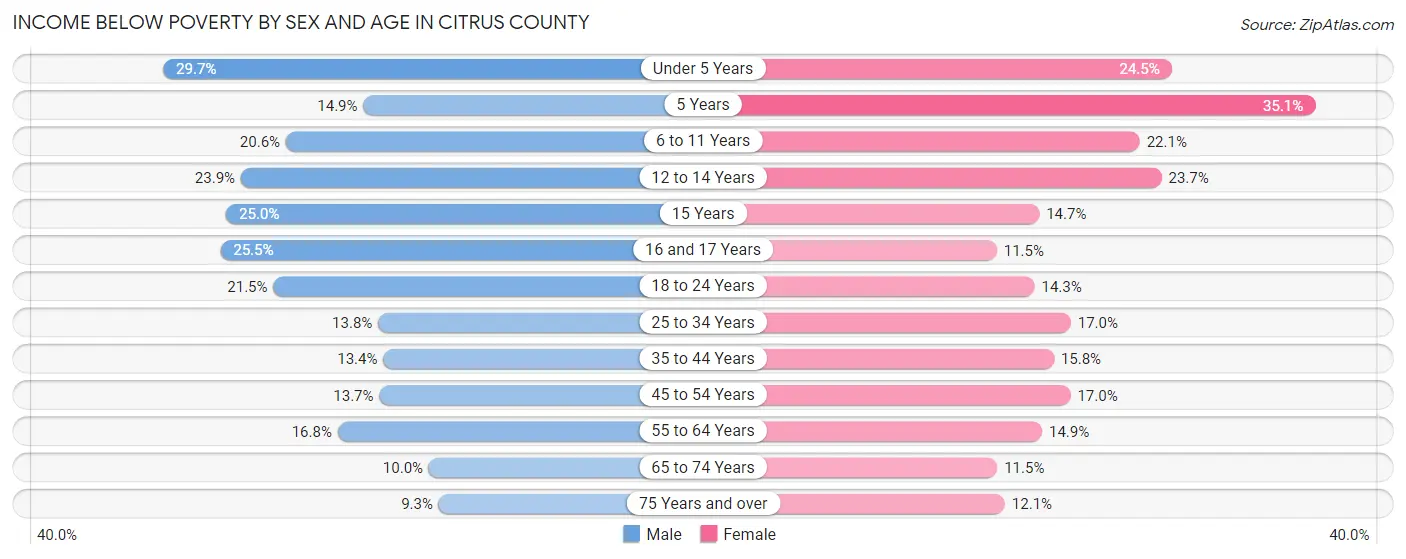
| Age Bracket | Male | Female |
| Under 5 Years | 823 (29.7%) | 596 (24.5%) |
| 5 Years | 53 (14.8%) | 260 (35.1%) |
| 6 to 11 Years | 852 (20.6%) | 645 (22.1%) |
| 12 to 14 Years | 535 (23.9%) | 580 (23.7%) |
| 15 Years | 170 (25.0%) | 100 (14.7%) |
| 16 and 17 Years | 403 (25.5%) | 143 (11.5%) |
| 18 to 24 Years | 949 (21.5%) | 569 (14.3%) |
| 25 to 34 Years | 888 (13.8%) | 1,072 (17.0%) |
| 35 to 44 Years | 841 (13.4%) | 1,000 (15.8%) |
| 45 to 54 Years | 1,032 (13.7%) | 1,432 (17.0%) |
| 55 to 64 Years | 1,955 (16.8%) | 1,991 (14.9%) |
| 65 to 74 Years | 1,428 (10.0%) | 1,831 (11.5%) |
| 75 Years and over | 1,099 (9.2%) | 1,586 (12.1%) |
| Total | 11,028 (14.8%) | 11,805 (15.2%) |
Income Above Poverty by Sex and Age in Citrus County
According to the poverty statistics in Citrus County, males aged 75 years and over and females aged 16 and 17 years are the age groups that are most secure financially, with 90.7% of males and 88.5% of females in these age groups living above the poverty line.
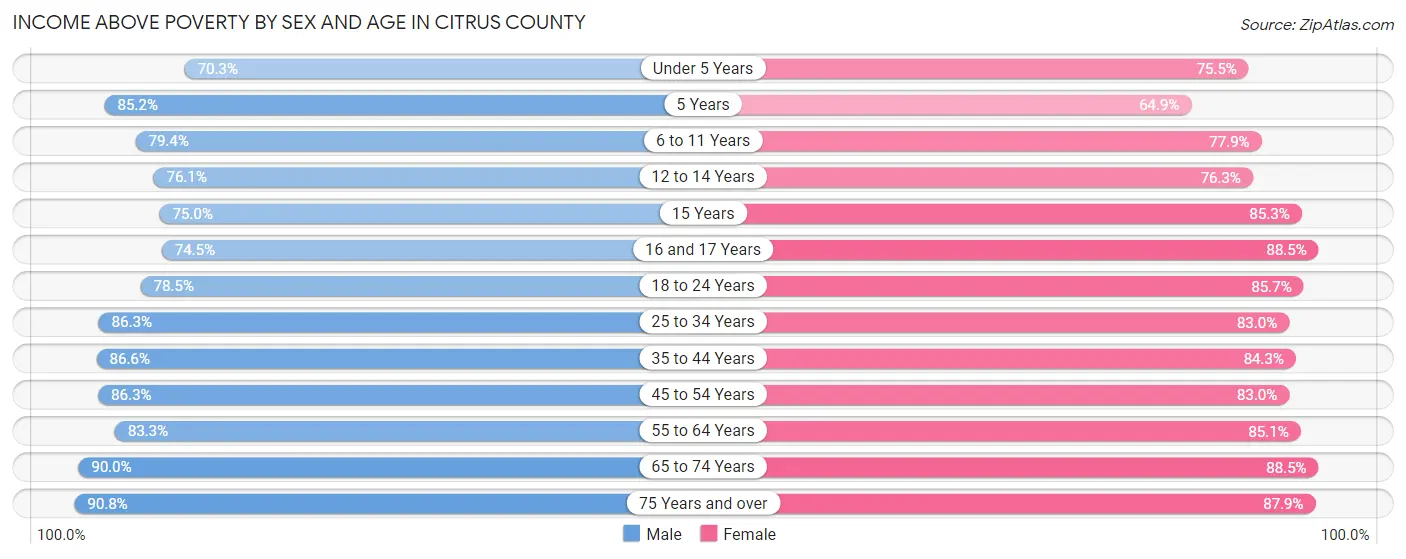
| Age Bracket | Male | Female |
| Under 5 Years | 1,947 (70.3%) | 1,839 (75.5%) |
| 5 Years | 304 (85.2%) | 480 (64.9%) |
| 6 to 11 Years | 3,284 (79.4%) | 2,271 (77.9%) |
| 12 to 14 Years | 1,700 (76.1%) | 1,863 (76.3%) |
| 15 Years | 509 (75.0%) | 582 (85.3%) |
| 16 and 17 Years | 1,179 (74.5%) | 1,099 (88.5%) |
| 18 to 24 Years | 3,459 (78.5%) | 3,408 (85.7%) |
| 25 to 34 Years | 5,568 (86.3%) | 5,235 (83.0%) |
| 35 to 44 Years | 5,451 (86.6%) | 5,351 (84.3%) |
| 45 to 54 Years | 6,522 (86.3%) | 7,000 (83.0%) |
| 55 to 64 Years | 9,716 (83.3%) | 11,394 (85.1%) |
| 65 to 74 Years | 12,882 (90.0%) | 14,031 (88.5%) |
| 75 Years and over | 10,779 (90.7%) | 11,513 (87.9%) |
| Total | 63,300 (85.2%) | 66,066 (84.8%) |
Income Below Poverty Among Married-Couple Families in Citrus County
The poverty statistics for married-couple families in Citrus County show that 6.8% or 2,322 of the total 34,180 families live below the poverty line. Families with 5 or more children have the highest poverty rate of 74.1%, comprising of 40 families. On the other hand, families with no children have the lowest poverty rate of 5.3%, which includes 1,463 families.
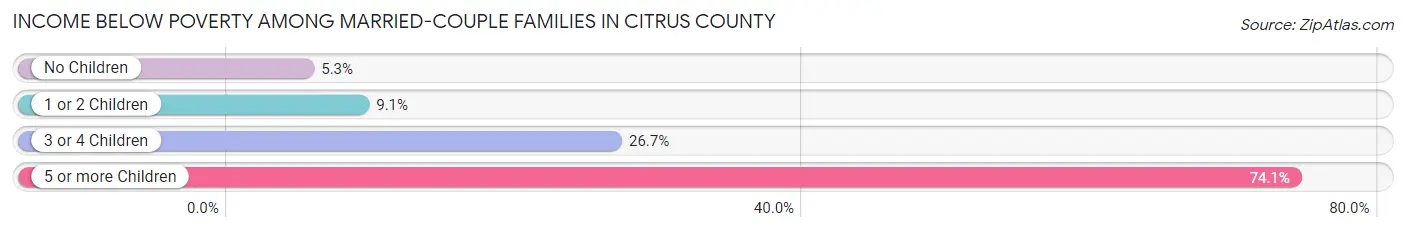
| Children | Above Poverty | Below Poverty |
| No Children | 26,077 (94.7%) | 1,463 (5.3%) |
| 1 or 2 Children | 4,863 (90.9%) | 489 (9.1%) |
| 3 or 4 Children | 904 (73.3%) | 330 (26.7%) |
| 5 or more Children | 14 (25.9%) | 40 (74.1%) |
| Total | 31,858 (93.2%) | 2,322 (6.8%) |
Income Below Poverty Among Single-Parent Households in Citrus County
According to the poverty data in Citrus County, 27.6% or 679 single-father households and 23.0% or 1,435 single-mother households are living below the poverty line. Among single-father households, those with 1 or 2 children have the highest poverty rate, with 451 households (42.2%) experiencing poverty. Likewise, among single-mother households, those with 3 or 4 children have the highest poverty rate, with 231 households (58.8%) falling below the poverty line.
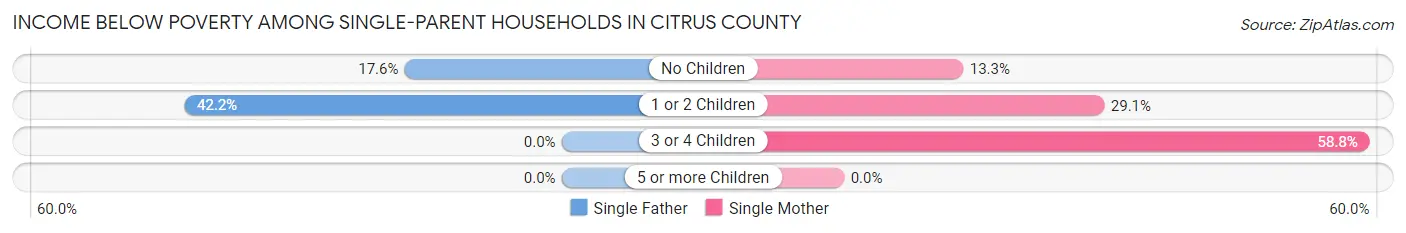
| Children | Single Father | Single Mother |
| No Children | 228 (17.6%) | 421 (13.3%) |
| 1 or 2 Children | 451 (42.2%) | 783 (29.1%) |
| 3 or 4 Children | 0 (0.0%) | 231 (58.8%) |
| 5 or more Children | 0 (0.0%) | 0 (0.0%) |
| Total | 679 (27.6%) | 1,435 (23.0%) |
Income Below Poverty Among Married-Couple vs Single-Parent Households in Citrus County
The poverty data for Citrus County shows that 2,322 of the married-couple family households (6.8%) and 2,114 of the single-parent households (24.3%) are living below the poverty level. Within the married-couple family households, those with 5 or more children have the highest poverty rate, with 40 households (74.1%) falling below the poverty line. Among the single-parent households, those with 3 or 4 children have the highest poverty rate, with 231 household (47.5%) living below poverty.
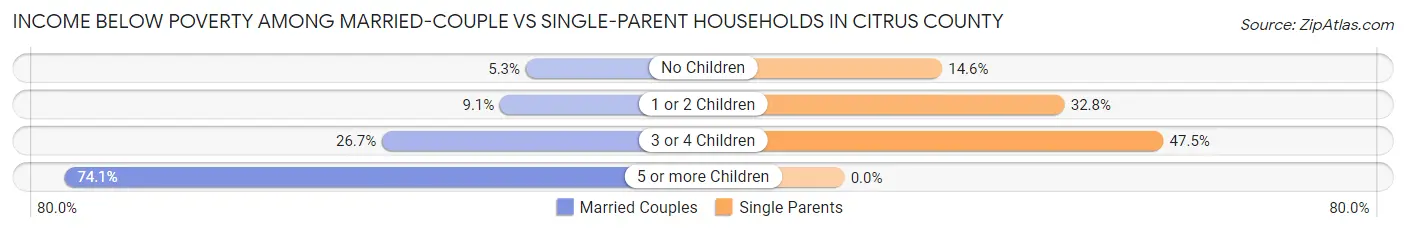
| Children | Married-Couple Families | Single-Parent Households |
| No Children | 1,463 (5.3%) | 649 (14.5%) |
| 1 or 2 Children | 489 (9.1%) | 1,234 (32.8%) |
| 3 or 4 Children | 330 (26.7%) | 231 (47.5%) |
| 5 or more Children | 40 (74.1%) | 0 (0.0%) |
| Total | 2,322 (6.8%) | 2,114 (24.3%) |
Race in Citrus County
The most populous races in Citrus County are White / Caucasian (139,269 | 89.7%), Hispanic or Latino (9,981 | 6.4%), and Two or more Races (7,717 | 5.0%).
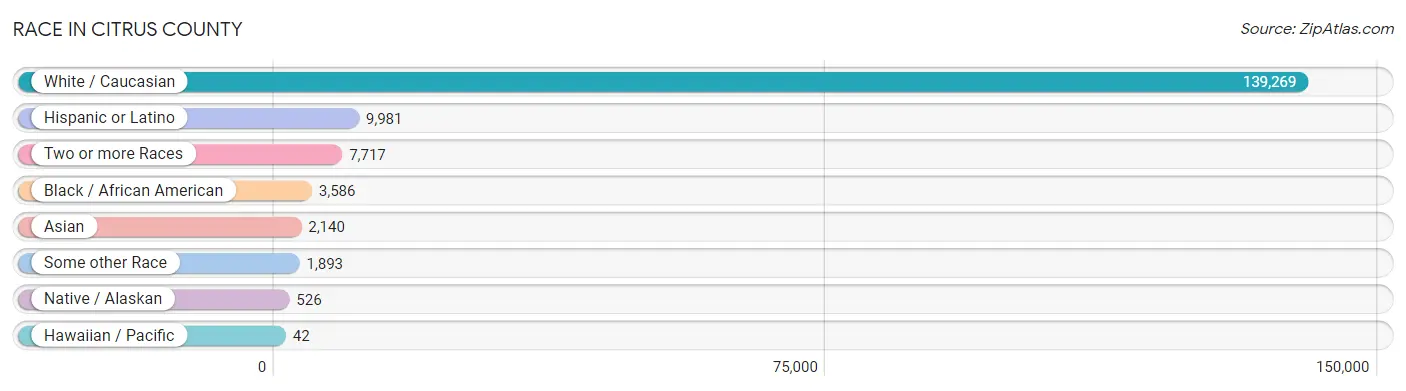
| Race | # Population | % Population |
| Asian | 2,140 | 1.4% |
| Black / African American | 3,586 | 2.3% |
| Hawaiian / Pacific | 42 | 0.0% |
| Hispanic or Latino | 9,981 | 6.4% |
| Native / Alaskan | 526 | 0.3% |
| White / Caucasian | 139,269 | 89.7% |
| Two or more Races | 7,717 | 5.0% |
| Some other Race | 1,893 | 1.2% |
| Total | 155,173 | 100.0% |
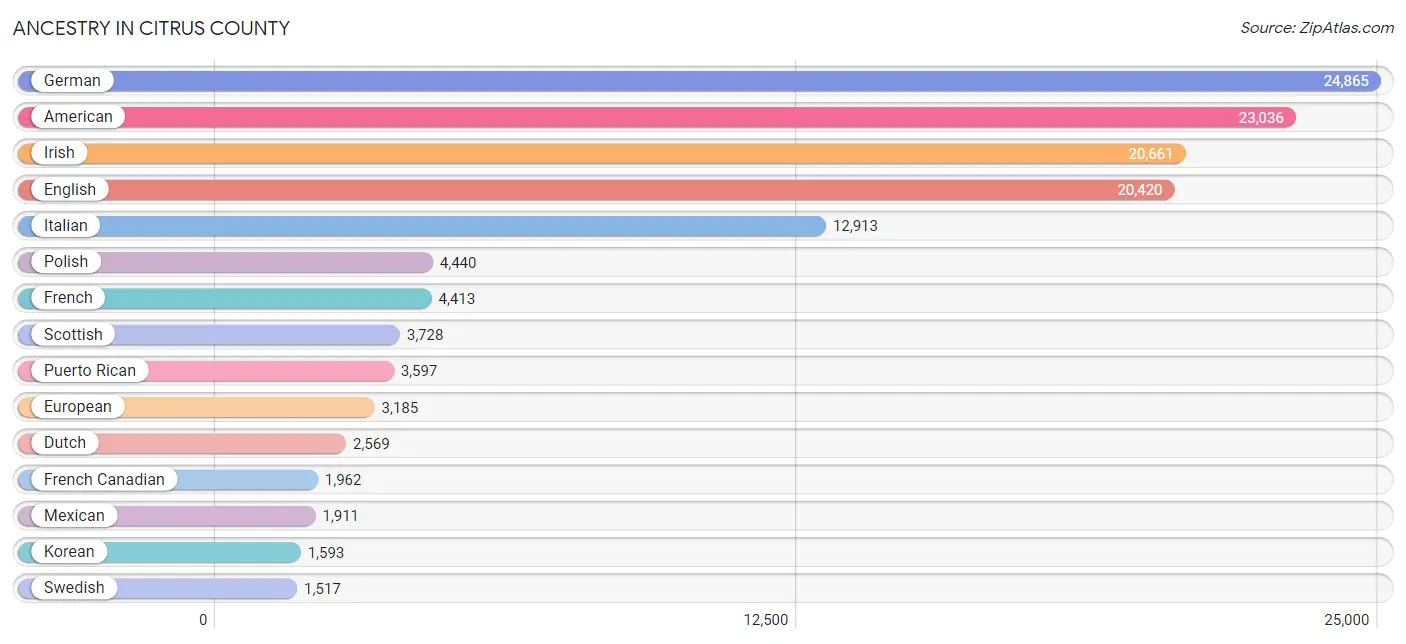
Ancestry in Citrus County
The most populous ancestries reported in Citrus County are German (24,865 | 16.0%), American (23,036 | 14.8%), Irish (20,661 | 13.3%), English (20,420 | 13.2%), and Italian (12,913 | 8.3%), together accounting for 65.7% of all Citrus County residents.
| Ancestry | # Population | % Population |
| African | 241 | 0.2% |
| Alaska Native | 47 | 0.0% |
| American | 23,036 | 14.8% |
| Apache | 18 | 0.0% |
| Arab | 592 | 0.4% |
| Argentinean | 78 | 0.1% |
| Armenian | 45 | 0.0% |
| Austrian | 260 | 0.2% |
| Bahamian | 11 | 0.0% |
| Bangladeshi | 116 | 0.1% |
| Barbadian | 13 | 0.0% |
| Basque | 37 | 0.0% |
| Belgian | 174 | 0.1% |
| Bhutanese | 800 | 0.5% |
| Blackfeet | 49 | 0.0% |
| Brazilian | 147 | 0.1% |
| British | 1,096 | 0.7% |
| British West Indian | 13 | 0.0% |
| Bulgarian | 26 | 0.0% |
| Burmese | 271 | 0.2% |
| Cajun | 18 | 0.0% |
| Canadian | 344 | 0.2% |
| Celtic | 18 | 0.0% |
| Central American | 711 | 0.5% |
| Central American Indian | 27 | 0.0% |
| Cherokee | 234 | 0.2% |
| Chickasaw | 7 | 0.0% |
| Chilean | 15 | 0.0% |
| Chippewa | 33 | 0.0% |
| Choctaw | 427 | 0.3% |
| Colombian | 257 | 0.2% |
| Costa Rican | 243 | 0.2% |
| Croatian | 137 | 0.1% |
| Cuban | 1,323 | 0.9% |
| Czech | 638 | 0.4% |
| Czechoslovakian | 147 | 0.1% |
| Danish | 408 | 0.3% |
| Delaware | 120 | 0.1% |
| Dominican | 401 | 0.3% |
| Dutch | 2,569 | 1.7% |
| Eastern European | 303 | 0.2% |
| Ecuadorian | 300 | 0.2% |
| Egyptian | 333 | 0.2% |
| English | 20,420 | 13.2% |
| Ethiopian | 19 | 0.0% |
| European | 3,185 | 2.1% |
| Finnish | 380 | 0.2% |
| French | 4,413 | 2.8% |
| French Canadian | 1,962 | 1.3% |
| German | 24,865 | 16.0% |
| Greek | 646 | 0.4% |
| Guamanian / Chamorro | 16 | 0.0% |
| Guatemalan | 73 | 0.1% |
| Guyanese | 624 | 0.4% |
| Haitian | 104 | 0.1% |
| Honduran | 215 | 0.1% |
| Hungarian | 1,014 | 0.6% |
| Icelander | 13 | 0.0% |
| Indian (Asian) | 256 | 0.2% |
| Iranian | 48 | 0.0% |
| Iraqi | 36 | 0.0% |
| Irish | 20,661 | 13.3% |
| Iroquois | 46 | 0.0% |
| Israeli | 59 | 0.0% |
| Italian | 12,913 | 8.3% |
| Jamaican | 105 | 0.1% |
| Korean | 1,593 | 1.0% |
| Latvian | 19 | 0.0% |
| Lebanese | 102 | 0.1% |
| Lithuanian | 467 | 0.3% |
| Lumbee | 45 | 0.0% |
| Luxembourger | 36 | 0.0% |
| Malaysian | 120 | 0.1% |
| Maltese | 16 | 0.0% |
| Mexican | 1,911 | 1.2% |
| Mexican American Indian | 27 | 0.0% |
| Moroccan | 18 | 0.0% |
| Native Hawaiian | 34 | 0.0% |
| Nicaraguan | 77 | 0.1% |
| Northern European | 85 | 0.1% |
| Norwegian | 1,210 | 0.8% |
| Ottawa | 19 | 0.0% |
| Pakistani | 38 | 0.0% |
| Panamanian | 71 | 0.1% |
| Paraguayan | 12 | 0.0% |
| Pennsylvania German | 162 | 0.1% |
| Peruvian | 163 | 0.1% |
| Polish | 4,440 | 2.9% |
| Portuguese | 393 | 0.3% |
| Potawatomi | 8 | 0.0% |
| Puerto Rican | 3,597 | 2.3% |
| Romanian | 193 | 0.1% |
| Russian | 1,065 | 0.7% |
| Salvadoran | 32 | 0.0% |
| Scandinavian | 173 | 0.1% |
| Scotch-Irish | 1,474 | 0.9% |
| Scottish | 3,728 | 2.4% |
| Seminole | 70 | 0.1% |
| Serbian | 64 | 0.0% |
| Sioux | 20 | 0.0% |
| Slavic | 31 | 0.0% |
| Slovak | 321 | 0.2% |
| Slovene | 62 | 0.0% |
| South African | 92 | 0.1% |
| South American | 1,004 | 0.6% |
| South American Indian | 34 | 0.0% |
| Soviet Union | 10 | 0.0% |
| Spaniard | 254 | 0.2% |
| Spanish | 119 | 0.1% |
| Sri Lankan | 213 | 0.1% |
| Subsaharan African | 422 | 0.3% |
| Swedish | 1,517 | 1.0% |
| Swiss | 213 | 0.1% |
| Syrian | 73 | 0.1% |
| Thai | 156 | 0.1% |
| Tlingit-Haida | 18 | 0.0% |
| Trinidadian and Tobagonian | 34 | 0.0% |
| Turkish | 75 | 0.1% |
| U.S. Virgin Islander | 18 | 0.0% |
| Ukrainian | 412 | 0.3% |
| Venezuelan | 147 | 0.1% |
| Welsh | 1,169 | 0.7% |
| West Indian | 89 | 0.1% | View All 123 Rows |
Immigrants in Citrus County
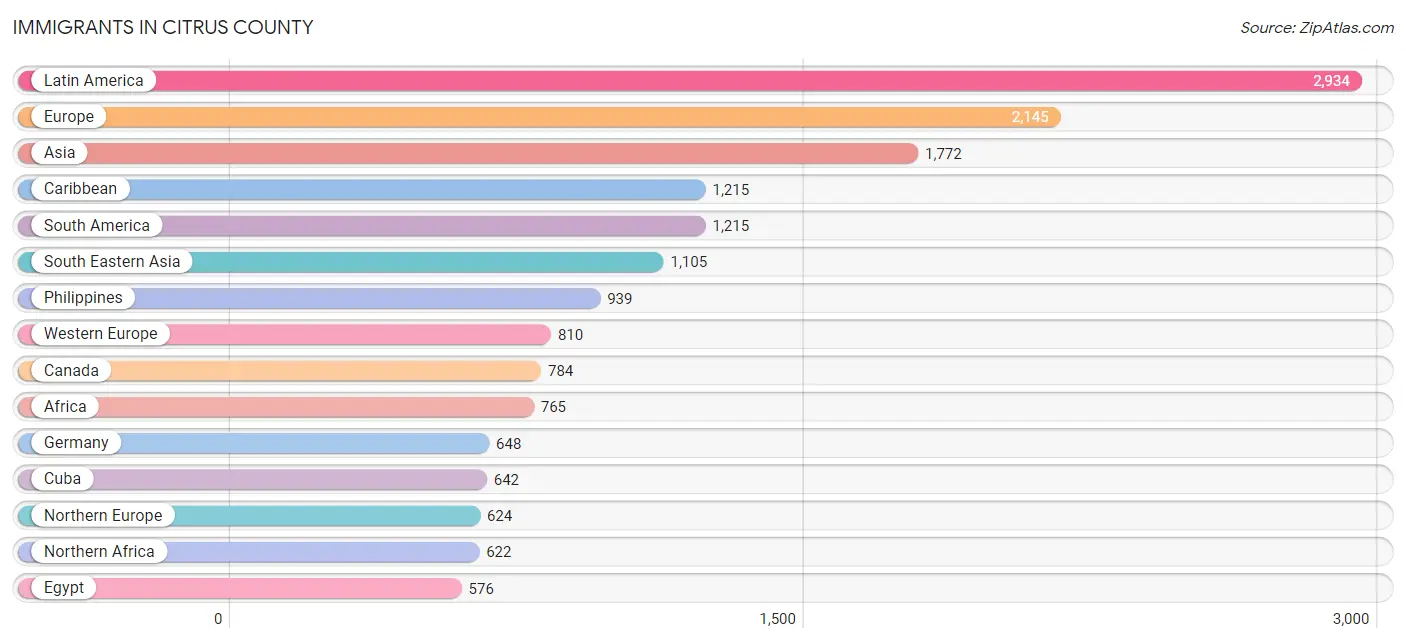
The most numerous immigrant groups reported in Citrus County came from Latin America (2,934 | 1.9%), Europe (2,145 | 1.4%), Asia (1,772 | 1.1%), Caribbean (1,215 | 0.8%), and South America (1,215 | 0.8%), together accounting for 6.0% of all Citrus County residents.
| Immigration Origin | # Population | % Population |
| Africa | 765 | 0.5% |
| Argentina | 76 | 0.1% |
| Asia | 1,772 | 1.1% |
| Barbados | 13 | 0.0% |
| Belarus | 9 | 0.0% |
| Belgium | 27 | 0.0% |
| Brazil | 193 | 0.1% |
| Canada | 784 | 0.5% |
| Caribbean | 1,215 | 0.8% |
| Central America | 504 | 0.3% |
| Chile | 20 | 0.0% |
| China | 235 | 0.2% |
| Colombia | 137 | 0.1% |
| Costa Rica | 37 | 0.0% |
| Croatia | 29 | 0.0% |
| Cuba | 642 | 0.4% |
| Czechoslovakia | 16 | 0.0% |
| Dominica | 23 | 0.0% |
| Dominican Republic | 207 | 0.1% |
| Eastern Asia | 453 | 0.3% |
| Eastern Europe | 424 | 0.3% |
| Ecuador | 205 | 0.1% |
| Egypt | 576 | 0.4% |
| El Salvador | 32 | 0.0% |
| England | 259 | 0.2% |
| Europe | 2,145 | 1.4% |
| Germany | 648 | 0.4% |
| Greece | 50 | 0.0% |
| Guatemala | 12 | 0.0% |
| Guyana | 304 | 0.2% |
| Haiti | 75 | 0.1% |
| Honduras | 87 | 0.1% |
| Hong Kong | 28 | 0.0% |
| Hungary | 21 | 0.0% |
| India | 116 | 0.1% |
| Iran | 16 | 0.0% |
| Iraq | 36 | 0.0% |
| Ireland | 17 | 0.0% |
| Israel | 9 | 0.0% |
| Italy | 150 | 0.1% |
| Jamaica | 114 | 0.1% |
| Japan | 104 | 0.1% |
| Korea | 114 | 0.1% |
| Latin America | 2,934 | 1.9% |
| Latvia | 19 | 0.0% |
| Mexico | 246 | 0.2% |
| Middle Africa | 10 | 0.0% |
| Morocco | 46 | 0.0% |
| Netherlands | 135 | 0.1% |
| Nicaragua | 38 | 0.0% |
| Northern Africa | 622 | 0.4% |
| Northern Europe | 624 | 0.4% |
| Pakistan | 37 | 0.0% |
| Panama | 52 | 0.0% |
| Peru | 99 | 0.1% |
| Philippines | 939 | 0.6% |
| Poland | 146 | 0.1% |
| Portugal | 20 | 0.0% |
| Romania | 6 | 0.0% |
| Russia | 128 | 0.1% |
| Scotland | 51 | 0.0% |
| South Africa | 124 | 0.1% |
| South America | 1,215 | 0.8% |
| South Central Asia | 169 | 0.1% |
| South Eastern Asia | 1,105 | 0.7% |
| Southern Europe | 287 | 0.2% |
| Spain | 67 | 0.0% |
| St. Vincent and the Grenadines | 14 | 0.0% |
| Taiwan | 12 | 0.0% |
| Thailand | 35 | 0.0% |
| Trinidad and Tobago | 94 | 0.1% |
| Ukraine | 19 | 0.0% |
| Venezuela | 117 | 0.1% |
| Vietnam | 131 | 0.1% |
| West Indies | 7 | 0.0% |
| Western Asia | 45 | 0.0% |
| Western Europe | 810 | 0.5% |
| Zaire | 10 | 0.0% | View All 78 Rows |
Sex and Age in Citrus County
Sex and Age in Citrus County
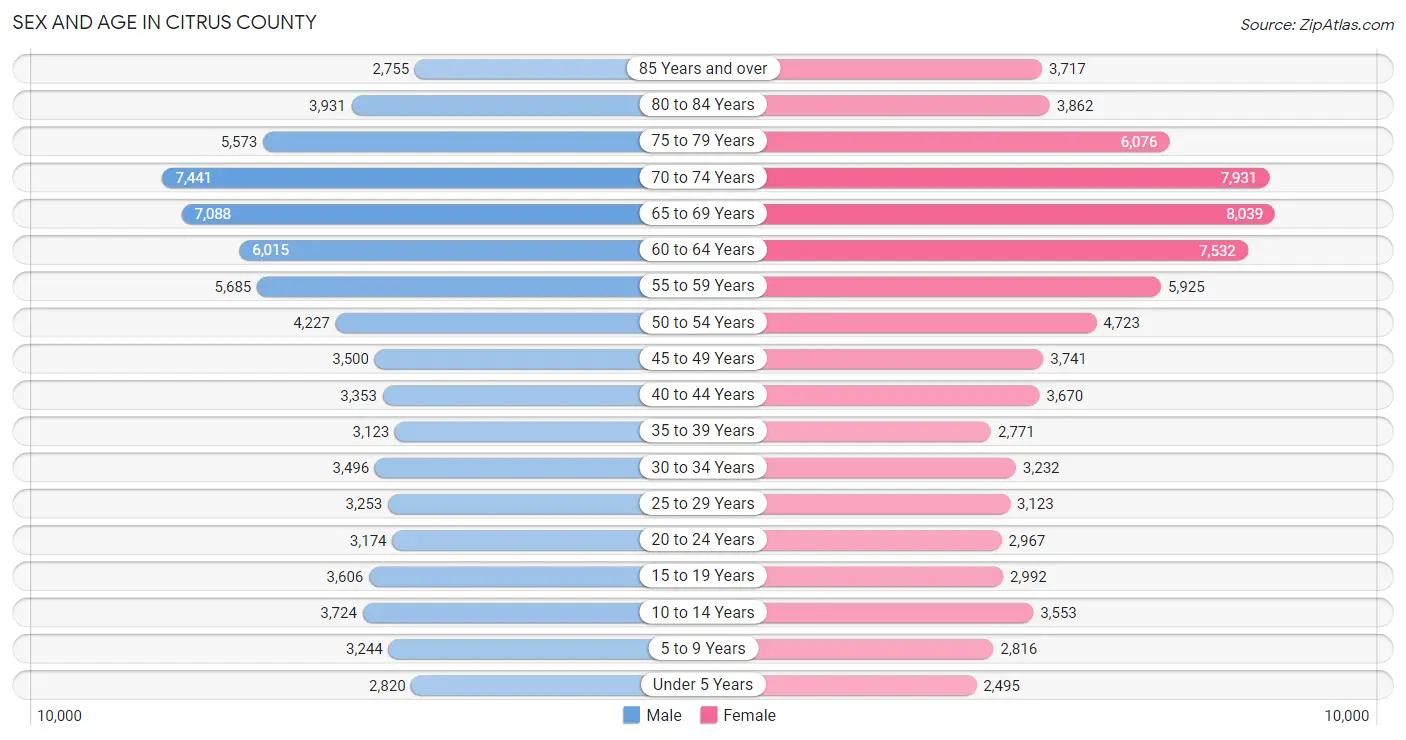
The most populous age groups in Citrus County are 70 to 74 Years (7,441 | 9.8%) for men and 65 to 69 Years (8,039 | 10.2%) for women.
| Age Bracket | Male | Female |
| Under 5 Years | 2,820 (3.7%) | 2,495 (3.2%) |
| 5 to 9 Years | 3,244 (4.3%) | 2,816 (3.6%) |
| 10 to 14 Years | 3,724 (4.9%) | 3,553 (4.5%) |
| 15 to 19 Years | 3,606 (4.7%) | 2,992 (3.8%) |
| 20 to 24 Years | 3,174 (4.2%) | 2,967 (3.7%) |
| 25 to 29 Years | 3,253 (4.3%) | 3,123 (3.9%) |
| 30 to 34 Years | 3,496 (4.6%) | 3,232 (4.1%) |
| 35 to 39 Years | 3,123 (4.1%) | 2,771 (3.5%) |
| 40 to 44 Years | 3,353 (4.4%) | 3,670 (4.6%) |
| 45 to 49 Years | 3,500 (4.6%) | 3,741 (4.7%) |
| 50 to 54 Years | 4,227 (5.6%) | 4,723 (6.0%) |
| 55 to 59 Years | 5,685 (7.5%) | 5,925 (7.5%) |
| 60 to 64 Years | 6,015 (7.9%) | 7,532 (9.5%) |
| 65 to 69 Years | 7,088 (9.3%) | 8,039 (10.2%) |
| 70 to 74 Years | 7,441 (9.8%) | 7,931 (10.0%) |
| 75 to 79 Years | 5,573 (7.3%) | 6,076 (7.7%) |
| 80 to 84 Years | 3,931 (5.2%) | 3,862 (4.9%) |
| 85 Years and over | 2,755 (3.6%) | 3,717 (4.7%) |
| Total | 76,008 (100.0%) | 79,165 (100.0%) |
Families and Households in Citrus County
Median Family Size in Citrus County
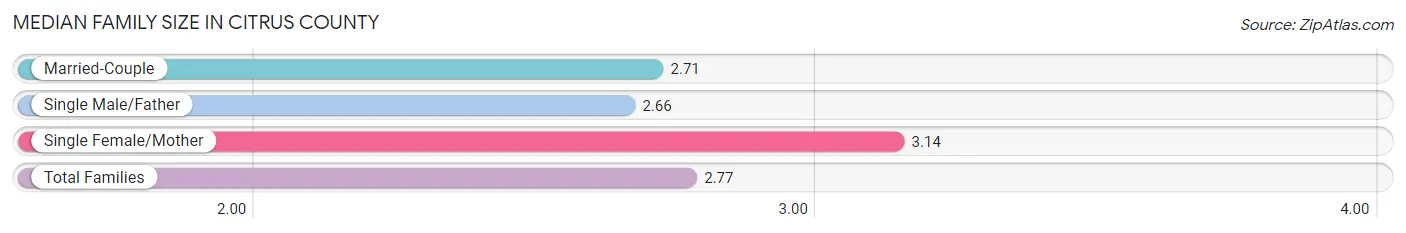
The median family size in Citrus County is 2.77 persons per family, with single female/mother families (6,249 | 14.6%) accounting for the largest median family size of 3.14 persons per family. On the other hand, single male/father families (2,460 | 5.7%) represent the smallest median family size with 2.66 persons per family.
| Family Type | # Families | Family Size |
| Married-Couple | 34,180 (79.7%) | 2.71 |
| Single Male/Father | 2,460 (5.7%) | 2.66 |
| Single Female/Mother | 6,249 (14.6%) | 3.14 |
| Total Families | 42,889 (100.0%) | 2.77 |
Median Household Size in Citrus County
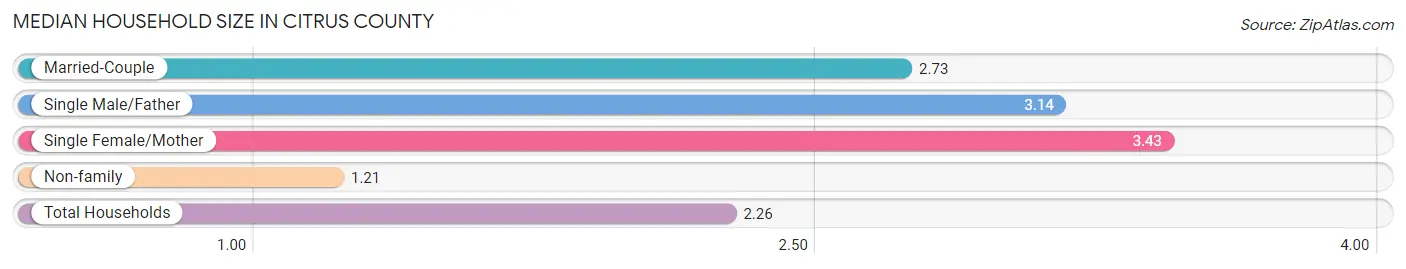
The median household size in Citrus County is 2.26 persons per household, with single female/mother households (6,249 | 9.2%) accounting for the largest median household size of 3.43 persons per household. non-family households (24,662 | 36.5%) represent the smallest median household size with 1.21 persons per household.
| Household Type | # Households | Household Size |
| Married-Couple | 34,180 (50.6%) | 2.73 |
| Single Male/Father | 2,460 (3.6%) | 3.14 |
| Single Female/Mother | 6,249 (9.2%) | 3.43 |
| Non-family | 24,662 (36.5%) | 1.21 |
| Total Households | 67,551 (100.0%) | 2.26 |
Household Size by Marriage Status in Citrus County
Out of a total of 67,551 households in Citrus County, 42,889 (63.5%) are family households, while 24,662 (36.5%) are nonfamily households. The most numerous type of family households are 2-person households, comprising 26,271, and the most common type of nonfamily households are 1-person households, comprising 20,572.
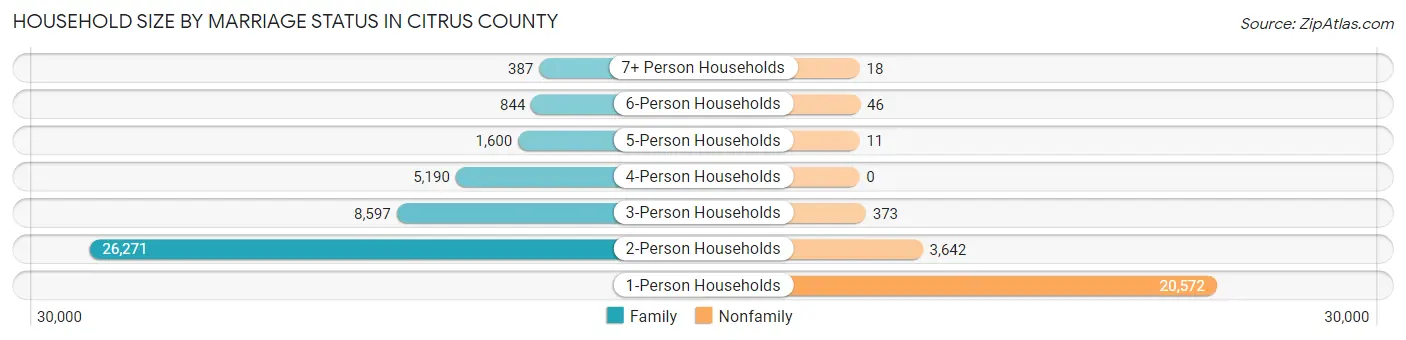
| Household Size | Family Households | Nonfamily Households |
| 1-Person Households | - | 20,572 (30.4%) |
| 2-Person Households | 26,271 (38.9%) | 3,642 (5.4%) |
| 3-Person Households | 8,597 (12.7%) | 373 (0.5%) |
| 4-Person Households | 5,190 (7.7%) | 0 (0.0%) |
| 5-Person Households | 1,600 (2.4%) | 11 (0.0%) |
| 6-Person Households | 844 (1.3%) | 46 (0.1%) |
| 7+ Person Households | 387 (0.6%) | 18 (0.0%) |
| Total | 42,889 (63.5%) | 24,662 (36.5%) |
Female Fertility in Citrus County
Fertility by Age in Citrus County
Average fertility rate in Citrus County is 44.0 births per 1,000 women. Women in the age bracket of 20 to 34 years have the highest fertility rate with 81.0 births per 1,000 women. Women in the age bracket of 20 to 34 years acount for 74.1% of all women with births.
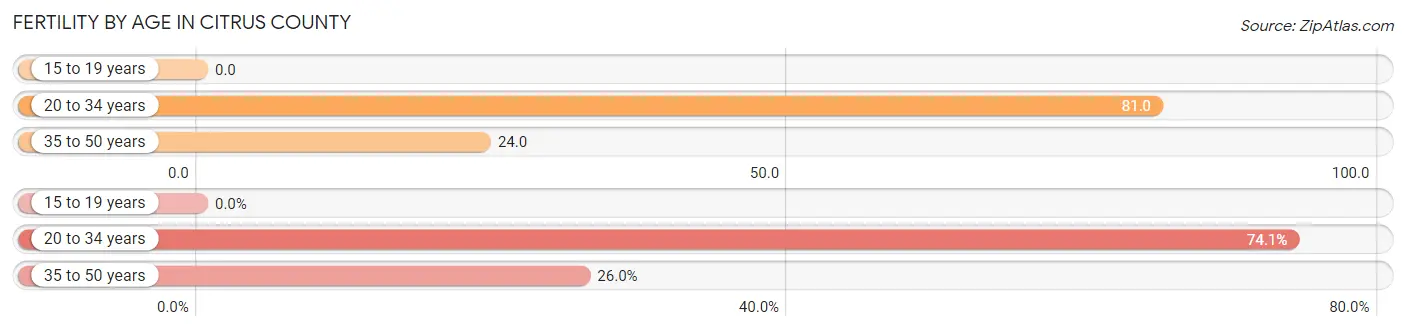
| Age Bracket | Women with Births | Births / 1,000 Women |
| 15 to 19 years | 0 (0.0%) | 0.0 |
| 20 to 34 years | 759 (74.1%) | 81.0 |
| 35 to 50 years | 266 (26.0%) | 24.0 |
| Total | 1,025 (100.0%) | 44.0 |
Fertility by Age by Marriage Status in Citrus County
69.5% of women with births (1,025) in Citrus County are married. The highest percentage of unmarried women with births falls into 35 to 50 years age bracket with 49.2% of them unmarried at the time of birth, while the lowest percentage of unmarried women with births belong to 20 to 34 years age bracket with 24.0% of them unmarried.
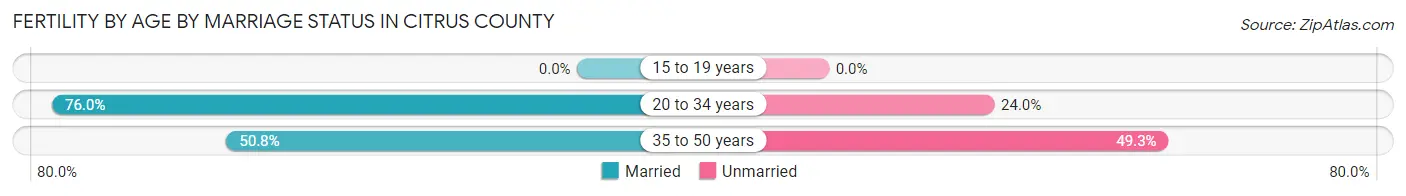
| Age Bracket | Married | Unmarried |
| 15 to 19 years | 0 (0.0%) | 0 (0.0%) |
| 20 to 34 years | 577 (76.0%) | 182 (24.0%) |
| 35 to 50 years | 135 (50.7%) | 131 (49.2%) |
| Total | 712 (69.5%) | 313 (30.5%) |
Fertility by Education in Citrus County
Average fertility rate in Citrus County is 44.0 births per 1,000 women. Women with the education attainment of bachelor's degree have the highest fertility rate of 102.0 births per 1,000 women, while women with the education attainment of less than high school have the lowest fertility at 16.0 births per 1,000 women. Women with the education attainment of bachelor's degree represent 29.8% of all women with births.
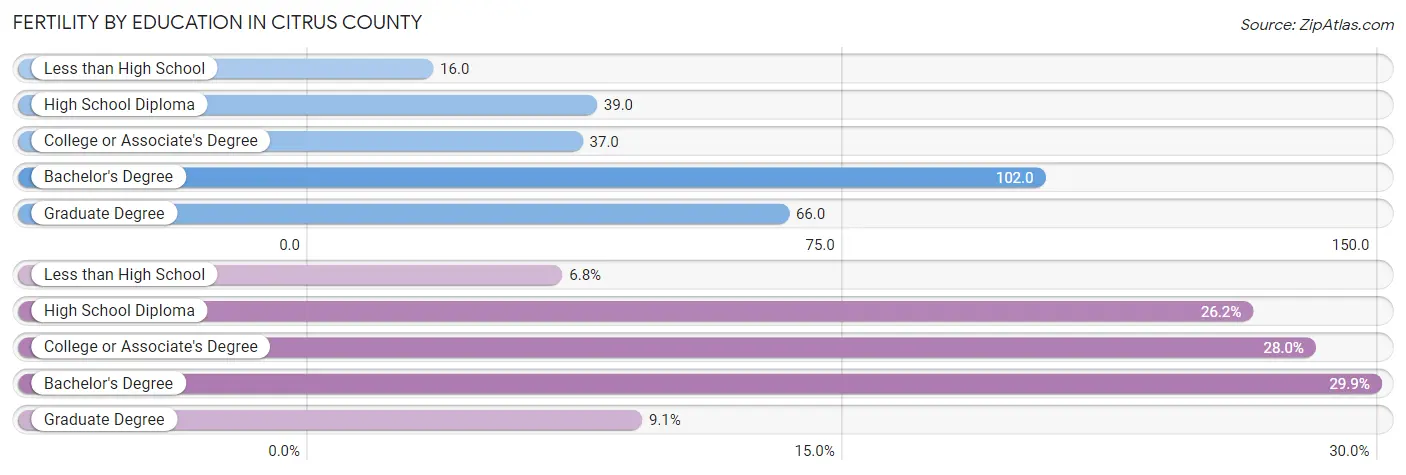
| Educational Attainment | Women with Births | Births / 1,000 Women |
| Less than High School | 70 (6.8%) | 16.0 |
| High School Diploma | 269 (26.2%) | 39.0 |
| College or Associate's Degree | 287 (28.0%) | 37.0 |
| Bachelor's Degree | 306 (29.8%) | 102.0 |
| Graduate Degree | 93 (9.1%) | 66.0 |
| Total | 1,025 (100.0%) | 44.0 |
Fertility by Education by Marriage Status in Citrus County
30.5% of women with births in Citrus County are unmarried. Women with the educational attainment of college or associate's degree are most likely to be married with 89.9% of them married at childbirth, while women with the educational attainment of graduate degree are least likely to be married with 61.3% of them unmarried at childbirth.
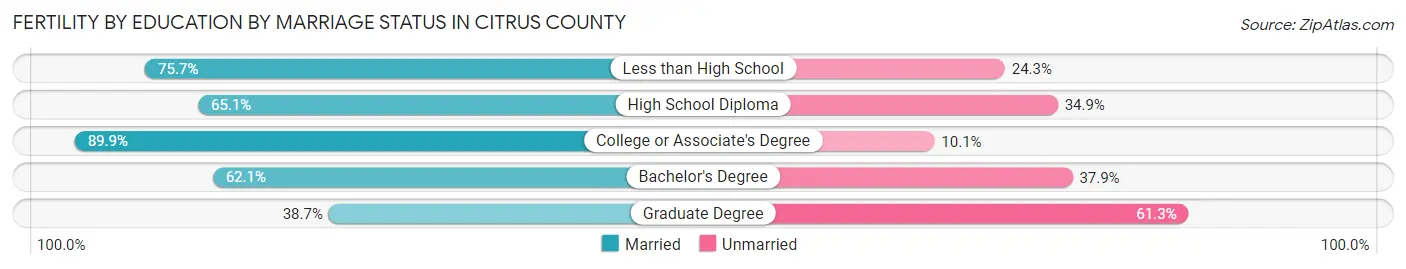
| Educational Attainment | Married | Unmarried |
| Less than High School | 53 (75.7%) | 17 (24.3%) |
| High School Diploma | 175 (65.1%) | 94 (34.9%) |
| College or Associate's Degree | 258 (89.9%) | 29 (10.1%) |
| Bachelor's Degree | 190 (62.1%) | 116 (37.9%) |
| Graduate Degree | 36 (38.7%) | 57 (61.3%) |
| Total | 712 (69.5%) | 313 (30.5%) |
Employment Characteristics in Citrus County
Employment by Class of Employer in Citrus County
Among the 48,459 employed individuals in Citrus County, private company employees (34,166 | 70.5%), local government employees (3,902 | 8.1%), and self-employed (not incorporated) (3,051 | 6.3%) make up the most common classes of employment.
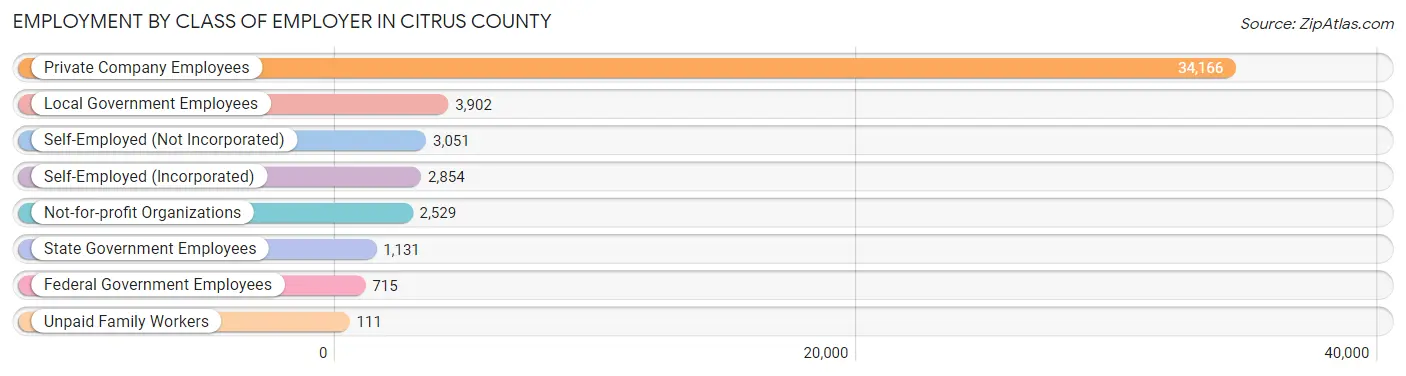
| Employer Class | # Employees | % Employees |
| Private Company Employees | 34,166 | 70.5% |
| Self-Employed (Incorporated) | 2,854 | 5.9% |
| Self-Employed (Not Incorporated) | 3,051 | 6.3% |
| Not-for-profit Organizations | 2,529 | 5.2% |
| Local Government Employees | 3,902 | 8.1% |
| State Government Employees | 1,131 | 2.3% |
| Federal Government Employees | 715 | 1.5% |
| Unpaid Family Workers | 111 | 0.2% |
| Total | 48,459 | 100.0% |
Employment Status by Age in Citrus County
According to the labor force statistics for Citrus County, out of the total population over 16 years of age (135,149), 39.4% or 53,249 individuals are in the labor force, with 7.2% or 3,834 of them unemployed. The age group with the highest labor force participation rate is 35 to 44 years, with 76.4% or 9,869 individuals in the labor force. Within the labor force, the 16 to 19 years age range has the highest percentage of unemployed individuals, with 13.0% or 270 of them being unemployed.
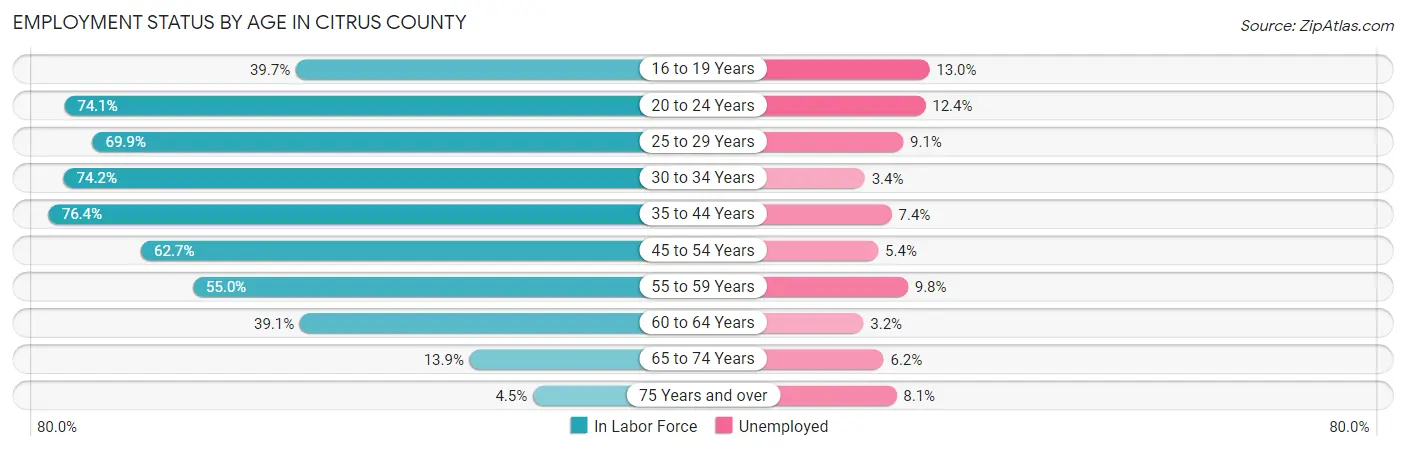
| Age Bracket | In Labor Force | Unemployed |
| 16 to 19 Years | 2,075 (39.7%) | 270 (13.0%) |
| 20 to 24 Years | 4,550 (74.1%) | 564 (12.4%) |
| 25 to 29 Years | 4,457 (69.9%) | 406 (9.1%) |
| 30 to 34 Years | 4,992 (74.2%) | 170 (3.4%) |
| 35 to 44 Years | 9,869 (76.4%) | 730 (7.4%) |
| 45 to 54 Years | 10,152 (62.7%) | 548 (5.4%) |
| 55 to 59 Years | 6,386 (55.0%) | 626 (9.8%) |
| 60 to 64 Years | 5,297 (39.1%) | 170 (3.2%) |
| 65 to 74 Years | 4,239 (13.9%) | 263 (6.2%) |
| 75 Years and over | 1,166 (4.5%) | 94 (8.1%) |
| Total | 53,249 (39.4%) | 3,834 (7.2%) |
Employment Status by Educational Attainment in Citrus County
According to labor force statistics for Citrus County, 61.1% of individuals (41,162) out of the total population between 25 and 64 years of age (67,369) are in the labor force, with 6.4% or 2,634 of them being unemployed. The group with the highest labor force participation rate are those with the educational attainment of bachelor's degree or higher, with 71.2% or 8,814 individuals in the labor force. Within the labor force, individuals with less than high school education have the highest percentage of unemployment, with 13.8% or 451 of them being unemployed.
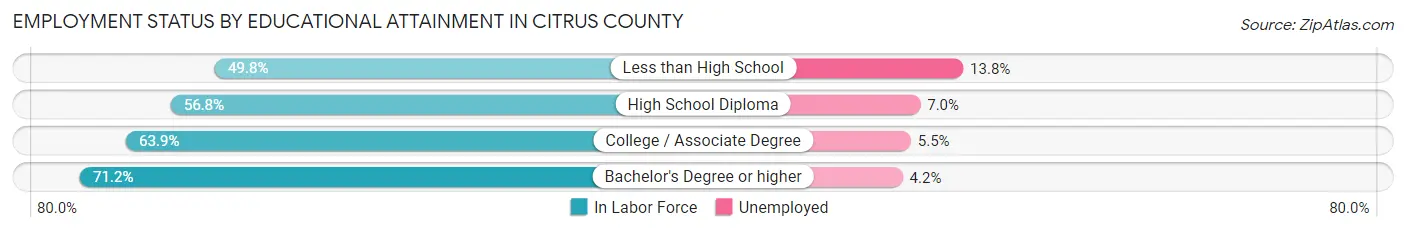
| Educational Attainment | In Labor Force | Unemployed |
| Less than High School | 3,271 (49.8%) | 907 (13.8%) |
| High School Diploma | 15,018 (56.8%) | 1,851 (7.0%) |
| College / Associate Degree | 14,045 (63.9%) | 1,209 (5.5%) |
| Bachelor's Degree or higher | 8,814 (71.2%) | 520 (4.2%) |
| Total | 41,162 (61.1%) | 4,312 (6.4%) |
Employment Occupations by Sex in Citrus County
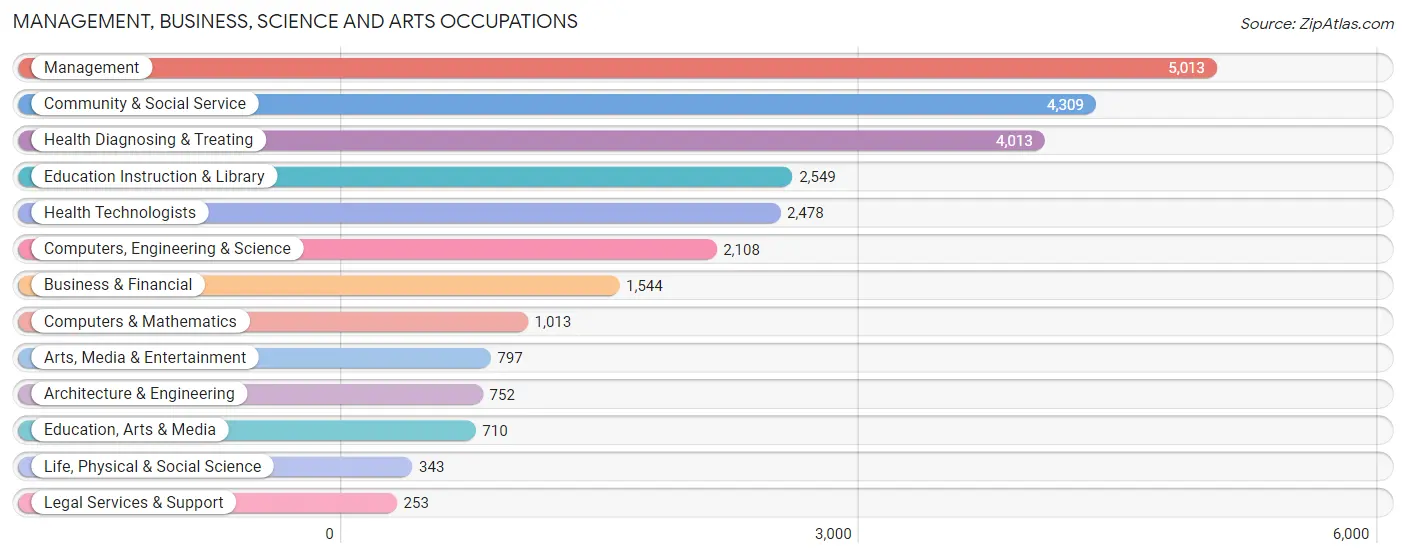
Management, Business, Science and Arts Occupations
The most common Management, Business, Science and Arts occupations in Citrus County are Management (5,013 | 10.2%), Community & Social Service (4,309 | 8.7%), Health Diagnosing & Treating (4,013 | 8.1%), Education Instruction & Library (2,549 | 5.2%), and Health Technologists (2,478 | 5.0%).
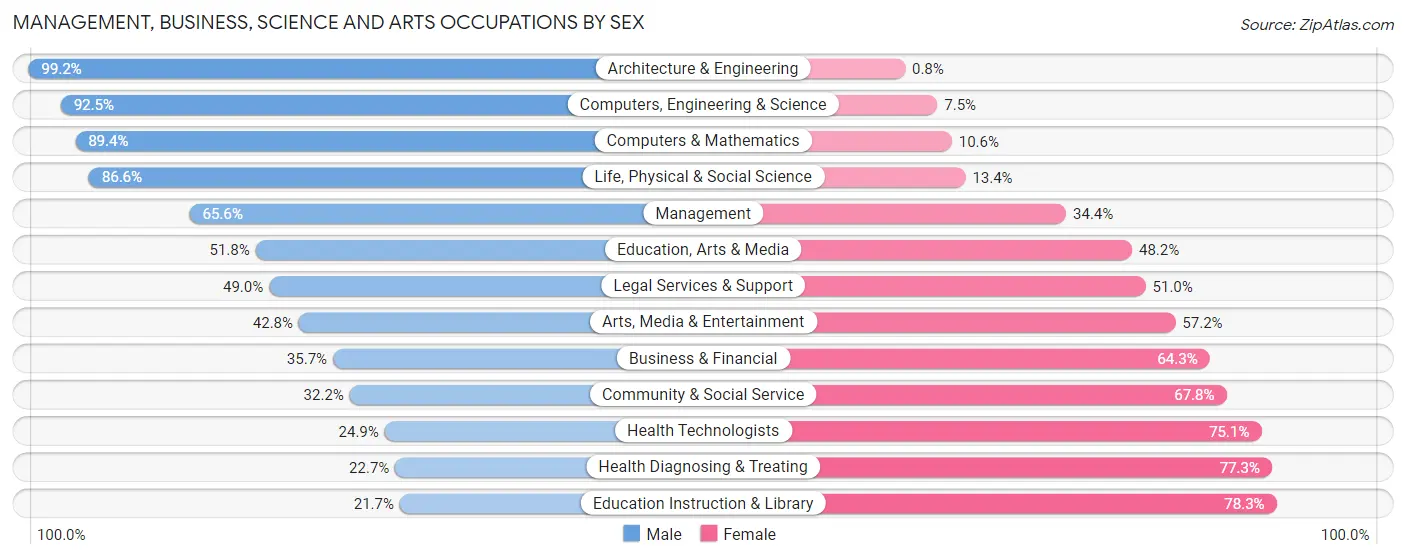
Management, Business, Science and Arts Occupations by Sex
Within the Management, Business, Science and Arts occupations in Citrus County, the most male-oriented occupations are Architecture & Engineering (99.2%), Computers, Engineering & Science (92.5%), and Computers & Mathematics (89.4%), while the most female-oriented occupations are Education Instruction & Library (78.3%), Health Diagnosing & Treating (77.3%), and Health Technologists (75.1%).
| Occupation | Male | Female |
| Management | 3,288 (65.6%) | 1,725 (34.4%) |
| Business & Financial | 551 (35.7%) | 993 (64.3%) |
| Computers, Engineering & Science | 1,949 (92.5%) | 159 (7.5%) |
| Computers & Mathematics | 906 (89.4%) | 107 (10.6%) |
| Architecture & Engineering | 746 (99.2%) | 6 (0.8%) |
| Life, Physical & Social Science | 297 (86.6%) | 46 (13.4%) |
| Community & Social Service | 1,387 (32.2%) | 2,922 (67.8%) |
| Education, Arts & Media | 368 (51.8%) | 342 (48.2%) |
| Legal Services & Support | 124 (49.0%) | 129 (51.0%) |
| Education Instruction & Library | 554 (21.7%) | 1,995 (78.3%) |
| Arts, Media & Entertainment | 341 (42.8%) | 456 (57.2%) |
| Health Diagnosing & Treating | 911 (22.7%) | 3,102 (77.3%) |
| Health Technologists | 617 (24.9%) | 1,861 (75.1%) |
| Total (Category) | 8,086 (47.6%) | 8,901 (52.4%) |
| Total (Overall) | 25,679 (52.1%) | 23,636 (47.9%) |
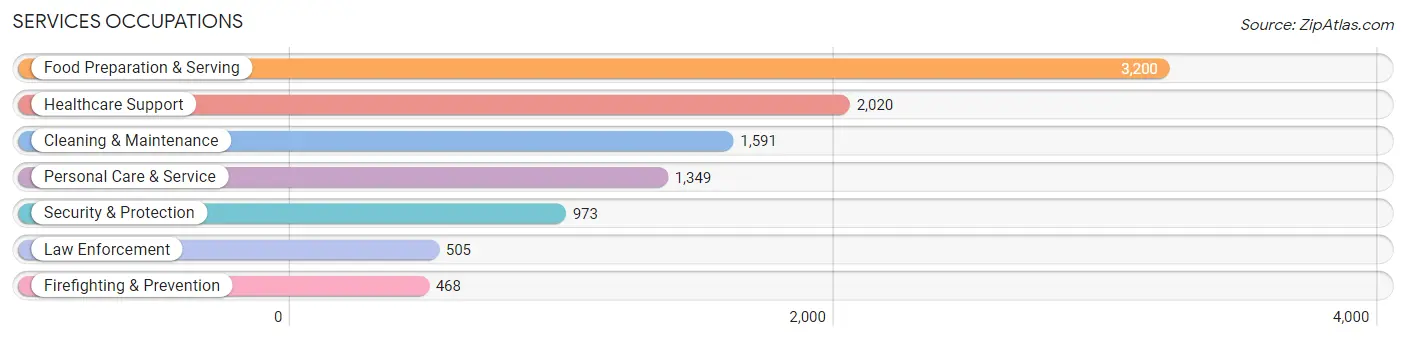
Services Occupations
The most common Services occupations in Citrus County are Food Preparation & Serving (3,200 | 6.5%), Healthcare Support (2,020 | 4.1%), Cleaning & Maintenance (1,591 | 3.2%), Personal Care & Service (1,349 | 2.7%), and Security & Protection (973 | 2.0%).
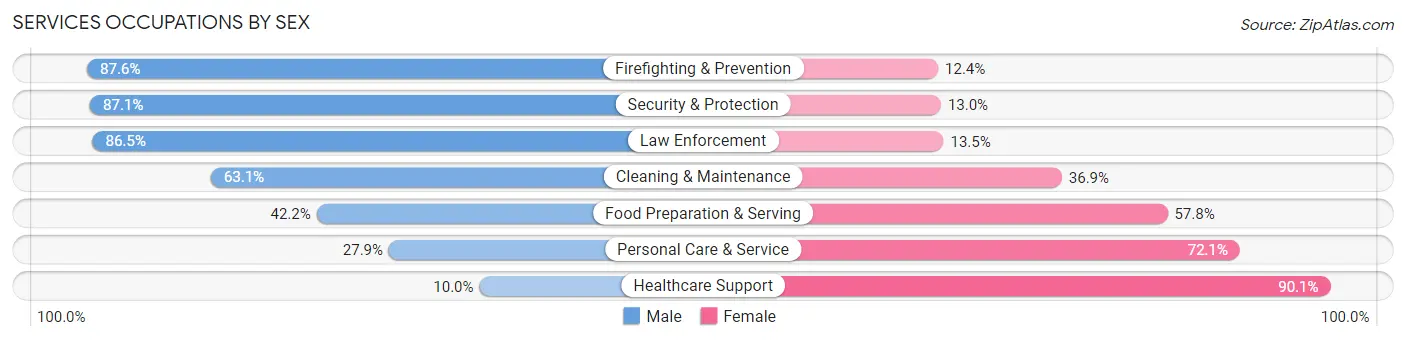
Services Occupations by Sex
Within the Services occupations in Citrus County, the most male-oriented occupations are Firefighting & Prevention (87.6%), Security & Protection (87.1%), and Law Enforcement (86.5%), while the most female-oriented occupations are Healthcare Support (90.0%), Personal Care & Service (72.1%), and Food Preparation & Serving (57.8%).
| Occupation | Male | Female |
| Healthcare Support | 201 (10.0%) | 1,819 (90.0%) |
| Security & Protection | 847 (87.1%) | 126 (13.0%) |
| Firefighting & Prevention | 410 (87.6%) | 58 (12.4%) |
| Law Enforcement | 437 (86.5%) | 68 (13.5%) |
| Food Preparation & Serving | 1,350 (42.2%) | 1,850 (57.8%) |
| Cleaning & Maintenance | 1,004 (63.1%) | 587 (36.9%) |
| Personal Care & Service | 376 (27.9%) | 973 (72.1%) |
| Total (Category) | 3,778 (41.4%) | 5,355 (58.6%) |
| Total (Overall) | 25,679 (52.1%) | 23,636 (47.9%) |
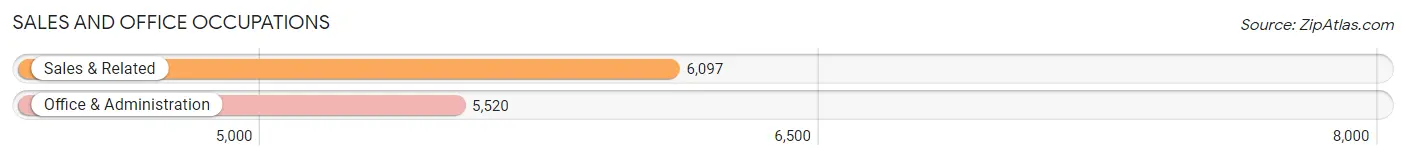
Sales and Office Occupations
The most common Sales and Office occupations in Citrus County are Sales & Related (6,097 | 12.4%), and Office & Administration (5,520 | 11.2%).
Sales and Office Occupations by Sex
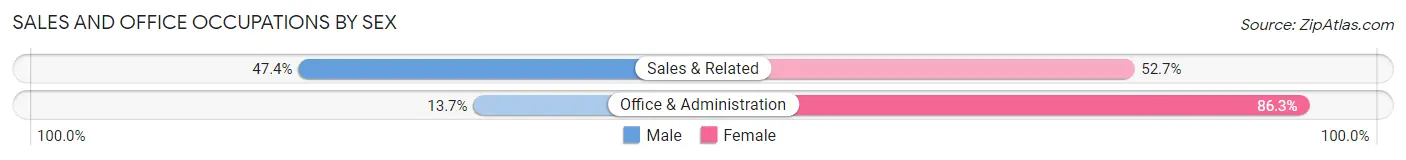
| Occupation | Male | Female |
| Sales & Related | 2,887 (47.3%) | 3,210 (52.6%) |
| Office & Administration | 756 (13.7%) | 4,764 (86.3%) |
| Total (Category) | 3,643 (31.4%) | 7,974 (68.6%) |
| Total (Overall) | 25,679 (52.1%) | 23,636 (47.9%) |
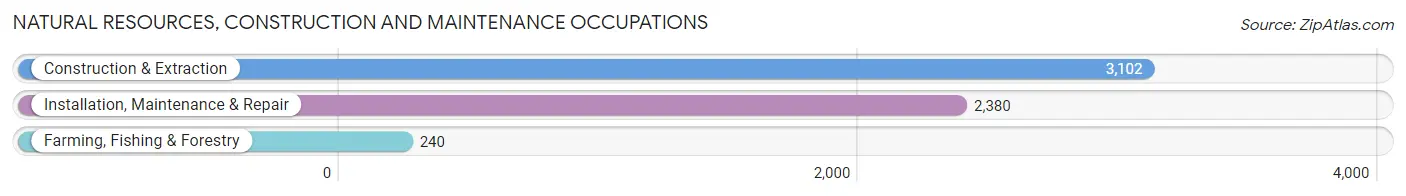
Natural Resources, Construction and Maintenance Occupations
The most common Natural Resources, Construction and Maintenance occupations in Citrus County are Construction & Extraction (3,102 | 6.3%), Installation, Maintenance & Repair (2,380 | 4.8%), and Farming, Fishing & Forestry (240 | 0.5%).
Natural Resources, Construction and Maintenance Occupations by Sex
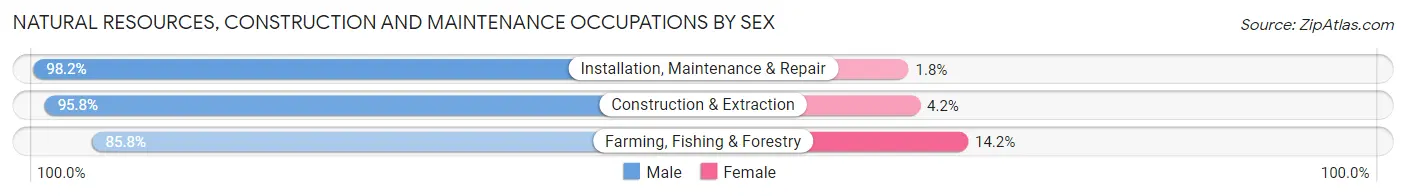
| Occupation | Male | Female |
| Farming, Fishing & Forestry | 206 (85.8%) | 34 (14.2%) |
| Construction & Extraction | 2,972 (95.8%) | 130 (4.2%) |
| Installation, Maintenance & Repair | 2,337 (98.2%) | 43 (1.8%) |
| Total (Category) | 5,515 (96.4%) | 207 (3.6%) |
| Total (Overall) | 25,679 (52.1%) | 23,636 (47.9%) |
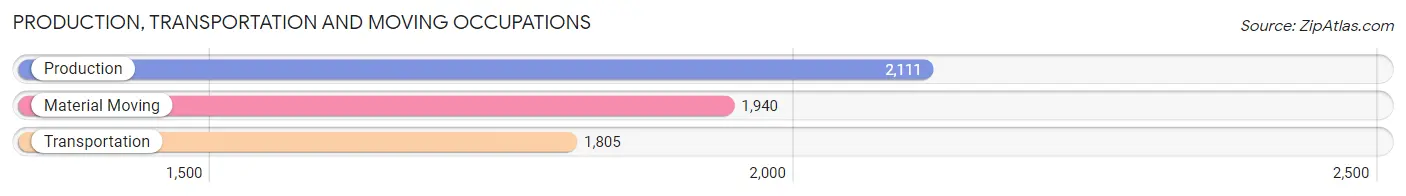
Production, Transportation and Moving Occupations
The most common Production, Transportation and Moving occupations in Citrus County are Production (2,111 | 4.3%), Material Moving (1,940 | 3.9%), and Transportation (1,805 | 3.7%).
Production, Transportation and Moving Occupations by Sex
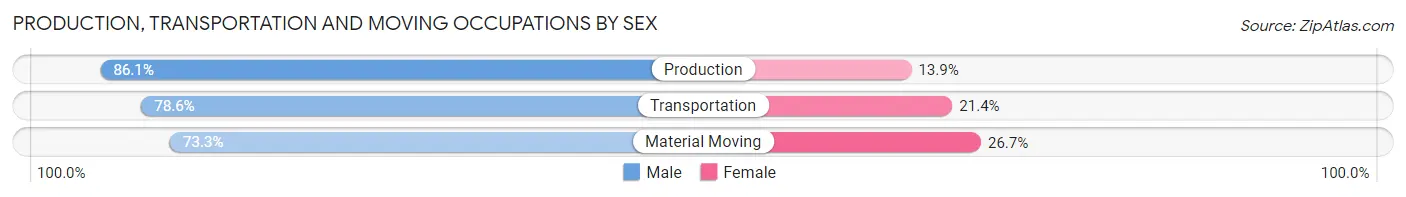
| Occupation | Male | Female |
| Production | 1,817 (86.1%) | 294 (13.9%) |
| Transportation | 1,418 (78.6%) | 387 (21.4%) |
| Material Moving | 1,422 (73.3%) | 518 (26.7%) |
| Total (Category) | 4,657 (79.5%) | 1,199 (20.5%) |
| Total (Overall) | 25,679 (52.1%) | 23,636 (47.9%) |
Employment Industries by Sex in Citrus County
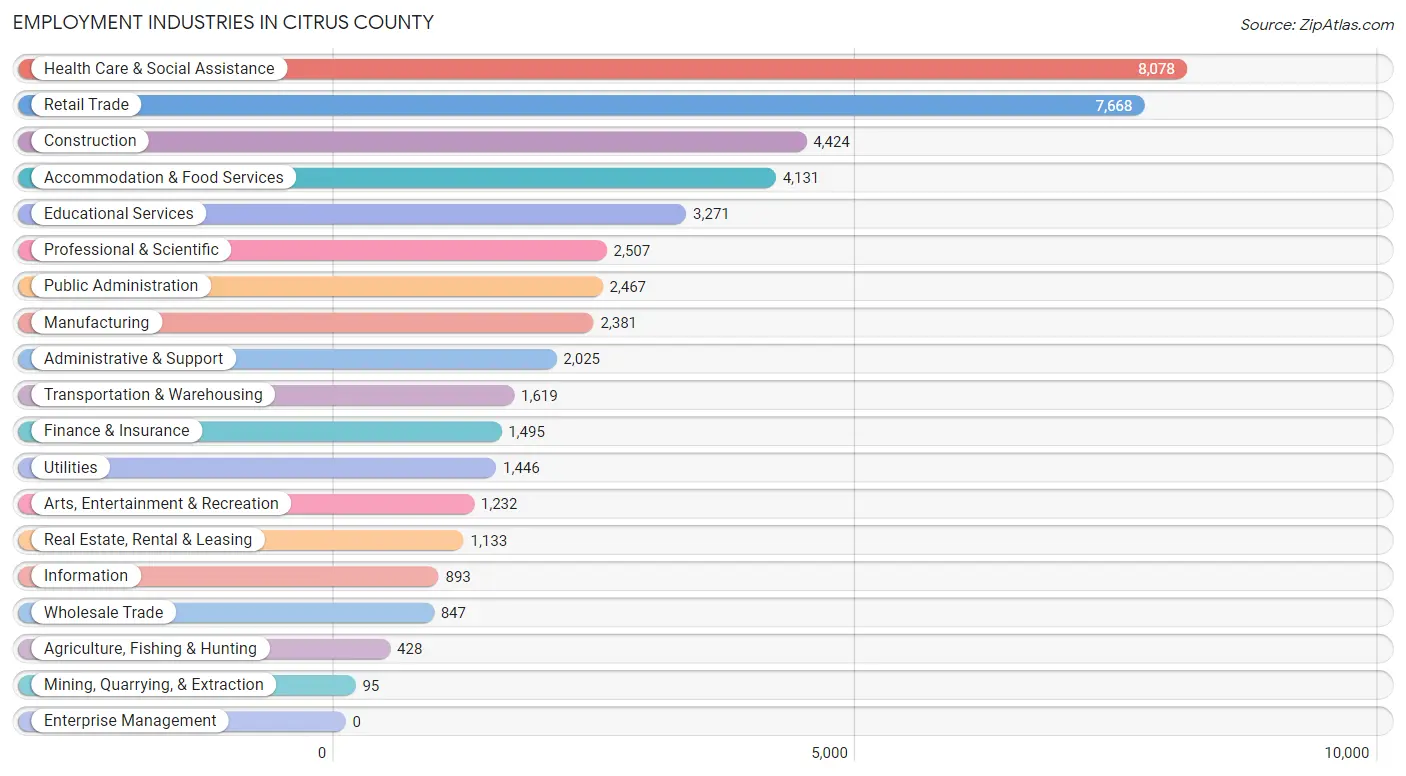
Employment Industries in Citrus County
The major employment industries in Citrus County include Health Care & Social Assistance (8,078 | 16.4%), Retail Trade (7,668 | 15.5%), Construction (4,424 | 9.0%), Accommodation & Food Services (4,131 | 8.4%), and Educational Services (3,271 | 6.6%).
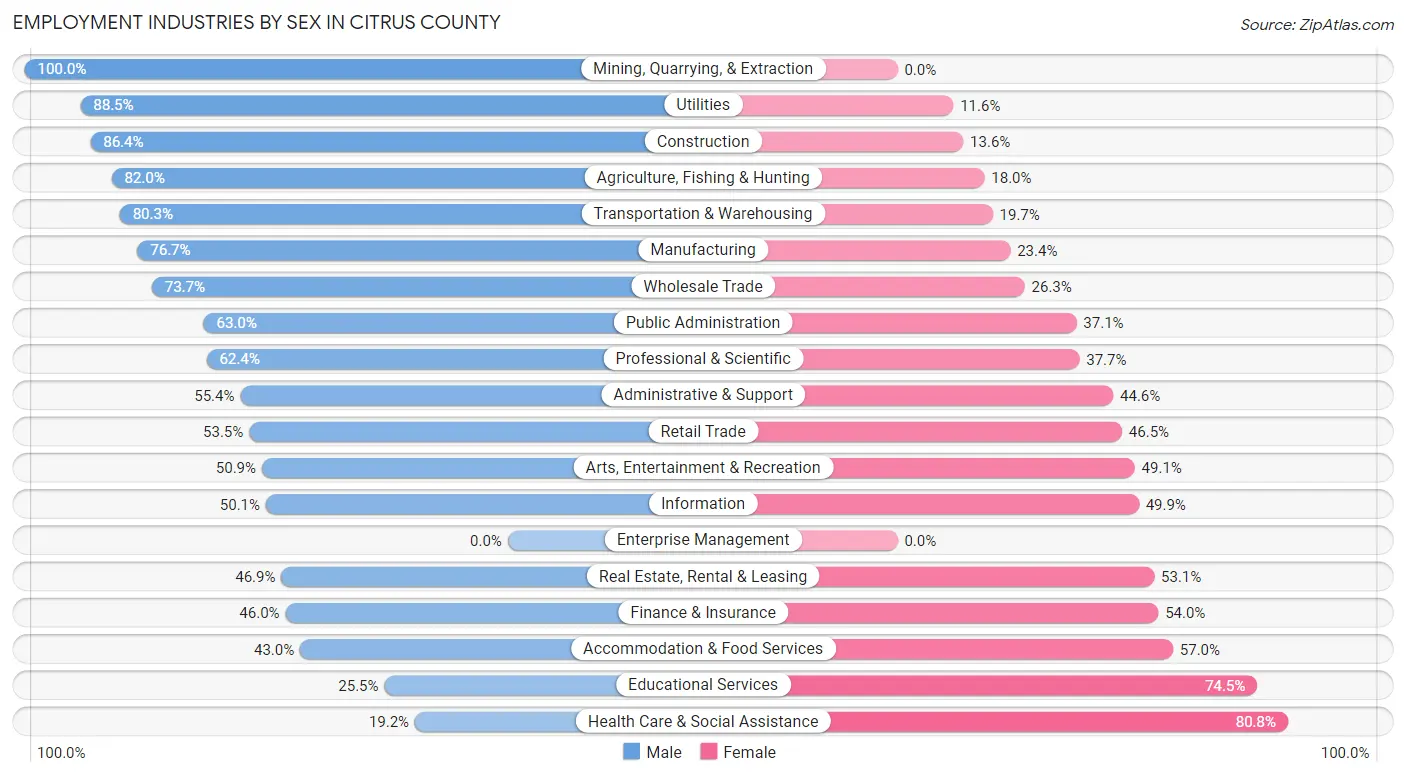
Employment Industries by Sex in Citrus County
The Citrus County industries that see more men than women are Mining, Quarrying, & Extraction (100.0%), Utilities (88.4%), and Construction (86.4%), whereas the industries that tend to have a higher number of women are Health Care & Social Assistance (80.8%), Educational Services (74.5%), and Accommodation & Food Services (57.0%).
| Industry | Male | Female |
| Agriculture, Fishing & Hunting | 351 (82.0%) | 77 (18.0%) |
| Mining, Quarrying, & Extraction | 95 (100.0%) | 0 (0.0%) |
| Construction | 3,822 (86.4%) | 602 (13.6%) |
| Manufacturing | 1,825 (76.6%) | 556 (23.4%) |
| Wholesale Trade | 624 (73.7%) | 223 (26.3%) |
| Retail Trade | 4,105 (53.5%) | 3,563 (46.5%) |
| Transportation & Warehousing | 1,300 (80.3%) | 319 (19.7%) |
| Utilities | 1,279 (88.4%) | 167 (11.6%) |
| Information | 447 (50.1%) | 446 (49.9%) |
| Finance & Insurance | 688 (46.0%) | 807 (54.0%) |
| Real Estate, Rental & Leasing | 531 (46.9%) | 602 (53.1%) |
| Professional & Scientific | 1,563 (62.4%) | 944 (37.7%) |
| Enterprise Management | 0 (0.0%) | 0 (0.0%) |
| Administrative & Support | 1,121 (55.4%) | 904 (44.6%) |
| Educational Services | 835 (25.5%) | 2,436 (74.5%) |
| Health Care & Social Assistance | 1,551 (19.2%) | 6,527 (80.8%) |
| Arts, Entertainment & Recreation | 627 (50.9%) | 605 (49.1%) |
| Accommodation & Food Services | 1,776 (43.0%) | 2,355 (57.0%) |
| Public Administration | 1,553 (62.9%) | 914 (37.0%) |
| Total | 25,679 (52.1%) | 23,636 (47.9%) |
Education in Citrus County
School Enrollment in Citrus County
The most common levels of schooling among the 23,624 students in Citrus County are high school (6,018 | 25.5%), middle school (5,599 | 23.7%), and elementary school (5,204 | 22.0%).
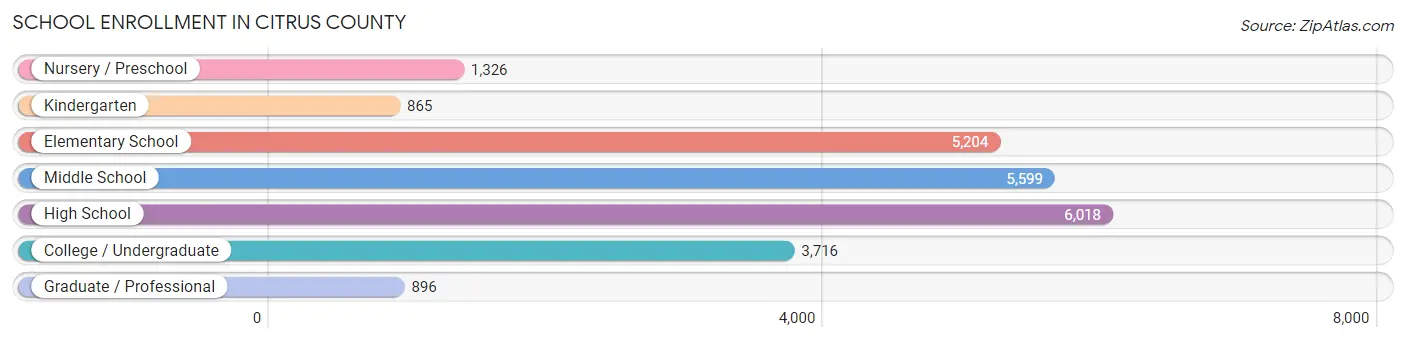
| School Level | # Students | % Students |
| Nursery / Preschool | 1,326 | 5.6% |
| Kindergarten | 865 | 3.7% |
| Elementary School | 5,204 | 22.0% |
| Middle School | 5,599 | 23.7% |
| High School | 6,018 | 25.5% |
| College / Undergraduate | 3,716 | 15.7% |
| Graduate / Professional | 896 | 3.8% |
| Total | 23,624 | 100.0% |
School Enrollment by Age by Funding Source in Citrus County
Out of a total of 23,624 students who are enrolled in schools in Citrus County, 4,252 (18.0%) attend a private institution, while the remaining 19,372 (82.0%) are enrolled in public schools. The age group of 25 to 34 year olds has the highest likelihood of being enrolled in private schools, with 553 (46.0% in the age bracket) enrolled. Conversely, the age group of 18 to 19 year olds has the lowest likelihood of being enrolled in a private school, with 1,491 (91.1% in the age bracket) attending a public institution.
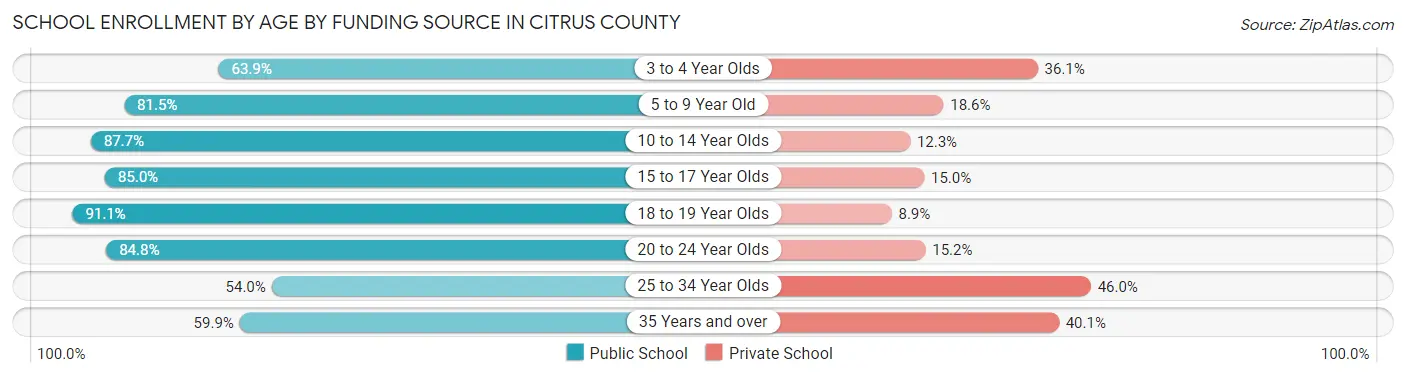
| Age Bracket | Public School | Private School |
| 3 to 4 Year Olds | 573 (63.9%) | 324 (36.1%) |
| 5 to 9 Year Old | 4,676 (81.5%) | 1,065 (18.5%) |
| 10 to 14 Year Olds | 6,146 (87.7%) | 865 (12.3%) |
| 15 to 17 Year Olds | 3,476 (85.0%) | 612 (15.0%) |
| 18 to 19 Year Olds | 1,491 (91.1%) | 146 (8.9%) |
| 20 to 24 Year Olds | 1,795 (84.8%) | 322 (15.2%) |
| 25 to 34 Year Olds | 649 (54.0%) | 553 (46.0%) |
| 35 Years and over | 558 (59.9%) | 373 (40.1%) |
| Total | 19,372 (82.0%) | 4,252 (18.0%) |
Educational Attainment by Field of Study in Citrus County
Business (4,902 | 18.9%), education (4,724 | 18.2%), science & technology (2,961 | 11.4%), bio, nature & agricultural (1,811 | 7.0%), and engineering (1,720 | 6.6%) are the most common fields of study among 25,923 individuals in Citrus County who have obtained a bachelor's degree or higher.
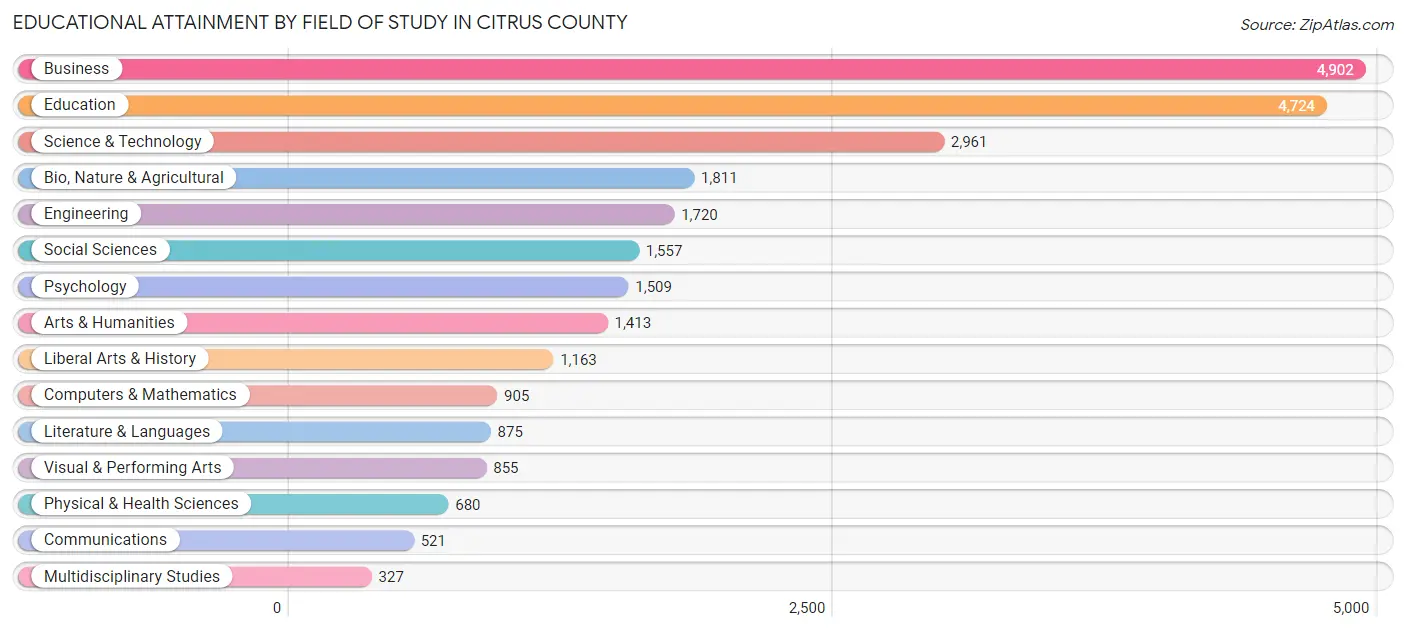
| Field of Study | # Graduates | % Graduates |
| Computers & Mathematics | 905 | 3.5% |
| Bio, Nature & Agricultural | 1,811 | 7.0% |
| Physical & Health Sciences | 680 | 2.6% |
| Psychology | 1,509 | 5.8% |
| Social Sciences | 1,557 | 6.0% |
| Engineering | 1,720 | 6.6% |
| Multidisciplinary Studies | 327 | 1.3% |
| Science & Technology | 2,961 | 11.4% |
| Business | 4,902 | 18.9% |
| Education | 4,724 | 18.2% |
| Literature & Languages | 875 | 3.4% |
| Liberal Arts & History | 1,163 | 4.5% |
| Visual & Performing Arts | 855 | 3.3% |
| Communications | 521 | 2.0% |
| Arts & Humanities | 1,413 | 5.4% |
| Total | 25,923 | 100.0% |
Transportation & Commute in Citrus County
Vehicle Availability by Sex in Citrus County
The most prevalent vehicle ownership categories in Citrus County are males with 2 vehicles (10,610, accounting for 42.0%) and females with 2 vehicles (9,752, making up 45.9%).
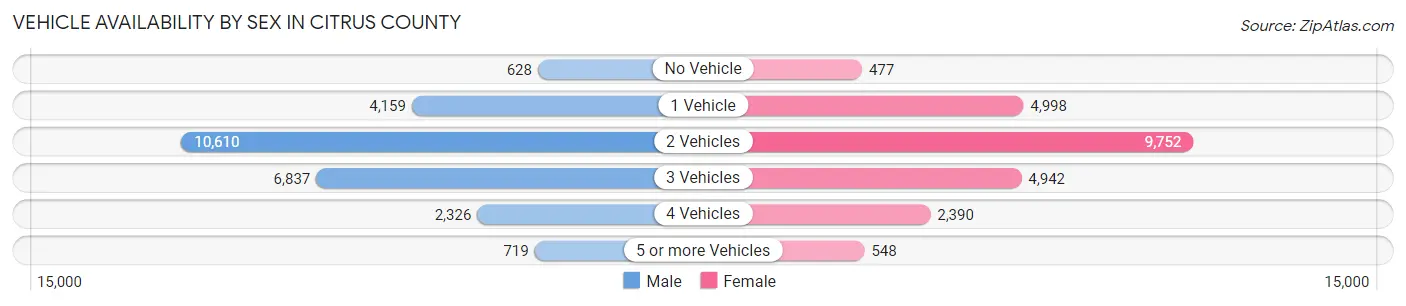
| Vehicles Available | Male | Female |
| No Vehicle | 628 (2.5%) | 477 (2.1%) |
| 1 Vehicle | 4,159 (16.5%) | 4,998 (21.6%) |
| 2 Vehicles | 10,610 (42.0%) | 9,752 (42.2%) |
| 3 Vehicles | 6,837 (27.1%) | 4,942 (21.4%) |
| 4 Vehicles | 2,326 (9.2%) | 2,390 (10.3%) |
| 5 or more Vehicles | 719 (2.8%) | 548 (2.4%) |
| Total | 25,279 (100.0%) | 23,107 (100.0%) |
Commute Time in Citrus County
The most frequently occuring commute durations in Citrus County are 15 to 19 minutes (6,850 commuters, 15.9%), 20 to 24 minutes (5,887 commuters, 13.7%), and 10 to 14 minutes (5,850 commuters, 13.6%).
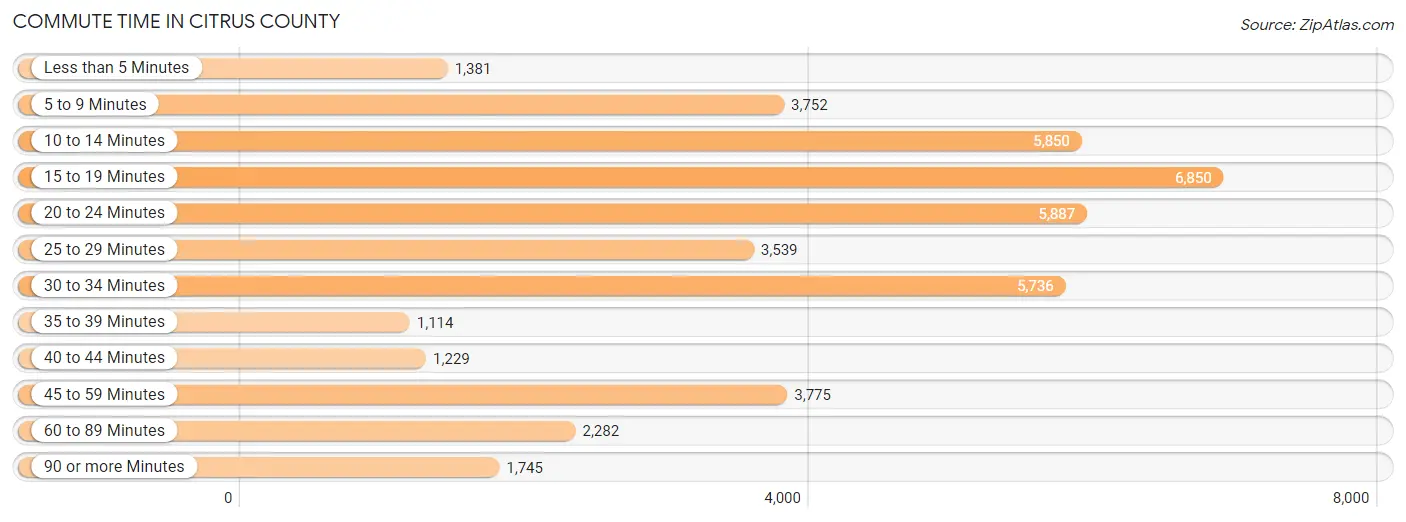
| Commute Time | # Commuters | % Commuters |
| Less than 5 Minutes | 1,381 | 3.2% |
| 5 to 9 Minutes | 3,752 | 8.7% |
| 10 to 14 Minutes | 5,850 | 13.6% |
| 15 to 19 Minutes | 6,850 | 15.9% |
| 20 to 24 Minutes | 5,887 | 13.7% |
| 25 to 29 Minutes | 3,539 | 8.2% |
| 30 to 34 Minutes | 5,736 | 13.3% |
| 35 to 39 Minutes | 1,114 | 2.6% |
| 40 to 44 Minutes | 1,229 | 2.9% |
| 45 to 59 Minutes | 3,775 | 8.7% |
| 60 to 89 Minutes | 2,282 | 5.3% |
| 90 or more Minutes | 1,745 | 4.0% |
Commute Time by Sex in Citrus County
The most common commute times in Citrus County are 15 to 19 minutes (3,439 commuters, 15.1%) for males and 15 to 19 minutes (3,411 commuters, 16.8%) for females.
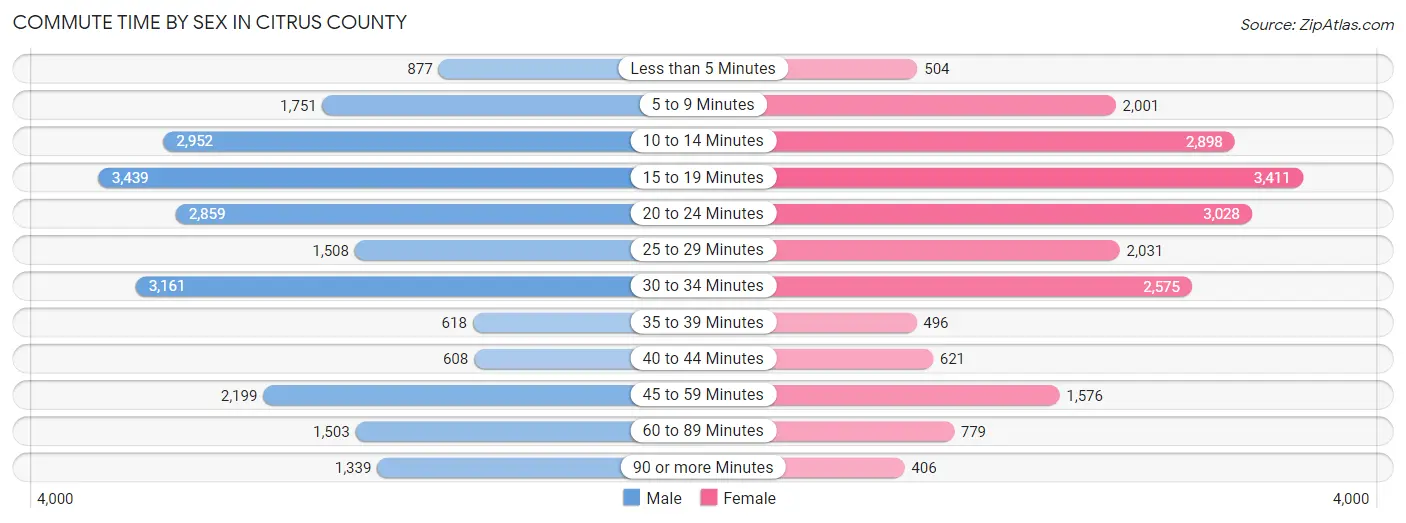
| Commute Time | Male | Female |
| Less than 5 Minutes | 877 (3.8%) | 504 (2.5%) |
| 5 to 9 Minutes | 1,751 (7.7%) | 2,001 (9.8%) |
| 10 to 14 Minutes | 2,952 (12.9%) | 2,898 (14.3%) |
| 15 to 19 Minutes | 3,439 (15.1%) | 3,411 (16.8%) |
| 20 to 24 Minutes | 2,859 (12.5%) | 3,028 (14.9%) |
| 25 to 29 Minutes | 1,508 (6.6%) | 2,031 (10.0%) |
| 30 to 34 Minutes | 3,161 (13.9%) | 2,575 (12.7%) |
| 35 to 39 Minutes | 618 (2.7%) | 496 (2.4%) |
| 40 to 44 Minutes | 608 (2.7%) | 621 (3.1%) |
| 45 to 59 Minutes | 2,199 (9.6%) | 1,576 (7.7%) |
| 60 to 89 Minutes | 1,503 (6.6%) | 779 (3.8%) |
| 90 or more Minutes | 1,339 (5.9%) | 406 (2.0%) |
Time of Departure to Work by Sex in Citrus County
The most frequent times of departure to work in Citrus County are 7:00 AM to 7:29 AM (4,130, 18.1%) for males and 7:00 AM to 7:29 AM (2,818, 13.9%) for females.
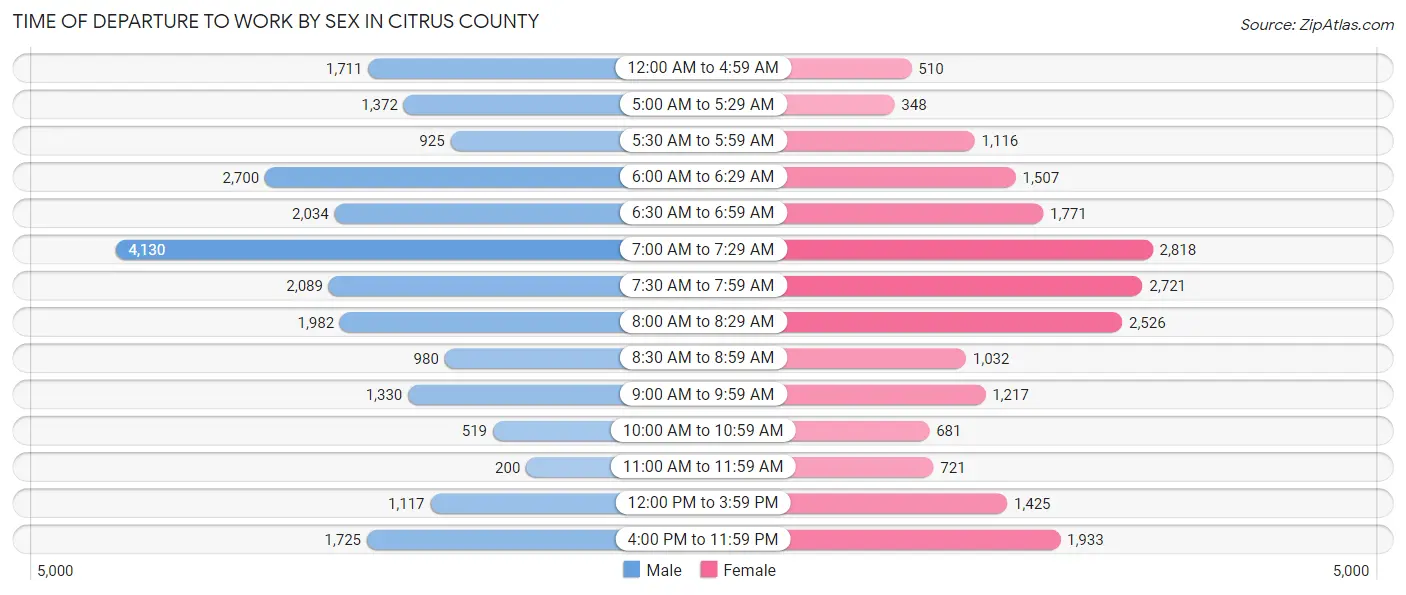
| Time of Departure | Male | Female |
| 12:00 AM to 4:59 AM | 1,711 (7.5%) | 510 (2.5%) |
| 5:00 AM to 5:29 AM | 1,372 (6.0%) | 348 (1.7%) |
| 5:30 AM to 5:59 AM | 925 (4.1%) | 1,116 (5.5%) |
| 6:00 AM to 6:29 AM | 2,700 (11.8%) | 1,507 (7.4%) |
| 6:30 AM to 6:59 AM | 2,034 (8.9%) | 1,771 (8.7%) |
| 7:00 AM to 7:29 AM | 4,130 (18.1%) | 2,818 (13.9%) |
| 7:30 AM to 7:59 AM | 2,089 (9.2%) | 2,721 (13.4%) |
| 8:00 AM to 8:29 AM | 1,982 (8.7%) | 2,526 (12.4%) |
| 8:30 AM to 8:59 AM | 980 (4.3%) | 1,032 (5.1%) |
| 9:00 AM to 9:59 AM | 1,330 (5.8%) | 1,217 (6.0%) |
| 10:00 AM to 10:59 AM | 519 (2.3%) | 681 (3.4%) |
| 11:00 AM to 11:59 AM | 200 (0.9%) | 721 (3.5%) |
| 12:00 PM to 3:59 PM | 1,117 (4.9%) | 1,425 (7.0%) |
| 4:00 PM to 11:59 PM | 1,725 (7.6%) | 1,933 (9.5%) |
| Total | 22,814 (100.0%) | 20,326 (100.0%) |
Housing Occupancy in Citrus County
Occupancy by Ownership in Citrus County
Of the total 67,551 dwellings in Citrus County, owner-occupied units account for 57,661 (85.4%), while renter-occupied units make up 9,890 (14.6%).
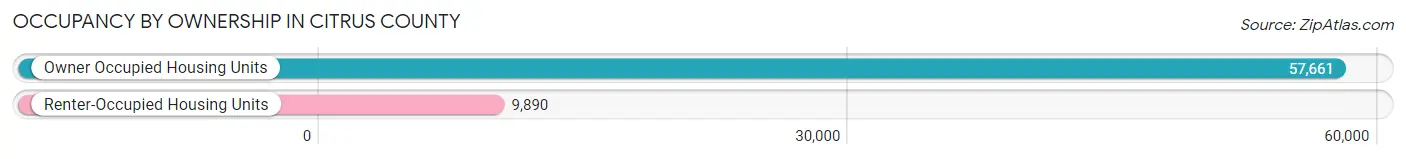
| Occupancy | # Housing Units | % Housing Units |
| Owner Occupied Housing Units | 57,661 | 85.4% |
| Renter-Occupied Housing Units | 9,890 | 14.6% |
| Total Occupied Housing Units | 67,551 | 100.0% |
Occupancy by Household Size in Citrus County
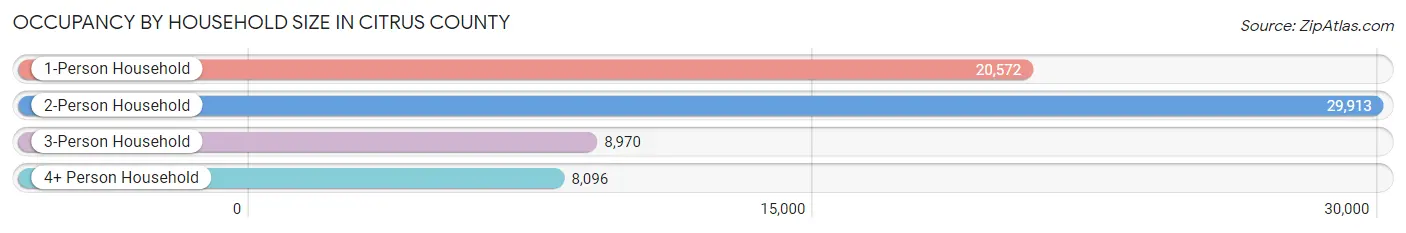
| Household Size | # Housing Units | % Housing Units |
| 1-Person Household | 20,572 | 30.4% |
| 2-Person Household | 29,913 | 44.3% |
| 3-Person Household | 8,970 | 13.3% |
| 4+ Person Household | 8,096 | 12.0% |
| Total Housing Units | 67,551 | 100.0% |
Occupancy by Ownership by Household Size in Citrus County
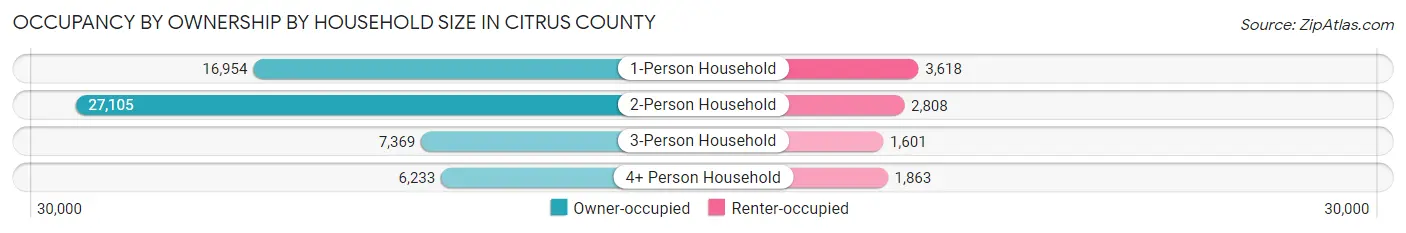
| Household Size | Owner-occupied | Renter-occupied |
| 1-Person Household | 16,954 (82.4%) | 3,618 (17.6%) |
| 2-Person Household | 27,105 (90.6%) | 2,808 (9.4%) |
| 3-Person Household | 7,369 (82.2%) | 1,601 (17.8%) |
| 4+ Person Household | 6,233 (77.0%) | 1,863 (23.0%) |
| Total Housing Units | 57,661 (85.4%) | 9,890 (14.6%) |
Occupancy by Educational Attainment in Citrus County
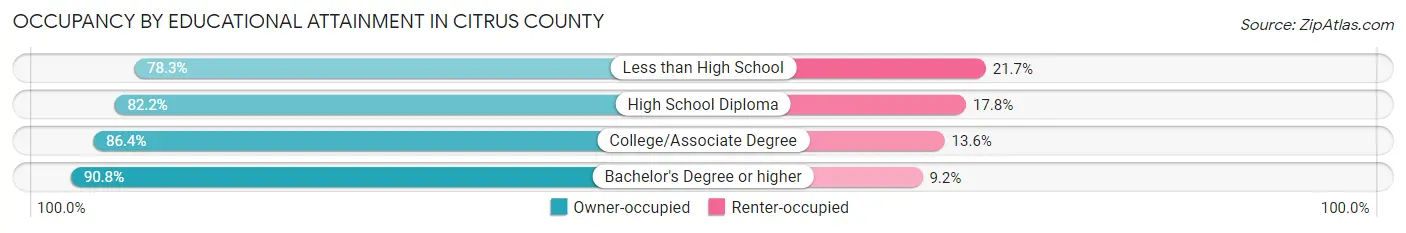
| Household Size | Owner-occupied | Renter-occupied |
| Less than High School | 3,829 (78.3%) | 1,063 (21.7%) |
| High School Diploma | 18,630 (82.2%) | 4,041 (17.8%) |
| College/Associate Degree | 21,906 (86.4%) | 3,443 (13.6%) |
| Bachelor's Degree or higher | 13,296 (90.8%) | 1,343 (9.2%) |
Occupancy by Age of Householder in Citrus County
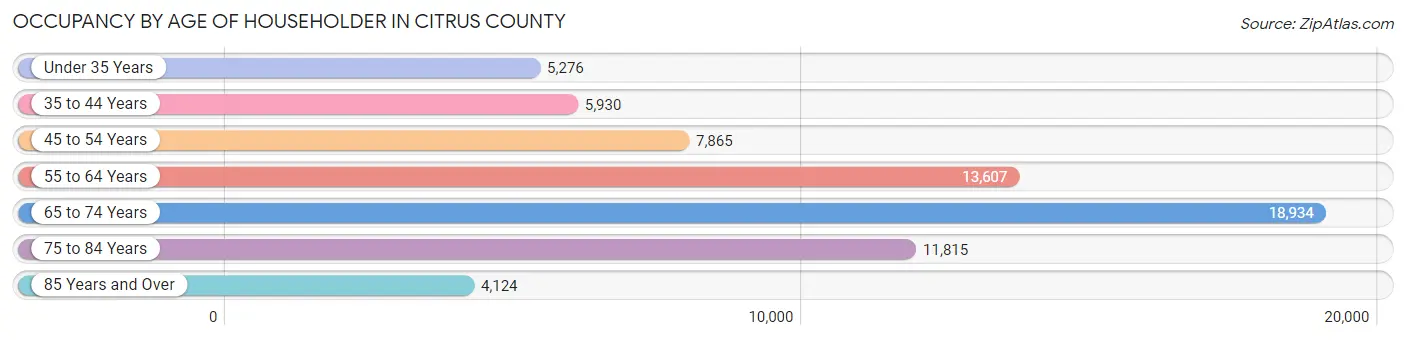
| Age Bracket | # Households | % Households |
| Under 35 Years | 5,276 | 7.8% |
| 35 to 44 Years | 5,930 | 8.8% |
| 45 to 54 Years | 7,865 | 11.6% |
| 55 to 64 Years | 13,607 | 20.1% |
| 65 to 74 Years | 18,934 | 28.0% |
| 75 to 84 Years | 11,815 | 17.5% |
| 85 Years and Over | 4,124 | 6.1% |
| Total | 67,551 | 100.0% |
Housing Finances in Citrus County
Median Income by Occupancy in Citrus County
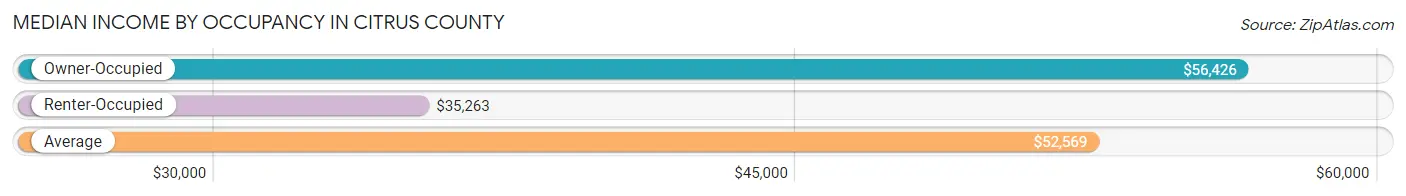
| Occupancy Type | # Households | Median Income |
| Owner-Occupied | 57,661 (85.4%) | $56,426 |
| Renter-Occupied | 9,890 (14.6%) | $35,263 |
| Average | 67,551 (100.0%) | $52,569 |
Occupancy by Householder Income Bracket in Citrus County
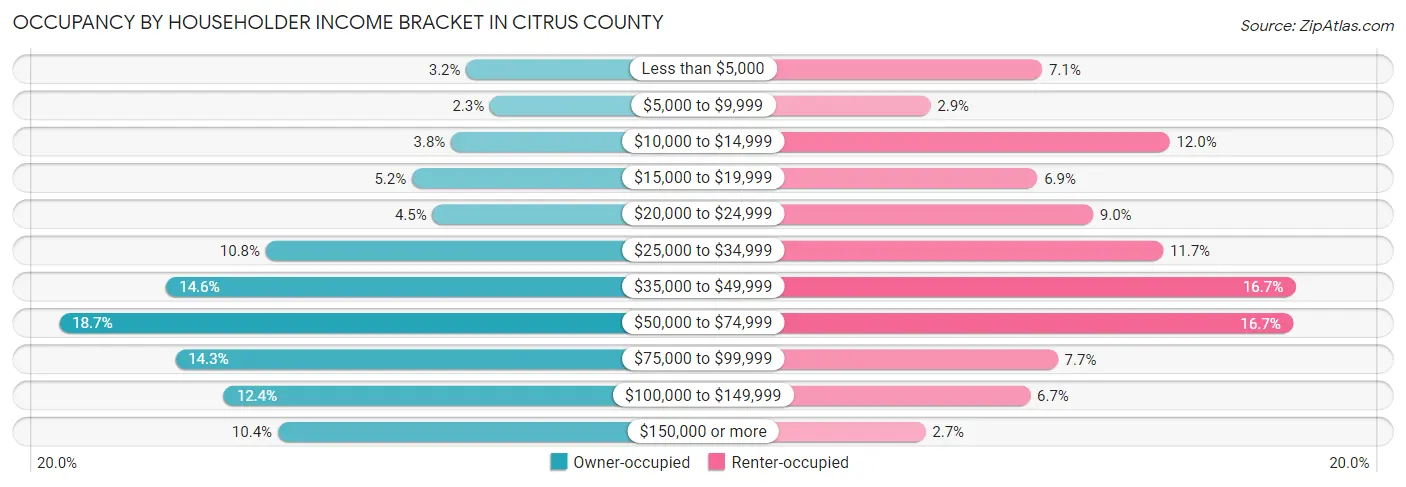
| Income Bracket | Owner-occupied | Renter-occupied |
| Less than $5,000 | 1,825 (3.2%) | 703 (7.1%) |
| $5,000 to $9,999 | 1,310 (2.3%) | 282 (2.9%) |
| $10,000 to $14,999 | 2,165 (3.7%) | 1,183 (12.0%) |
| $15,000 to $19,999 | 3,019 (5.2%) | 684 (6.9%) |
| $20,000 to $24,999 | 2,569 (4.5%) | 894 (9.0%) |
| $25,000 to $34,999 | 6,236 (10.8%) | 1,158 (11.7%) |
| $35,000 to $49,999 | 8,417 (14.6%) | 1,656 (16.7%) |
| $50,000 to $74,999 | 10,773 (18.7%) | 1,647 (16.7%) |
| $75,000 to $99,999 | 8,224 (14.3%) | 762 (7.7%) |
| $100,000 to $149,999 | 7,155 (12.4%) | 658 (6.7%) |
| $150,000 or more | 5,968 (10.3%) | 263 (2.7%) |
| Total | 57,661 (100.0%) | 9,890 (100.0%) |
Monthly Housing Cost Tiers in Citrus County
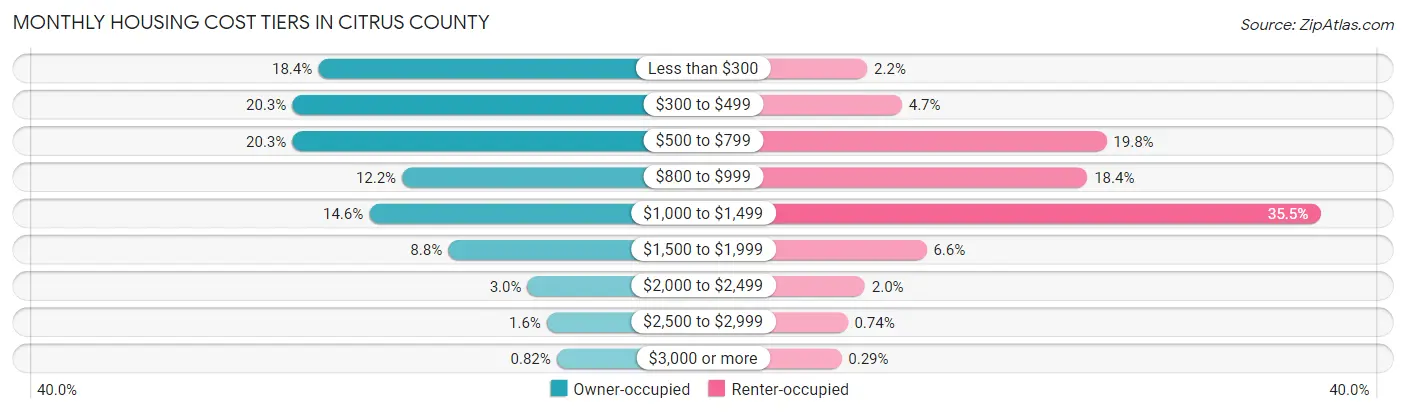
| Monthly Cost | Owner-occupied | Renter-occupied |
| Less than $300 | 10,601 (18.4%) | 217 (2.2%) |
| $300 to $499 | 11,703 (20.3%) | 469 (4.7%) |
| $500 to $799 | 11,708 (20.3%) | 1,959 (19.8%) |
| $800 to $999 | 7,040 (12.2%) | 1,820 (18.4%) |
| $1,000 to $1,499 | 8,437 (14.6%) | 3,515 (35.5%) |
| $1,500 to $1,999 | 5,085 (8.8%) | 649 (6.6%) |
| $2,000 to $2,499 | 1,721 (3.0%) | 200 (2.0%) |
| $2,500 to $2,999 | 896 (1.5%) | 73 (0.7%) |
| $3,000 or more | 470 (0.8%) | 29 (0.3%) |
| Total | 57,661 (100.0%) | 9,890 (100.0%) |
Physical Housing Characteristics in Citrus County
Housing Structures in Citrus County
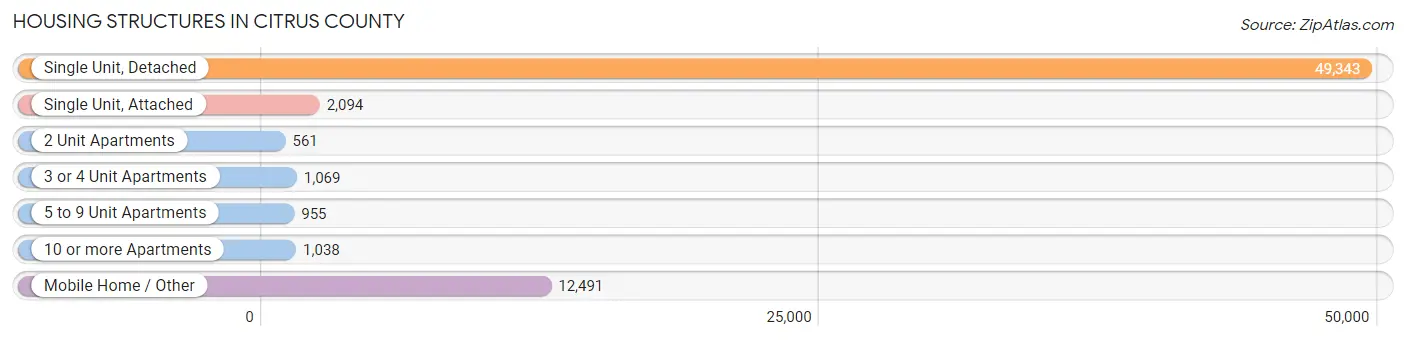
| Structure Type | # Housing Units | % Housing Units |
| Single Unit, Detached | 49,343 | 73.1% |
| Single Unit, Attached | 2,094 | 3.1% |
| 2 Unit Apartments | 561 | 0.8% |
| 3 or 4 Unit Apartments | 1,069 | 1.6% |
| 5 to 9 Unit Apartments | 955 | 1.4% |
| 10 or more Apartments | 1,038 | 1.5% |
| Mobile Home / Other | 12,491 | 18.5% |
| Total | 67,551 | 100.0% |
Housing Structures by Occupancy in Citrus County
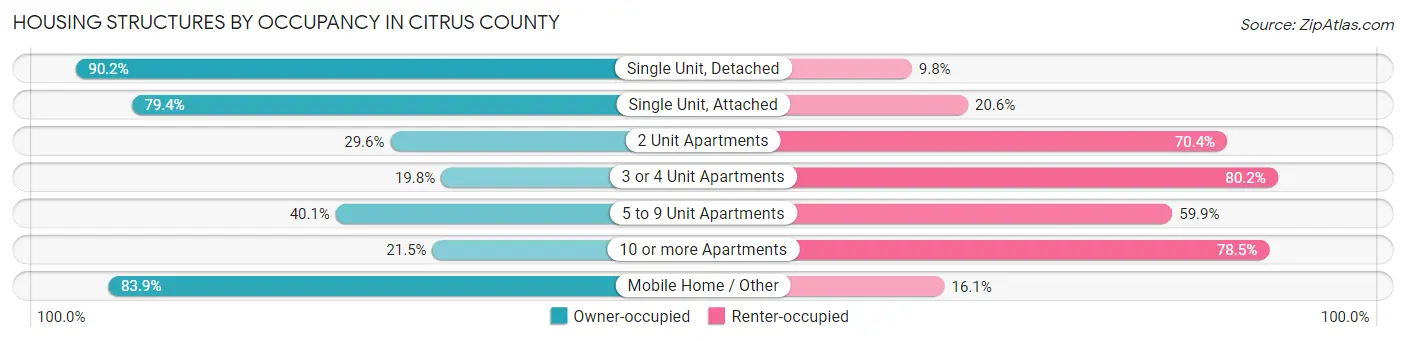
| Structure Type | Owner-occupied | Renter-occupied |
| Single Unit, Detached | 44,529 (90.2%) | 4,814 (9.8%) |
| Single Unit, Attached | 1,663 (79.4%) | 431 (20.6%) |
| 2 Unit Apartments | 166 (29.6%) | 395 (70.4%) |
| 3 or 4 Unit Apartments | 212 (19.8%) | 857 (80.2%) |
| 5 to 9 Unit Apartments | 383 (40.1%) | 572 (59.9%) |
| 10 or more Apartments | 223 (21.5%) | 815 (78.5%) |
| Mobile Home / Other | 10,485 (83.9%) | 2,006 (16.1%) |
| Total | 57,661 (85.4%) | 9,890 (14.6%) |
Housing Structures by Number of Rooms in Citrus County
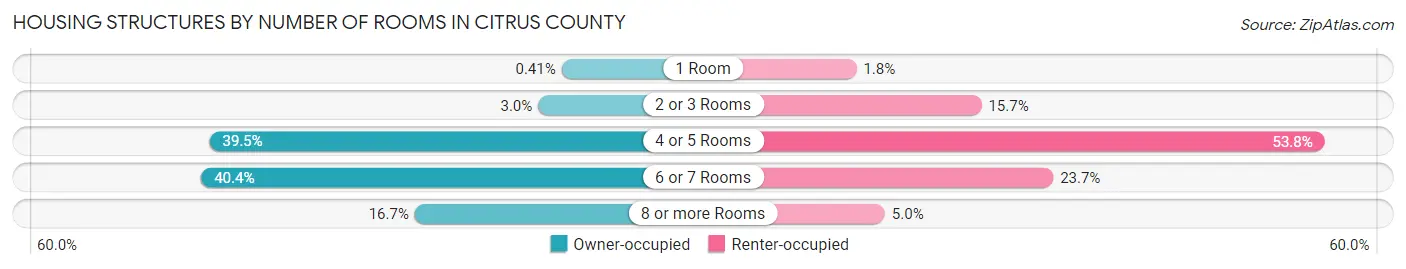
| Number of Rooms | Owner-occupied | Renter-occupied |
| 1 Room | 236 (0.4%) | 182 (1.8%) |
| 2 or 3 Rooms | 1,734 (3.0%) | 1,554 (15.7%) |
| 4 or 5 Rooms | 22,771 (39.5%) | 5,319 (53.8%) |
| 6 or 7 Rooms | 23,292 (40.4%) | 2,341 (23.7%) |
| 8 or more Rooms | 9,628 (16.7%) | 494 (5.0%) |
| Total | 57,661 (100.0%) | 9,890 (100.0%) |
Housing Structure by Heating Type in Citrus County
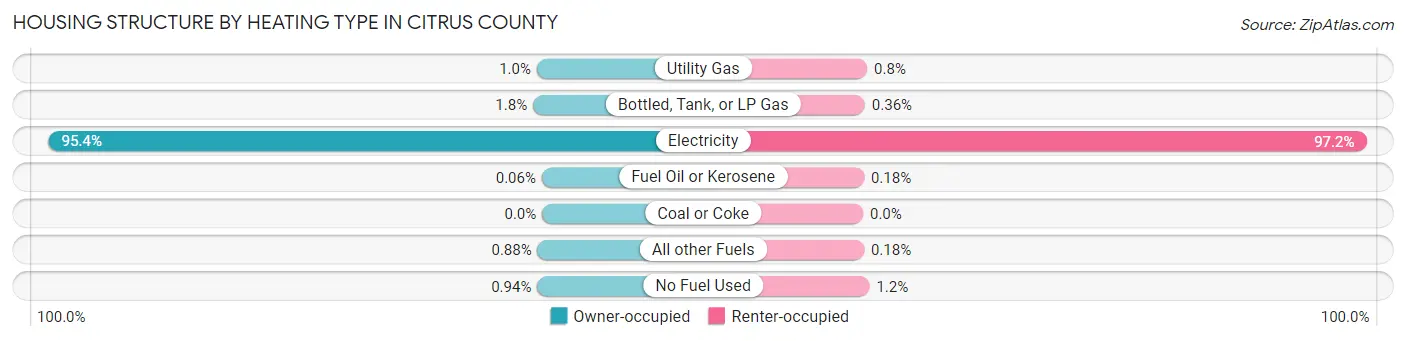
| Heating Type | Owner-occupied | Renter-occupied |
| Utility Gas | 589 (1.0%) | 79 (0.8%) |
| Bottled, Tank, or LP Gas | 1,012 (1.8%) | 36 (0.4%) |
| Electricity | 54,983 (95.4%) | 9,616 (97.2%) |
| Fuel Oil or Kerosene | 32 (0.1%) | 18 (0.2%) |
| Coal or Coke | 0 (0.0%) | 0 (0.0%) |
| All other Fuels | 505 (0.9%) | 18 (0.2%) |
| No Fuel Used | 540 (0.9%) | 123 (1.2%) |
| Total | 57,661 (100.0%) | 9,890 (100.0%) |
Household Vehicle Usage in Citrus County
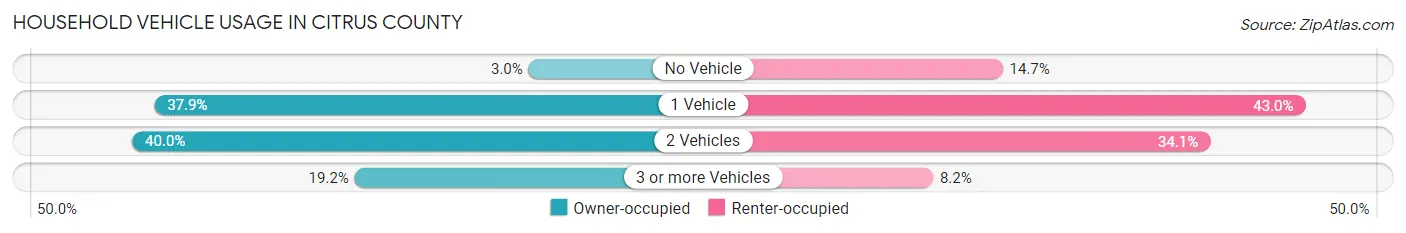
| Vehicles per Household | Owner-occupied | Renter-occupied |
| No Vehicle | 1,700 (2.9%) | 1,455 (14.7%) |
| 1 Vehicle | 21,855 (37.9%) | 4,251 (43.0%) |
| 2 Vehicles | 23,040 (40.0%) | 3,371 (34.1%) |
| 3 or more Vehicles | 11,066 (19.2%) | 813 (8.2%) |
| Total | 57,661 (100.0%) | 9,890 (100.0%) |
Real Estate & Mortgages in Citrus County
Real Estate and Mortgage Overview in Citrus County
| Characteristic | Without Mortgage | With Mortgage |
| Housing Units | 32,092 | 25,569 |
| Median Property Value | $170,700 | $211,000 |
| Median Household Income | $48,637 | $3,343 |
| Monthly Housing Costs | $390 | $459 |
| Real Estate Taxes | $1,121 | $1,094 |
Property Value by Mortgage Status in Citrus County
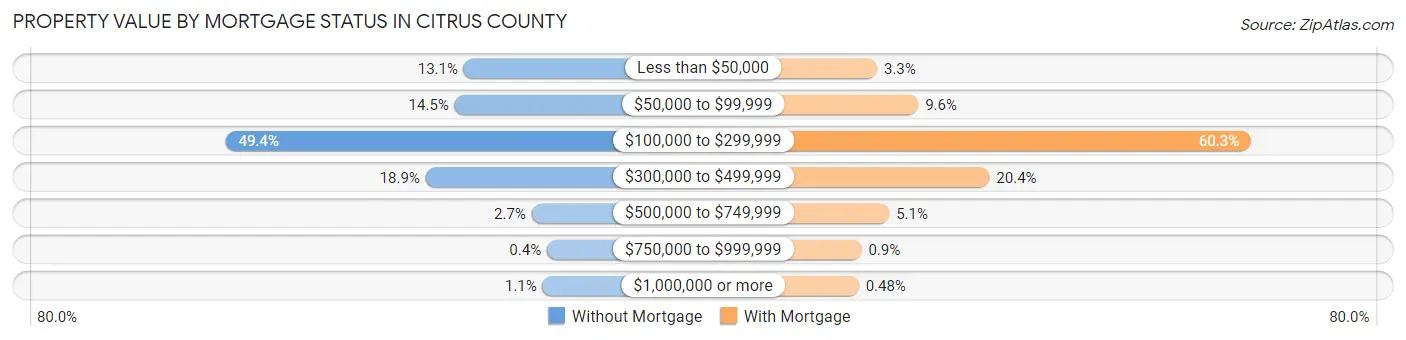
| Property Value | Without Mortgage | With Mortgage |
| Less than $50,000 | 4,195 (13.1%) | 836 (3.3%) |
| $50,000 to $99,999 | 4,643 (14.5%) | 2,441 (9.6%) |
| $100,000 to $299,999 | 15,845 (49.4%) | 15,409 (60.3%) |
| $300,000 to $499,999 | 6,060 (18.9%) | 5,217 (20.4%) |
| $500,000 to $749,999 | 875 (2.7%) | 1,311 (5.1%) |
| $750,000 to $999,999 | 127 (0.4%) | 231 (0.9%) |
| $1,000,000 or more | 347 (1.1%) | 124 (0.5%) |
| Total | 32,092 (100.0%) | 25,569 (100.0%) |
Household Income by Mortgage Status in Citrus County
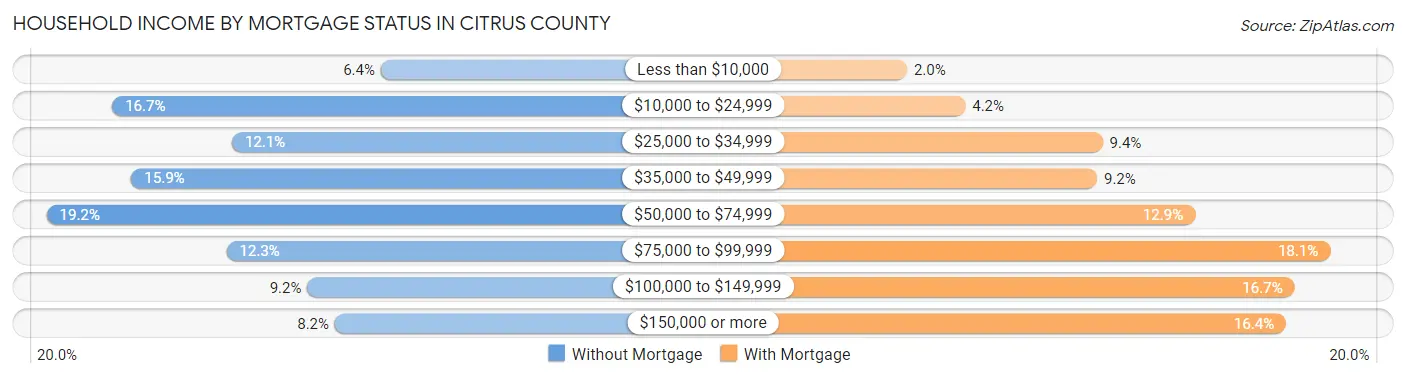
| Household Income | Without Mortgage | With Mortgage |
| Less than $10,000 | 2,065 (6.4%) | 500 (2.0%) |
| $10,000 to $24,999 | 5,346 (16.7%) | 1,070 (4.2%) |
| $25,000 to $34,999 | 3,884 (12.1%) | 2,407 (9.4%) |
| $35,000 to $49,999 | 5,112 (15.9%) | 2,352 (9.2%) |
| $50,000 to $74,999 | 6,149 (19.2%) | 3,305 (12.9%) |
| $75,000 to $99,999 | 3,950 (12.3%) | 4,624 (18.1%) |
| $100,000 to $149,999 | 2,961 (9.2%) | 4,274 (16.7%) |
| $150,000 or more | 2,625 (8.2%) | 4,194 (16.4%) |
| Total | 32,092 (100.0%) | 25,569 (100.0%) |
Property Value to Household Income Ratio in Citrus County
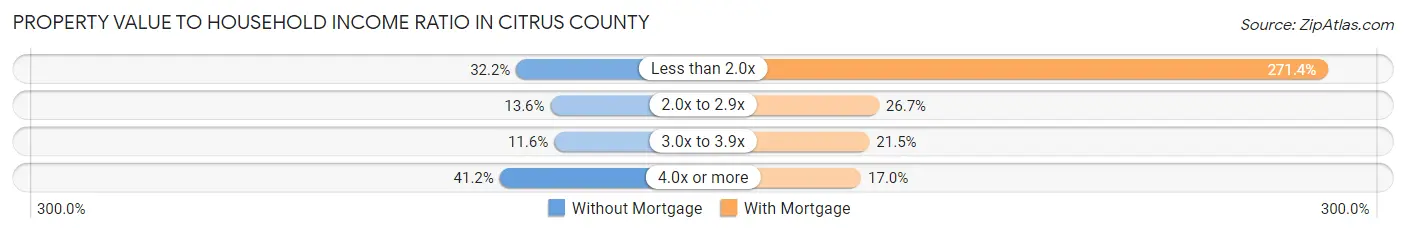
| Value-to-Income Ratio | Without Mortgage | With Mortgage |
| Less than 2.0x | 10,322 (32.2%) | 69,396 (271.4%) |
| 2.0x to 2.9x | 4,347 (13.6%) | 6,823 (26.7%) |
| 3.0x to 3.9x | 3,715 (11.6%) | 5,501 (21.5%) |
| 4.0x or more | 13,226 (41.2%) | 4,345 (17.0%) |
| Total | 32,092 (100.0%) | 25,569 (100.0%) |
Real Estate Taxes by Mortgage Status in Citrus County
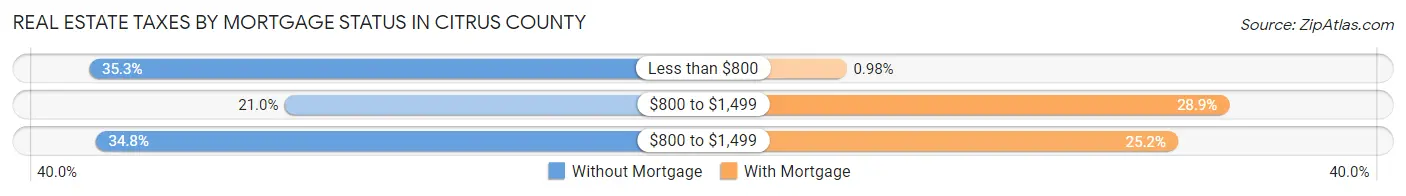
| Property Taxes | Without Mortgage | With Mortgage |
| Less than $800 | 11,325 (35.3%) | 251 (1.0%) |
| $800 to $1,499 | 6,748 (21.0%) | 7,400 (28.9%) |
| $800 to $1,499 | 11,171 (34.8%) | 6,441 (25.2%) |
| Total | 32,092 (100.0%) | 25,569 (100.0%) |
Health & Disability in Citrus County
Health Insurance Coverage by Age in Citrus County
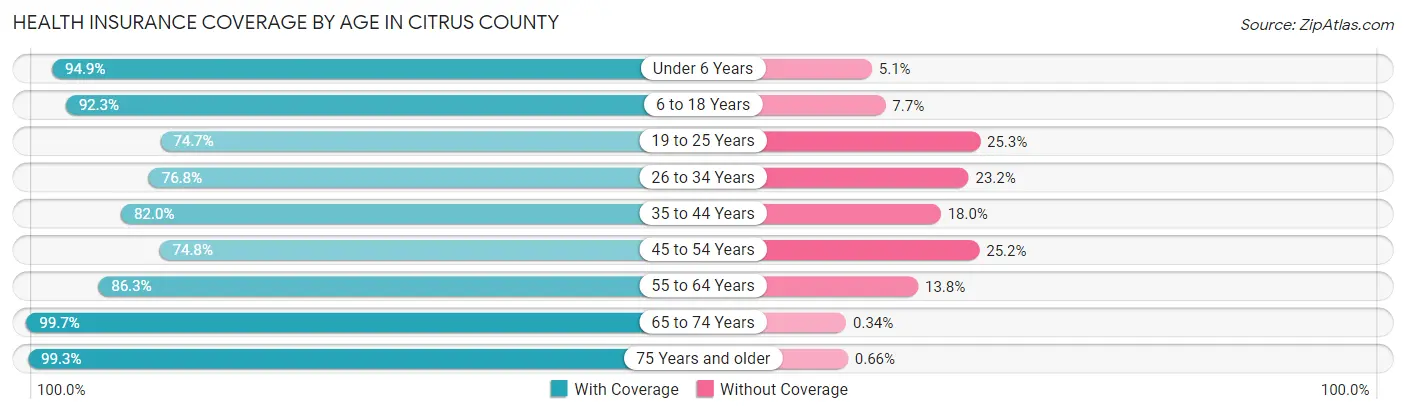
| Age Bracket | With Coverage | Without Coverage |
| Under 6 Years | 6,132 (94.9%) | 332 (5.1%) |
| 6 to 18 Years | 16,330 (92.3%) | 1,356 (7.7%) |
| 19 to 25 Years | 6,168 (74.7%) | 2,091 (25.3%) |
| 26 to 34 Years | 8,904 (76.8%) | 2,685 (23.2%) |
| 35 to 44 Years | 10,370 (82.0%) | 2,273 (18.0%) |
| 45 to 54 Years | 11,940 (74.8%) | 4,016 (25.2%) |
| 55 to 64 Years | 21,610 (86.3%) | 3,446 (13.8%) |
| 65 to 74 Years | 30,068 (99.7%) | 104 (0.3%) |
| 75 Years and older | 24,811 (99.3%) | 166 (0.7%) |
| Total | 136,333 (89.2%) | 16,469 (10.8%) |
Health Insurance Coverage by Citizenship Status in Citrus County
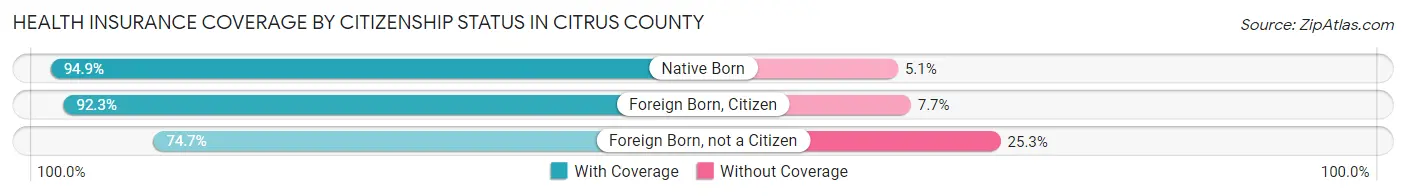
| Citizenship Status | With Coverage | Without Coverage |
| Native Born | 6,132 (94.9%) | 332 (5.1%) |
| Foreign Born, Citizen | 16,330 (92.3%) | 1,356 (7.7%) |
| Foreign Born, not a Citizen | 6,168 (74.7%) | 2,091 (25.3%) |
Health Insurance Coverage by Household Income in Citrus County
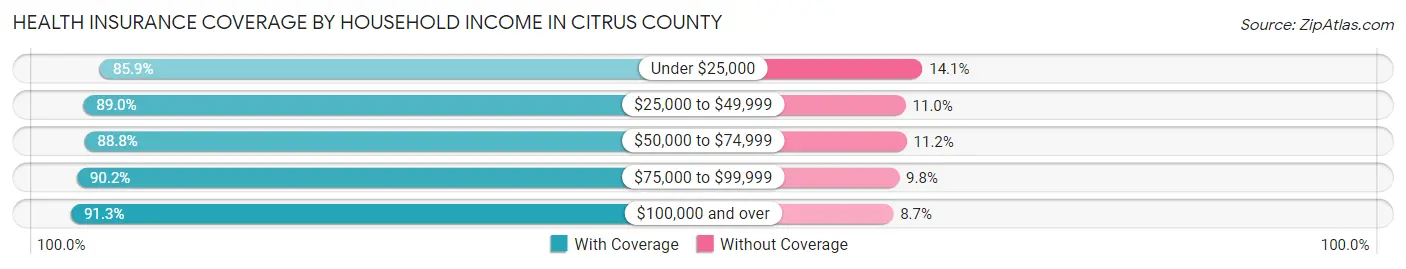
| Household Income | With Coverage | Without Coverage |
| Under $25,000 | 20,033 (85.9%) | 3,300 (14.1%) |
| $25,000 to $49,999 | 31,301 (89.0%) | 3,875 (11.0%) |
| $50,000 to $74,999 | 25,786 (88.8%) | 3,257 (11.2%) |
| $75,000 to $99,999 | 22,160 (90.2%) | 2,411 (9.8%) |
| $100,000 and over | 36,735 (91.3%) | 3,500 (8.7%) |
Public vs Private Health Insurance Coverage by Age in Citrus County
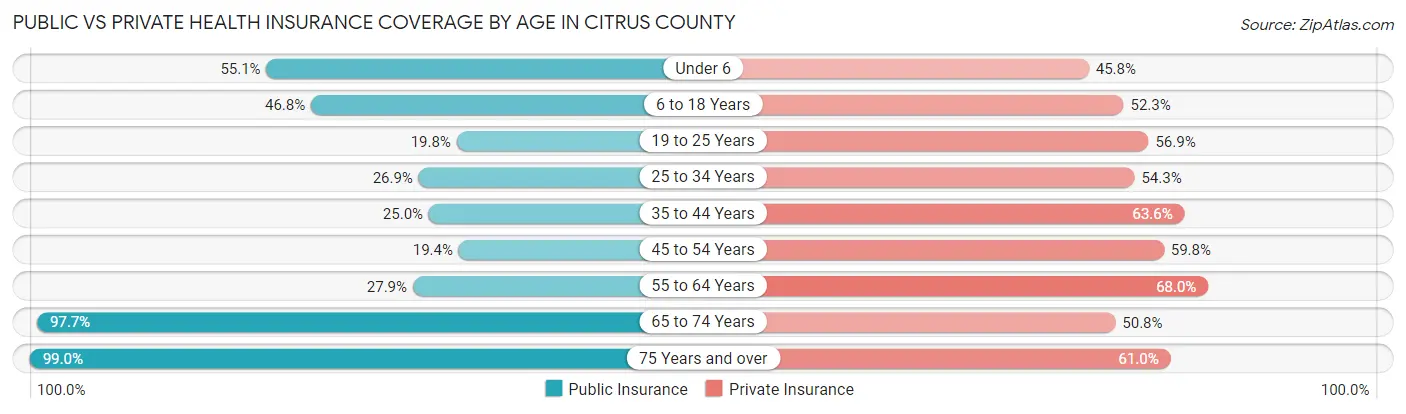
| Age Bracket | Public Insurance | Private Insurance |
| Under 6 | 3,562 (55.1%) | 2,963 (45.8%) |
| 6 to 18 Years | 8,282 (46.8%) | 9,250 (52.3%) |
| 19 to 25 Years | 1,635 (19.8%) | 4,702 (56.9%) |
| 25 to 34 Years | 3,112 (26.9%) | 6,296 (54.3%) |
| 35 to 44 Years | 3,155 (24.9%) | 8,044 (63.6%) |
| 45 to 54 Years | 3,095 (19.4%) | 9,536 (59.8%) |
| 55 to 64 Years | 6,997 (27.9%) | 17,039 (68.0%) |
| 65 to 74 Years | 29,478 (97.7%) | 15,320 (50.8%) |
| 75 Years and over | 24,738 (99.0%) | 15,241 (61.0%) |
| Total | 84,054 (55.0%) | 88,391 (57.9%) |
Disability Status by Sex by Age in Citrus County
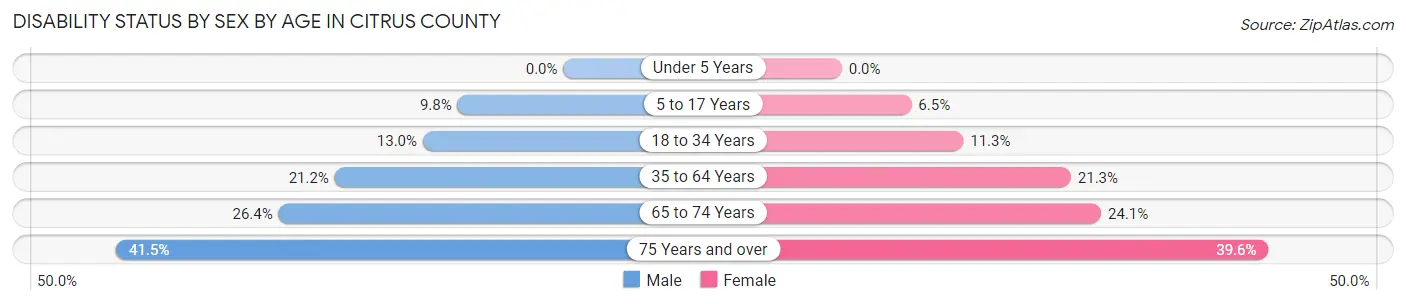
| Age Bracket | Male | Female |
| Under 5 Years | 0 (0.0%) | 0 (0.0%) |
| 5 to 17 Years | 906 (9.8%) | 535 (6.5%) |
| 18 to 34 Years | 1,420 (13.0%) | 1,161 (11.3%) |
| 35 to 64 Years | 5,408 (21.2%) | 5,988 (21.3%) |
| 65 to 74 Years | 3,782 (26.4%) | 3,816 (24.1%) |
| 75 Years and over | 4,931 (41.5%) | 5,185 (39.6%) |
Disability Class by Sex by Age in Citrus County
Disability Class: Hearing Difficulty
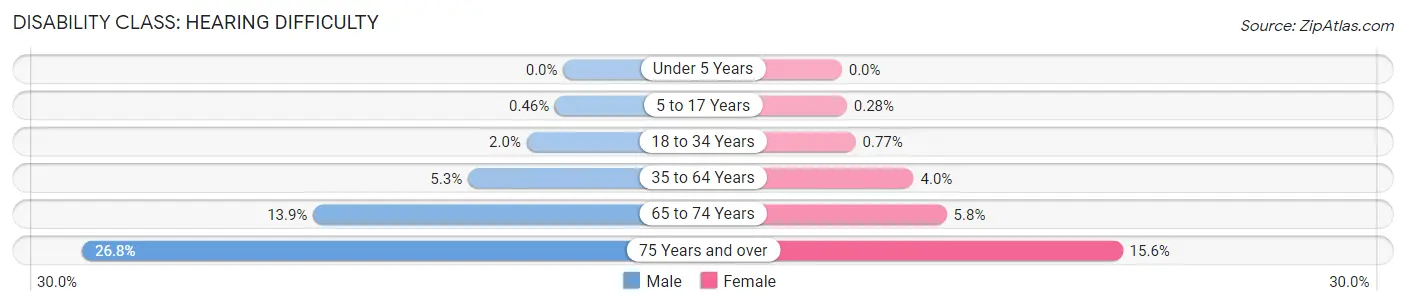
| Age Bracket | Male | Female |
| Under 5 Years | 0 (0.0%) | 0 (0.0%) |
| 5 to 17 Years | 42 (0.5%) | 23 (0.3%) |
| 18 to 34 Years | 222 (2.0%) | 79 (0.8%) |
| 35 to 64 Years | 1,354 (5.3%) | 1,128 (4.0%) |
| 65 to 74 Years | 1,993 (13.9%) | 926 (5.8%) |
| 75 Years and over | 3,183 (26.8%) | 2,049 (15.6%) |
Disability Class: Vision Difficulty
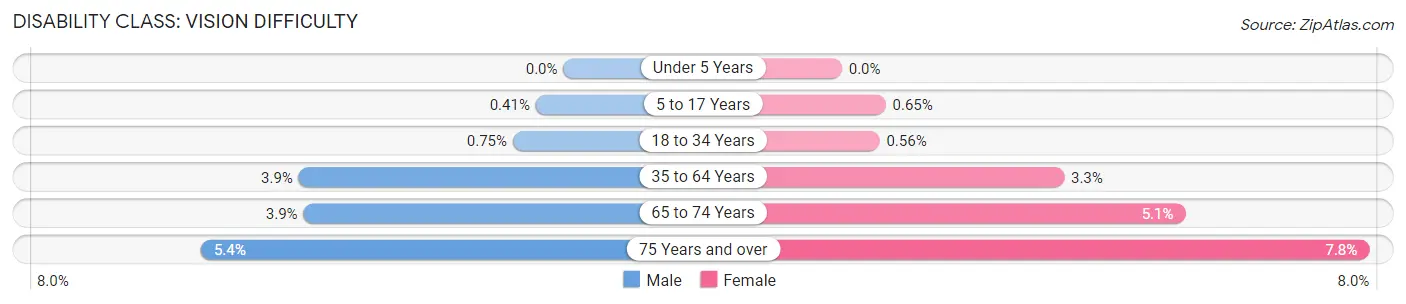
| Age Bracket | Male | Female |
| Under 5 Years | 0 (0.0%) | 0 (0.0%) |
| 5 to 17 Years | 38 (0.4%) | 54 (0.6%) |
| 18 to 34 Years | 82 (0.7%) | 58 (0.6%) |
| 35 to 64 Years | 1,002 (3.9%) | 930 (3.3%) |
| 65 to 74 Years | 552 (3.9%) | 809 (5.1%) |
| 75 Years and over | 639 (5.4%) | 1,025 (7.8%) |
Disability Class: Cognitive Difficulty
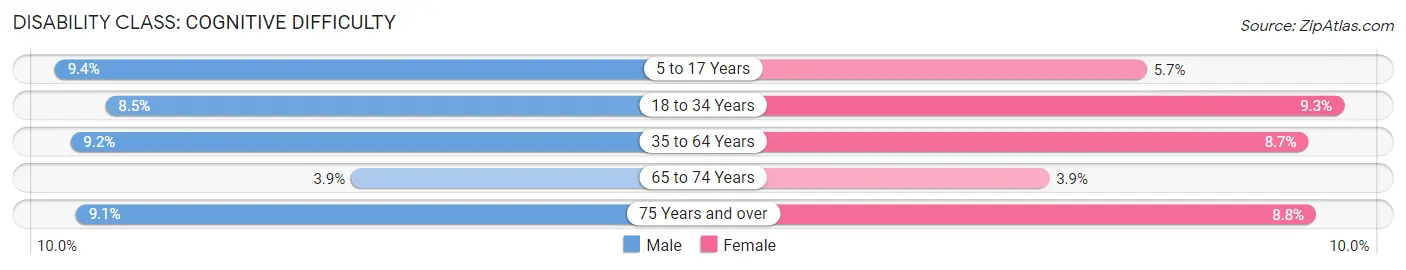
| Age Bracket | Male | Female |
| 5 to 17 Years | 871 (9.4%) | 469 (5.7%) |
| 18 to 34 Years | 925 (8.5%) | 959 (9.3%) |
| 35 to 64 Years | 2,332 (9.1%) | 2,439 (8.7%) |
| 65 to 74 Years | 564 (3.9%) | 611 (3.8%) |
| 75 Years and over | 1,075 (9.0%) | 1,153 (8.8%) |
Disability Class: Ambulatory Difficulty
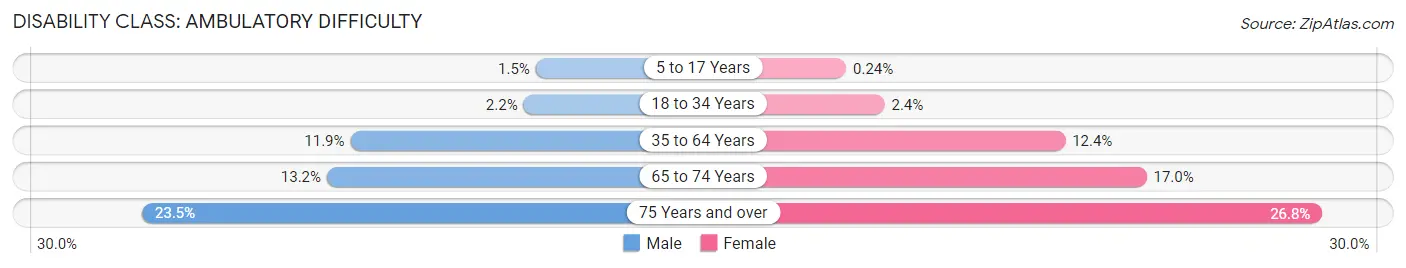
| Age Bracket | Male | Female |
| 5 to 17 Years | 142 (1.5%) | 20 (0.2%) |
| 18 to 34 Years | 242 (2.2%) | 245 (2.4%) |
| 35 to 64 Years | 3,022 (11.9%) | 3,504 (12.4%) |
| 65 to 74 Years | 1,885 (13.2%) | 2,691 (17.0%) |
| 75 Years and over | 2,788 (23.5%) | 3,504 (26.8%) |
Disability Class: Self-Care Difficulty
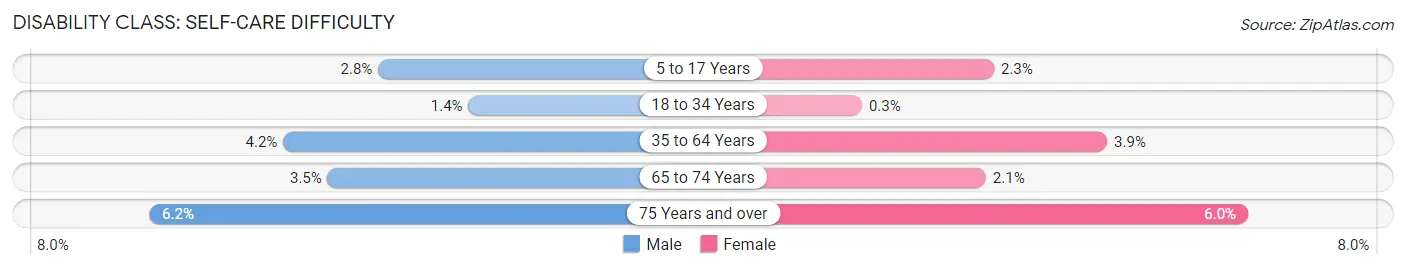
| Age Bracket | Male | Female |
| 5 to 17 Years | 254 (2.8%) | 187 (2.3%) |
| 18 to 34 Years | 154 (1.4%) | 31 (0.3%) |
| 35 to 64 Years | 1,061 (4.2%) | 1,111 (3.9%) |
| 65 to 74 Years | 501 (3.5%) | 340 (2.1%) |
| 75 Years and over | 730 (6.1%) | 790 (6.0%) |
Technology Access in Citrus County
Computing Device Access in Citrus County
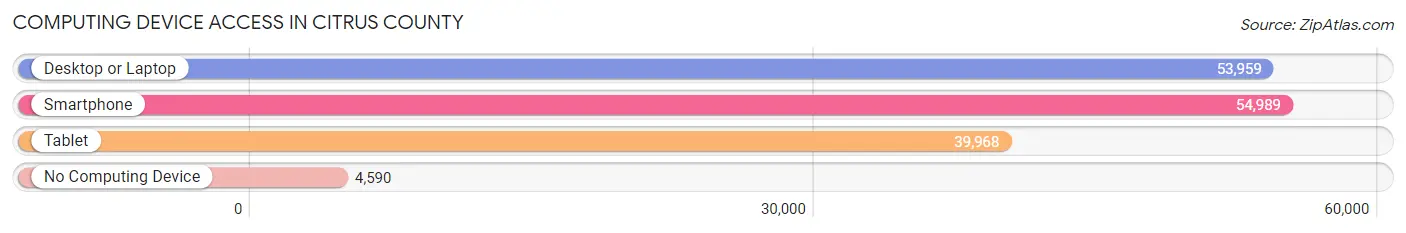
| Device Type | # Households | % Households |
| Desktop or Laptop | 53,959 | 79.9% |
| Smartphone | 54,989 | 81.4% |
| Tablet | 39,968 | 59.2% |
| No Computing Device | 4,590 | 6.8% |
| Total | 67,551 | 100.0% |
Internet Access in Citrus County
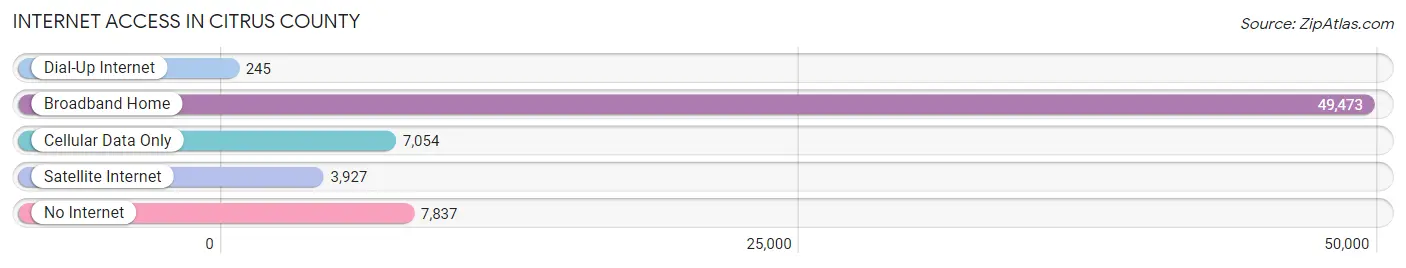
| Internet Type | # Households | % Households |
| Dial-Up Internet | 245 | 0.4% |
| Broadband Home | 49,473 | 73.2% |
| Cellular Data Only | 7,054 | 10.4% |
| Satellite Internet | 3,927 | 5.8% |
| No Internet | 7,837 | 11.6% |
| Total | 67,551 | 100.0% |
Citrus County Summary
Citrus County is a county located in the U.S. state of Florida. As of the 2010 census, the population was 141,236. The county seat is Inverness, and the largest city is Crystal River. Citrus County is part of the Tampa-St. Petersburg-Clearwater, FL Metropolitan Statistical Area.
History
Citrus County was created in 1887 from parts of Hernando and Levy counties. It was named for the citrus groves that once flourished there. The county was originally part of Hernando County, but was split off in 1887. The Citrus County Board of County Commissioners was first established in 1888.
In the early 1900s, the county was a major producer of citrus fruits, and the county seat of Inverness was known as the "Citrus Capital of the World." The citrus industry declined in the mid-1900s, and the county's economy shifted to tourism and retirement.
Geography
Citrus County is located in the central part of the state of Florida, on the Gulf of Mexico. It is bordered by Levy County to the north, Marion County to the east, Hernando County to the south, and Sumter County to the west. The county covers an area of 773 square miles, of which 745 square miles is land and 28 square miles is water.
The county is home to several rivers, including the Withlacoochee River, the Homosassa River, and the Chassahowitzka River. The county also contains several lakes, including Lake Tsala Apopka, Lake Rousseau, and Lake Hernando.
The county is home to several state parks, including Chassahowitzka National Wildlife Refuge, Crystal River National Wildlife Refuge, and Homosassa Springs Wildlife State Park.
Economy
Citrus County's economy is largely based on tourism and retirement. The county is home to several resorts and retirement communities, including Sugarmill Woods, Citrus Hills, and Citrus Springs.
The county is also home to several manufacturing companies, including Progress Energy, which operates a nuclear power plant in Crystal River. The county is also home to several agricultural operations, including citrus groves, cattle ranches, and timber operations.
Demographics
As of the 2010 census, there were 141,236 people, 58,945 households, and 41,845 families residing in the county. The population density was 189.3 people per square mile. There were 68,945 housing units at an average density of 92.7 per square mile. The racial makeup of the county was 90.2% White, 4.3% African American, 0.6% Native American, 1.2% Asian, 0.1% Pacific Islander, 1.9% from other races, and 1.7% from two or more races. Hispanic or Latino of any race were 6.3% of the population.
The median income for a household in the county was $37,817, and the median income for a family was $45,852. The per capita income for the county was $20,945. About 11.2% of families and 15.2% of the population were below the poverty line, including 22.2% of those under age 18 and 8.2% of those age 65 or over.
Common Questions
What is Per Capita Income in Citrus County?
Per Capita income in Citrus County is $33,514.
What is the Median Family Income in Citrus County?
Median Family Income in Citrus County is $66,464.
What is the Median Household income in Citrus County?
Median Household Income in Citrus County is $52,569.
What is Income or Wage Gap in Citrus County?
Income or Wage Gap in Citrus County is 21.4%.
Women in Citrus County earn 78.6 cents for every dollar earned by a man.
What is Family Income Deficit in Citrus County?
Family Income Deficit in Citrus County is $9,871.
Families that are below poverty line in Citrus County earn $9,871 less on average than the poverty threshold level.
What is Inequality or Gini Index in Citrus County?
Inequality or Gini Index in Citrus County is 0.48.
What is the Total Population of Citrus County?
Total Population of Citrus County is 155,173.
What is the Total Male Population of Citrus County?
Total Male Population of Citrus County is 76,008.
What is the Total Female Population of Citrus County?
Total Female Population of Citrus County is 79,165.
What is the Ratio of Males per 100 Females in Citrus County?
There are 96.01 Males per 100 Females in Citrus County.
What is the Ratio of Females per 100 Males in Citrus County?
There are 104.15 Females per 100 Males in Citrus County.
What is the Median Population Age in Citrus County?
Median Population Age in Citrus County is 56.9 Years.
What is the Average Family Size in Citrus County
Average Family Size in Citrus County is 2.8 People.
What is the Average Household Size in Citrus County
Average Household Size in Citrus County is 2.3 People.
How Large is the Labor Force in Citrus County?
There are 53,249 People in the Labor Forcein in Citrus County.
What is the Percentage of People in the Labor Force in Citrus County?
39.4% of People are in the Labor Force in Citrus County.
What is the Unemployment Rate in Citrus County?
Unemployment Rate in Citrus County is 7.2%.