Calhoun County, FL Map & Demographics
Calhoun County Map
Calhoun County Overview
$21,324
PER CAPITA INCOME
$65,776
AVG FAMILY INCOME
$41,526
AVG HOUSEHOLD INCOME
10.1%
WAGE / INCOME GAP [ % ]
89.9¢/ $1
WAGE / INCOME GAP [ $ ]
$12,357
FAMILY INCOME DEFICIT
0.46
INEQUALITY / GINI INDEX
13,753
TOTAL POPULATION
7,715
MALE POPULATION
6,038
FEMALE POPULATION
127.77
MALES / 100 FEMALES
78.26
FEMALES / 100 MALES
41.9
MEDIAN AGE
3.5
AVG FAMILY SIZE
2.7
AVG HOUSEHOLD SIZE
4,686
LABOR FORCE [ PEOPLE ]
41.4%
PERCENT IN LABOR FORCE
3.7%
UNEMPLOYMENT RATE
Calhoun County Area Codes
Income in Calhoun County
Income Overview in Calhoun County
Per Capita Income in Calhoun County is $21,324, while median incomes of families and households are $65,776 and $41,526 respectively.
| Characteristic | Number | Measure |
| Per Capita Income | 13,753 | $21,324 |
| Median Family Income | 2,761 | $65,776 |
| Mean Family Income | 2,761 | $74,886 |
| Median Household Income | 4,448 | $41,526 |
| Mean Household Income | 4,448 | $60,413 |
| Income Deficit | 2,761 | $12,357 |
| Wage / Income Gap (%) | 13,753 | 10.13% |
| Wage / Income Gap ($) | 13,753 | 89.87¢ per $1 |
| Gini / Inequality Index | 13,753 | 0.46 |
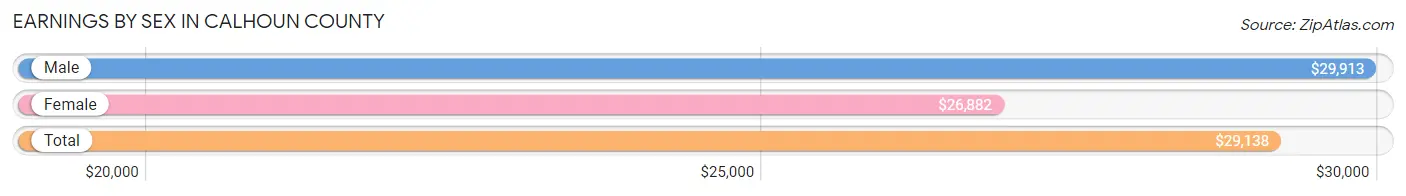
Earnings by Sex in Calhoun County
Average Earnings in Calhoun County are $29,138, $29,913 for men and $26,882 for women, a difference of 10.1%.
| Sex | Number | Average Earnings |
| Male | 2,732 (56.6%) | $29,913 |
| Female | 2,096 (43.4%) | $26,882 |
| Total | 4,828 (100.0%) | $29,138 |
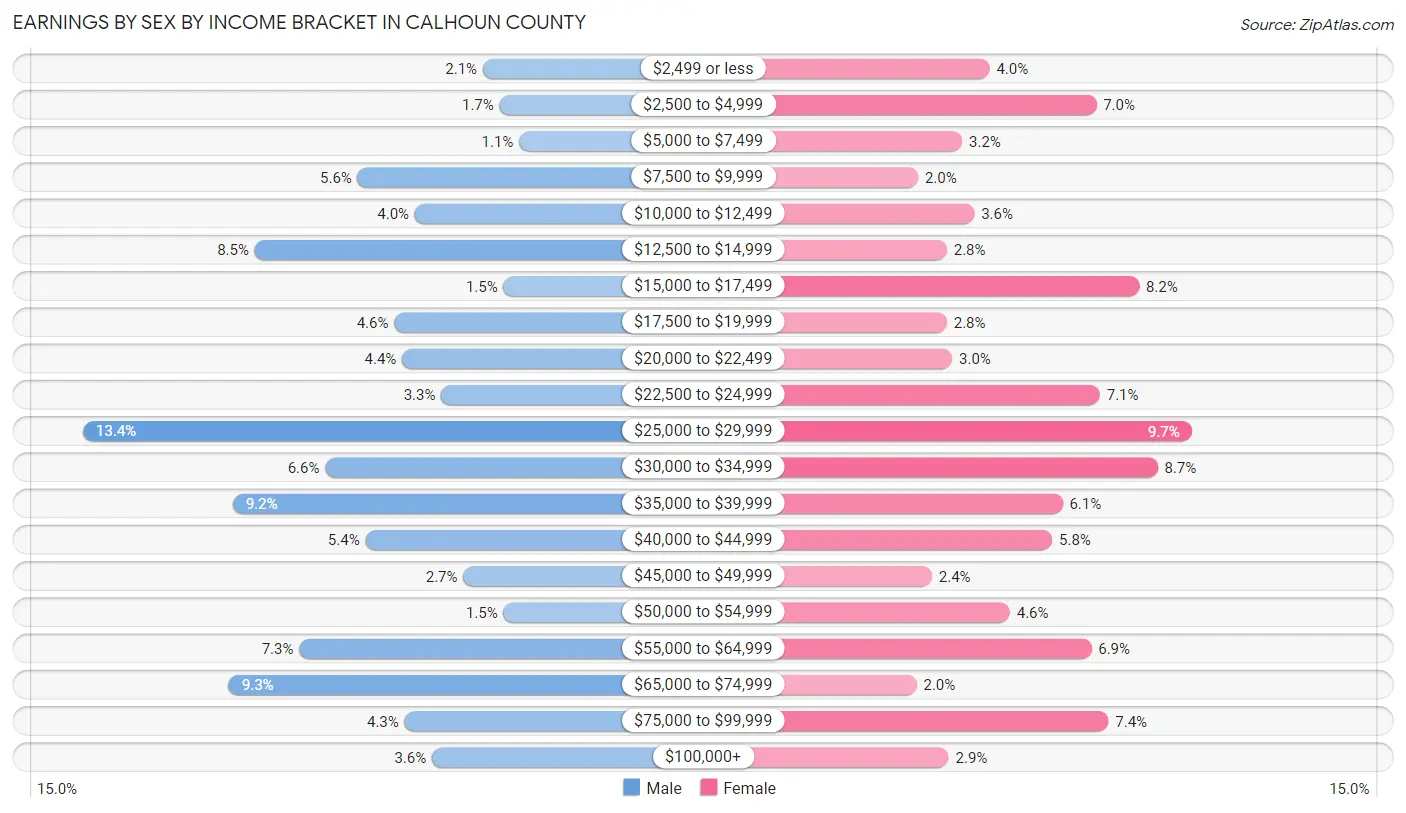
Earnings by Sex by Income Bracket in Calhoun County
The most common earnings brackets in Calhoun County are $25,000 to $29,999 for men (365 | 13.4%) and $25,000 to $29,999 for women (203 | 9.7%).
| Income | Male | Female |
| $2,499 or less | 58 (2.1%) | 84 (4.0%) |
| $2,500 to $4,999 | 45 (1.7%) | 147 (7.0%) |
| $5,000 to $7,499 | 30 (1.1%) | 68 (3.2%) |
| $7,500 to $9,999 | 154 (5.6%) | 42 (2.0%) |
| $10,000 to $12,499 | 110 (4.0%) | 75 (3.6%) |
| $12,500 to $14,999 | 233 (8.5%) | 59 (2.8%) |
| $15,000 to $17,499 | 42 (1.5%) | 172 (8.2%) |
| $17,500 to $19,999 | 126 (4.6%) | 59 (2.8%) |
| $20,000 to $22,499 | 120 (4.4%) | 62 (3.0%) |
| $22,500 to $24,999 | 90 (3.3%) | 149 (7.1%) |
| $25,000 to $29,999 | 365 (13.4%) | 203 (9.7%) |
| $30,000 to $34,999 | 179 (6.6%) | 183 (8.7%) |
| $35,000 to $39,999 | 250 (9.1%) | 127 (6.1%) |
| $40,000 to $44,999 | 148 (5.4%) | 121 (5.8%) |
| $45,000 to $49,999 | 73 (2.7%) | 50 (2.4%) |
| $50,000 to $54,999 | 42 (1.5%) | 96 (4.6%) |
| $55,000 to $64,999 | 199 (7.3%) | 144 (6.9%) |
| $65,000 to $74,999 | 253 (9.3%) | 41 (2.0%) |
| $75,000 to $99,999 | 118 (4.3%) | 154 (7.3%) |
| $100,000+ | 97 (3.5%) | 60 (2.9%) |
| Total | 2,732 (100.0%) | 2,096 (100.0%) |
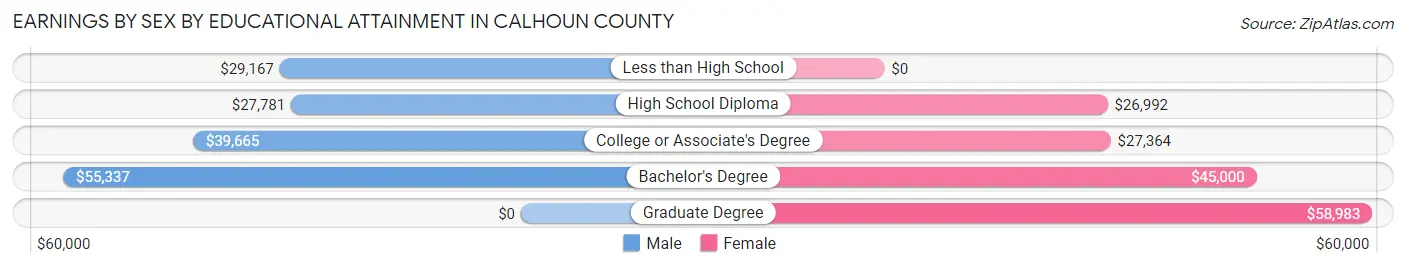
Earnings by Sex by Educational Attainment in Calhoun County
Average earnings in Calhoun County are $31,783 for men and $30,873 for women, a difference of 2.9%. Men with an educational attainment of bachelor's degree enjoy the highest average annual earnings of $55,337, while those with high school diploma education earn the least with $27,781. Women with an educational attainment of graduate degree earn the most with the average annual earnings of $58,983, while those with high school diploma education have the smallest earnings of $26,992.
| Educational Attainment | Male Income | Female Income |
| Less than High School | $29,167 | $0 |
| High School Diploma | $27,781 | $26,992 |
| College or Associate's Degree | $39,665 | $27,364 |
| Bachelor's Degree | $55,337 | $45,000 |
| Graduate Degree | - | - |
| Total | $31,783 | $30,873 |
Family Income in Calhoun County
Family Income Brackets in Calhoun County
According to the Calhoun County family income data, there are 621 families falling into the $50,000 to $74,999 income range, which is the most common income bracket and makes up 22.5% of all families. Conversely, the $200,000+ income bracket is the least frequent group with only 72 families (2.6%) belonging to this category.
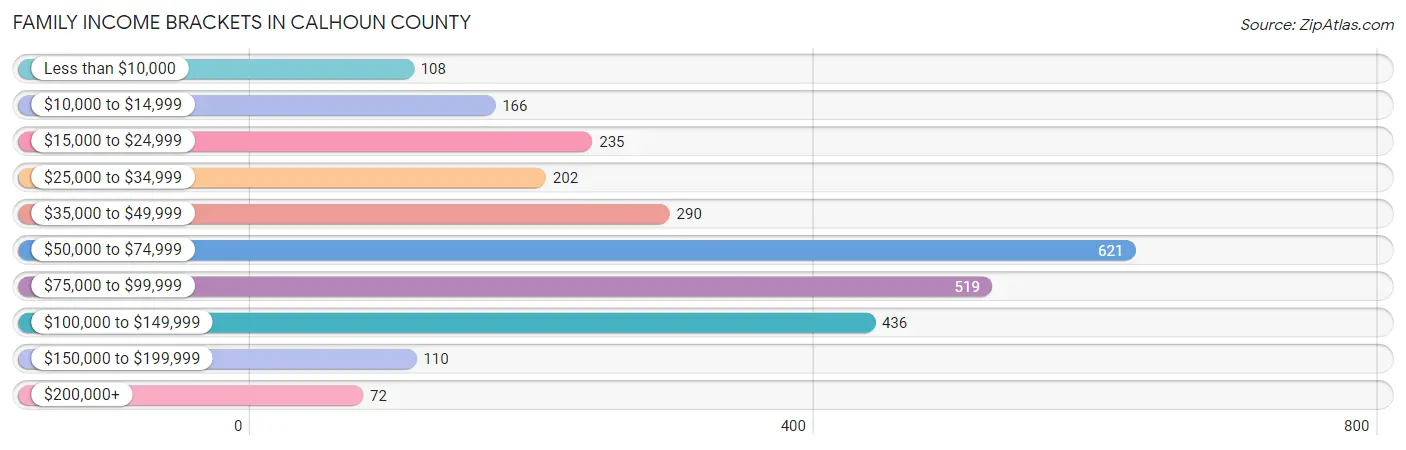
| Income Bracket | # Families | % Families |
| Less than $10,000 | 108 | 3.9% |
| $10,000 to $14,999 | 166 | 6.0% |
| $15,000 to $24,999 | 235 | 8.5% |
| $25,000 to $34,999 | 202 | 7.3% |
| $35,000 to $49,999 | 290 | 10.5% |
| $50,000 to $74,999 | 621 | 22.5% |
| $75,000 to $99,999 | 519 | 18.8% |
| $100,000 to $149,999 | 436 | 15.8% |
| $150,000 to $199,999 | 110 | 4.0% |
| $200,000+ | 72 | 2.6% |
Family Income by Famaliy Size in Calhoun County
7+ person families (37 | 1.3%) account for the highest median family income in Calhoun County with $100,938 per family, while 2-person families (1,314 | 47.6%) have the highest median income of $34,792 per family member.
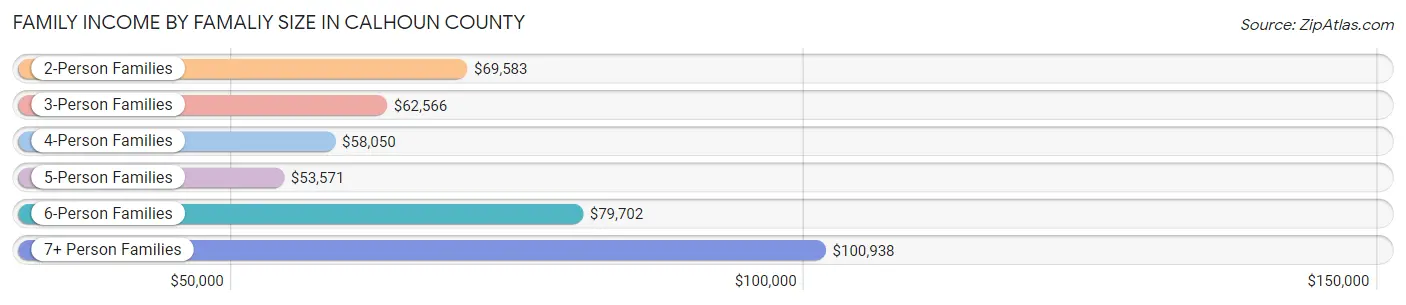
| Income Bracket | # Families | Median Income |
| 2-Person Families | 1,314 (47.6%) | $69,583 |
| 3-Person Families | 631 (22.9%) | $62,566 |
| 4-Person Families | 505 (18.3%) | $58,050 |
| 5-Person Families | 170 (6.2%) | $53,571 |
| 6-Person Families | 104 (3.8%) | $79,702 |
| 7+ Person Families | 37 (1.3%) | $100,938 |
| Total | 2,761 (100.0%) | $65,776 |
Family Income by Number of Earners in Calhoun County
The median family income in Calhoun County is $65,776, with families comprising 3+ earners (202) having the highest median family income of $97,308, while families with 1 earner (1,047) have the lowest median family income of $39,460, accounting for 7.3% and 37.9% of families, respectively.
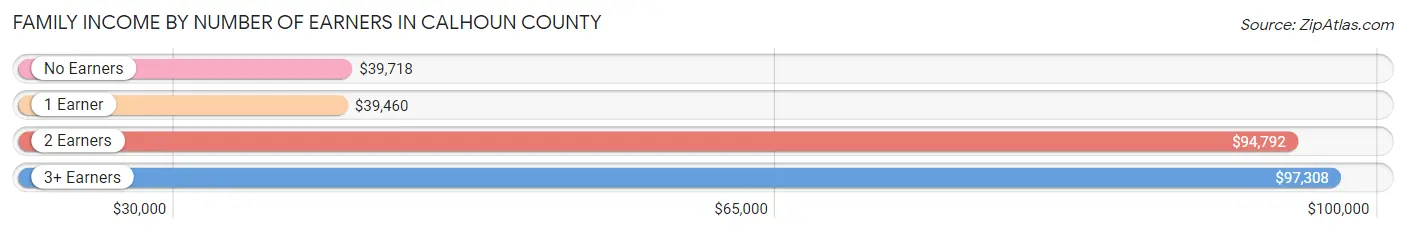
| Number of Earners | # Families | Median Income |
| No Earners | 613 (22.2%) | $39,718 |
| 1 Earner | 1,047 (37.9%) | $39,460 |
| 2 Earners | 899 (32.6%) | $94,792 |
| 3+ Earners | 202 (7.3%) | $97,308 |
| Total | 2,761 (100.0%) | $65,776 |
Household Income in Calhoun County
Household Income Brackets in Calhoun County
With 676 households falling in the category, the $15,000 to $24,999 income range is the most frequent in Calhoun County, accounting for 15.2% of all households. In contrast, only 111 households (2.5%) fall into the $200,000+ income bracket, making it the least populous group.
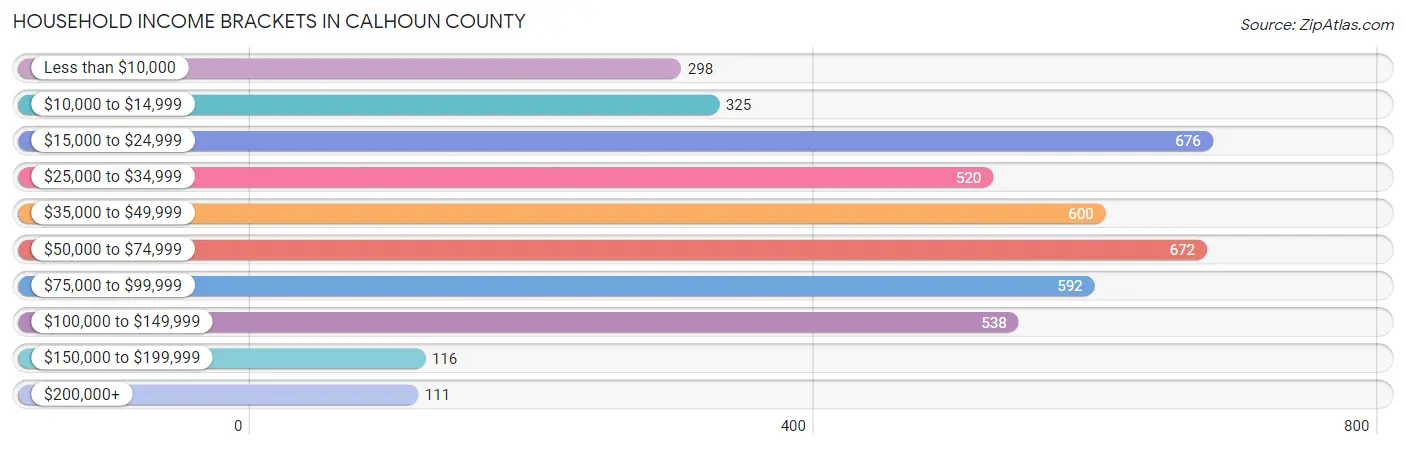
| Income Bracket | # Households | % Households |
| Less than $10,000 | 298 | 6.7% |
| $10,000 to $14,999 | 325 | 7.3% |
| $15,000 to $24,999 | 676 | 15.2% |
| $25,000 to $34,999 | 520 | 11.7% |
| $35,000 to $49,999 | 600 | 13.5% |
| $50,000 to $74,999 | 672 | 15.1% |
| $75,000 to $99,999 | 592 | 13.3% |
| $100,000 to $149,999 | 538 | 12.1% |
| $150,000 to $199,999 | 116 | 2.6% |
| $200,000+ | 111 | 2.5% |
Household Income by Householder Age in Calhoun County
The median household income in Calhoun County is $41,526, with the highest median household income of $53,958 found in the 45 to 64 years age bracket for the primary householder. A total of 1,741 households (39.1%) fall into this category. Meanwhile, the 65+ years age bracket for the primary householder has the lowest median household income of $37,175, with 1,527 households (34.3%) in this group.
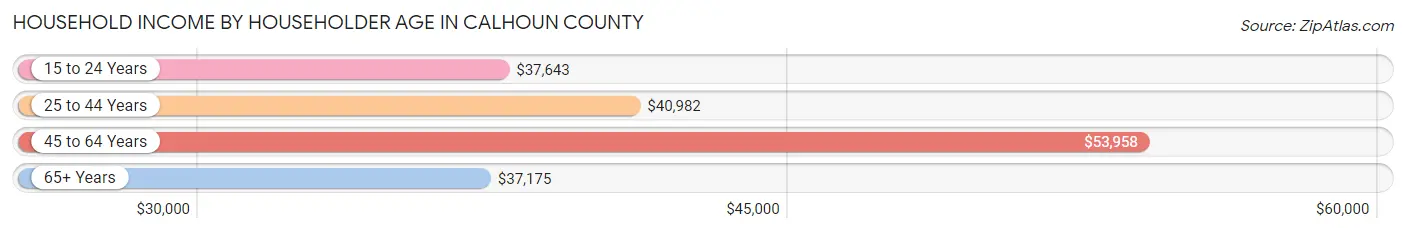
| Income Bracket | # Households | Median Income |
| 15 to 24 Years | 92 (2.1%) | $37,643 |
| 25 to 44 Years | 1,088 (24.5%) | $40,982 |
| 45 to 64 Years | 1,741 (39.1%) | $53,958 |
| 65+ Years | 1,527 (34.3%) | $37,175 |
| Total | 4,448 (100.0%) | $41,526 |
Poverty in Calhoun County
Income Below Poverty by Sex and Age in Calhoun County
With 17.6% poverty level for males and 22.3% for females among the residents of Calhoun County, 5 year old males and 5 year old females are the most vulnerable to poverty, with 122 males (78.7%) and 39 females (72.2%) in their respective age groups living below the poverty level.
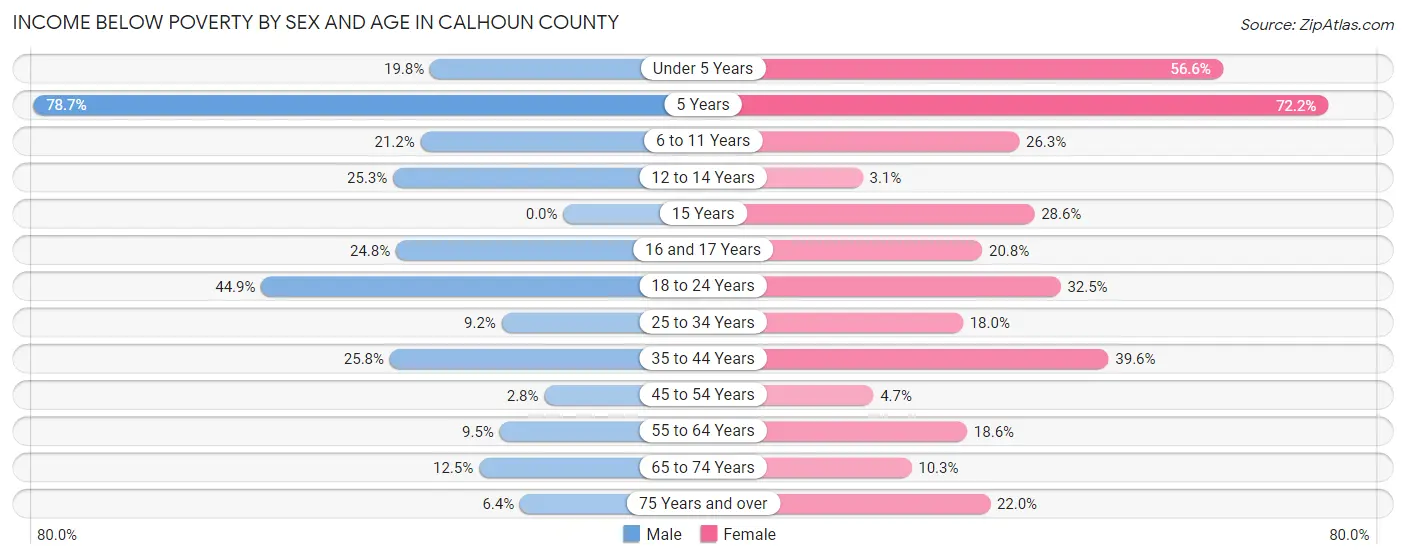
| Age Bracket | Male | Female |
| Under 5 Years | 56 (19.8%) | 164 (56.6%) |
| 5 Years | 122 (78.7%) | 39 (72.2%) |
| 6 to 11 Years | 84 (21.2%) | 105 (26.3%) |
| 12 to 14 Years | 91 (25.3%) | 7 (3.1%) |
| 15 Years | 0 (0.0%) | 34 (28.6%) |
| 16 and 17 Years | 38 (24.8%) | 20 (20.8%) |
| 18 to 24 Years | 235 (44.9%) | 126 (32.5%) |
| 25 to 34 Years | 61 (9.2%) | 118 (18.0%) |
| 35 to 44 Years | 187 (25.8%) | 281 (39.6%) |
| 45 to 54 Years | 26 (2.8%) | 33 (4.7%) |
| 55 to 64 Years | 77 (9.5%) | 183 (18.6%) |
| 65 to 74 Years | 76 (12.5%) | 67 (10.3%) |
| 75 Years and over | 25 (6.4%) | 119 (22.0%) |
| Total | 1,078 (17.6%) | 1,296 (22.3%) |
Income Above Poverty by Sex and Age in Calhoun County
According to the poverty statistics in Calhoun County, males aged 15 years and females aged 12 to 14 years are the age groups that are most secure financially, with 100.0% of males and 96.9% of females in these age groups living above the poverty line.
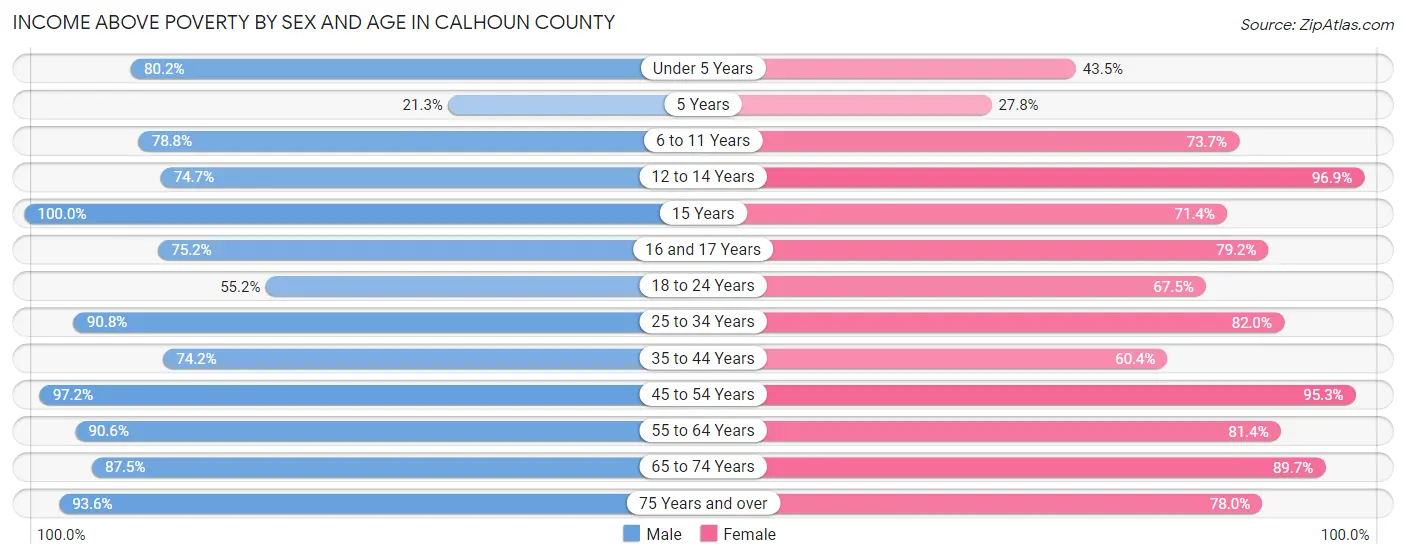
| Age Bracket | Male | Female |
| Under 5 Years | 227 (80.2%) | 126 (43.4%) |
| 5 Years | 33 (21.3%) | 15 (27.8%) |
| 6 to 11 Years | 312 (78.8%) | 294 (73.7%) |
| 12 to 14 Years | 269 (74.7%) | 220 (96.9%) |
| 15 Years | 109 (100.0%) | 85 (71.4%) |
| 16 and 17 Years | 115 (75.2%) | 76 (79.2%) |
| 18 to 24 Years | 289 (55.1%) | 262 (67.5%) |
| 25 to 34 Years | 605 (90.8%) | 539 (82.0%) |
| 35 to 44 Years | 539 (74.2%) | 429 (60.4%) |
| 45 to 54 Years | 897 (97.2%) | 674 (95.3%) |
| 55 to 64 Years | 738 (90.5%) | 802 (81.4%) |
| 65 to 74 Years | 531 (87.5%) | 582 (89.7%) |
| 75 Years and over | 364 (93.6%) | 422 (78.0%) |
| Total | 5,028 (82.4%) | 4,526 (77.7%) |
Income Below Poverty Among Married-Couple Families in Calhoun County
The poverty statistics for married-couple families in Calhoun County show that 4.8% or 94 of the total 1,971 families live below the poverty line. Families with 3 or 4 children have the highest poverty rate of 11.9%, comprising of 24 families. On the other hand, families with 5 or more children have the lowest poverty rate of 0.0%, which includes 0 families.
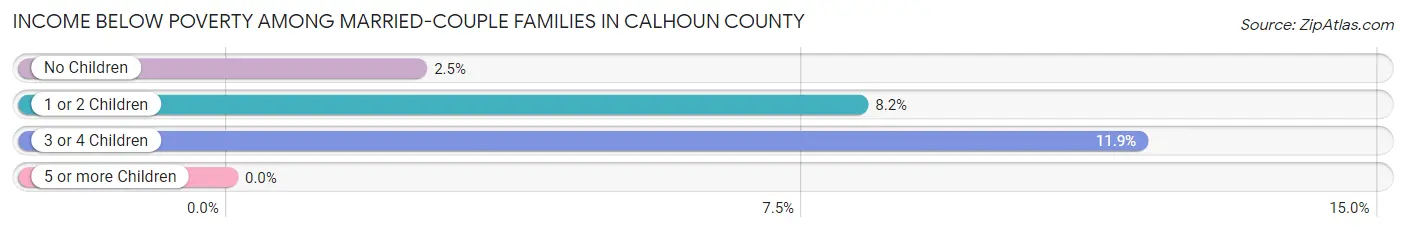
| Children | Above Poverty | Below Poverty |
| No Children | 1,262 (97.5%) | 32 (2.5%) |
| 1 or 2 Children | 424 (91.8%) | 38 (8.2%) |
| 3 or 4 Children | 178 (88.1%) | 24 (11.9%) |
| 5 or more Children | 13 (100.0%) | 0 (0.0%) |
| Total | 1,877 (95.2%) | 94 (4.8%) |
Income Below Poverty Among Single-Parent Households in Calhoun County
According to the poverty data in Calhoun County, 52.3% or 104 single-father households and 39.9% or 236 single-mother households are living below the poverty line. Among single-father households, those with 3 or 4 children have the highest poverty rate, with 6 households (100.0%) experiencing poverty. Likewise, among single-mother households, those with 3 or 4 children have the highest poverty rate, with 108 households (71.1%) falling below the poverty line.
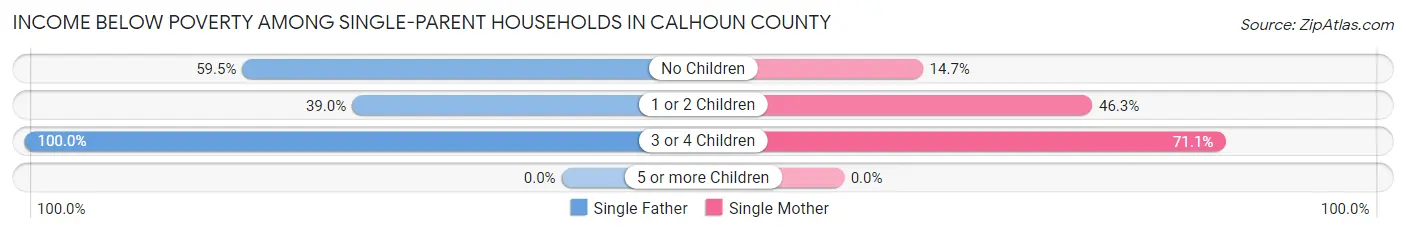
| Children | Single Father | Single Mother |
| No Children | 66 (59.5%) | 35 (14.7%) |
| 1 or 2 Children | 32 (39.0%) | 93 (46.3%) |
| 3 or 4 Children | 6 (100.0%) | 108 (71.1%) |
| 5 or more Children | 0 (0.0%) | 0 (0.0%) |
| Total | 104 (52.3%) | 236 (39.9%) |
Income Below Poverty Among Married-Couple vs Single-Parent Households in Calhoun County
The poverty data for Calhoun County shows that 94 of the married-couple family households (4.8%) and 340 of the single-parent households (43.0%) are living below the poverty level. Within the married-couple family households, those with 3 or 4 children have the highest poverty rate, with 24 households (11.9%) falling below the poverty line. Among the single-parent households, those with 3 or 4 children have the highest poverty rate, with 114 household (72.2%) living below poverty.
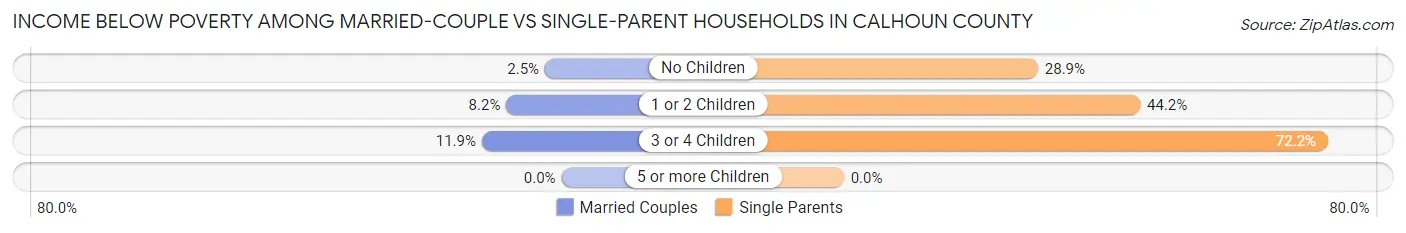
| Children | Married-Couple Families | Single-Parent Households |
| No Children | 32 (2.5%) | 101 (28.9%) |
| 1 or 2 Children | 38 (8.2%) | 125 (44.2%) |
| 3 or 4 Children | 24 (11.9%) | 114 (72.2%) |
| 5 or more Children | 0 (0.0%) | 0 (0.0%) |
| Total | 94 (4.8%) | 340 (43.0%) |
Race in Calhoun County
The most populous races in Calhoun County are White / Caucasian (10,578 | 76.9%), Black / African American (1,712 | 12.4%), and Two or more Races (1,014 | 7.4%).
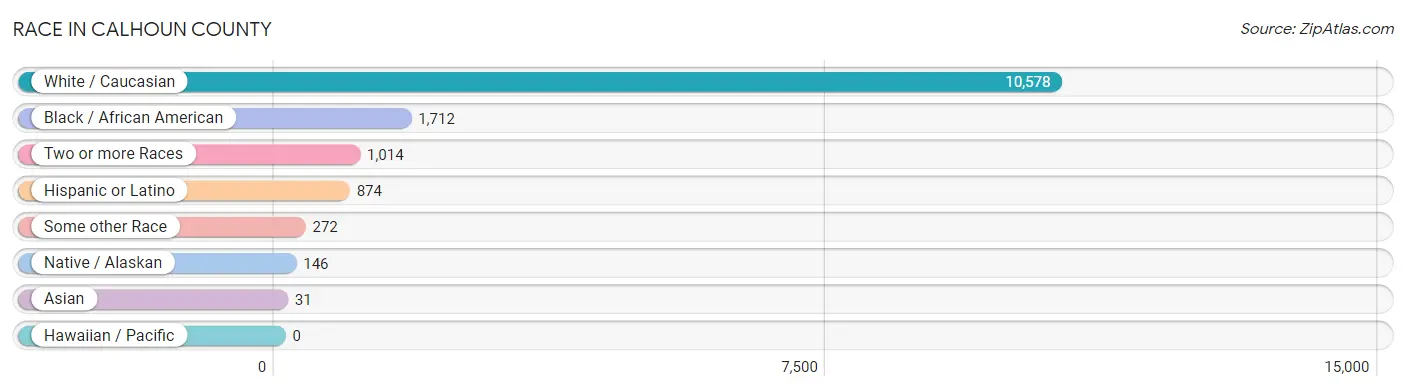
| Race | # Population | % Population |
| Asian | 31 | 0.2% |
| Black / African American | 1,712 | 12.4% |
| Hawaiian / Pacific | 0 | 0.0% |
| Hispanic or Latino | 874 | 6.4% |
| Native / Alaskan | 146 | 1.1% |
| White / Caucasian | 10,578 | 76.9% |
| Two or more Races | 1,014 | 7.4% |
| Some other Race | 272 | 2.0% |
| Total | 13,753 | 100.0% |
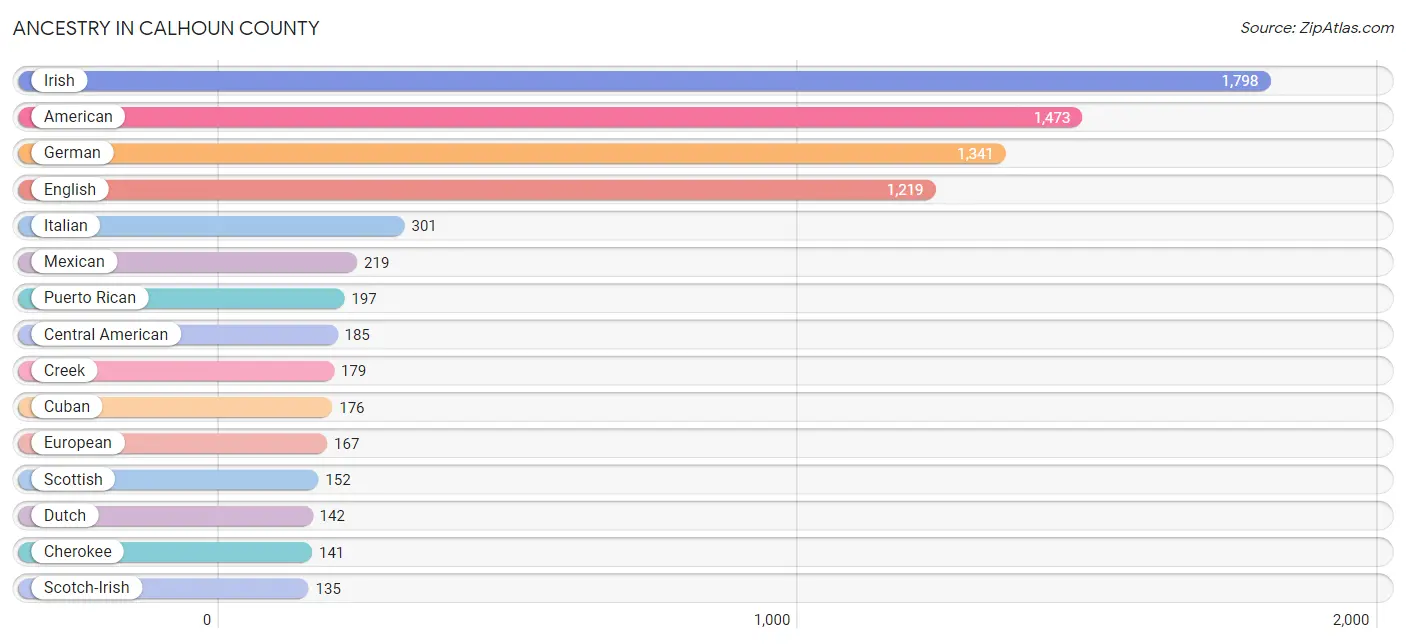
Ancestry in Calhoun County
The most populous ancestries reported in Calhoun County are Irish (1,798 | 13.1%), American (1,473 | 10.7%), German (1,341 | 9.8%), English (1,219 | 8.9%), and Italian (301 | 2.2%), together accounting for 44.6% of all Calhoun County residents.
| Ancestry | # Population | % Population |
| African | 18 | 0.1% |
| American | 1,473 | 10.7% |
| Arab | 40 | 0.3% |
| Austrian | 22 | 0.2% |
| British | 77 | 0.6% |
| Burmese | 2 | 0.0% |
| Canadian | 22 | 0.2% |
| Celtic | 17 | 0.1% |
| Central American | 185 | 1.3% |
| Central American Indian | 4 | 0.0% |
| Cherokee | 141 | 1.0% |
| Choctaw | 2 | 0.0% |
| Costa Rican | 35 | 0.3% |
| Creek | 179 | 1.3% |
| Cuban | 176 | 1.3% |
| Danish | 18 | 0.1% |
| Dominican | 10 | 0.1% |
| Dutch | 142 | 1.0% |
| English | 1,219 | 8.9% |
| European | 167 | 1.2% |
| Finnish | 7 | 0.1% |
| French | 117 | 0.9% |
| French American Indian | 11 | 0.1% |
| French Canadian | 15 | 0.1% |
| German | 1,341 | 9.8% |
| Guatemalan | 13 | 0.1% |
| Haitian | 64 | 0.5% |
| Honduran | 6 | 0.0% |
| Irish | 1,798 | 13.1% |
| Israeli | 10 | 0.1% |
| Italian | 301 | 2.2% |
| Jamaican | 66 | 0.5% |
| Korean | 19 | 0.1% |
| Lebanese | 23 | 0.2% |
| Lithuanian | 3 | 0.0% |
| Mexican | 219 | 1.6% |
| Nicaraguan | 126 | 0.9% |
| Norwegian | 8 | 0.1% |
| Osage | 5 | 0.0% |
| Panamanian | 5 | 0.0% |
| Polish | 81 | 0.6% |
| Portuguese | 1 | 0.0% |
| Puerto Rican | 197 | 1.4% |
| Romanian | 10 | 0.1% |
| Russian | 47 | 0.3% |
| Scotch-Irish | 135 | 1.0% |
| Scottish | 152 | 1.1% |
| Seminole | 5 | 0.0% |
| Sioux | 37 | 0.3% |
| Slavic | 17 | 0.1% |
| South American | 14 | 0.1% |
| Spaniard | 5 | 0.0% |
| Sri Lankan | 20 | 0.2% |
| Subsaharan African | 18 | 0.1% |
| Swedish | 60 | 0.4% |
| Syrian | 11 | 0.1% |
| Venezuelan | 14 | 0.1% |
| Welsh | 22 | 0.2% | View All 58 Rows |
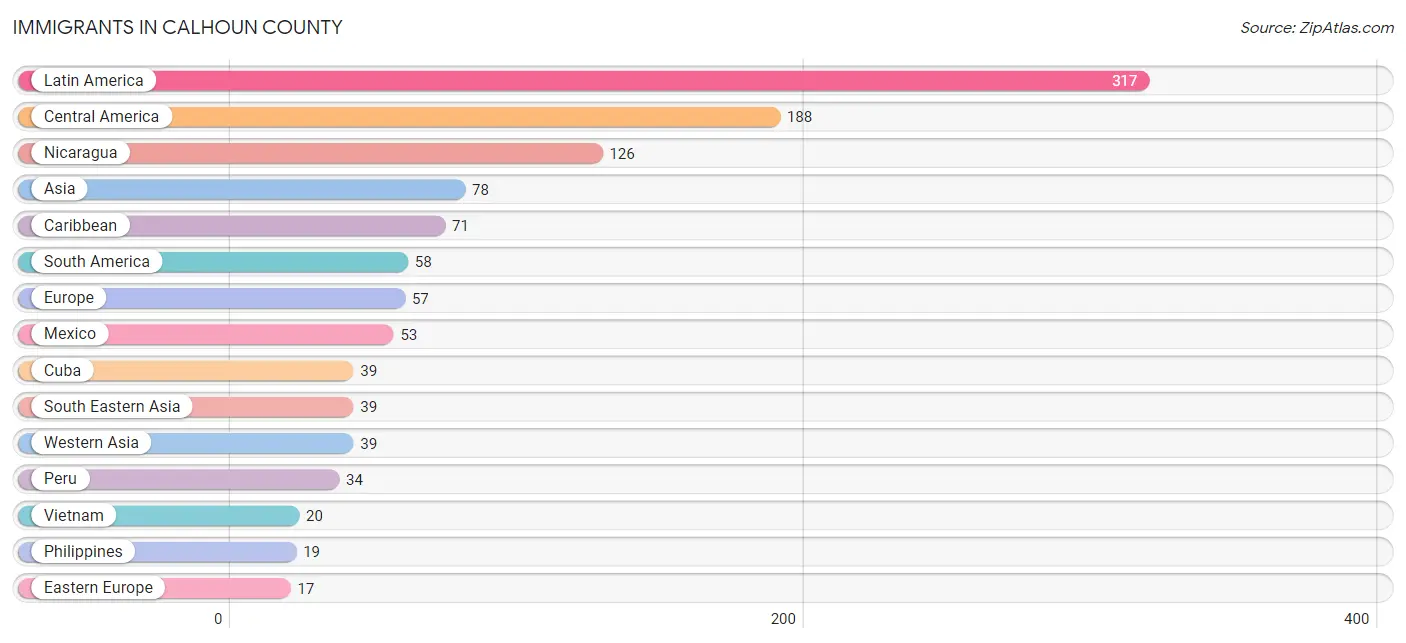
Immigrants in Calhoun County
The most numerous immigrant groups reported in Calhoun County came from Latin America (317 | 2.3%), Central America (188 | 1.4%), Nicaragua (126 | 0.9%), Asia (78 | 0.6%), and Caribbean (71 | 0.5%), together accounting for 5.7% of all Calhoun County residents.
| Immigration Origin | # Population | % Population |
| Asia | 78 | 0.6% |
| Azores | 1 | 0.0% |
| Barbados | 13 | 0.1% |
| Brazil | 10 | 0.1% |
| Bulgaria | 8 | 0.1% |
| Canada | 8 | 0.1% |
| Caribbean | 71 | 0.5% |
| Central America | 188 | 1.4% |
| Cuba | 39 | 0.3% |
| Eastern Europe | 17 | 0.1% |
| England | 14 | 0.1% |
| Europe | 57 | 0.4% |
| France | 5 | 0.0% |
| Germany | 12 | 0.1% |
| Haiti | 10 | 0.1% |
| Honduras | 4 | 0.0% |
| Jamaica | 9 | 0.1% |
| Jordan | 6 | 0.0% |
| Latin America | 317 | 2.3% |
| Mexico | 53 | 0.4% |
| Nicaragua | 126 | 0.9% |
| Northern Europe | 14 | 0.1% |
| Panama | 5 | 0.0% |
| Peru | 34 | 0.3% |
| Philippines | 19 | 0.1% |
| Portugal | 1 | 0.0% |
| South America | 58 | 0.4% |
| South Eastern Asia | 39 | 0.3% |
| Southern Europe | 1 | 0.0% |
| Venezuela | 14 | 0.1% |
| Vietnam | 20 | 0.2% |
| Western Asia | 39 | 0.3% |
| Western Europe | 17 | 0.1% | View All 33 Rows |
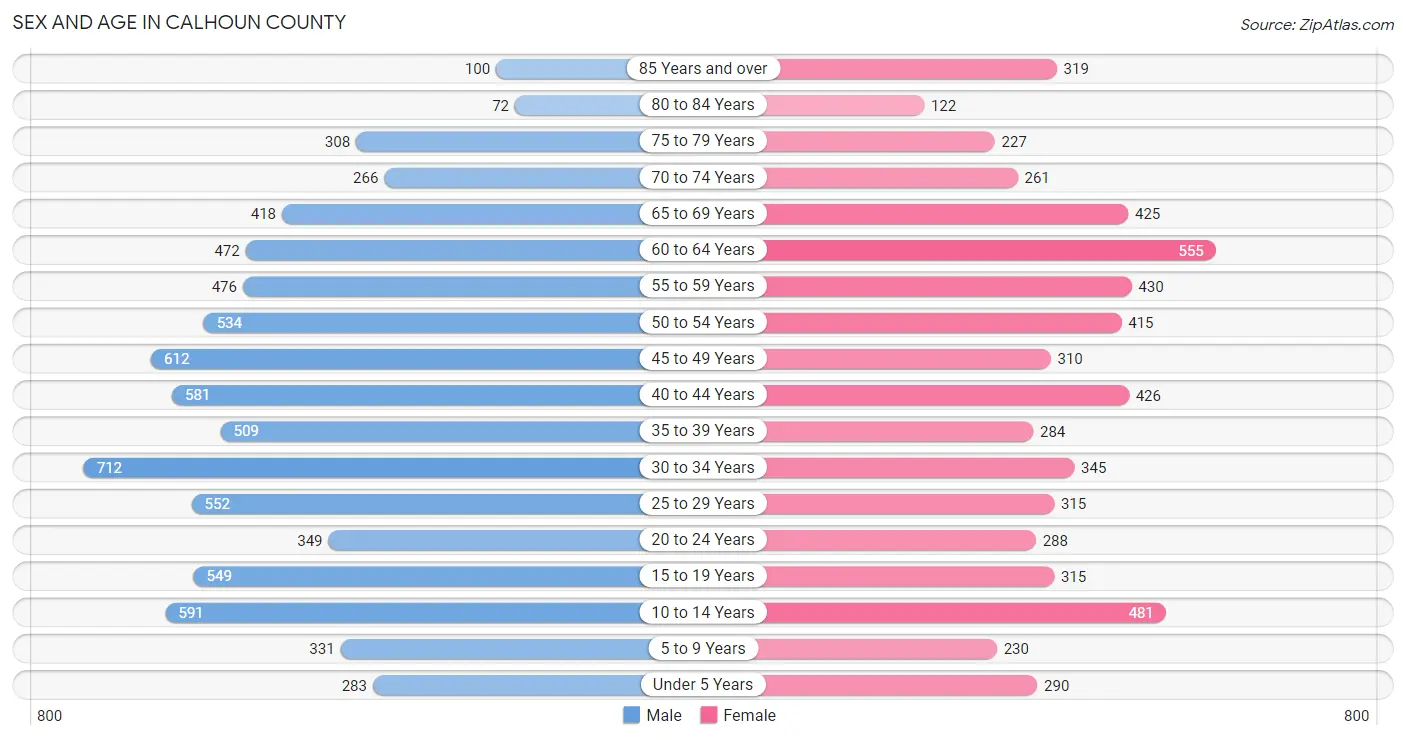
Sex and Age in Calhoun County
Sex and Age in Calhoun County
The most populous age groups in Calhoun County are 30 to 34 Years (712 | 9.2%) for men and 60 to 64 Years (555 | 9.2%) for women.
| Age Bracket | Male | Female |
| Under 5 Years | 283 (3.7%) | 290 (4.8%) |
| 5 to 9 Years | 331 (4.3%) | 230 (3.8%) |
| 10 to 14 Years | 591 (7.7%) | 481 (8.0%) |
| 15 to 19 Years | 549 (7.1%) | 315 (5.2%) |
| 20 to 24 Years | 349 (4.5%) | 288 (4.8%) |
| 25 to 29 Years | 552 (7.1%) | 315 (5.2%) |
| 30 to 34 Years | 712 (9.2%) | 345 (5.7%) |
| 35 to 39 Years | 509 (6.6%) | 284 (4.7%) |
| 40 to 44 Years | 581 (7.5%) | 426 (7.1%) |
| 45 to 49 Years | 612 (7.9%) | 310 (5.1%) |
| 50 to 54 Years | 534 (6.9%) | 415 (6.9%) |
| 55 to 59 Years | 476 (6.2%) | 430 (7.1%) |
| 60 to 64 Years | 472 (6.1%) | 555 (9.2%) |
| 65 to 69 Years | 418 (5.4%) | 425 (7.0%) |
| 70 to 74 Years | 266 (3.5%) | 261 (4.3%) |
| 75 to 79 Years | 308 (4.0%) | 227 (3.8%) |
| 80 to 84 Years | 72 (0.9%) | 122 (2.0%) |
| 85 Years and over | 100 (1.3%) | 319 (5.3%) |
| Total | 7,715 (100.0%) | 6,038 (100.0%) |
Families and Households in Calhoun County
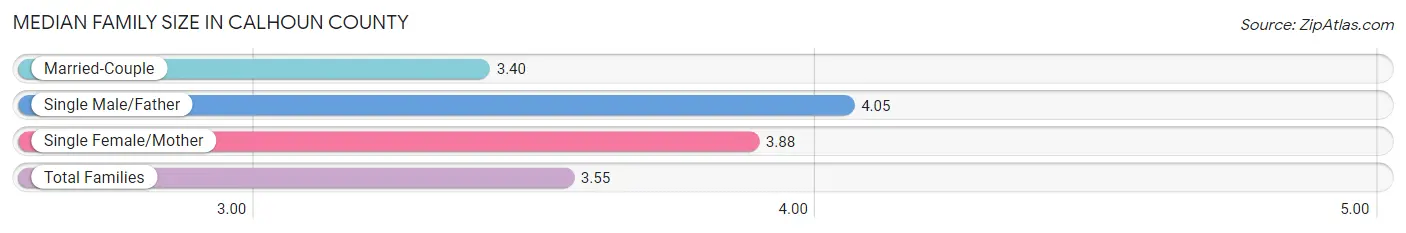
Median Family Size in Calhoun County
The median family size in Calhoun County is 3.55 persons per family, with single male/father families (199 | 7.2%) accounting for the largest median family size of 4.05 persons per family. On the other hand, married-couple families (1,971 | 71.4%) represent the smallest median family size with 3.40 persons per family.
| Family Type | # Families | Family Size |
| Married-Couple | 1,971 (71.4%) | 3.40 |
| Single Male/Father | 199 (7.2%) | 4.05 |
| Single Female/Mother | 591 (21.4%) | 3.88 |
| Total Families | 2,761 (100.0%) | 3.55 |
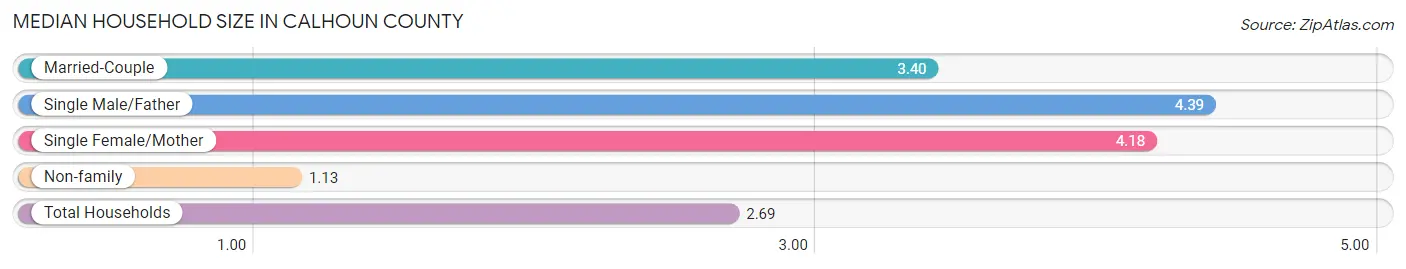
Median Household Size in Calhoun County
The median household size in Calhoun County is 2.69 persons per household, with single male/father households (199 | 4.5%) accounting for the largest median household size of 4.39 persons per household. non-family households (1,687 | 37.9%) represent the smallest median household size with 1.13 persons per household.
| Household Type | # Households | Household Size |
| Married-Couple | 1,971 (44.3%) | 3.40 |
| Single Male/Father | 199 (4.5%) | 4.39 |
| Single Female/Mother | 591 (13.3%) | 4.18 |
| Non-family | 1,687 (37.9%) | 1.13 |
| Total Households | 4,448 (100.0%) | 2.69 |
Household Size by Marriage Status in Calhoun County
Out of a total of 4,448 households in Calhoun County, 2,761 (62.1%) are family households, while 1,687 (37.9%) are nonfamily households. The most numerous type of family households are 2-person households, comprising 1,206, and the most common type of nonfamily households are 1-person households, comprising 1,549.
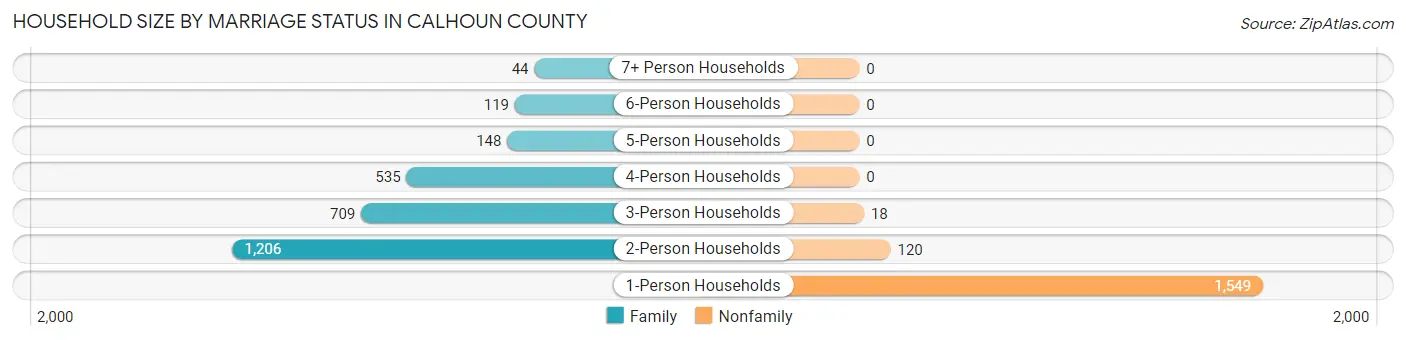
| Household Size | Family Households | Nonfamily Households |
| 1-Person Households | - | 1,549 (34.8%) |
| 2-Person Households | 1,206 (27.1%) | 120 (2.7%) |
| 3-Person Households | 709 (15.9%) | 18 (0.4%) |
| 4-Person Households | 535 (12.0%) | 0 (0.0%) |
| 5-Person Households | 148 (3.3%) | 0 (0.0%) |
| 6-Person Households | 119 (2.7%) | 0 (0.0%) |
| 7+ Person Households | 44 (1.0%) | 0 (0.0%) |
| Total | 2,761 (62.1%) | 1,687 (37.9%) |
Female Fertility in Calhoun County
Fertility by Age in Calhoun County
Average fertility rate in Calhoun County is 59.0 births per 1,000 women. Women in the age bracket of 20 to 34 years have the highest fertility rate with 138.0 births per 1,000 women. Women in the age bracket of 20 to 34 years acount for 94.2% of all women with births.
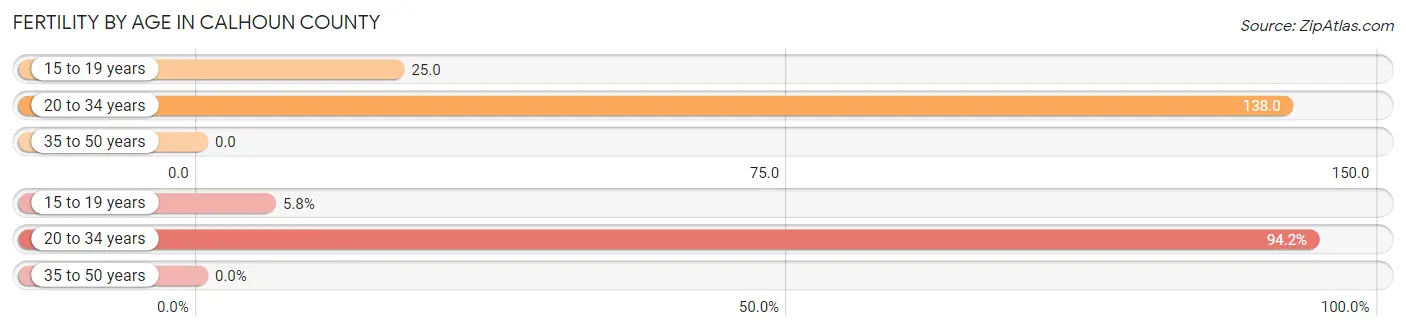
| Age Bracket | Women with Births | Births / 1,000 Women |
| 15 to 19 years | 8 (5.8%) | 25.0 |
| 20 to 34 years | 131 (94.2%) | 138.0 |
| 35 to 50 years | 0 (0.0%) | 0.0 |
| Total | 139 (100.0%) | 59.0 |
Fertility by Age by Marriage Status in Calhoun County
49.6% of women with births (139) in Calhoun County are married. The highest percentage of unmarried women with births falls into 15 to 19 years age bracket with 100.0% of them unmarried at the time of birth, while the lowest percentage of unmarried women with births belong to 20 to 34 years age bracket with 47.3% of them unmarried.
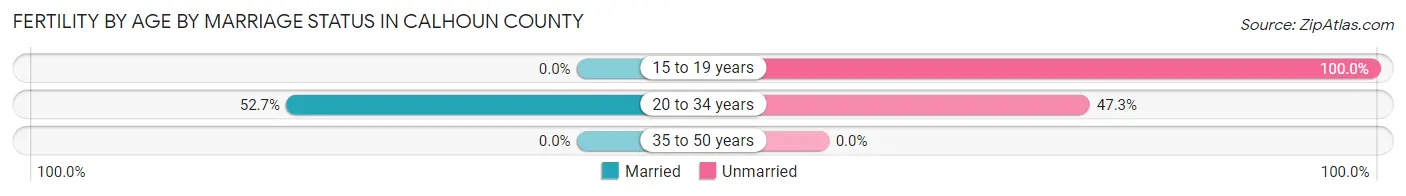
| Age Bracket | Married | Unmarried |
| 15 to 19 years | 0 (0.0%) | 8 (100.0%) |
| 20 to 34 years | 69 (52.7%) | 62 (47.3%) |
| 35 to 50 years | 0 (0.0%) | 0 (0.0%) |
| Total | 69 (49.6%) | 70 (50.4%) |
Fertility by Education in Calhoun County
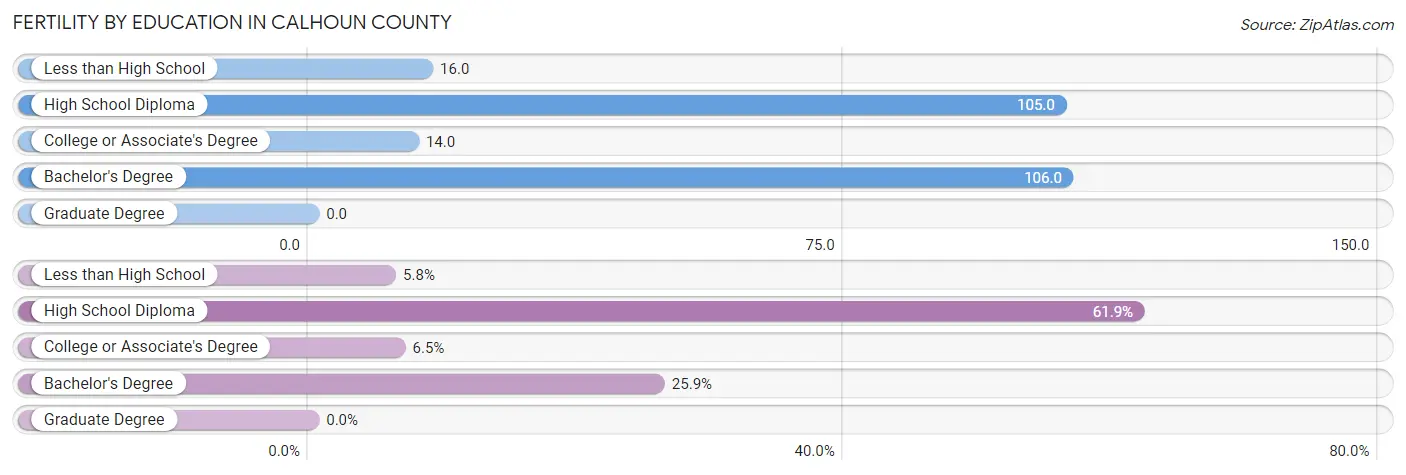
| Educational Attainment | Women with Births | Births / 1,000 Women |
| Less than High School | 8 (5.8%) | 16.0 |
| High School Diploma | 86 (61.9%) | 105.0 |
| College or Associate's Degree | 9 (6.5%) | 14.0 |
| Bachelor's Degree | 36 (25.9%) | 106.0 |
| Graduate Degree | 0 (0.0%) | 0.0 |
| Total | 139 (100.0%) | 59.0 |
Fertility by Education by Marriage Status in Calhoun County
50.4% of women with births in Calhoun County are unmarried. Women with the educational attainment of college or associate's degree are most likely to be married with 77.8% of them married at childbirth, while women with the educational attainment of less than high school are least likely to be married with 100.0% of them unmarried at childbirth.
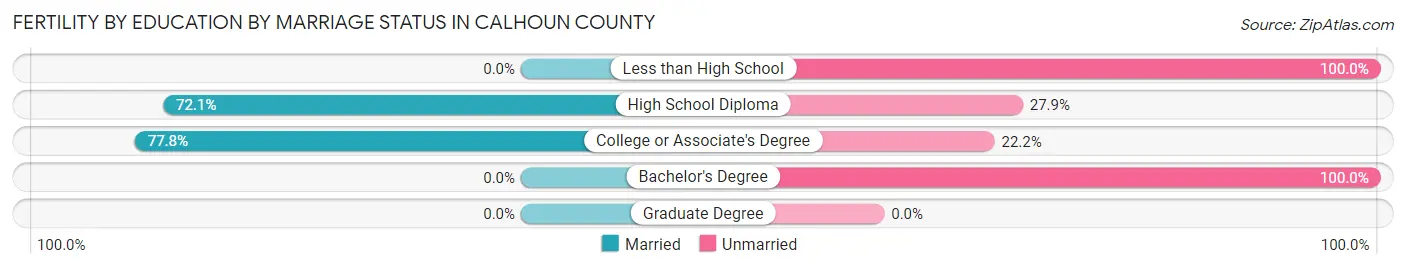
| Educational Attainment | Married | Unmarried |
| Less than High School | 0 (0.0%) | 8 (100.0%) |
| High School Diploma | 62 (72.1%) | 24 (27.9%) |
| College or Associate's Degree | 7 (77.8%) | 2 (22.2%) |
| Bachelor's Degree | 0 (0.0%) | 36 (100.0%) |
| Graduate Degree | 0 (0.0%) | 0 (0.0%) |
| Total | 69 (49.6%) | 70 (50.4%) |
Employment Characteristics in Calhoun County
Employment by Class of Employer in Calhoun County
Among the 4,482 employed individuals in Calhoun County, private company employees (2,437 | 54.4%), state government employees (562 | 12.5%), and local government employees (466 | 10.4%) make up the most common classes of employment.
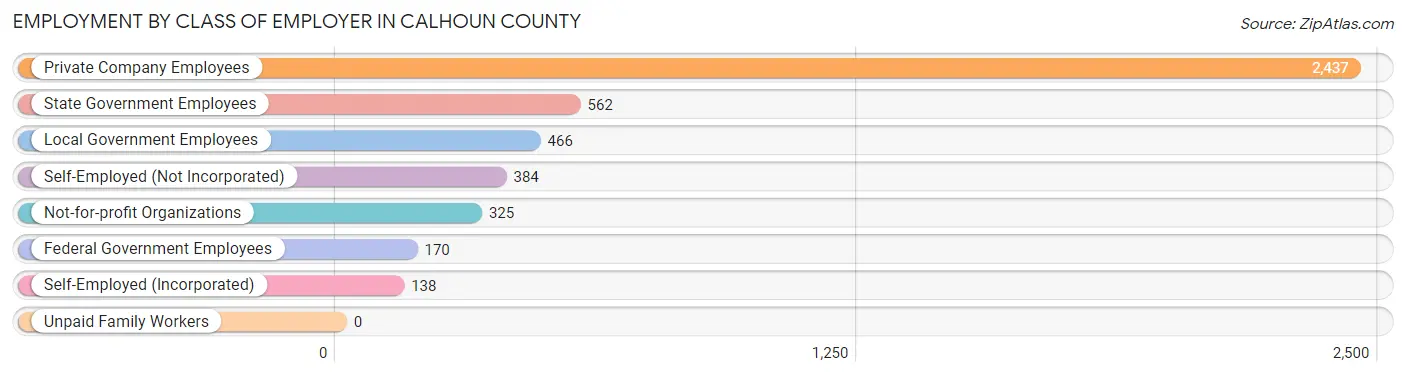
| Employer Class | # Employees | % Employees |
| Private Company Employees | 2,437 | 54.4% |
| Self-Employed (Incorporated) | 138 | 3.1% |
| Self-Employed (Not Incorporated) | 384 | 8.6% |
| Not-for-profit Organizations | 325 | 7.2% |
| Local Government Employees | 466 | 10.4% |
| State Government Employees | 562 | 12.5% |
| Federal Government Employees | 170 | 3.8% |
| Unpaid Family Workers | 0 | 0.0% |
| Total | 4,482 | 100.0% |
Employment Status by Age in Calhoun County
According to the labor force statistics for Calhoun County, out of the total population over 16 years of age (11,319), 41.4% or 4,686 individuals are in the labor force, with 3.7% or 173 of them unemployed. The age group with the highest labor force participation rate is 30 to 34 years, with 56.2% or 594 individuals in the labor force. Within the labor force, the 16 to 19 years age range has the highest percentage of unemployed individuals, with 40.5% or 113 of them being unemployed.
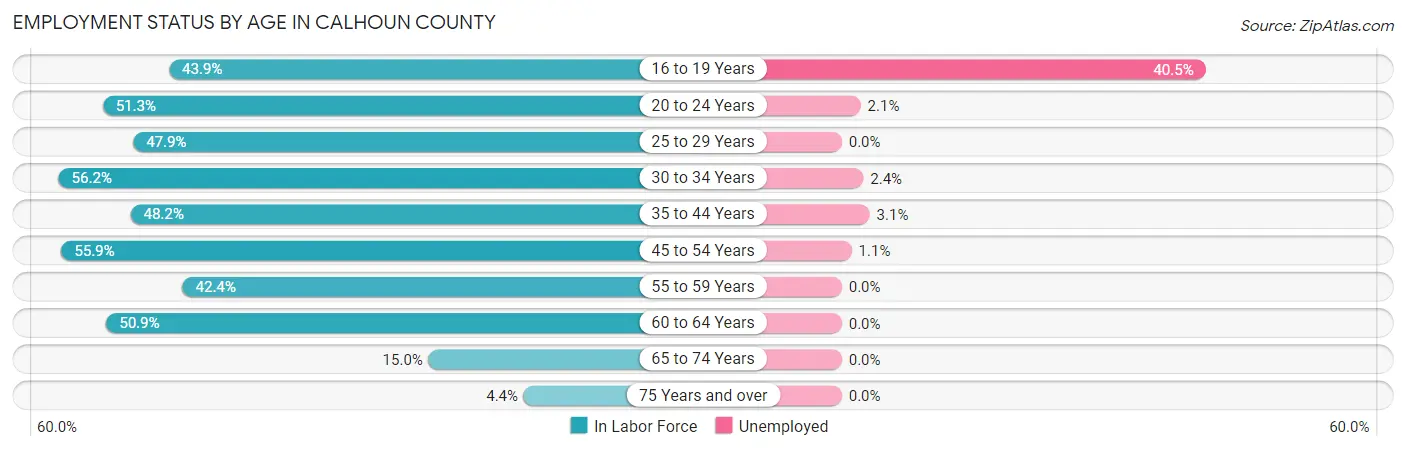
| Age Bracket | In Labor Force | Unemployed |
| 16 to 19 Years | 279 (43.9%) | 113 (40.5%) |
| 20 to 24 Years | 327 (51.3%) | 7 (2.1%) |
| 25 to 29 Years | 415 (47.9%) | 0 (0.0%) |
| 30 to 34 Years | 594 (56.2%) | 14 (2.4%) |
| 35 to 44 Years | 868 (48.2%) | 27 (3.1%) |
| 45 to 54 Years | 1,046 (55.9%) | 12 (1.1%) |
| 55 to 59 Years | 384 (42.4%) | 0 (0.0%) |
| 60 to 64 Years | 523 (50.9%) | 0 (0.0%) |
| 65 to 74 Years | 206 (15.0%) | 0 (0.0%) |
| 75 Years and over | 51 (4.4%) | 0 (0.0%) |
| Total | 4,686 (41.4%) | 173 (3.7%) |
Employment Status by Educational Attainment in Calhoun County
According to labor force statistics for Calhoun County, 50.9% of individuals (3,832) out of the total population between 25 and 64 years of age (7,528) are in the labor force, with 1.4% or 54 of them being unemployed. The group with the highest labor force participation rate are those with the educational attainment of bachelor's degree or higher, with 74.7% or 546 individuals in the labor force. Within the labor force, individuals with high school diploma education have the highest percentage of unemployment, with 2.4% or 40 of them being unemployed.
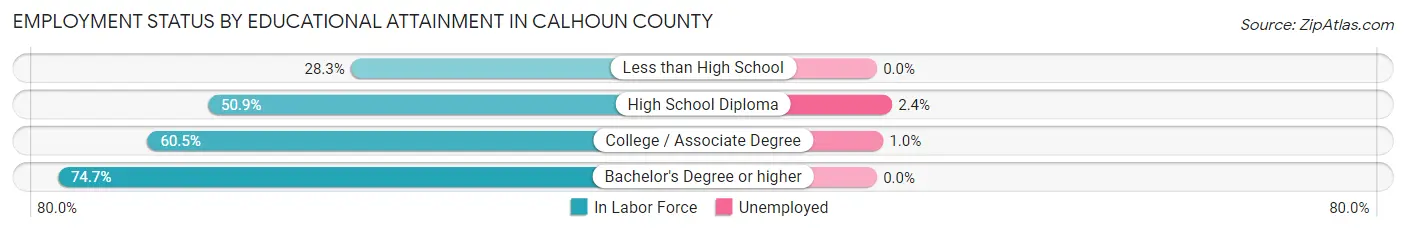
| Educational Attainment | In Labor Force | Unemployed |
| Less than High School | 451 (28.3%) | 0 (0.0%) |
| High School Diploma | 1,680 (50.9%) | 79 (2.4%) |
| College / Associate Degree | 1,152 (60.5%) | 19 (1.0%) |
| Bachelor's Degree or higher | 546 (74.7%) | 0 (0.0%) |
| Total | 3,832 (50.9%) | 105 (1.4%) |
Employment Occupations by Sex in Calhoun County
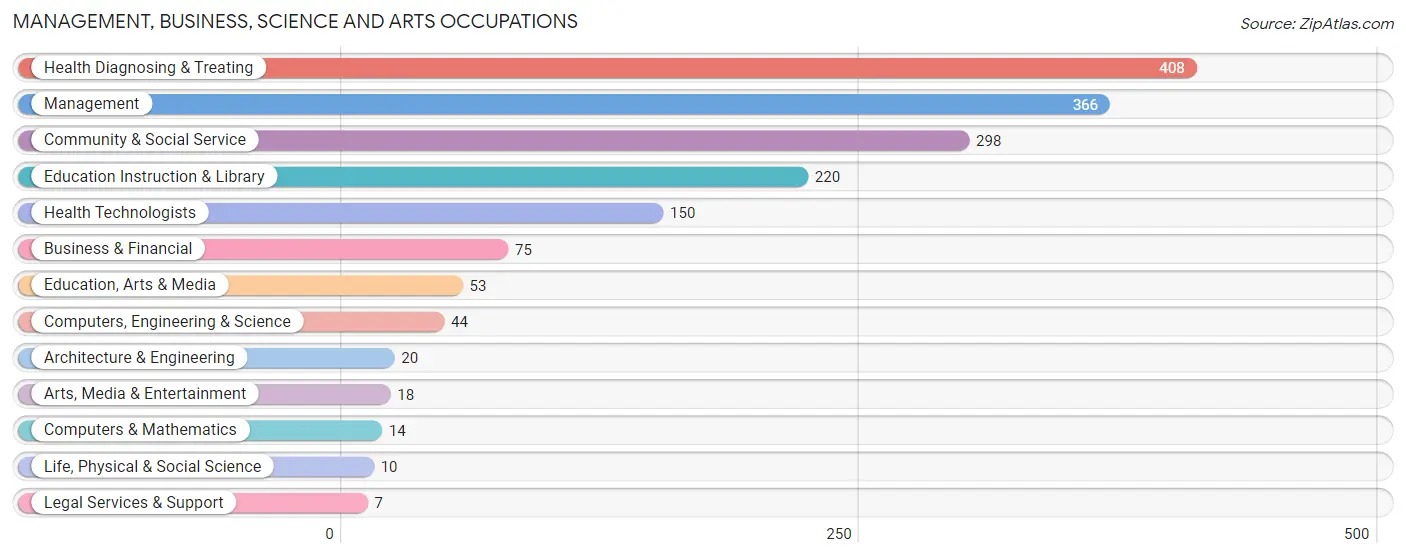
Management, Business, Science and Arts Occupations
The most common Management, Business, Science and Arts occupations in Calhoun County are Health Diagnosing & Treating (408 | 9.0%), Management (366 | 8.1%), Community & Social Service (298 | 6.6%), Education Instruction & Library (220 | 4.9%), and Health Technologists (150 | 3.3%).
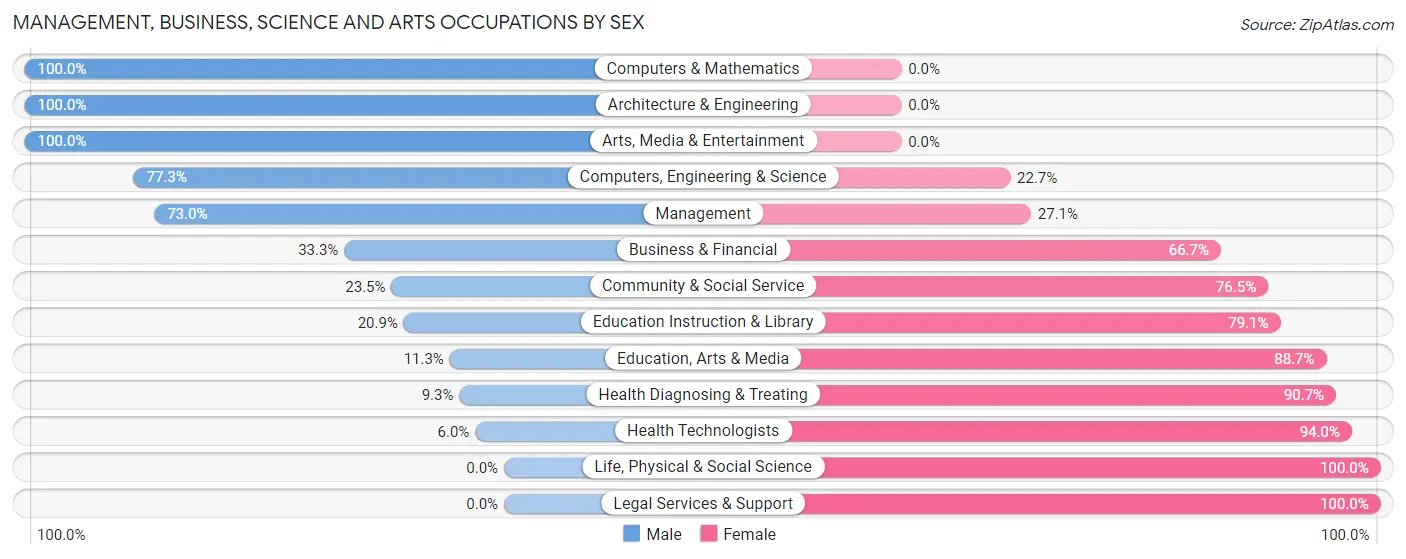
Management, Business, Science and Arts Occupations by Sex
Within the Management, Business, Science and Arts occupations in Calhoun County, the most male-oriented occupations are Computers & Mathematics (100.0%), Architecture & Engineering (100.0%), and Arts, Media & Entertainment (100.0%), while the most female-oriented occupations are Life, Physical & Social Science (100.0%), Legal Services & Support (100.0%), and Health Technologists (94.0%).
| Occupation | Male | Female |
| Management | 267 (73.0%) | 99 (27.1%) |
| Business & Financial | 25 (33.3%) | 50 (66.7%) |
| Computers, Engineering & Science | 34 (77.3%) | 10 (22.7%) |
| Computers & Mathematics | 14 (100.0%) | 0 (0.0%) |
| Architecture & Engineering | 20 (100.0%) | 0 (0.0%) |
| Life, Physical & Social Science | 0 (0.0%) | 10 (100.0%) |
| Community & Social Service | 70 (23.5%) | 228 (76.5%) |
| Education, Arts & Media | 6 (11.3%) | 47 (88.7%) |
| Legal Services & Support | 0 (0.0%) | 7 (100.0%) |
| Education Instruction & Library | 46 (20.9%) | 174 (79.1%) |
| Arts, Media & Entertainment | 18 (100.0%) | 0 (0.0%) |
| Health Diagnosing & Treating | 38 (9.3%) | 370 (90.7%) |
| Health Technologists | 9 (6.0%) | 141 (94.0%) |
| Total (Category) | 434 (36.4%) | 757 (63.6%) |
| Total (Overall) | 2,522 (55.8%) | 1,996 (44.2%) |
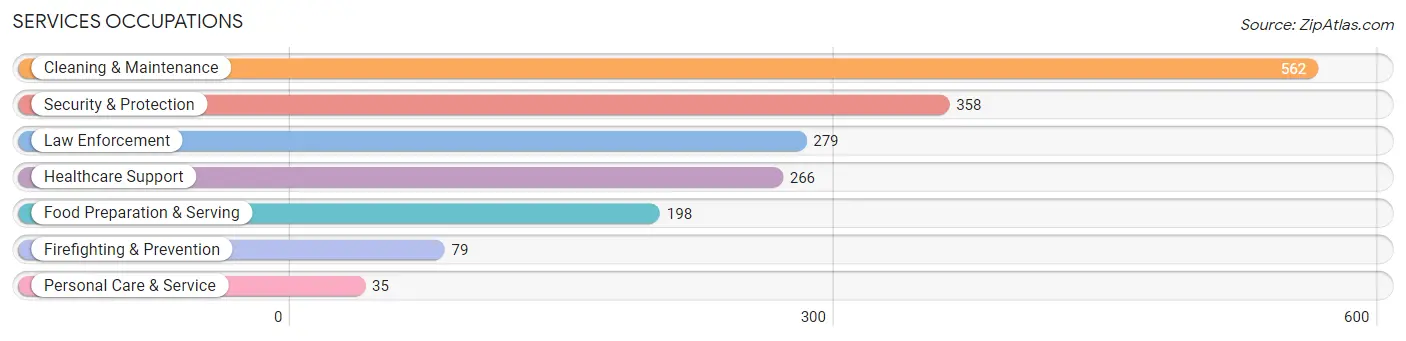
Services Occupations
The most common Services occupations in Calhoun County are Cleaning & Maintenance (562 | 12.4%), Security & Protection (358 | 7.9%), Law Enforcement (279 | 6.2%), Healthcare Support (266 | 5.9%), and Food Preparation & Serving (198 | 4.4%).
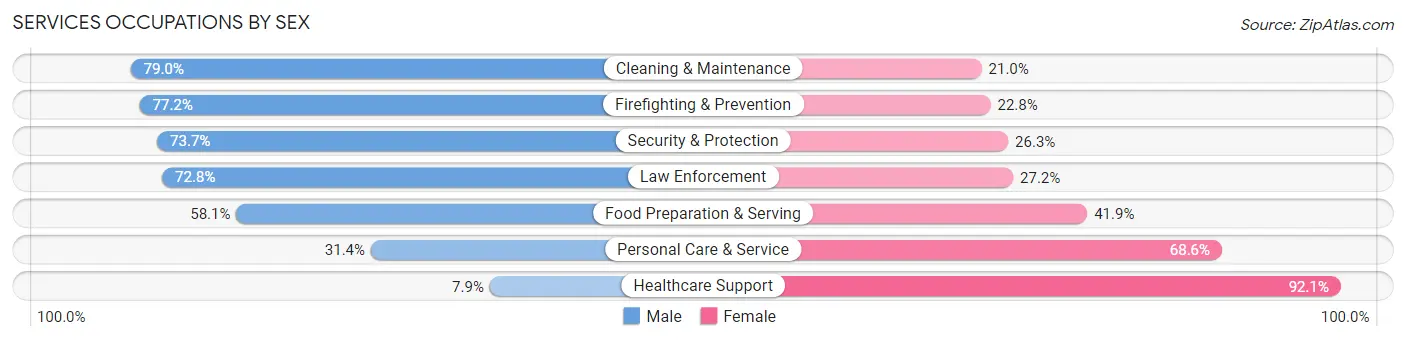
Services Occupations by Sex
Within the Services occupations in Calhoun County, the most male-oriented occupations are Cleaning & Maintenance (79.0%), Firefighting & Prevention (77.2%), and Security & Protection (73.7%), while the most female-oriented occupations are Healthcare Support (92.1%), Personal Care & Service (68.6%), and Food Preparation & Serving (41.9%).
| Occupation | Male | Female |
| Healthcare Support | 21 (7.9%) | 245 (92.1%) |
| Security & Protection | 264 (73.7%) | 94 (26.3%) |
| Firefighting & Prevention | 61 (77.2%) | 18 (22.8%) |
| Law Enforcement | 203 (72.8%) | 76 (27.2%) |
| Food Preparation & Serving | 115 (58.1%) | 83 (41.9%) |
| Cleaning & Maintenance | 444 (79.0%) | 118 (21.0%) |
| Personal Care & Service | 11 (31.4%) | 24 (68.6%) |
| Total (Category) | 855 (60.3%) | 564 (39.8%) |
| Total (Overall) | 2,522 (55.8%) | 1,996 (44.2%) |
Sales and Office Occupations
The most common Sales and Office occupations in Calhoun County are Office & Administration (410 | 9.1%), and Sales & Related (335 | 7.4%).

Sales and Office Occupations by Sex

| Occupation | Male | Female |
| Sales & Related | 148 (44.2%) | 187 (55.8%) |
| Office & Administration | 71 (17.3%) | 339 (82.7%) |
| Total (Category) | 219 (29.4%) | 526 (70.6%) |
| Total (Overall) | 2,522 (55.8%) | 1,996 (44.2%) |
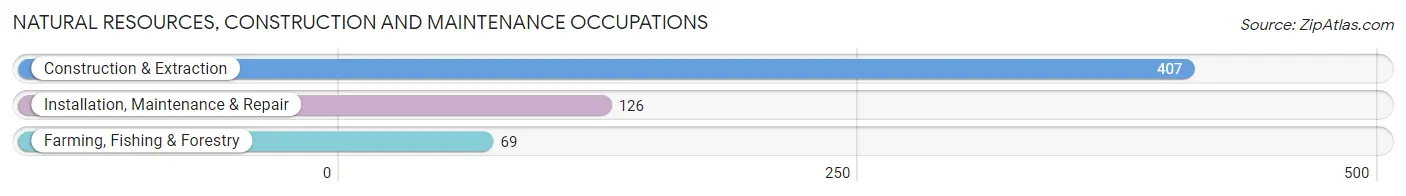
Natural Resources, Construction and Maintenance Occupations
The most common Natural Resources, Construction and Maintenance occupations in Calhoun County are Construction & Extraction (407 | 9.0%), Installation, Maintenance & Repair (126 | 2.8%), and Farming, Fishing & Forestry (69 | 1.5%).
Natural Resources, Construction and Maintenance Occupations by Sex
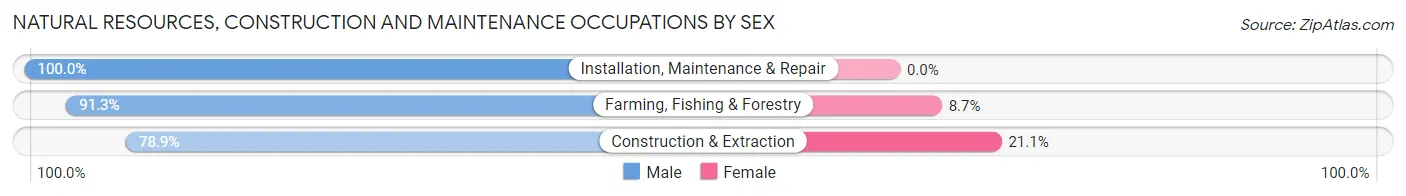
| Occupation | Male | Female |
| Farming, Fishing & Forestry | 63 (91.3%) | 6 (8.7%) |
| Construction & Extraction | 321 (78.9%) | 86 (21.1%) |
| Installation, Maintenance & Repair | 126 (100.0%) | 0 (0.0%) |
| Total (Category) | 510 (84.7%) | 92 (15.3%) |
| Total (Overall) | 2,522 (55.8%) | 1,996 (44.2%) |
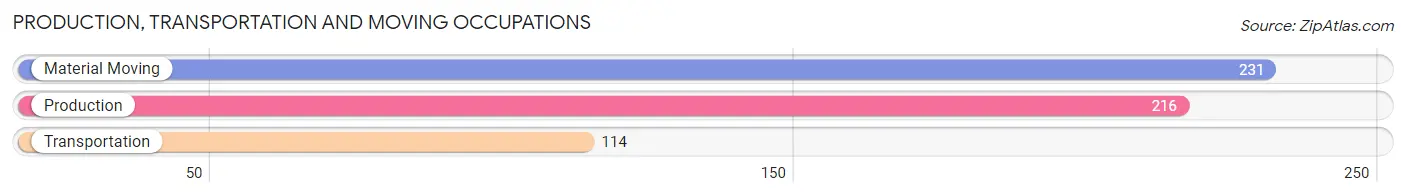
Production, Transportation and Moving Occupations
The most common Production, Transportation and Moving occupations in Calhoun County are Material Moving (231 | 5.1%), Production (216 | 4.8%), and Transportation (114 | 2.5%).
Production, Transportation and Moving Occupations by Sex
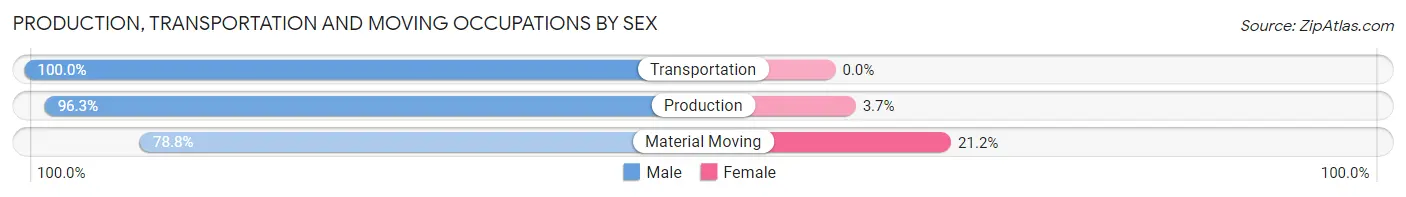
| Occupation | Male | Female |
| Production | 208 (96.3%) | 8 (3.7%) |
| Transportation | 114 (100.0%) | 0 (0.0%) |
| Material Moving | 182 (78.8%) | 49 (21.2%) |
| Total (Category) | 504 (89.8%) | 57 (10.2%) |
| Total (Overall) | 2,522 (55.8%) | 1,996 (44.2%) |
Employment Industries by Sex in Calhoun County
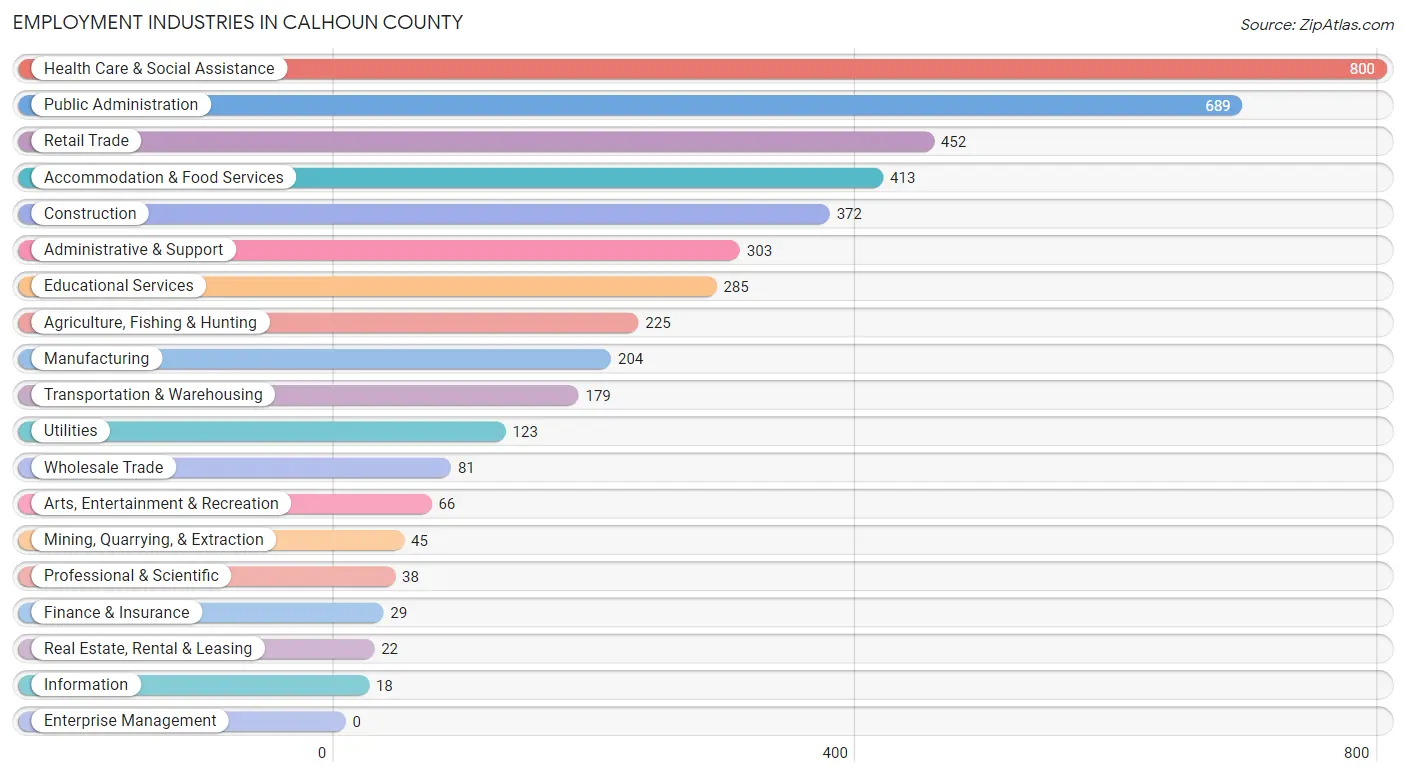
Employment Industries in Calhoun County
The major employment industries in Calhoun County include Health Care & Social Assistance (800 | 17.7%), Public Administration (689 | 15.2%), Retail Trade (452 | 10.0%), Accommodation & Food Services (413 | 9.1%), and Construction (372 | 8.2%).
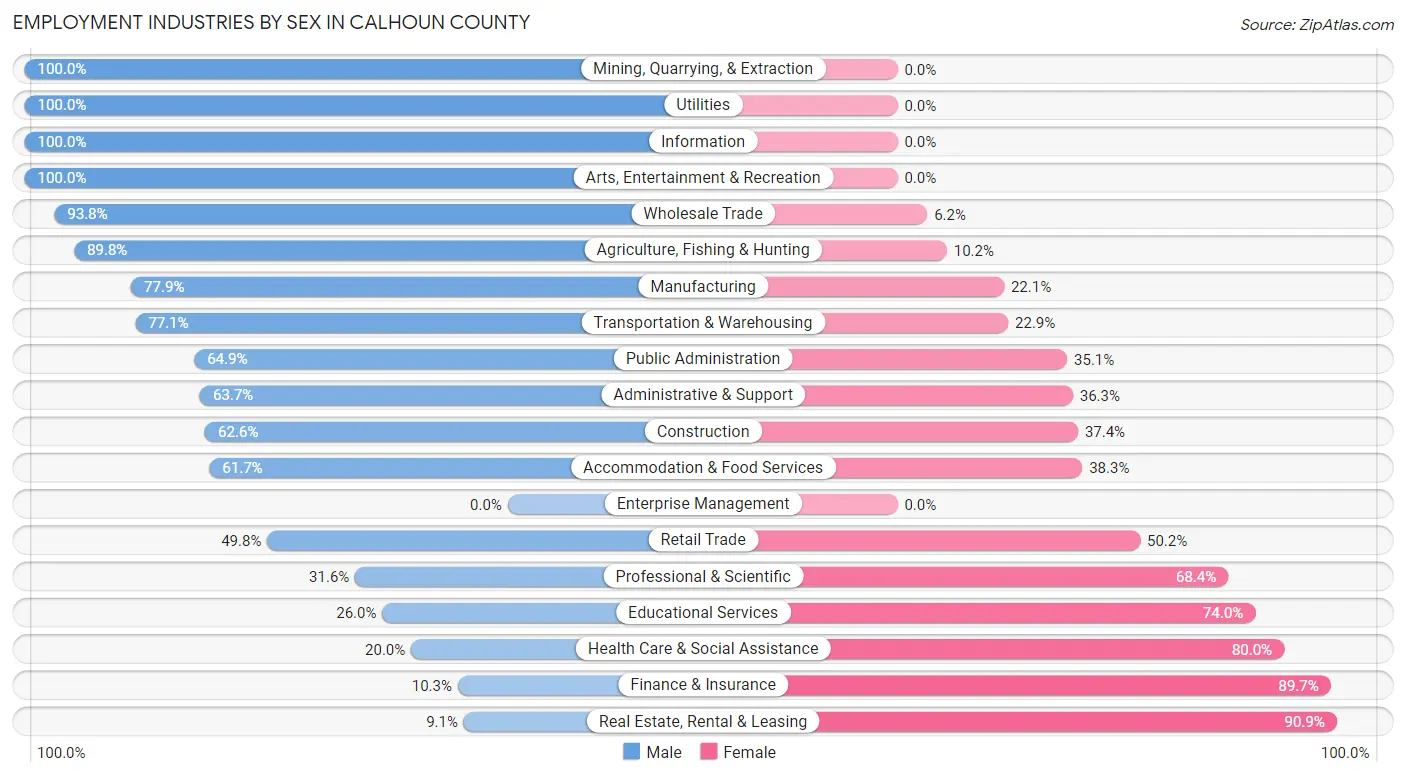
Employment Industries by Sex in Calhoun County
The Calhoun County industries that see more men than women are Mining, Quarrying, & Extraction (100.0%), Utilities (100.0%), and Information (100.0%), whereas the industries that tend to have a higher number of women are Real Estate, Rental & Leasing (90.9%), Finance & Insurance (89.7%), and Health Care & Social Assistance (80.0%).
| Industry | Male | Female |
| Agriculture, Fishing & Hunting | 202 (89.8%) | 23 (10.2%) |
| Mining, Quarrying, & Extraction | 45 (100.0%) | 0 (0.0%) |
| Construction | 233 (62.6%) | 139 (37.4%) |
| Manufacturing | 159 (77.9%) | 45 (22.1%) |
| Wholesale Trade | 76 (93.8%) | 5 (6.2%) |
| Retail Trade | 225 (49.8%) | 227 (50.2%) |
| Transportation & Warehousing | 138 (77.1%) | 41 (22.9%) |
| Utilities | 123 (100.0%) | 0 (0.0%) |
| Information | 18 (100.0%) | 0 (0.0%) |
| Finance & Insurance | 3 (10.3%) | 26 (89.7%) |
| Real Estate, Rental & Leasing | 2 (9.1%) | 20 (90.9%) |
| Professional & Scientific | 12 (31.6%) | 26 (68.4%) |
| Enterprise Management | 0 (0.0%) | 0 (0.0%) |
| Administrative & Support | 193 (63.7%) | 110 (36.3%) |
| Educational Services | 74 (26.0%) | 211 (74.0%) |
| Health Care & Social Assistance | 160 (20.0%) | 640 (80.0%) |
| Arts, Entertainment & Recreation | 66 (100.0%) | 0 (0.0%) |
| Accommodation & Food Services | 255 (61.7%) | 158 (38.3%) |
| Public Administration | 447 (64.9%) | 242 (35.1%) |
| Total | 2,522 (55.8%) | 1,996 (44.2%) |
Education in Calhoun County
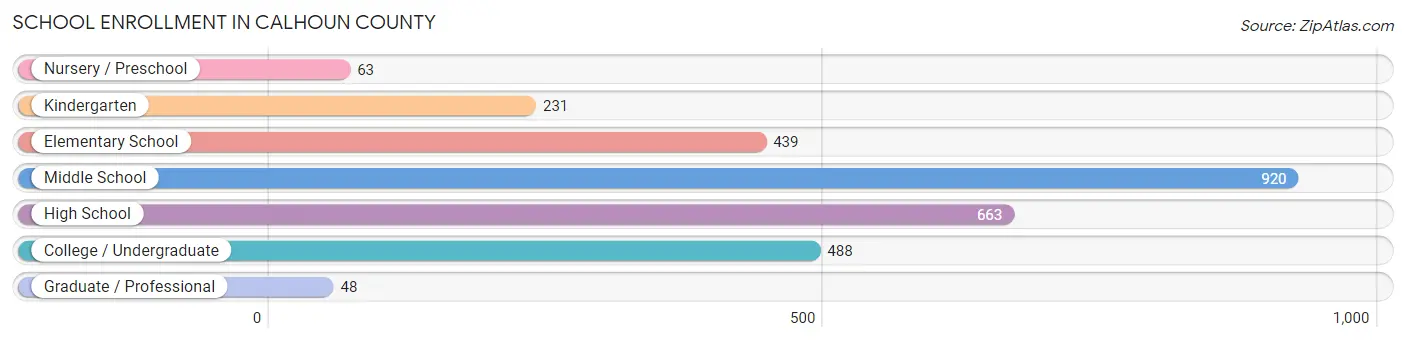
School Enrollment in Calhoun County
The most common levels of schooling among the 2,852 students in Calhoun County are middle school (920 | 32.3%), high school (663 | 23.3%), and college / undergraduate (488 | 17.1%).
| School Level | # Students | % Students |
| Nursery / Preschool | 63 | 2.2% |
| Kindergarten | 231 | 8.1% |
| Elementary School | 439 | 15.4% |
| Middle School | 920 | 32.3% |
| High School | 663 | 23.3% |
| College / Undergraduate | 488 | 17.1% |
| Graduate / Professional | 48 | 1.7% |
| Total | 2,852 | 100.0% |
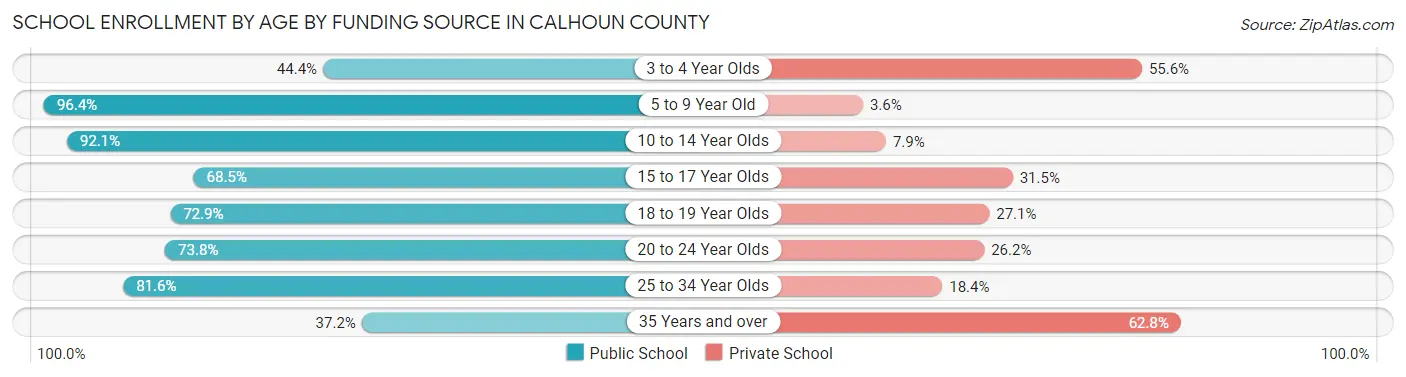
School Enrollment by Age by Funding Source in Calhoun County
Out of a total of 2,852 students who are enrolled in schools in Calhoun County, 550 (19.3%) attend a private institution, while the remaining 2,302 (80.7%) are enrolled in public schools. The age group of 35 years and over has the highest likelihood of being enrolled in private schools, with 140 (62.8% in the age bracket) enrolled. Conversely, the age group of 5 to 9 year old has the lowest likelihood of being enrolled in a private school, with 535 (96.4% in the age bracket) attending a public institution.
| Age Bracket | Public School | Private School |
| 3 to 4 Year Olds | 28 (44.4%) | 35 (55.6%) |
| 5 to 9 Year Old | 535 (96.4%) | 20 (3.6%) |
| 10 to 14 Year Olds | 935 (92.1%) | 80 (7.9%) |
| 15 to 17 Year Olds | 322 (68.5%) | 148 (31.5%) |
| 18 to 19 Year Olds | 137 (72.9%) | 51 (27.1%) |
| 20 to 24 Year Olds | 141 (73.8%) | 50 (26.2%) |
| 25 to 34 Year Olds | 120 (81.6%) | 27 (18.4%) |
| 35 Years and over | 83 (37.2%) | 140 (62.8%) |
| Total | 2,302 (80.7%) | 550 (19.3%) |
Educational Attainment by Field of Study in Calhoun County
Education (258 | 20.9%), science & technology (246 | 19.9%), business (218 | 17.6%), arts & humanities (142 | 11.5%), and social sciences (82 | 6.6%) are the most common fields of study among 1,236 individuals in Calhoun County who have obtained a bachelor's degree or higher.
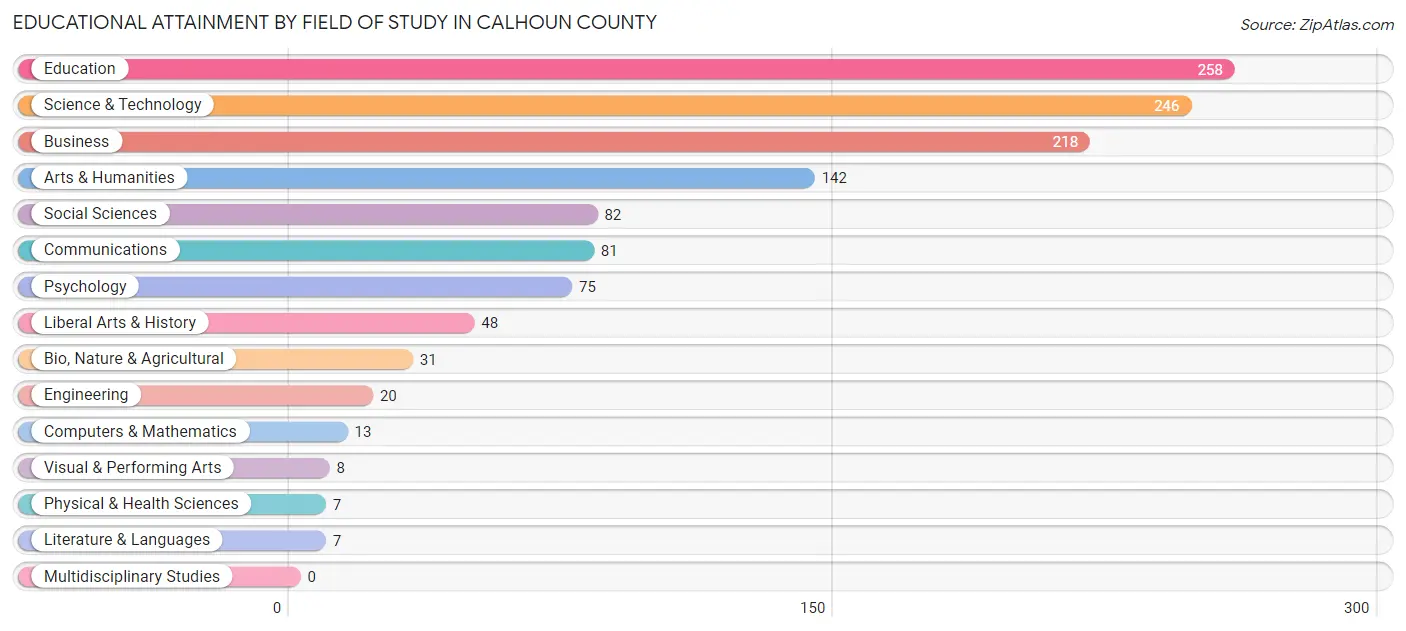
| Field of Study | # Graduates | % Graduates |
| Computers & Mathematics | 13 | 1.1% |
| Bio, Nature & Agricultural | 31 | 2.5% |
| Physical & Health Sciences | 7 | 0.6% |
| Psychology | 75 | 6.1% |
| Social Sciences | 82 | 6.6% |
| Engineering | 20 | 1.6% |
| Multidisciplinary Studies | 0 | 0.0% |
| Science & Technology | 246 | 19.9% |
| Business | 218 | 17.6% |
| Education | 258 | 20.9% |
| Literature & Languages | 7 | 0.6% |
| Liberal Arts & History | 48 | 3.9% |
| Visual & Performing Arts | 8 | 0.6% |
| Communications | 81 | 6.6% |
| Arts & Humanities | 142 | 11.5% |
| Total | 1,236 | 100.0% |
Transportation & Commute in Calhoun County
Vehicle Availability by Sex in Calhoun County
The most prevalent vehicle ownership categories in Calhoun County are males with 3 vehicles (941, accounting for 37.4%) and females with 3 vehicles (601, making up 47.9%).
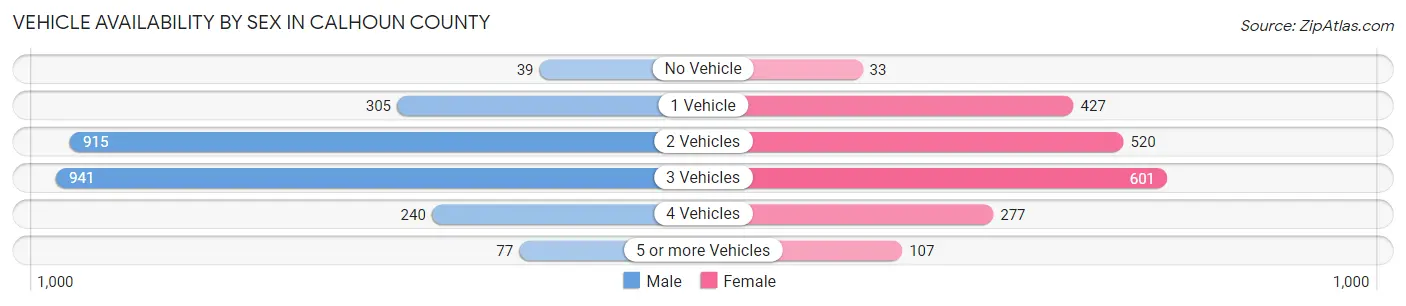
| Vehicles Available | Male | Female |
| No Vehicle | 39 (1.5%) | 33 (1.7%) |
| 1 Vehicle | 305 (12.1%) | 427 (21.7%) |
| 2 Vehicles | 915 (36.3%) | 520 (26.5%) |
| 3 Vehicles | 941 (37.4%) | 601 (30.6%) |
| 4 Vehicles | 240 (9.5%) | 277 (14.1%) |
| 5 or more Vehicles | 77 (3.1%) | 107 (5.4%) |
| Total | 2,517 (100.0%) | 1,965 (100.0%) |
Commute Time in Calhoun County
The most frequently occuring commute durations in Calhoun County are 45 to 59 minutes (635 commuters, 14.7%), 10 to 14 minutes (520 commuters, 12.0%), and 60 to 89 minutes (514 commuters, 11.9%).
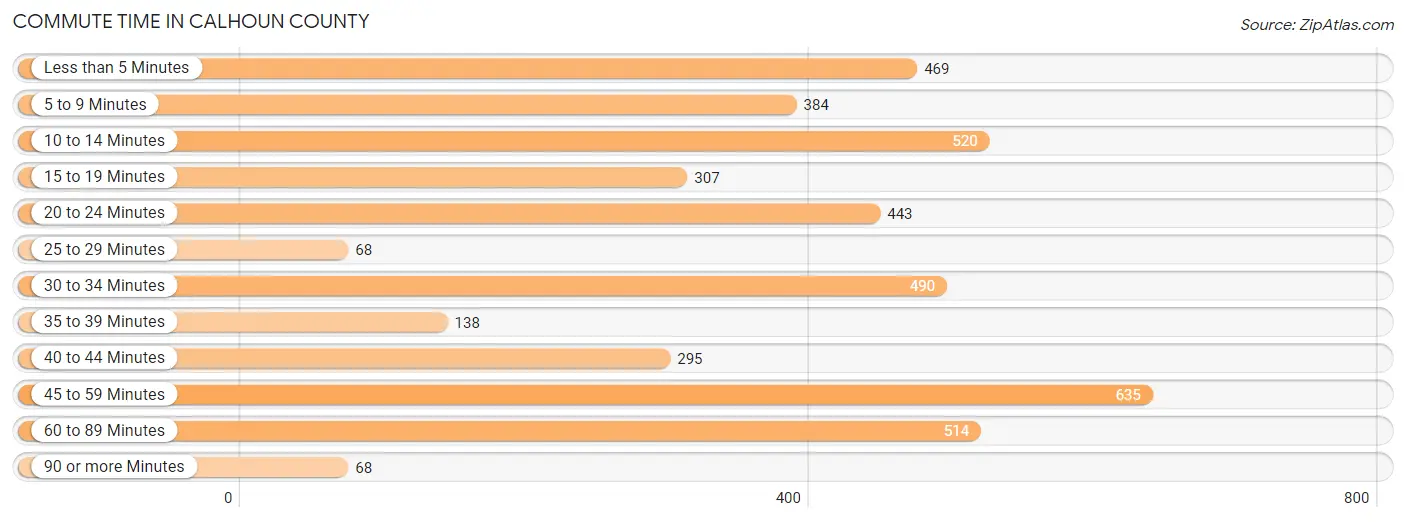
| Commute Time | # Commuters | % Commuters |
| Less than 5 Minutes | 469 | 10.8% |
| 5 to 9 Minutes | 384 | 8.9% |
| 10 to 14 Minutes | 520 | 12.0% |
| 15 to 19 Minutes | 307 | 7.1% |
| 20 to 24 Minutes | 443 | 10.2% |
| 25 to 29 Minutes | 68 | 1.6% |
| 30 to 34 Minutes | 490 | 11.3% |
| 35 to 39 Minutes | 138 | 3.2% |
| 40 to 44 Minutes | 295 | 6.8% |
| 45 to 59 Minutes | 635 | 14.7% |
| 60 to 89 Minutes | 514 | 11.9% |
| 90 or more Minutes | 68 | 1.6% |
Commute Time by Sex in Calhoun County
The most common commute times in Calhoun County are 45 to 59 minutes (448 commuters, 18.3%) for males and less than 5 minutes (308 commuters, 16.3%) for females.
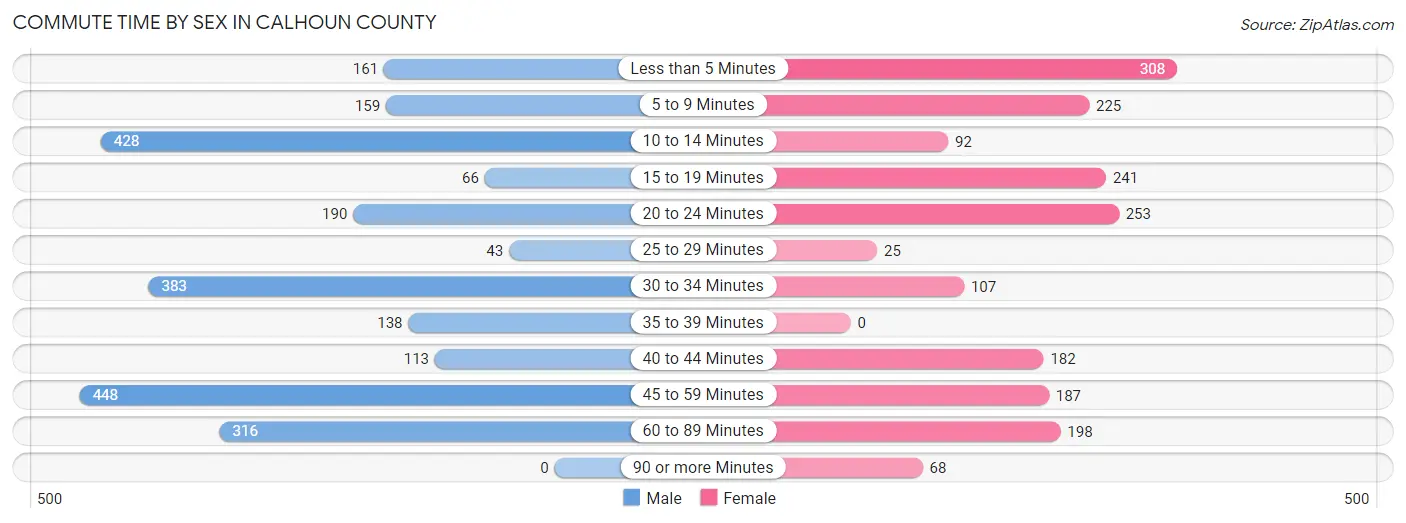
| Commute Time | Male | Female |
| Less than 5 Minutes | 161 (6.6%) | 308 (16.3%) |
| 5 to 9 Minutes | 159 (6.5%) | 225 (11.9%) |
| 10 to 14 Minutes | 428 (17.5%) | 92 (4.9%) |
| 15 to 19 Minutes | 66 (2.7%) | 241 (12.8%) |
| 20 to 24 Minutes | 190 (7.8%) | 253 (13.4%) |
| 25 to 29 Minutes | 43 (1.8%) | 25 (1.3%) |
| 30 to 34 Minutes | 383 (15.7%) | 107 (5.7%) |
| 35 to 39 Minutes | 138 (5.6%) | 0 (0.0%) |
| 40 to 44 Minutes | 113 (4.6%) | 182 (9.7%) |
| 45 to 59 Minutes | 448 (18.3%) | 187 (9.9%) |
| 60 to 89 Minutes | 316 (12.9%) | 198 (10.5%) |
| 90 or more Minutes | 0 (0.0%) | 68 (3.6%) |
Time of Departure to Work by Sex in Calhoun County
The most frequent times of departure to work in Calhoun County are 12:00 AM to 4:59 AM (394, 16.1%) for males and 6:30 AM to 6:59 AM (454, 24.1%) for females.
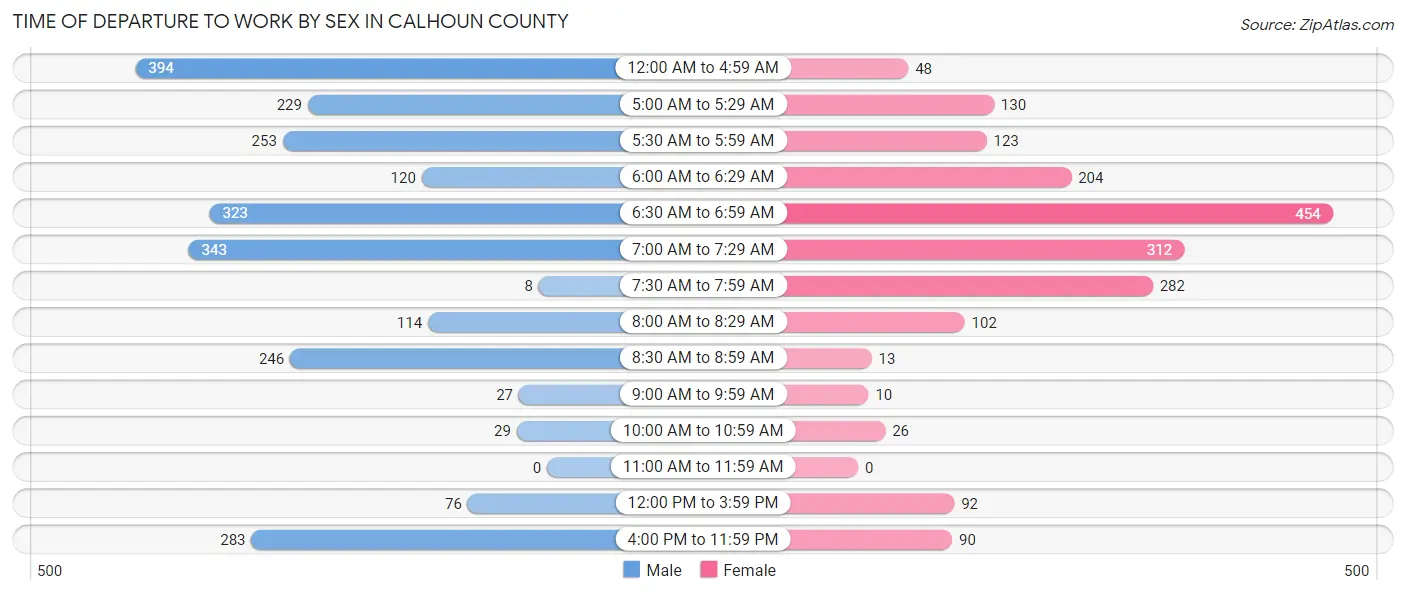
| Time of Departure | Male | Female |
| 12:00 AM to 4:59 AM | 394 (16.1%) | 48 (2.5%) |
| 5:00 AM to 5:29 AM | 229 (9.4%) | 130 (6.9%) |
| 5:30 AM to 5:59 AM | 253 (10.3%) | 123 (6.5%) |
| 6:00 AM to 6:29 AM | 120 (4.9%) | 204 (10.8%) |
| 6:30 AM to 6:59 AM | 323 (13.2%) | 454 (24.1%) |
| 7:00 AM to 7:29 AM | 343 (14.0%) | 312 (16.5%) |
| 7:30 AM to 7:59 AM | 8 (0.3%) | 282 (14.9%) |
| 8:00 AM to 8:29 AM | 114 (4.7%) | 102 (5.4%) |
| 8:30 AM to 8:59 AM | 246 (10.1%) | 13 (0.7%) |
| 9:00 AM to 9:59 AM | 27 (1.1%) | 10 (0.5%) |
| 10:00 AM to 10:59 AM | 29 (1.2%) | 26 (1.4%) |
| 11:00 AM to 11:59 AM | 0 (0.0%) | 0 (0.0%) |
| 12:00 PM to 3:59 PM | 76 (3.1%) | 92 (4.9%) |
| 4:00 PM to 11:59 PM | 283 (11.6%) | 90 (4.8%) |
| Total | 2,445 (100.0%) | 1,886 (100.0%) |
Housing Occupancy in Calhoun County
Occupancy by Ownership in Calhoun County
Of the total 4,448 dwellings in Calhoun County, owner-occupied units account for 3,406 (76.6%), while renter-occupied units make up 1,042 (23.4%).
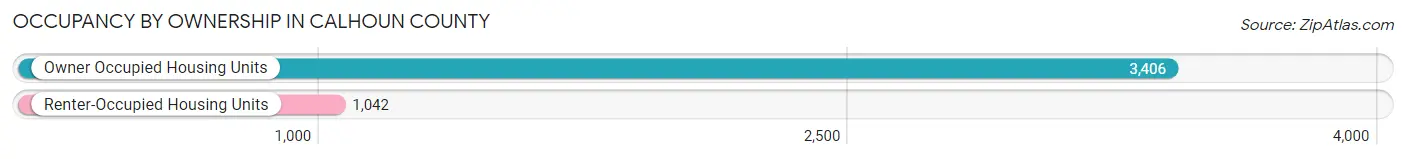
| Occupancy | # Housing Units | % Housing Units |
| Owner Occupied Housing Units | 3,406 | 76.6% |
| Renter-Occupied Housing Units | 1,042 | 23.4% |
| Total Occupied Housing Units | 4,448 | 100.0% |
Occupancy by Household Size in Calhoun County
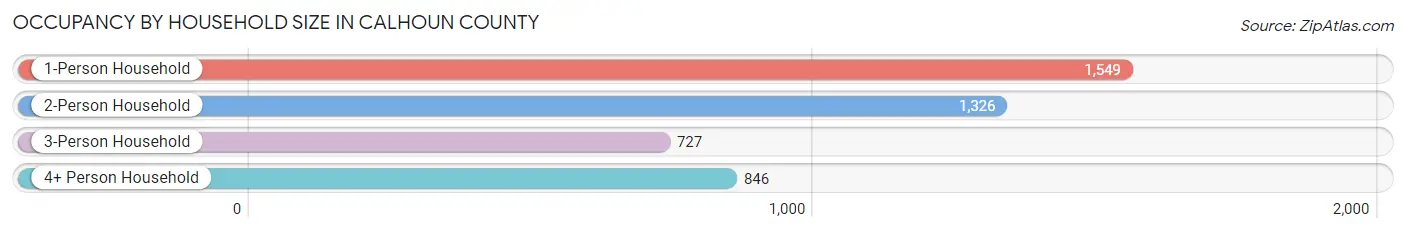
| Household Size | # Housing Units | % Housing Units |
| 1-Person Household | 1,549 | 34.8% |
| 2-Person Household | 1,326 | 29.8% |
| 3-Person Household | 727 | 16.3% |
| 4+ Person Household | 846 | 19.0% |
| Total Housing Units | 4,448 | 100.0% |
Occupancy by Ownership by Household Size in Calhoun County
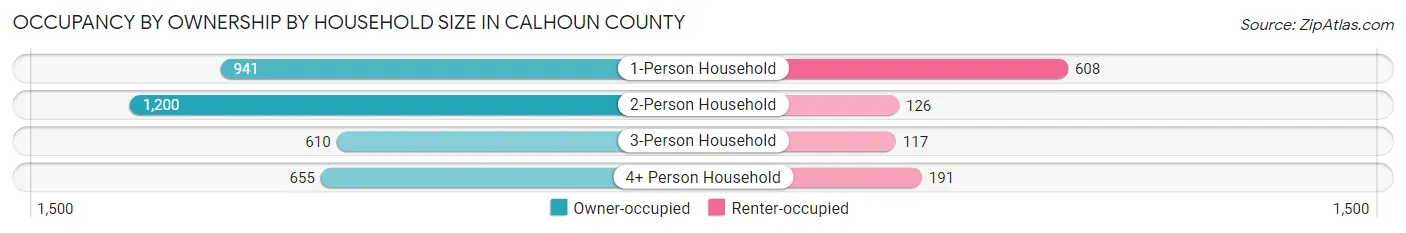
| Household Size | Owner-occupied | Renter-occupied |
| 1-Person Household | 941 (60.8%) | 608 (39.3%) |
| 2-Person Household | 1,200 (90.5%) | 126 (9.5%) |
| 3-Person Household | 610 (83.9%) | 117 (16.1%) |
| 4+ Person Household | 655 (77.4%) | 191 (22.6%) |
| Total Housing Units | 3,406 (76.6%) | 1,042 (23.4%) |
Occupancy by Educational Attainment in Calhoun County
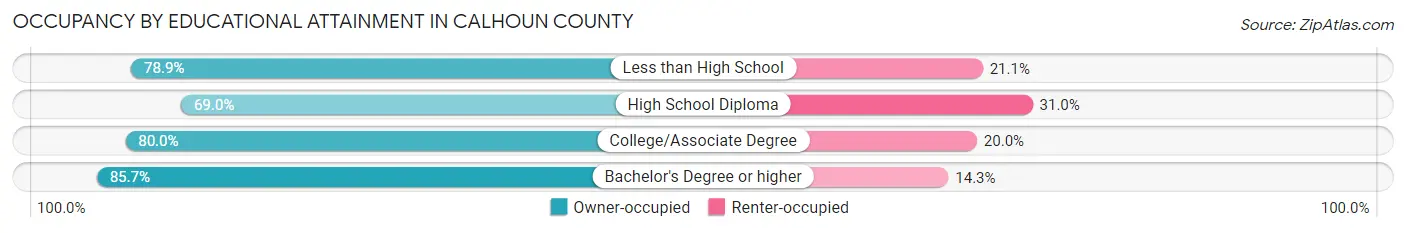
| Household Size | Owner-occupied | Renter-occupied |
| Less than High School | 616 (78.9%) | 165 (21.1%) |
| High School Diploma | 1,137 (69.0%) | 511 (31.0%) |
| College/Associate Degree | 1,090 (80.0%) | 272 (20.0%) |
| Bachelor's Degree or higher | 563 (85.7%) | 94 (14.3%) |
Occupancy by Age of Householder in Calhoun County
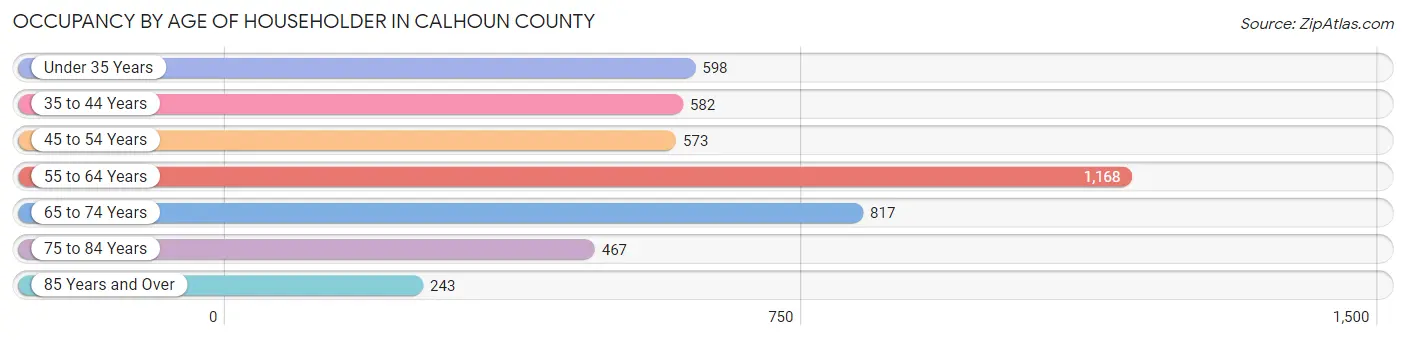
| Age Bracket | # Households | % Households |
| Under 35 Years | 598 | 13.4% |
| 35 to 44 Years | 582 | 13.1% |
| 45 to 54 Years | 573 | 12.9% |
| 55 to 64 Years | 1,168 | 26.3% |
| 65 to 74 Years | 817 | 18.4% |
| 75 to 84 Years | 467 | 10.5% |
| 85 Years and Over | 243 | 5.5% |
| Total | 4,448 | 100.0% |
Housing Finances in Calhoun County
Median Income by Occupancy in Calhoun County
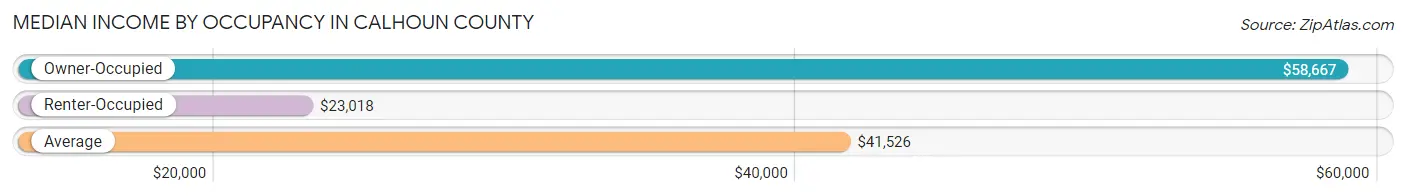
| Occupancy Type | # Households | Median Income |
| Owner-Occupied | 3,406 (76.6%) | $58,667 |
| Renter-Occupied | 1,042 (23.4%) | $23,018 |
| Average | 4,448 (100.0%) | $41,526 |
Occupancy by Householder Income Bracket in Calhoun County
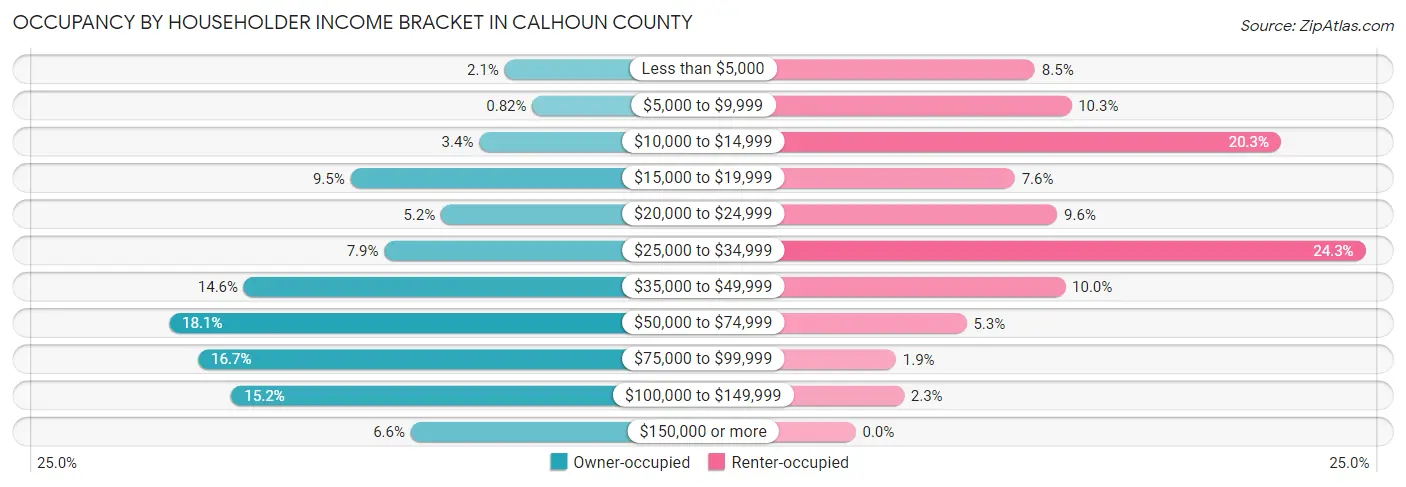
| Income Bracket | Owner-occupied | Renter-occupied |
| Less than $5,000 | 73 (2.1%) | 89 (8.5%) |
| $5,000 to $9,999 | 28 (0.8%) | 107 (10.3%) |
| $10,000 to $14,999 | 114 (3.4%) | 211 (20.3%) |
| $15,000 to $19,999 | 323 (9.5%) | 79 (7.6%) |
| $20,000 to $24,999 | 176 (5.2%) | 100 (9.6%) |
| $25,000 to $34,999 | 268 (7.9%) | 253 (24.3%) |
| $35,000 to $49,999 | 496 (14.6%) | 104 (10.0%) |
| $50,000 to $74,999 | 617 (18.1%) | 55 (5.3%) |
| $75,000 to $99,999 | 570 (16.7%) | 20 (1.9%) |
| $100,000 to $149,999 | 516 (15.1%) | 24 (2.3%) |
| $150,000 or more | 225 (6.6%) | 0 (0.0%) |
| Total | 3,406 (100.0%) | 1,042 (100.0%) |
Monthly Housing Cost Tiers in Calhoun County
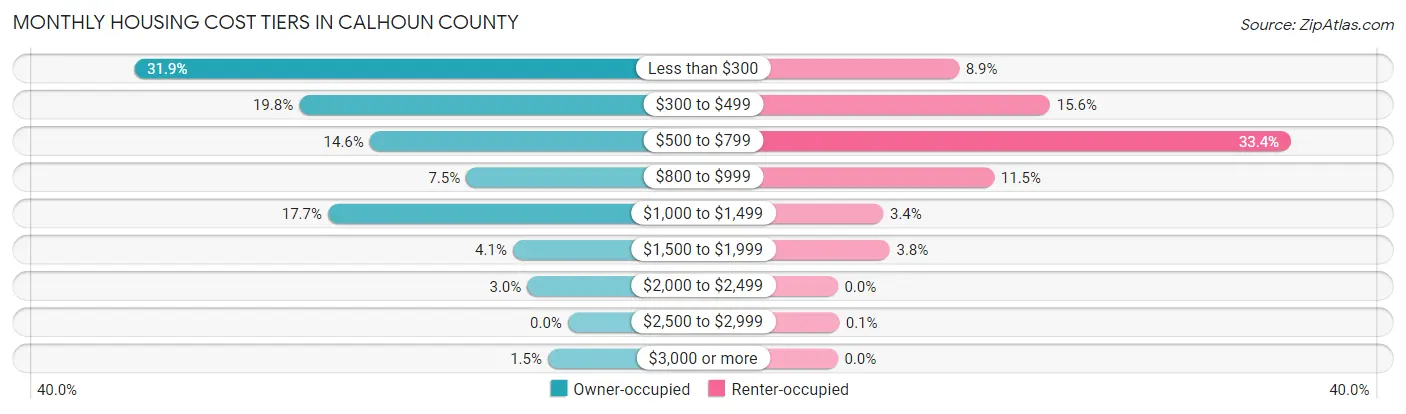
| Monthly Cost | Owner-occupied | Renter-occupied |
| Less than $300 | 1,088 (31.9%) | 93 (8.9%) |
| $300 to $499 | 674 (19.8%) | 163 (15.6%) |
| $500 to $799 | 497 (14.6%) | 348 (33.4%) |
| $800 to $999 | 255 (7.5%) | 120 (11.5%) |
| $1,000 to $1,499 | 602 (17.7%) | 35 (3.4%) |
| $1,500 to $1,999 | 138 (4.1%) | 40 (3.8%) |
| $2,000 to $2,499 | 102 (3.0%) | 0 (0.0%) |
| $2,500 to $2,999 | 0 (0.0%) | 1 (0.1%) |
| $3,000 or more | 50 (1.5%) | 0 (0.0%) |
| Total | 3,406 (100.0%) | 1,042 (100.0%) |
Physical Housing Characteristics in Calhoun County
Housing Structures in Calhoun County
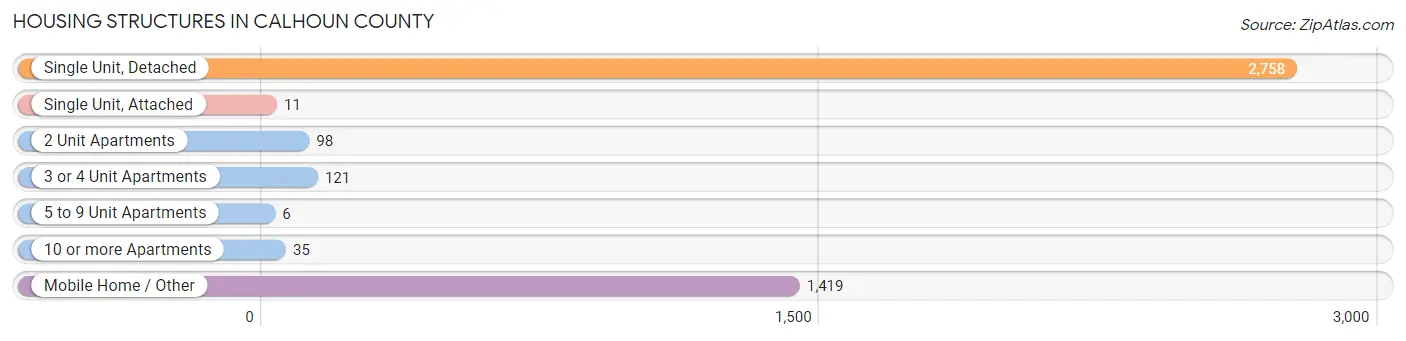
| Structure Type | # Housing Units | % Housing Units |
| Single Unit, Detached | 2,758 | 62.0% |
| Single Unit, Attached | 11 | 0.3% |
| 2 Unit Apartments | 98 | 2.2% |
| 3 or 4 Unit Apartments | 121 | 2.7% |
| 5 to 9 Unit Apartments | 6 | 0.1% |
| 10 or more Apartments | 35 | 0.8% |
| Mobile Home / Other | 1,419 | 31.9% |
| Total | 4,448 | 100.0% |
Housing Structures by Occupancy in Calhoun County
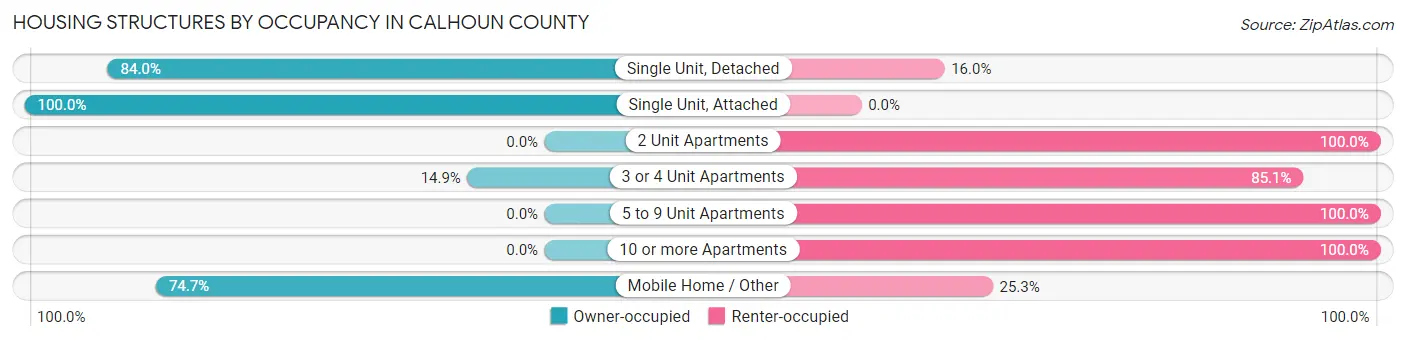
| Structure Type | Owner-occupied | Renter-occupied |
| Single Unit, Detached | 2,317 (84.0%) | 441 (16.0%) |
| Single Unit, Attached | 11 (100.0%) | 0 (0.0%) |
| 2 Unit Apartments | 0 (0.0%) | 98 (100.0%) |
| 3 or 4 Unit Apartments | 18 (14.9%) | 103 (85.1%) |
| 5 to 9 Unit Apartments | 0 (0.0%) | 6 (100.0%) |
| 10 or more Apartments | 0 (0.0%) | 35 (100.0%) |
| Mobile Home / Other | 1,060 (74.7%) | 359 (25.3%) |
| Total | 3,406 (76.6%) | 1,042 (23.4%) |
Housing Structures by Number of Rooms in Calhoun County
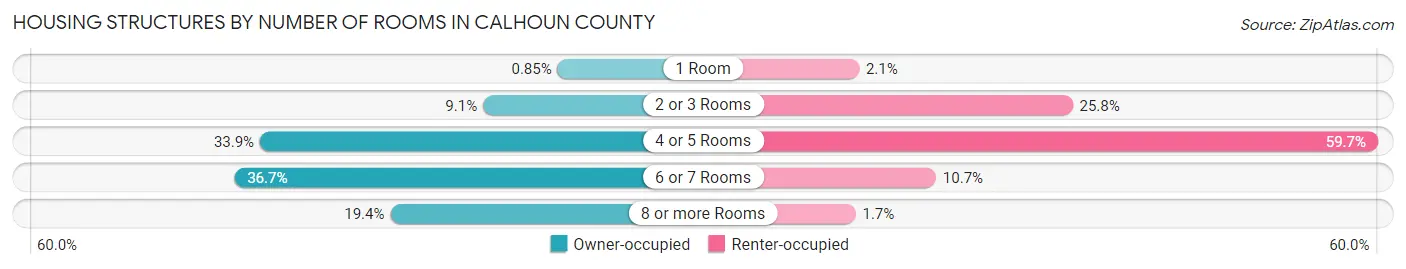
| Number of Rooms | Owner-occupied | Renter-occupied |
| 1 Room | 29 (0.9%) | 22 (2.1%) |
| 2 or 3 Rooms | 311 (9.1%) | 269 (25.8%) |
| 4 or 5 Rooms | 1,154 (33.9%) | 622 (59.7%) |
| 6 or 7 Rooms | 1,251 (36.7%) | 111 (10.6%) |
| 8 or more Rooms | 661 (19.4%) | 18 (1.7%) |
| Total | 3,406 (100.0%) | 1,042 (100.0%) |
Housing Structure by Heating Type in Calhoun County
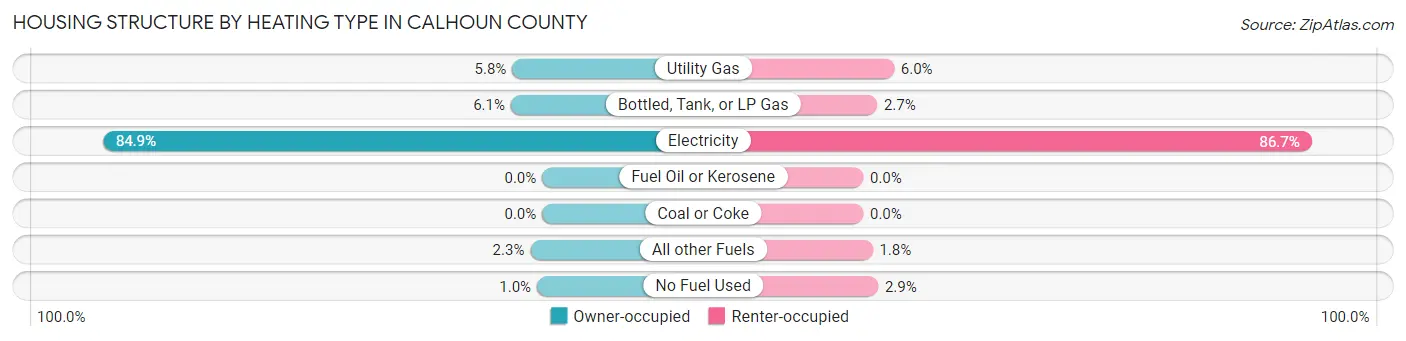
| Heating Type | Owner-occupied | Renter-occupied |
| Utility Gas | 197 (5.8%) | 62 (5.9%) |
| Bottled, Tank, or LP Gas | 206 (6.0%) | 28 (2.7%) |
| Electricity | 2,891 (84.9%) | 903 (86.7%) |
| Fuel Oil or Kerosene | 0 (0.0%) | 0 (0.0%) |
| Coal or Coke | 0 (0.0%) | 0 (0.0%) |
| All other Fuels | 78 (2.3%) | 19 (1.8%) |
| No Fuel Used | 34 (1.0%) | 30 (2.9%) |
| Total | 3,406 (100.0%) | 1,042 (100.0%) |
Household Vehicle Usage in Calhoun County
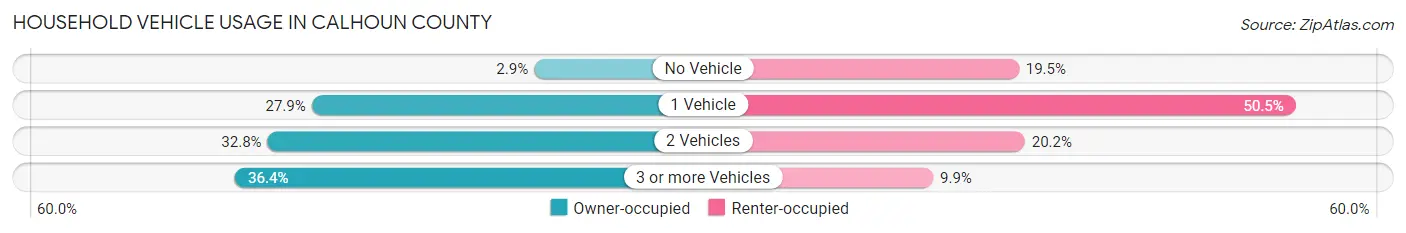
| Vehicles per Household | Owner-occupied | Renter-occupied |
| No Vehicle | 100 (2.9%) | 203 (19.5%) |
| 1 Vehicle | 949 (27.9%) | 526 (50.5%) |
| 2 Vehicles | 1,117 (32.8%) | 210 (20.2%) |
| 3 or more Vehicles | 1,240 (36.4%) | 103 (9.9%) |
| Total | 3,406 (100.0%) | 1,042 (100.0%) |
Real Estate & Mortgages in Calhoun County
Real Estate and Mortgage Overview in Calhoun County
| Characteristic | Without Mortgage | With Mortgage |
| Housing Units | 2,179 | 1,227 |
| Median Property Value | $89,900 | $149,100 |
| Median Household Income | $44,732 | $77 |
| Monthly Housing Costs | $307 | $50 |
| Real Estate Taxes | $459 | $55 |
Property Value by Mortgage Status in Calhoun County
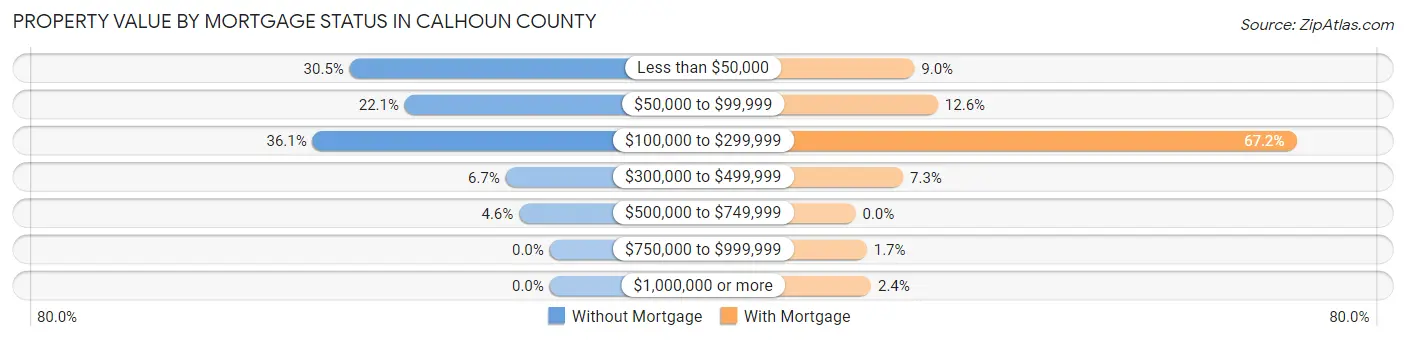
| Property Value | Without Mortgage | With Mortgage |
| Less than $50,000 | 664 (30.5%) | 110 (9.0%) |
| $50,000 to $99,999 | 481 (22.1%) | 154 (12.6%) |
| $100,000 to $299,999 | 787 (36.1%) | 824 (67.2%) |
| $300,000 to $499,999 | 146 (6.7%) | 89 (7.2%) |
| $500,000 to $749,999 | 101 (4.6%) | 0 (0.0%) |
| $750,000 to $999,999 | 0 (0.0%) | 21 (1.7%) |
| $1,000,000 or more | 0 (0.0%) | 29 (2.4%) |
| Total | 2,179 (100.0%) | 1,227 (100.0%) |
Household Income by Mortgage Status in Calhoun County
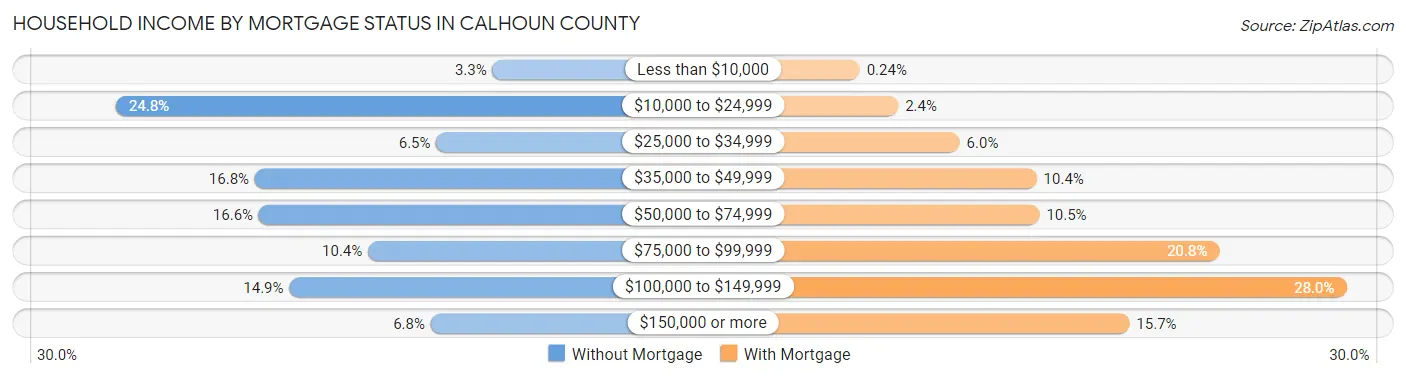
| Household Income | Without Mortgage | With Mortgage |
| Less than $10,000 | 71 (3.3%) | 3 (0.2%) |
| $10,000 to $24,999 | 540 (24.8%) | 30 (2.4%) |
| $25,000 to $34,999 | 141 (6.5%) | 73 (5.9%) |
| $35,000 to $49,999 | 367 (16.8%) | 127 (10.3%) |
| $50,000 to $74,999 | 362 (16.6%) | 129 (10.5%) |
| $75,000 to $99,999 | 226 (10.4%) | 255 (20.8%) |
| $100,000 to $149,999 | 324 (14.9%) | 344 (28.0%) |
| $150,000 or more | 148 (6.8%) | 192 (15.7%) |
| Total | 2,179 (100.0%) | 1,227 (100.0%) |
Property Value to Household Income Ratio in Calhoun County
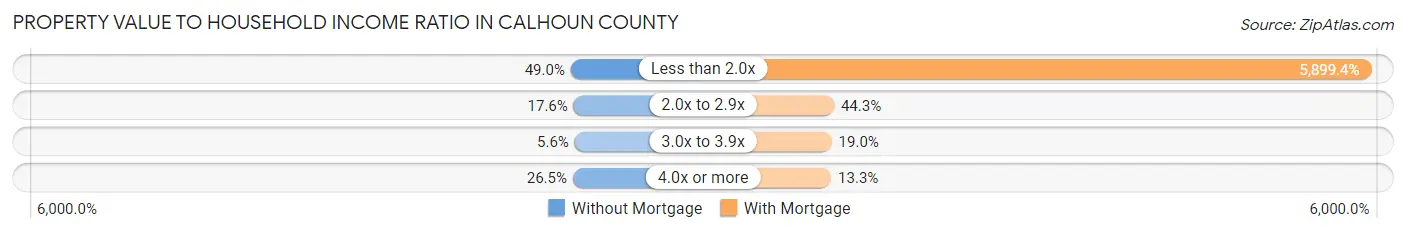
| Value-to-Income Ratio | Without Mortgage | With Mortgage |
| Less than 2.0x | 1,068 (49.0%) | 72,386 (5,899.4%) |
| 2.0x to 2.9x | 383 (17.6%) | 543 (44.3%) |
| 3.0x to 3.9x | 122 (5.6%) | 233 (19.0%) |
| 4.0x or more | 577 (26.5%) | 163 (13.3%) |
| Total | 2,179 (100.0%) | 1,227 (100.0%) |
Real Estate Taxes by Mortgage Status in Calhoun County
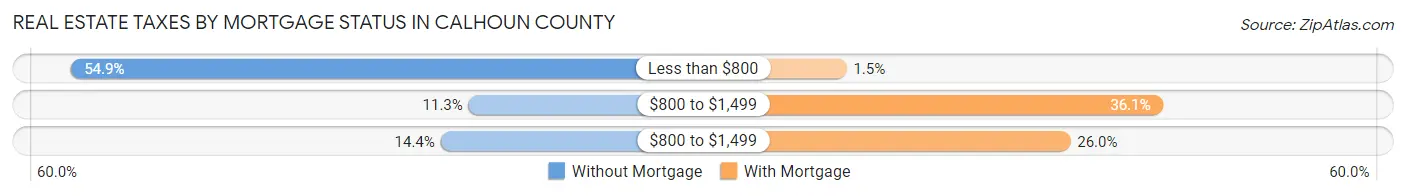
| Property Taxes | Without Mortgage | With Mortgage |
| Less than $800 | 1,196 (54.9%) | 18 (1.5%) |
| $800 to $1,499 | 247 (11.3%) | 443 (36.1%) |
| $800 to $1,499 | 314 (14.4%) | 319 (26.0%) |
| Total | 2,179 (100.0%) | 1,227 (100.0%) |
Health & Disability in Calhoun County
Health Insurance Coverage by Age in Calhoun County
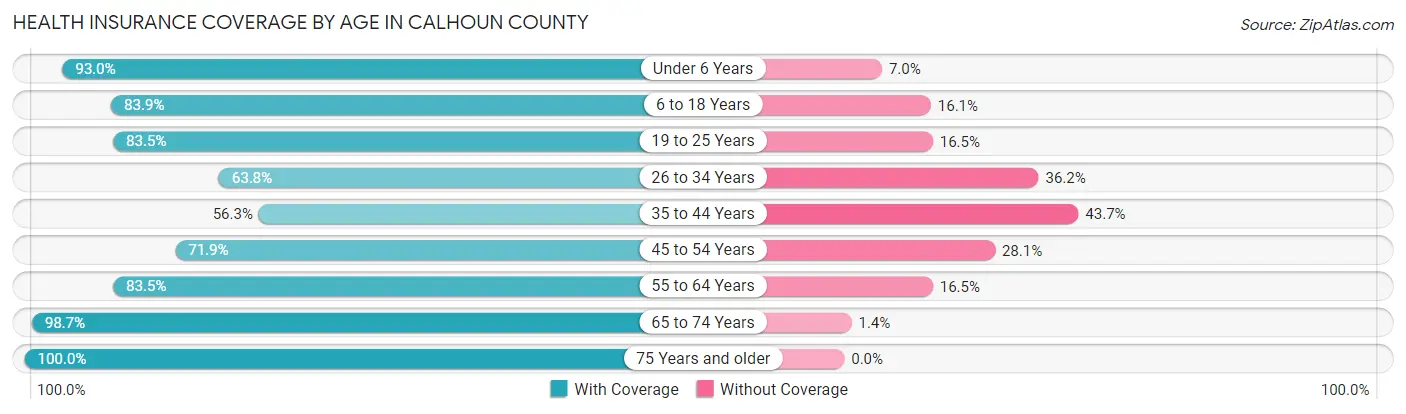
| Age Bracket | With Coverage | Without Coverage |
| Under 6 Years | 727 (93.0%) | 55 (7.0%) |
| 6 to 18 Years | 1,792 (83.9%) | 345 (16.1%) |
| 19 to 25 Years | 734 (83.5%) | 145 (16.5%) |
| 26 to 34 Years | 711 (63.8%) | 404 (36.2%) |
| 35 to 44 Years | 809 (56.3%) | 627 (43.7%) |
| 45 to 54 Years | 1,172 (71.9%) | 458 (28.1%) |
| 55 to 64 Years | 1,503 (83.5%) | 297 (16.5%) |
| 65 to 74 Years | 1,239 (98.7%) | 17 (1.3%) |
| 75 Years and older | 930 (100.0%) | 0 (0.0%) |
| Total | 9,617 (80.4%) | 2,348 (19.6%) |
Health Insurance Coverage by Citizenship Status in Calhoun County
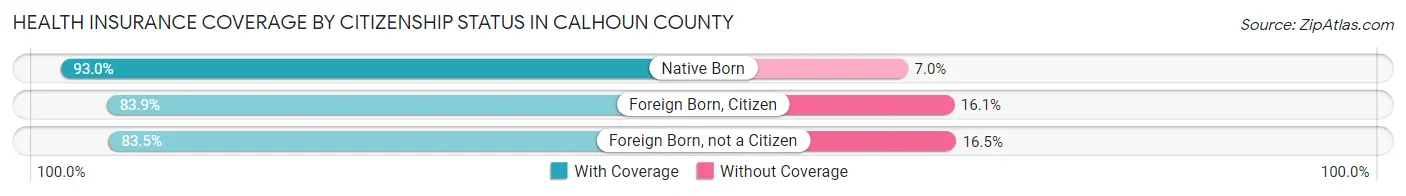
| Citizenship Status | With Coverage | Without Coverage |
| Native Born | 727 (93.0%) | 55 (7.0%) |
| Foreign Born, Citizen | 1,792 (83.9%) | 345 (16.1%) |
| Foreign Born, not a Citizen | 734 (83.5%) | 145 (16.5%) |
Health Insurance Coverage by Household Income in Calhoun County
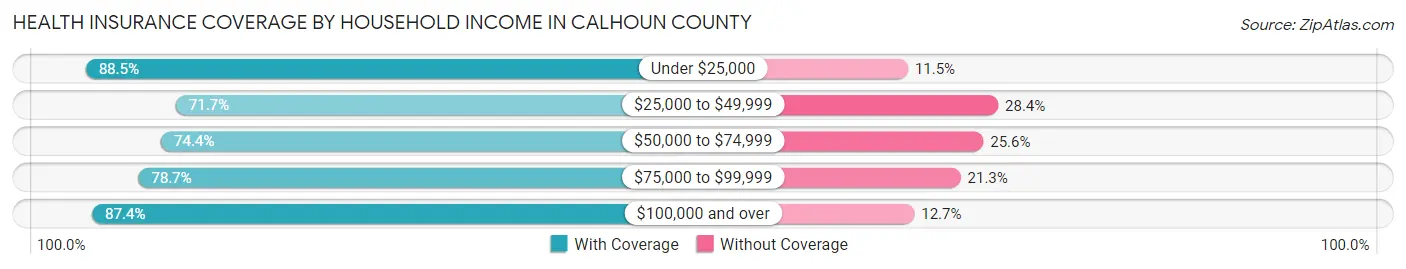
| Household Income | With Coverage | Without Coverage |
| Under $25,000 | 2,326 (88.5%) | 301 (11.5%) |
| $25,000 to $49,999 | 1,812 (71.7%) | 717 (28.3%) |
| $50,000 to $74,999 | 1,647 (74.4%) | 566 (25.6%) |
| $75,000 to $99,999 | 1,661 (78.7%) | 450 (21.3%) |
| $100,000 and over | 2,162 (87.4%) | 313 (12.7%) |
Public vs Private Health Insurance Coverage by Age in Calhoun County
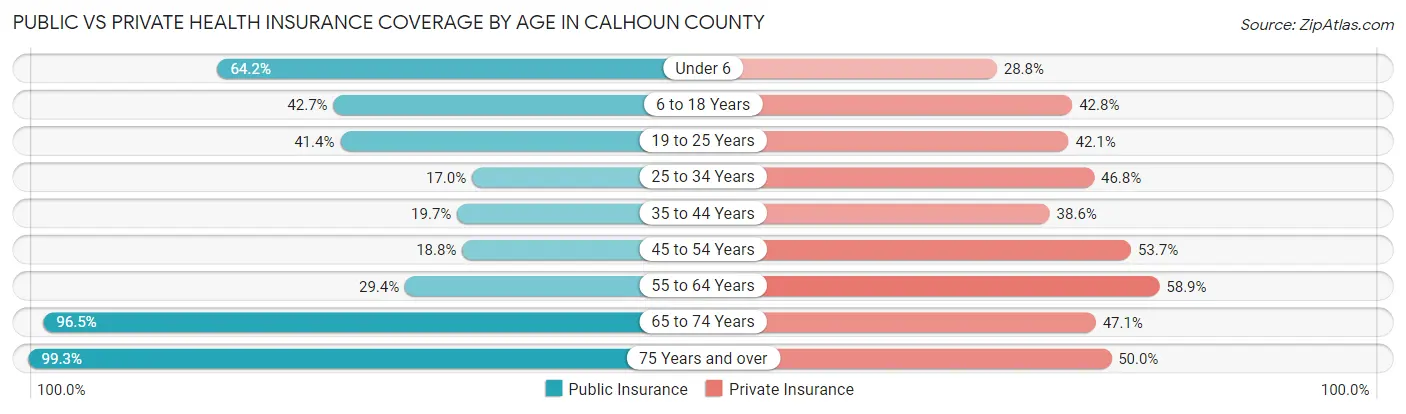
| Age Bracket | Public Insurance | Private Insurance |
| Under 6 | 502 (64.2%) | 225 (28.8%) |
| 6 to 18 Years | 912 (42.7%) | 914 (42.8%) |
| 19 to 25 Years | 364 (41.4%) | 370 (42.1%) |
| 25 to 34 Years | 189 (17.0%) | 522 (46.8%) |
| 35 to 44 Years | 283 (19.7%) | 554 (38.6%) |
| 45 to 54 Years | 306 (18.8%) | 875 (53.7%) |
| 55 to 64 Years | 529 (29.4%) | 1,061 (58.9%) |
| 65 to 74 Years | 1,212 (96.5%) | 592 (47.1%) |
| 75 Years and over | 923 (99.3%) | 465 (50.0%) |
| Total | 5,220 (43.6%) | 5,578 (46.6%) |
Disability Status by Sex by Age in Calhoun County
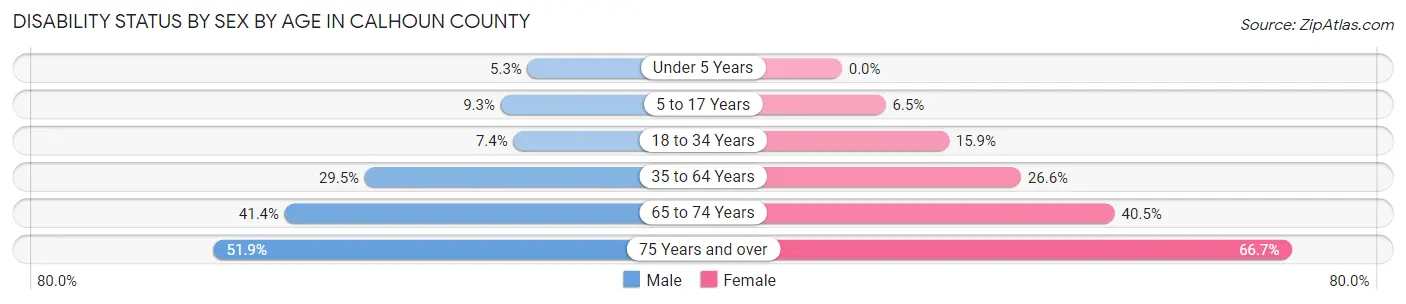
| Age Bracket | Male | Female |
| Under 5 Years | 15 (5.3%) | 0 (0.0%) |
| 5 to 17 Years | 110 (9.3%) | 60 (6.5%) |
| 18 to 34 Years | 88 (7.4%) | 166 (15.9%) |
| 35 to 64 Years | 726 (29.5%) | 639 (26.6%) |
| 65 to 74 Years | 251 (41.3%) | 263 (40.5%) |
| 75 Years and over | 202 (51.9%) | 361 (66.7%) |
Disability Class by Sex by Age in Calhoun County
Disability Class: Hearing Difficulty
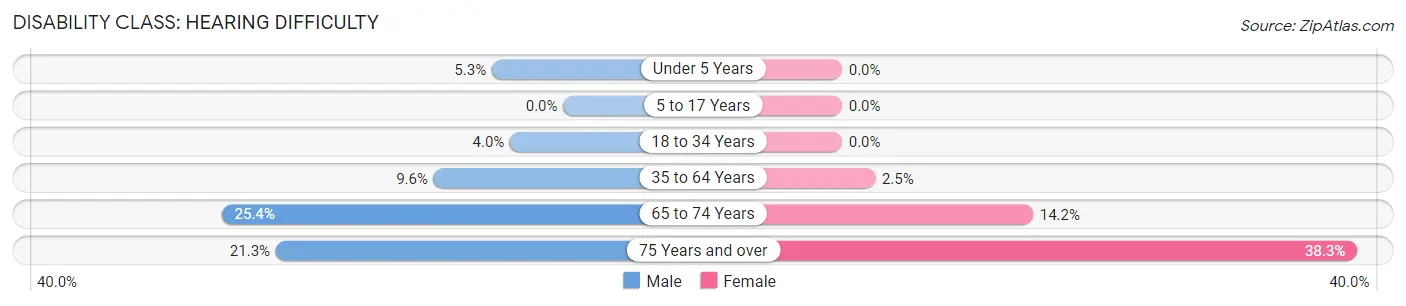
| Age Bracket | Male | Female |
| Under 5 Years | 15 (5.3%) | 0 (0.0%) |
| 5 to 17 Years | 0 (0.0%) | 0 (0.0%) |
| 18 to 34 Years | 47 (4.0%) | 0 (0.0%) |
| 35 to 64 Years | 237 (9.6%) | 59 (2.5%) |
| 65 to 74 Years | 154 (25.4%) | 92 (14.2%) |
| 75 Years and over | 83 (21.3%) | 207 (38.3%) |
Disability Class: Vision Difficulty
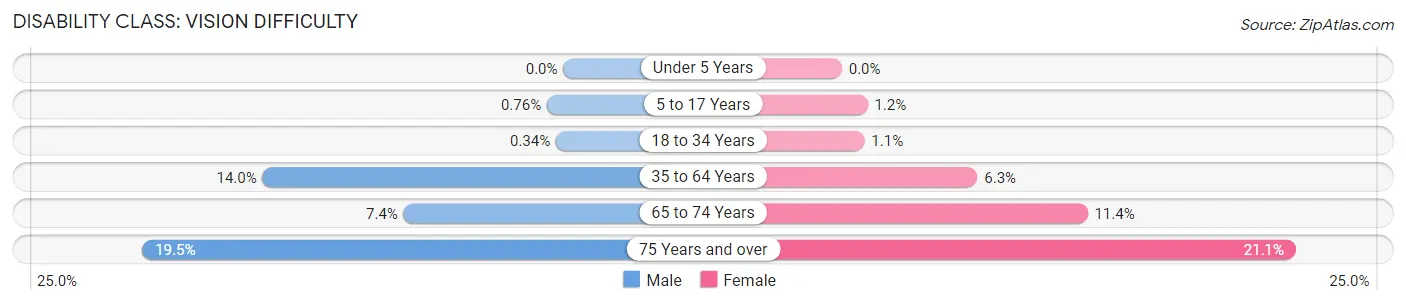
| Age Bracket | Male | Female |
| Under 5 Years | 0 (0.0%) | 0 (0.0%) |
| 5 to 17 Years | 9 (0.8%) | 11 (1.2%) |
| 18 to 34 Years | 4 (0.3%) | 11 (1.1%) |
| 35 to 64 Years | 344 (14.0%) | 151 (6.3%) |
| 65 to 74 Years | 45 (7.4%) | 74 (11.4%) |
| 75 Years and over | 76 (19.5%) | 114 (21.1%) |
Disability Class: Cognitive Difficulty
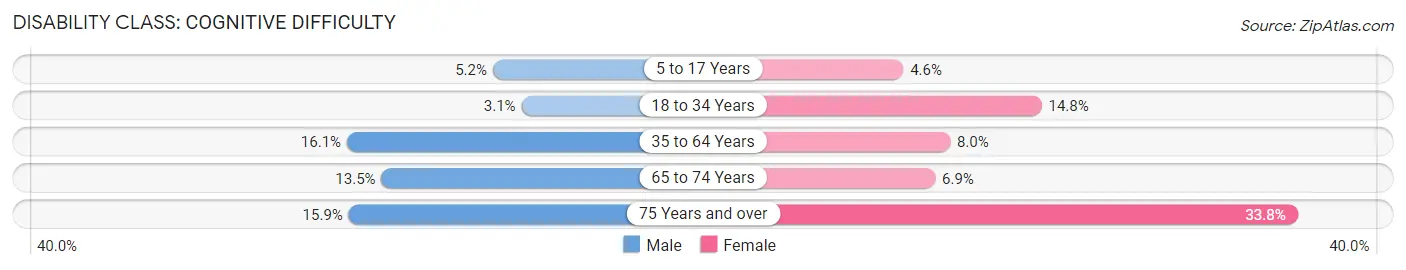
| Age Bracket | Male | Female |
| 5 to 17 Years | 62 (5.2%) | 42 (4.6%) |
| 18 to 34 Years | 37 (3.1%) | 155 (14.8%) |
| 35 to 64 Years | 396 (16.1%) | 193 (8.0%) |
| 65 to 74 Years | 82 (13.5%) | 45 (6.9%) |
| 75 Years and over | 62 (15.9%) | 183 (33.8%) |
Disability Class: Ambulatory Difficulty
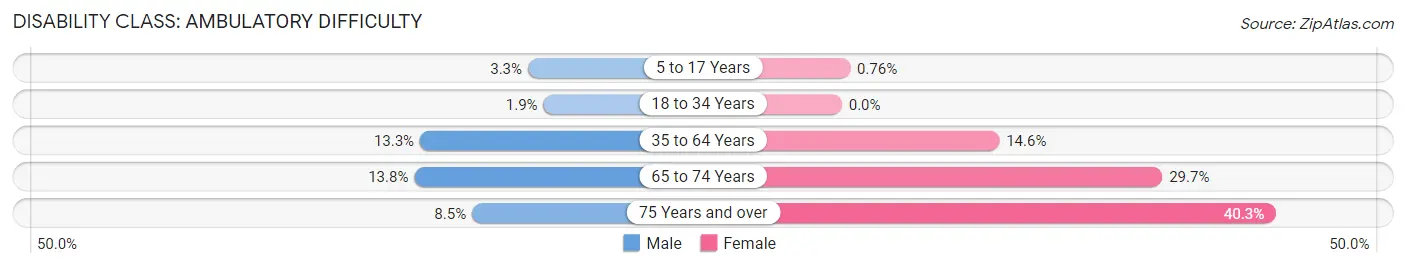
| Age Bracket | Male | Female |
| 5 to 17 Years | 39 (3.3%) | 7 (0.8%) |
| 18 to 34 Years | 22 (1.8%) | 0 (0.0%) |
| 35 to 64 Years | 328 (13.3%) | 351 (14.6%) |
| 65 to 74 Years | 84 (13.8%) | 193 (29.7%) |
| 75 Years and over | 33 (8.5%) | 218 (40.3%) |
Disability Class: Self-Care Difficulty
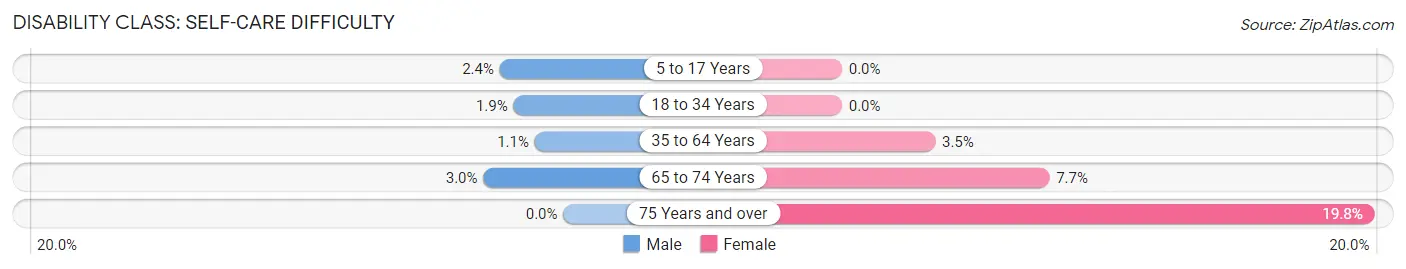
| Age Bracket | Male | Female |
| 5 to 17 Years | 28 (2.4%) | 0 (0.0%) |
| 18 to 34 Years | 22 (1.8%) | 0 (0.0%) |
| 35 to 64 Years | 26 (1.1%) | 83 (3.5%) |
| 65 to 74 Years | 18 (3.0%) | 50 (7.7%) |
| 75 Years and over | 0 (0.0%) | 107 (19.8%) |
Technology Access in Calhoun County
Computing Device Access in Calhoun County
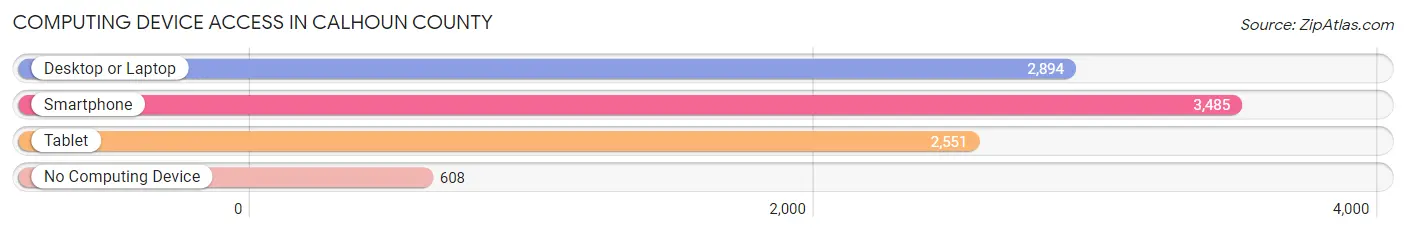
| Device Type | # Households | % Households |
| Desktop or Laptop | 2,894 | 65.1% |
| Smartphone | 3,485 | 78.3% |
| Tablet | 2,551 | 57.4% |
| No Computing Device | 608 | 13.7% |
| Total | 4,448 | 100.0% |
Internet Access in Calhoun County
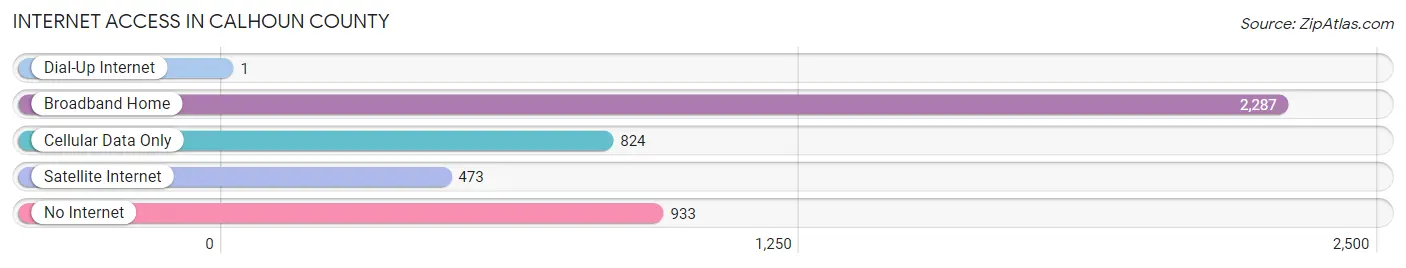
| Internet Type | # Households | % Households |
| Dial-Up Internet | 1 | 0.0% |
| Broadband Home | 2,287 | 51.4% |
| Cellular Data Only | 824 | 18.5% |
| Satellite Internet | 473 | 10.6% |
| No Internet | 933 | 21.0% |
| Total | 4,448 | 100.0% |
Calhoun County Summary
Calhoun County is located in the Florida Panhandle, along the Gulf of Mexico. It is bordered by Jackson County to the north, Liberty County to the east, Gulf County to the south, and Bay County to the west. The county seat is Blountstown, and the county has a total area of 576 square miles.
History
Calhoun County was created in 1838 from parts of Jackson and Gadsden counties. It was named for John C. Calhoun, a prominent South Carolina politician and statesman. The county was originally part of the Apalachicola Territory, which was established in 1822. The county was divided into two districts in 1843, and the county seat was moved from St. Joseph to Blountstown in 1845.
The county was largely rural until the early 20th century, when the timber industry began to boom. The county was home to several large sawmills, and the population grew rapidly. The county was also home to several large plantations, and the economy was largely based on agriculture.
Geography
Calhoun County is located in the Florida Panhandle, along the Gulf of Mexico. It is bordered by Jackson County to the north, Liberty County to the east, Gulf County to the south, and Bay County to the west. The county has a total area of 576 square miles, of which 574 square miles is land and 2 square miles is water.
The county is mostly flat, with some rolling hills in the northern part of the county. The Apalachicola River forms the western border of the county, and the Chipola River forms the eastern border. The county is home to several lakes, including Lake Mystic, Lake Seminole, and Lake Talquin.
Economy
Calhoun County has a diverse economy, with a mix of agriculture, manufacturing, and tourism. The county is home to several large timber companies, and the timber industry is a major contributor to the local economy. The county is also home to several large farms, and agriculture is a major part of the local economy.
The county is home to several manufacturing companies, including a paper mill, a plastics plant, and a furniture factory. Tourism is also an important part of the local economy, with several popular attractions, including the Apalachicola National Forest, the Chipola River, and the St. Joseph Bay State Park.
Demographics
As of the 2010 census, Calhoun County had a population of 14,625. The population was spread out, with 48.3% male and 51.7% female. The median age was 41.2 years. The racial makeup of the county was 79.2% White, 17.3% African American, 0.4% Native American, 0.3% Asian, 0.1% Pacific Islander, 1.2% from other races, and 1.5% from two or more races. Hispanic or Latino of any race were 3.2% of the population.
The median household income was $32,917, and the median family income was $41,917. The per capita income was $17,845. About 17.3% of the population was below the poverty line.
Calhoun County is a rural county with a diverse economy and a rich history. The county is home to several large timber companies, farms, and manufacturing companies, and tourism is an important part of the local economy. The county has a population of 14,625, with a median age of 41.2 years. The median household income is $32,917, and the per capita income is $17,845.
Common Questions
What is Per Capita Income in Calhoun County?
Per Capita income in Calhoun County is $21,324.
What is the Median Family Income in Calhoun County?
Median Family Income in Calhoun County is $65,776.
What is the Median Household income in Calhoun County?
Median Household Income in Calhoun County is $41,526.
What is Income or Wage Gap in Calhoun County?
Income or Wage Gap in Calhoun County is 10.1%.
Women in Calhoun County earn 89.9 cents for every dollar earned by a man.
What is Family Income Deficit in Calhoun County?
Family Income Deficit in Calhoun County is $12,357.
Families that are below poverty line in Calhoun County earn $12,357 less on average than the poverty threshold level.
What is Inequality or Gini Index in Calhoun County?
Inequality or Gini Index in Calhoun County is 0.46.
What is the Total Population of Calhoun County?
Total Population of Calhoun County is 13,753.
What is the Total Male Population of Calhoun County?
Total Male Population of Calhoun County is 7,715.
What is the Total Female Population of Calhoun County?
Total Female Population of Calhoun County is 6,038.
What is the Ratio of Males per 100 Females in Calhoun County?
There are 127.77 Males per 100 Females in Calhoun County.
What is the Ratio of Females per 100 Males in Calhoun County?
There are 78.26 Females per 100 Males in Calhoun County.
What is the Median Population Age in Calhoun County?
Median Population Age in Calhoun County is 41.9 Years.
What is the Average Family Size in Calhoun County
Average Family Size in Calhoun County is 3.5 People.
What is the Average Household Size in Calhoun County
Average Household Size in Calhoun County is 2.7 People.
How Large is the Labor Force in Calhoun County?
There are 4,686 People in the Labor Forcein in Calhoun County.
What is the Percentage of People in the Labor Force in Calhoun County?
41.4% of People are in the Labor Force in Calhoun County.
What is the Unemployment Rate in Calhoun County?
Unemployment Rate in Calhoun County is 3.7%.