Bradford County, FL Map & Demographics
Bradford County Map
Bradford County Overview
$25,276
PER CAPITA INCOME
$71,767
AVG FAMILY INCOME
$54,759
AVG HOUSEHOLD INCOME
10.4%
WAGE / INCOME GAP [ % ]
89.6¢/ $1
WAGE / INCOME GAP [ $ ]
$7,644
FAMILY INCOME DEFICIT
0.45
INEQUALITY / GINI INDEX
27,816
TOTAL POPULATION
15,418
MALE POPULATION
12,398
FEMALE POPULATION
124.36
MALES / 100 FEMALES
80.41
FEMALES / 100 MALES
39.9
MEDIAN AGE
3.2
AVG FAMILY SIZE
2.6
AVG HOUSEHOLD SIZE
11,384
LABOR FORCE [ PEOPLE ]
49.5%
PERCENT IN LABOR FORCE
5.8%
UNEMPLOYMENT RATE
Income in Bradford County
Income Overview in Bradford County
Per Capita Income in Bradford County is $25,276, while median incomes of families and households are $71,767 and $54,759 respectively.
| Characteristic | Number | Measure |
| Per Capita Income | 27,816 | $25,276 |
| Median Family Income | 6,045 | $71,767 |
| Mean Family Income | 6,045 | $83,755 |
| Median Household Income | 9,067 | $54,759 |
| Mean Household Income | 9,067 | $70,626 |
| Income Deficit | 6,045 | $7,644 |
| Wage / Income Gap (%) | 27,816 | 10.40% |
| Wage / Income Gap ($) | 27,816 | 89.60¢ per $1 |
| Gini / Inequality Index | 27,816 | 0.45 |
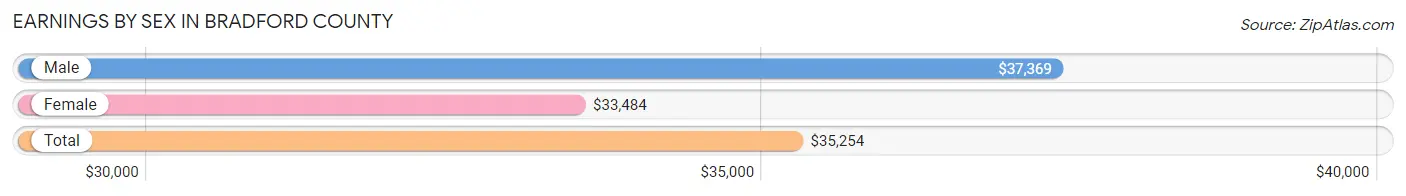
Earnings by Sex in Bradford County
Average Earnings in Bradford County are $35,254, $37,369 for men and $33,484 for women, a difference of 10.4%.
| Sex | Number | Average Earnings |
| Male | 6,099 (51.5%) | $37,369 |
| Female | 5,736 (48.5%) | $33,484 |
| Total | 11,835 (100.0%) | $35,254 |
Earnings by Sex by Income Bracket in Bradford County
The most common earnings brackets in Bradford County are $45,000 to $49,999 for men (561 | 9.2%) and $40,000 to $44,999 for women (614 | 10.7%).
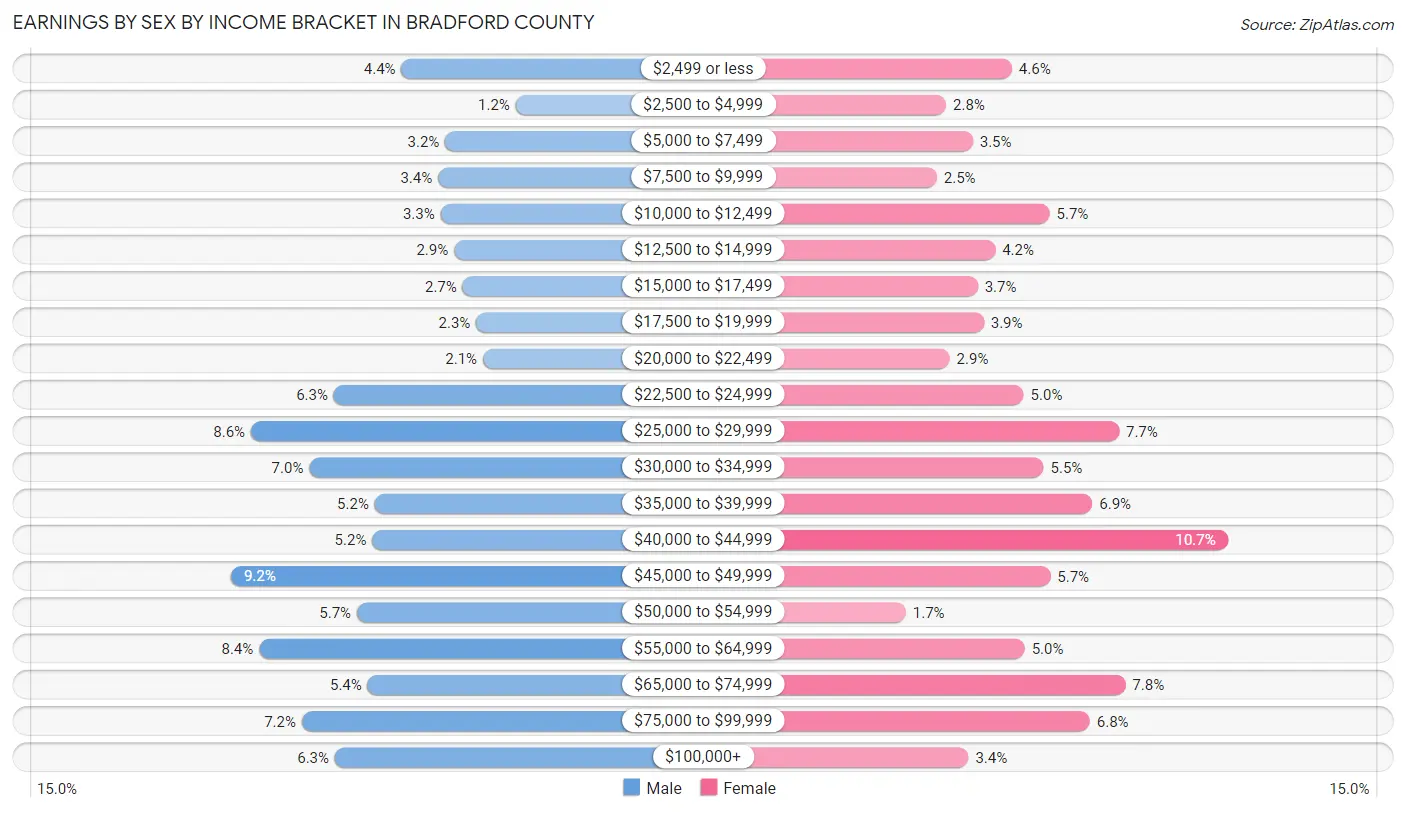
| Income | Male | Female |
| $2,499 or less | 269 (4.4%) | 266 (4.6%) |
| $2,500 to $4,999 | 73 (1.2%) | 160 (2.8%) |
| $5,000 to $7,499 | 194 (3.2%) | 203 (3.5%) |
| $7,500 to $9,999 | 206 (3.4%) | 145 (2.5%) |
| $10,000 to $12,499 | 202 (3.3%) | 327 (5.7%) |
| $12,500 to $14,999 | 179 (2.9%) | 239 (4.2%) |
| $15,000 to $17,499 | 164 (2.7%) | 211 (3.7%) |
| $17,500 to $19,999 | 141 (2.3%) | 221 (3.8%) |
| $20,000 to $22,499 | 129 (2.1%) | 166 (2.9%) |
| $22,500 to $24,999 | 385 (6.3%) | 285 (5.0%) |
| $25,000 to $29,999 | 527 (8.6%) | 439 (7.6%) |
| $30,000 to $34,999 | 427 (7.0%) | 317 (5.5%) |
| $35,000 to $39,999 | 315 (5.2%) | 396 (6.9%) |
| $40,000 to $44,999 | 319 (5.2%) | 614 (10.7%) |
| $45,000 to $49,999 | 561 (9.2%) | 328 (5.7%) |
| $50,000 to $54,999 | 345 (5.7%) | 95 (1.7%) |
| $55,000 to $64,999 | 513 (8.4%) | 287 (5.0%) |
| $65,000 to $74,999 | 327 (5.4%) | 449 (7.8%) |
| $75,000 to $99,999 | 440 (7.2%) | 392 (6.8%) |
| $100,000+ | 383 (6.3%) | 196 (3.4%) |
| Total | 6,099 (100.0%) | 5,736 (100.0%) |
Earnings by Sex by Educational Attainment in Bradford County
Average earnings in Bradford County are $42,216 for men and $35,728 for women, a difference of 15.4%. Men with an educational attainment of graduate degree enjoy the highest average annual earnings of $50,609, while those with high school diploma education earn the least with $38,705. Women with an educational attainment of graduate degree earn the most with the average annual earnings of $73,125, while those with less than high school education have the smallest earnings of $25,391.
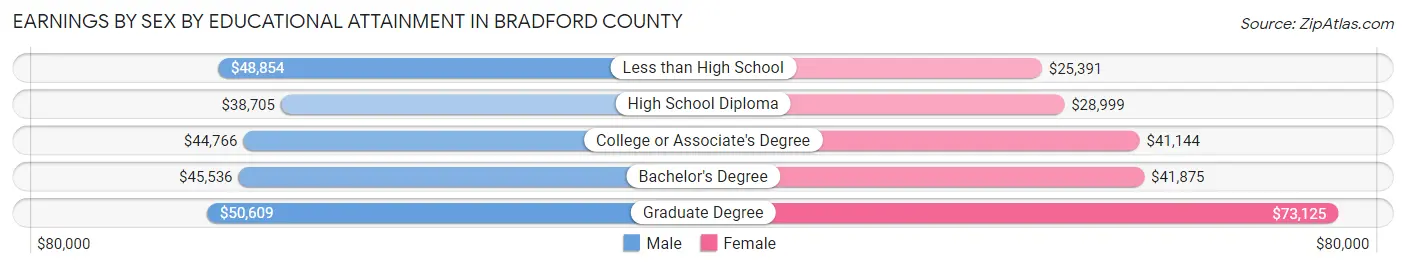
| Educational Attainment | Male Income | Female Income |
| Less than High School | $48,854 | $25,391 |
| High School Diploma | $38,705 | $28,999 |
| College or Associate's Degree | $44,766 | $41,144 |
| Bachelor's Degree | $45,536 | $41,875 |
| Graduate Degree | $50,609 | $73,125 |
| Total | $42,216 | $35,728 |
Family Income in Bradford County
Family Income Brackets in Bradford County
According to the Bradford County family income data, there are 1,185 families falling into the $35,000 to $49,999 income range, which is the most common income bracket and makes up 19.6% of all families. Conversely, the $10,000 to $14,999 income bracket is the least frequent group with only 163 families (2.7%) belonging to this category.
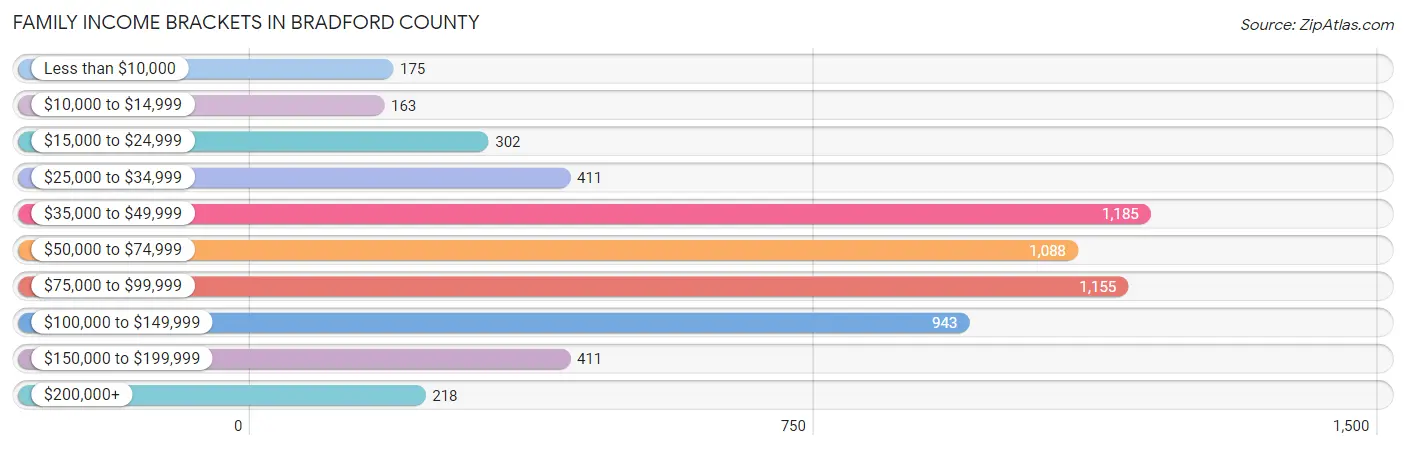
| Income Bracket | # Families | % Families |
| Less than $10,000 | 175 | 2.9% |
| $10,000 to $14,999 | 163 | 2.7% |
| $15,000 to $24,999 | 302 | 5.0% |
| $25,000 to $34,999 | 411 | 6.8% |
| $35,000 to $49,999 | 1,185 | 19.6% |
| $50,000 to $74,999 | 1,088 | 18.0% |
| $75,000 to $99,999 | 1,155 | 19.1% |
| $100,000 to $149,999 | 943 | 15.6% |
| $150,000 to $199,999 | 411 | 6.8% |
| $200,000+ | 218 | 3.6% |
Family Income by Famaliy Size in Bradford County
5-person families (551 | 9.1%) account for the highest median family income in Bradford County with $99,080 per family, while 3-person families (1,428 | 23.6%) have the highest median income of $29,583 per family member.
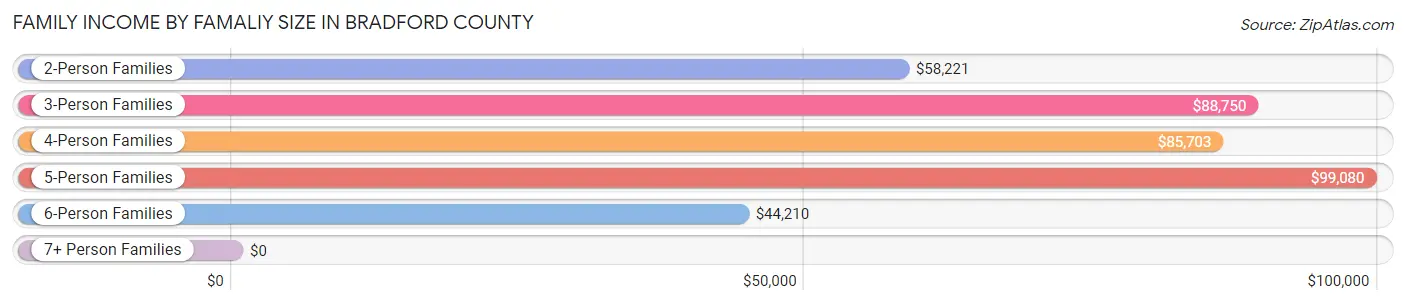
| Income Bracket | # Families | Median Income |
| 2-Person Families | 3,026 (50.1%) | $58,221 |
| 3-Person Families | 1,428 (23.6%) | $88,750 |
| 4-Person Families | 739 (12.2%) | $85,703 |
| 5-Person Families | 551 (9.1%) | $99,080 |
| 6-Person Families | 248 (4.1%) | $44,210 |
| 7+ Person Families | 53 (0.9%) | $0 |
| Total | 6,045 (100.0%) | $71,767 |
Family Income by Number of Earners in Bradford County
The median family income in Bradford County is $71,767, with families comprising 3+ earners (587) having the highest median family income of $140,574, while families with no earners (877) have the lowest median family income of $41,950, accounting for 9.7% and 14.5% of families, respectively.
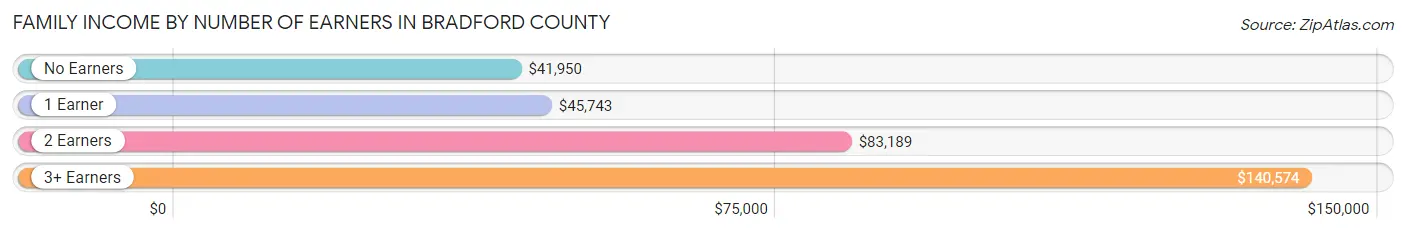
| Number of Earners | # Families | Median Income |
| No Earners | 877 (14.5%) | $41,950 |
| 1 Earner | 2,416 (40.0%) | $45,743 |
| 2 Earners | 2,165 (35.8%) | $83,189 |
| 3+ Earners | 587 (9.7%) | $140,574 |
| Total | 6,045 (100.0%) | $71,767 |
Household Income in Bradford County
Household Income Brackets in Bradford County
With 1,560 households falling in the category, the $50,000 to $74,999 income range is the most frequent in Bradford County, accounting for 17.2% of all households. In contrast, only 227 households (2.5%) fall into the $200,000+ income bracket, making it the least populous group.
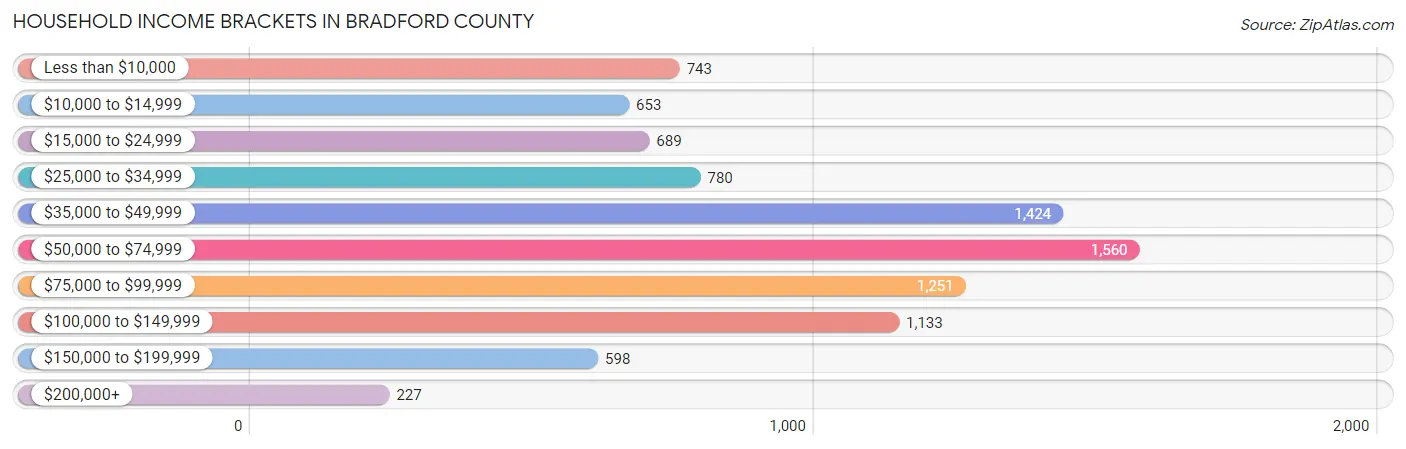
| Income Bracket | # Households | % Households |
| Less than $10,000 | 743 | 8.2% |
| $10,000 to $14,999 | 653 | 7.2% |
| $15,000 to $24,999 | 689 | 7.6% |
| $25,000 to $34,999 | 780 | 8.6% |
| $35,000 to $49,999 | 1,424 | 15.7% |
| $50,000 to $74,999 | 1,560 | 17.2% |
| $75,000 to $99,999 | 1,251 | 13.8% |
| $100,000 to $149,999 | 1,133 | 12.5% |
| $150,000 to $199,999 | 598 | 6.6% |
| $200,000+ | 227 | 2.5% |
Household Income by Householder Age in Bradford County
The median household income in Bradford County is $54,759, with the highest median household income of $70,324 found in the 15 to 24 years age bracket for the primary householder. A total of 229 households (2.5%) fall into this category. Meanwhile, the 65+ years age bracket for the primary householder has the lowest median household income of $37,911, with 3,003 households (33.1%) in this group.
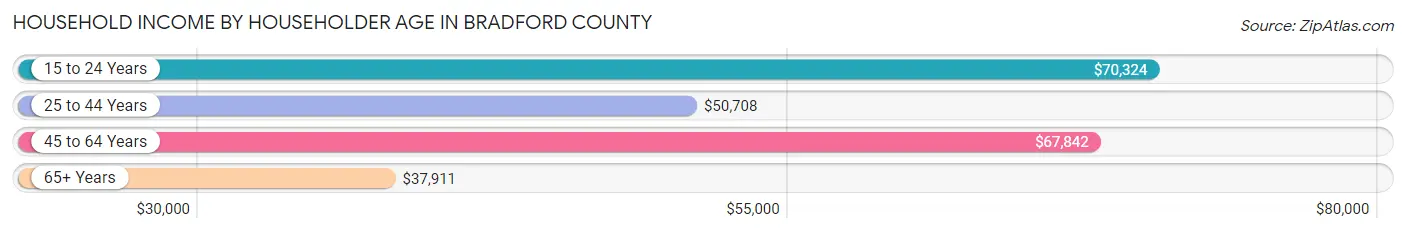
| Income Bracket | # Households | Median Income |
| 15 to 24 Years | 229 (2.5%) | $70,324 |
| 25 to 44 Years | 2,476 (27.3%) | $50,708 |
| 45 to 64 Years | 3,359 (37.0%) | $67,842 |
| 65+ Years | 3,003 (33.1%) | $37,911 |
| Total | 9,067 (100.0%) | $54,759 |
Poverty in Bradford County
Income Below Poverty by Sex and Age in Bradford County
With 16.8% poverty level for males and 19.5% for females among the residents of Bradford County, under 5 year old males and 6 to 11 year old females are the most vulnerable to poverty, with 235 males (32.8%) and 184 females (32.7%) in their respective age groups living below the poverty level.
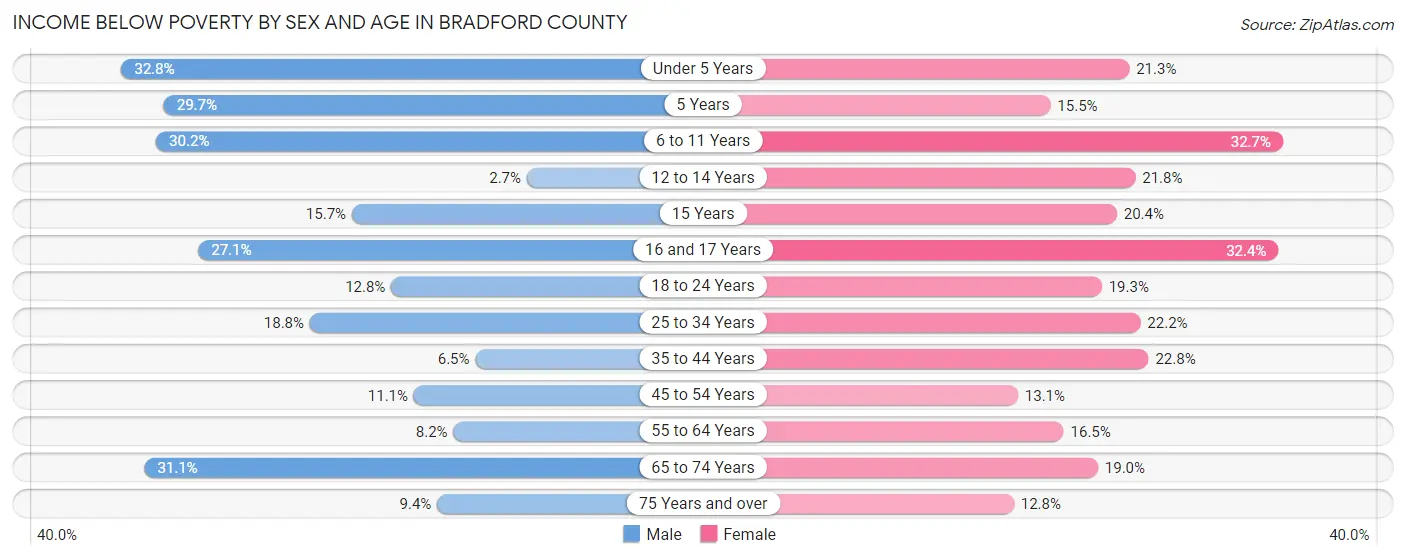
| Age Bracket | Male | Female |
| Under 5 Years | 235 (32.8%) | 124 (21.3%) |
| 5 Years | 35 (29.7%) | 11 (15.5%) |
| 6 to 11 Years | 322 (30.2%) | 184 (32.7%) |
| 12 to 14 Years | 12 (2.7%) | 178 (21.8%) |
| 15 Years | 19 (15.7%) | 29 (20.4%) |
| 16 and 17 Years | 100 (27.1%) | 93 (32.4%) |
| 18 to 24 Years | 156 (12.8%) | 148 (19.3%) |
| 25 to 34 Years | 321 (18.8%) | 350 (22.2%) |
| 35 to 44 Years | 76 (6.5%) | 344 (22.8%) |
| 45 to 54 Years | 182 (11.1%) | 171 (13.1%) |
| 55 to 64 Years | 120 (8.2%) | 284 (16.5%) |
| 65 to 74 Years | 352 (31.1%) | 285 (19.0%) |
| 75 Years and over | 68 (9.4%) | 153 (12.8%) |
| Total | 1,998 (16.8%) | 2,354 (19.5%) |
Income Above Poverty by Sex and Age in Bradford County
According to the poverty statistics in Bradford County, males aged 12 to 14 years and females aged 75 years and over are the age groups that are most secure financially, with 97.3% of males and 87.2% of females in these age groups living above the poverty line.
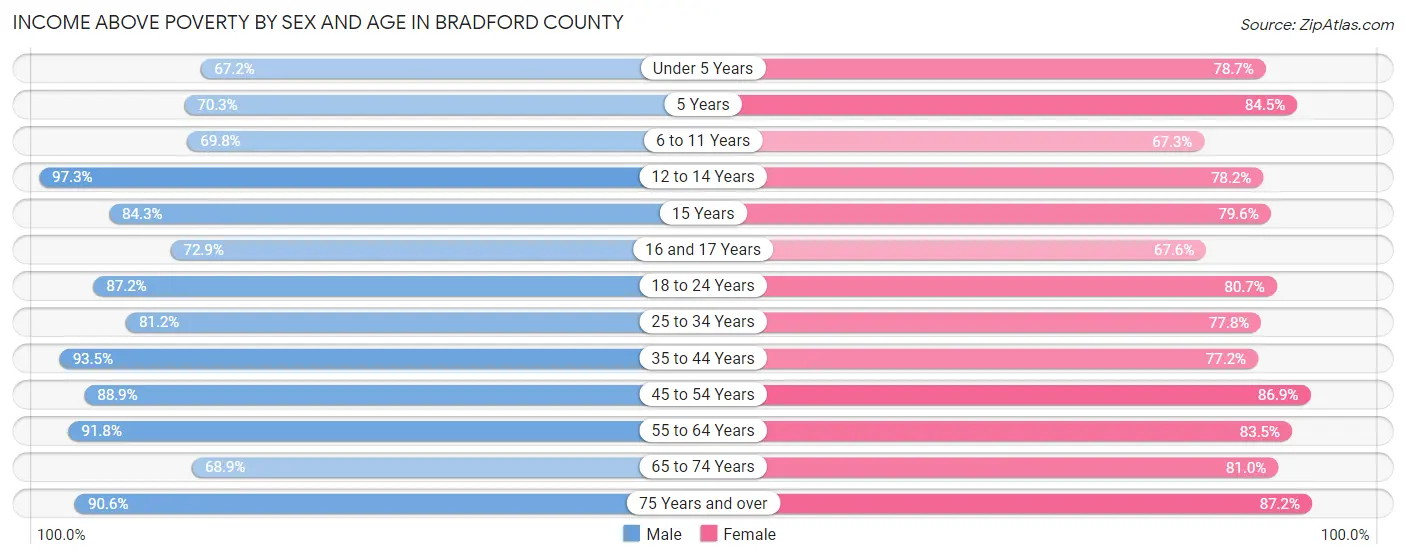
| Age Bracket | Male | Female |
| Under 5 Years | 481 (67.2%) | 457 (78.7%) |
| 5 Years | 83 (70.3%) | 60 (84.5%) |
| 6 to 11 Years | 743 (69.8%) | 378 (67.3%) |
| 12 to 14 Years | 431 (97.3%) | 639 (78.2%) |
| 15 Years | 102 (84.3%) | 113 (79.6%) |
| 16 and 17 Years | 269 (72.9%) | 194 (67.6%) |
| 18 to 24 Years | 1,065 (87.2%) | 619 (80.7%) |
| 25 to 34 Years | 1,385 (81.2%) | 1,229 (77.8%) |
| 35 to 44 Years | 1,087 (93.5%) | 1,167 (77.2%) |
| 45 to 54 Years | 1,458 (88.9%) | 1,137 (86.9%) |
| 55 to 64 Years | 1,351 (91.8%) | 1,440 (83.5%) |
| 65 to 74 Years | 780 (68.9%) | 1,214 (81.0%) |
| 75 Years and over | 658 (90.6%) | 1,045 (87.2%) |
| Total | 9,893 (83.2%) | 9,692 (80.5%) |
Income Below Poverty Among Married-Couple Families in Bradford County
The poverty statistics for married-couple families in Bradford County show that 6.1% or 254 of the total 4,168 families live below the poverty line. Families with 5 or more children have the highest poverty rate of 47.8%, comprising of 11 families. On the other hand, families with no children have the lowest poverty rate of 3.4%, which includes 88 families.
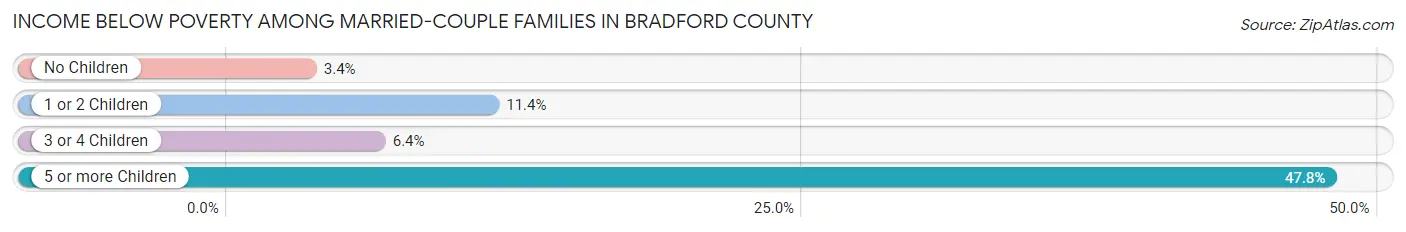
| Children | Above Poverty | Below Poverty |
| No Children | 2,477 (96.6%) | 88 (3.4%) |
| 1 or 2 Children | 959 (88.6%) | 123 (11.4%) |
| 3 or 4 Children | 466 (93.6%) | 32 (6.4%) |
| 5 or more Children | 12 (52.2%) | 11 (47.8%) |
| Total | 3,914 (93.9%) | 254 (6.1%) |
Income Below Poverty Among Single-Parent Households in Bradford County
According to the poverty data in Bradford County, 11.9% or 65 single-father households and 25.7% or 342 single-mother households are living below the poverty line. Among single-father households, those with 5 or more children have the highest poverty rate, with 8 households (100.0%) experiencing poverty. Likewise, among single-mother households, those with 3 or 4 children have the highest poverty rate, with 122 households (93.9%) falling below the poverty line.
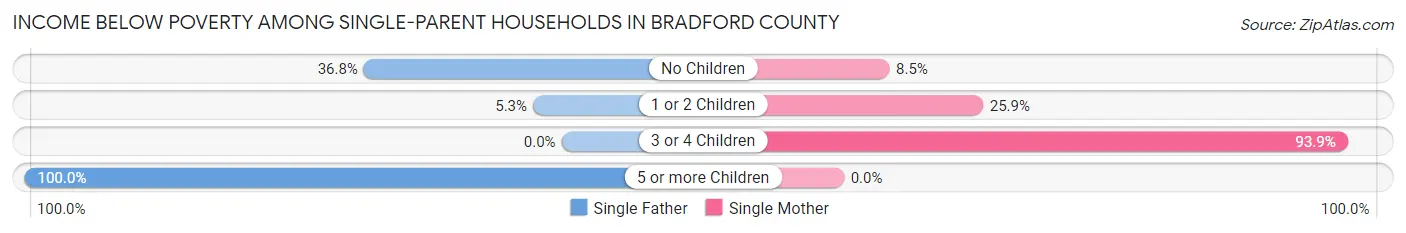
| Children | Single Father | Single Mother |
| No Children | 35 (36.8%) | 44 (8.5%) |
| 1 or 2 Children | 22 (5.3%) | 176 (25.9%) |
| 3 or 4 Children | 0 (0.0%) | 122 (93.9%) |
| 5 or more Children | 8 (100.0%) | 0 (0.0%) |
| Total | 65 (11.9%) | 342 (25.7%) |
Income Below Poverty Among Married-Couple vs Single-Parent Households in Bradford County
The poverty data for Bradford County shows that 254 of the married-couple family households (6.1%) and 407 of the single-parent households (21.7%) are living below the poverty level. Within the married-couple family households, those with 5 or more children have the highest poverty rate, with 11 households (47.8%) falling below the poverty line. Among the single-parent households, those with 5 or more children have the highest poverty rate, with 8 household (100.0%) living below poverty.
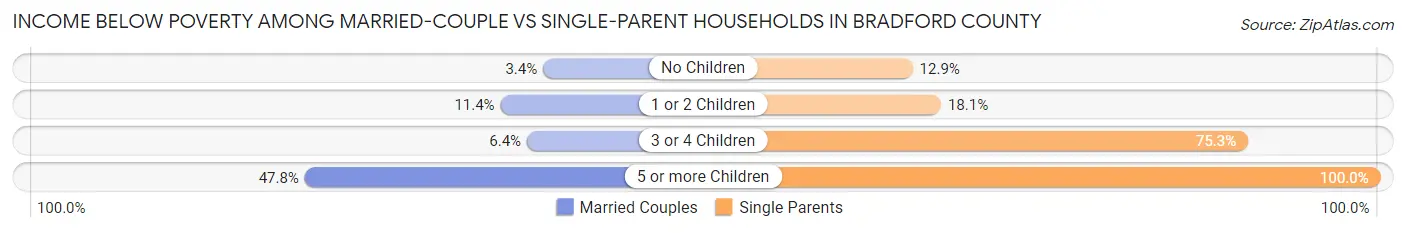
| Children | Married-Couple Families | Single-Parent Households |
| No Children | 88 (3.4%) | 79 (12.9%) |
| 1 or 2 Children | 123 (11.4%) | 198 (18.1%) |
| 3 or 4 Children | 32 (6.4%) | 122 (75.3%) |
| 5 or more Children | 11 (47.8%) | 8 (100.0%) |
| Total | 254 (6.1%) | 407 (21.7%) |
Race in Bradford County
The most populous races in Bradford County are White / Caucasian (20,708 | 74.5%), Black / African American (5,017 | 18.0%), and Two or more Races (1,668 | 6.0%).
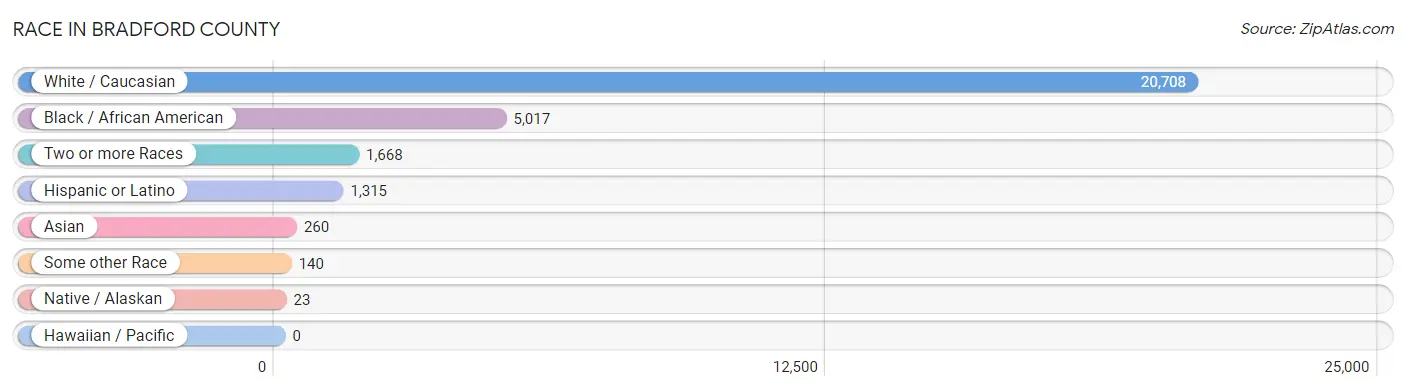
| Race | # Population | % Population |
| Asian | 260 | 0.9% |
| Black / African American | 5,017 | 18.0% |
| Hawaiian / Pacific | 0 | 0.0% |
| Hispanic or Latino | 1,315 | 4.7% |
| Native / Alaskan | 23 | 0.1% |
| White / Caucasian | 20,708 | 74.5% |
| Two or more Races | 1,668 | 6.0% |
| Some other Race | 140 | 0.5% |
| Total | 27,816 | 100.0% |
Ancestry in Bradford County
The most populous ancestries reported in Bradford County are Irish (3,654 | 13.1%), English (2,800 | 10.1%), German (2,740 | 9.9%), American (2,234 | 8.0%), and African (1,084 | 3.9%), together accounting for 45.0% of all Bradford County residents.
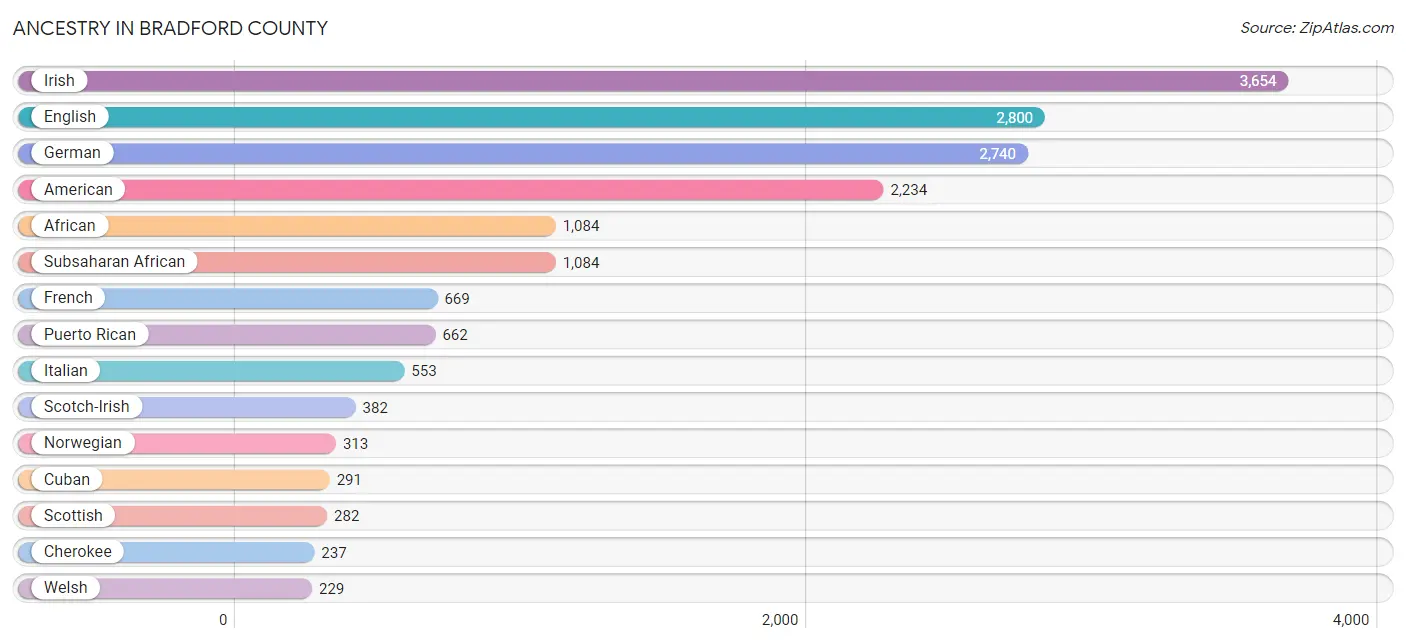
| Ancestry | # Population | % Population |
| African | 1,084 | 3.9% |
| American | 2,234 | 8.0% |
| Apache | 4 | 0.0% |
| Arab | 69 | 0.3% |
| Australian | 71 | 0.3% |
| Belgian | 30 | 0.1% |
| Belizean | 5 | 0.0% |
| Blackfeet | 7 | 0.0% |
| Brazilian | 27 | 0.1% |
| British | 158 | 0.6% |
| British West Indian | 6 | 0.0% |
| Burmese | 4 | 0.0% |
| Canadian | 10 | 0.0% |
| Central American | 13 | 0.1% |
| Cherokee | 237 | 0.9% |
| Chippewa | 3 | 0.0% |
| Choctaw | 4 | 0.0% |
| Colombian | 14 | 0.1% |
| Crow | 80 | 0.3% |
| Cuban | 291 | 1.1% |
| Czech | 34 | 0.1% |
| Danish | 64 | 0.2% |
| Dominican | 23 | 0.1% |
| Dutch | 203 | 0.7% |
| Eastern European | 62 | 0.2% |
| Ecuadorian | 3 | 0.0% |
| English | 2,800 | 10.1% |
| European | 190 | 0.7% |
| French | 669 | 2.4% |
| French Canadian | 226 | 0.8% |
| German | 2,740 | 9.9% |
| Greek | 83 | 0.3% |
| Haitian | 80 | 0.3% |
| Honduran | 2 | 0.0% |
| Hungarian | 89 | 0.3% |
| Indian (Asian) | 42 | 0.2% |
| Irish | 3,654 | 13.1% |
| Italian | 553 | 2.0% |
| Jamaican | 51 | 0.2% |
| Jordanian | 6 | 0.0% |
| Korean | 32 | 0.1% |
| Laotian | 7 | 0.0% |
| Lebanese | 63 | 0.2% |
| Mexican | 123 | 0.4% |
| Northern European | 11 | 0.0% |
| Norwegian | 313 | 1.1% |
| Pakistani | 74 | 0.3% |
| Panamanian | 11 | 0.0% |
| Polish | 103 | 0.4% |
| Portuguese | 75 | 0.3% |
| Puerto Rican | 662 | 2.4% |
| Russian | 4 | 0.0% |
| Scandinavian | 9 | 0.0% |
| Scotch-Irish | 382 | 1.4% |
| Scottish | 282 | 1.0% |
| Seminole | 135 | 0.5% |
| Sioux | 9 | 0.0% |
| Slovak | 97 | 0.4% |
| South American | 17 | 0.1% |
| South American Indian | 6 | 0.0% |
| Spaniard | 95 | 0.3% |
| Spanish | 58 | 0.2% |
| Sri Lankan | 8 | 0.0% |
| Subsaharan African | 1,084 | 3.9% |
| Swedish | 57 | 0.2% |
| Swiss | 14 | 0.1% |
| Thai | 140 | 0.5% |
| U.S. Virgin Islander | 3 | 0.0% |
| Welsh | 229 | 0.8% |
| West Indian | 14 | 0.1% | View All 70 Rows |
Immigrants in Bradford County
The most numerous immigrant groups reported in Bradford County came from Latin America (326 | 1.2%), Caribbean (284 | 1.0%), Asia (201 | 0.7%), Europe (137 | 0.5%), and Jamaica (137 | 0.5%), together accounting for 3.9% of all Bradford County residents.
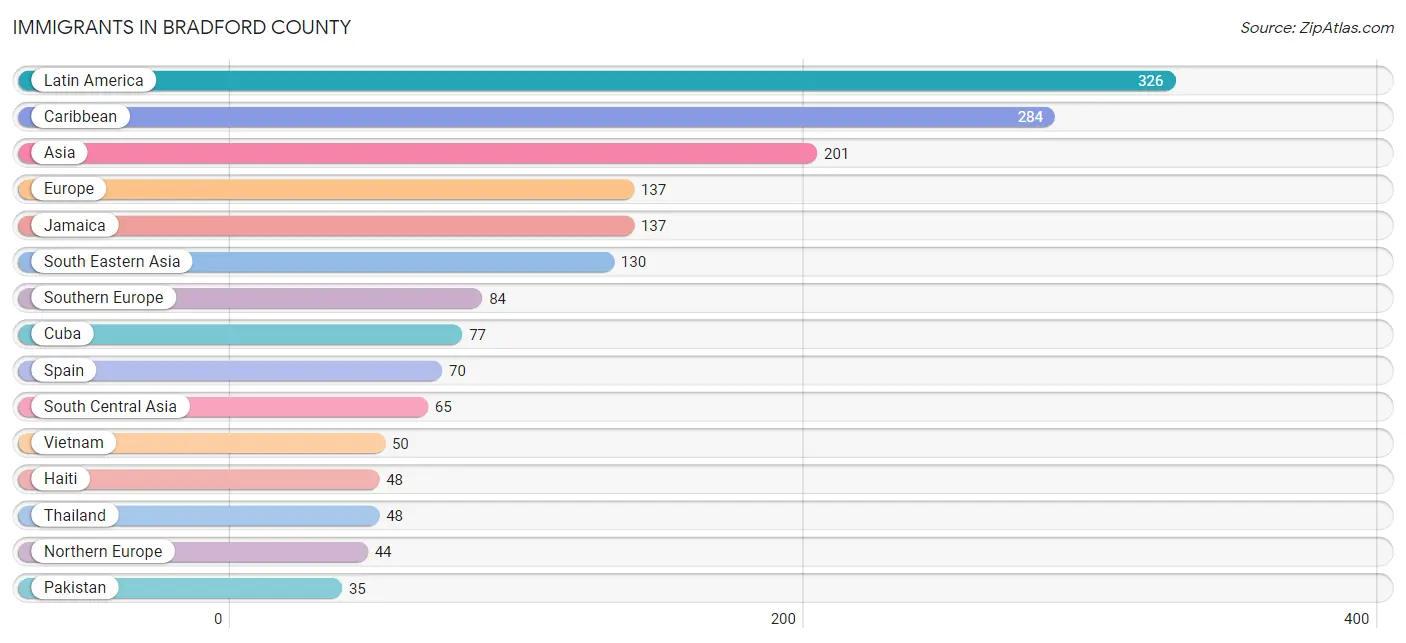
| Immigration Origin | # Population | % Population |
| Africa | 7 | 0.0% |
| Asia | 201 | 0.7% |
| Australia | 25 | 0.1% |
| Brazil | 27 | 0.1% |
| Canada | 16 | 0.1% |
| Caribbean | 284 | 1.0% |
| Central America | 9 | 0.0% |
| Cuba | 77 | 0.3% |
| England | 19 | 0.1% |
| Europe | 137 | 0.5% |
| Germany | 9 | 0.0% |
| Ghana | 7 | 0.0% |
| Guyana | 6 | 0.0% |
| Haiti | 48 | 0.2% |
| India | 30 | 0.1% |
| Italy | 14 | 0.1% |
| Jamaica | 137 | 0.5% |
| Jordan | 6 | 0.0% |
| Latin America | 326 | 1.2% |
| Mexico | 9 | 0.0% |
| Northern Europe | 44 | 0.2% |
| Oceania | 25 | 0.1% |
| Pakistan | 35 | 0.1% |
| Philippines | 32 | 0.1% |
| South America | 33 | 0.1% |
| South Central Asia | 65 | 0.2% |
| South Eastern Asia | 130 | 0.5% |
| Southern Europe | 84 | 0.3% |
| Spain | 70 | 0.3% |
| Thailand | 48 | 0.2% |
| Trinidad and Tobago | 22 | 0.1% |
| Vietnam | 50 | 0.2% |
| Western Africa | 7 | 0.0% |
| Western Asia | 6 | 0.0% |
| Western Europe | 9 | 0.0% | View All 35 Rows |
Sex and Age in Bradford County
Sex and Age in Bradford County
The most populous age groups in Bradford County are 30 to 34 Years (1,405 | 9.1%) for men and 10 to 14 Years (1,067 | 8.6%) for women.
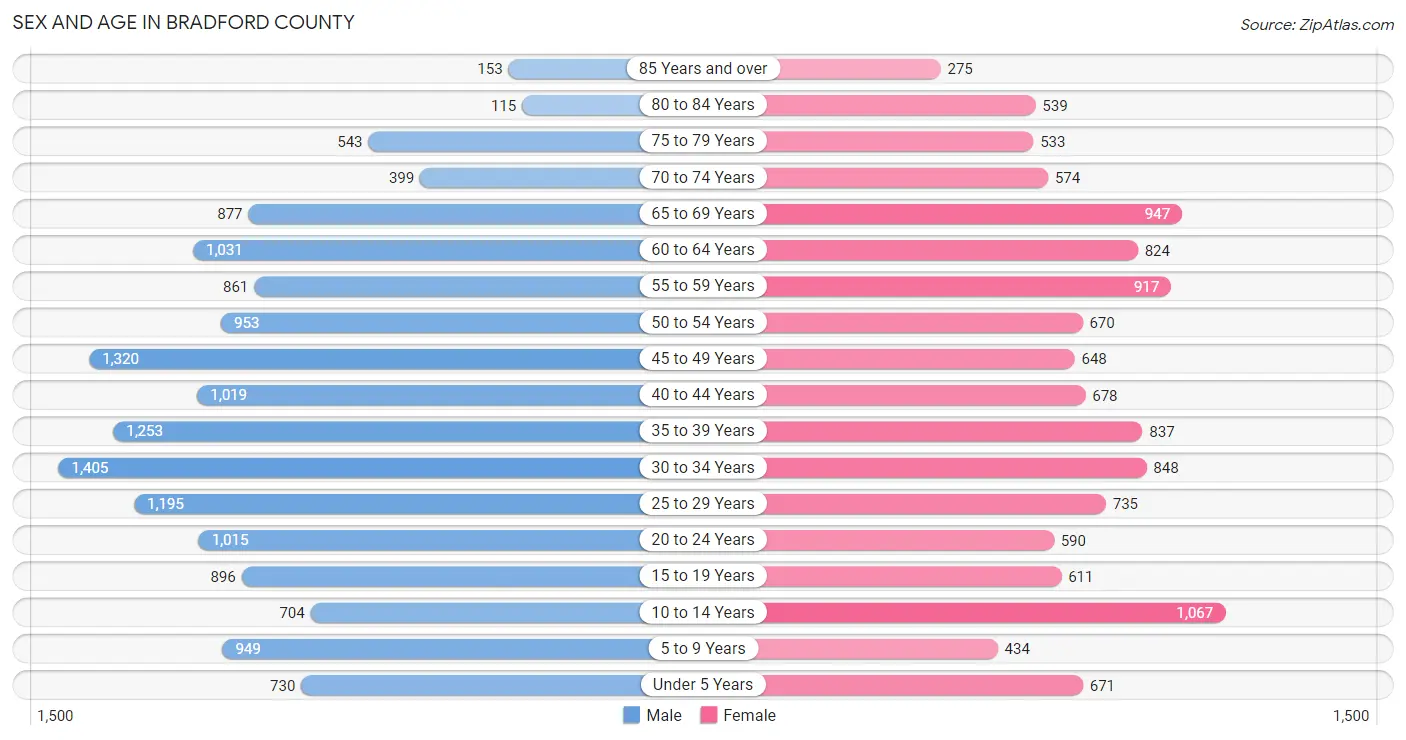
| Age Bracket | Male | Female |
| Under 5 Years | 730 (4.7%) | 671 (5.4%) |
| 5 to 9 Years | 949 (6.2%) | 434 (3.5%) |
| 10 to 14 Years | 704 (4.6%) | 1,067 (8.6%) |
| 15 to 19 Years | 896 (5.8%) | 611 (4.9%) |
| 20 to 24 Years | 1,015 (6.6%) | 590 (4.8%) |
| 25 to 29 Years | 1,195 (7.7%) | 735 (5.9%) |
| 30 to 34 Years | 1,405 (9.1%) | 848 (6.8%) |
| 35 to 39 Years | 1,253 (8.1%) | 837 (6.8%) |
| 40 to 44 Years | 1,019 (6.6%) | 678 (5.5%) |
| 45 to 49 Years | 1,320 (8.6%) | 648 (5.2%) |
| 50 to 54 Years | 953 (6.2%) | 670 (5.4%) |
| 55 to 59 Years | 861 (5.6%) | 917 (7.4%) |
| 60 to 64 Years | 1,031 (6.7%) | 824 (6.7%) |
| 65 to 69 Years | 877 (5.7%) | 947 (7.6%) |
| 70 to 74 Years | 399 (2.6%) | 574 (4.6%) |
| 75 to 79 Years | 543 (3.5%) | 533 (4.3%) |
| 80 to 84 Years | 115 (0.7%) | 539 (4.3%) |
| 85 Years and over | 153 (1.0%) | 275 (2.2%) |
| Total | 15,418 (100.0%) | 12,398 (100.0%) |
Families and Households in Bradford County
Median Family Size in Bradford County
The median family size in Bradford County is 3.18 persons per family, with single male/father families (548 | 9.1%) accounting for the largest median family size of 3.4 persons per family. On the other hand, married-couple families (4,168 | 69.0%) represent the smallest median family size with 3.14 persons per family.
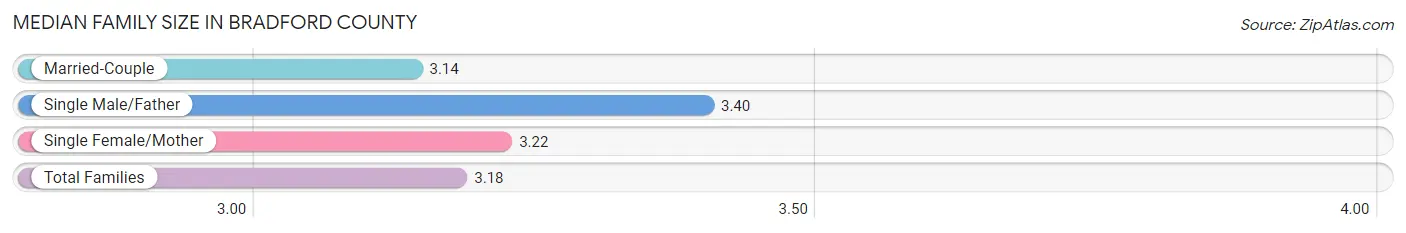
| Family Type | # Families | Family Size |
| Married-Couple | 4,168 (69.0%) | 3.14 |
| Single Male/Father | 548 (9.1%) | 3.40 |
| Single Female/Mother | 1,329 (22.0%) | 3.22 |
| Total Families | 6,045 (100.0%) | 3.18 |
Median Household Size in Bradford County
The median household size in Bradford County is 2.65 persons per household, with single male/father households (548 | 6.0%) accounting for the largest median household size of 3.97 persons per household. non-family households (3,022 | 33.3%) represent the smallest median household size with 1.28 persons per household.
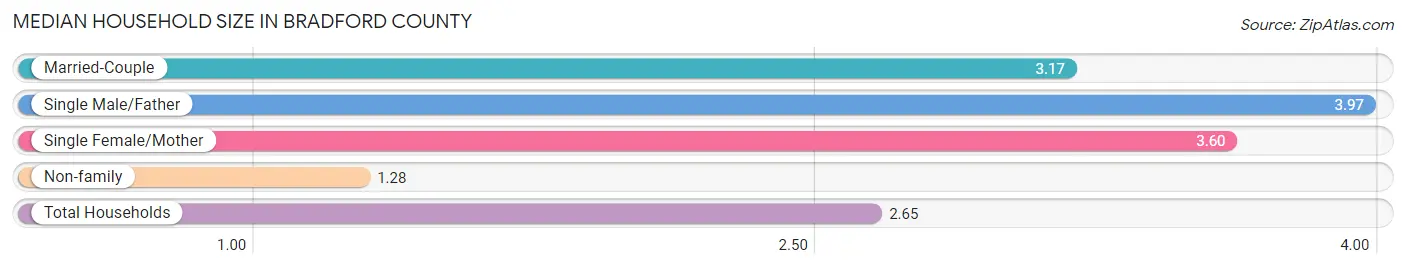
| Household Type | # Households | Household Size |
| Married-Couple | 4,168 (46.0%) | 3.17 |
| Single Male/Father | 548 (6.0%) | 3.97 |
| Single Female/Mother | 1,329 (14.7%) | 3.60 |
| Non-family | 3,022 (33.3%) | 1.28 |
| Total Households | 9,067 (100.0%) | 2.65 |
Household Size by Marriage Status in Bradford County
Out of a total of 9,067 households in Bradford County, 6,045 (66.7%) are family households, while 3,022 (33.3%) are nonfamily households. The most numerous type of family households are 2-person households, comprising 2,806, and the most common type of nonfamily households are 1-person households, comprising 2,659.
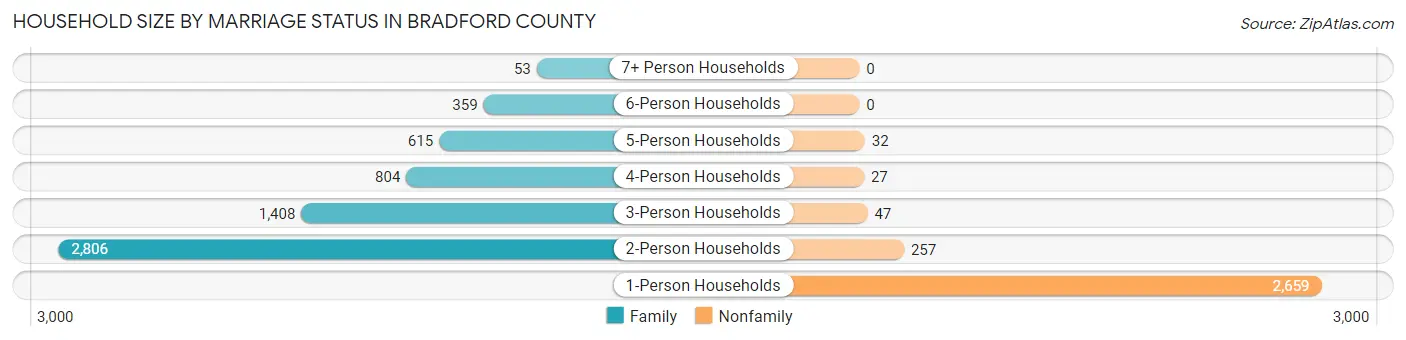
| Household Size | Family Households | Nonfamily Households |
| 1-Person Households | - | 2,659 (29.3%) |
| 2-Person Households | 2,806 (30.9%) | 257 (2.8%) |
| 3-Person Households | 1,408 (15.5%) | 47 (0.5%) |
| 4-Person Households | 804 (8.9%) | 27 (0.3%) |
| 5-Person Households | 615 (6.8%) | 32 (0.4%) |
| 6-Person Households | 359 (4.0%) | 0 (0.0%) |
| 7+ Person Households | 53 (0.6%) | 0 (0.0%) |
| Total | 6,045 (66.7%) | 3,022 (33.3%) |
Female Fertility in Bradford County
Fertility by Age in Bradford County
Average fertility rate in Bradford County is 10.0 births per 1,000 women. Women in the age bracket of 20 to 34 years have the highest fertility rate with 20.0 births per 1,000 women. Women in the age bracket of 20 to 34 years acount for 91.7% of all women with births.
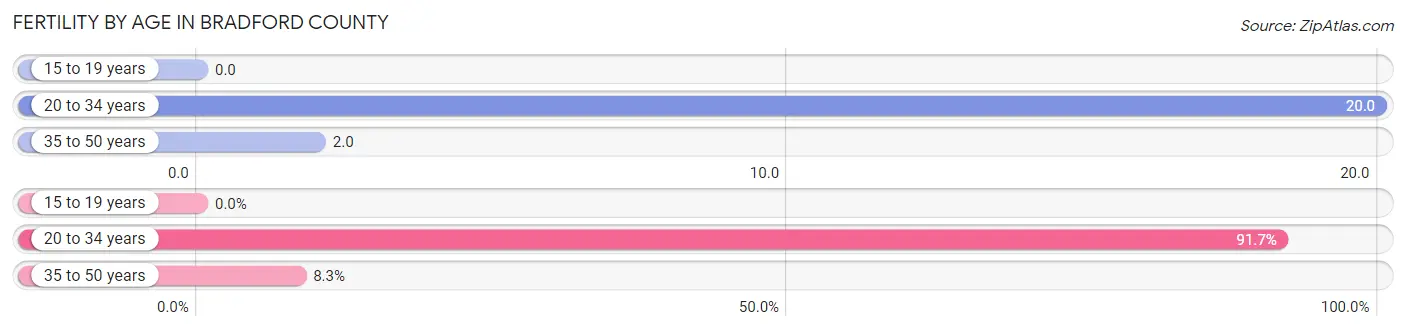
| Age Bracket | Women with Births | Births / 1,000 Women |
| 15 to 19 years | 0 (0.0%) | 0.0 |
| 20 to 34 years | 44 (91.7%) | 20.0 |
| 35 to 50 years | 4 (8.3%) | 2.0 |
| Total | 48 (100.0%) | 10.0 |
Fertility by Age by Marriage Status in Bradford County
64.6% of women with births (48) in Bradford County are married. The highest percentage of unmarried women with births falls into 35 to 50 years age bracket with 100.0% of them unmarried at the time of birth, while the lowest percentage of unmarried women with births belong to 20 to 34 years age bracket with 29.5% of them unmarried.
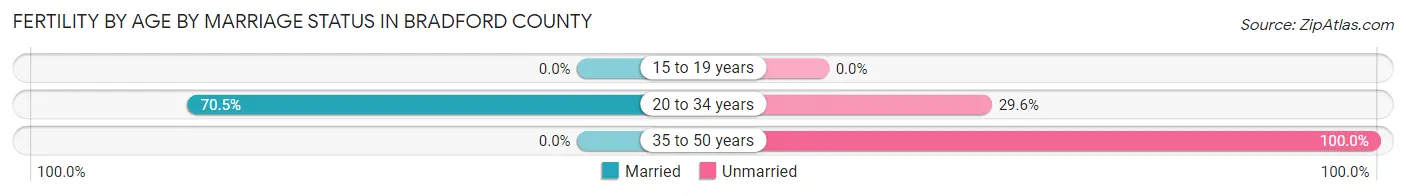
| Age Bracket | Married | Unmarried |
| 15 to 19 years | 0 (0.0%) | 0 (0.0%) |
| 20 to 34 years | 31 (70.5%) | 13 (29.5%) |
| 35 to 50 years | 0 (0.0%) | 4 (100.0%) |
| Total | 31 (64.6%) | 17 (35.4%) |
Fertility by Education in Bradford County
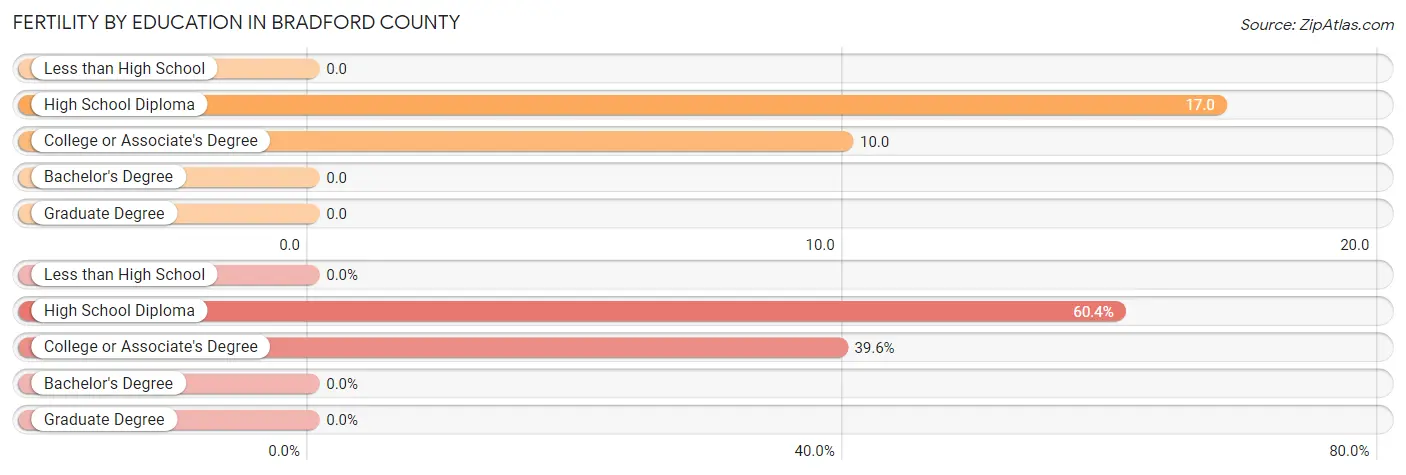
| Educational Attainment | Women with Births | Births / 1,000 Women |
| Less than High School | 0 (0.0%) | 0.0 |
| High School Diploma | 29 (60.4%) | 17.0 |
| College or Associate's Degree | 19 (39.6%) | 10.0 |
| Bachelor's Degree | 0 (0.0%) | 0.0 |
| Graduate Degree | 0 (0.0%) | 0.0 |
| Total | 48 (100.0%) | 10.0 |
Fertility by Education by Marriage Status in Bradford County
35.4% of women with births in Bradford County are unmarried. Women with the educational attainment of high school diploma are most likely to be married with 69.0% of them married at childbirth, while women with the educational attainment of college or associate's degree are least likely to be married with 42.1% of them unmarried at childbirth.
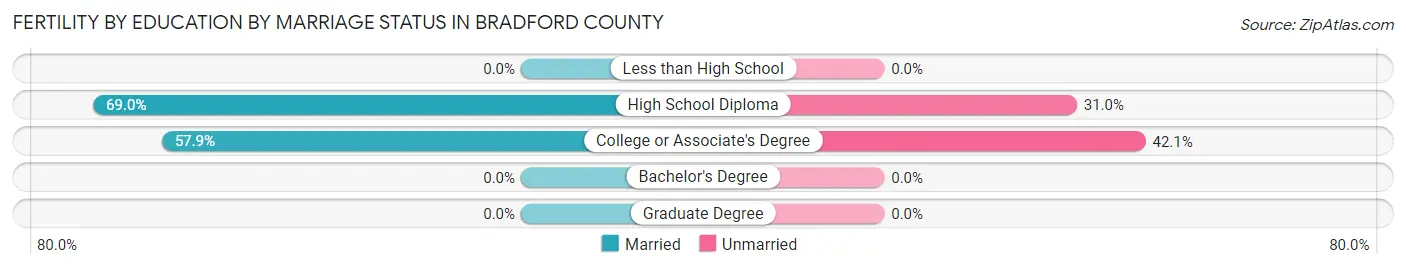
| Educational Attainment | Married | Unmarried |
| Less than High School | 0 (0.0%) | 0 (0.0%) |
| High School Diploma | 20 (69.0%) | 9 (31.0%) |
| College or Associate's Degree | 11 (57.9%) | 8 (42.1%) |
| Bachelor's Degree | 0 (0.0%) | 0 (0.0%) |
| Graduate Degree | 0 (0.0%) | 0 (0.0%) |
| Total | 31 (64.6%) | 17 (35.4%) |
Employment Characteristics in Bradford County
Employment by Class of Employer in Bradford County
Among the 10,616 employed individuals in Bradford County, private company employees (6,818 | 64.2%), local government employees (968 | 9.1%), and state government employees (941 | 8.9%) make up the most common classes of employment.
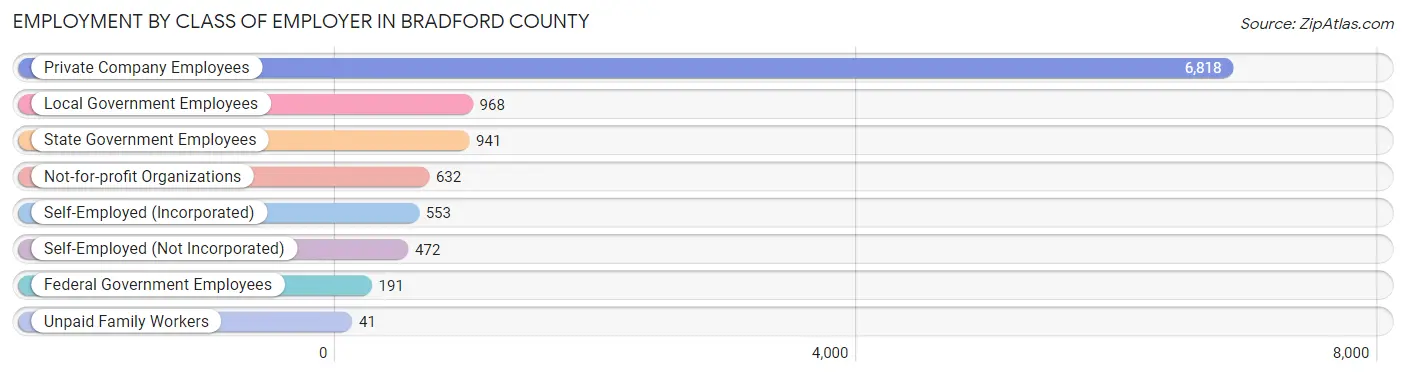
| Employer Class | # Employees | % Employees |
| Private Company Employees | 6,818 | 64.2% |
| Self-Employed (Incorporated) | 553 | 5.2% |
| Self-Employed (Not Incorporated) | 472 | 4.4% |
| Not-for-profit Organizations | 632 | 5.9% |
| Local Government Employees | 968 | 9.1% |
| State Government Employees | 941 | 8.9% |
| Federal Government Employees | 191 | 1.8% |
| Unpaid Family Workers | 41 | 0.4% |
| Total | 10,616 | 100.0% |
Employment Status by Age in Bradford County
According to the labor force statistics for Bradford County, out of the total population over 16 years of age (22,998), 49.5% or 11,384 individuals are in the labor force, with 5.8% or 660 of them unemployed. The age group with the highest labor force participation rate is 20 to 24 years, with 72.1% or 1,157 individuals in the labor force. Within the labor force, the 16 to 19 years age range has the highest percentage of unemployed individuals, with 18.8% or 84 of them being unemployed.
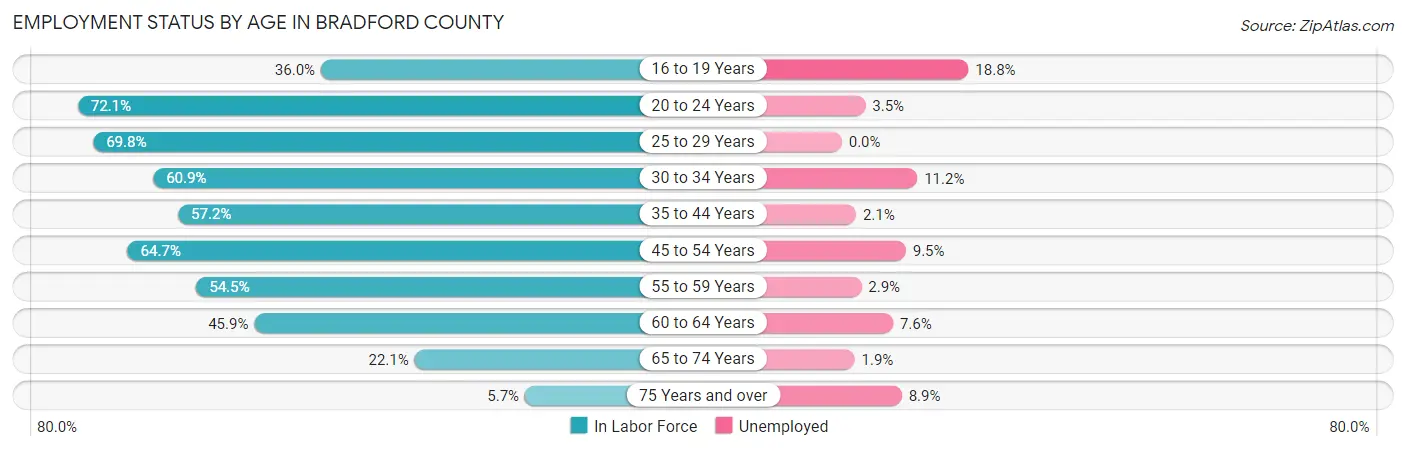
| Age Bracket | In Labor Force | Unemployed |
| 16 to 19 Years | 448 (36.0%) | 84 (18.8%) |
| 20 to 24 Years | 1,157 (72.1%) | 40 (3.5%) |
| 25 to 29 Years | 1,347 (69.8%) | 0 (0.0%) |
| 30 to 34 Years | 1,372 (60.9%) | 154 (11.2%) |
| 35 to 44 Years | 2,166 (57.2%) | 45 (2.1%) |
| 45 to 54 Years | 2,323 (64.7%) | 221 (9.5%) |
| 55 to 59 Years | 969 (54.5%) | 28 (2.9%) |
| 60 to 64 Years | 851 (45.9%) | 65 (7.6%) |
| 65 to 74 Years | 618 (22.1%) | 12 (1.9%) |
| 75 Years and over | 123 (5.7%) | 11 (8.9%) |
| Total | 11,384 (49.5%) | 660 (5.8%) |
Employment Status by Educational Attainment in Bradford County
According to labor force statistics for Bradford County, 59.4% of individuals (9,025) out of the total population between 25 and 64 years of age (15,194) are in the labor force, with 5.7% or 514 of them being unemployed. The group with the highest labor force participation rate are those with the educational attainment of college / associate degree, with 70.4% or 3,346 individuals in the labor force. Within the labor force, individuals with less than high school education have the highest percentage of unemployment, with 26.4% or 239 of them being unemployed.
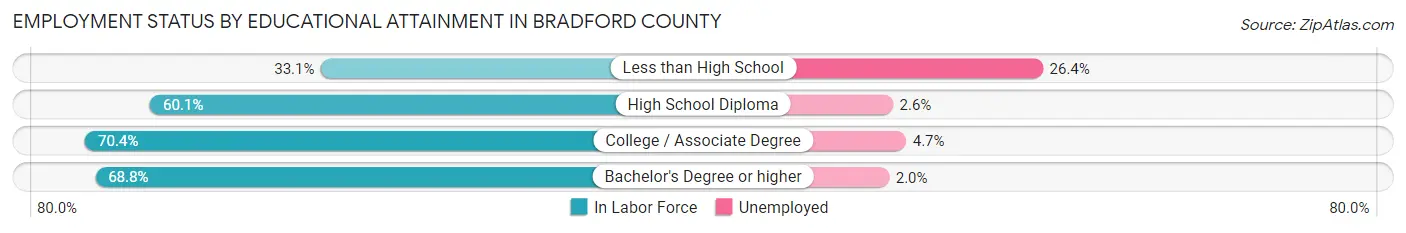
| Educational Attainment | In Labor Force | Unemployed |
| Less than High School | 905 (33.1%) | 722 (26.4%) |
| High School Diploma | 3,608 (60.1%) | 156 (2.6%) |
| College / Associate Degree | 3,346 (70.4%) | 223 (4.7%) |
| Bachelor's Degree or higher | 1,172 (68.8%) | 34 (2.0%) |
| Total | 9,025 (59.4%) | 866 (5.7%) |
Employment Occupations by Sex in Bradford County
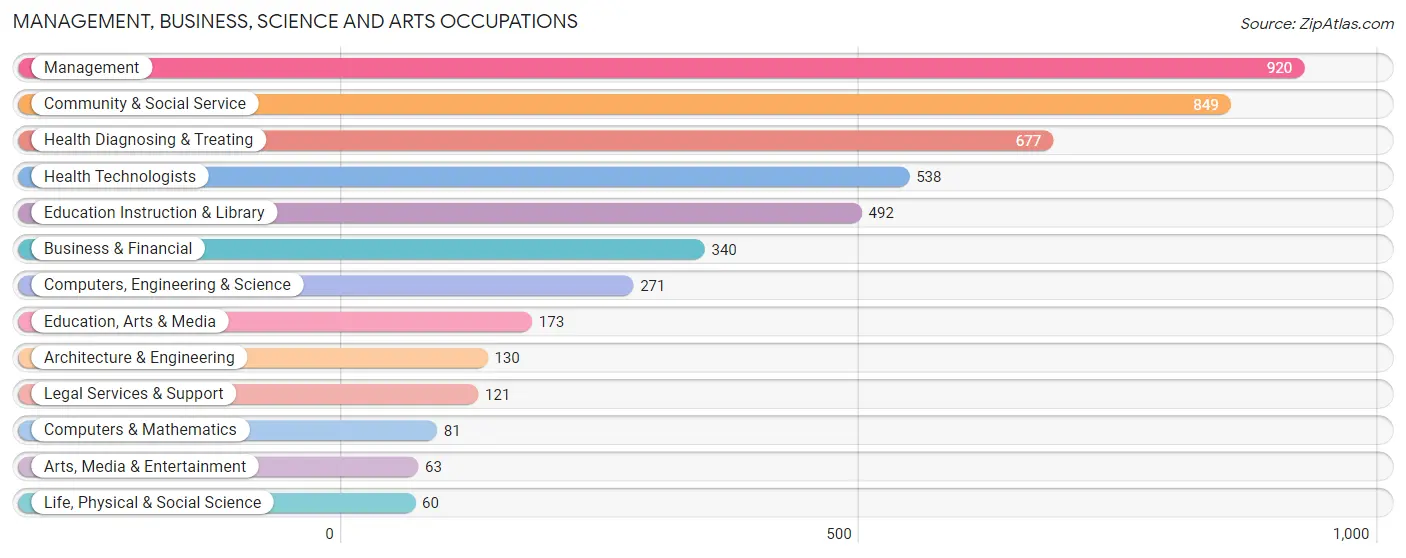
Management, Business, Science and Arts Occupations
The most common Management, Business, Science and Arts occupations in Bradford County are Management (920 | 8.6%), Community & Social Service (849 | 8.0%), Health Diagnosing & Treating (677 | 6.4%), Health Technologists (538 | 5.1%), and Education Instruction & Library (492 | 4.6%).
Management, Business, Science and Arts Occupations by Sex
Within the Management, Business, Science and Arts occupations in Bradford County, the most male-oriented occupations are Life, Physical & Social Science (100.0%), Arts, Media & Entertainment (100.0%), and Computers, Engineering & Science (91.5%), while the most female-oriented occupations are Health Technologists (95.9%), Health Diagnosing & Treating (93.2%), and Education Instruction & Library (74.4%).
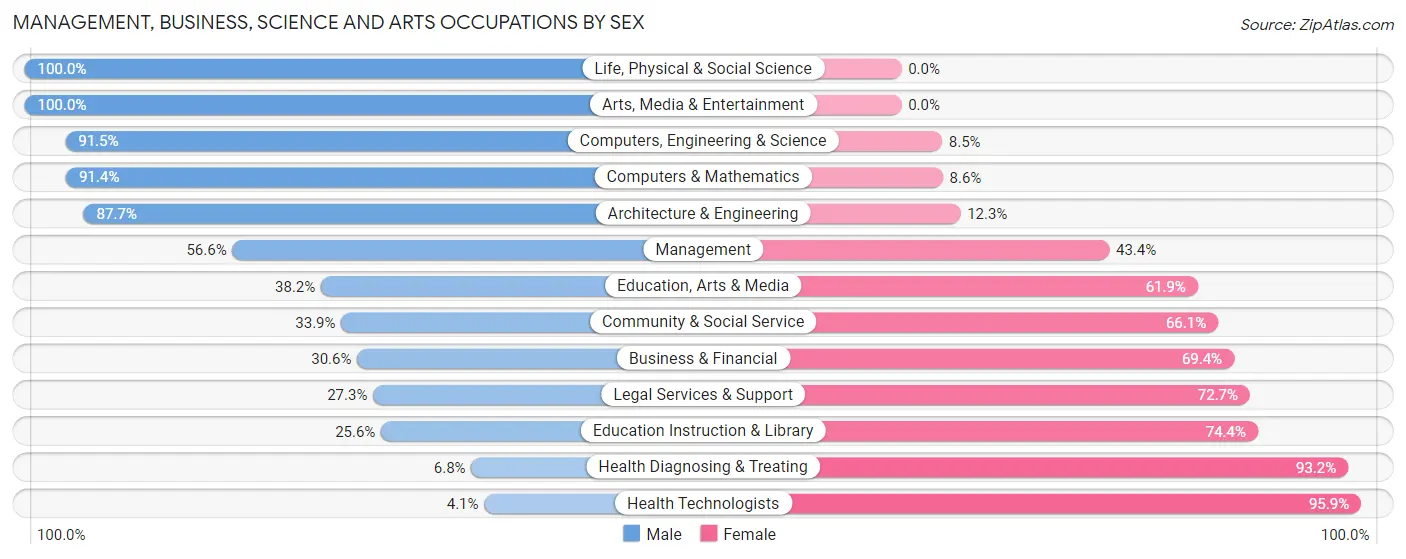
| Occupation | Male | Female |
| Management | 521 (56.6%) | 399 (43.4%) |
| Business & Financial | 104 (30.6%) | 236 (69.4%) |
| Computers, Engineering & Science | 248 (91.5%) | 23 (8.5%) |
| Computers & Mathematics | 74 (91.4%) | 7 (8.6%) |
| Architecture & Engineering | 114 (87.7%) | 16 (12.3%) |
| Life, Physical & Social Science | 60 (100.0%) | 0 (0.0%) |
| Community & Social Service | 288 (33.9%) | 561 (66.1%) |
| Education, Arts & Media | 66 (38.2%) | 107 (61.9%) |
| Legal Services & Support | 33 (27.3%) | 88 (72.7%) |
| Education Instruction & Library | 126 (25.6%) | 366 (74.4%) |
| Arts, Media & Entertainment | 63 (100.0%) | 0 (0.0%) |
| Health Diagnosing & Treating | 46 (6.8%) | 631 (93.2%) |
| Health Technologists | 22 (4.1%) | 516 (95.9%) |
| Total (Category) | 1,207 (39.5%) | 1,850 (60.5%) |
| Total (Overall) | 5,449 (51.2%) | 5,196 (48.8%) |
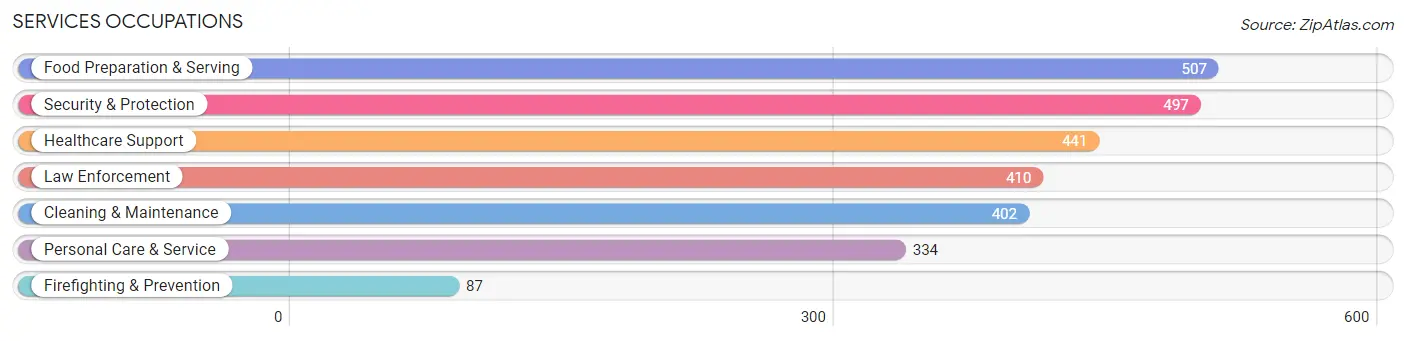
Services Occupations
The most common Services occupations in Bradford County are Food Preparation & Serving (507 | 4.8%), Security & Protection (497 | 4.7%), Healthcare Support (441 | 4.1%), Law Enforcement (410 | 3.8%), and Cleaning & Maintenance (402 | 3.8%).
Services Occupations by Sex
Within the Services occupations in Bradford County, the most male-oriented occupations are Firefighting & Prevention (100.0%), Security & Protection (65.4%), and Law Enforcement (58.1%), while the most female-oriented occupations are Healthcare Support (86.4%), Personal Care & Service (86.2%), and Food Preparation & Serving (82.3%).
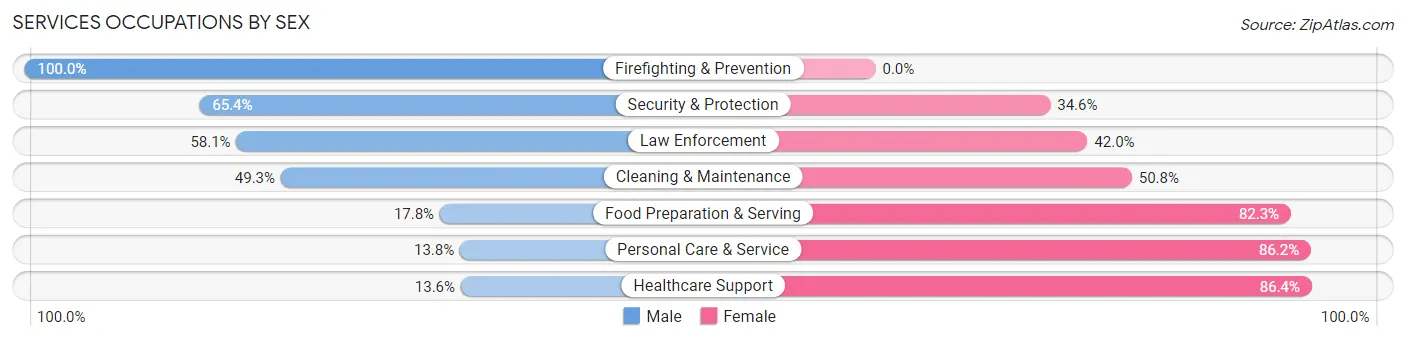
| Occupation | Male | Female |
| Healthcare Support | 60 (13.6%) | 381 (86.4%) |
| Security & Protection | 325 (65.4%) | 172 (34.6%) |
| Firefighting & Prevention | 87 (100.0%) | 0 (0.0%) |
| Law Enforcement | 238 (58.1%) | 172 (41.9%) |
| Food Preparation & Serving | 90 (17.7%) | 417 (82.3%) |
| Cleaning & Maintenance | 198 (49.2%) | 204 (50.7%) |
| Personal Care & Service | 46 (13.8%) | 288 (86.2%) |
| Total (Category) | 719 (33.0%) | 1,462 (67.0%) |
| Total (Overall) | 5,449 (51.2%) | 5,196 (48.8%) |
Sales and Office Occupations
The most common Sales and Office occupations in Bradford County are Office & Administration (1,351 | 12.7%), and Sales & Related (1,309 | 12.3%).
Sales and Office Occupations by Sex
| Occupation | Male | Female |
| Sales & Related | 852 (65.1%) | 457 (34.9%) |
| Office & Administration | 297 (22.0%) | 1,054 (78.0%) |
| Total (Category) | 1,149 (43.2%) | 1,511 (56.8%) |
| Total (Overall) | 5,449 (51.2%) | 5,196 (48.8%) |
Natural Resources, Construction and Maintenance Occupations
The most common Natural Resources, Construction and Maintenance occupations in Bradford County are Construction & Extraction (573 | 5.4%), Installation, Maintenance & Repair (511 | 4.8%), and Farming, Fishing & Forestry (20 | 0.2%).
Natural Resources, Construction and Maintenance Occupations by Sex
| Occupation | Male | Female |
| Farming, Fishing & Forestry | 20 (100.0%) | 0 (0.0%) |
| Construction & Extraction | 543 (94.8%) | 30 (5.2%) |
| Installation, Maintenance & Repair | 462 (90.4%) | 49 (9.6%) |
| Total (Category) | 1,025 (92.8%) | 79 (7.2%) |
| Total (Overall) | 5,449 (51.2%) | 5,196 (48.8%) |
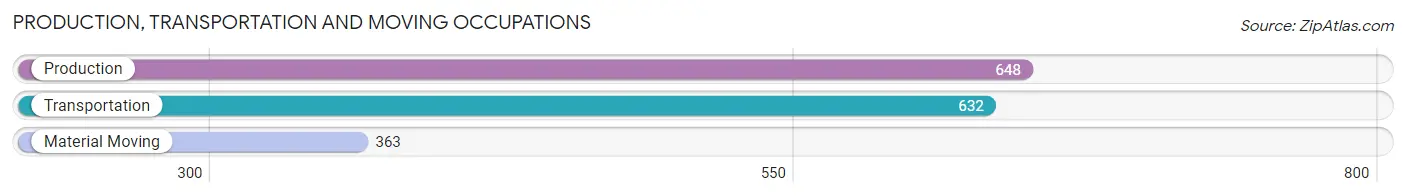
Production, Transportation and Moving Occupations
The most common Production, Transportation and Moving occupations in Bradford County are Production (648 | 6.1%), Transportation (632 | 5.9%), and Material Moving (363 | 3.4%).
Production, Transportation and Moving Occupations by Sex
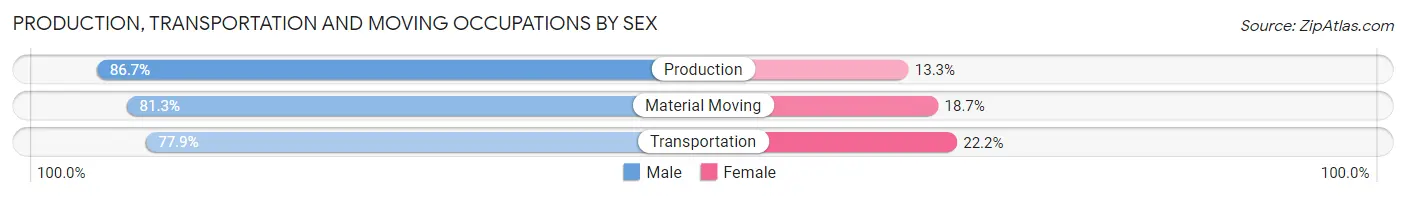
| Occupation | Male | Female |
| Production | 562 (86.7%) | 86 (13.3%) |
| Transportation | 492 (77.8%) | 140 (22.2%) |
| Material Moving | 295 (81.3%) | 68 (18.7%) |
| Total (Category) | 1,349 (82.1%) | 294 (17.9%) |
| Total (Overall) | 5,449 (51.2%) | 5,196 (48.8%) |
Employment Industries by Sex in Bradford County
Employment Industries in Bradford County
The major employment industries in Bradford County include Health Care & Social Assistance (1,838 | 17.3%), Retail Trade (1,202 | 11.3%), Educational Services (917 | 8.6%), Public Administration (896 | 8.4%), and Construction (786 | 7.4%).
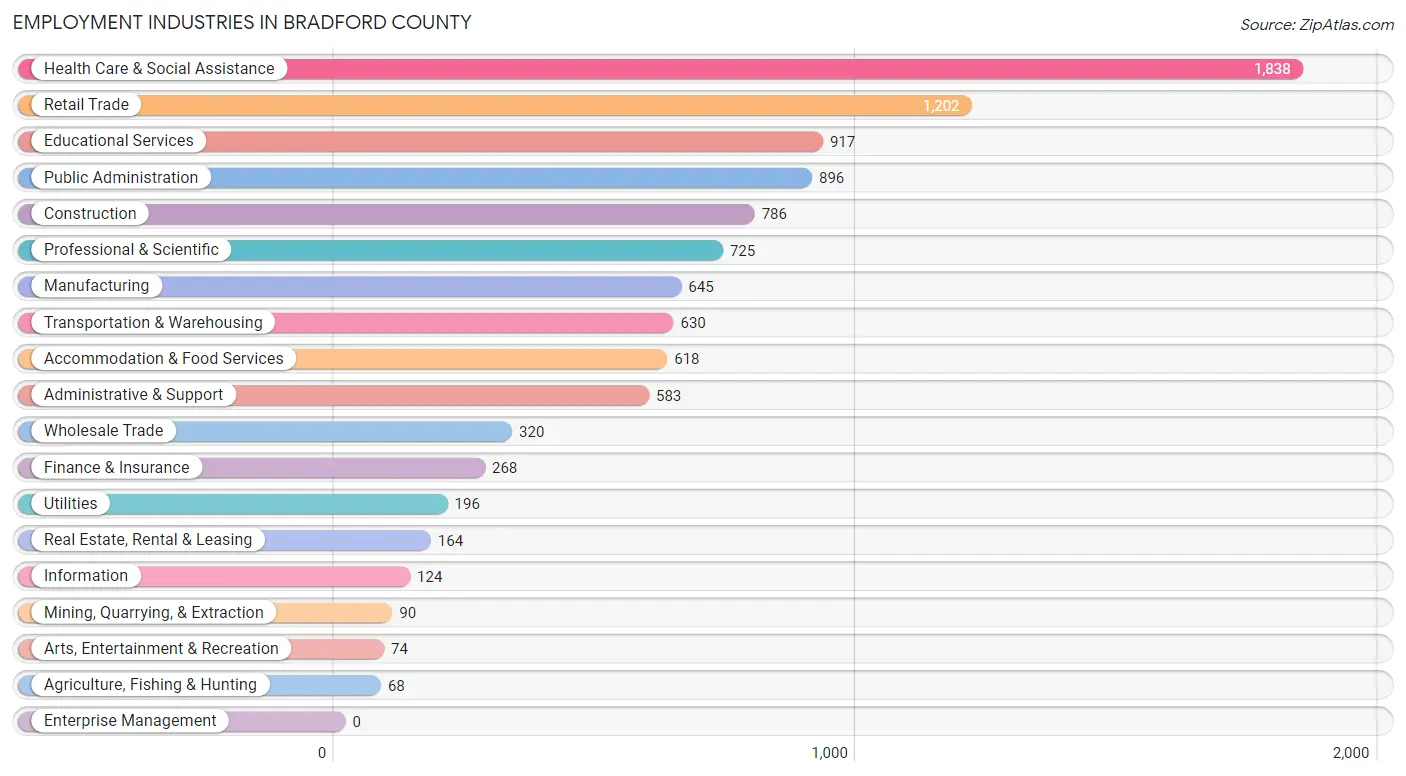
Employment Industries by Sex in Bradford County
The Bradford County industries that see more men than women are Utilities (98.0%), Wholesale Trade (93.8%), and Construction (92.9%), whereas the industries that tend to have a higher number of women are Finance & Insurance (81.3%), Health Care & Social Assistance (79.9%), and Professional & Scientific (79.0%).
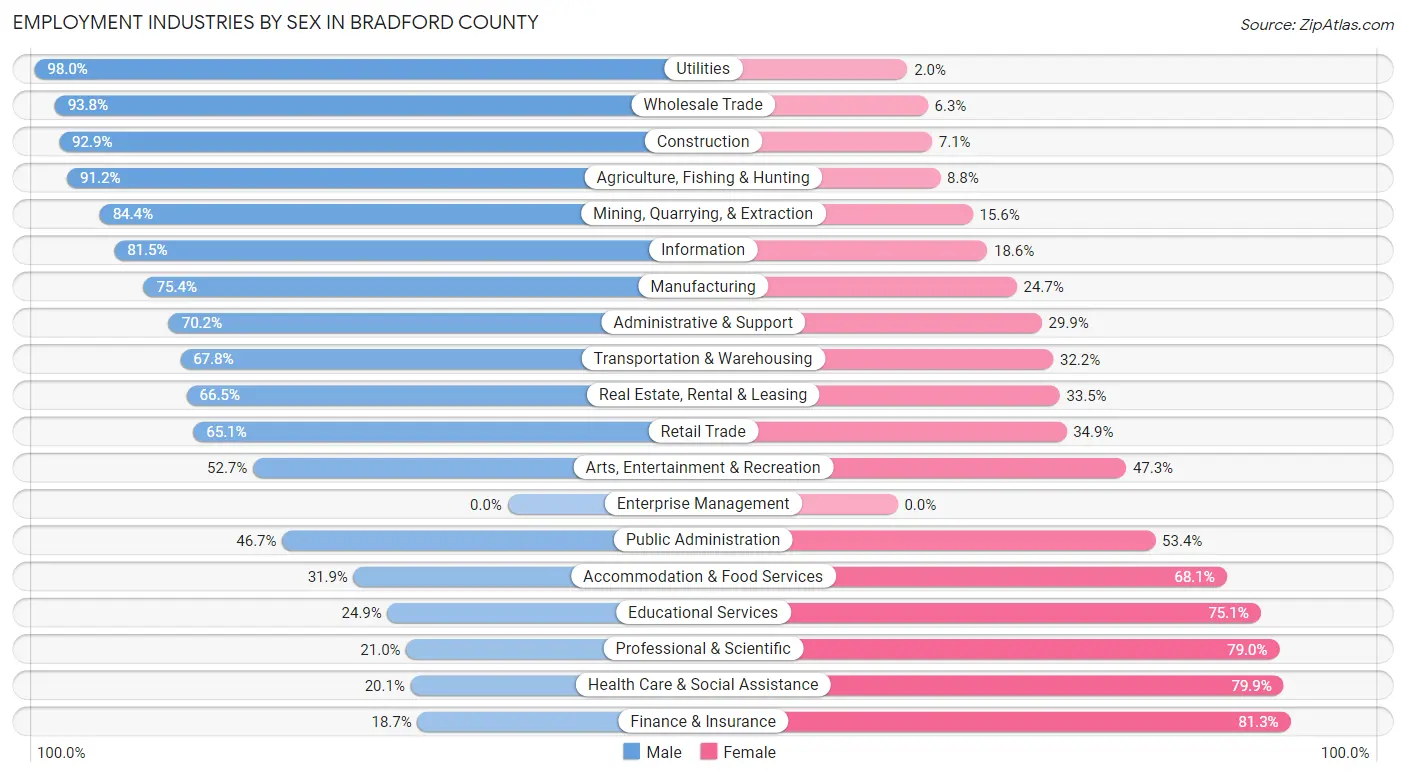
| Industry | Male | Female |
| Agriculture, Fishing & Hunting | 62 (91.2%) | 6 (8.8%) |
| Mining, Quarrying, & Extraction | 76 (84.4%) | 14 (15.6%) |
| Construction | 730 (92.9%) | 56 (7.1%) |
| Manufacturing | 486 (75.3%) | 159 (24.6%) |
| Wholesale Trade | 300 (93.8%) | 20 (6.2%) |
| Retail Trade | 782 (65.1%) | 420 (34.9%) |
| Transportation & Warehousing | 427 (67.8%) | 203 (32.2%) |
| Utilities | 192 (98.0%) | 4 (2.0%) |
| Information | 101 (81.5%) | 23 (18.5%) |
| Finance & Insurance | 50 (18.7%) | 218 (81.3%) |
| Real Estate, Rental & Leasing | 109 (66.5%) | 55 (33.5%) |
| Professional & Scientific | 152 (21.0%) | 573 (79.0%) |
| Enterprise Management | 0 (0.0%) | 0 (0.0%) |
| Administrative & Support | 409 (70.2%) | 174 (29.8%) |
| Educational Services | 228 (24.9%) | 689 (75.1%) |
| Health Care & Social Assistance | 369 (20.1%) | 1,469 (79.9%) |
| Arts, Entertainment & Recreation | 39 (52.7%) | 35 (47.3%) |
| Accommodation & Food Services | 197 (31.9%) | 421 (68.1%) |
| Public Administration | 418 (46.7%) | 478 (53.3%) |
| Total | 5,449 (51.2%) | 5,196 (48.8%) |
Education in Bradford County
School Enrollment in Bradford County
The most common levels of schooling among the 5,869 students in Bradford County are middle school (1,552 | 26.4%), high school (1,278 | 21.8%), and college / undergraduate (1,163 | 19.8%).
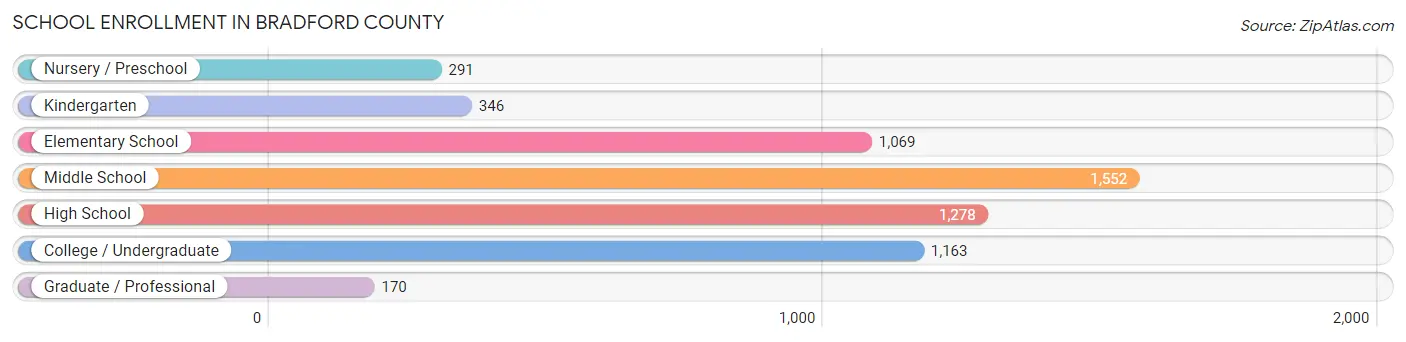
| School Level | # Students | % Students |
| Nursery / Preschool | 291 | 5.0% |
| Kindergarten | 346 | 5.9% |
| Elementary School | 1,069 | 18.2% |
| Middle School | 1,552 | 26.4% |
| High School | 1,278 | 21.8% |
| College / Undergraduate | 1,163 | 19.8% |
| Graduate / Professional | 170 | 2.9% |
| Total | 5,869 | 100.0% |
School Enrollment by Age by Funding Source in Bradford County
Out of a total of 5,869 students who are enrolled in schools in Bradford County, 1,279 (21.8%) attend a private institution, while the remaining 4,590 (78.2%) are enrolled in public schools. The age group of 3 to 4 year olds has the highest likelihood of being enrolled in private schools, with 163 (57.6% in the age bracket) enrolled. Conversely, the age group of 35 years and over has the lowest likelihood of being enrolled in a private school, with 552 (90.8% in the age bracket) attending a public institution.
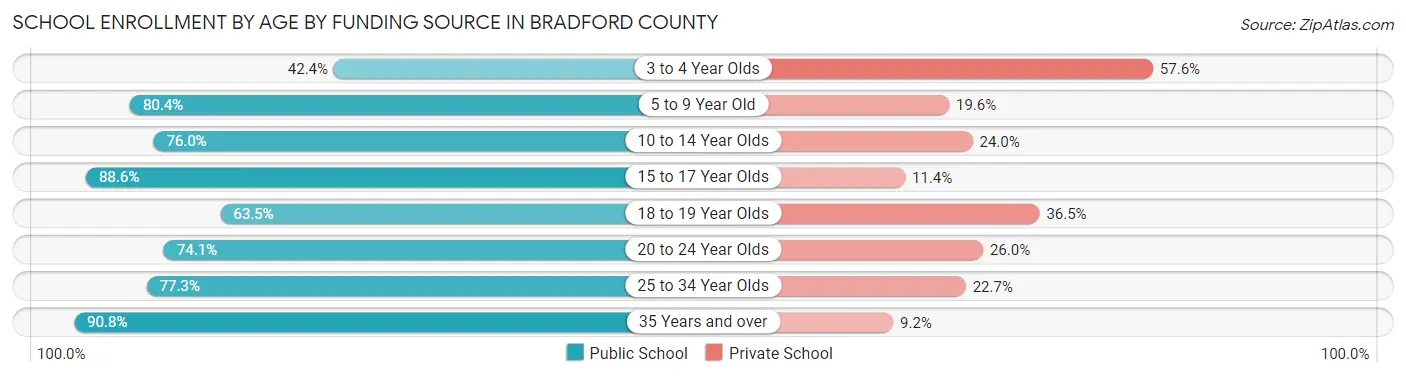
| Age Bracket | Public School | Private School |
| 3 to 4 Year Olds | 120 (42.4%) | 163 (57.6%) |
| 5 to 9 Year Old | 995 (80.4%) | 243 (19.6%) |
| 10 to 14 Year Olds | 1,304 (76.0%) | 412 (24.0%) |
| 15 to 17 Year Olds | 805 (88.6%) | 104 (11.4%) |
| 18 to 19 Year Olds | 169 (63.5%) | 97 (36.5%) |
| 20 to 24 Year Olds | 254 (74.1%) | 89 (26.0%) |
| 25 to 34 Year Olds | 391 (77.3%) | 115 (22.7%) |
| 35 Years and over | 552 (90.8%) | 56 (9.2%) |
| Total | 4,590 (78.2%) | 1,279 (21.8%) |
Educational Attainment by Field of Study in Bradford County
Education (528 | 19.2%), business (482 | 17.5%), science & technology (321 | 11.7%), liberal arts & history (289 | 10.5%), and psychology (241 | 8.8%) are the most common fields of study among 2,749 individuals in Bradford County who have obtained a bachelor's degree or higher.
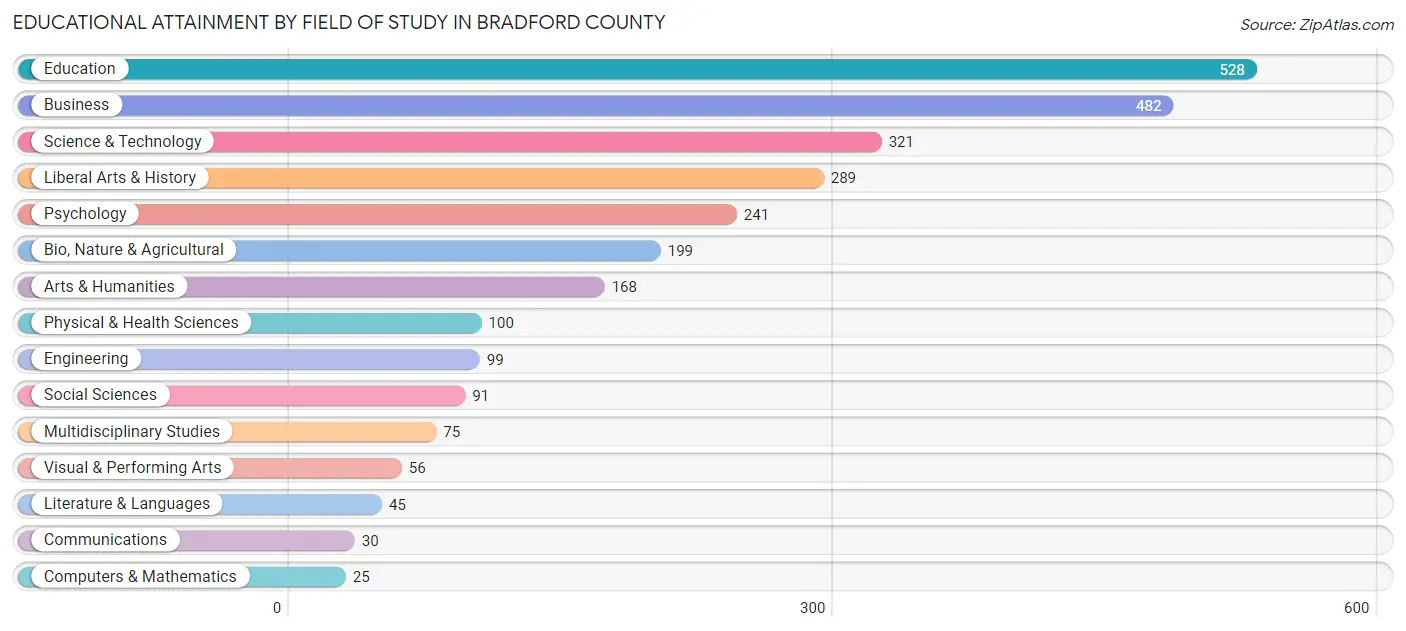
| Field of Study | # Graduates | % Graduates |
| Computers & Mathematics | 25 | 0.9% |
| Bio, Nature & Agricultural | 199 | 7.2% |
| Physical & Health Sciences | 100 | 3.6% |
| Psychology | 241 | 8.8% |
| Social Sciences | 91 | 3.3% |
| Engineering | 99 | 3.6% |
| Multidisciplinary Studies | 75 | 2.7% |
| Science & Technology | 321 | 11.7% |
| Business | 482 | 17.5% |
| Education | 528 | 19.2% |
| Literature & Languages | 45 | 1.6% |
| Liberal Arts & History | 289 | 10.5% |
| Visual & Performing Arts | 56 | 2.0% |
| Communications | 30 | 1.1% |
| Arts & Humanities | 168 | 6.1% |
| Total | 2,749 | 100.0% |
Transportation & Commute in Bradford County
Vehicle Availability by Sex in Bradford County
The most prevalent vehicle ownership categories in Bradford County are males with 2 vehicles (2,069, accounting for 37.8%) and females with 2 vehicles (2,236, making up 40.2%).
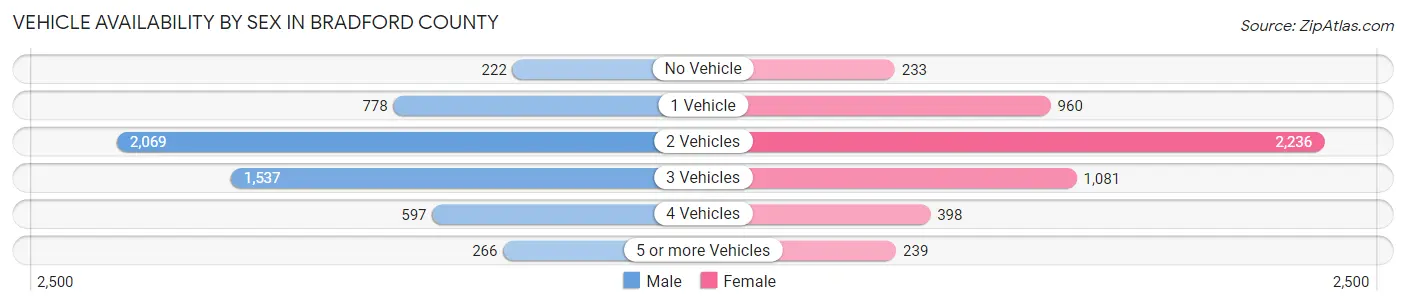
| Vehicles Available | Male | Female |
| No Vehicle | 222 (4.1%) | 233 (4.5%) |
| 1 Vehicle | 778 (14.2%) | 960 (18.6%) |
| 2 Vehicles | 2,069 (37.8%) | 2,236 (43.4%) |
| 3 Vehicles | 1,537 (28.1%) | 1,081 (21.0%) |
| 4 Vehicles | 597 (10.9%) | 398 (7.7%) |
| 5 or more Vehicles | 266 (4.9%) | 239 (4.6%) |
| Total | 5,469 (100.0%) | 5,147 (100.0%) |
Commute Time in Bradford County
The most frequently occuring commute durations in Bradford County are 5 to 9 minutes (1,787 commuters, 18.5%), 45 to 59 minutes (1,739 commuters, 18.0%), and 60 to 89 minutes (1,206 commuters, 12.5%).
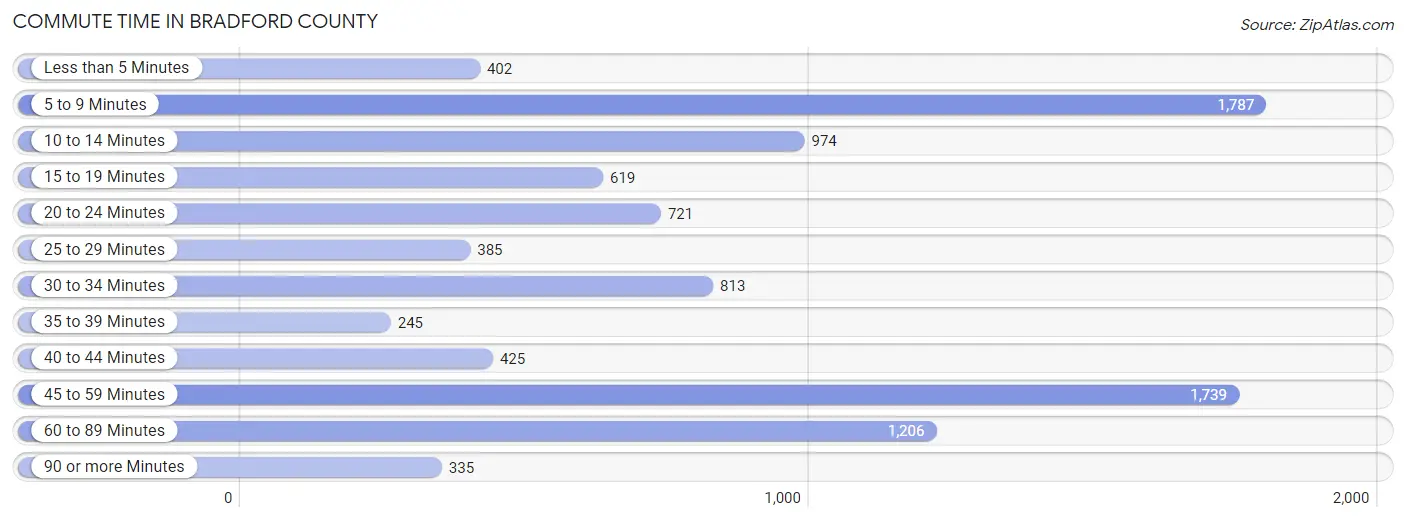
| Commute Time | # Commuters | % Commuters |
| Less than 5 Minutes | 402 | 4.2% |
| 5 to 9 Minutes | 1,787 | 18.5% |
| 10 to 14 Minutes | 974 | 10.1% |
| 15 to 19 Minutes | 619 | 6.4% |
| 20 to 24 Minutes | 721 | 7.5% |
| 25 to 29 Minutes | 385 | 4.0% |
| 30 to 34 Minutes | 813 | 8.4% |
| 35 to 39 Minutes | 245 | 2.5% |
| 40 to 44 Minutes | 425 | 4.4% |
| 45 to 59 Minutes | 1,739 | 18.0% |
| 60 to 89 Minutes | 1,206 | 12.5% |
| 90 or more Minutes | 335 | 3.5% |
Commute Time by Sex in Bradford County
The most common commute times in Bradford County are 45 to 59 minutes (926 commuters, 18.3%) for males and 5 to 9 minutes (1,058 commuters, 23.1%) for females.
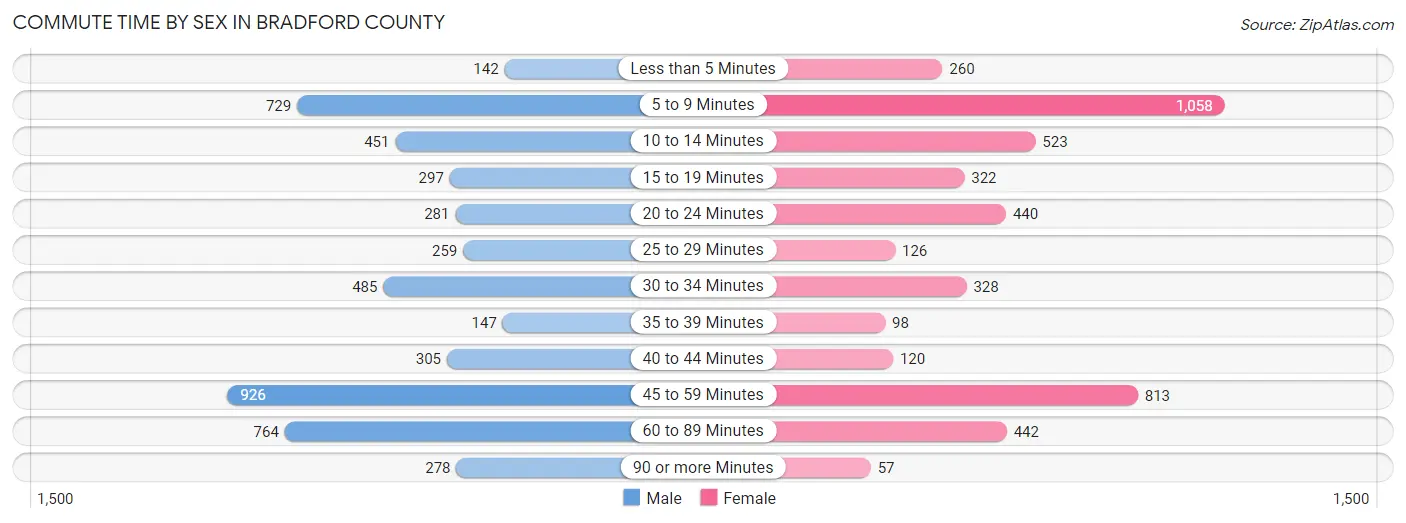
| Commute Time | Male | Female |
| Less than 5 Minutes | 142 (2.8%) | 260 (5.7%) |
| 5 to 9 Minutes | 729 (14.4%) | 1,058 (23.1%) |
| 10 to 14 Minutes | 451 (8.9%) | 523 (11.4%) |
| 15 to 19 Minutes | 297 (5.9%) | 322 (7.0%) |
| 20 to 24 Minutes | 281 (5.6%) | 440 (9.6%) |
| 25 to 29 Minutes | 259 (5.1%) | 126 (2.8%) |
| 30 to 34 Minutes | 485 (9.6%) | 328 (7.1%) |
| 35 to 39 Minutes | 147 (2.9%) | 98 (2.1%) |
| 40 to 44 Minutes | 305 (6.0%) | 120 (2.6%) |
| 45 to 59 Minutes | 926 (18.3%) | 813 (17.7%) |
| 60 to 89 Minutes | 764 (15.1%) | 442 (9.6%) |
| 90 or more Minutes | 278 (5.5%) | 57 (1.2%) |
Time of Departure to Work by Sex in Bradford County
The most frequent times of departure to work in Bradford County are 7:00 AM to 7:29 AM (716, 14.1%) for males and 7:00 AM to 7:29 AM (939, 20.5%) for females.
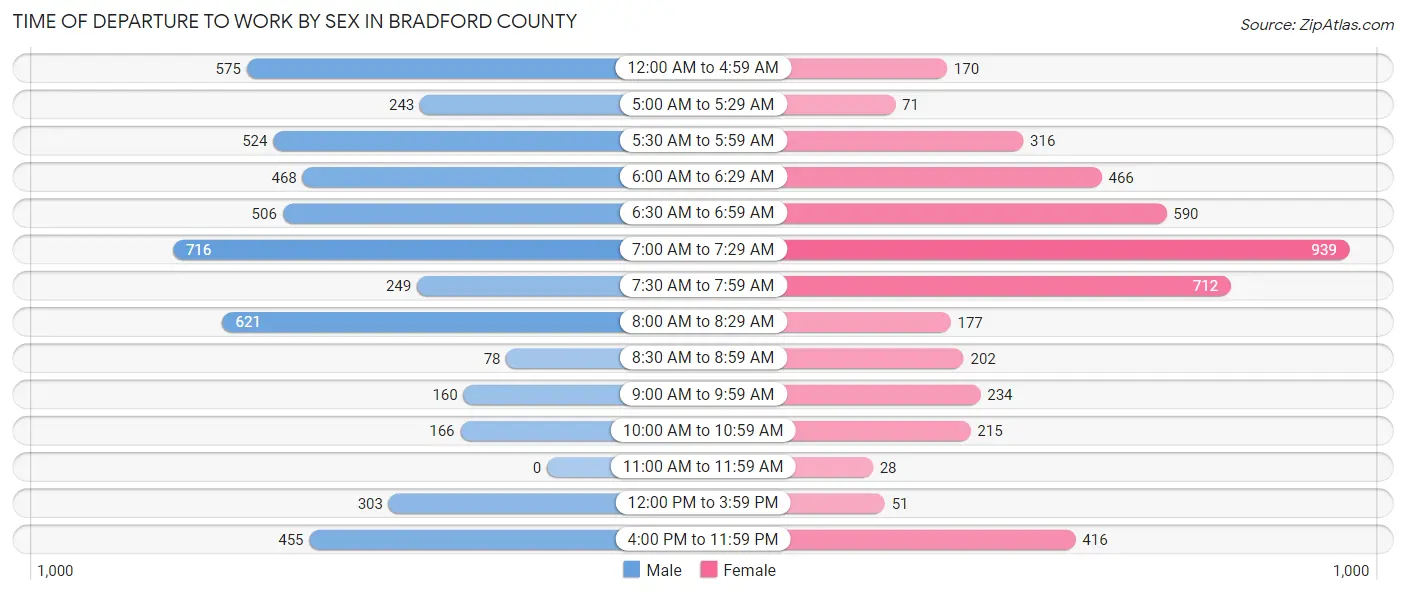
| Time of Departure | Male | Female |
| 12:00 AM to 4:59 AM | 575 (11.4%) | 170 (3.7%) |
| 5:00 AM to 5:29 AM | 243 (4.8%) | 71 (1.5%) |
| 5:30 AM to 5:59 AM | 524 (10.3%) | 316 (6.9%) |
| 6:00 AM to 6:29 AM | 468 (9.2%) | 466 (10.2%) |
| 6:30 AM to 6:59 AM | 506 (10.0%) | 590 (12.9%) |
| 7:00 AM to 7:29 AM | 716 (14.1%) | 939 (20.5%) |
| 7:30 AM to 7:59 AM | 249 (4.9%) | 712 (15.5%) |
| 8:00 AM to 8:29 AM | 621 (12.3%) | 177 (3.9%) |
| 8:30 AM to 8:59 AM | 78 (1.5%) | 202 (4.4%) |
| 9:00 AM to 9:59 AM | 160 (3.2%) | 234 (5.1%) |
| 10:00 AM to 10:59 AM | 166 (3.3%) | 215 (4.7%) |
| 11:00 AM to 11:59 AM | 0 (0.0%) | 28 (0.6%) |
| 12:00 PM to 3:59 PM | 303 (6.0%) | 51 (1.1%) |
| 4:00 PM to 11:59 PM | 455 (9.0%) | 416 (9.1%) |
| Total | 5,064 (100.0%) | 4,587 (100.0%) |
Housing Occupancy in Bradford County
Occupancy by Ownership in Bradford County
Of the total 9,067 dwellings in Bradford County, owner-occupied units account for 6,168 (68.0%), while renter-occupied units make up 2,899 (32.0%).
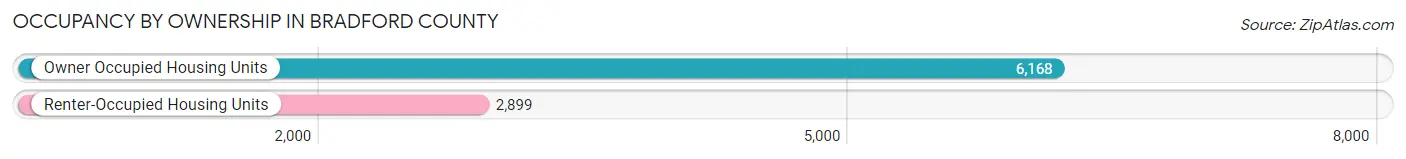
| Occupancy | # Housing Units | % Housing Units |
| Owner Occupied Housing Units | 6,168 | 68.0% |
| Renter-Occupied Housing Units | 2,899 | 32.0% |
| Total Occupied Housing Units | 9,067 | 100.0% |
Occupancy by Household Size in Bradford County
| Household Size | # Housing Units | % Housing Units |
| 1-Person Household | 2,659 | 29.3% |
| 2-Person Household | 3,063 | 33.8% |
| 3-Person Household | 1,455 | 16.1% |
| 4+ Person Household | 1,890 | 20.8% |
| Total Housing Units | 9,067 | 100.0% |
Occupancy by Ownership by Household Size in Bradford County
| Household Size | Owner-occupied | Renter-occupied |
| 1-Person Household | 1,662 (62.5%) | 997 (37.5%) |
| 2-Person Household | 2,181 (71.2%) | 882 (28.8%) |
| 3-Person Household | 1,103 (75.8%) | 352 (24.2%) |
| 4+ Person Household | 1,222 (64.7%) | 668 (35.3%) |
| Total Housing Units | 6,168 (68.0%) | 2,899 (32.0%) |
Occupancy by Educational Attainment in Bradford County
| Household Size | Owner-occupied | Renter-occupied |
| Less than High School | 634 (50.4%) | 625 (49.6%) |
| High School Diploma | 2,263 (71.4%) | 905 (28.6%) |
| College/Associate Degree | 2,265 (72.6%) | 857 (27.5%) |
| Bachelor's Degree or higher | 1,006 (66.3%) | 512 (33.7%) |
Occupancy by Age of Householder in Bradford County
| Age Bracket | # Households | % Households |
| Under 35 Years | 1,401 | 15.4% |
| 35 to 44 Years | 1,304 | 14.4% |
| 45 to 54 Years | 1,524 | 16.8% |
| 55 to 64 Years | 1,835 | 20.2% |
| 65 to 74 Years | 1,756 | 19.4% |
| 75 to 84 Years | 1,009 | 11.1% |
| 85 Years and Over | 238 | 2.6% |
| Total | 9,067 | 100.0% |
Housing Finances in Bradford County
Median Income by Occupancy in Bradford County
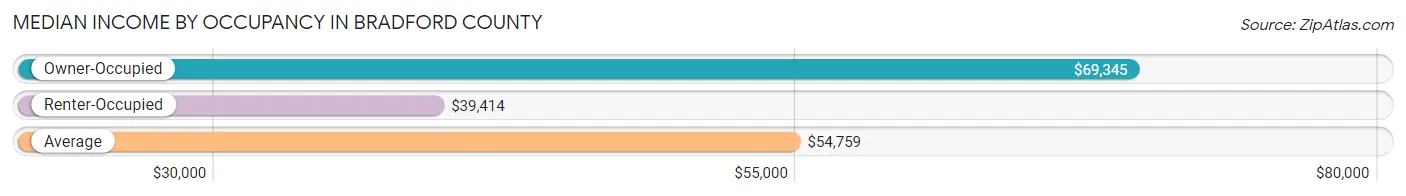
| Occupancy Type | # Households | Median Income |
| Owner-Occupied | 6,168 (68.0%) | $69,345 |
| Renter-Occupied | 2,899 (32.0%) | $39,414 |
| Average | 9,067 (100.0%) | $54,759 |
Occupancy by Householder Income Bracket in Bradford County
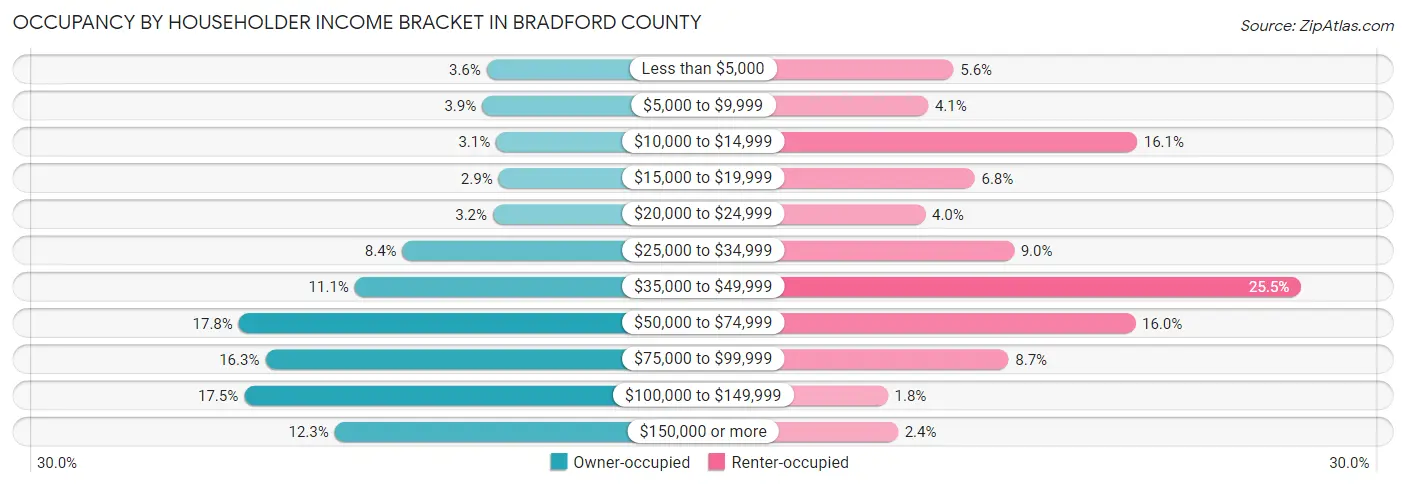
| Income Bracket | Owner-occupied | Renter-occupied |
| Less than $5,000 | 222 (3.6%) | 162 (5.6%) |
| $5,000 to $9,999 | 238 (3.9%) | 120 (4.1%) |
| $10,000 to $14,999 | 189 (3.1%) | 466 (16.1%) |
| $15,000 to $19,999 | 180 (2.9%) | 197 (6.8%) |
| $20,000 to $24,999 | 200 (3.2%) | 115 (4.0%) |
| $25,000 to $34,999 | 519 (8.4%) | 262 (9.0%) |
| $35,000 to $49,999 | 687 (11.1%) | 738 (25.5%) |
| $50,000 to $74,999 | 1,096 (17.8%) | 463 (16.0%) |
| $75,000 to $99,999 | 1,002 (16.3%) | 253 (8.7%) |
| $100,000 to $149,999 | 1,077 (17.5%) | 53 (1.8%) |
| $150,000 or more | 758 (12.3%) | 70 (2.4%) |
| Total | 6,168 (100.0%) | 2,899 (100.0%) |
Monthly Housing Cost Tiers in Bradford County
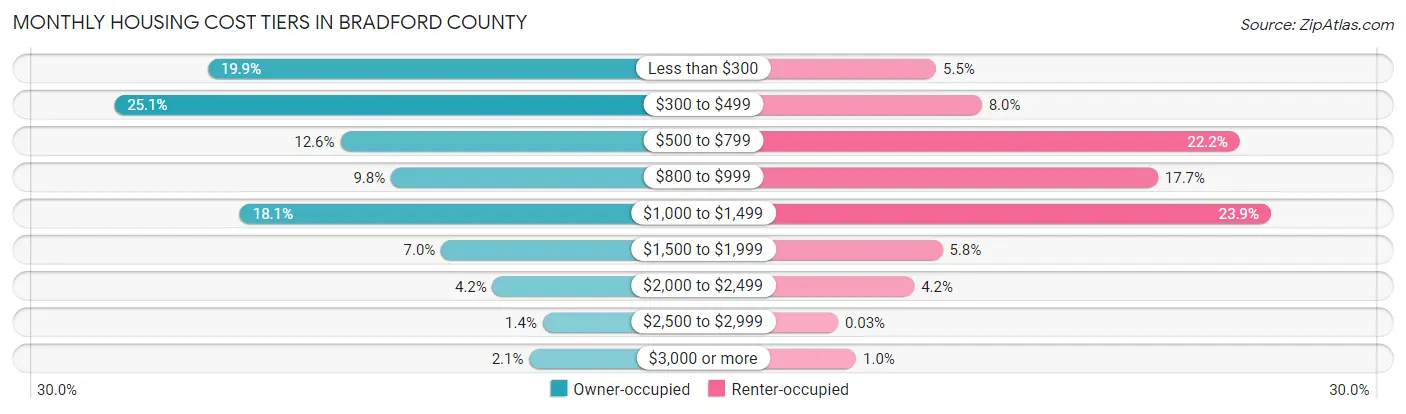
| Monthly Cost | Owner-occupied | Renter-occupied |
| Less than $300 | 1,226 (19.9%) | 158 (5.4%) |
| $300 to $499 | 1,545 (25.1%) | 231 (8.0%) |
| $500 to $799 | 775 (12.6%) | 644 (22.2%) |
| $800 to $999 | 602 (9.8%) | 513 (17.7%) |
| $1,000 to $1,499 | 1,117 (18.1%) | 694 (23.9%) |
| $1,500 to $1,999 | 431 (7.0%) | 168 (5.8%) |
| $2,000 to $2,499 | 256 (4.2%) | 123 (4.2%) |
| $2,500 to $2,999 | 85 (1.4%) | 1 (0.0%) |
| $3,000 or more | 131 (2.1%) | 30 (1.0%) |
| Total | 6,168 (100.0%) | 2,899 (100.0%) |
Physical Housing Characteristics in Bradford County
Housing Structures in Bradford County
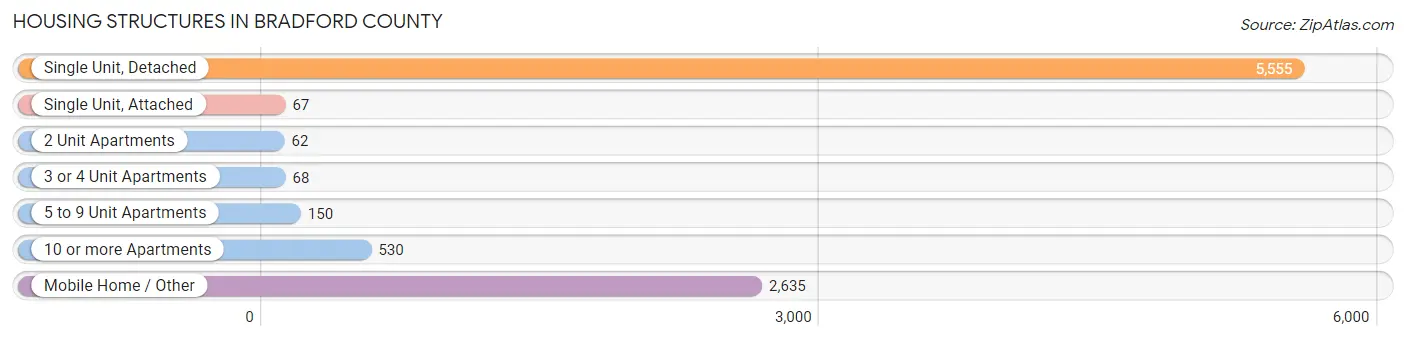
| Structure Type | # Housing Units | % Housing Units |
| Single Unit, Detached | 5,555 | 61.3% |
| Single Unit, Attached | 67 | 0.7% |
| 2 Unit Apartments | 62 | 0.7% |
| 3 or 4 Unit Apartments | 68 | 0.7% |
| 5 to 9 Unit Apartments | 150 | 1.7% |
| 10 or more Apartments | 530 | 5.9% |
| Mobile Home / Other | 2,635 | 29.1% |
| Total | 9,067 | 100.0% |
Housing Structures by Occupancy in Bradford County
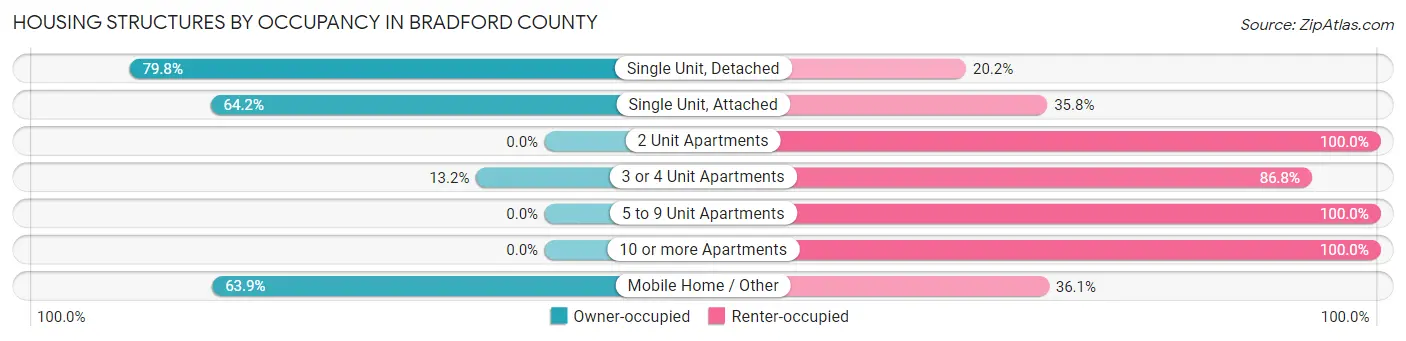
| Structure Type | Owner-occupied | Renter-occupied |
| Single Unit, Detached | 4,433 (79.8%) | 1,122 (20.2%) |
| Single Unit, Attached | 43 (64.2%) | 24 (35.8%) |
| 2 Unit Apartments | 0 (0.0%) | 62 (100.0%) |
| 3 or 4 Unit Apartments | 9 (13.2%) | 59 (86.8%) |
| 5 to 9 Unit Apartments | 0 (0.0%) | 150 (100.0%) |
| 10 or more Apartments | 0 (0.0%) | 530 (100.0%) |
| Mobile Home / Other | 1,683 (63.9%) | 952 (36.1%) |
| Total | 6,168 (68.0%) | 2,899 (32.0%) |
Housing Structures by Number of Rooms in Bradford County
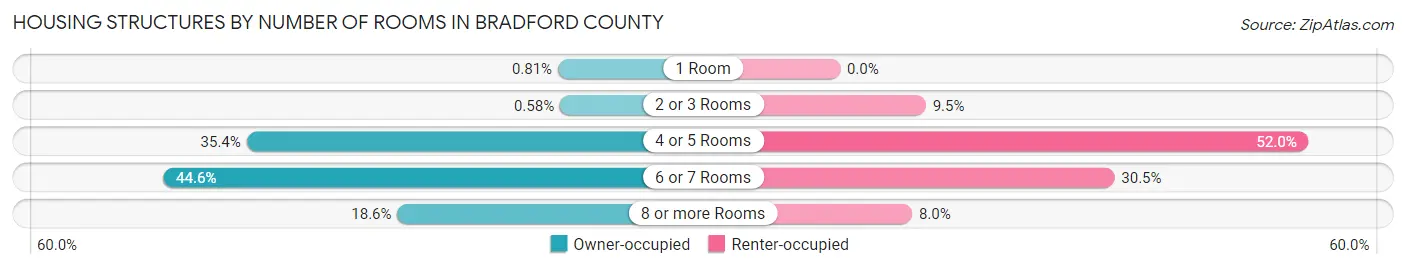
| Number of Rooms | Owner-occupied | Renter-occupied |
| 1 Room | 50 (0.8%) | 0 (0.0%) |
| 2 or 3 Rooms | 36 (0.6%) | 276 (9.5%) |
| 4 or 5 Rooms | 2,181 (35.4%) | 1,508 (52.0%) |
| 6 or 7 Rooms | 2,752 (44.6%) | 883 (30.5%) |
| 8 or more Rooms | 1,149 (18.6%) | 232 (8.0%) |
| Total | 6,168 (100.0%) | 2,899 (100.0%) |
Housing Structure by Heating Type in Bradford County
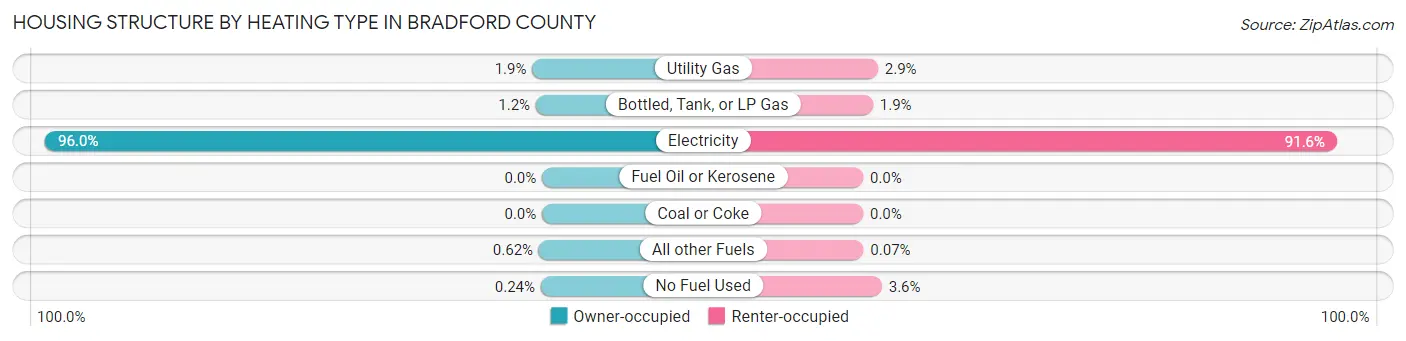
| Heating Type | Owner-occupied | Renter-occupied |
| Utility Gas | 117 (1.9%) | 83 (2.9%) |
| Bottled, Tank, or LP Gas | 74 (1.2%) | 55 (1.9%) |
| Electricity | 5,924 (96.0%) | 2,654 (91.5%) |
| Fuel Oil or Kerosene | 0 (0.0%) | 0 (0.0%) |
| Coal or Coke | 0 (0.0%) | 0 (0.0%) |
| All other Fuels | 38 (0.6%) | 2 (0.1%) |
| No Fuel Used | 15 (0.2%) | 105 (3.6%) |
| Total | 6,168 (100.0%) | 2,899 (100.0%) |
Household Vehicle Usage in Bradford County
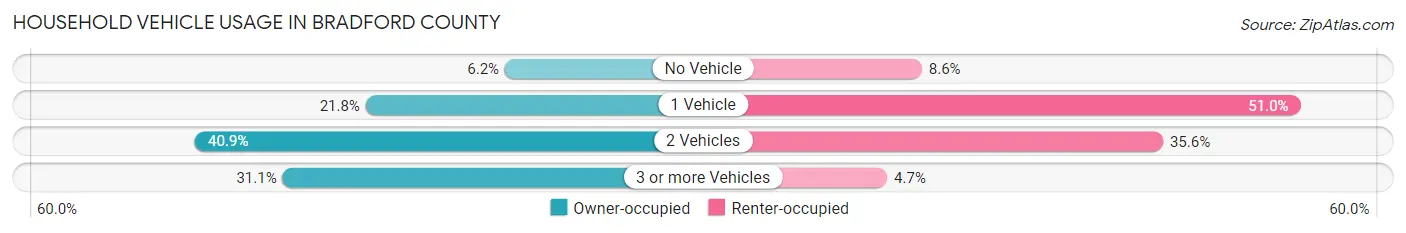
| Vehicles per Household | Owner-occupied | Renter-occupied |
| No Vehicle | 382 (6.2%) | 250 (8.6%) |
| 1 Vehicle | 1,344 (21.8%) | 1,479 (51.0%) |
| 2 Vehicles | 2,523 (40.9%) | 1,033 (35.6%) |
| 3 or more Vehicles | 1,919 (31.1%) | 137 (4.7%) |
| Total | 6,168 (100.0%) | 2,899 (100.0%) |
Real Estate & Mortgages in Bradford County
Real Estate and Mortgage Overview in Bradford County
| Characteristic | Without Mortgage | With Mortgage |
| Housing Units | 3,336 | 2,832 |
| Median Property Value | $98,500 | $192,000 |
| Median Household Income | $58,490 | $432 |
| Monthly Housing Costs | $345 | $122 |
| Real Estate Taxes | $684 | $35 |
Property Value by Mortgage Status in Bradford County
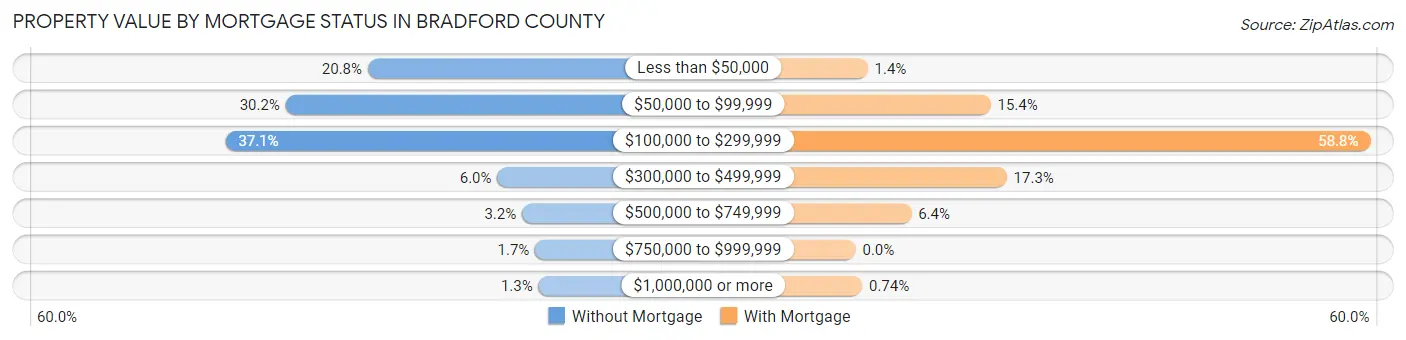
| Property Value | Without Mortgage | With Mortgage |
| Less than $50,000 | 693 (20.8%) | 39 (1.4%) |
| $50,000 to $99,999 | 1,006 (30.2%) | 437 (15.4%) |
| $100,000 to $299,999 | 1,236 (37.0%) | 1,666 (58.8%) |
| $300,000 to $499,999 | 199 (6.0%) | 489 (17.3%) |
| $500,000 to $749,999 | 105 (3.2%) | 180 (6.4%) |
| $750,000 to $999,999 | 55 (1.7%) | 0 (0.0%) |
| $1,000,000 or more | 42 (1.3%) | 21 (0.7%) |
| Total | 3,336 (100.0%) | 2,832 (100.0%) |
Household Income by Mortgage Status in Bradford County
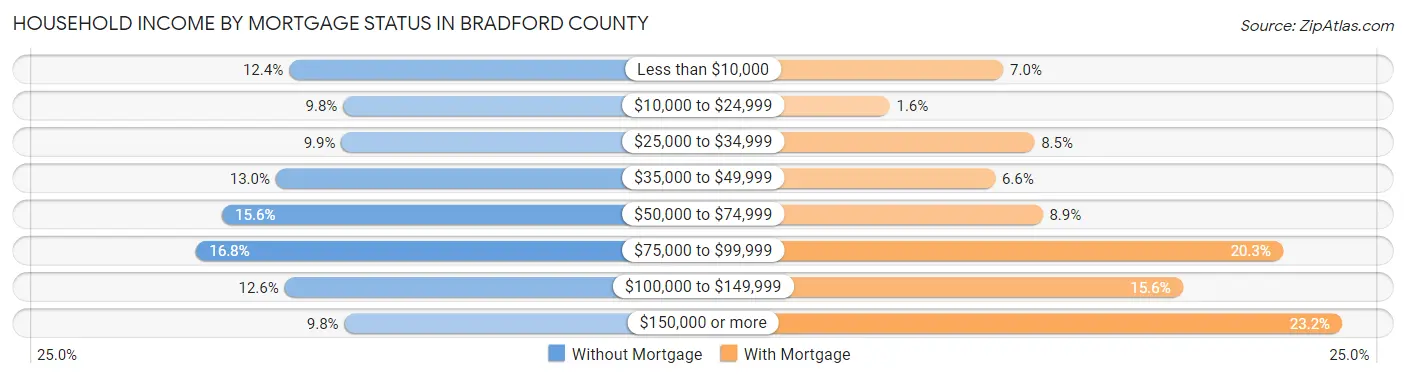
| Household Income | Without Mortgage | With Mortgage |
| Less than $10,000 | 414 (12.4%) | 199 (7.0%) |
| $10,000 to $24,999 | 328 (9.8%) | 46 (1.6%) |
| $25,000 to $34,999 | 331 (9.9%) | 241 (8.5%) |
| $35,000 to $49,999 | 435 (13.0%) | 188 (6.6%) |
| $50,000 to $74,999 | 520 (15.6%) | 252 (8.9%) |
| $75,000 to $99,999 | 561 (16.8%) | 576 (20.3%) |
| $100,000 to $149,999 | 421 (12.6%) | 441 (15.6%) |
| $150,000 or more | 326 (9.8%) | 656 (23.2%) |
| Total | 3,336 (100.0%) | 2,832 (100.0%) |
Property Value to Household Income Ratio in Bradford County
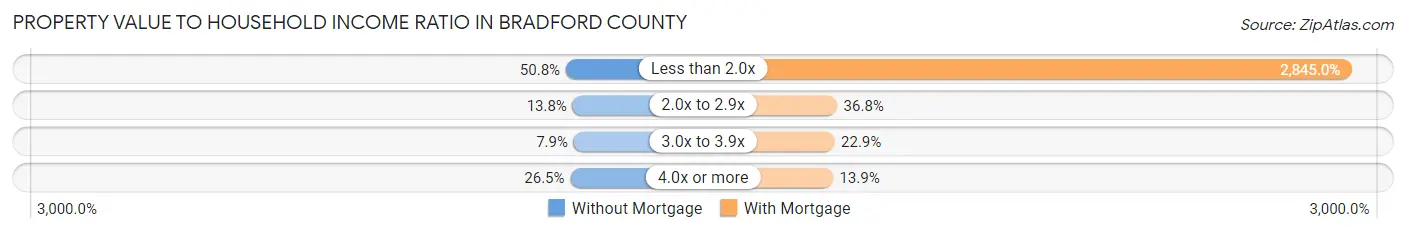
| Value-to-Income Ratio | Without Mortgage | With Mortgage |
| Less than 2.0x | 1,696 (50.8%) | 80,571 (2,845.0%) |
| 2.0x to 2.9x | 461 (13.8%) | 1,042 (36.8%) |
| 3.0x to 3.9x | 265 (7.9%) | 647 (22.9%) |
| 4.0x or more | 883 (26.5%) | 394 (13.9%) |
| Total | 3,336 (100.0%) | 2,832 (100.0%) |
Real Estate Taxes by Mortgage Status in Bradford County
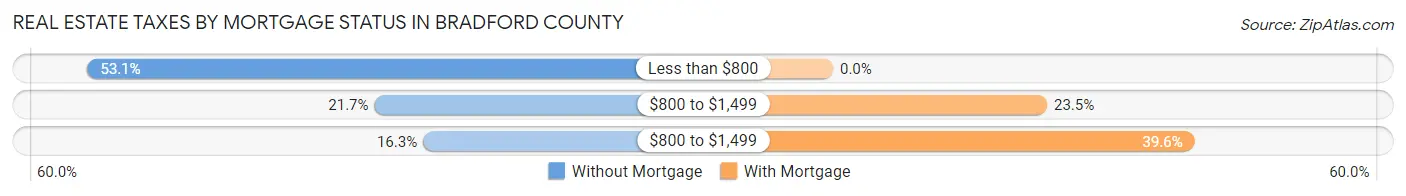
| Property Taxes | Without Mortgage | With Mortgage |
| Less than $800 | 1,772 (53.1%) | 0 (0.0%) |
| $800 to $1,499 | 723 (21.7%) | 664 (23.4%) |
| $800 to $1,499 | 545 (16.3%) | 1,122 (39.6%) |
| Total | 3,336 (100.0%) | 2,832 (100.0%) |
Health & Disability in Bradford County
Health Insurance Coverage by Age in Bradford County
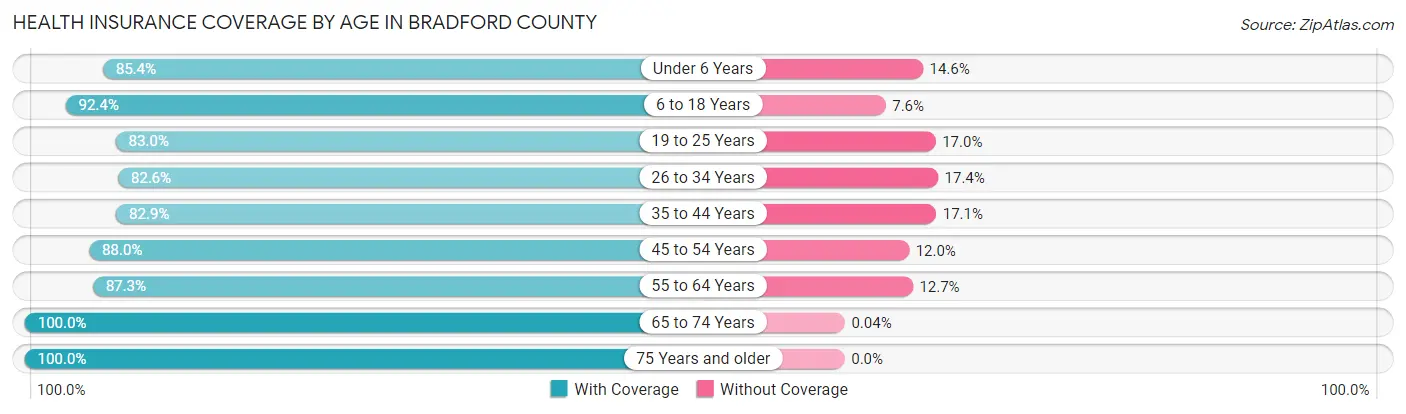
| Age Bracket | With Coverage | Without Coverage |
| Under 6 Years | 1,358 (85.4%) | 232 (14.6%) |
| 6 to 18 Years | 3,845 (92.4%) | 318 (7.6%) |
| 19 to 25 Years | 1,728 (83.0%) | 353 (17.0%) |
| 26 to 34 Years | 2,406 (82.6%) | 507 (17.4%) |
| 35 to 44 Years | 2,164 (82.9%) | 445 (17.1%) |
| 45 to 54 Years | 2,587 (88.0%) | 353 (12.0%) |
| 55 to 64 Years | 2,789 (87.3%) | 406 (12.7%) |
| 65 to 74 Years | 2,630 (100.0%) | 1 (0.0%) |
| 75 Years and older | 1,924 (100.0%) | 0 (0.0%) |
| Total | 21,431 (89.1%) | 2,615 (10.9%) |
Health Insurance Coverage by Citizenship Status in Bradford County
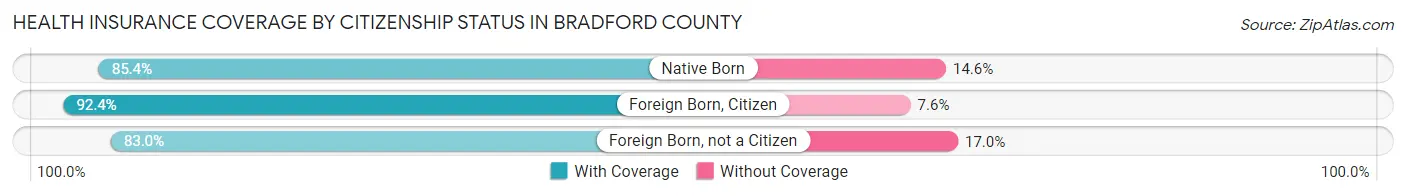
| Citizenship Status | With Coverage | Without Coverage |
| Native Born | 1,358 (85.4%) | 232 (14.6%) |
| Foreign Born, Citizen | 3,845 (92.4%) | 318 (7.6%) |
| Foreign Born, not a Citizen | 1,728 (83.0%) | 353 (17.0%) |
Health Insurance Coverage by Household Income in Bradford County
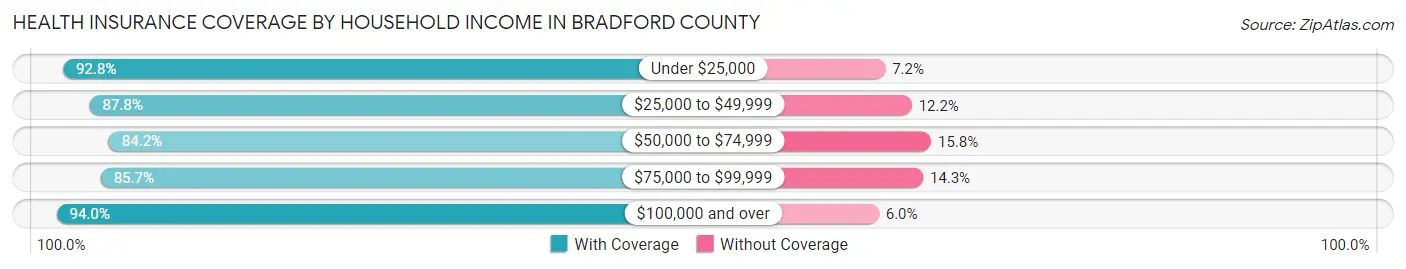
| Household Income | With Coverage | Without Coverage |
| Under $25,000 | 3,044 (92.8%) | 236 (7.2%) |
| $25,000 to $49,999 | 4,673 (87.8%) | 647 (12.2%) |
| $50,000 to $74,999 | 3,309 (84.2%) | 621 (15.8%) |
| $75,000 to $99,999 | 4,348 (85.7%) | 724 (14.3%) |
| $100,000 and over | 5,990 (94.0%) | 382 (6.0%) |
Public vs Private Health Insurance Coverage by Age in Bradford County
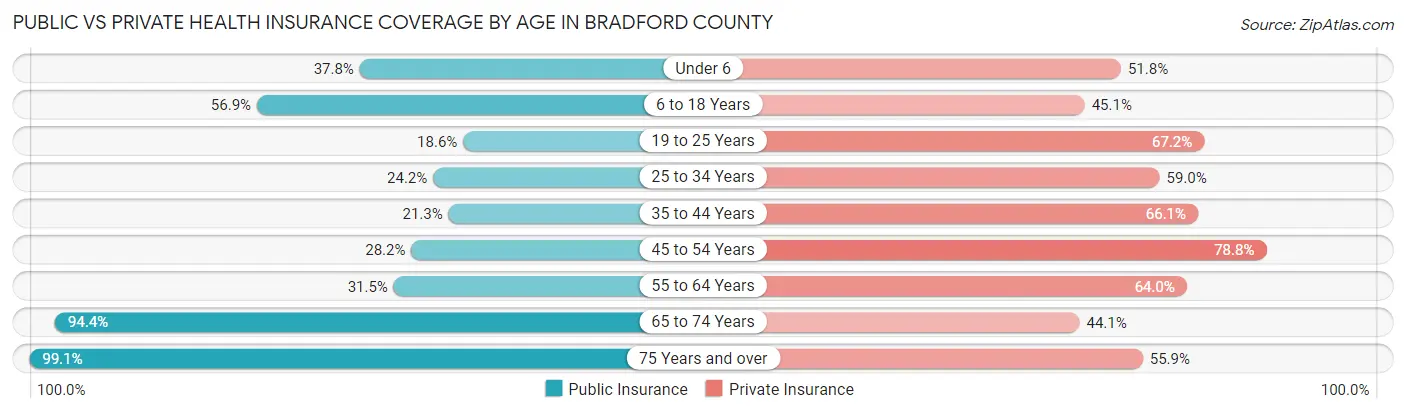
| Age Bracket | Public Insurance | Private Insurance |
| Under 6 | 601 (37.8%) | 824 (51.8%) |
| 6 to 18 Years | 2,368 (56.9%) | 1,877 (45.1%) |
| 19 to 25 Years | 387 (18.6%) | 1,399 (67.2%) |
| 25 to 34 Years | 704 (24.2%) | 1,718 (59.0%) |
| 35 to 44 Years | 556 (21.3%) | 1,724 (66.1%) |
| 45 to 54 Years | 830 (28.2%) | 2,316 (78.8%) |
| 55 to 64 Years | 1,006 (31.5%) | 2,045 (64.0%) |
| 65 to 74 Years | 2,483 (94.4%) | 1,161 (44.1%) |
| 75 Years and over | 1,907 (99.1%) | 1,075 (55.9%) |
| Total | 10,842 (45.1%) | 14,139 (58.8%) |
Disability Status by Sex by Age in Bradford County
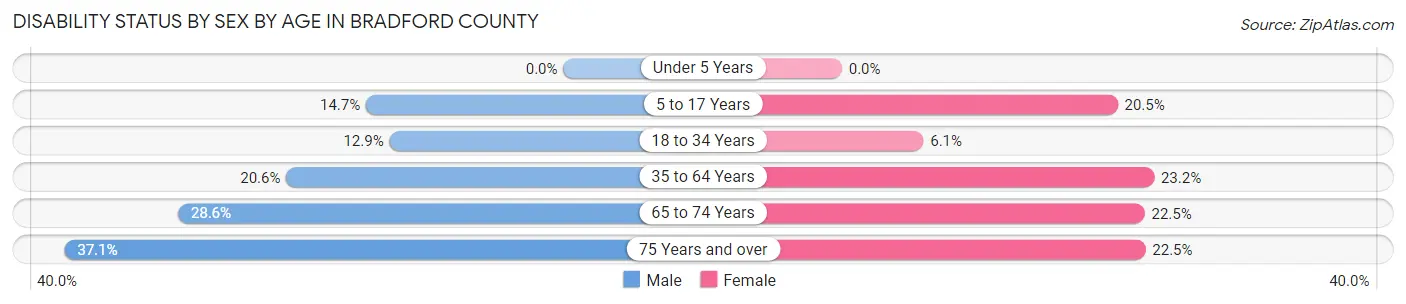
| Age Bracket | Male | Female |
| Under 5 Years | 0 (0.0%) | 0 (0.0%) |
| 5 to 17 Years | 314 (14.6%) | 395 (20.5%) |
| 18 to 34 Years | 378 (12.9%) | 142 (6.0%) |
| 35 to 64 Years | 864 (20.6%) | 1,053 (23.2%) |
| 65 to 74 Years | 324 (28.6%) | 337 (22.5%) |
| 75 Years and over | 269 (37.0%) | 270 (22.5%) |
Disability Class by Sex by Age in Bradford County
Disability Class: Hearing Difficulty
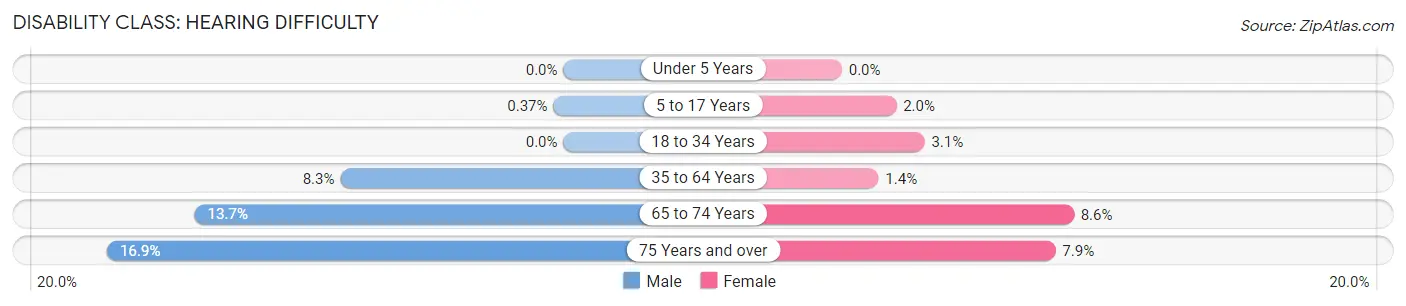
| Age Bracket | Male | Female |
| Under 5 Years | 0 (0.0%) | 0 (0.0%) |
| 5 to 17 Years | 8 (0.4%) | 39 (2.0%) |
| 18 to 34 Years | 0 (0.0%) | 72 (3.1%) |
| 35 to 64 Years | 348 (8.3%) | 62 (1.4%) |
| 65 to 74 Years | 155 (13.7%) | 129 (8.6%) |
| 75 Years and over | 123 (16.9%) | 95 (7.9%) |
Disability Class: Vision Difficulty
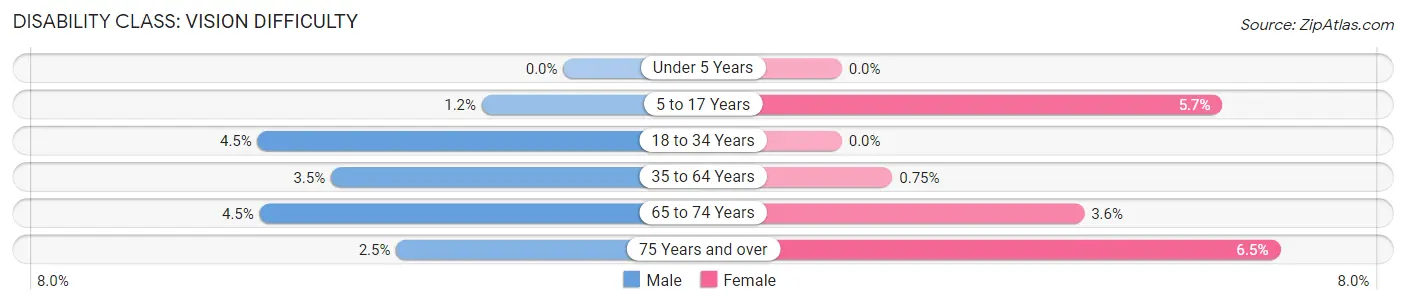
| Age Bracket | Male | Female |
| Under 5 Years | 0 (0.0%) | 0 (0.0%) |
| 5 to 17 Years | 26 (1.2%) | 109 (5.7%) |
| 18 to 34 Years | 133 (4.5%) | 0 (0.0%) |
| 35 to 64 Years | 145 (3.5%) | 34 (0.7%) |
| 65 to 74 Years | 51 (4.5%) | 54 (3.6%) |
| 75 Years and over | 18 (2.5%) | 78 (6.5%) |
Disability Class: Cognitive Difficulty
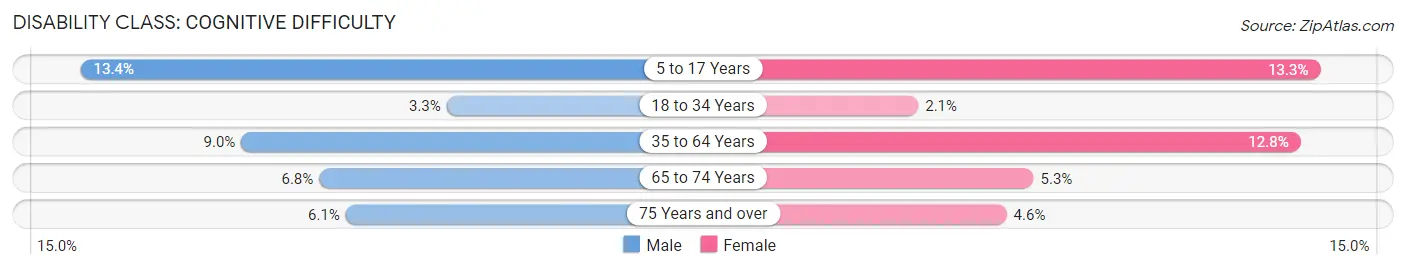
| Age Bracket | Male | Female |
| 5 to 17 Years | 288 (13.4%) | 257 (13.3%) |
| 18 to 34 Years | 95 (3.3%) | 50 (2.1%) |
| 35 to 64 Years | 377 (9.0%) | 580 (12.8%) |
| 65 to 74 Years | 77 (6.8%) | 80 (5.3%) |
| 75 Years and over | 44 (6.1%) | 55 (4.6%) |
Disability Class: Ambulatory Difficulty
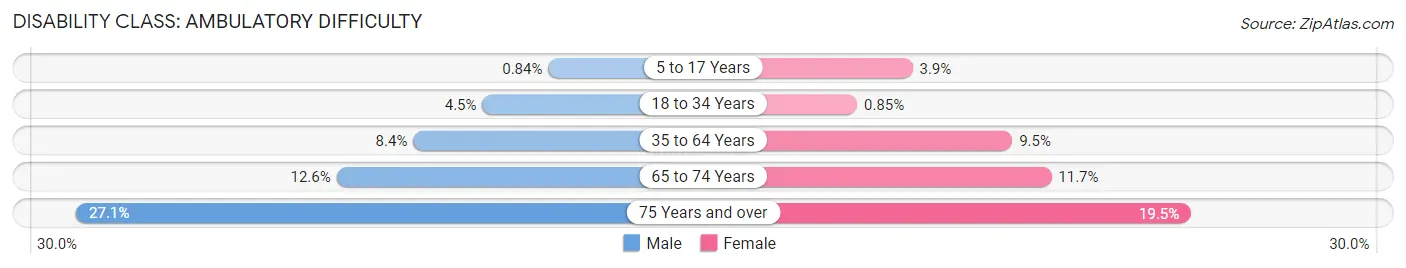
| Age Bracket | Male | Female |
| 5 to 17 Years | 18 (0.8%) | 76 (3.9%) |
| 18 to 34 Years | 132 (4.5%) | 20 (0.9%) |
| 35 to 64 Years | 351 (8.4%) | 431 (9.5%) |
| 65 to 74 Years | 143 (12.6%) | 175 (11.7%) |
| 75 Years and over | 197 (27.1%) | 233 (19.5%) |
Disability Class: Self-Care Difficulty
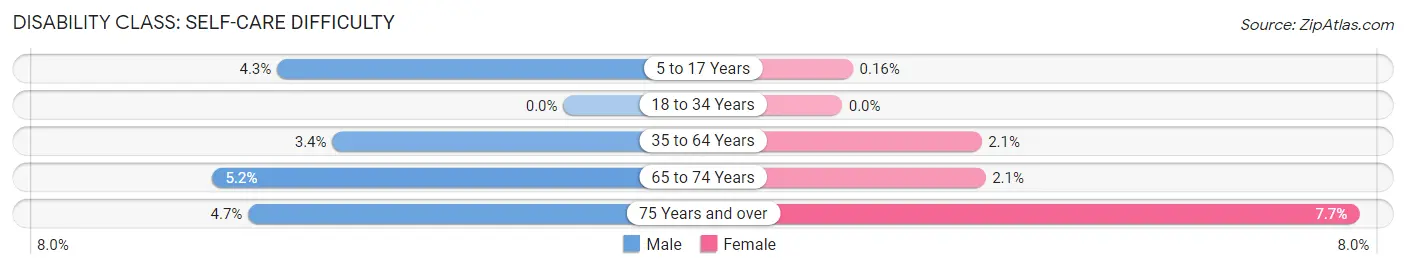
| Age Bracket | Male | Female |
| 5 to 17 Years | 91 (4.3%) | 3 (0.2%) |
| 18 to 34 Years | 0 (0.0%) | 0 (0.0%) |
| 35 to 64 Years | 144 (3.4%) | 94 (2.1%) |
| 65 to 74 Years | 59 (5.2%) | 32 (2.1%) |
| 75 Years and over | 34 (4.7%) | 92 (7.7%) |
Technology Access in Bradford County
Computing Device Access in Bradford County
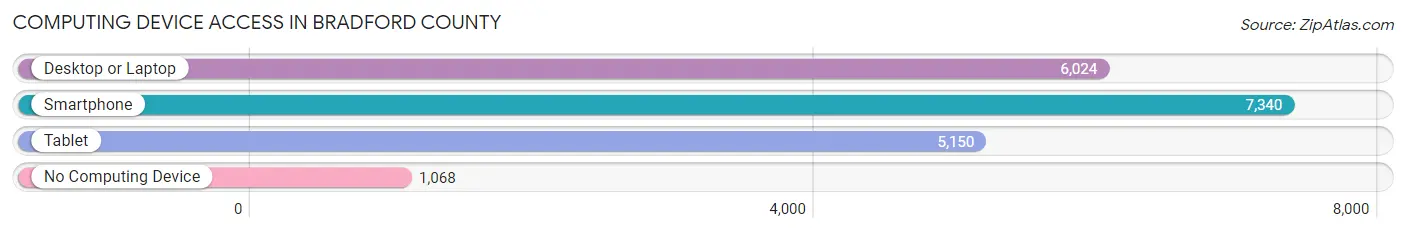
| Device Type | # Households | % Households |
| Desktop or Laptop | 6,024 | 66.4% |
| Smartphone | 7,340 | 80.9% |
| Tablet | 5,150 | 56.8% |
| No Computing Device | 1,068 | 11.8% |
| Total | 9,067 | 100.0% |
Internet Access in Bradford County
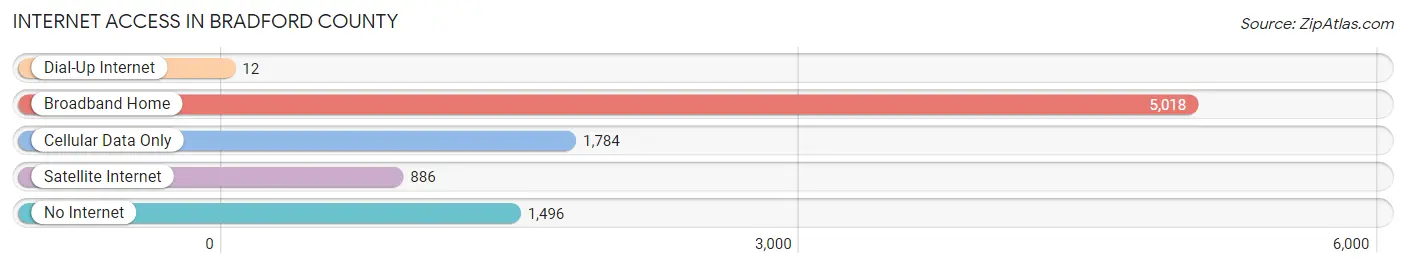
| Internet Type | # Households | % Households |
| Dial-Up Internet | 12 | 0.1% |
| Broadband Home | 5,018 | 55.3% |
| Cellular Data Only | 1,784 | 19.7% |
| Satellite Internet | 886 | 9.8% |
| No Internet | 1,496 | 16.5% |
| Total | 9,067 | 100.0% |
Bradford County Summary
Bradford County is located in the north-central part of the state of Florida, in the United States. It is bordered by Alachua County to the north, Union County to the east, Clay County to the south, and Baker County to the west. The county seat is Starke, and the largest city is Keystone Heights. As of the 2010 census, the population was 28,520.
History
The area that is now Bradford County was inhabited by the Timucua people for thousands of years before the arrival of Europeans. The first Europeans to settle in the area were the Spanish, who established a mission in the area in the late 1600s. The area was part of the Spanish colony of Florida until 1821, when it became part of the United States.
In 1858, Bradford County was created from a portion of Alachua County. It was named for Captain Richard Bradford, a soldier in the Second Seminole War. The county seat was established in Starke, which was named for a local family.
Geography
Bradford County is located in north-central Florida, and is bordered by Alachua County to the north, Union County to the east, Clay County to the south, and Baker County to the west. The county has a total area of 300 square miles, of which 296 square miles is land and 4 square miles is water.
The county is mostly flat, with some rolling hills in the northern part of the county. The terrain is mostly covered in pine and oak forests, with some wetlands and swamps. The county is drained by the Santa Fe River, which flows through the county from north to south.
Economy
The economy of Bradford County is largely based on agriculture. The county is home to several large farms, which produce a variety of crops, including corn, soybeans, cotton, and peanuts. The county is also home to several large timber companies, which harvest pine and oak trees for lumber.
The county is also home to several manufacturing companies, which produce a variety of products, including furniture, paper products, and plastics. The county is also home to several retail stores, restaurants, and other businesses.
Demographics
As of the 2010 census, there were 28,520 people, 10,845 households, and 7,717 families living in the county. The population density was 96.3 people per square mile. The racial makeup of the county was 79.2% White, 16.3% African American, 0.4% Native American, 0.7% Asian, 0.1% Pacific Islander, 1.7% from other races, and 1.6% from two or more races. Hispanic or Latino of any race were 4.3% of the population.
The median income for a household in the county was $37,845, and the median income for a family was $45,890. The per capita income for the county was $18,845. About 14.2% of families and 17.7% of the population were below the poverty line, including 25.2% of those under age 18 and 11.2% of those age 65 or over.
Common Questions
What is Per Capita Income in Bradford County?
Per Capita income in Bradford County is $25,276.
What is the Median Family Income in Bradford County?
Median Family Income in Bradford County is $71,767.
What is the Median Household income in Bradford County?
Median Household Income in Bradford County is $54,759.
What is Income or Wage Gap in Bradford County?
Income or Wage Gap in Bradford County is 10.4%.
Women in Bradford County earn 89.6 cents for every dollar earned by a man.
What is Family Income Deficit in Bradford County?
Family Income Deficit in Bradford County is $7,644.
Families that are below poverty line in Bradford County earn $7,644 less on average than the poverty threshold level.
What is Inequality or Gini Index in Bradford County?
Inequality or Gini Index in Bradford County is 0.45.
What is the Total Population of Bradford County?
Total Population of Bradford County is 27,816.
What is the Total Male Population of Bradford County?
Total Male Population of Bradford County is 15,418.
What is the Total Female Population of Bradford County?
Total Female Population of Bradford County is 12,398.
What is the Ratio of Males per 100 Females in Bradford County?
There are 124.36 Males per 100 Females in Bradford County.
What is the Ratio of Females per 100 Males in Bradford County?
There are 80.41 Females per 100 Males in Bradford County.
What is the Median Population Age in Bradford County?
Median Population Age in Bradford County is 39.9 Years.
What is the Average Family Size in Bradford County
Average Family Size in Bradford County is 3.2 People.
What is the Average Household Size in Bradford County
Average Household Size in Bradford County is 2.6 People.
How Large is the Labor Force in Bradford County?
There are 11,384 People in the Labor Forcein in Bradford County.
What is the Percentage of People in the Labor Force in Bradford County?
49.5% of People are in the Labor Force in Bradford County.
What is the Unemployment Rate in Bradford County?
Unemployment Rate in Bradford County is 5.8%.