Baker County, FL Map & Demographics
Baker County Map
Baker County Overview
$28,612
PER CAPITA INCOME
$81,512
AVG FAMILY INCOME
$67,872
AVG HOUSEHOLD INCOME
20.9%
WAGE / INCOME GAP [ % ]
79.1¢/ $1
WAGE / INCOME GAP [ $ ]
$10,439
FAMILY INCOME DEFICIT
0.41
INEQUALITY / GINI INDEX
27,969
TOTAL POPULATION
14,996
MALE POPULATION
12,973
FEMALE POPULATION
115.59
MALES / 100 FEMALES
86.51
FEMALES / 100 MALES
37.7
MEDIAN AGE
3.2
AVG FAMILY SIZE
2.8
AVG HOUSEHOLD SIZE
12,232
LABOR FORCE [ PEOPLE ]
55.5%
PERCENT IN LABOR FORCE
4.9%
UNEMPLOYMENT RATE
Baker County Area Codes
Income in Baker County
Income Overview in Baker County
Per Capita Income in Baker County is $28,612, while median incomes of families and households are $81,512 and $67,872 respectively.
| Characteristic | Number | Measure |
| Per Capita Income | 27,969 | $28,612 |
| Median Family Income | 6,642 | $81,512 |
| Mean Family Income | 6,642 | $94,179 |
| Median Household Income | 9,004 | $67,872 |
| Mean Household Income | 9,004 | $86,352 |
| Income Deficit | 6,642 | $10,439 |
| Wage / Income Gap (%) | 27,969 | 20.93% |
| Wage / Income Gap ($) | 27,969 | 79.07¢ per $1 |
| Gini / Inequality Index | 27,969 | 0.41 |
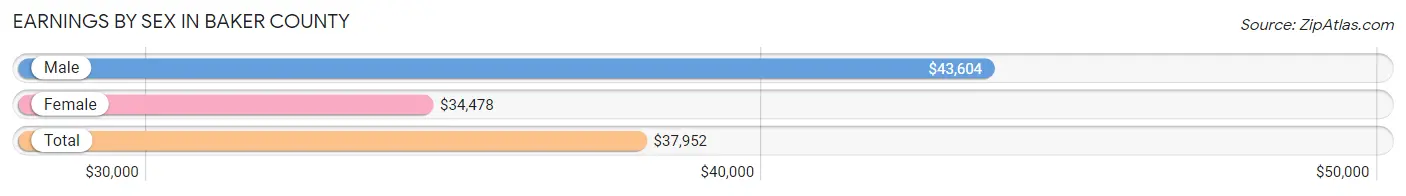
Earnings by Sex in Baker County
Average Earnings in Baker County are $37,952, $43,604 for men and $34,478 for women, a difference of 20.9%.
| Sex | Number | Average Earnings |
| Male | 6,773 (52.8%) | $43,604 |
| Female | 6,050 (47.2%) | $34,478 |
| Total | 12,823 (100.0%) | $37,952 |
Earnings by Sex by Income Bracket in Baker County
The most common earnings brackets in Baker County are $100,000+ for men (843 | 12.4%) and $35,000 to $39,999 for women (685 | 11.3%).
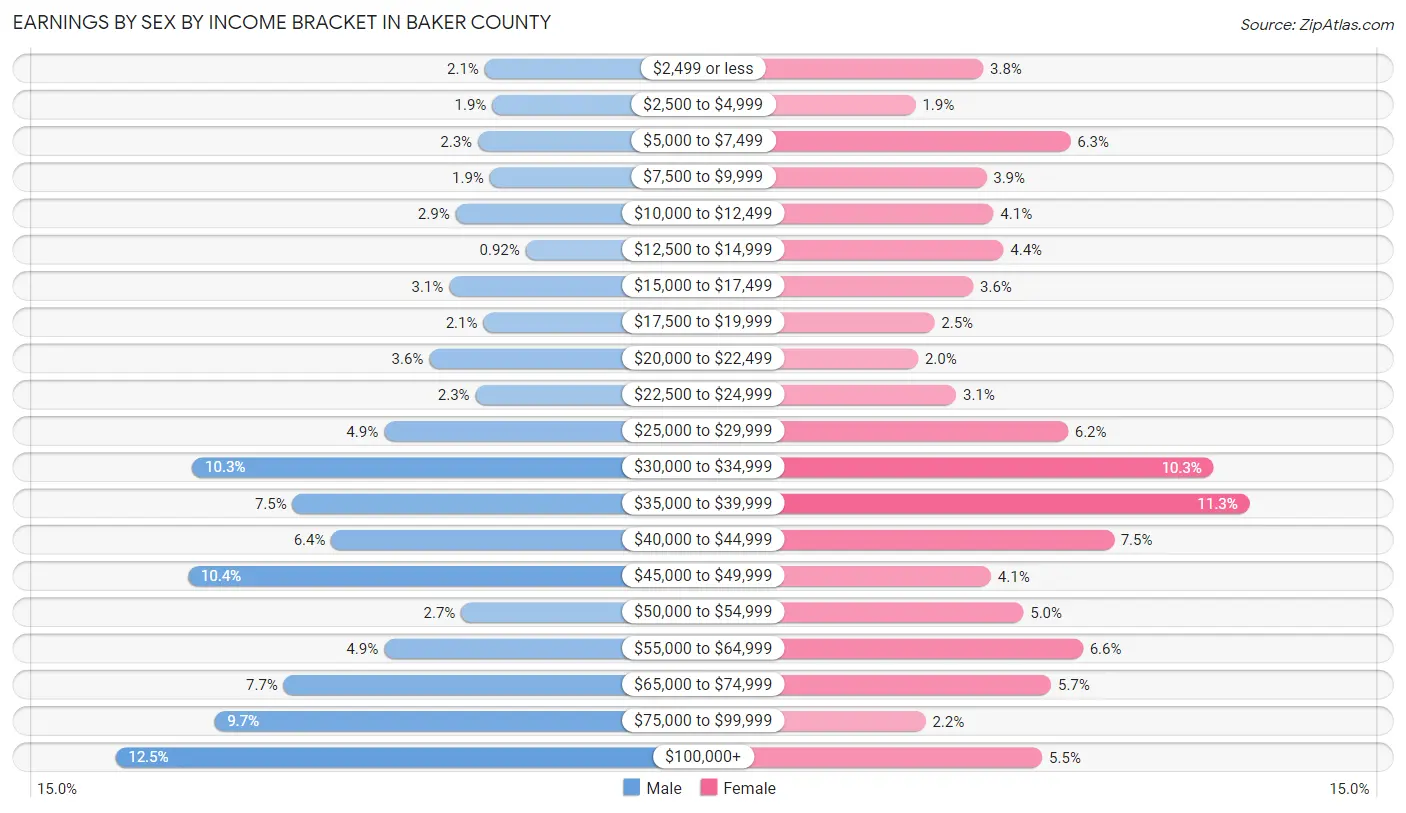
| Income | Male | Female |
| $2,499 or less | 140 (2.1%) | 232 (3.8%) |
| $2,500 to $4,999 | 126 (1.9%) | 117 (1.9%) |
| $5,000 to $7,499 | 153 (2.3%) | 380 (6.3%) |
| $7,500 to $9,999 | 131 (1.9%) | 237 (3.9%) |
| $10,000 to $12,499 | 196 (2.9%) | 249 (4.1%) |
| $12,500 to $14,999 | 62 (0.9%) | 266 (4.4%) |
| $15,000 to $17,499 | 208 (3.1%) | 215 (3.5%) |
| $17,500 to $19,999 | 143 (2.1%) | 149 (2.5%) |
| $20,000 to $22,499 | 246 (3.6%) | 121 (2.0%) |
| $22,500 to $24,999 | 158 (2.3%) | 186 (3.1%) |
| $25,000 to $29,999 | 332 (4.9%) | 376 (6.2%) |
| $30,000 to $34,999 | 697 (10.3%) | 624 (10.3%) |
| $35,000 to $39,999 | 506 (7.5%) | 685 (11.3%) |
| $40,000 to $44,999 | 432 (6.4%) | 454 (7.5%) |
| $45,000 to $49,999 | 705 (10.4%) | 245 (4.1%) |
| $50,000 to $54,999 | 185 (2.7%) | 300 (5.0%) |
| $55,000 to $64,999 | 332 (4.9%) | 401 (6.6%) |
| $65,000 to $74,999 | 523 (7.7%) | 347 (5.7%) |
| $75,000 to $99,999 | 655 (9.7%) | 134 (2.2%) |
| $100,000+ | 843 (12.4%) | 332 (5.5%) |
| Total | 6,773 (100.0%) | 6,050 (100.0%) |
Earnings by Sex by Educational Attainment in Baker County
Average earnings in Baker County are $47,173 for men and $38,523 for women, a difference of 18.3%. Men with an educational attainment of graduate degree enjoy the highest average annual earnings of $100,790, while those with less than high school education earn the least with $34,967. Women with an educational attainment of graduate degree earn the most with the average annual earnings of $52,148, while those with less than high school education have the smallest earnings of $9,127.
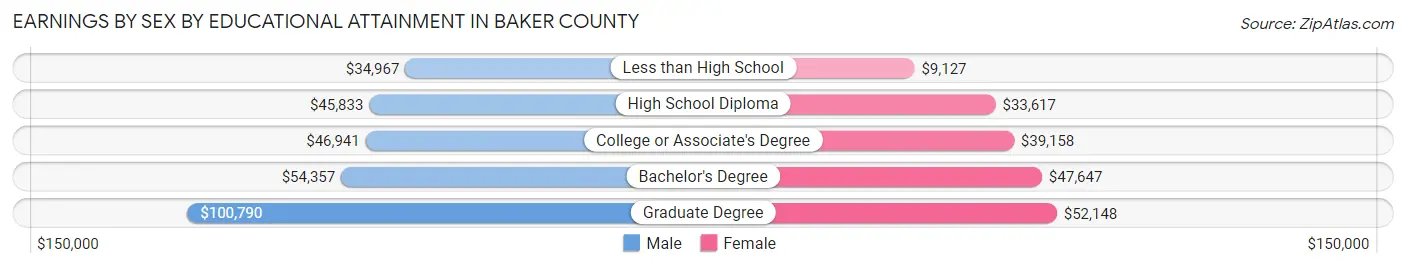
| Educational Attainment | Male Income | Female Income |
| Less than High School | $34,967 | $9,127 |
| High School Diploma | $45,833 | $33,617 |
| College or Associate's Degree | $46,941 | $39,158 |
| Bachelor's Degree | $54,357 | $47,647 |
| Graduate Degree | $100,790 | $52,148 |
| Total | $47,173 | $38,523 |
Family Income in Baker County
Family Income Brackets in Baker County
According to the Baker County family income data, there are 1,335 families falling into the $100,000 to $149,999 income range, which is the most common income bracket and makes up 20.1% of all families. Conversely, the $10,000 to $14,999 income bracket is the least frequent group with only 120 families (1.8%) belonging to this category.
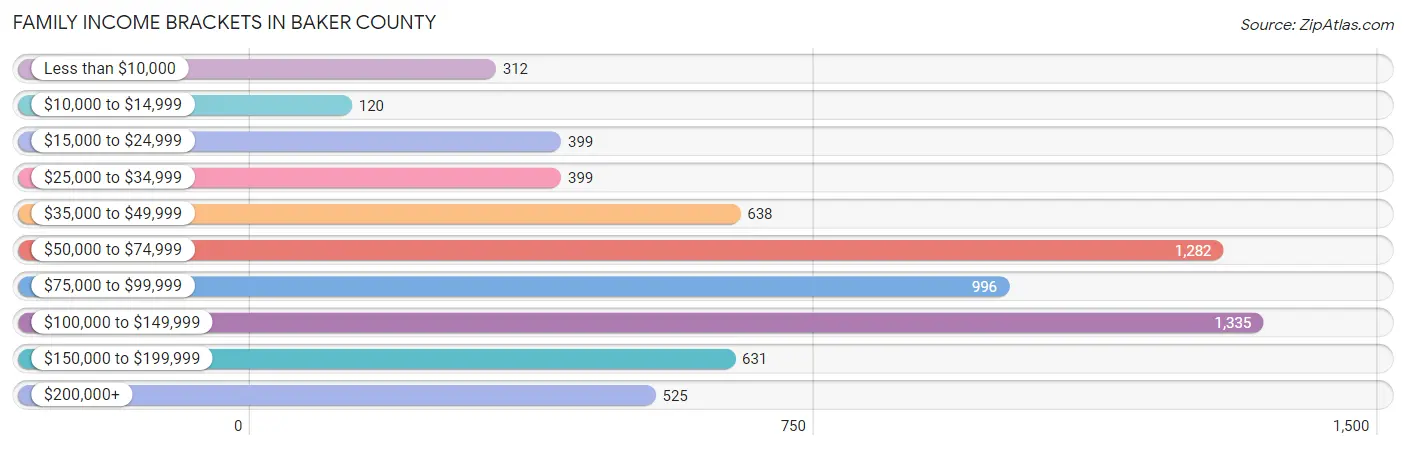
| Income Bracket | # Families | % Families |
| Less than $10,000 | 312 | 4.7% |
| $10,000 to $14,999 | 120 | 1.8% |
| $15,000 to $24,999 | 399 | 6.0% |
| $25,000 to $34,999 | 399 | 6.0% |
| $35,000 to $49,999 | 638 | 9.6% |
| $50,000 to $74,999 | 1,282 | 19.3% |
| $75,000 to $99,999 | 996 | 15.0% |
| $100,000 to $149,999 | 1,335 | 20.1% |
| $150,000 to $199,999 | 631 | 9.5% |
| $200,000+ | 525 | 7.9% |
Family Income by Famaliy Size in Baker County
6-person families (335 | 5.0%) account for the highest median family income in Baker County with $122,961 per family, while 2-person families (3,124 | 47.0%) have the highest median income of $32,996 per family member.
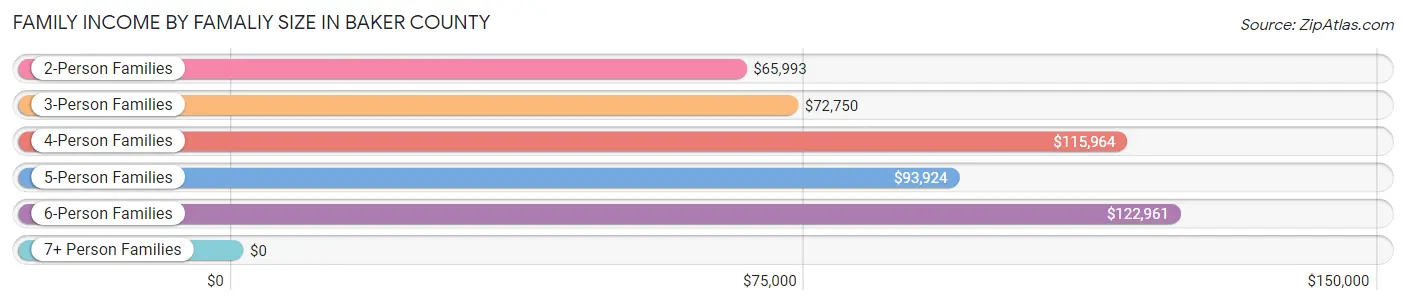
| Income Bracket | # Families | Median Income |
| 2-Person Families | 3,124 (47.0%) | $65,993 |
| 3-Person Families | 1,480 (22.3%) | $72,750 |
| 4-Person Families | 972 (14.6%) | $115,964 |
| 5-Person Families | 663 (10.0%) | $93,924 |
| 6-Person Families | 335 (5.0%) | $122,961 |
| 7+ Person Families | 68 (1.0%) | $0 |
| Total | 6,642 (100.0%) | $81,512 |
Family Income by Number of Earners in Baker County
The median family income in Baker County is $81,512, with families comprising 3+ earners (835) having the highest median family income of $139,375, while families with no earners (1,305) have the lowest median family income of $52,017, accounting for 12.6% and 19.7% of families, respectively.
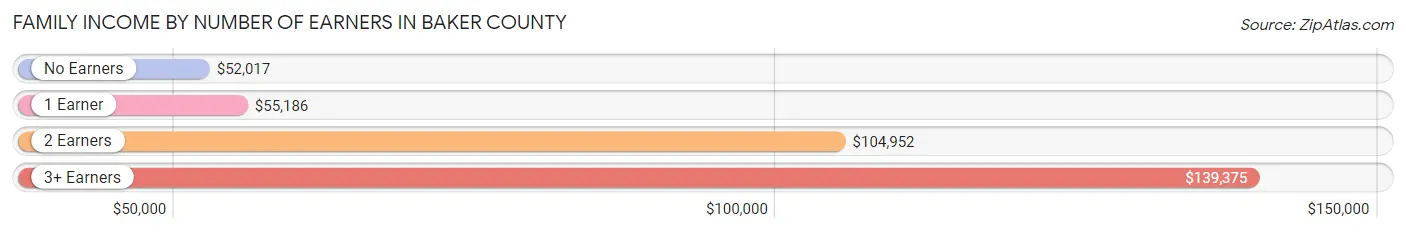
| Number of Earners | # Families | Median Income |
| No Earners | 1,305 (19.7%) | $52,017 |
| 1 Earner | 2,125 (32.0%) | $55,186 |
| 2 Earners | 2,377 (35.8%) | $104,952 |
| 3+ Earners | 835 (12.6%) | $139,375 |
| Total | 6,642 (100.0%) | $81,512 |
Household Income in Baker County
Household Income Brackets in Baker County
With 1,828 households falling in the category, the $50,000 to $74,999 income range is the most frequent in Baker County, accounting for 20.3% of all households. In contrast, only 288 households (3.2%) fall into the $10,000 to $14,999 income bracket, making it the least populous group.
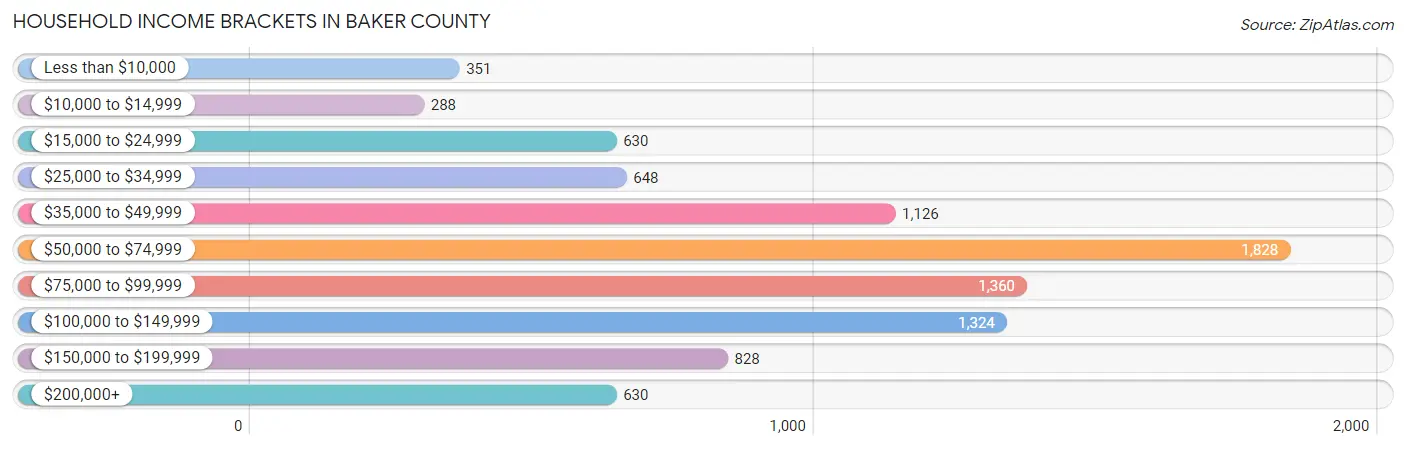
| Income Bracket | # Households | % Households |
| Less than $10,000 | 351 | 3.9% |
| $10,000 to $14,999 | 288 | 3.2% |
| $15,000 to $24,999 | 630 | 7.0% |
| $25,000 to $34,999 | 648 | 7.2% |
| $35,000 to $49,999 | 1,126 | 12.5% |
| $50,000 to $74,999 | 1,828 | 20.3% |
| $75,000 to $99,999 | 1,360 | 15.1% |
| $100,000 to $149,999 | 1,324 | 14.7% |
| $150,000 to $199,999 | 828 | 9.2% |
| $200,000+ | 630 | 7.0% |
Household Income by Householder Age in Baker County
The median household income in Baker County is $67,872, with the highest median household income of $80,993 found in the 45 to 64 years age bracket for the primary householder. A total of 3,211 households (35.7%) fall into this category. Meanwhile, the 65+ years age bracket for the primary householder has the lowest median household income of $50,794, with 2,435 households (27.0%) in this group.
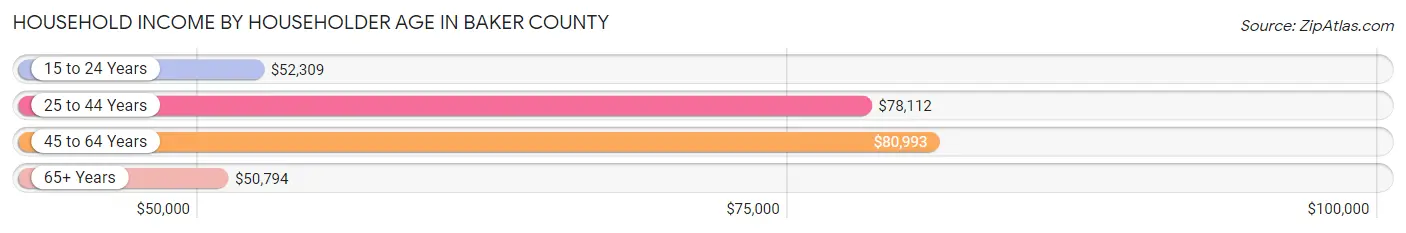
| Income Bracket | # Households | Median Income |
| 15 to 24 Years | 285 (3.2%) | $52,309 |
| 25 to 44 Years | 3,073 (34.1%) | $78,112 |
| 45 to 64 Years | 3,211 (35.7%) | $80,993 |
| 65+ Years | 2,435 (27.0%) | $50,794 |
| Total | 9,004 (100.0%) | $67,872 |
Poverty in Baker County
Income Below Poverty by Sex and Age in Baker County
With 11.8% poverty level for males and 15.6% for females among the residents of Baker County, under 5 year old males and under 5 year old females are the most vulnerable to poverty, with 225 males (24.5%) and 280 females (37.5%) in their respective age groups living below the poverty level.
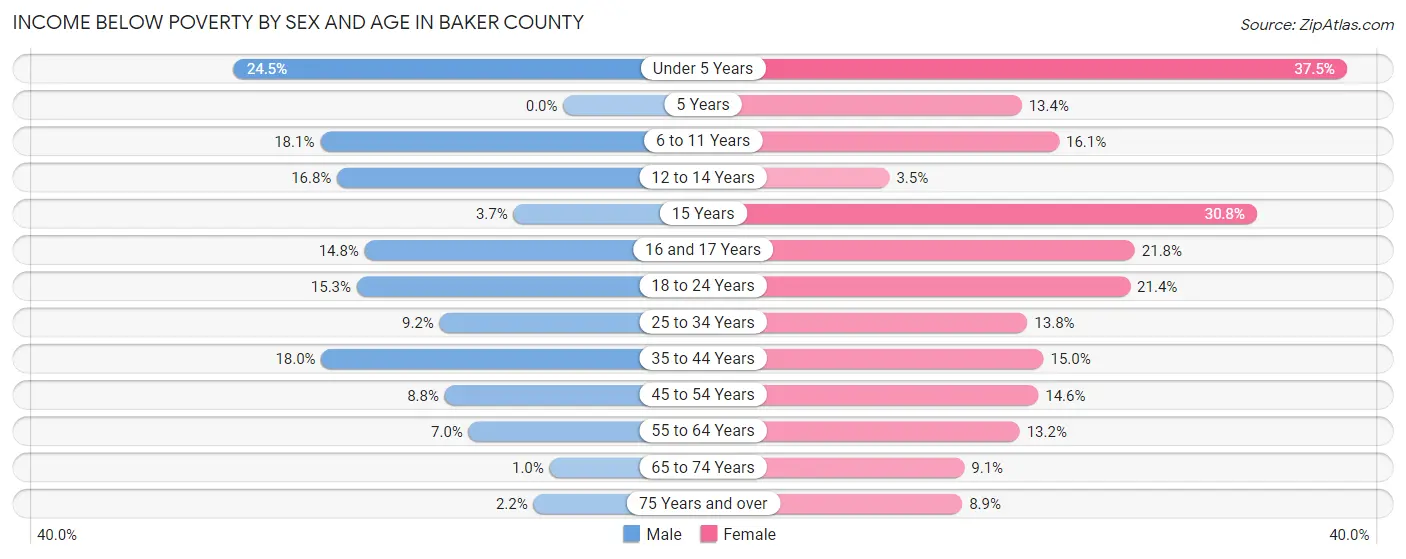
| Age Bracket | Male | Female |
| Under 5 Years | 225 (24.5%) | 280 (37.5%) |
| 5 Years | 0 (0.0%) | 29 (13.4%) |
| 6 to 11 Years | 178 (18.0%) | 155 (16.1%) |
| 12 to 14 Years | 138 (16.8%) | 18 (3.5%) |
| 15 Years | 12 (3.7%) | 61 (30.8%) |
| 16 and 17 Years | 45 (14.7%) | 74 (21.8%) |
| 18 to 24 Years | 188 (15.3%) | 249 (21.4%) |
| 25 to 34 Years | 154 (9.2%) | 206 (13.8%) |
| 35 to 44 Years | 257 (18.0%) | 224 (15.0%) |
| 45 to 54 Years | 132 (8.8%) | 259 (14.6%) |
| 55 to 64 Years | 107 (7.0%) | 208 (13.2%) |
| 65 to 74 Years | 11 (1.0%) | 103 (9.1%) |
| 75 Years and over | 12 (2.2%) | 73 (8.9%) |
| Total | 1,459 (11.8%) | 1,939 (15.6%) |
Income Above Poverty by Sex and Age in Baker County
According to the poverty statistics in Baker County, males aged 5 years and females aged 12 to 14 years are the age groups that are most secure financially, with 100.0% of males and 96.5% of females in these age groups living above the poverty line.
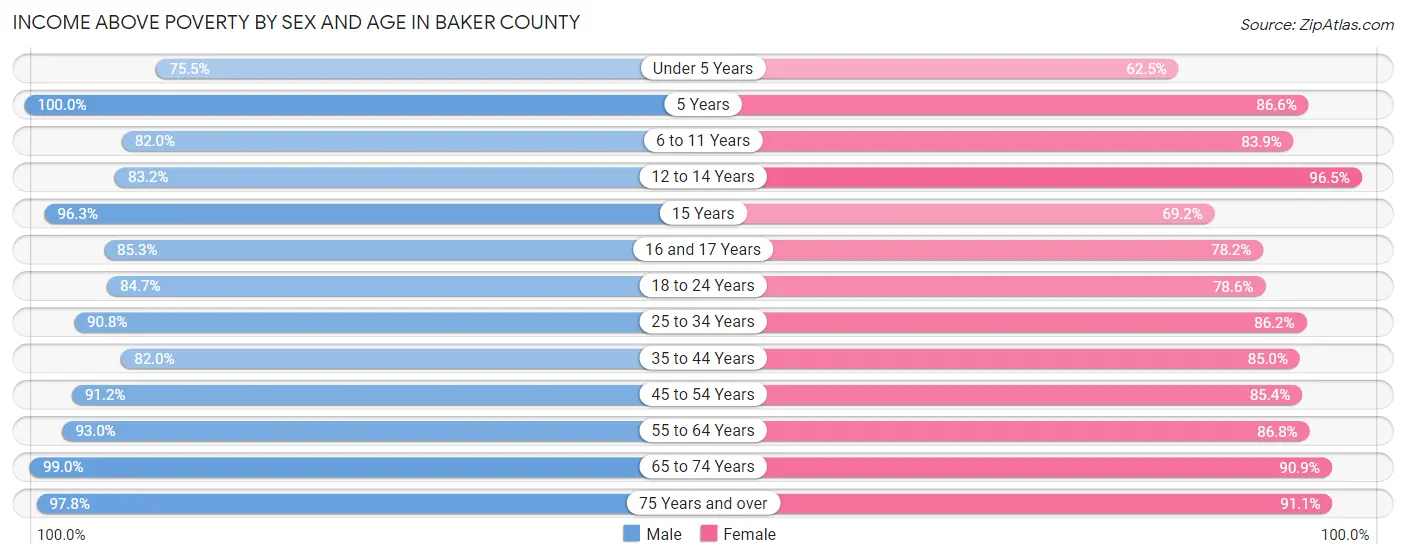
| Age Bracket | Male | Female |
| Under 5 Years | 695 (75.5%) | 467 (62.5%) |
| 5 Years | 74 (100.0%) | 188 (86.6%) |
| 6 to 11 Years | 808 (82.0%) | 806 (83.9%) |
| 12 to 14 Years | 684 (83.2%) | 491 (96.5%) |
| 15 Years | 312 (96.3%) | 137 (69.2%) |
| 16 and 17 Years | 260 (85.3%) | 266 (78.2%) |
| 18 to 24 Years | 1,038 (84.7%) | 914 (78.6%) |
| 25 to 34 Years | 1,523 (90.8%) | 1,289 (86.2%) |
| 35 to 44 Years | 1,174 (82.0%) | 1,271 (85.0%) |
| 45 to 54 Years | 1,368 (91.2%) | 1,516 (85.4%) |
| 55 to 64 Years | 1,416 (93.0%) | 1,367 (86.8%) |
| 65 to 74 Years | 1,068 (99.0%) | 1,029 (90.9%) |
| 75 Years and over | 531 (97.8%) | 744 (91.1%) |
| Total | 10,951 (88.2%) | 10,485 (84.4%) |
Income Below Poverty Among Married-Couple Families in Baker County
The poverty statistics for married-couple families in Baker County show that 5.9% or 280 of the total 4,733 families live below the poverty line. Families with 5 or more children have the highest poverty rate of 73.3%, comprising of 11 families. On the other hand, families with no children have the lowest poverty rate of 3.1%, which includes 85 families.
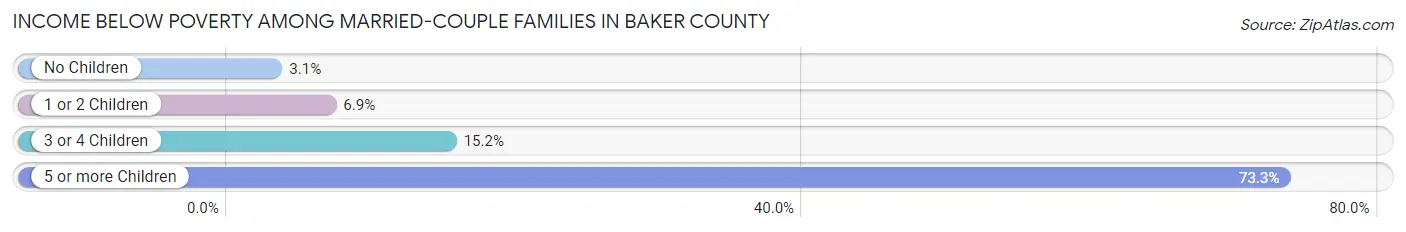
| Children | Above Poverty | Below Poverty |
| No Children | 2,669 (96.9%) | 85 (3.1%) |
| 1 or 2 Children | 1,279 (93.1%) | 94 (6.9%) |
| 3 or 4 Children | 501 (84.8%) | 90 (15.2%) |
| 5 or more Children | 4 (26.7%) | 11 (73.3%) |
| Total | 4,453 (94.1%) | 280 (5.9%) |
Income Below Poverty Among Single-Parent Households in Baker County
According to the poverty data in Baker County, 37.1% or 175 single-father households and 27.9% or 401 single-mother households are living below the poverty line. Among single-father households, those with no children have the highest poverty rate, with 109 households (61.6%) experiencing poverty. Likewise, among single-mother households, those with 3 or 4 children have the highest poverty rate, with 114 households (66.7%) falling below the poverty line.
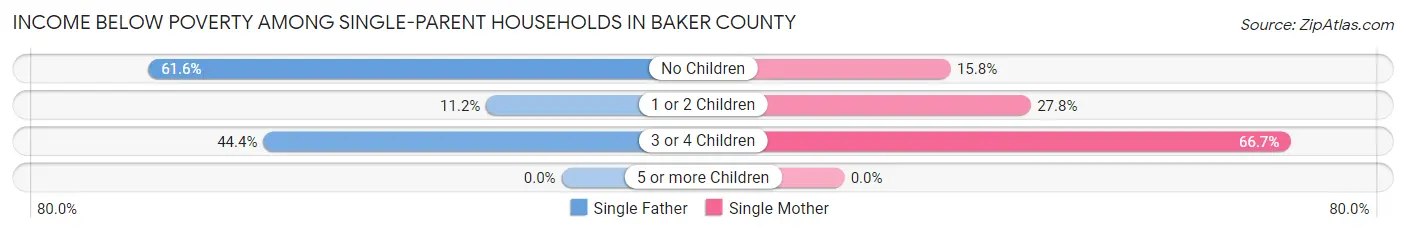
| Children | Single Father | Single Mother |
| No Children | 109 (61.6%) | 86 (15.8%) |
| 1 or 2 Children | 22 (11.2%) | 201 (27.8%) |
| 3 or 4 Children | 44 (44.4%) | 114 (66.7%) |
| 5 or more Children | 0 (0.0%) | 0 (0.0%) |
| Total | 175 (37.1%) | 401 (27.9%) |
Income Below Poverty Among Married-Couple vs Single-Parent Households in Baker County
The poverty data for Baker County shows that 280 of the married-couple family households (5.9%) and 576 of the single-parent households (30.2%) are living below the poverty level. Within the married-couple family households, those with 5 or more children have the highest poverty rate, with 11 households (73.3%) falling below the poverty line. Among the single-parent households, those with 3 or 4 children have the highest poverty rate, with 158 household (58.5%) living below poverty.
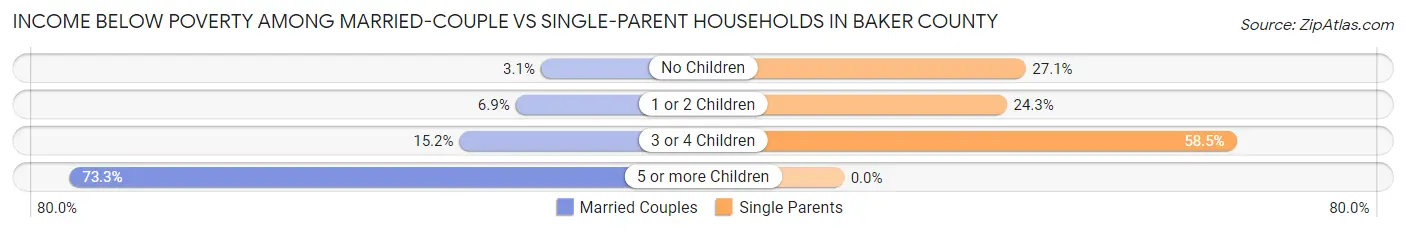
| Children | Married-Couple Families | Single-Parent Households |
| No Children | 85 (3.1%) | 195 (27.1%) |
| 1 or 2 Children | 94 (6.9%) | 223 (24.3%) |
| 3 or 4 Children | 90 (15.2%) | 158 (58.5%) |
| 5 or more Children | 11 (73.3%) | 0 (0.0%) |
| Total | 280 (5.9%) | 576 (30.2%) |
Race in Baker County
The most populous races in Baker County are White / Caucasian (21,970 | 78.5%), Black / African American (3,319 | 11.9%), and Two or more Races (2,248 | 8.0%).
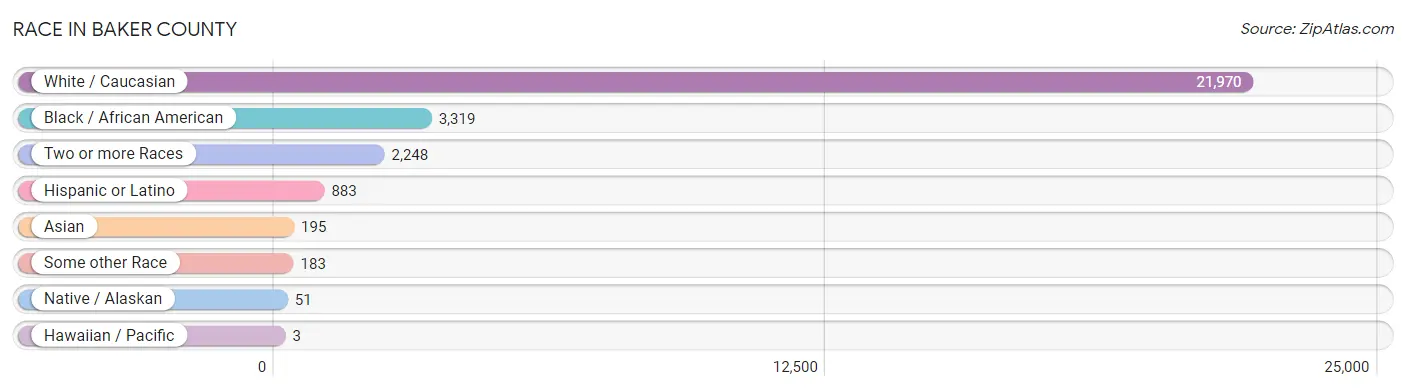
| Race | # Population | % Population |
| Asian | 195 | 0.7% |
| Black / African American | 3,319 | 11.9% |
| Hawaiian / Pacific | 3 | 0.0% |
| Hispanic or Latino | 883 | 3.2% |
| Native / Alaskan | 51 | 0.2% |
| White / Caucasian | 21,970 | 78.5% |
| Two or more Races | 2,248 | 8.0% |
| Some other Race | 183 | 0.6% |
| Total | 27,969 | 100.0% |
Ancestry in Baker County
The most populous ancestries reported in Baker County are Irish (3,548 | 12.7%), American (3,226 | 11.5%), German (2,723 | 9.7%), English (2,330 | 8.3%), and Italian (1,443 | 5.2%), together accounting for 47.4% of all Baker County residents.
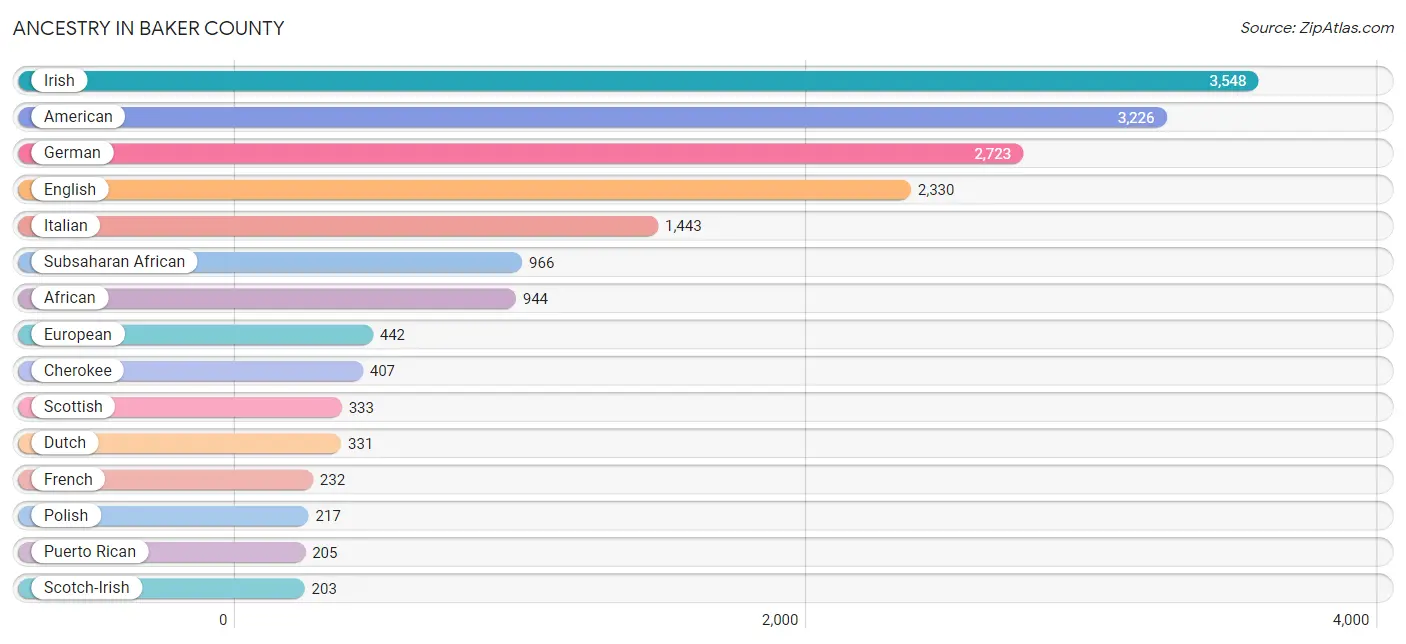
| Ancestry | # Population | % Population |
| African | 944 | 3.4% |
| American | 3,226 | 11.5% |
| Apache | 4 | 0.0% |
| Arab | 32 | 0.1% |
| Armenian | 12 | 0.0% |
| Bahamian | 4 | 0.0% |
| Belizean | 5 | 0.0% |
| Bhutanese | 10 | 0.0% |
| Blackfeet | 55 | 0.2% |
| Brazilian | 14 | 0.1% |
| British | 82 | 0.3% |
| Burmese | 11 | 0.0% |
| Central American | 117 | 0.4% |
| Cherokee | 407 | 1.5% |
| Choctaw | 12 | 0.0% |
| Colombian | 11 | 0.0% |
| Croatian | 9 | 0.0% |
| Cuban | 171 | 0.6% |
| Czech | 31 | 0.1% |
| Dominican | 30 | 0.1% |
| Dutch | 331 | 1.2% |
| Eastern European | 24 | 0.1% |
| English | 2,330 | 8.3% |
| Ethiopian | 7 | 0.0% |
| European | 442 | 1.6% |
| Finnish | 28 | 0.1% |
| French | 232 | 0.8% |
| French Canadian | 72 | 0.3% |
| German | 2,723 | 9.7% |
| Greek | 198 | 0.7% |
| Guamanian / Chamorro | 5 | 0.0% |
| Guyanese | 19 | 0.1% |
| Haitian | 12 | 0.0% |
| Honduran | 22 | 0.1% |
| Hungarian | 13 | 0.1% |
| Indian (Asian) | 82 | 0.3% |
| Irish | 3,548 | 12.7% |
| Israeli | 3 | 0.0% |
| Italian | 1,443 | 5.2% |
| Jamaican | 109 | 0.4% |
| Japanese | 19 | 0.1% |
| Korean | 63 | 0.2% |
| Lithuanian | 6 | 0.0% |
| Mexican | 163 | 0.6% |
| Norwegian | 34 | 0.1% |
| Pakistani | 48 | 0.2% |
| Panamanian | 37 | 0.1% |
| Polish | 217 | 0.8% |
| Portuguese | 34 | 0.1% |
| Puerto Rican | 205 | 0.7% |
| Russian | 105 | 0.4% |
| Salvadoran | 58 | 0.2% |
| Scandinavian | 29 | 0.1% |
| Scotch-Irish | 203 | 0.7% |
| Scottish | 333 | 1.2% |
| Seminole | 49 | 0.2% |
| South African | 15 | 0.1% |
| South American | 23 | 0.1% |
| Spaniard | 45 | 0.2% |
| Spanish | 70 | 0.3% |
| Sri Lankan | 7 | 0.0% |
| Subsaharan African | 966 | 3.5% |
| Swedish | 40 | 0.1% |
| Syrian | 20 | 0.1% |
| Thai | 102 | 0.4% |
| Trinidadian and Tobagonian | 85 | 0.3% |
| Venezuelan | 12 | 0.0% |
| Welsh | 172 | 0.6% |
| West Indian | 19 | 0.1% | View All 69 Rows |
Immigrants in Baker County
The most numerous immigrant groups reported in Baker County came from Latin America (323 | 1.1%), Caribbean (178 | 0.6%), Central America (122 | 0.4%), Asia (94 | 0.3%), and Mexico (57 | 0.2%), together accounting for 2.8% of all Baker County residents.
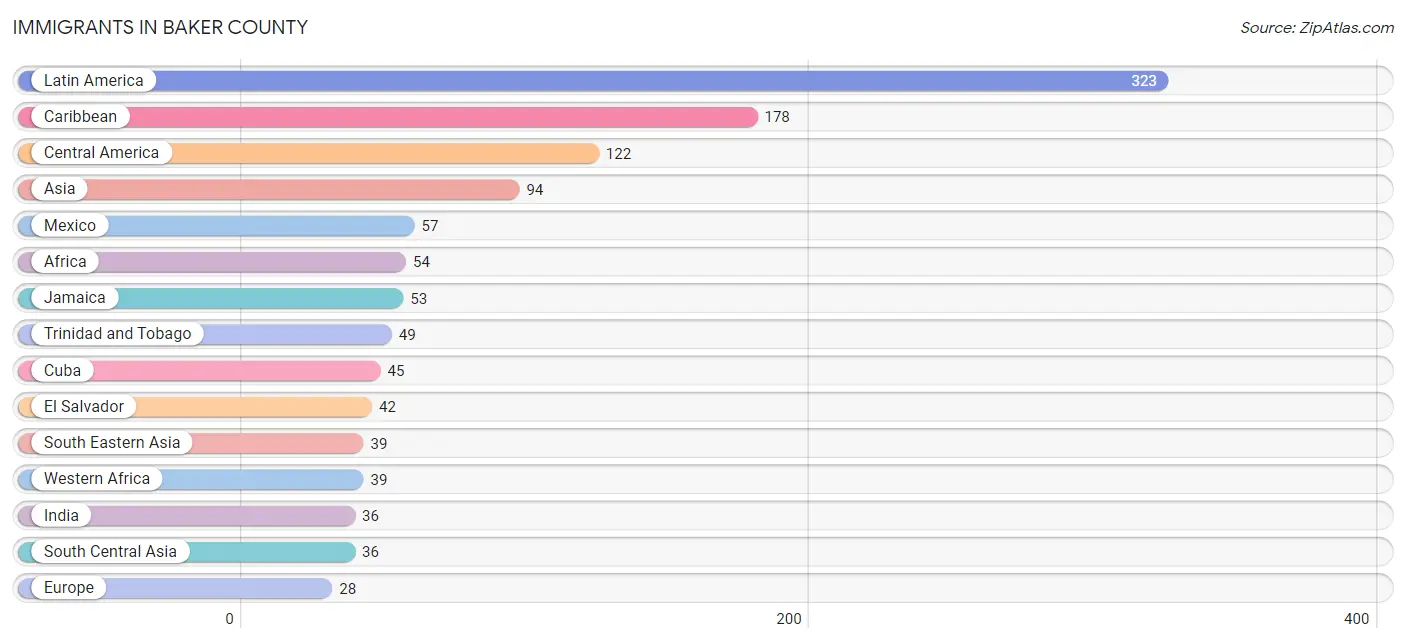
| Immigration Origin | # Population | % Population |
| Africa | 54 | 0.2% |
| Asia | 94 | 0.3% |
| Azores | 2 | 0.0% |
| Caribbean | 178 | 0.6% |
| Central America | 122 | 0.4% |
| China | 9 | 0.0% |
| Colombia | 11 | 0.0% |
| Cuba | 45 | 0.2% |
| Dominican Republic | 26 | 0.1% |
| Eastern Asia | 19 | 0.1% |
| El Salvador | 42 | 0.2% |
| Europe | 28 | 0.1% |
| France | 21 | 0.1% |
| Haiti | 5 | 0.0% |
| Honduras | 23 | 0.1% |
| India | 36 | 0.1% |
| Indonesia | 6 | 0.0% |
| Jamaica | 53 | 0.2% |
| Japan | 10 | 0.0% |
| Latin America | 323 | 1.1% |
| Mexico | 57 | 0.2% |
| Northern Europe | 5 | 0.0% |
| Philippines | 28 | 0.1% |
| Portugal | 2 | 0.0% |
| South Africa | 15 | 0.1% |
| South America | 23 | 0.1% |
| South Central Asia | 36 | 0.1% |
| South Eastern Asia | 39 | 0.1% |
| Southern Europe | 2 | 0.0% |
| Trinidad and Tobago | 49 | 0.2% |
| Venezuela | 12 | 0.0% |
| Vietnam | 5 | 0.0% |
| Western Africa | 39 | 0.1% |
| Western Europe | 21 | 0.1% | View All 34 Rows |
Sex and Age in Baker County
Sex and Age in Baker County
The most populous age groups in Baker County are 30 to 34 Years (1,280 | 8.5%) for men and 55 to 59 Years (1,073 | 8.3%) for women.
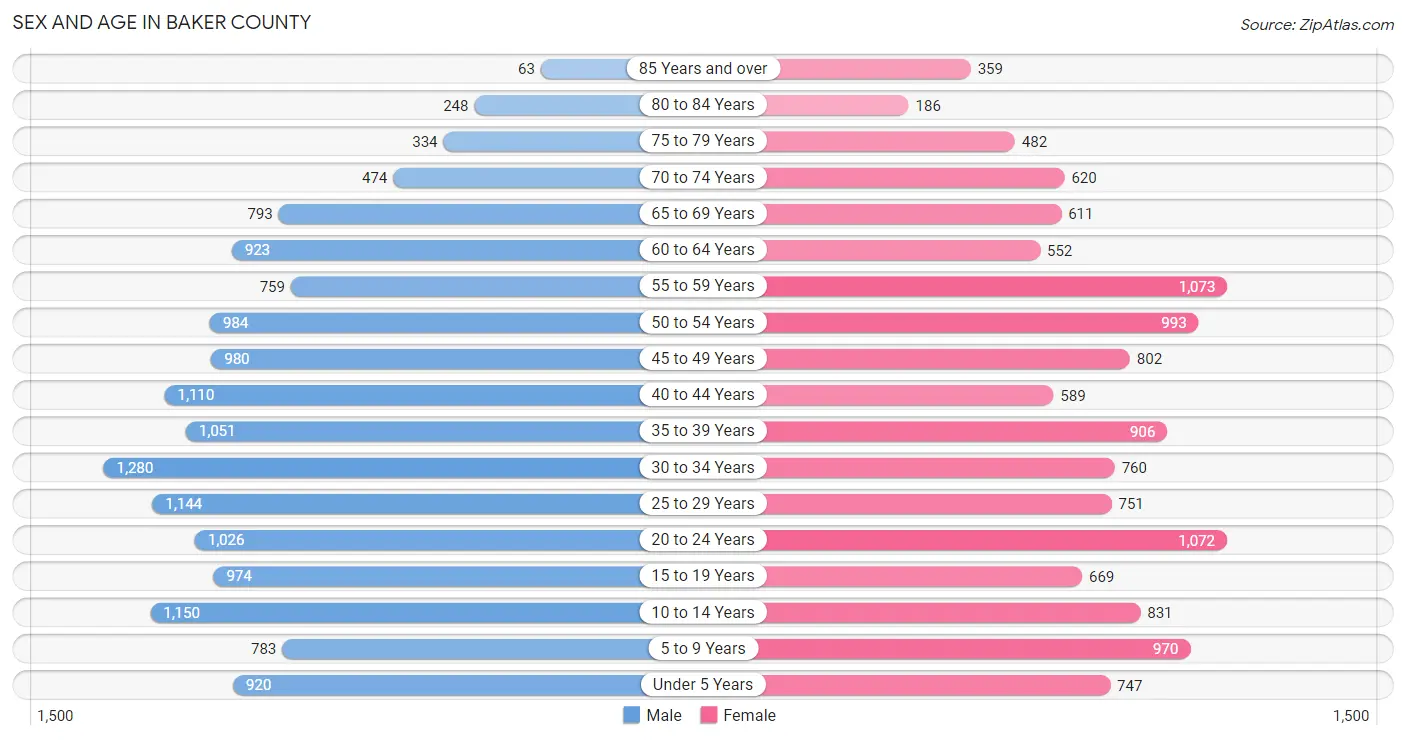
| Age Bracket | Male | Female |
| Under 5 Years | 920 (6.1%) | 747 (5.8%) |
| 5 to 9 Years | 783 (5.2%) | 970 (7.5%) |
| 10 to 14 Years | 1,150 (7.7%) | 831 (6.4%) |
| 15 to 19 Years | 974 (6.5%) | 669 (5.2%) |
| 20 to 24 Years | 1,026 (6.8%) | 1,072 (8.3%) |
| 25 to 29 Years | 1,144 (7.6%) | 751 (5.8%) |
| 30 to 34 Years | 1,280 (8.5%) | 760 (5.9%) |
| 35 to 39 Years | 1,051 (7.0%) | 906 (7.0%) |
| 40 to 44 Years | 1,110 (7.4%) | 589 (4.5%) |
| 45 to 49 Years | 980 (6.5%) | 802 (6.2%) |
| 50 to 54 Years | 984 (6.6%) | 993 (7.6%) |
| 55 to 59 Years | 759 (5.1%) | 1,073 (8.3%) |
| 60 to 64 Years | 923 (6.1%) | 552 (4.3%) |
| 65 to 69 Years | 793 (5.3%) | 611 (4.7%) |
| 70 to 74 Years | 474 (3.2%) | 620 (4.8%) |
| 75 to 79 Years | 334 (2.2%) | 482 (3.7%) |
| 80 to 84 Years | 248 (1.7%) | 186 (1.4%) |
| 85 Years and over | 63 (0.4%) | 359 (2.8%) |
| Total | 14,996 (100.0%) | 12,973 (100.0%) |
Families and Households in Baker County
Median Family Size in Baker County
The median family size in Baker County is 3.17 persons per family, with married-couple families (4,733 | 71.3%) accounting for the largest median family size of 3.27 persons per family. On the other hand, single female/mother families (1,437 | 21.6%) represent the smallest median family size with 2.83 persons per family.
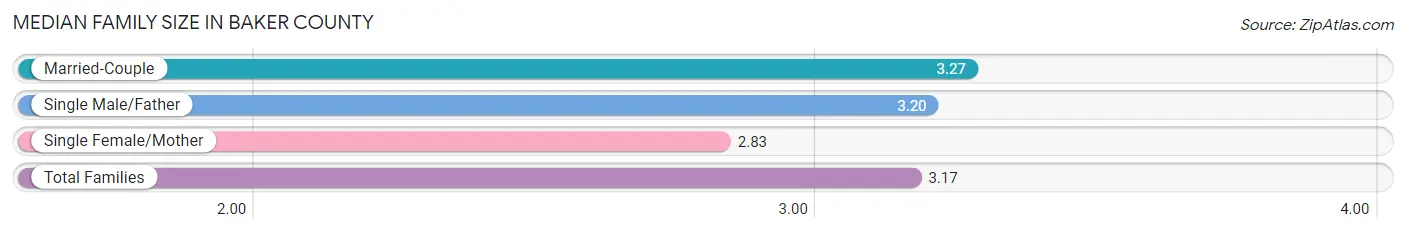
| Family Type | # Families | Family Size |
| Married-Couple | 4,733 (71.3%) | 3.27 |
| Single Male/Father | 472 (7.1%) | 3.20 |
| Single Female/Mother | 1,437 (21.6%) | 2.83 |
| Total Families | 6,642 (100.0%) | 3.17 |
Median Household Size in Baker County
The median household size in Baker County is 2.78 persons per household, with single male/father households (472 | 5.2%) accounting for the largest median household size of 3.64 persons per household. non-family households (2,362 | 26.2%) represent the smallest median household size with 1.34 persons per household.
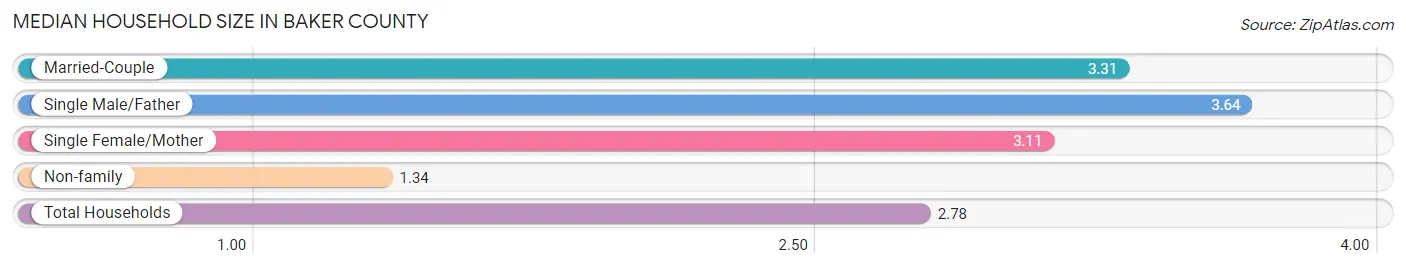
| Household Type | # Households | Household Size |
| Married-Couple | 4,733 (52.6%) | 3.31 |
| Single Male/Father | 472 (5.2%) | 3.64 |
| Single Female/Mother | 1,437 (16.0%) | 3.11 |
| Non-family | 2,362 (26.2%) | 1.34 |
| Total Households | 9,004 (100.0%) | 2.78 |
Household Size by Marriage Status in Baker County
Out of a total of 9,004 households in Baker County, 6,642 (73.8%) are family households, while 2,362 (26.2%) are nonfamily households. The most numerous type of family households are 2-person households, comprising 2,853, and the most common type of nonfamily households are 1-person households, comprising 1,539.
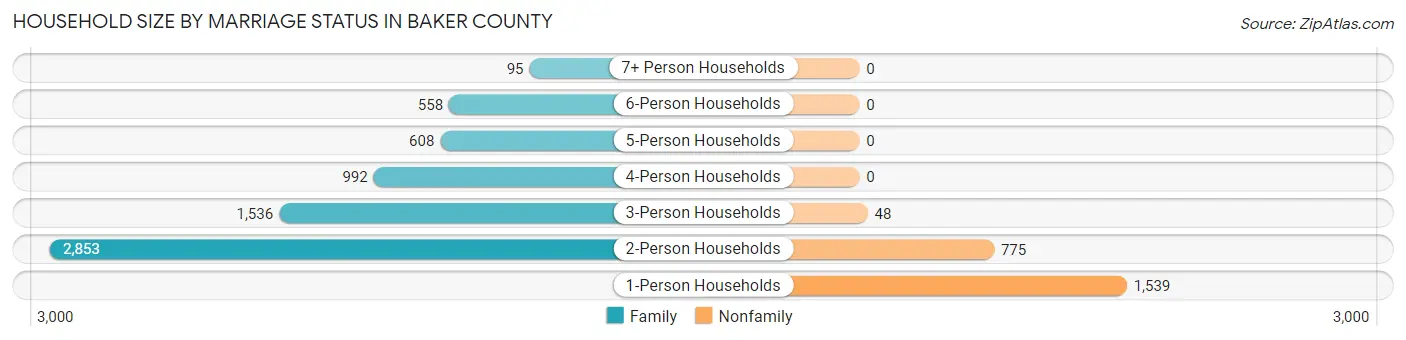
| Household Size | Family Households | Nonfamily Households |
| 1-Person Households | - | 1,539 (17.1%) |
| 2-Person Households | 2,853 (31.7%) | 775 (8.6%) |
| 3-Person Households | 1,536 (17.1%) | 48 (0.5%) |
| 4-Person Households | 992 (11.0%) | 0 (0.0%) |
| 5-Person Households | 608 (6.8%) | 0 (0.0%) |
| 6-Person Households | 558 (6.2%) | 0 (0.0%) |
| 7+ Person Households | 95 (1.1%) | 0 (0.0%) |
| Total | 6,642 (73.8%) | 2,362 (26.2%) |
Female Fertility in Baker County
Fertility by Age in Baker County
Average fertility rate in Baker County is 32.0 births per 1,000 women. Women in the age bracket of 20 to 34 years have the highest fertility rate with 61.0 births per 1,000 women. Women in the age bracket of 20 to 34 years acount for 85.4% of all women with births.
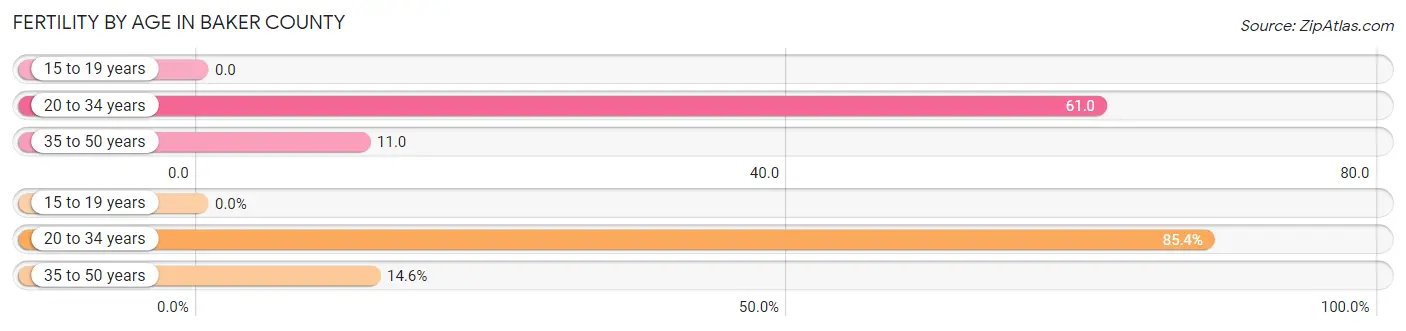
| Age Bracket | Women with Births | Births / 1,000 Women |
| 15 to 19 years | 0 (0.0%) | 0.0 |
| 20 to 34 years | 158 (85.4%) | 61.0 |
| 35 to 50 years | 27 (14.6%) | 11.0 |
| Total | 185 (100.0%) | 32.0 |
Fertility by Age by Marriage Status in Baker County
78.4% of women with births (185) in Baker County are married. The highest percentage of unmarried women with births falls into 20 to 34 years age bracket with 25.3% of them unmarried at the time of birth, while the lowest percentage of unmarried women with births belong to 35 to 50 years age bracket with 0.0% of them unmarried.
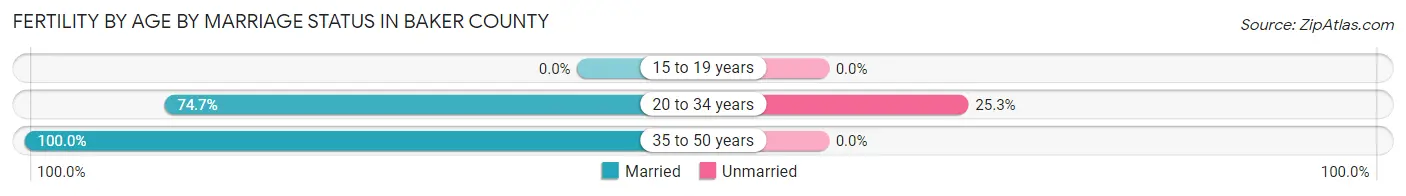
| Age Bracket | Married | Unmarried |
| 15 to 19 years | 0 (0.0%) | 0 (0.0%) |
| 20 to 34 years | 118 (74.7%) | 40 (25.3%) |
| 35 to 50 years | 27 (100.0%) | 0 (0.0%) |
| Total | 145 (78.4%) | 40 (21.6%) |
Fertility by Education in Baker County
Average fertility rate in Baker County is 32.0 births per 1,000 women. Women with the education attainment of bachelor's degree have the highest fertility rate of 106.0 births per 1,000 women, while women with the education attainment of less than high school have the lowest fertility at 8.0 births per 1,000 women. Women with the education attainment of bachelor's degree represent 40.0% of all women with births.
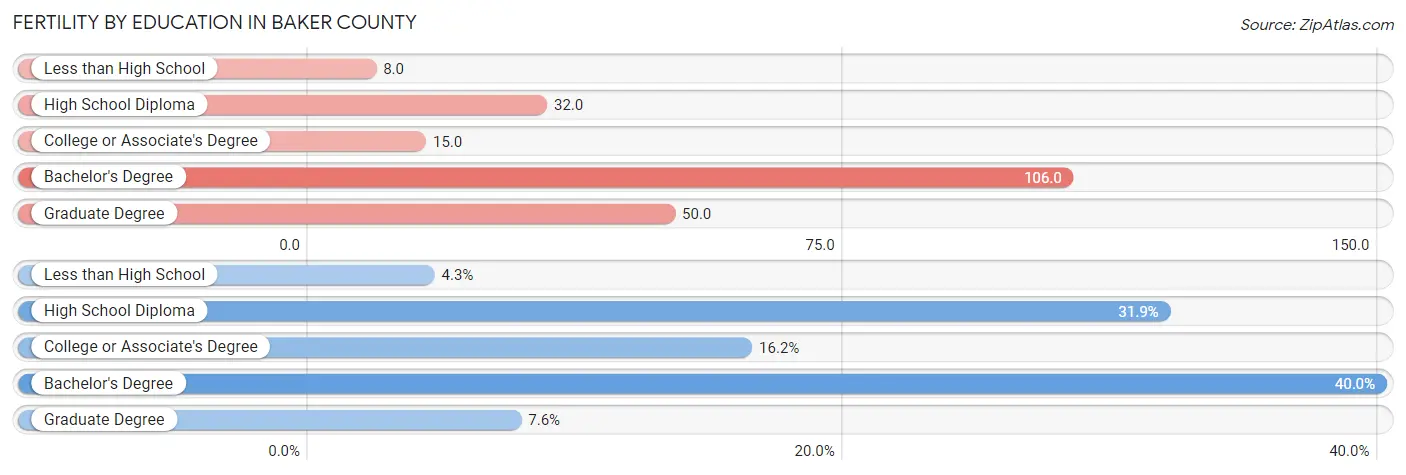
| Educational Attainment | Women with Births | Births / 1,000 Women |
| Less than High School | 8 (4.3%) | 8.0 |
| High School Diploma | 59 (31.9%) | 32.0 |
| College or Associate's Degree | 30 (16.2%) | 15.0 |
| Bachelor's Degree | 74 (40.0%) | 106.0 |
| Graduate Degree | 14 (7.6%) | 50.0 |
| Total | 185 (100.0%) | 32.0 |
Fertility by Education by Marriage Status in Baker County
21.6% of women with births in Baker County are unmarried. Women with the educational attainment of college or associate's degree are most likely to be married with 100.0% of them married at childbirth, while women with the educational attainment of less than high school are least likely to be married with 62.5% of them unmarried at childbirth.
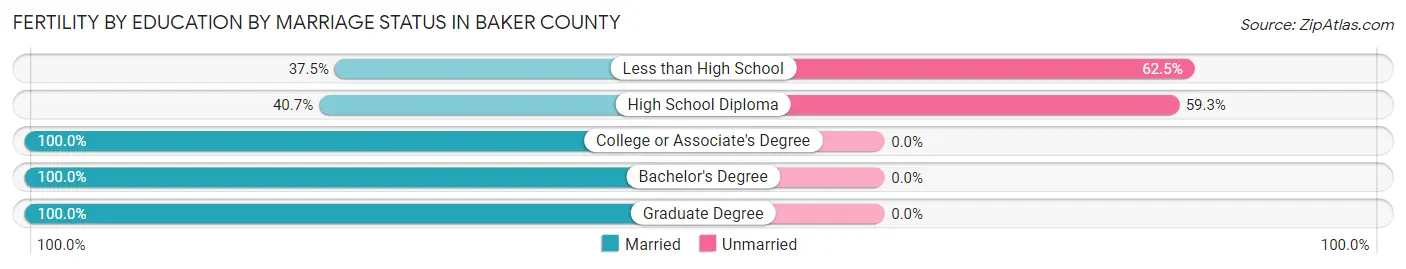
| Educational Attainment | Married | Unmarried |
| Less than High School | 3 (37.5%) | 5 (62.5%) |
| High School Diploma | 24 (40.7%) | 35 (59.3%) |
| College or Associate's Degree | 30 (100.0%) | 0 (0.0%) |
| Bachelor's Degree | 74 (100.0%) | 0 (0.0%) |
| Graduate Degree | 14 (100.0%) | 0 (0.0%) |
| Total | 145 (78.4%) | 40 (21.6%) |
Employment Characteristics in Baker County
Employment by Class of Employer in Baker County
Among the 11,312 employed individuals in Baker County, private company employees (7,139 | 63.1%), local government employees (1,223 | 10.8%), and self-employed (incorporated) (857 | 7.6%) make up the most common classes of employment.
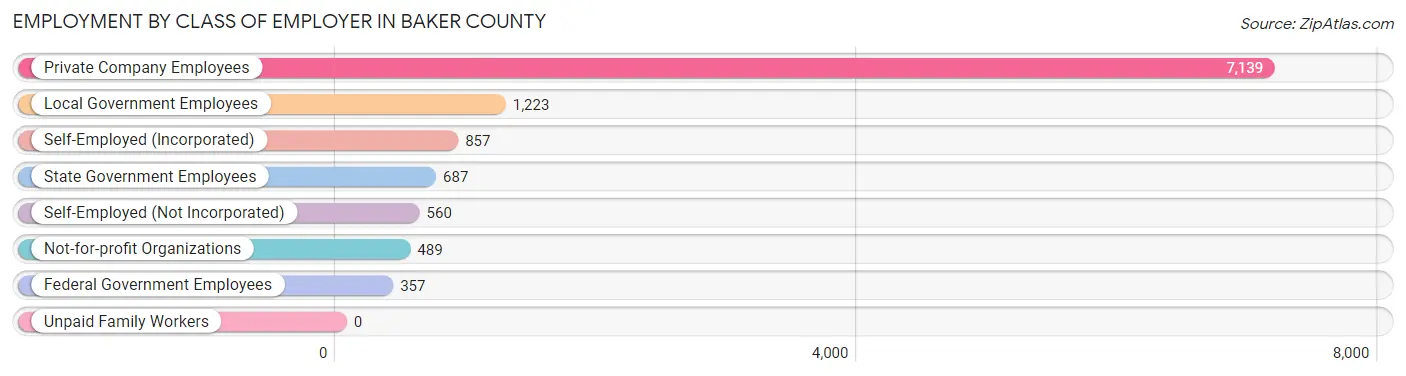
| Employer Class | # Employees | % Employees |
| Private Company Employees | 7,139 | 63.1% |
| Self-Employed (Incorporated) | 857 | 7.6% |
| Self-Employed (Not Incorporated) | 560 | 5.0% |
| Not-for-profit Organizations | 489 | 4.3% |
| Local Government Employees | 1,223 | 10.8% |
| State Government Employees | 687 | 6.1% |
| Federal Government Employees | 357 | 3.2% |
| Unpaid Family Workers | 0 | 0.0% |
| Total | 11,312 | 100.0% |
Employment Status by Age in Baker County
According to the labor force statistics for Baker County, out of the total population over 16 years of age (22,039), 55.5% or 12,232 individuals are in the labor force, with 4.9% or 599 of them unemployed. The age group with the highest labor force participation rate is 20 to 24 years, with 82.2% or 1,725 individuals in the labor force. Within the labor force, the 55 to 59 years age range has the highest percentage of unemployed individuals, with 11.5% or 115 of them being unemployed.
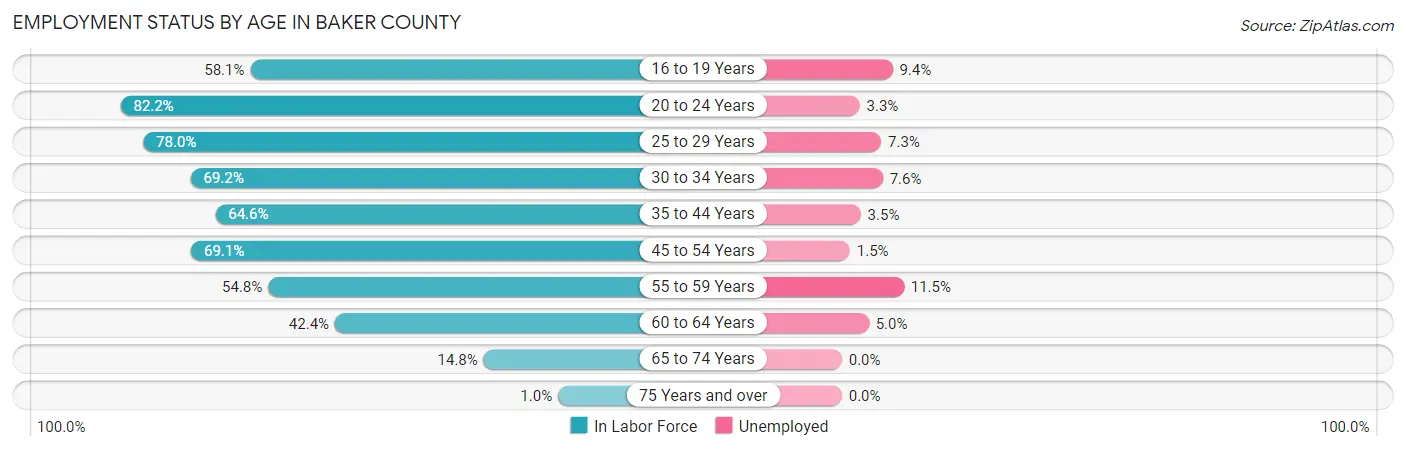
| Age Bracket | In Labor Force | Unemployed |
| 16 to 19 Years | 647 (58.1%) | 61 (9.4%) |
| 20 to 24 Years | 1,725 (82.2%) | 57 (3.3%) |
| 25 to 29 Years | 1,478 (78.0%) | 108 (7.3%) |
| 30 to 34 Years | 1,412 (69.2%) | 107 (7.6%) |
| 35 to 44 Years | 2,362 (64.6%) | 83 (3.5%) |
| 45 to 54 Years | 2,597 (69.1%) | 39 (1.5%) |
| 55 to 59 Years | 1,004 (54.8%) | 115 (11.5%) |
| 60 to 64 Years | 625 (42.4%) | 31 (5.0%) |
| 65 to 74 Years | 370 (14.8%) | 0 (0.0%) |
| 75 Years and over | 17 (1.0%) | 0 (0.0%) |
| Total | 12,232 (55.5%) | 599 (4.9%) |
Employment Status by Educational Attainment in Baker County
According to labor force statistics for Baker County, 64.7% of individuals (9,483) out of the total population between 25 and 64 years of age (14,657) are in the labor force, with 5.1% or 484 of them being unemployed. The group with the highest labor force participation rate are those with the educational attainment of bachelor's degree or higher, with 89.1% or 1,905 individuals in the labor force. Within the labor force, individuals with less than high school education have the highest percentage of unemployment, with 20.4% or 130 of them being unemployed.
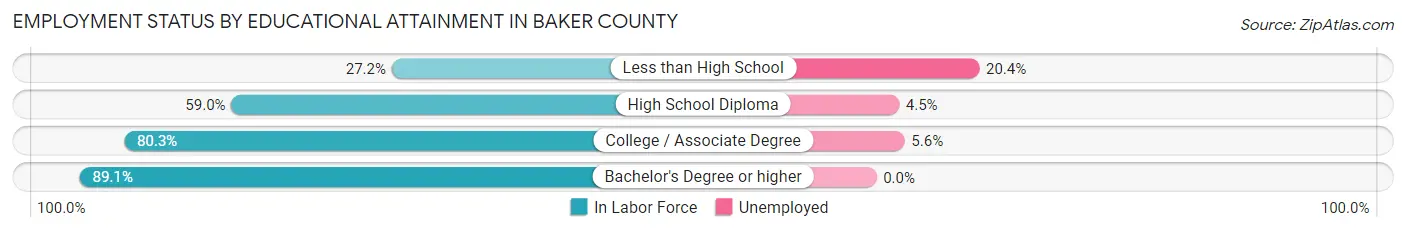
| Educational Attainment | In Labor Force | Unemployed |
| Less than High School | 638 (27.2%) | 479 (20.4%) |
| High School Diploma | 3,428 (59.0%) | 261 (4.5%) |
| College / Associate Degree | 3,502 (80.3%) | 244 (5.6%) |
| Bachelor's Degree or higher | 1,905 (89.1%) | 0 (0.0%) |
| Total | 9,483 (64.7%) | 748 (5.1%) |
Employment Occupations by Sex in Baker County
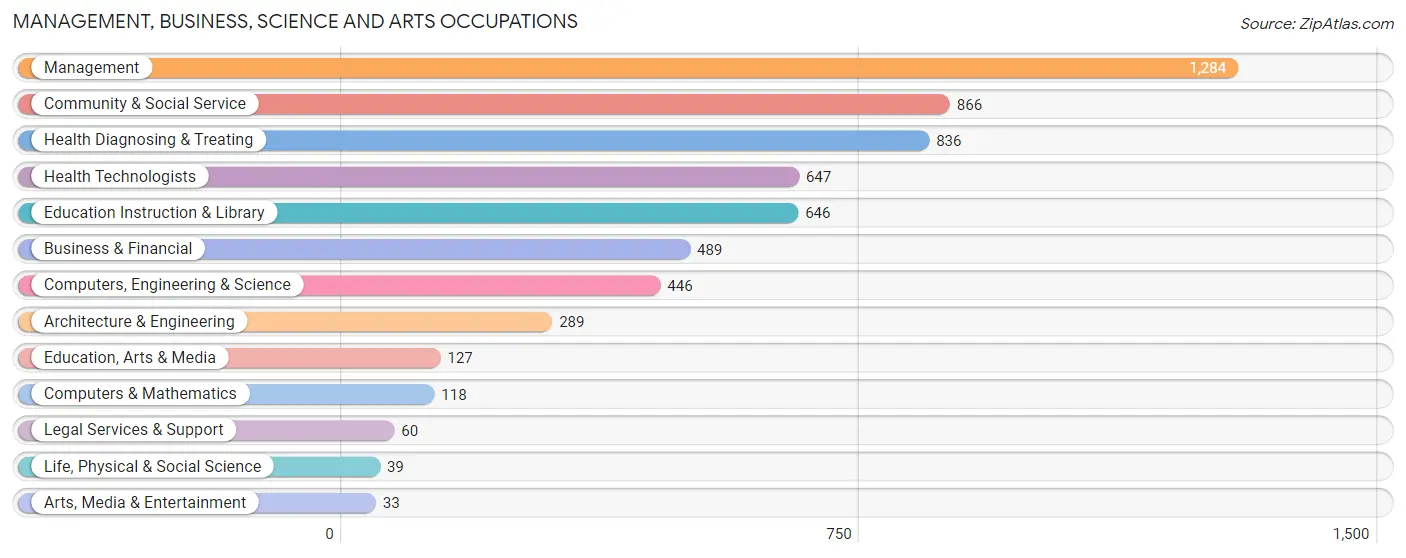
Management, Business, Science and Arts Occupations
The most common Management, Business, Science and Arts occupations in Baker County are Management (1,284 | 11.2%), Community & Social Service (866 | 7.5%), Health Diagnosing & Treating (836 | 7.3%), Health Technologists (647 | 5.6%), and Education Instruction & Library (646 | 5.6%).
Management, Business, Science and Arts Occupations by Sex
Within the Management, Business, Science and Arts occupations in Baker County, the most male-oriented occupations are Architecture & Engineering (97.6%), Computers, Engineering & Science (82.1%), and Arts, Media & Entertainment (69.7%), while the most female-oriented occupations are Education, Arts & Media (100.0%), Health Technologists (89.0%), and Health Diagnosing & Treating (82.5%).
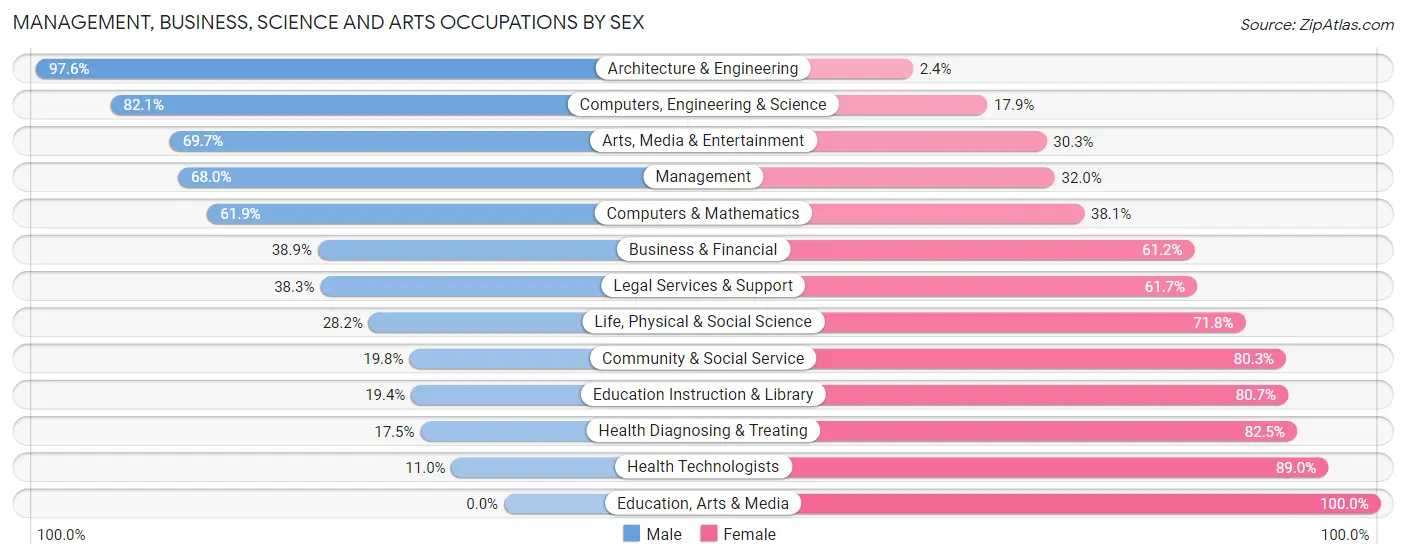
| Occupation | Male | Female |
| Management | 873 (68.0%) | 411 (32.0%) |
| Business & Financial | 190 (38.9%) | 299 (61.2%) |
| Computers, Engineering & Science | 366 (82.1%) | 80 (17.9%) |
| Computers & Mathematics | 73 (61.9%) | 45 (38.1%) |
| Architecture & Engineering | 282 (97.6%) | 7 (2.4%) |
| Life, Physical & Social Science | 11 (28.2%) | 28 (71.8%) |
| Community & Social Service | 171 (19.8%) | 695 (80.2%) |
| Education, Arts & Media | 0 (0.0%) | 127 (100.0%) |
| Legal Services & Support | 23 (38.3%) | 37 (61.7%) |
| Education Instruction & Library | 125 (19.4%) | 521 (80.6%) |
| Arts, Media & Entertainment | 23 (69.7%) | 10 (30.3%) |
| Health Diagnosing & Treating | 146 (17.5%) | 690 (82.5%) |
| Health Technologists | 71 (11.0%) | 576 (89.0%) |
| Total (Category) | 1,746 (44.5%) | 2,175 (55.5%) |
| Total (Overall) | 5,959 (51.8%) | 5,550 (48.2%) |
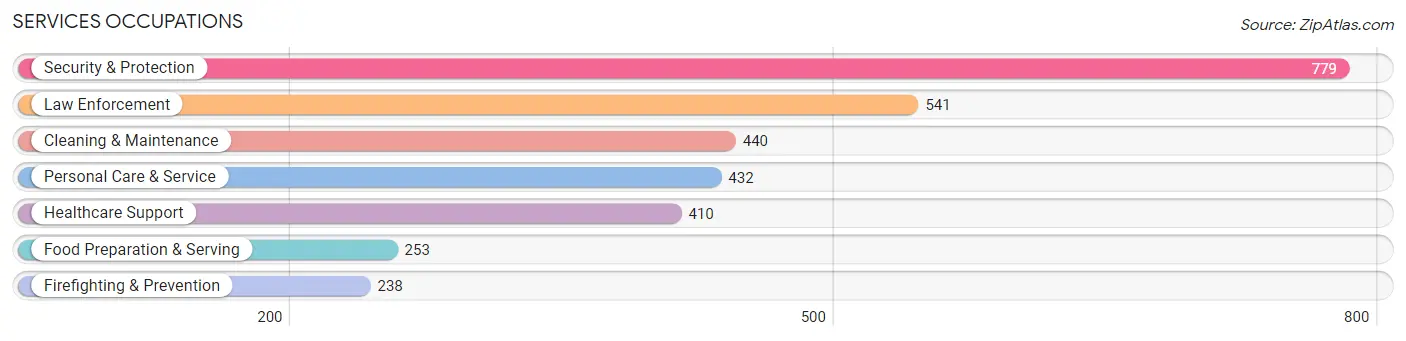
Services Occupations
The most common Services occupations in Baker County are Security & Protection (779 | 6.8%), Law Enforcement (541 | 4.7%), Cleaning & Maintenance (440 | 3.8%), Personal Care & Service (432 | 3.7%), and Healthcare Support (410 | 3.6%).
Services Occupations by Sex
Within the Services occupations in Baker County, the most male-oriented occupations are Firefighting & Prevention (93.7%), Security & Protection (68.5%), and Cleaning & Maintenance (59.1%), while the most female-oriented occupations are Personal Care & Service (100.0%), Healthcare Support (95.9%), and Food Preparation & Serving (54.5%).
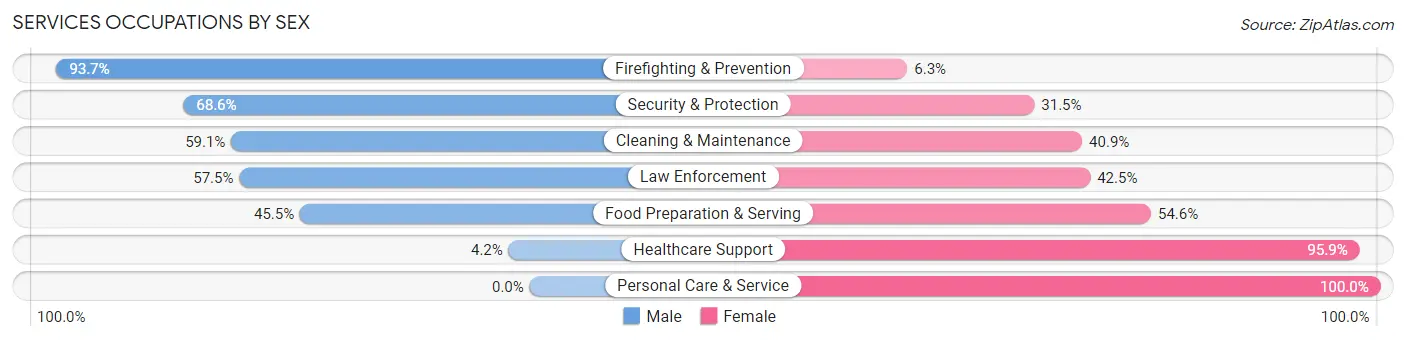
| Occupation | Male | Female |
| Healthcare Support | 17 (4.2%) | 393 (95.9%) |
| Security & Protection | 534 (68.5%) | 245 (31.5%) |
| Firefighting & Prevention | 223 (93.7%) | 15 (6.3%) |
| Law Enforcement | 311 (57.5%) | 230 (42.5%) |
| Food Preparation & Serving | 115 (45.5%) | 138 (54.5%) |
| Cleaning & Maintenance | 260 (59.1%) | 180 (40.9%) |
| Personal Care & Service | 0 (0.0%) | 432 (100.0%) |
| Total (Category) | 926 (40.0%) | 1,388 (60.0%) |
| Total (Overall) | 5,959 (51.8%) | 5,550 (48.2%) |
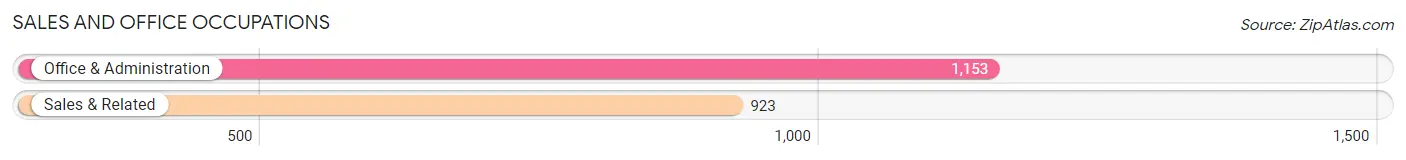
Sales and Office Occupations
The most common Sales and Office occupations in Baker County are Office & Administration (1,153 | 10.0%), and Sales & Related (923 | 8.0%).
Sales and Office Occupations by Sex
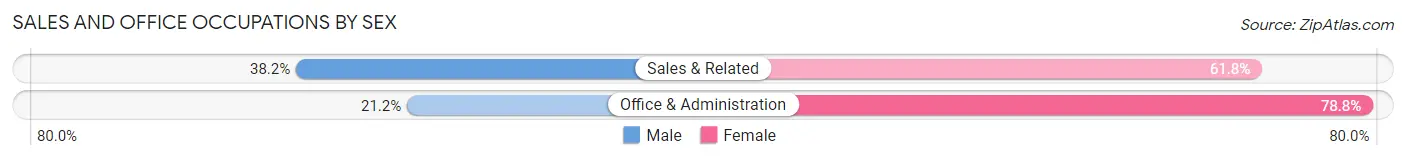
| Occupation | Male | Female |
| Sales & Related | 353 (38.2%) | 570 (61.8%) |
| Office & Administration | 244 (21.2%) | 909 (78.8%) |
| Total (Category) | 597 (28.8%) | 1,479 (71.2%) |
| Total (Overall) | 5,959 (51.8%) | 5,550 (48.2%) |
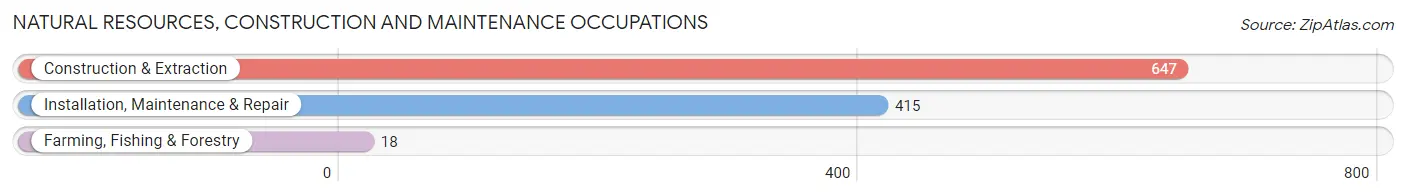
Natural Resources, Construction and Maintenance Occupations
The most common Natural Resources, Construction and Maintenance occupations in Baker County are Construction & Extraction (647 | 5.6%), Installation, Maintenance & Repair (415 | 3.6%), and Farming, Fishing & Forestry (18 | 0.2%).
Natural Resources, Construction and Maintenance Occupations by Sex
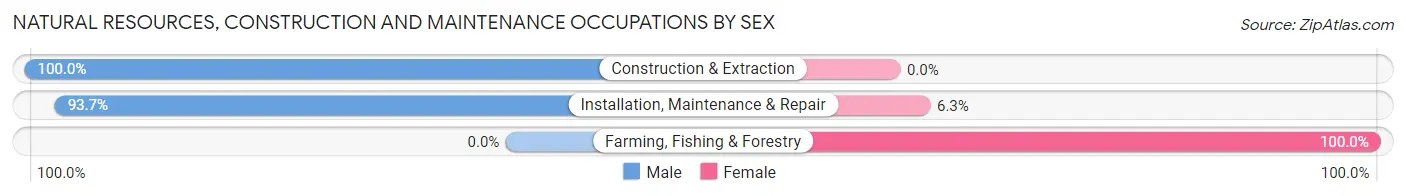
| Occupation | Male | Female |
| Farming, Fishing & Forestry | 0 (0.0%) | 18 (100.0%) |
| Construction & Extraction | 647 (100.0%) | 0 (0.0%) |
| Installation, Maintenance & Repair | 389 (93.7%) | 26 (6.3%) |
| Total (Category) | 1,036 (95.9%) | 44 (4.1%) |
| Total (Overall) | 5,959 (51.8%) | 5,550 (48.2%) |
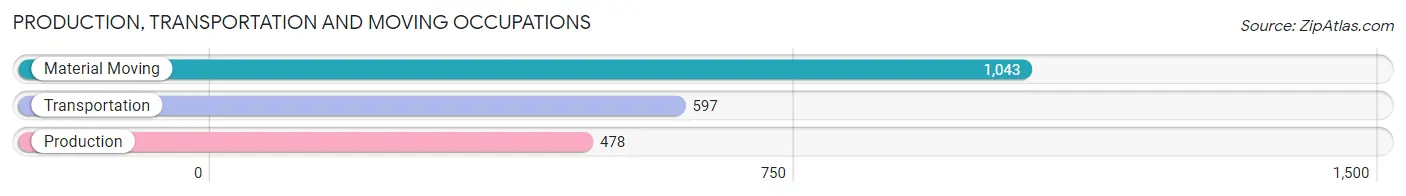
Production, Transportation and Moving Occupations
The most common Production, Transportation and Moving occupations in Baker County are Material Moving (1,043 | 9.1%), Transportation (597 | 5.2%), and Production (478 | 4.2%).
Production, Transportation and Moving Occupations by Sex
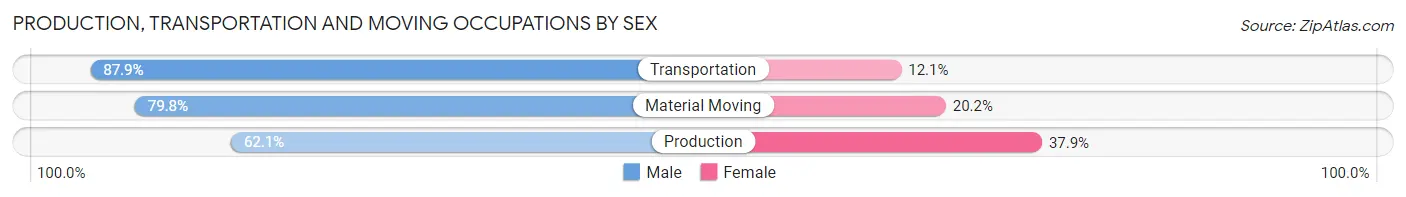
| Occupation | Male | Female |
| Production | 297 (62.1%) | 181 (37.9%) |
| Transportation | 525 (87.9%) | 72 (12.1%) |
| Material Moving | 832 (79.8%) | 211 (20.2%) |
| Total (Category) | 1,654 (78.1%) | 464 (21.9%) |
| Total (Overall) | 5,959 (51.8%) | 5,550 (48.2%) |
Employment Industries by Sex in Baker County
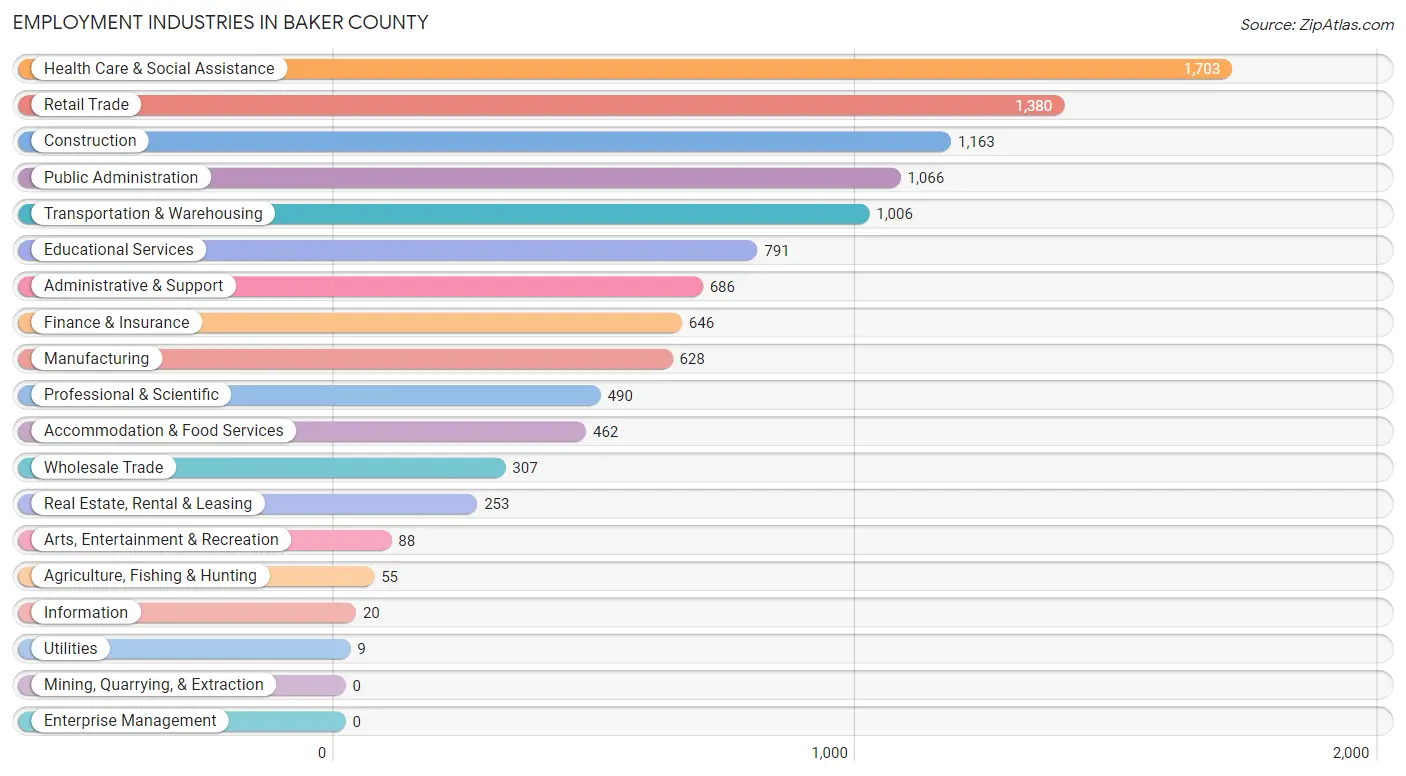
Employment Industries in Baker County
The major employment industries in Baker County include Health Care & Social Assistance (1,703 | 14.8%), Retail Trade (1,380 | 12.0%), Construction (1,163 | 10.1%), Public Administration (1,066 | 9.3%), and Transportation & Warehousing (1,006 | 8.7%).
Employment Industries by Sex in Baker County
The Baker County industries that see more men than women are Utilities (100.0%), Information (100.0%), and Construction (92.6%), whereas the industries that tend to have a higher number of women are Educational Services (81.5%), Health Care & Social Assistance (77.0%), and Finance & Insurance (69.2%).
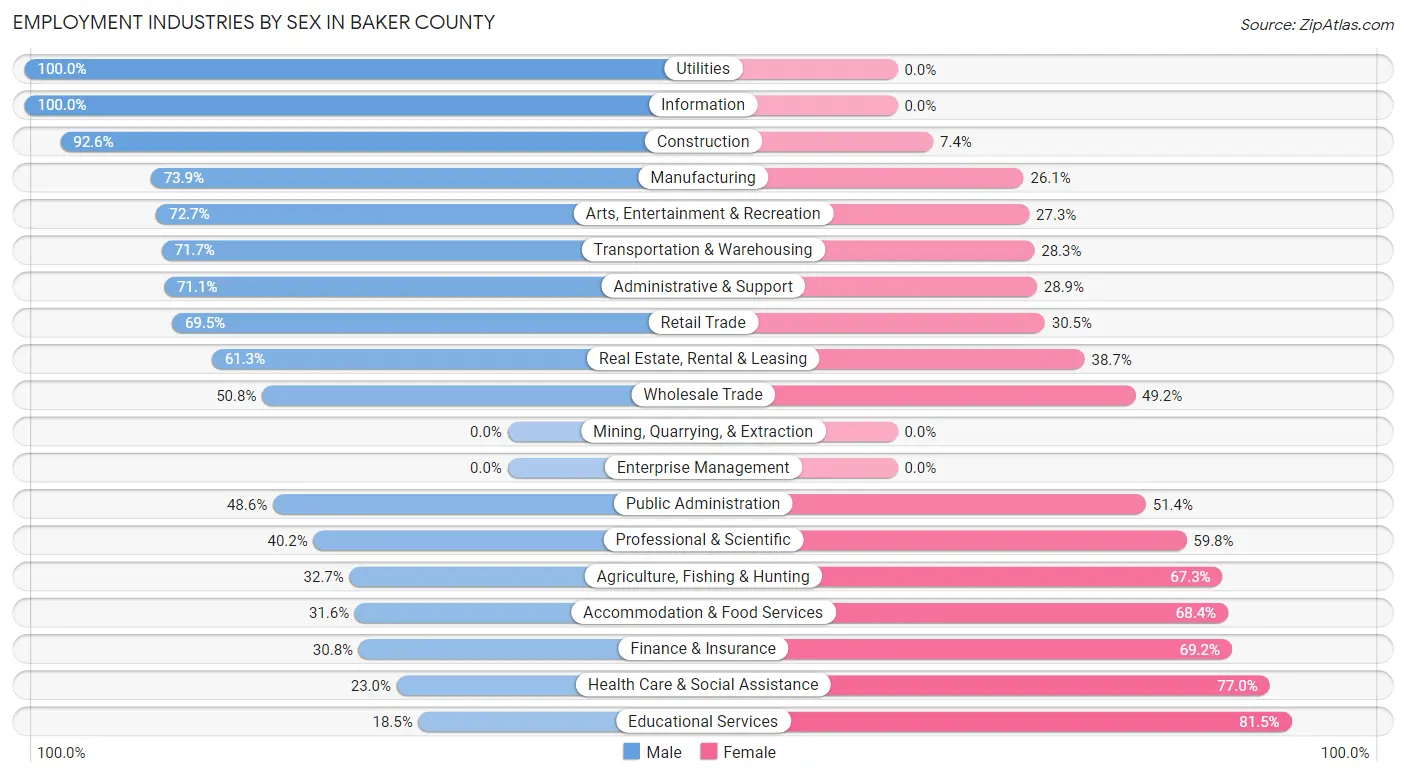
| Industry | Male | Female |
| Agriculture, Fishing & Hunting | 18 (32.7%) | 37 (67.3%) |
| Mining, Quarrying, & Extraction | 0 (0.0%) | 0 (0.0%) |
| Construction | 1,077 (92.6%) | 86 (7.4%) |
| Manufacturing | 464 (73.9%) | 164 (26.1%) |
| Wholesale Trade | 156 (50.8%) | 151 (49.2%) |
| Retail Trade | 959 (69.5%) | 421 (30.5%) |
| Transportation & Warehousing | 721 (71.7%) | 285 (28.3%) |
| Utilities | 9 (100.0%) | 0 (0.0%) |
| Information | 20 (100.0%) | 0 (0.0%) |
| Finance & Insurance | 199 (30.8%) | 447 (69.2%) |
| Real Estate, Rental & Leasing | 155 (61.3%) | 98 (38.7%) |
| Professional & Scientific | 197 (40.2%) | 293 (59.8%) |
| Enterprise Management | 0 (0.0%) | 0 (0.0%) |
| Administrative & Support | 488 (71.1%) | 198 (28.9%) |
| Educational Services | 146 (18.5%) | 645 (81.5%) |
| Health Care & Social Assistance | 391 (23.0%) | 1,312 (77.0%) |
| Arts, Entertainment & Recreation | 64 (72.7%) | 24 (27.3%) |
| Accommodation & Food Services | 146 (31.6%) | 316 (68.4%) |
| Public Administration | 518 (48.6%) | 548 (51.4%) |
| Total | 5,959 (51.8%) | 5,550 (48.2%) |
Education in Baker County
School Enrollment in Baker County
The most common levels of schooling among the 6,777 students in Baker County are high school (1,675 | 24.7%), elementary school (1,503 | 22.2%), and middle school (1,399 | 20.6%).
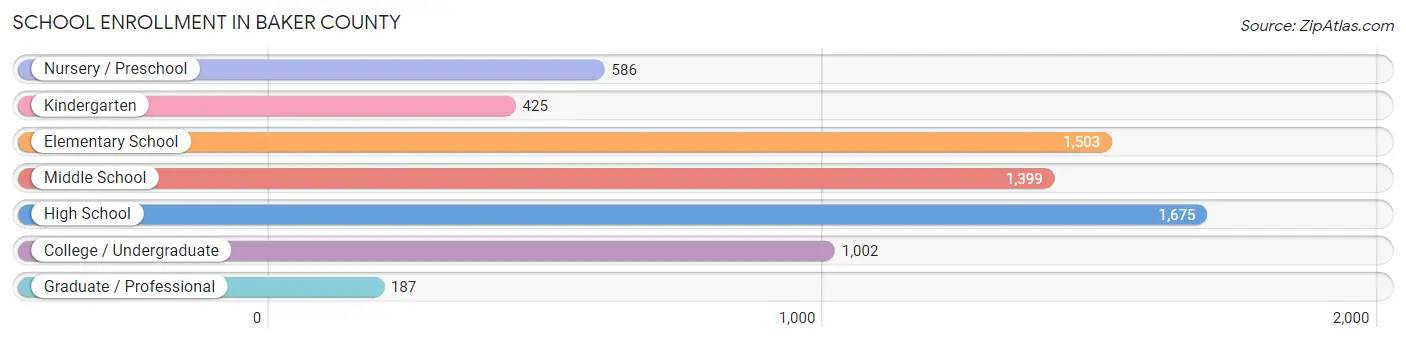
| School Level | # Students | % Students |
| Nursery / Preschool | 586 | 8.6% |
| Kindergarten | 425 | 6.3% |
| Elementary School | 1,503 | 22.2% |
| Middle School | 1,399 | 20.6% |
| High School | 1,675 | 24.7% |
| College / Undergraduate | 1,002 | 14.8% |
| Graduate / Professional | 187 | 2.8% |
| Total | 6,777 | 100.0% |
School Enrollment by Age by Funding Source in Baker County
Out of a total of 6,777 students who are enrolled in schools in Baker County, 1,071 (15.8%) attend a private institution, while the remaining 5,706 (84.2%) are enrolled in public schools. The age group of 25 to 34 year olds has the highest likelihood of being enrolled in private schools, with 151 (34.4% in the age bracket) enrolled. Conversely, the age group of 15 to 17 year olds has the lowest likelihood of being enrolled in a private school, with 1,055 (95.6% in the age bracket) attending a public institution.
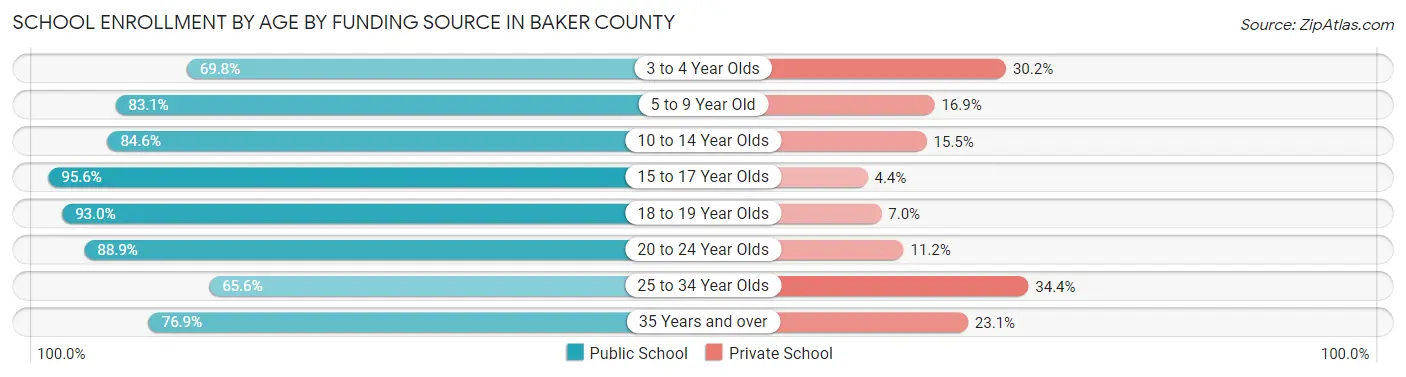
| Age Bracket | Public School | Private School |
| 3 to 4 Year Olds | 300 (69.8%) | 130 (30.2%) |
| 5 to 9 Year Old | 1,453 (83.1%) | 296 (16.9%) |
| 10 to 14 Year Olds | 1,675 (84.6%) | 306 (15.4%) |
| 15 to 17 Year Olds | 1,055 (95.6%) | 49 (4.4%) |
| 18 to 19 Year Olds | 265 (93.0%) | 20 (7.0%) |
| 20 to 24 Year Olds | 486 (88.8%) | 61 (11.2%) |
| 25 to 34 Year Olds | 288 (65.6%) | 151 (34.4%) |
| 35 Years and over | 186 (76.9%) | 56 (23.1%) |
| Total | 5,706 (84.2%) | 1,071 (15.8%) |
Educational Attainment by Field of Study in Baker County
Education (572 | 21.0%), business (542 | 19.9%), science & technology (348 | 12.8%), engineering (333 | 12.2%), and bio, nature & agricultural (204 | 7.5%) are the most common fields of study among 2,726 individuals in Baker County who have obtained a bachelor's degree or higher.
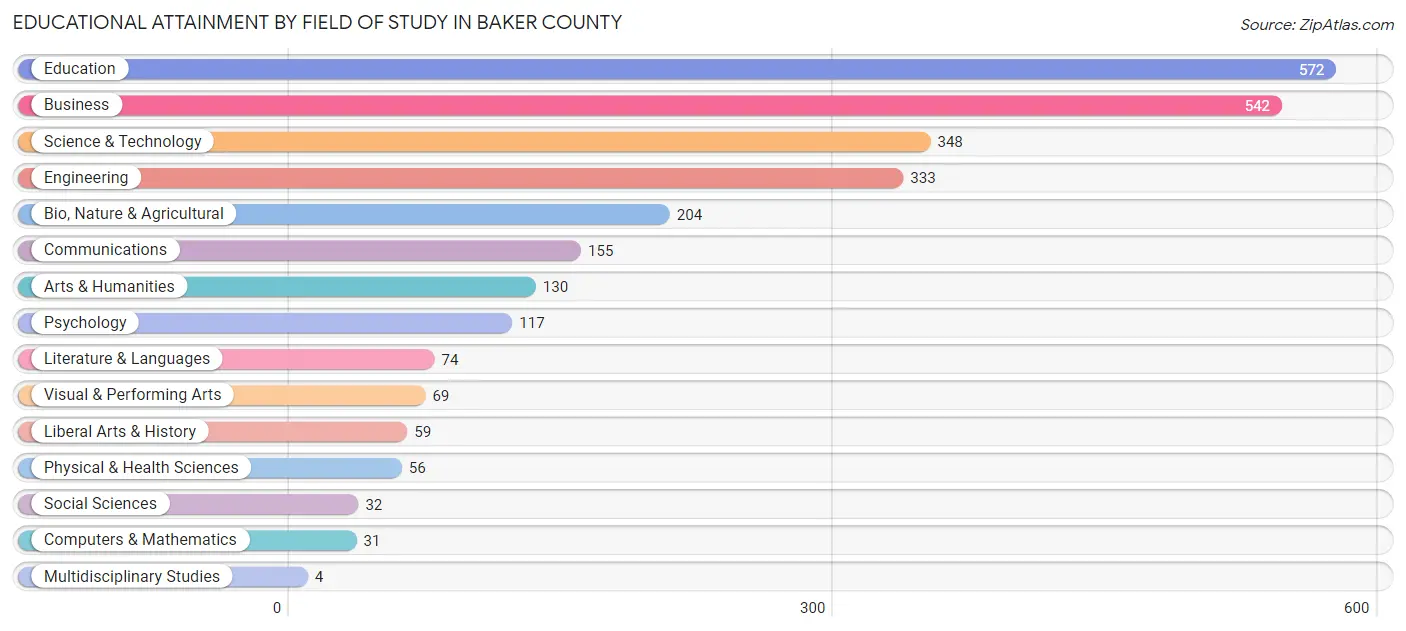
| Field of Study | # Graduates | % Graduates |
| Computers & Mathematics | 31 | 1.1% |
| Bio, Nature & Agricultural | 204 | 7.5% |
| Physical & Health Sciences | 56 | 2.1% |
| Psychology | 117 | 4.3% |
| Social Sciences | 32 | 1.2% |
| Engineering | 333 | 12.2% |
| Multidisciplinary Studies | 4 | 0.2% |
| Science & Technology | 348 | 12.8% |
| Business | 542 | 19.9% |
| Education | 572 | 21.0% |
| Literature & Languages | 74 | 2.7% |
| Liberal Arts & History | 59 | 2.2% |
| Visual & Performing Arts | 69 | 2.5% |
| Communications | 155 | 5.7% |
| Arts & Humanities | 130 | 4.8% |
| Total | 2,726 | 100.0% |
Transportation & Commute in Baker County
Vehicle Availability by Sex in Baker County
The most prevalent vehicle ownership categories in Baker County are males with 2 vehicles (2,310, accounting for 38.1%) and females with 2 vehicles (1,474, making up 44.0%).
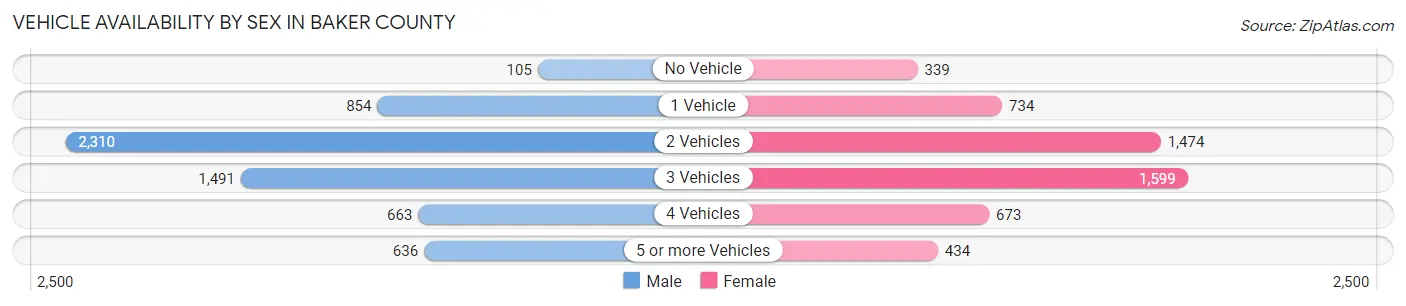
| Vehicles Available | Male | Female |
| No Vehicle | 105 (1.7%) | 339 (6.5%) |
| 1 Vehicle | 854 (14.1%) | 734 (14.0%) |
| 2 Vehicles | 2,310 (38.1%) | 1,474 (28.1%) |
| 3 Vehicles | 1,491 (24.6%) | 1,599 (30.4%) |
| 4 Vehicles | 663 (10.9%) | 673 (12.8%) |
| 5 or more Vehicles | 636 (10.5%) | 434 (8.3%) |
| Total | 6,059 (100.0%) | 5,253 (100.0%) |
Commute Time in Baker County
The most frequently occuring commute durations in Baker County are 30 to 34 minutes (1,848 commuters, 17.6%), 45 to 59 minutes (1,414 commuters, 13.5%), and 10 to 14 minutes (1,268 commuters, 12.1%).
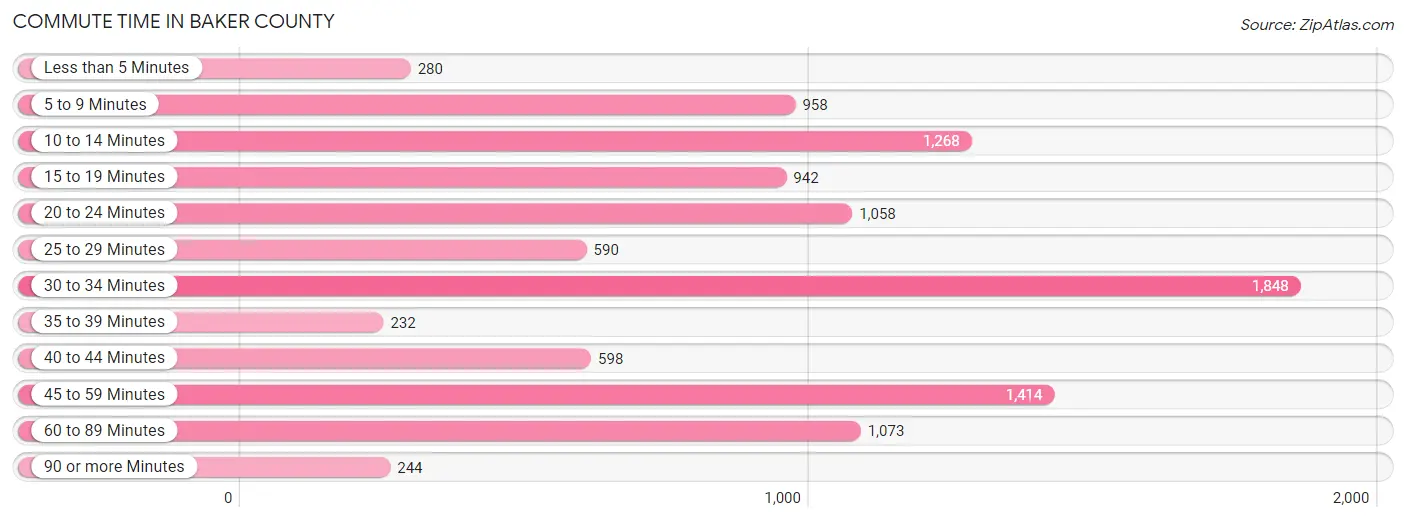
| Commute Time | # Commuters | % Commuters |
| Less than 5 Minutes | 280 | 2.7% |
| 5 to 9 Minutes | 958 | 9.1% |
| 10 to 14 Minutes | 1,268 | 12.1% |
| 15 to 19 Minutes | 942 | 9.0% |
| 20 to 24 Minutes | 1,058 | 10.1% |
| 25 to 29 Minutes | 590 | 5.6% |
| 30 to 34 Minutes | 1,848 | 17.6% |
| 35 to 39 Minutes | 232 | 2.2% |
| 40 to 44 Minutes | 598 | 5.7% |
| 45 to 59 Minutes | 1,414 | 13.5% |
| 60 to 89 Minutes | 1,073 | 10.2% |
| 90 or more Minutes | 244 | 2.3% |
Commute Time by Sex in Baker County
The most common commute times in Baker County are 30 to 34 minutes (1,171 commuters, 20.8%) for males and 20 to 24 minutes (735 commuters, 15.0%) for females.
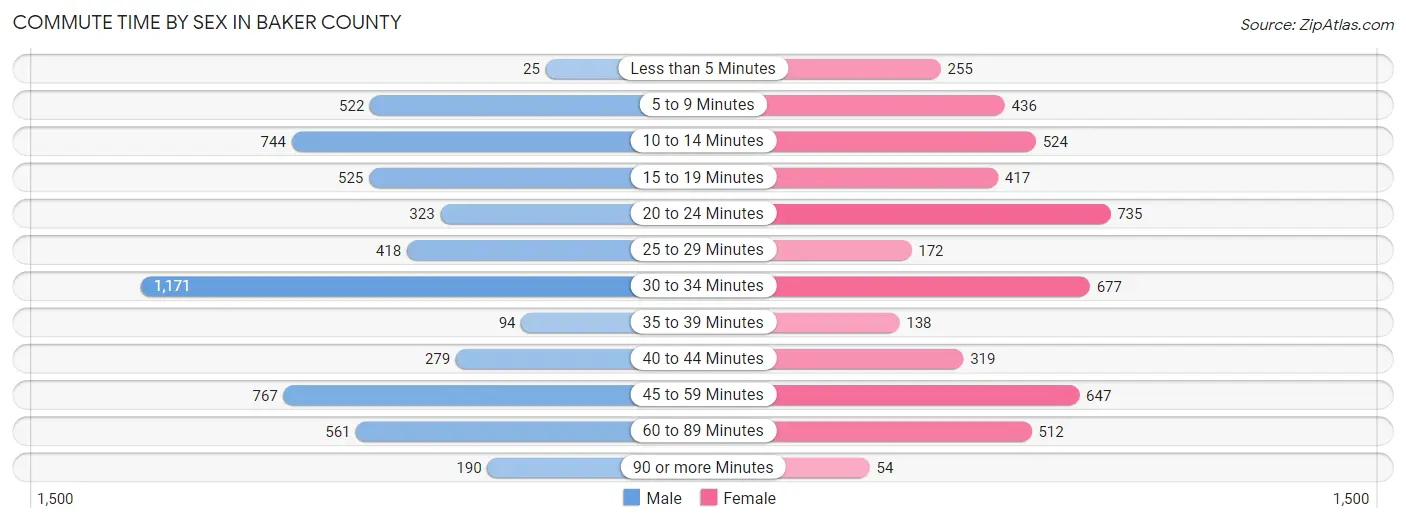
| Commute Time | Male | Female |
| Less than 5 Minutes | 25 (0.4%) | 255 (5.2%) |
| 5 to 9 Minutes | 522 (9.3%) | 436 (8.9%) |
| 10 to 14 Minutes | 744 (13.2%) | 524 (10.7%) |
| 15 to 19 Minutes | 525 (9.3%) | 417 (8.5%) |
| 20 to 24 Minutes | 323 (5.8%) | 735 (15.0%) |
| 25 to 29 Minutes | 418 (7.4%) | 172 (3.5%) |
| 30 to 34 Minutes | 1,171 (20.8%) | 677 (13.9%) |
| 35 to 39 Minutes | 94 (1.7%) | 138 (2.8%) |
| 40 to 44 Minutes | 279 (5.0%) | 319 (6.5%) |
| 45 to 59 Minutes | 767 (13.7%) | 647 (13.2%) |
| 60 to 89 Minutes | 561 (10.0%) | 512 (10.5%) |
| 90 or more Minutes | 190 (3.4%) | 54 (1.1%) |
Time of Departure to Work by Sex in Baker County
The most frequent times of departure to work in Baker County are 12:00 AM to 4:59 AM (998, 17.8%) for males and 6:30 AM to 6:59 AM (972, 19.9%) for females.
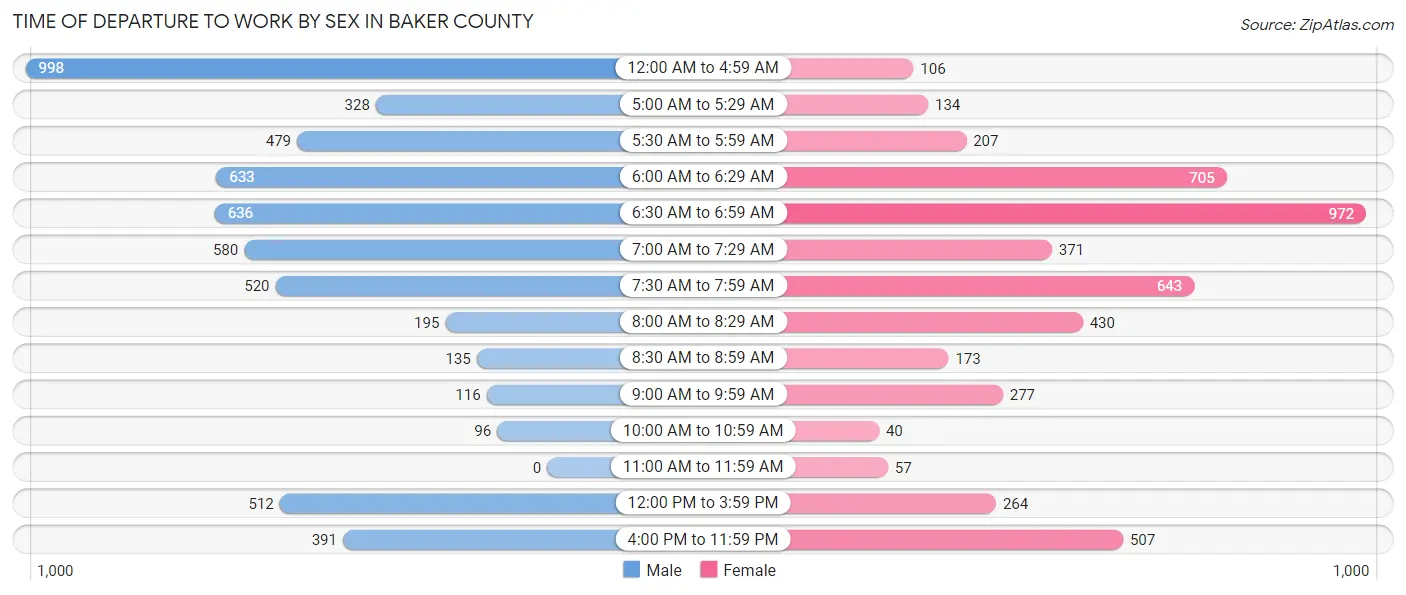
| Time of Departure | Male | Female |
| 12:00 AM to 4:59 AM | 998 (17.8%) | 106 (2.2%) |
| 5:00 AM to 5:29 AM | 328 (5.8%) | 134 (2.7%) |
| 5:30 AM to 5:59 AM | 479 (8.5%) | 207 (4.2%) |
| 6:00 AM to 6:29 AM | 633 (11.3%) | 705 (14.4%) |
| 6:30 AM to 6:59 AM | 636 (11.3%) | 972 (19.9%) |
| 7:00 AM to 7:29 AM | 580 (10.3%) | 371 (7.6%) |
| 7:30 AM to 7:59 AM | 520 (9.2%) | 643 (13.2%) |
| 8:00 AM to 8:29 AM | 195 (3.5%) | 430 (8.8%) |
| 8:30 AM to 8:59 AM | 135 (2.4%) | 173 (3.5%) |
| 9:00 AM to 9:59 AM | 116 (2.1%) | 277 (5.7%) |
| 10:00 AM to 10:59 AM | 96 (1.7%) | 40 (0.8%) |
| 11:00 AM to 11:59 AM | 0 (0.0%) | 57 (1.2%) |
| 12:00 PM to 3:59 PM | 512 (9.1%) | 264 (5.4%) |
| 4:00 PM to 11:59 PM | 391 (7.0%) | 507 (10.4%) |
| Total | 5,619 (100.0%) | 4,886 (100.0%) |
Housing Occupancy in Baker County
Occupancy by Ownership in Baker County
Of the total 9,004 dwellings in Baker County, owner-occupied units account for 7,186 (79.8%), while renter-occupied units make up 1,818 (20.2%).
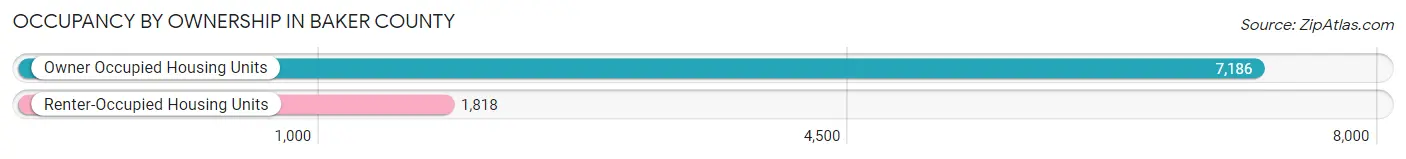
| Occupancy | # Housing Units | % Housing Units |
| Owner Occupied Housing Units | 7,186 | 79.8% |
| Renter-Occupied Housing Units | 1,818 | 20.2% |
| Total Occupied Housing Units | 9,004 | 100.0% |
Occupancy by Household Size in Baker County
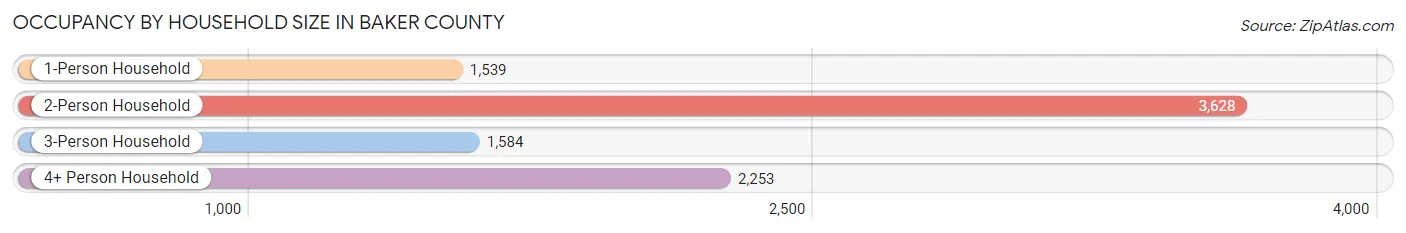
| Household Size | # Housing Units | % Housing Units |
| 1-Person Household | 1,539 | 17.1% |
| 2-Person Household | 3,628 | 40.3% |
| 3-Person Household | 1,584 | 17.6% |
| 4+ Person Household | 2,253 | 25.0% |
| Total Housing Units | 9,004 | 100.0% |
Occupancy by Ownership by Household Size in Baker County
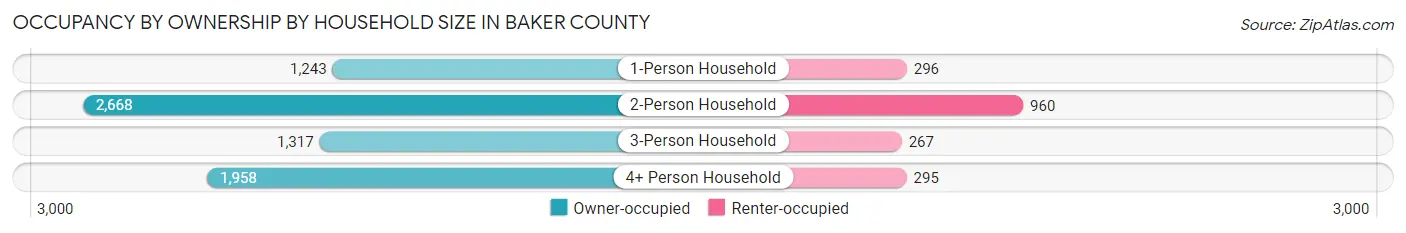
| Household Size | Owner-occupied | Renter-occupied |
| 1-Person Household | 1,243 (80.8%) | 296 (19.2%) |
| 2-Person Household | 2,668 (73.5%) | 960 (26.5%) |
| 3-Person Household | 1,317 (83.1%) | 267 (16.9%) |
| 4+ Person Household | 1,958 (86.9%) | 295 (13.1%) |
| Total Housing Units | 7,186 (79.8%) | 1,818 (20.2%) |
Occupancy by Educational Attainment in Baker County
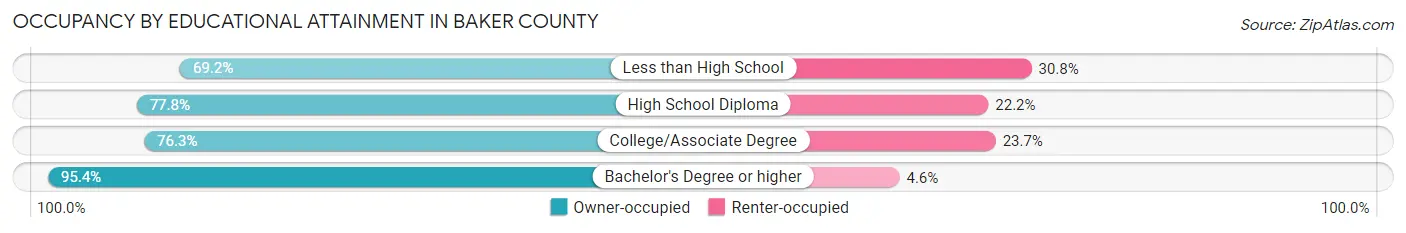
| Household Size | Owner-occupied | Renter-occupied |
| Less than High School | 575 (69.2%) | 256 (30.8%) |
| High School Diploma | 2,658 (77.8%) | 760 (22.2%) |
| College/Associate Degree | 2,327 (76.3%) | 723 (23.7%) |
| Bachelor's Degree or higher | 1,626 (95.4%) | 79 (4.6%) |
Occupancy by Age of Householder in Baker County
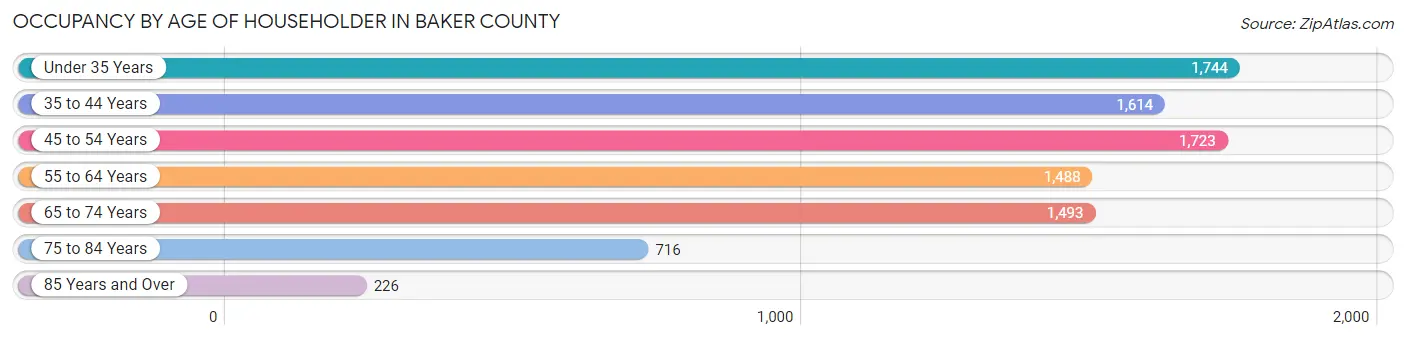
| Age Bracket | # Households | % Households |
| Under 35 Years | 1,744 | 19.4% |
| 35 to 44 Years | 1,614 | 17.9% |
| 45 to 54 Years | 1,723 | 19.1% |
| 55 to 64 Years | 1,488 | 16.5% |
| 65 to 74 Years | 1,493 | 16.6% |
| 75 to 84 Years | 716 | 8.0% |
| 85 Years and Over | 226 | 2.5% |
| Total | 9,004 | 100.0% |
Housing Finances in Baker County
Median Income by Occupancy in Baker County
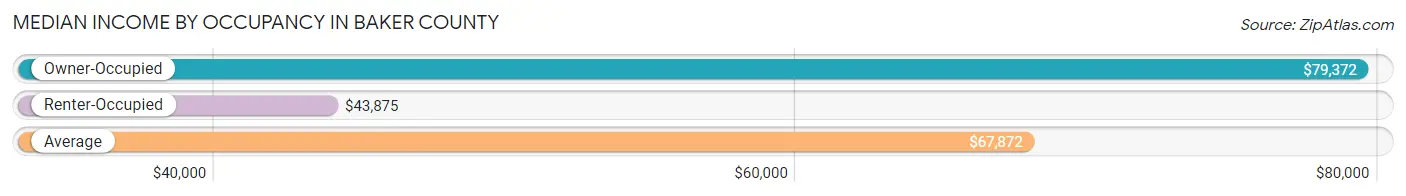
| Occupancy Type | # Households | Median Income |
| Owner-Occupied | 7,186 (79.8%) | $79,372 |
| Renter-Occupied | 1,818 (20.2%) | $43,875 |
| Average | 9,004 (100.0%) | $67,872 |
Occupancy by Householder Income Bracket in Baker County
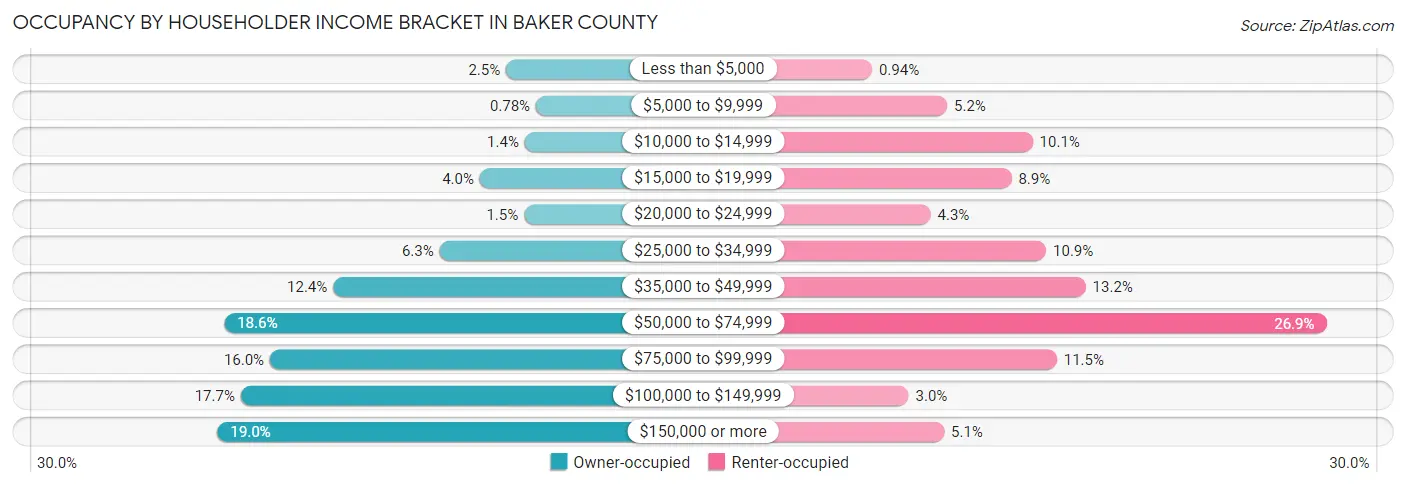
| Income Bracket | Owner-occupied | Renter-occupied |
| Less than $5,000 | 179 (2.5%) | 17 (0.9%) |
| $5,000 to $9,999 | 56 (0.8%) | 95 (5.2%) |
| $10,000 to $14,999 | 102 (1.4%) | 184 (10.1%) |
| $15,000 to $19,999 | 287 (4.0%) | 162 (8.9%) |
| $20,000 to $24,999 | 105 (1.5%) | 78 (4.3%) |
| $25,000 to $34,999 | 452 (6.3%) | 198 (10.9%) |
| $35,000 to $49,999 | 889 (12.4%) | 239 (13.2%) |
| $50,000 to $74,999 | 1,336 (18.6%) | 489 (26.9%) |
| $75,000 to $99,999 | 1,148 (16.0%) | 209 (11.5%) |
| $100,000 to $149,999 | 1,268 (17.6%) | 55 (3.0%) |
| $150,000 or more | 1,364 (19.0%) | 92 (5.1%) |
| Total | 7,186 (100.0%) | 1,818 (100.0%) |
Monthly Housing Cost Tiers in Baker County
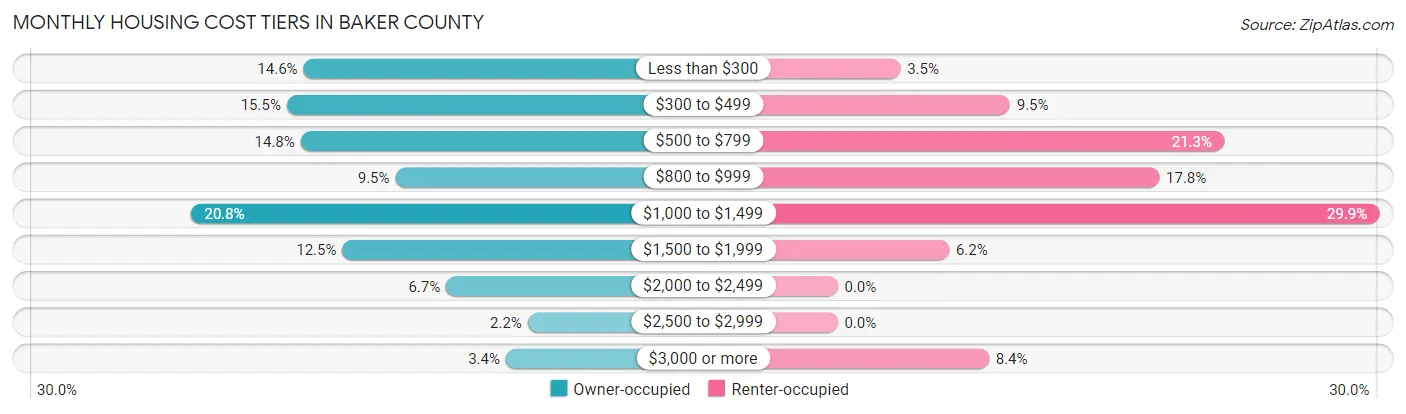
| Monthly Cost | Owner-occupied | Renter-occupied |
| Less than $300 | 1,049 (14.6%) | 63 (3.5%) |
| $300 to $499 | 1,115 (15.5%) | 173 (9.5%) |
| $500 to $799 | 1,061 (14.8%) | 388 (21.3%) |
| $800 to $999 | 684 (9.5%) | 323 (17.8%) |
| $1,000 to $1,499 | 1,494 (20.8%) | 544 (29.9%) |
| $1,500 to $1,999 | 895 (12.4%) | 112 (6.2%) |
| $2,000 to $2,499 | 483 (6.7%) | 0 (0.0%) |
| $2,500 to $2,999 | 159 (2.2%) | 0 (0.0%) |
| $3,000 or more | 246 (3.4%) | 152 (8.4%) |
| Total | 7,186 (100.0%) | 1,818 (100.0%) |
Physical Housing Characteristics in Baker County
Housing Structures in Baker County
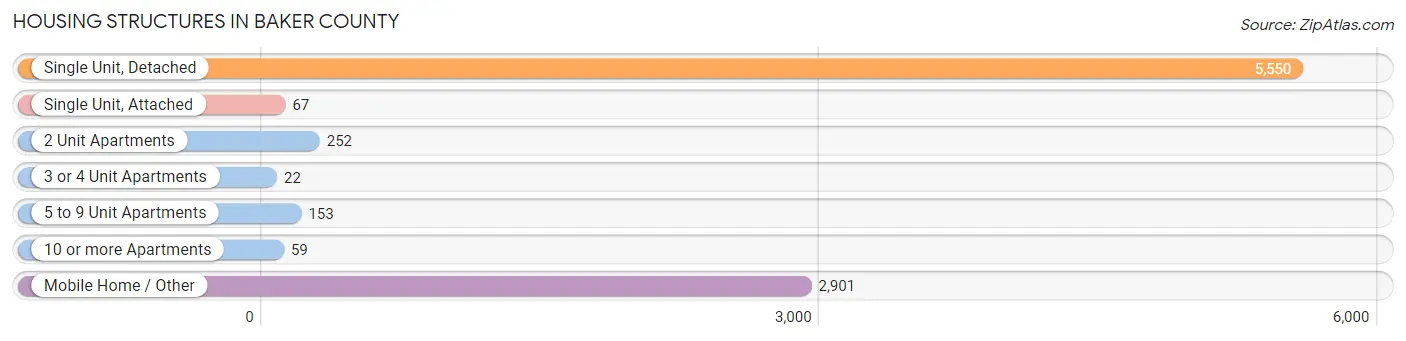
| Structure Type | # Housing Units | % Housing Units |
| Single Unit, Detached | 5,550 | 61.6% |
| Single Unit, Attached | 67 | 0.7% |
| 2 Unit Apartments | 252 | 2.8% |
| 3 or 4 Unit Apartments | 22 | 0.2% |
| 5 to 9 Unit Apartments | 153 | 1.7% |
| 10 or more Apartments | 59 | 0.7% |
| Mobile Home / Other | 2,901 | 32.2% |
| Total | 9,004 | 100.0% |
Housing Structures by Occupancy in Baker County
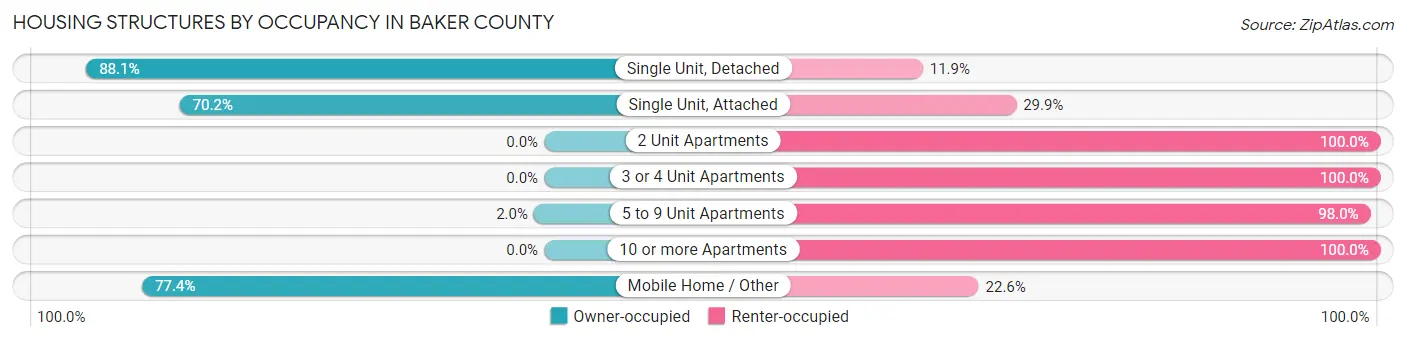
| Structure Type | Owner-occupied | Renter-occupied |
| Single Unit, Detached | 4,891 (88.1%) | 659 (11.9%) |
| Single Unit, Attached | 47 (70.2%) | 20 (29.8%) |
| 2 Unit Apartments | 0 (0.0%) | 252 (100.0%) |
| 3 or 4 Unit Apartments | 0 (0.0%) | 22 (100.0%) |
| 5 to 9 Unit Apartments | 3 (2.0%) | 150 (98.0%) |
| 10 or more Apartments | 0 (0.0%) | 59 (100.0%) |
| Mobile Home / Other | 2,245 (77.4%) | 656 (22.6%) |
| Total | 7,186 (79.8%) | 1,818 (20.2%) |
Housing Structures by Number of Rooms in Baker County
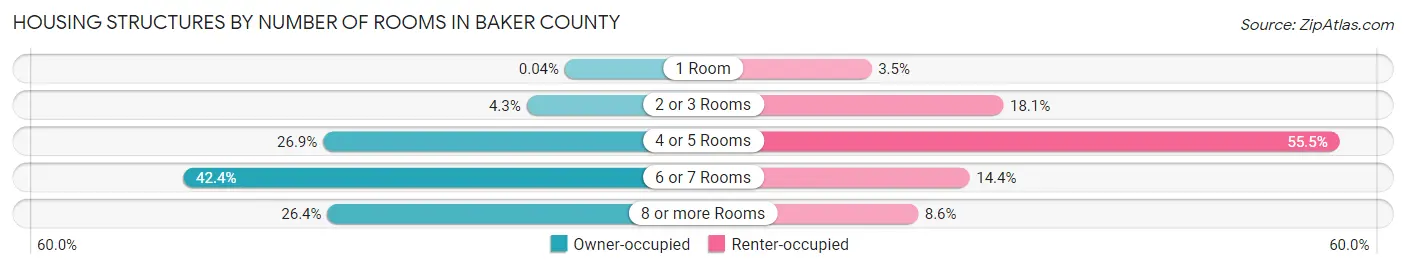
| Number of Rooms | Owner-occupied | Renter-occupied |
| 1 Room | 3 (0.0%) | 63 (3.5%) |
| 2 or 3 Rooms | 308 (4.3%) | 329 (18.1%) |
| 4 or 5 Rooms | 1,931 (26.9%) | 1,008 (55.4%) |
| 6 or 7 Rooms | 3,047 (42.4%) | 261 (14.4%) |
| 8 or more Rooms | 1,897 (26.4%) | 157 (8.6%) |
| Total | 7,186 (100.0%) | 1,818 (100.0%) |
Housing Structure by Heating Type in Baker County
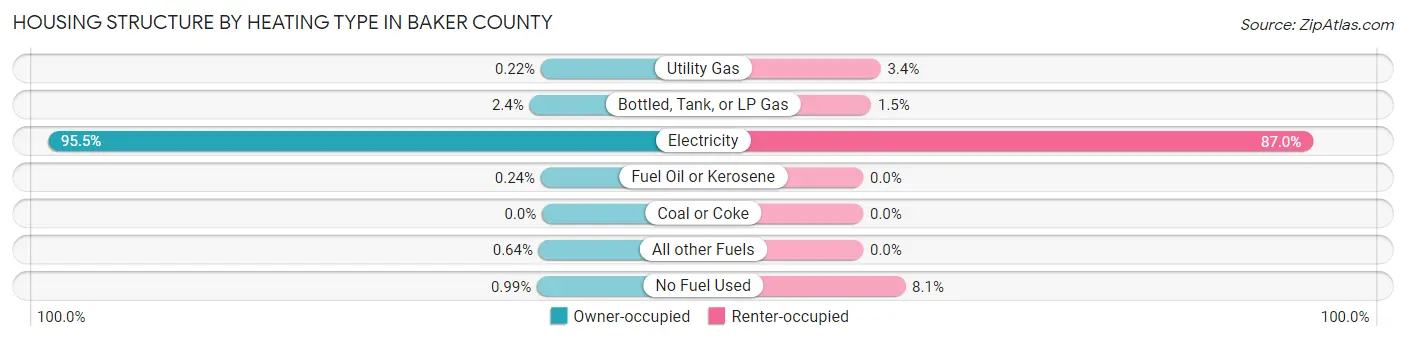
| Heating Type | Owner-occupied | Renter-occupied |
| Utility Gas | 16 (0.2%) | 61 (3.4%) |
| Bottled, Tank, or LP Gas | 174 (2.4%) | 28 (1.5%) |
| Electricity | 6,862 (95.5%) | 1,581 (87.0%) |
| Fuel Oil or Kerosene | 17 (0.2%) | 0 (0.0%) |
| Coal or Coke | 0 (0.0%) | 0 (0.0%) |
| All other Fuels | 46 (0.6%) | 0 (0.0%) |
| No Fuel Used | 71 (1.0%) | 148 (8.1%) |
| Total | 7,186 (100.0%) | 1,818 (100.0%) |
Household Vehicle Usage in Baker County
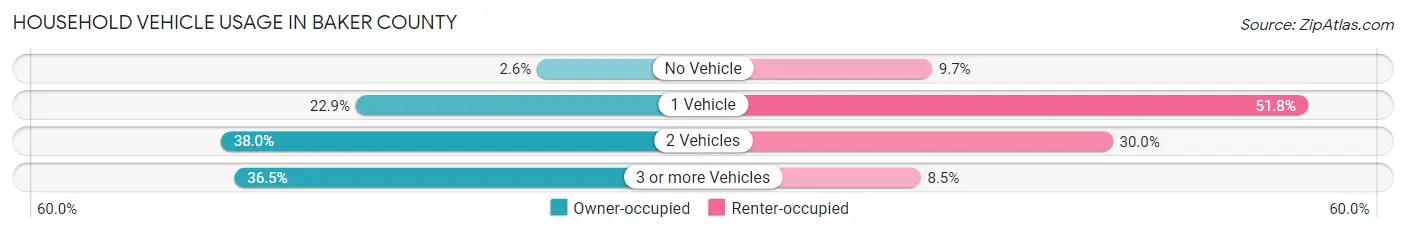
| Vehicles per Household | Owner-occupied | Renter-occupied |
| No Vehicle | 186 (2.6%) | 177 (9.7%) |
| 1 Vehicle | 1,645 (22.9%) | 942 (51.8%) |
| 2 Vehicles | 2,732 (38.0%) | 545 (30.0%) |
| 3 or more Vehicles | 2,623 (36.5%) | 154 (8.5%) |
| Total | 7,186 (100.0%) | 1,818 (100.0%) |
Real Estate & Mortgages in Baker County
Real Estate and Mortgage Overview in Baker County
| Characteristic | Without Mortgage | With Mortgage |
| Housing Units | 3,182 | 4,004 |
| Median Property Value | $169,400 | $218,800 |
| Median Household Income | $59,602 | $995 |
| Monthly Housing Costs | $375 | $193 |
| Real Estate Taxes | $972 | $77 |
Property Value by Mortgage Status in Baker County
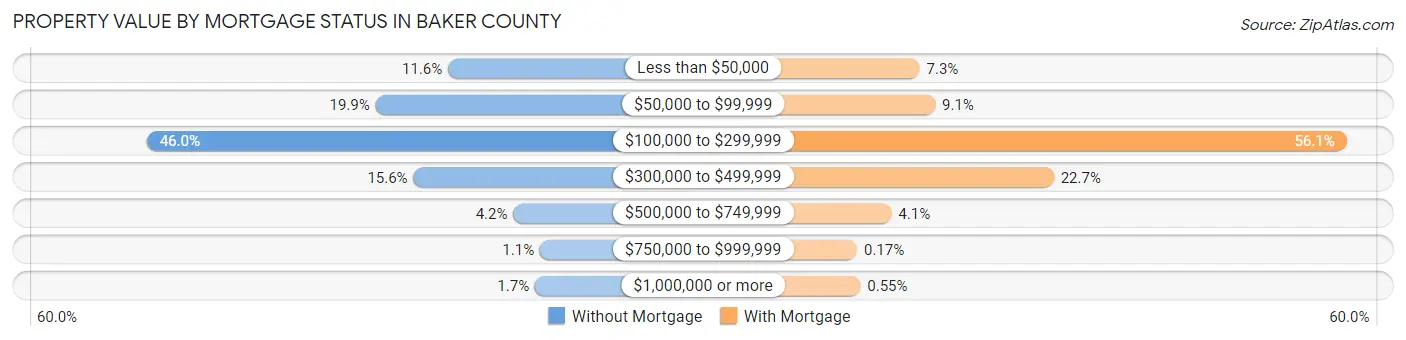
| Property Value | Without Mortgage | With Mortgage |
| Less than $50,000 | 369 (11.6%) | 293 (7.3%) |
| $50,000 to $99,999 | 633 (19.9%) | 364 (9.1%) |
| $100,000 to $299,999 | 1,465 (46.0%) | 2,247 (56.1%) |
| $300,000 to $499,999 | 495 (15.6%) | 907 (22.7%) |
| $500,000 to $749,999 | 132 (4.2%) | 164 (4.1%) |
| $750,000 to $999,999 | 35 (1.1%) | 7 (0.2%) |
| $1,000,000 or more | 53 (1.7%) | 22 (0.5%) |
| Total | 3,182 (100.0%) | 4,004 (100.0%) |
Household Income by Mortgage Status in Baker County
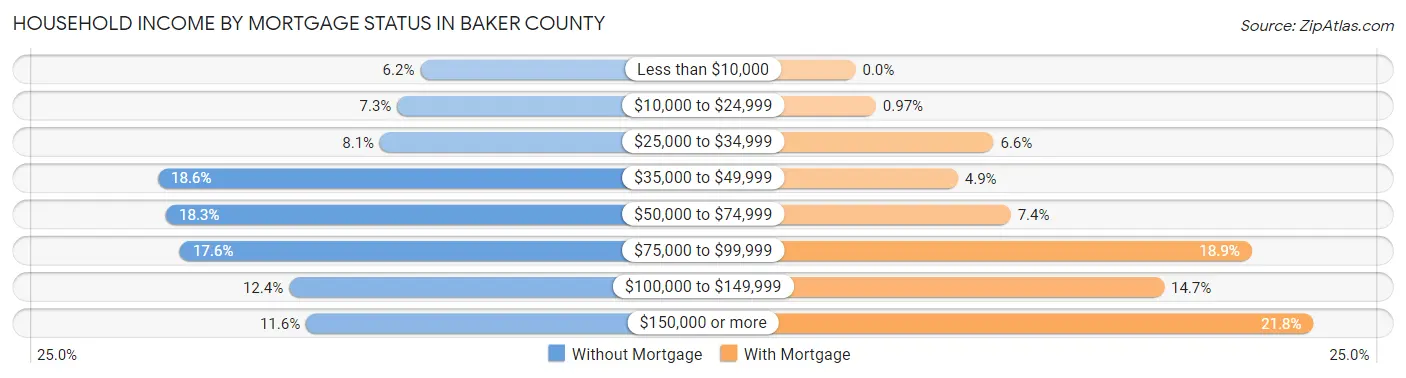
| Household Income | Without Mortgage | With Mortgage |
| Less than $10,000 | 196 (6.2%) | 0 (0.0%) |
| $10,000 to $24,999 | 231 (7.3%) | 39 (1.0%) |
| $25,000 to $34,999 | 257 (8.1%) | 263 (6.6%) |
| $35,000 to $49,999 | 593 (18.6%) | 195 (4.9%) |
| $50,000 to $74,999 | 581 (18.3%) | 296 (7.4%) |
| $75,000 to $99,999 | 560 (17.6%) | 755 (18.9%) |
| $100,000 to $149,999 | 395 (12.4%) | 588 (14.7%) |
| $150,000 or more | 369 (11.6%) | 873 (21.8%) |
| Total | 3,182 (100.0%) | 4,004 (100.0%) |
Property Value to Household Income Ratio in Baker County
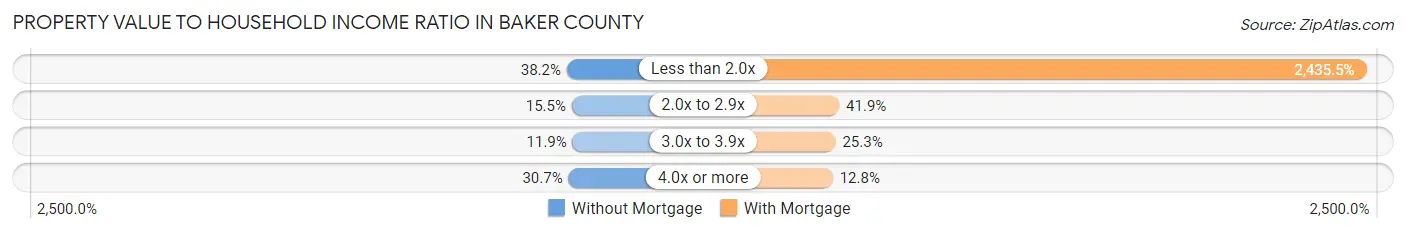
| Value-to-Income Ratio | Without Mortgage | With Mortgage |
| Less than 2.0x | 1,215 (38.2%) | 97,519 (2,435.5%) |
| 2.0x to 2.9x | 494 (15.5%) | 1,678 (41.9%) |
| 3.0x to 3.9x | 377 (11.8%) | 1,014 (25.3%) |
| 4.0x or more | 976 (30.7%) | 511 (12.8%) |
| Total | 3,182 (100.0%) | 4,004 (100.0%) |
Real Estate Taxes by Mortgage Status in Baker County
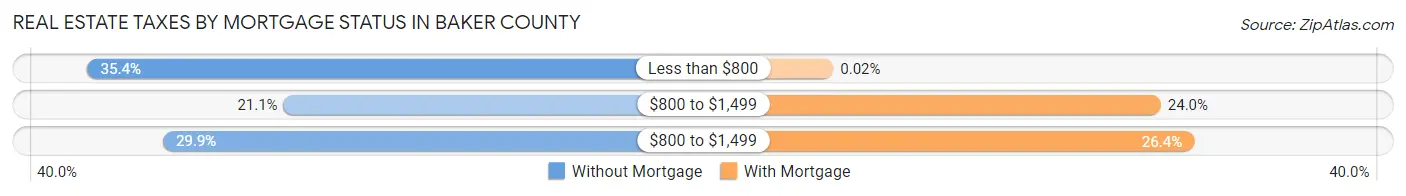
| Property Taxes | Without Mortgage | With Mortgage |
| Less than $800 | 1,126 (35.4%) | 1 (0.0%) |
| $800 to $1,499 | 671 (21.1%) | 959 (23.9%) |
| $800 to $1,499 | 951 (29.9%) | 1,056 (26.4%) |
| Total | 3,182 (100.0%) | 4,004 (100.0%) |
Health & Disability in Baker County
Health Insurance Coverage by Age in Baker County
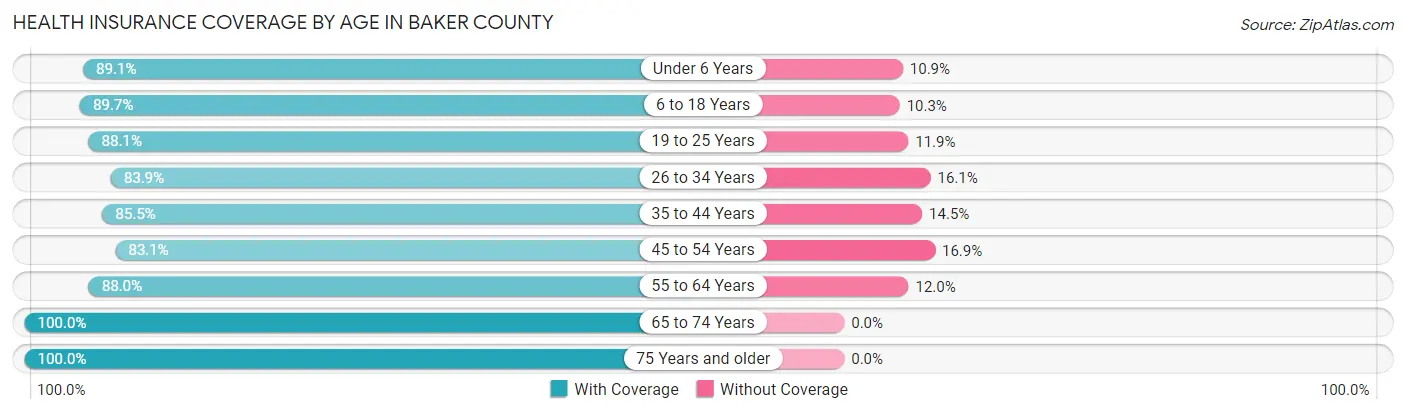
| Age Bracket | With Coverage | Without Coverage |
| Under 6 Years | 1,827 (89.1%) | 224 (10.9%) |
| 6 to 18 Years | 4,176 (89.7%) | 481 (10.3%) |
| 19 to 25 Years | 2,153 (88.1%) | 292 (11.9%) |
| 26 to 34 Years | 2,404 (83.9%) | 461 (16.1%) |
| 35 to 44 Years | 2,484 (85.5%) | 422 (14.5%) |
| 45 to 54 Years | 2,721 (83.1%) | 554 (16.9%) |
| 55 to 64 Years | 2,727 (88.0%) | 371 (12.0%) |
| 65 to 74 Years | 2,211 (100.0%) | 0 (0.0%) |
| 75 Years and older | 1,360 (100.0%) | 0 (0.0%) |
| Total | 22,063 (88.7%) | 2,805 (11.3%) |
Health Insurance Coverage by Citizenship Status in Baker County
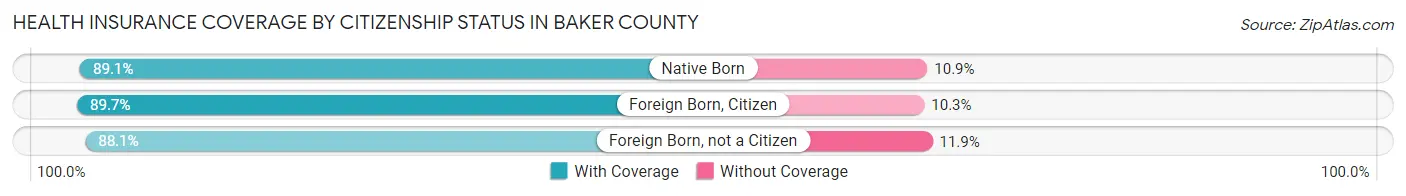
| Citizenship Status | With Coverage | Without Coverage |
| Native Born | 1,827 (89.1%) | 224 (10.9%) |
| Foreign Born, Citizen | 4,176 (89.7%) | 481 (10.3%) |
| Foreign Born, not a Citizen | 2,153 (88.1%) | 292 (11.9%) |
Health Insurance Coverage by Household Income in Baker County
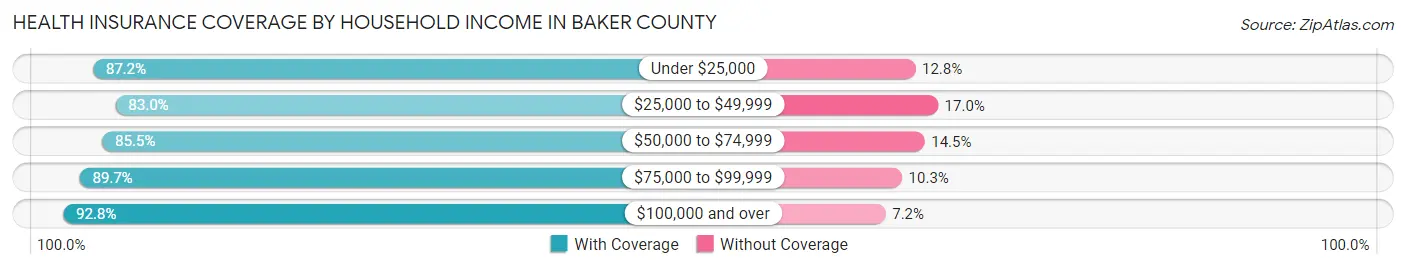
| Household Income | With Coverage | Without Coverage |
| Under $25,000 | 2,232 (87.2%) | 327 (12.8%) |
| $25,000 to $49,999 | 3,321 (83.0%) | 681 (17.0%) |
| $50,000 to $74,999 | 4,093 (85.5%) | 695 (14.5%) |
| $75,000 to $99,999 | 3,719 (89.7%) | 426 (10.3%) |
| $100,000 and over | 8,698 (92.8%) | 676 (7.2%) |
Public vs Private Health Insurance Coverage by Age in Baker County
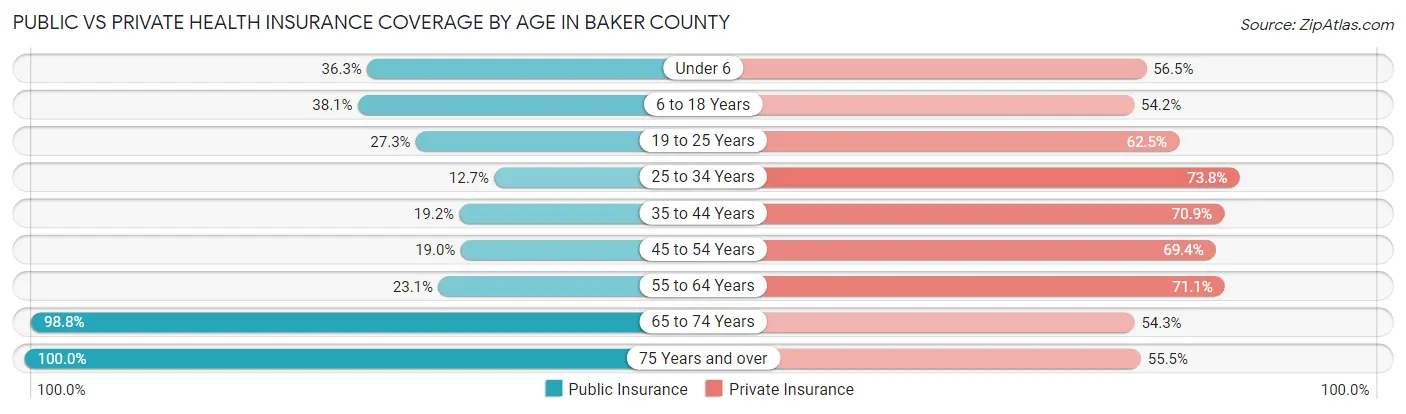
| Age Bracket | Public Insurance | Private Insurance |
| Under 6 | 745 (36.3%) | 1,159 (56.5%) |
| 6 to 18 Years | 1,772 (38.1%) | 2,526 (54.2%) |
| 19 to 25 Years | 667 (27.3%) | 1,529 (62.5%) |
| 25 to 34 Years | 364 (12.7%) | 2,114 (73.8%) |
| 35 to 44 Years | 558 (19.2%) | 2,061 (70.9%) |
| 45 to 54 Years | 621 (19.0%) | 2,272 (69.4%) |
| 55 to 64 Years | 716 (23.1%) | 2,201 (71.1%) |
| 65 to 74 Years | 2,184 (98.8%) | 1,201 (54.3%) |
| 75 Years and over | 1,360 (100.0%) | 755 (55.5%) |
| Total | 8,987 (36.1%) | 15,818 (63.6%) |
Disability Status by Sex by Age in Baker County
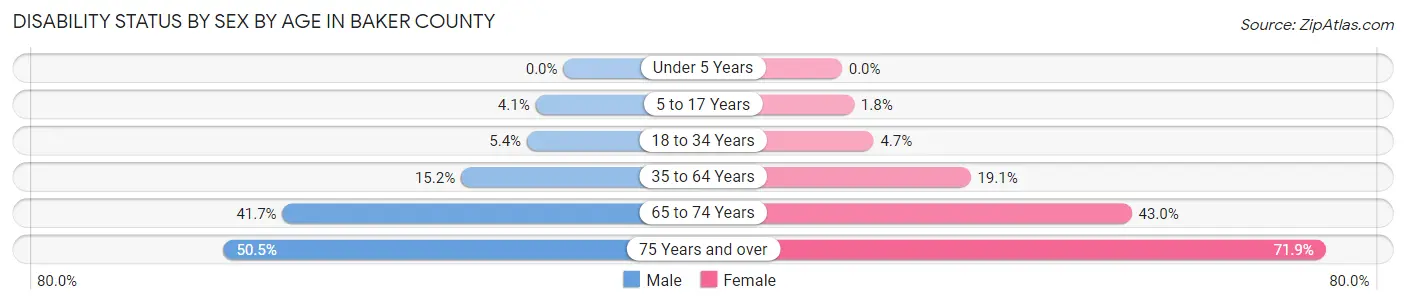
| Age Bracket | Male | Female |
| Under 5 Years | 0 (0.0%) | 0 (0.0%) |
| 5 to 17 Years | 106 (4.1%) | 42 (1.8%) |
| 18 to 34 Years | 151 (5.4%) | 125 (4.7%) |
| 35 to 64 Years | 674 (15.2%) | 926 (19.1%) |
| 65 to 74 Years | 450 (41.7%) | 487 (43.0%) |
| 75 Years and over | 274 (50.5%) | 587 (71.9%) |
Disability Class by Sex by Age in Baker County
Disability Class: Hearing Difficulty
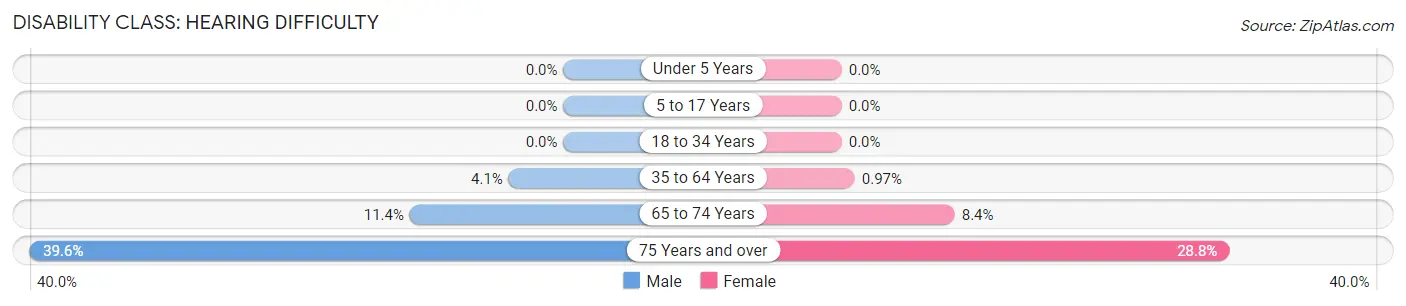
| Age Bracket | Male | Female |
| Under 5 Years | 0 (0.0%) | 0 (0.0%) |
| 5 to 17 Years | 0 (0.0%) | 0 (0.0%) |
| 18 to 34 Years | 0 (0.0%) | 0 (0.0%) |
| 35 to 64 Years | 180 (4.1%) | 47 (1.0%) |
| 65 to 74 Years | 123 (11.4%) | 95 (8.4%) |
| 75 Years and over | 215 (39.6%) | 235 (28.8%) |
Disability Class: Vision Difficulty
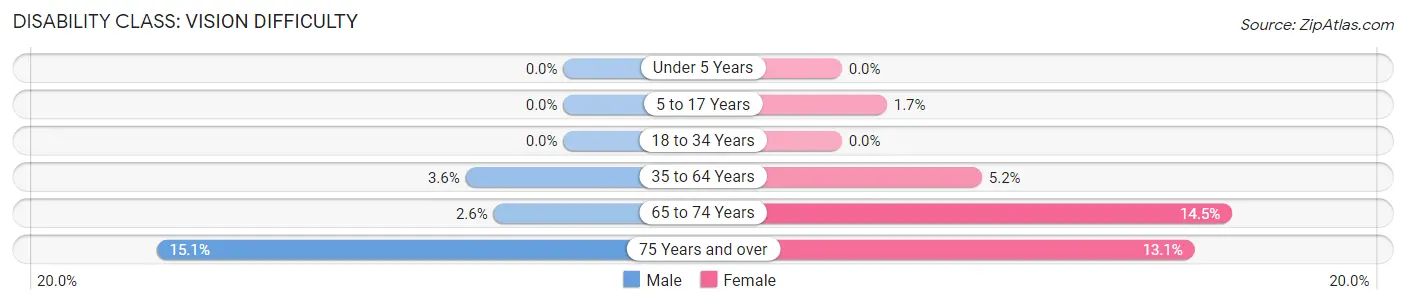
| Age Bracket | Male | Female |
| Under 5 Years | 0 (0.0%) | 0 (0.0%) |
| 5 to 17 Years | 0 (0.0%) | 39 (1.7%) |
| 18 to 34 Years | 0 (0.0%) | 0 (0.0%) |
| 35 to 64 Years | 161 (3.6%) | 252 (5.2%) |
| 65 to 74 Years | 28 (2.6%) | 164 (14.5%) |
| 75 Years and over | 82 (15.1%) | 107 (13.1%) |
Disability Class: Cognitive Difficulty
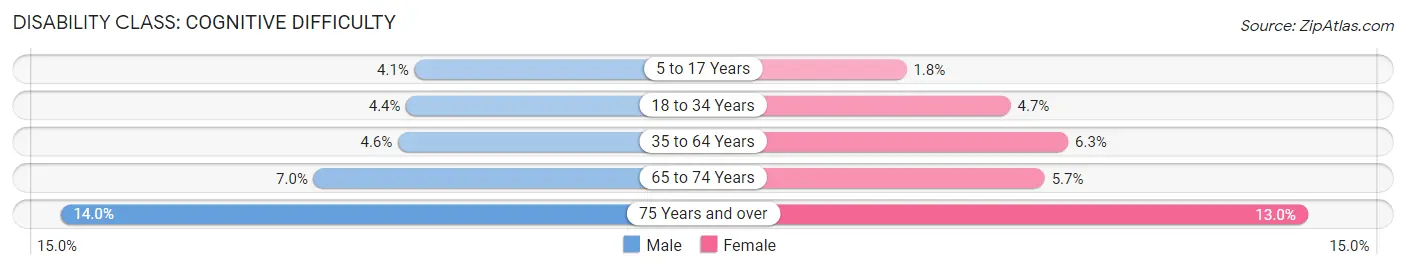
| Age Bracket | Male | Female |
| 5 to 17 Years | 106 (4.1%) | 42 (1.8%) |
| 18 to 34 Years | 122 (4.4%) | 125 (4.7%) |
| 35 to 64 Years | 204 (4.6%) | 305 (6.3%) |
| 65 to 74 Years | 75 (7.0%) | 64 (5.7%) |
| 75 Years and over | 76 (14.0%) | 106 (13.0%) |
Disability Class: Ambulatory Difficulty
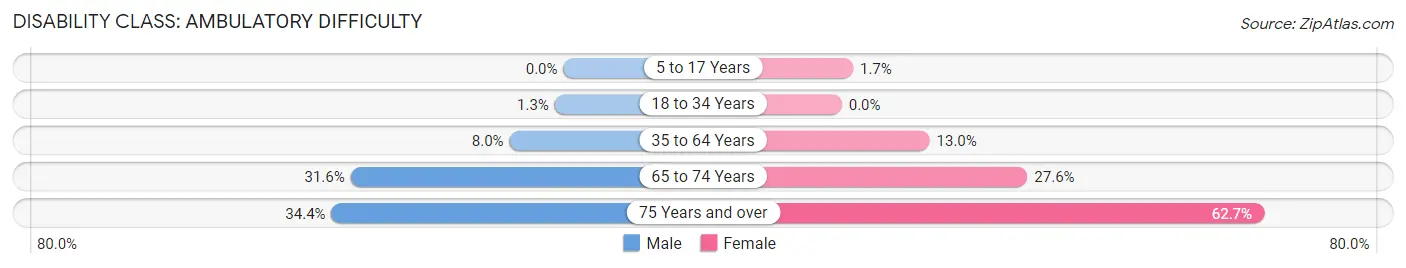
| Age Bracket | Male | Female |
| 5 to 17 Years | 0 (0.0%) | 39 (1.7%) |
| 18 to 34 Years | 36 (1.3%) | 0 (0.0%) |
| 35 to 64 Years | 355 (8.0%) | 632 (13.0%) |
| 65 to 74 Years | 341 (31.6%) | 312 (27.6%) |
| 75 Years and over | 187 (34.4%) | 512 (62.7%) |
Disability Class: Self-Care Difficulty
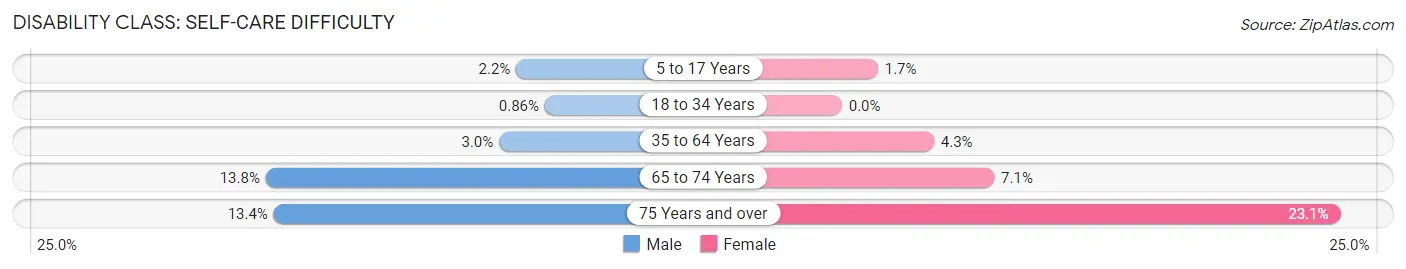
| Age Bracket | Male | Female |
| 5 to 17 Years | 56 (2.2%) | 39 (1.7%) |
| 18 to 34 Years | 24 (0.9%) | 0 (0.0%) |
| 35 to 64 Years | 132 (3.0%) | 207 (4.3%) |
| 65 to 74 Years | 149 (13.8%) | 80 (7.1%) |
| 75 Years and over | 73 (13.4%) | 189 (23.1%) |
Technology Access in Baker County
Computing Device Access in Baker County
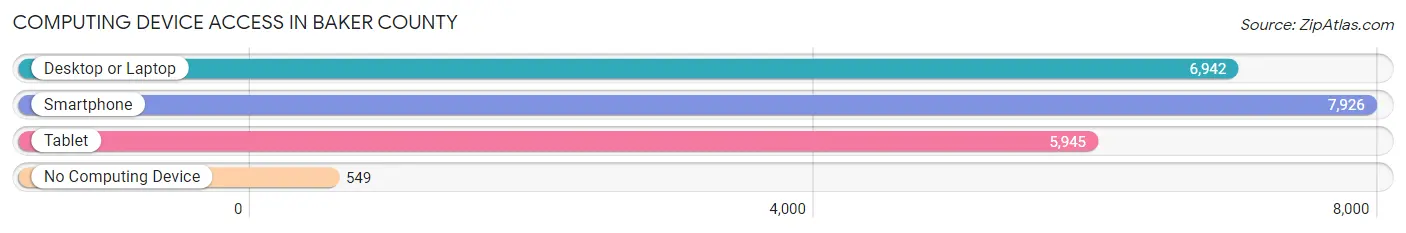
| Device Type | # Households | % Households |
| Desktop or Laptop | 6,942 | 77.1% |
| Smartphone | 7,926 | 88.0% |
| Tablet | 5,945 | 66.0% |
| No Computing Device | 549 | 6.1% |
| Total | 9,004 | 100.0% |
Internet Access in Baker County
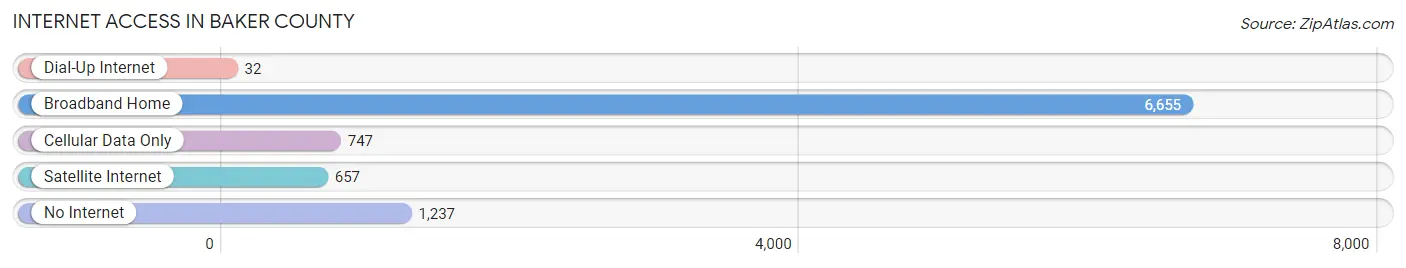
| Internet Type | # Households | % Households |
| Dial-Up Internet | 32 | 0.4% |
| Broadband Home | 6,655 | 73.9% |
| Cellular Data Only | 747 | 8.3% |
| Satellite Internet | 657 | 7.3% |
| No Internet | 1,237 | 13.7% |
| Total | 9,004 | 100.0% |
Baker County Summary
Baker County is located in the northeastern part of the state of Florida, in the United States. It is bordered by Columbia County to the north, Union County to the east, Bradford County to the south, and Nassau County to the west. The county seat is Macclenny, and the largest city is Glen St. Mary. The county was created in 1861 and named for James McNair Baker, a judge and Confederate Senator from Florida.
History
The area that is now Baker County was originally inhabited by the Timucua and Mocama Native American tribes. The first European settlers arrived in the area in the late 1700s, and the county was officially established in 1861. The county was named for James McNair Baker, a judge and Confederate Senator from Florida.
During the Civil War, Baker County was a major center of Confederate activity. The county was home to several Confederate camps, and the Battle of Olustee was fought in the county in 1864. After the war, the county's economy was largely based on timber and turpentine production.
In the early 1900s, the county began to develop a more diversified economy, with the establishment of several new industries, including a brick factory, a sawmill, and a turpentine distillery. The county also began to attract more tourists, with the opening of several resorts in the area.
Geography
Baker County is located in the northeastern part of the state of Florida. It is bordered by Columbia County to the north, Union County to the east, Bradford County to the south, and Nassau County to the west. The county has a total area of 602 square miles, of which 590 square miles is land and 12 square miles is water.
The county is mostly flat, with some rolling hills in the northern part of the county. The St. Marys River forms the western border of the county, and the Suwannee River forms the eastern border. The county is home to several lakes, including Ocean Pond, Olustee Lake, and Sanderson Lake.
Economy
The economy of Baker County is largely based on agriculture and forestry. The county is home to several large farms, which produce a variety of crops, including corn, soybeans, cotton, and peanuts. The county is also home to several timber companies, which harvest pine and cypress trees for use in the production of lumber and paper products.
The county is also home to several manufacturing companies, which produce a variety of products, including furniture, clothing, and food products. The county is also home to several tourist attractions, including the Olustee Battlefield Historic State Park and the Osceola National Forest.
Demographics
As of the 2010 census, there were 27,115 people, 10,093 households, and 7,541 families living in the county. The population density was 46 people per square mile. There were 11,845 housing units at an average density of 20 per square mile. The racial makeup of the county was 84.3% White, 11.3% African American, 0.5% Native American, 0.7% Asian, 0.1% Pacific Islander, 1.7% from other races, and 1.4% from two or more races. Hispanic or Latino of any race were 4.3% of the population.
The median income for a household in the county was $37,845, and the median income for a family was $45,890. The per capita income for the county was $18,845. About 14.3% of families and 17.7% of the population were below the poverty line, including 25.2% of those under age 18 and 11.2% of those age 65 or over.
Common Questions
What is Per Capita Income in Baker County?
Per Capita income in Baker County is $28,612.
What is the Median Family Income in Baker County?
Median Family Income in Baker County is $81,512.
What is the Median Household income in Baker County?
Median Household Income in Baker County is $67,872.
What is Income or Wage Gap in Baker County?
Income or Wage Gap in Baker County is 20.9%.
Women in Baker County earn 79.1 cents for every dollar earned by a man.
What is Family Income Deficit in Baker County?
Family Income Deficit in Baker County is $10,439.
Families that are below poverty line in Baker County earn $10,439 less on average than the poverty threshold level.
What is Inequality or Gini Index in Baker County?
Inequality or Gini Index in Baker County is 0.41.
What is the Total Population of Baker County?
Total Population of Baker County is 27,969.
What is the Total Male Population of Baker County?
Total Male Population of Baker County is 14,996.
What is the Total Female Population of Baker County?
Total Female Population of Baker County is 12,973.
What is the Ratio of Males per 100 Females in Baker County?
There are 115.59 Males per 100 Females in Baker County.
What is the Ratio of Females per 100 Males in Baker County?
There are 86.51 Females per 100 Males in Baker County.
What is the Median Population Age in Baker County?
Median Population Age in Baker County is 37.7 Years.
What is the Average Family Size in Baker County
Average Family Size in Baker County is 3.2 People.
What is the Average Household Size in Baker County
Average Household Size in Baker County is 2.8 People.
How Large is the Labor Force in Baker County?
There are 12,232 People in the Labor Forcein in Baker County.
What is the Percentage of People in the Labor Force in Baker County?
55.5% of People are in the Labor Force in Baker County.
What is the Unemployment Rate in Baker County?
Unemployment Rate in Baker County is 4.9%.