Bardmoor, FL Map & Demographics
Bardmoor Map
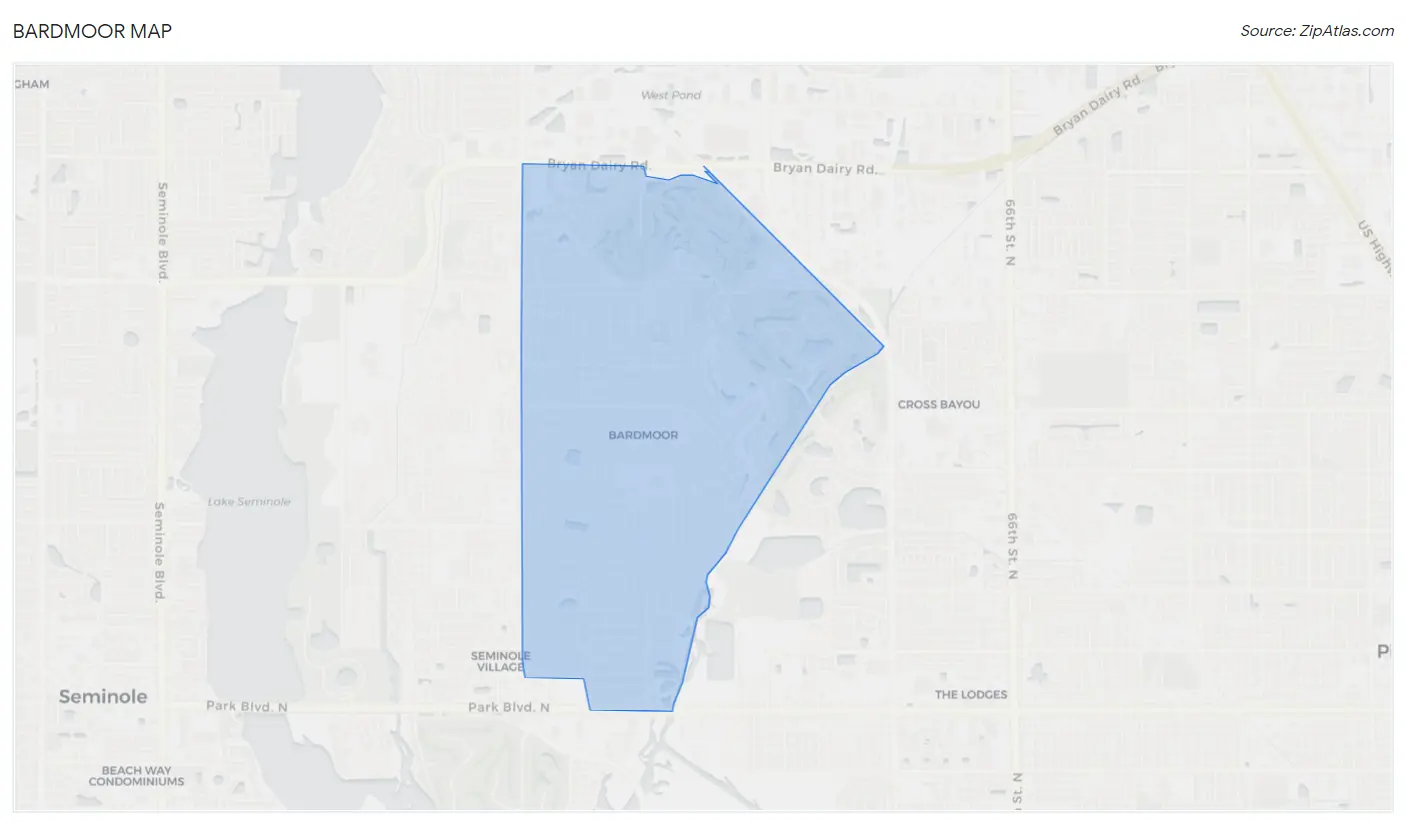
Bardmoor Overview
$44,445
PER CAPITA INCOME
$111,250
AVG FAMILY INCOME
$83,852
AVG HOUSEHOLD INCOME
4.6%
WAGE / INCOME GAP [ % ]
95.4¢/ $1
WAGE / INCOME GAP [ $ ]
0.42
INEQUALITY / GINI INDEX
9,834
TOTAL POPULATION
4,864
MALE POPULATION
4,970
FEMALE POPULATION
97.87
MALES / 100 FEMALES
102.18
FEMALES / 100 MALES
45.2
MEDIAN AGE
3.1
AVG FAMILY SIZE
2.5
AVG HOUSEHOLD SIZE
5,388
LABOR FORCE [ PEOPLE ]
66.2%
PERCENT IN LABOR FORCE
3.0%
UNEMPLOYMENT RATE
Income in Bardmoor
Income Overview in Bardmoor
Per Capita Income in Bardmoor is $44,445, while median incomes of families and households are $111,250 and $83,852 respectively.
| Characteristic | Number | Measure |
| Per Capita Income | 9,834 | $44,445 |
| Median Family Income | 2,406 | $111,250 |
| Mean Family Income | 2,406 | $127,054 |
| Median Household Income | 4,017 | $83,852 |
| Mean Household Income | 4,017 | $103,540 |
| Income Deficit | 2,406 | $0 |
| Wage / Income Gap (%) | 9,834 | 4.60% |
| Wage / Income Gap ($) | 9,834 | 95.40¢ per $1 |
| Gini / Inequality Index | 9,834 | 0.42 |
Earnings by Sex in Bardmoor
Average Earnings in Bardmoor are $43,714, $43,090 for men and $45,166 for women, a difference of 4.6%.
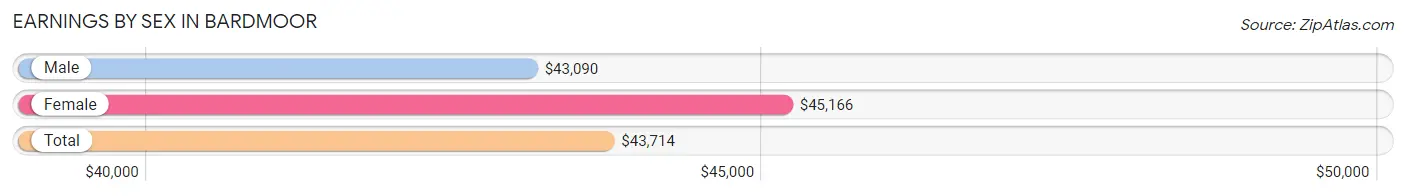
| Sex | Number | Average Earnings |
| Male | 2,923 (52.5%) | $43,090 |
| Female | 2,643 (47.5%) | $45,166 |
| Total | 5,566 (100.0%) | $43,714 |
Earnings by Sex by Income Bracket in Bardmoor
The most common earnings brackets in Bardmoor are $100,000+ for men (495 | 16.9%) and $100,000+ for women (474 | 17.9%).
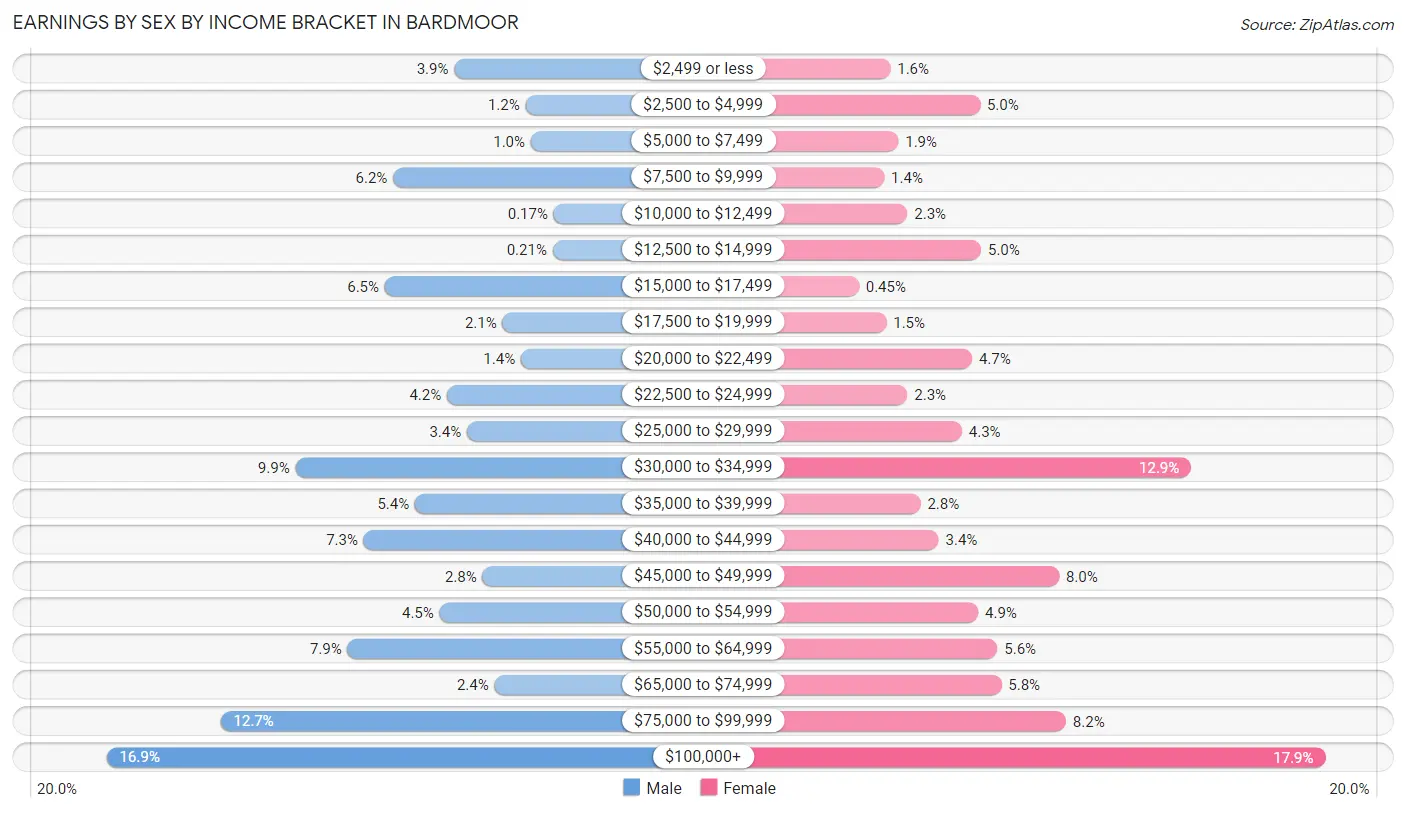
| Income | Male | Female |
| $2,499 or less | 114 (3.9%) | 43 (1.6%) |
| $2,500 to $4,999 | 36 (1.2%) | 132 (5.0%) |
| $5,000 to $7,499 | 30 (1.0%) | 51 (1.9%) |
| $7,500 to $9,999 | 181 (6.2%) | 37 (1.4%) |
| $10,000 to $12,499 | 5 (0.2%) | 60 (2.3%) |
| $12,500 to $14,999 | 6 (0.2%) | 133 (5.0%) |
| $15,000 to $17,499 | 190 (6.5%) | 12 (0.4%) |
| $17,500 to $19,999 | 61 (2.1%) | 39 (1.5%) |
| $20,000 to $22,499 | 41 (1.4%) | 124 (4.7%) |
| $22,500 to $24,999 | 122 (4.2%) | 60 (2.3%) |
| $25,000 to $29,999 | 100 (3.4%) | 114 (4.3%) |
| $30,000 to $34,999 | 288 (9.9%) | 341 (12.9%) |
| $35,000 to $39,999 | 157 (5.4%) | 73 (2.8%) |
| $40,000 to $44,999 | 213 (7.3%) | 91 (3.4%) |
| $45,000 to $49,999 | 83 (2.8%) | 210 (8.0%) |
| $50,000 to $54,999 | 130 (4.4%) | 130 (4.9%) |
| $55,000 to $64,999 | 231 (7.9%) | 149 (5.6%) |
| $65,000 to $74,999 | 70 (2.4%) | 153 (5.8%) |
| $75,000 to $99,999 | 370 (12.7%) | 217 (8.2%) |
| $100,000+ | 495 (16.9%) | 474 (17.9%) |
| Total | 2,923 (100.0%) | 2,643 (100.0%) |
Earnings by Sex by Educational Attainment in Bardmoor
Average earnings in Bardmoor are $51,494 for men and $46,416 for women, a difference of 9.9%. Men with an educational attainment of graduate degree enjoy the highest average annual earnings of $121,953, while those with less than high school education earn the least with $33,556. Women with an educational attainment of graduate degree earn the most with the average annual earnings of $57,137, while those with high school diploma education have the smallest earnings of $32,560.
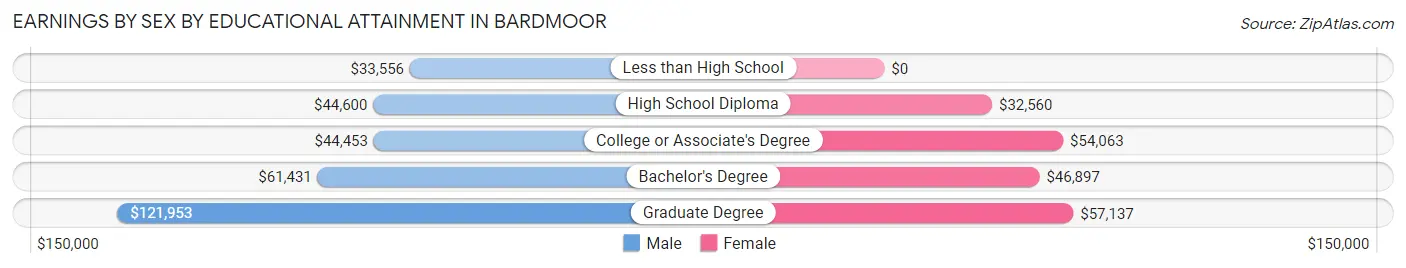
| Educational Attainment | Male Income | Female Income |
| Less than High School | $33,556 | $0 |
| High School Diploma | $44,600 | $32,560 |
| College or Associate's Degree | $44,453 | $54,063 |
| Bachelor's Degree | $61,431 | $46,897 |
| Graduate Degree | $121,953 | $57,137 |
| Total | $51,494 | $46,416 |
Family Income in Bardmoor
Family Income Brackets in Bardmoor
According to the Bardmoor family income data, there are 481 families falling into the $100,000 to $149,999 income range, which is the most common income bracket and makes up 20.0% of all families. Conversely, the $10,000 to $14,999 income bracket is the least frequent group with only 17 families (0.7%) belonging to this category.
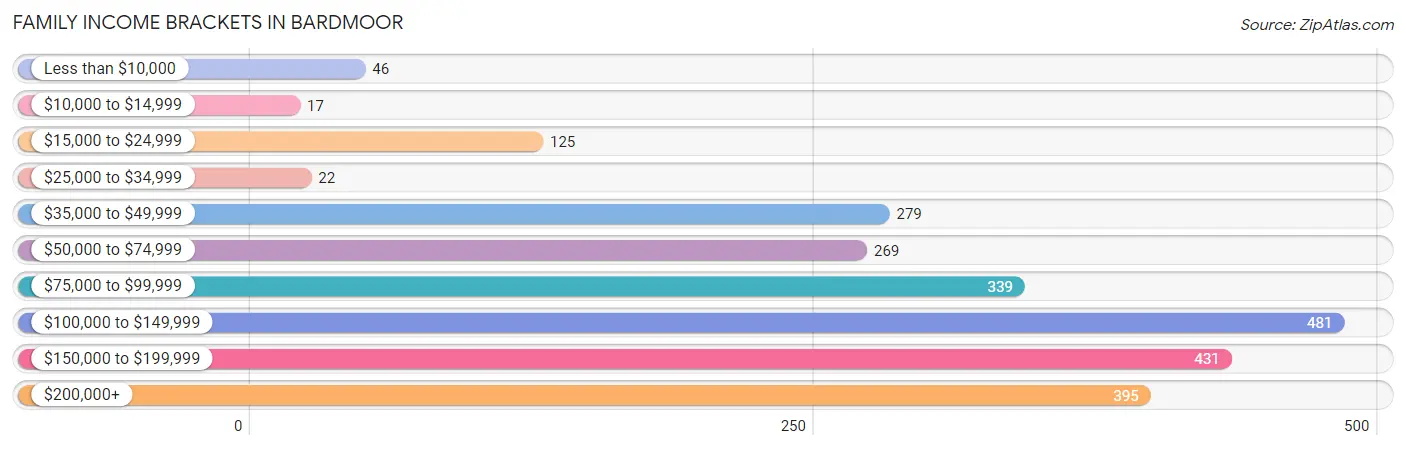
| Income Bracket | # Families | % Families |
| Less than $10,000 | 46 | 1.9% |
| $10,000 to $14,999 | 17 | 0.7% |
| $15,000 to $24,999 | 125 | 5.2% |
| $25,000 to $34,999 | 22 | 0.9% |
| $35,000 to $49,999 | 279 | 11.6% |
| $50,000 to $74,999 | 269 | 11.2% |
| $75,000 to $99,999 | 339 | 14.1% |
| $100,000 to $149,999 | 481 | 20.0% |
| $150,000 to $199,999 | 431 | 17.9% |
| $200,000+ | 395 | 16.4% |
Family Income by Famaliy Size in Bardmoor
4-person families (557 | 23.2%) account for the highest median family income in Bardmoor with $190,265 per family, while 4-person families (557 | 23.2%) have the highest median income of $47,566 per family member.
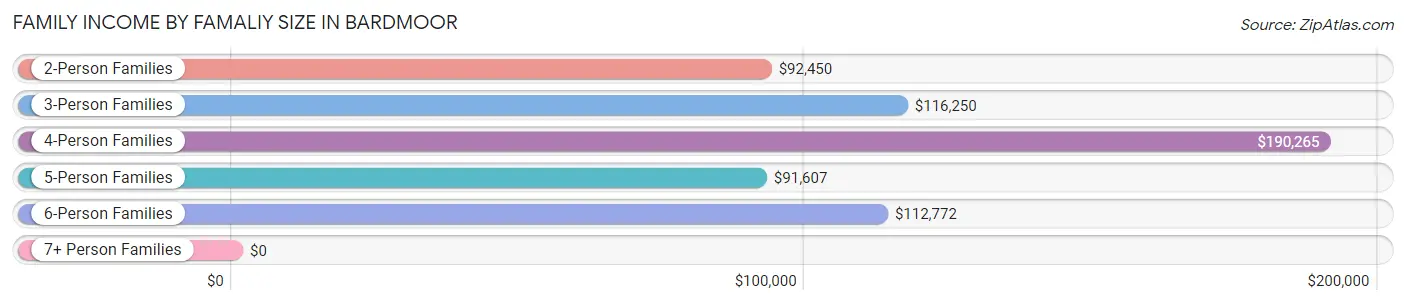
| Income Bracket | # Families | Median Income |
| 2-Person Families | 1,101 (45.8%) | $92,450 |
| 3-Person Families | 556 (23.1%) | $116,250 |
| 4-Person Families | 557 (23.2%) | $190,265 |
| 5-Person Families | 120 (5.0%) | $91,607 |
| 6-Person Families | 41 (1.7%) | $112,772 |
| 7+ Person Families | 31 (1.3%) | $0 |
| Total | 2,406 (100.0%) | $111,250 |
Family Income by Number of Earners in Bardmoor
The median family income in Bardmoor is $111,250, with families comprising 3+ earners (399) having the highest median family income of $190,356, while families with no earners (344) have the lowest median family income of $54,956, accounting for 16.6% and 14.3% of families, respectively.
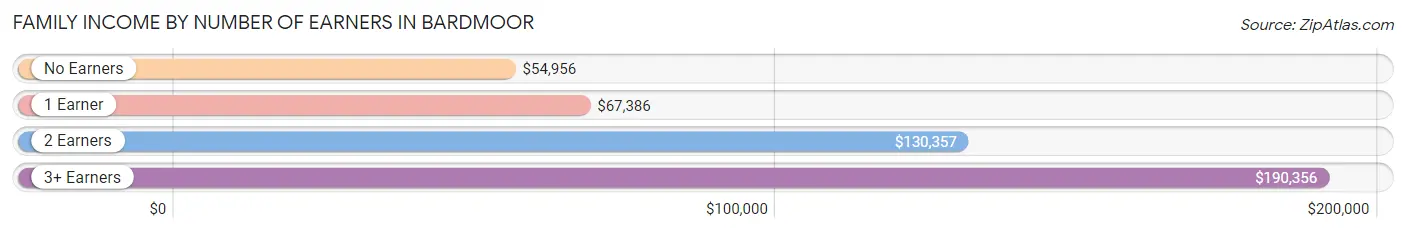
| Number of Earners | # Families | Median Income |
| No Earners | 344 (14.3%) | $54,956 |
| 1 Earner | 667 (27.7%) | $67,386 |
| 2 Earners | 996 (41.4%) | $130,357 |
| 3+ Earners | 399 (16.6%) | $190,356 |
| Total | 2,406 (100.0%) | $111,250 |
Household Income in Bardmoor
Household Income Brackets in Bardmoor
With 655 households falling in the category, the $75,000 to $99,999 income range is the most frequent in Bardmoor, accounting for 16.3% of all households. In contrast, only 104 households (2.6%) fall into the less than $10,000 income bracket, making it the least populous group.
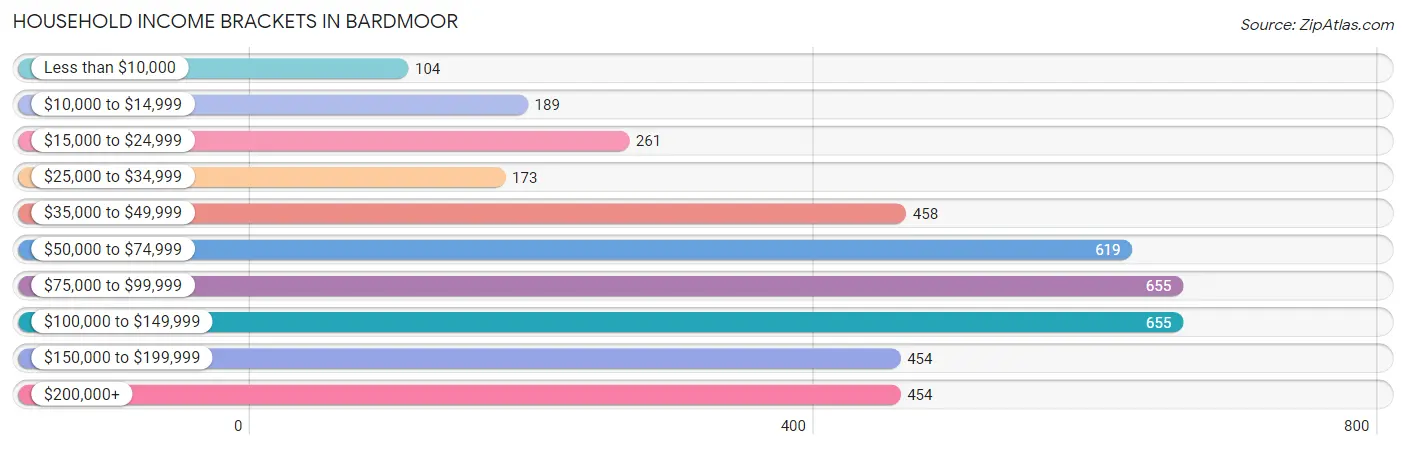
| Income Bracket | # Households | % Households |
| Less than $10,000 | 104 | 2.6% |
| $10,000 to $14,999 | 189 | 4.7% |
| $15,000 to $24,999 | 261 | 6.5% |
| $25,000 to $34,999 | 173 | 4.3% |
| $35,000 to $49,999 | 458 | 11.4% |
| $50,000 to $74,999 | 619 | 15.4% |
| $75,000 to $99,999 | 655 | 16.3% |
| $100,000 to $149,999 | 655 | 16.3% |
| $150,000 to $199,999 | 454 | 11.3% |
| $200,000+ | 454 | 11.3% |
Household Income by Householder Age in Bardmoor
The median household income in Bardmoor is $83,852, with the highest median household income of $97,823 found in the 45 to 64 years age bracket for the primary householder. A total of 1,734 households (43.2%) fall into this category. Meanwhile, the 15 to 24 years age bracket for the primary householder has the lowest median household income of $0, with 26 households (0.6%) in this group.
| Income Bracket | # Households | Median Income |
| 15 to 24 Years | 26 (0.6%) | $0 |
| 25 to 44 Years | 1,025 (25.5%) | $80,023 |
| 45 to 64 Years | 1,734 (43.2%) | $97,823 |
| 65+ Years | 1,232 (30.7%) | $59,710 |
| Total | 4,017 (100.0%) | $83,852 |
Poverty in Bardmoor
Income Below Poverty by Sex and Age in Bardmoor
With 7.8% poverty level for males and 9.1% for females among the residents of Bardmoor, 5 year old males and 6 to 11 year old females are the most vulnerable to poverty, with 29 males (34.1%) and 107 females (35.9%) in their respective age groups living below the poverty level.
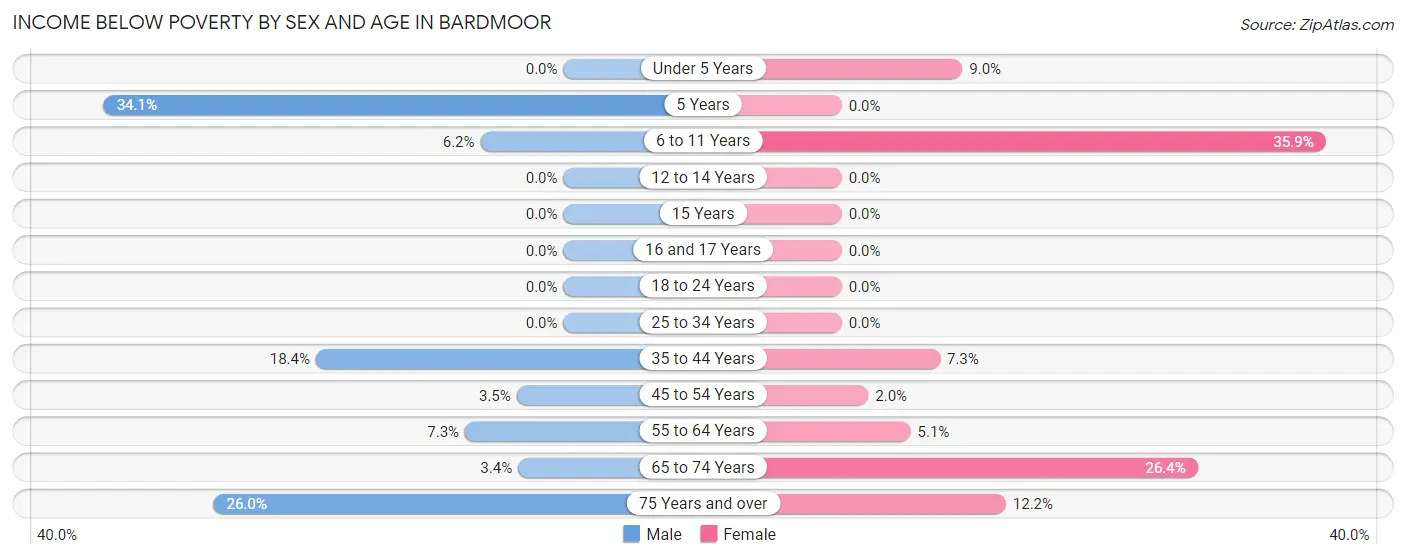
| Age Bracket | Male | Female |
| Under 5 Years | 0 (0.0%) | 28 (8.9%) |
| 5 Years | 29 (34.1%) | 0 (0.0%) |
| 6 to 11 Years | 18 (6.2%) | 107 (35.9%) |
| 12 to 14 Years | 0 (0.0%) | 0 (0.0%) |
| 15 Years | 0 (0.0%) | 0 (0.0%) |
| 16 and 17 Years | 0 (0.0%) | 0 (0.0%) |
| 18 to 24 Years | 0 (0.0%) | 0 (0.0%) |
| 25 to 34 Years | 0 (0.0%) | 0 (0.0%) |
| 35 to 44 Years | 116 (18.4%) | 48 (7.3%) |
| 45 to 54 Years | 16 (3.5%) | 14 (2.0%) |
| 55 to 64 Years | 66 (7.3%) | 46 (5.1%) |
| 65 to 74 Years | 19 (3.4%) | 155 (26.4%) |
| 75 Years and over | 107 (26.0%) | 47 (12.2%) |
| Total | 371 (7.8%) | 445 (9.1%) |
Income Above Poverty by Sex and Age in Bardmoor
According to the poverty statistics in Bardmoor, males aged under 5 years and females aged 12 to 14 years are the age groups that are most secure financially, with 100.0% of males and 100.0% of females in these age groups living above the poverty line.
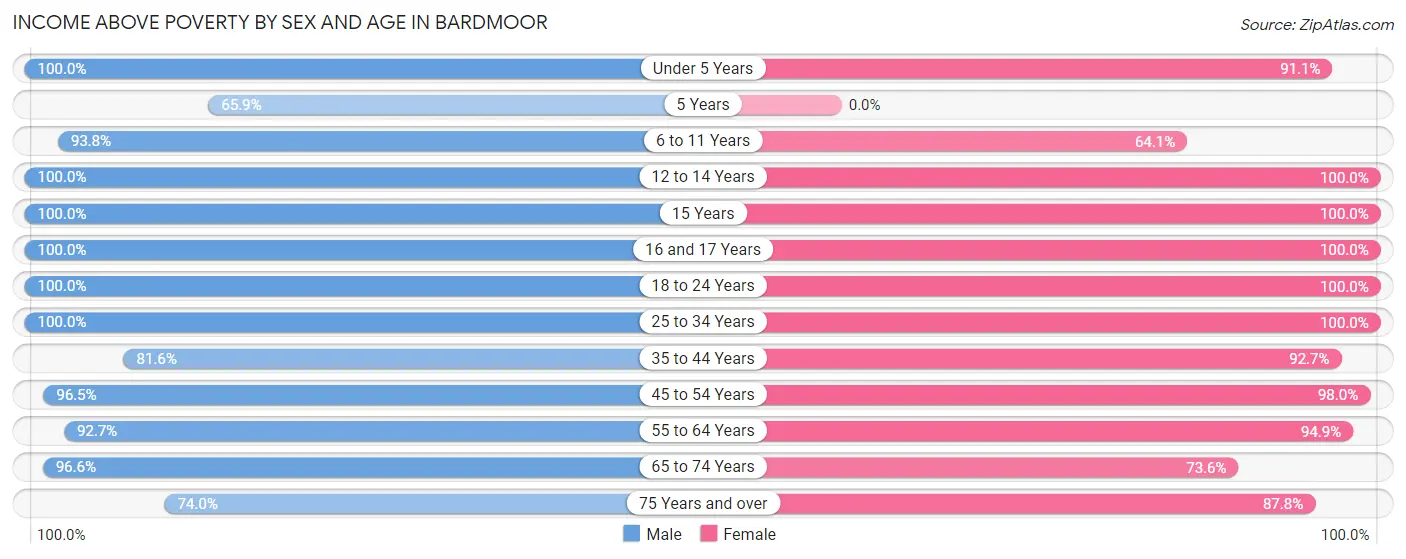
| Age Bracket | Male | Female |
| Under 5 Years | 198 (100.0%) | 285 (91.0%) |
| 5 Years | 56 (65.9%) | 0 (0.0%) |
| 6 to 11 Years | 274 (93.8%) | 191 (64.1%) |
| 12 to 14 Years | 68 (100.0%) | 162 (100.0%) |
| 15 Years | 12 (100.0%) | 81 (100.0%) |
| 16 and 17 Years | 96 (100.0%) | 23 (100.0%) |
| 18 to 24 Years | 549 (100.0%) | 160 (100.0%) |
| 25 to 34 Years | 482 (100.0%) | 615 (100.0%) |
| 35 to 44 Years | 515 (81.6%) | 610 (92.7%) |
| 45 to 54 Years | 445 (96.5%) | 698 (98.0%) |
| 55 to 64 Years | 837 (92.7%) | 855 (94.9%) |
| 65 to 74 Years | 544 (96.6%) | 432 (73.6%) |
| 75 Years and over | 305 (74.0%) | 339 (87.8%) |
| Total | 4,381 (92.2%) | 4,451 (90.9%) |
Income Below Poverty Among Married-Couple Families in Bardmoor
The poverty statistics for married-couple families in Bardmoor show that 4.6% or 93 of the total 2,038 families live below the poverty line. Families with 1 or 2 children have the highest poverty rate of 7.5%, comprising of 44 families. On the other hand, families with 3 or 4 children have the lowest poverty rate of 0.0%, which includes 0 families.
| Children | Above Poverty | Below Poverty |
| No Children | 1,321 (96.4%) | 49 (3.6%) |
| 1 or 2 Children | 545 (92.5%) | 44 (7.5%) |
| 3 or 4 Children | 79 (100.0%) | 0 (0.0%) |
| 5 or more Children | 0 (0.0%) | 0 (0.0%) |
| Total | 1,945 (95.4%) | 93 (4.6%) |
Income Below Poverty Among Single-Parent Households in Bardmoor
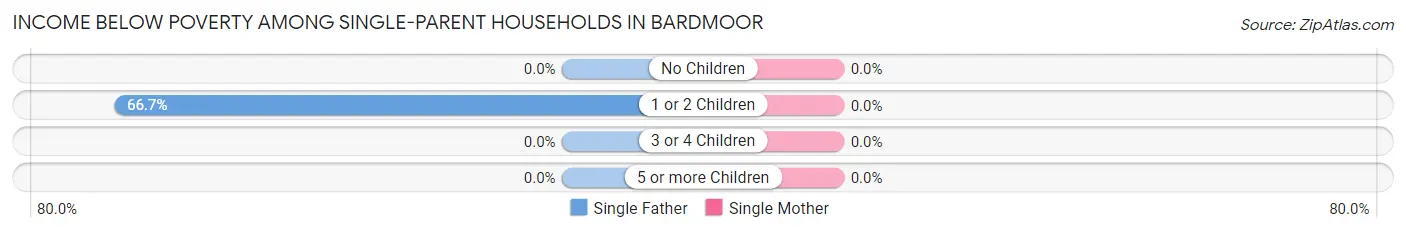
| Children | Single Father | Single Mother |
| No Children | 0 (0.0%) | 0 (0.0%) |
| 1 or 2 Children | 96 (66.7%) | 0 (0.0%) |
| 3 or 4 Children | 0 (0.0%) | 0 (0.0%) |
| 5 or more Children | 0 (0.0%) | 0 (0.0%) |
| Total | 96 (50.8%) | 0 (0.0%) |
Income Below Poverty Among Married-Couple vs Single-Parent Households in Bardmoor
The poverty data for Bardmoor shows that 93 of the married-couple family households (4.6%) and 96 of the single-parent households (26.1%) are living below the poverty level. Within the married-couple family households, those with 1 or 2 children have the highest poverty rate, with 44 households (7.5%) falling below the poverty line. Among the single-parent households, those with 1 or 2 children have the highest poverty rate, with 96 household (41.9%) living below poverty.
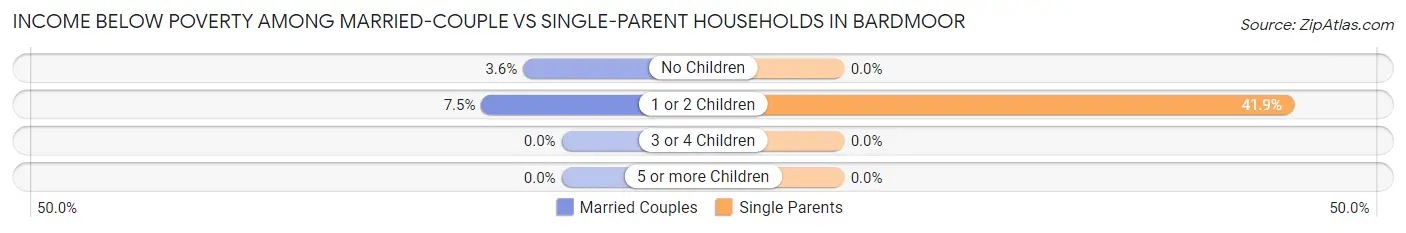
| Children | Married-Couple Families | Single-Parent Households |
| No Children | 49 (3.6%) | 0 (0.0%) |
| 1 or 2 Children | 44 (7.5%) | 96 (41.9%) |
| 3 or 4 Children | 0 (0.0%) | 0 (0.0%) |
| 5 or more Children | 0 (0.0%) | 0 (0.0%) |
| Total | 93 (4.6%) | 96 (26.1%) |
Race in Bardmoor
The most populous races in Bardmoor are White / Caucasian (7,960 | 80.9%), Two or more Races (770 | 7.8%), and Asian (549 | 5.6%).
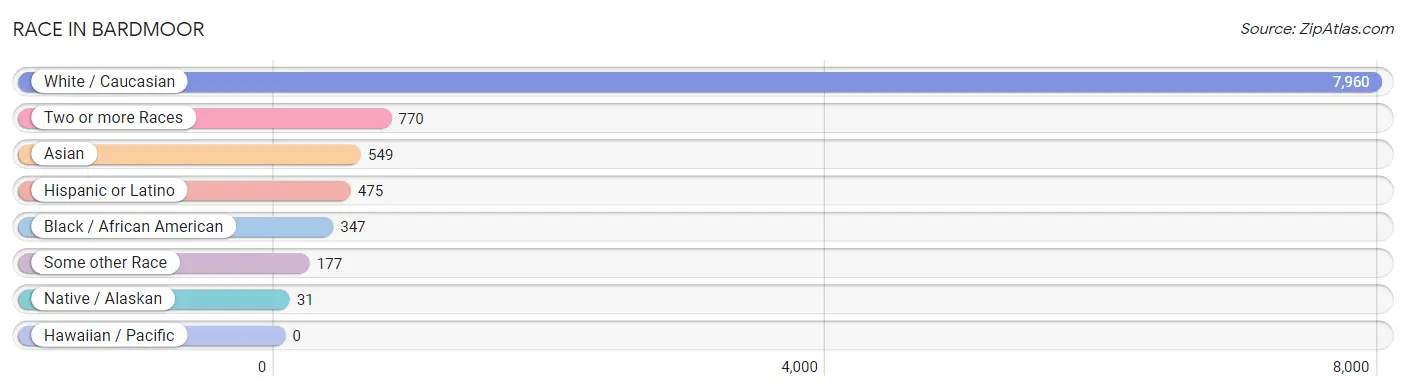
| Race | # Population | % Population |
| Asian | 549 | 5.6% |
| Black / African American | 347 | 3.5% |
| Hawaiian / Pacific | 0 | 0.0% |
| Hispanic or Latino | 475 | 4.8% |
| Native / Alaskan | 31 | 0.3% |
| White / Caucasian | 7,960 | 80.9% |
| Two or more Races | 770 | 7.8% |
| Some other Race | 177 | 1.8% |
| Total | 9,834 | 100.0% |
Ancestry in Bardmoor
The most populous ancestries reported in Bardmoor are German (1,789 | 18.2%), American (1,298 | 13.2%), English (1,290 | 13.1%), Irish (698 | 7.1%), and Italian (593 | 6.0%), together accounting for 57.6% of all Bardmoor residents.
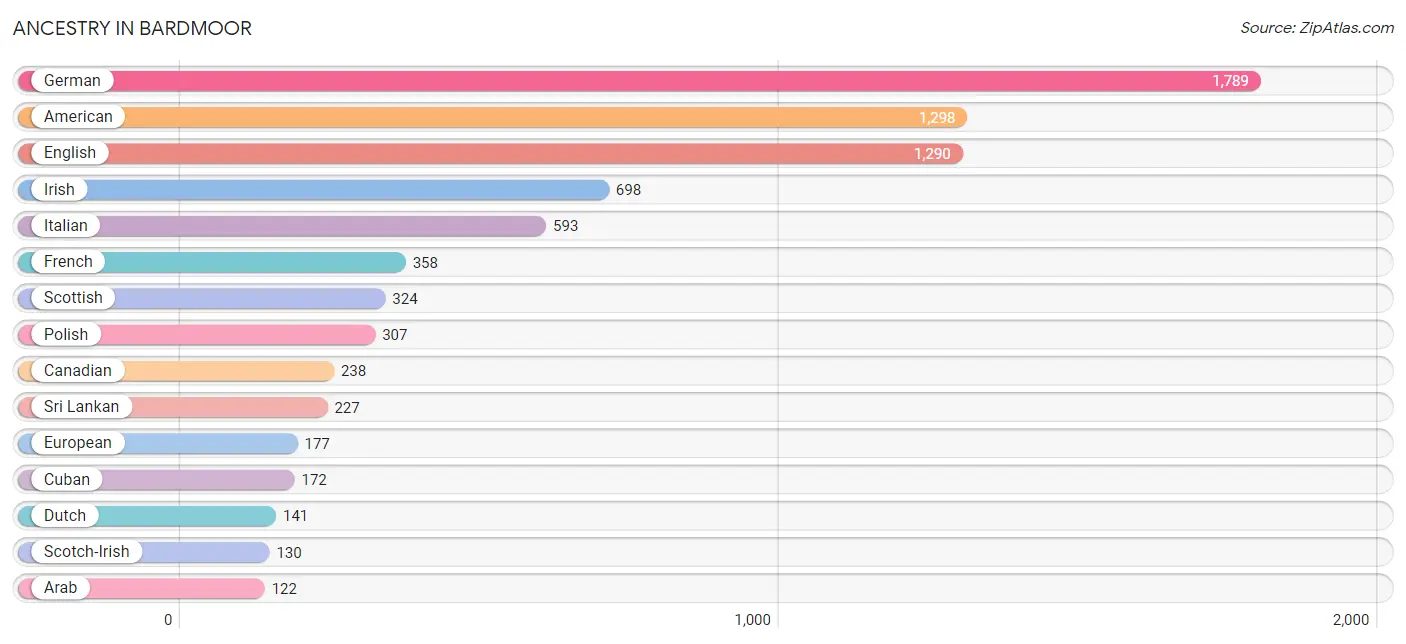
| Ancestry | # Population | % Population |
| African | 7 | 0.1% |
| American | 1,298 | 13.2% |
| Arab | 122 | 1.2% |
| Belgian | 64 | 0.6% |
| Bhutanese | 12 | 0.1% |
| Brazilian | 84 | 0.9% |
| British | 47 | 0.5% |
| Bulgarian | 42 | 0.4% |
| Burmese | 110 | 1.1% |
| Canadian | 238 | 2.4% |
| Carpatho Rusyn | 18 | 0.2% |
| Central American Indian | 16 | 0.2% |
| Cherokee | 38 | 0.4% |
| Choctaw | 11 | 0.1% |
| Colombian | 43 | 0.4% |
| Creek | 35 | 0.4% |
| Cuban | 172 | 1.8% |
| Czechoslovakian | 5 | 0.1% |
| Danish | 16 | 0.2% |
| Dominican | 21 | 0.2% |
| Dutch | 141 | 1.4% |
| Eastern European | 19 | 0.2% |
| English | 1,290 | 13.1% |
| European | 177 | 1.8% |
| French | 358 | 3.6% |
| French Canadian | 25 | 0.3% |
| German | 1,789 | 18.2% |
| Greek | 83 | 0.8% |
| Hungarian | 41 | 0.4% |
| Indian (Asian) | 74 | 0.7% |
| Irish | 698 | 7.1% |
| Italian | 593 | 6.0% |
| Jamaican | 54 | 0.5% |
| Korean | 66 | 0.7% |
| Lebanese | 87 | 0.9% |
| Lithuanian | 45 | 0.5% |
| Mexican | 80 | 0.8% |
| Northern European | 11 | 0.1% |
| Norwegian | 82 | 0.8% |
| Pakistani | 10 | 0.1% |
| Pennsylvania German | 9 | 0.1% |
| Peruvian | 37 | 0.4% |
| Polish | 307 | 3.1% |
| Portuguese | 55 | 0.6% |
| Puerto Rican | 105 | 1.1% |
| Romanian | 26 | 0.3% |
| Russian | 51 | 0.5% |
| Scotch-Irish | 130 | 1.3% |
| Scottish | 324 | 3.3% |
| Seminole | 13 | 0.1% |
| Slovak | 48 | 0.5% |
| Slovene | 10 | 0.1% |
| South American | 91 | 0.9% |
| Spanish | 6 | 0.1% |
| Sri Lankan | 227 | 2.3% |
| Subsaharan African | 7 | 0.1% |
| Swedish | 39 | 0.4% |
| Swiss | 7 | 0.1% |
| Thai | 101 | 1.0% |
| Venezuelan | 11 | 0.1% |
| Welsh | 54 | 0.5% |
| Yugoslavian | 55 | 0.6% | View All 62 Rows |
Immigrants in Bardmoor
The most numerous immigrant groups reported in Bardmoor came from Asia (275 | 2.8%), Canada (191 | 1.9%), Latin America (187 | 1.9%), Europe (183 | 1.9%), and Eastern Asia (139 | 1.4%), together accounting for 9.9% of all Bardmoor residents.
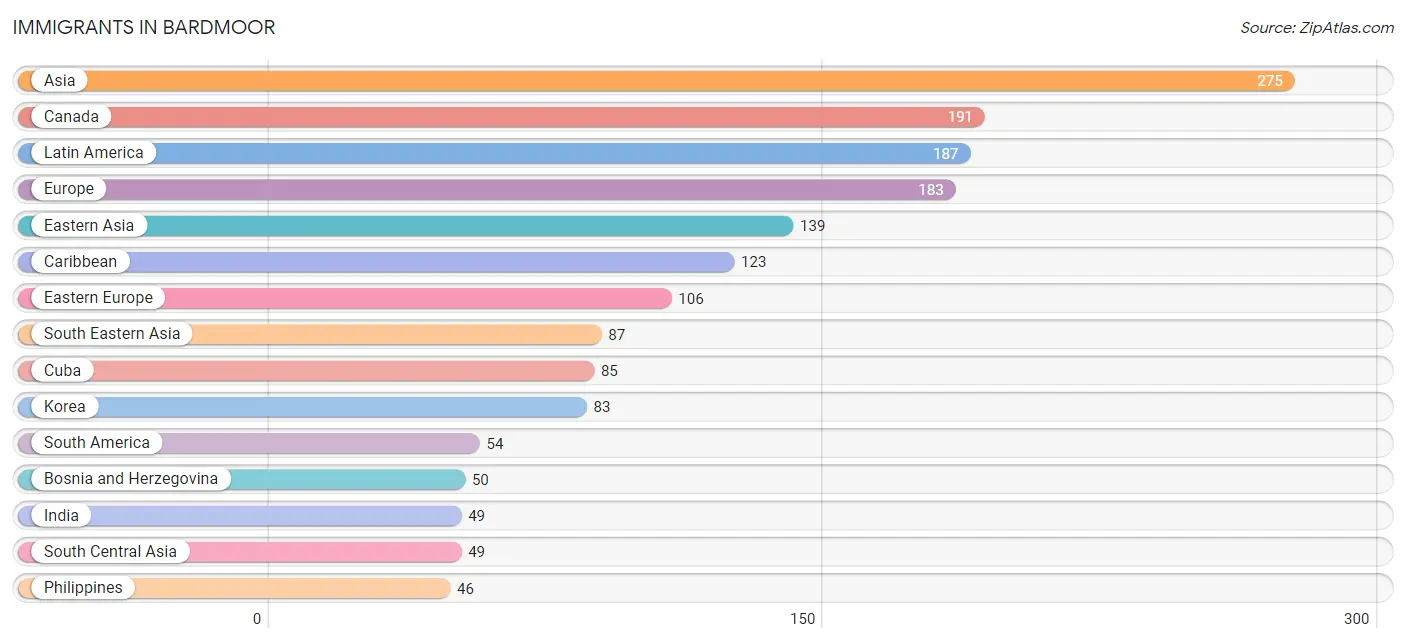
| Immigration Origin | # Population | % Population |
| Asia | 275 | 2.8% |
| Australia | 16 | 0.2% |
| Bosnia and Herzegovina | 50 | 0.5% |
| Bulgaria | 30 | 0.3% |
| Canada | 191 | 1.9% |
| Caribbean | 123 | 1.3% |
| Central America | 10 | 0.1% |
| China | 39 | 0.4% |
| Colombia | 6 | 0.1% |
| Cuba | 85 | 0.9% |
| Dominican Republic | 12 | 0.1% |
| Eastern Asia | 139 | 1.4% |
| Eastern Europe | 106 | 1.1% |
| Europe | 183 | 1.9% |
| Germany | 37 | 0.4% |
| India | 49 | 0.5% |
| Jamaica | 26 | 0.3% |
| Japan | 17 | 0.2% |
| Korea | 83 | 0.8% |
| Latin America | 187 | 1.9% |
| Mexico | 10 | 0.1% |
| Northern Europe | 40 | 0.4% |
| Oceania | 16 | 0.2% |
| Peru | 37 | 0.4% |
| Philippines | 46 | 0.5% |
| Romania | 26 | 0.3% |
| Singapore | 7 | 0.1% |
| South America | 54 | 0.5% |
| South Central Asia | 49 | 0.5% |
| South Eastern Asia | 87 | 0.9% |
| Thailand | 10 | 0.1% |
| Venezuela | 11 | 0.1% |
| Vietnam | 24 | 0.2% |
| Western Europe | 37 | 0.4% | View All 34 Rows |
Sex and Age in Bardmoor
Sex and Age in Bardmoor
The most populous age groups in Bardmoor are 55 to 59 Years (568 | 11.7%) for men and 60 to 64 Years (501 | 10.1%) for women.
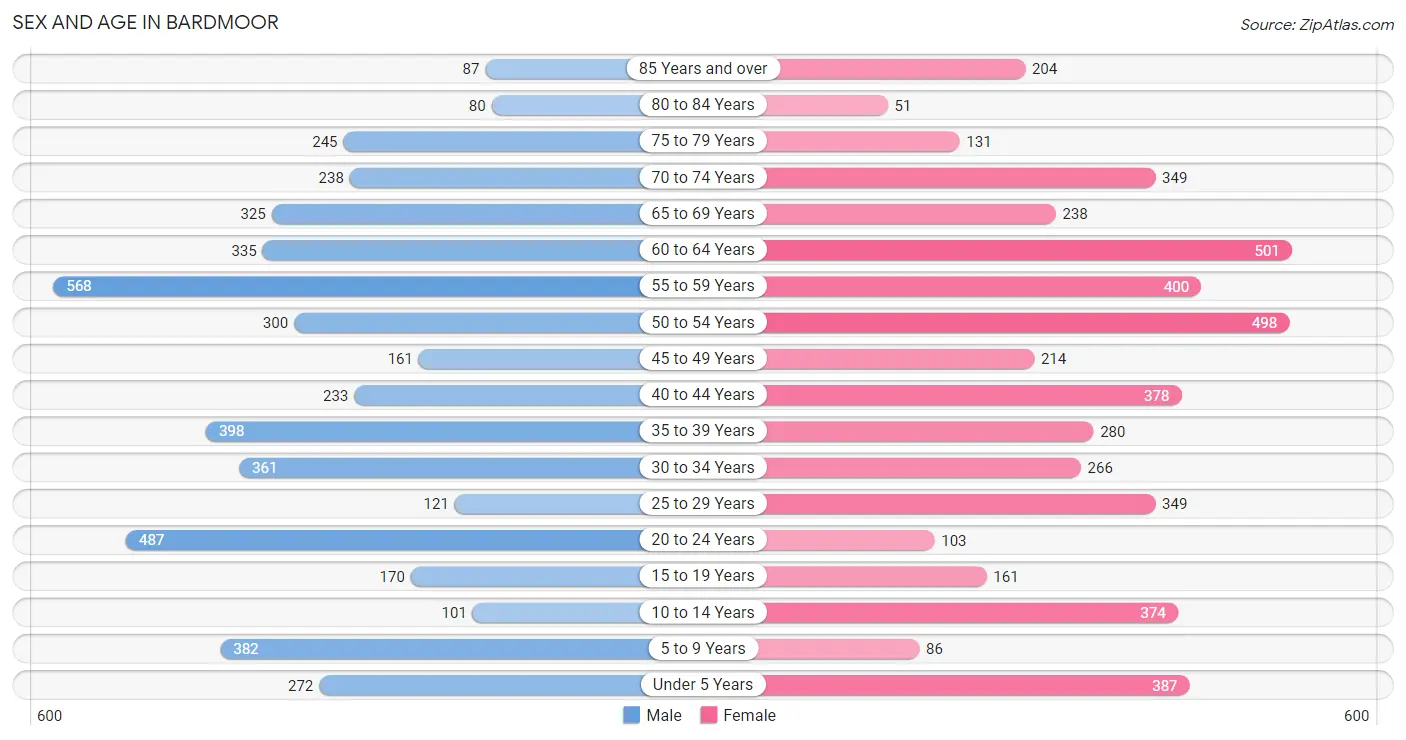
| Age Bracket | Male | Female |
| Under 5 Years | 272 (5.6%) | 387 (7.8%) |
| 5 to 9 Years | 382 (7.9%) | 86 (1.7%) |
| 10 to 14 Years | 101 (2.1%) | 374 (7.5%) |
| 15 to 19 Years | 170 (3.5%) | 161 (3.2%) |
| 20 to 24 Years | 487 (10.0%) | 103 (2.1%) |
| 25 to 29 Years | 121 (2.5%) | 349 (7.0%) |
| 30 to 34 Years | 361 (7.4%) | 266 (5.3%) |
| 35 to 39 Years | 398 (8.2%) | 280 (5.6%) |
| 40 to 44 Years | 233 (4.8%) | 378 (7.6%) |
| 45 to 49 Years | 161 (3.3%) | 214 (4.3%) |
| 50 to 54 Years | 300 (6.2%) | 498 (10.0%) |
| 55 to 59 Years | 568 (11.7%) | 400 (8.1%) |
| 60 to 64 Years | 335 (6.9%) | 501 (10.1%) |
| 65 to 69 Years | 325 (6.7%) | 238 (4.8%) |
| 70 to 74 Years | 238 (4.9%) | 349 (7.0%) |
| 75 to 79 Years | 245 (5.0%) | 131 (2.6%) |
| 80 to 84 Years | 80 (1.6%) | 51 (1.0%) |
| 85 Years and over | 87 (1.8%) | 204 (4.1%) |
| Total | 4,864 (100.0%) | 4,970 (100.0%) |
Families and Households in Bardmoor
Median Family Size in Bardmoor
The median family size in Bardmoor is 3.14 persons per family, with single female/mother families (179 | 7.4%) accounting for the largest median family size of 4.15 persons per family. On the other hand, single male/father families (189 | 7.9%) represent the smallest median family size with 2.77 persons per family.
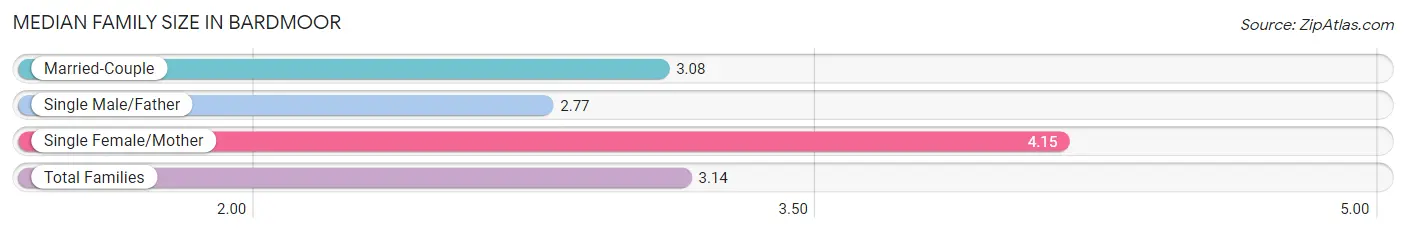
| Family Type | # Families | Family Size |
| Married-Couple | 2,038 (84.7%) | 3.08 |
| Single Male/Father | 189 (7.9%) | 2.77 |
| Single Female/Mother | 179 (7.4%) | 4.15 |
| Total Families | 2,406 (100.0%) | 3.14 |
Median Household Size in Bardmoor
The median household size in Bardmoor is 2.45 persons per household, with single female/mother households (179 | 4.5%) accounting for the largest median household size of 4.15 persons per household. non-family households (1,611 | 40.1%) represent the smallest median household size with 1.19 persons per household.
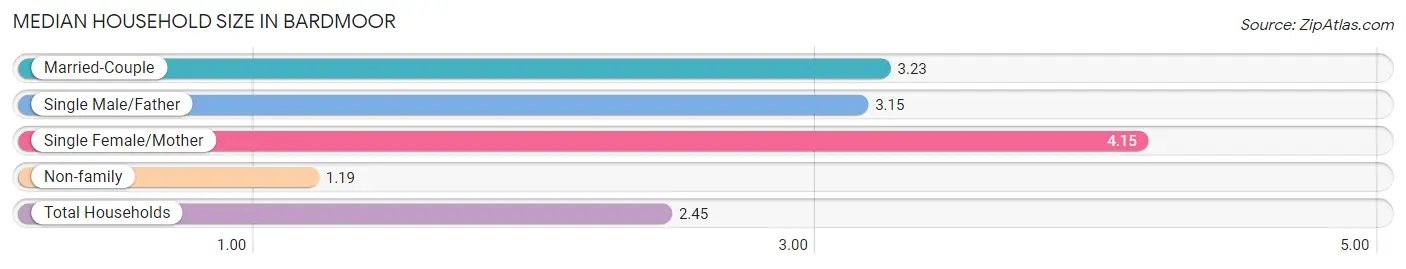
| Household Type | # Households | Household Size |
| Married-Couple | 2,038 (50.7%) | 3.23 |
| Single Male/Father | 189 (4.7%) | 3.15 |
| Single Female/Mother | 179 (4.5%) | 4.15 |
| Non-family | 1,611 (40.1%) | 1.19 |
| Total Households | 4,017 (100.0%) | 2.45 |
Household Size by Marriage Status in Bardmoor
Out of a total of 4,017 households in Bardmoor, 2,406 (59.9%) are family households, while 1,611 (40.1%) are nonfamily households. The most numerous type of family households are 2-person households, comprising 1,001, and the most common type of nonfamily households are 1-person households, comprising 1,352.
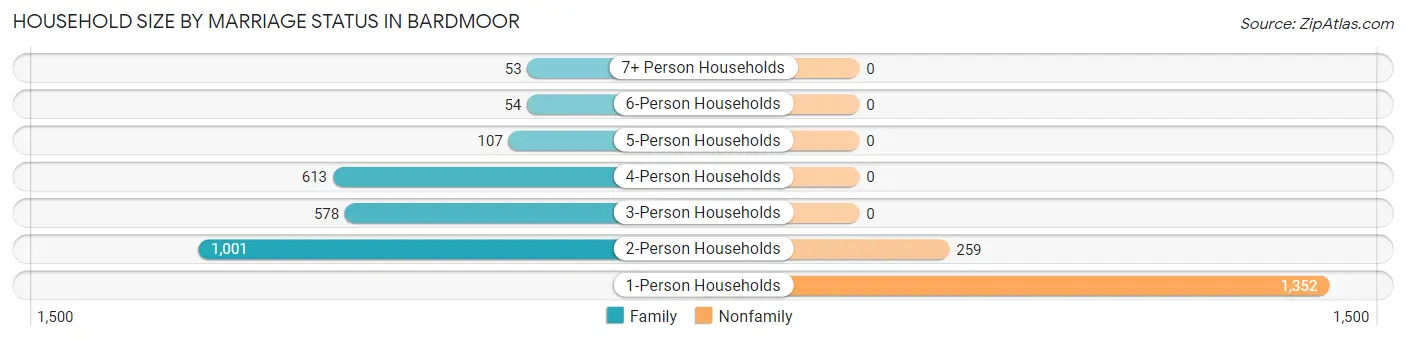
| Household Size | Family Households | Nonfamily Households |
| 1-Person Households | - | 1,352 (33.7%) |
| 2-Person Households | 1,001 (24.9%) | 259 (6.5%) |
| 3-Person Households | 578 (14.4%) | 0 (0.0%) |
| 4-Person Households | 613 (15.3%) | 0 (0.0%) |
| 5-Person Households | 107 (2.7%) | 0 (0.0%) |
| 6-Person Households | 54 (1.3%) | 0 (0.0%) |
| 7+ Person Households | 53 (1.3%) | 0 (0.0%) |
| Total | 2,406 (59.9%) | 1,611 (40.1%) |
Female Fertility in Bardmoor
Fertility by Age in Bardmoor
Average fertility rate in Bardmoor is 60.0 births per 1,000 women. Women in the age bracket of 20 to 34 years have the highest fertility rate with 155.0 births per 1,000 women. Women in the age bracket of 20 to 34 years acount for 100.0% of all women with births.
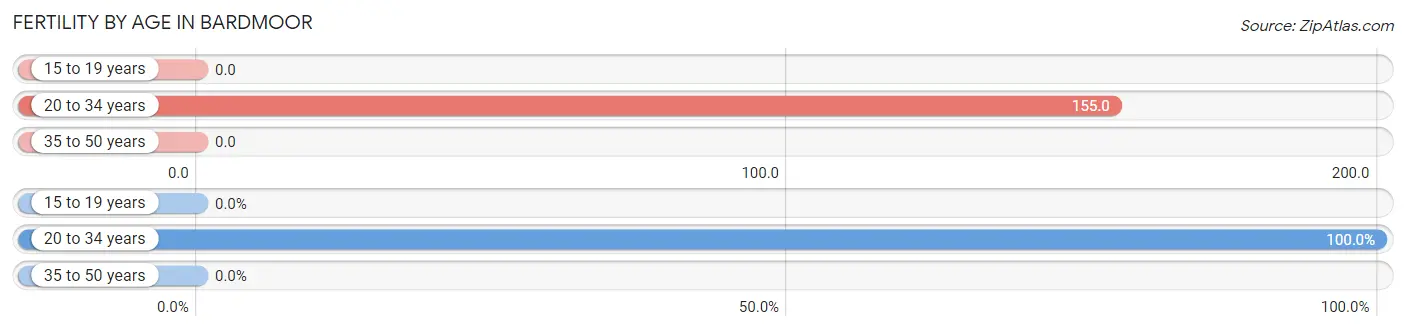
| Age Bracket | Women with Births | Births / 1,000 Women |
| 15 to 19 years | 0 (0.0%) | 0.0 |
| 20 to 34 years | 111 (100.0%) | 155.0 |
| 35 to 50 years | 0 (0.0%) | 0.0 |
| Total | 111 (100.0%) | 60.0 |
Fertility by Age by Marriage Status in Bardmoor
79.3% of women with births (111) in Bardmoor are married. The highest percentage of unmarried women with births falls into 20 to 34 years age bracket with 20.7% of them unmarried at the time of birth, while the lowest percentage of unmarried women with births belong to 20 to 34 years age bracket with 20.7% of them unmarried.
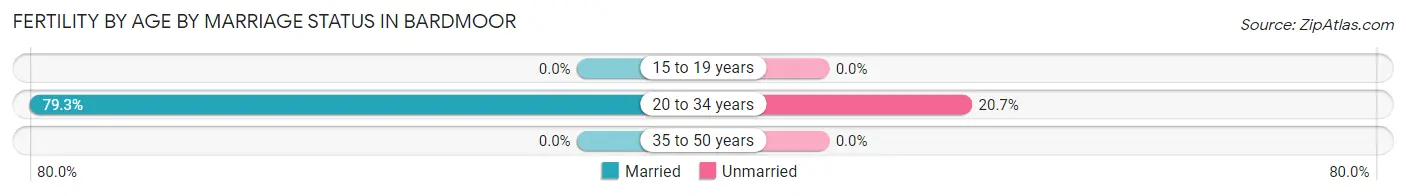
| Age Bracket | Married | Unmarried |
| 15 to 19 years | 0 (0.0%) | 0 (0.0%) |
| 20 to 34 years | 88 (79.3%) | 23 (20.7%) |
| 35 to 50 years | 0 (0.0%) | 0 (0.0%) |
| Total | 88 (79.3%) | 23 (20.7%) |
Fertility by Education in Bardmoor
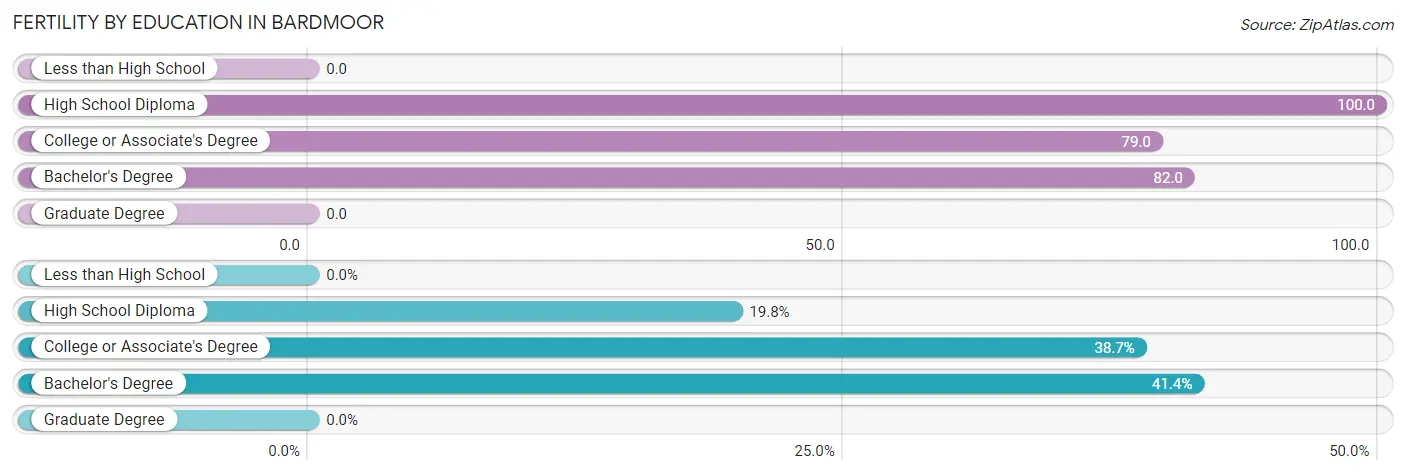
| Educational Attainment | Women with Births | Births / 1,000 Women |
| Less than High School | 0 (0.0%) | 0.0 |
| High School Diploma | 22 (19.8%) | 100.0 |
| College or Associate's Degree | 43 (38.7%) | 79.0 |
| Bachelor's Degree | 46 (41.4%) | 82.0 |
| Graduate Degree | 0 (0.0%) | 0.0 |
| Total | 111 (100.0%) | 60.0 |
Fertility by Education by Marriage Status in Bardmoor
20.7% of women with births in Bardmoor are unmarried. Women with the educational attainment of high school diploma are most likely to be married with 100.0% of them married at childbirth, while women with the educational attainment of college or associate's degree are least likely to be married with 53.5% of them unmarried at childbirth.
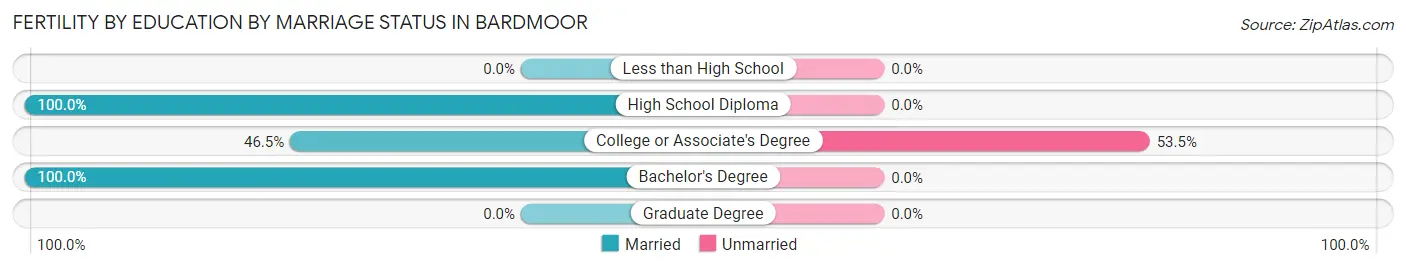
| Educational Attainment | Married | Unmarried |
| Less than High School | 0 (0.0%) | 0 (0.0%) |
| High School Diploma | 22 (100.0%) | 0 (0.0%) |
| College or Associate's Degree | 20 (46.5%) | 23 (53.5%) |
| Bachelor's Degree | 46 (100.0%) | 0 (0.0%) |
| Graduate Degree | 0 (0.0%) | 0 (0.0%) |
| Total | 88 (79.3%) | 23 (20.7%) |
Employment Characteristics in Bardmoor
Employment by Class of Employer in Bardmoor
Among the 5,093 employed individuals in Bardmoor, private company employees (3,357 | 65.9%), not-for-profit organizations (475 | 9.3%), and local government employees (365 | 7.2%) make up the most common classes of employment.
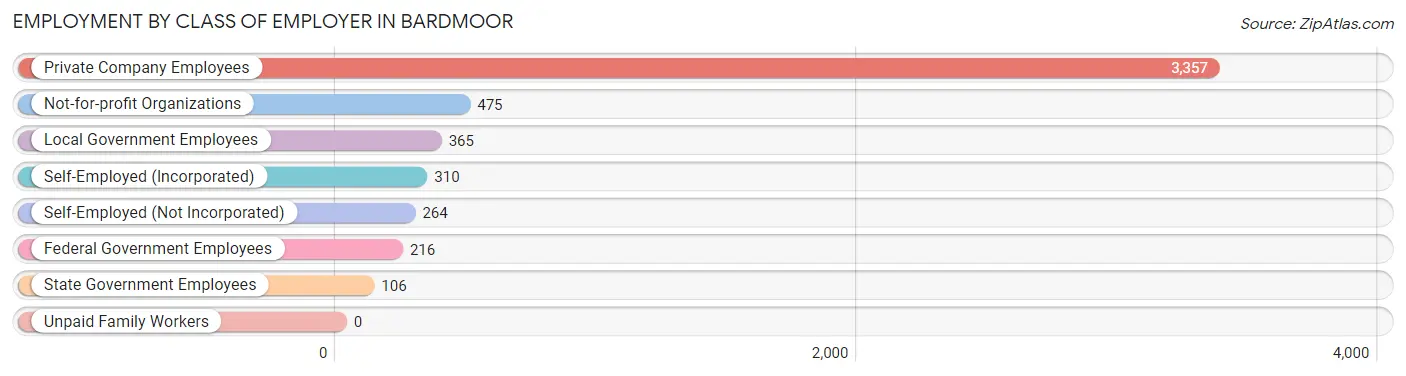
| Employer Class | # Employees | % Employees |
| Private Company Employees | 3,357 | 65.9% |
| Self-Employed (Incorporated) | 310 | 6.1% |
| Self-Employed (Not Incorporated) | 264 | 5.2% |
| Not-for-profit Organizations | 475 | 9.3% |
| Local Government Employees | 365 | 7.2% |
| State Government Employees | 106 | 2.1% |
| Federal Government Employees | 216 | 4.2% |
| Unpaid Family Workers | 0 | 0.0% |
| Total | 5,093 | 100.0% |
Employment Status by Age in Bardmoor
According to the labor force statistics for Bardmoor, out of the total population over 16 years of age (8,139), 66.2% or 5,388 individuals are in the labor force, with 3.0% or 162 of them unemployed. The age group with the highest labor force participation rate is 35 to 44 years, with 90.8% or 1,170 individuals in the labor force. Within the labor force, the 16 to 19 years age range has the highest percentage of unemployed individuals, with 27.1% or 39 of them being unemployed.
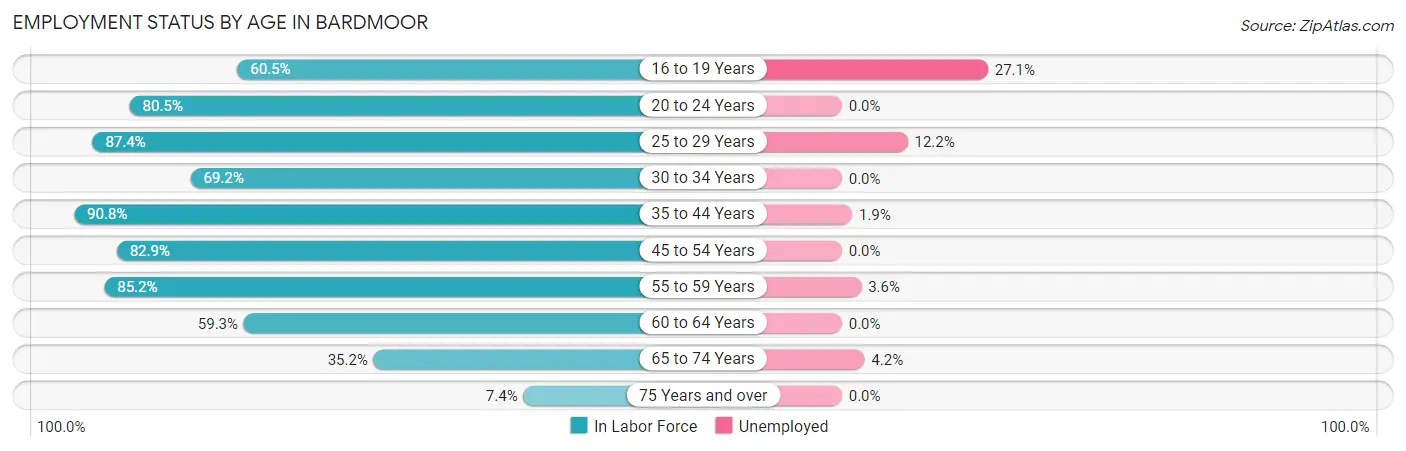
| Age Bracket | In Labor Force | Unemployed |
| 16 to 19 Years | 144 (60.5%) | 39 (27.1%) |
| 20 to 24 Years | 475 (80.5%) | 0 (0.0%) |
| 25 to 29 Years | 411 (87.4%) | 50 (12.2%) |
| 30 to 34 Years | 434 (69.2%) | 0 (0.0%) |
| 35 to 44 Years | 1,170 (90.8%) | 22 (1.9%) |
| 45 to 54 Years | 972 (82.9%) | 0 (0.0%) |
| 55 to 59 Years | 825 (85.2%) | 30 (3.6%) |
| 60 to 64 Years | 496 (59.3%) | 0 (0.0%) |
| 65 to 74 Years | 405 (35.2%) | 17 (4.2%) |
| 75 Years and over | 59 (7.4%) | 0 (0.0%) |
| Total | 5,388 (66.2%) | 162 (3.0%) |
Employment Status by Educational Attainment in Bardmoor
According to labor force statistics for Bardmoor, 80.3% of individuals (4,306) out of the total population between 25 and 64 years of age (5,363) are in the labor force, with 2.4% or 103 of them being unemployed. The group with the highest labor force participation rate are those with the educational attainment of college / associate degree, with 87.4% or 1,405 individuals in the labor force. Within the labor force, individuals with less than high school education have the highest percentage of unemployment, with 11.8% or 32 of them being unemployed.
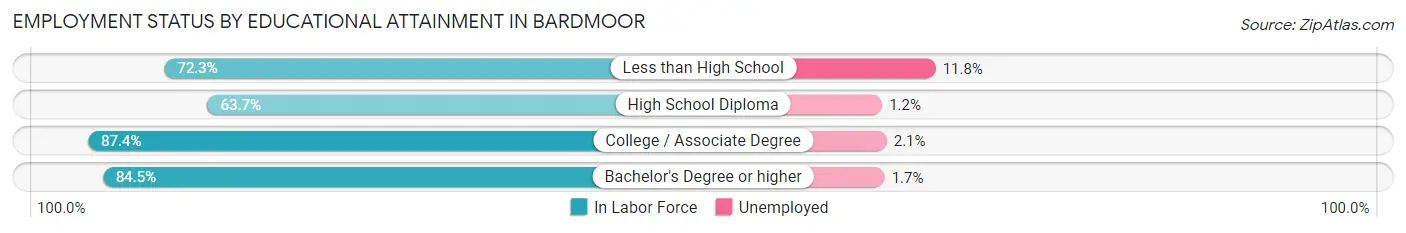
| Educational Attainment | In Labor Force | Unemployed |
| Less than High School | 271 (72.3%) | 44 (11.8%) |
| High School Diploma | 683 (63.7%) | 13 (1.2%) |
| College / Associate Degree | 1,405 (87.4%) | 34 (2.1%) |
| Bachelor's Degree or higher | 1,951 (84.5%) | 39 (1.7%) |
| Total | 4,306 (80.3%) | 129 (2.4%) |
Employment Occupations by Sex in Bardmoor
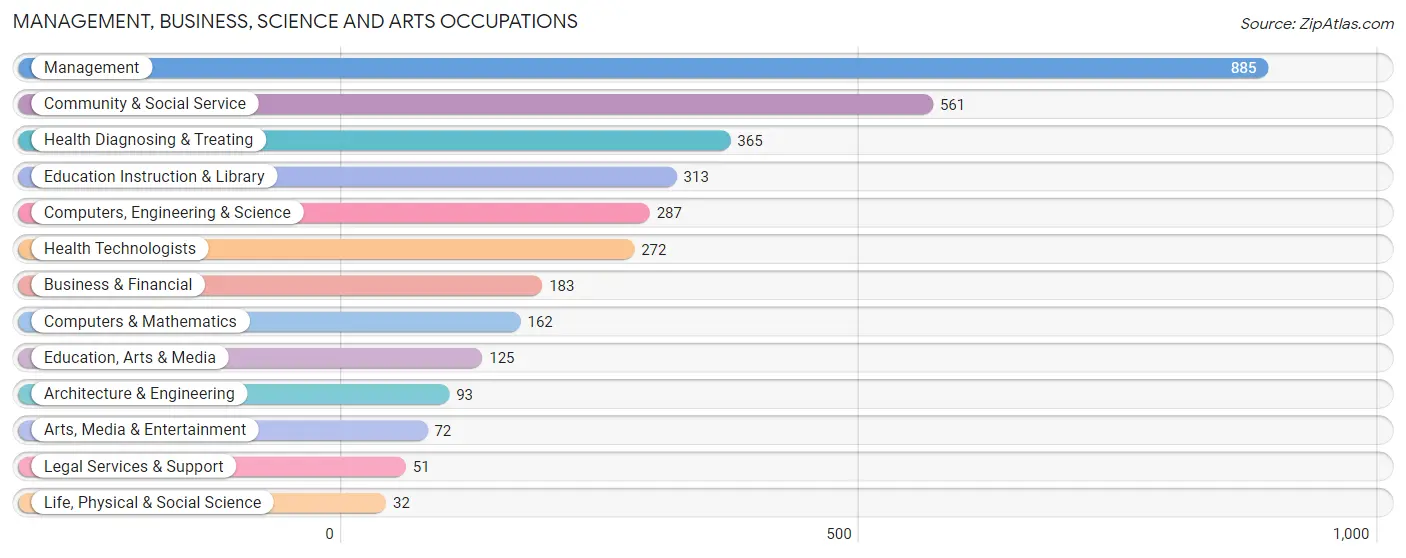
Management, Business, Science and Arts Occupations
The most common Management, Business, Science and Arts occupations in Bardmoor are Management (885 | 17.4%), Community & Social Service (561 | 11.1%), Health Diagnosing & Treating (365 | 7.2%), Education Instruction & Library (313 | 6.2%), and Computers, Engineering & Science (287 | 5.7%).
Management, Business, Science and Arts Occupations by Sex
Within the Management, Business, Science and Arts occupations in Bardmoor, the most male-oriented occupations are Life, Physical & Social Science (100.0%), Legal Services & Support (90.2%), and Computers & Mathematics (73.5%), while the most female-oriented occupations are Education, Arts & Media (98.4%), Health Technologists (87.9%), and Health Diagnosing & Treating (85.2%).
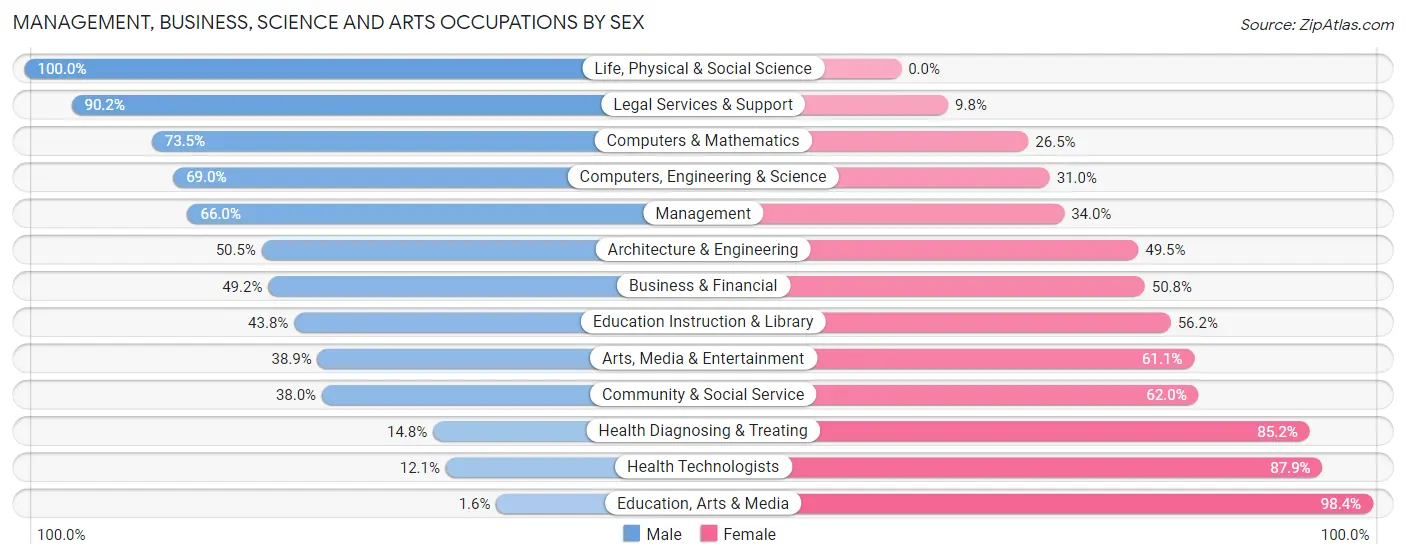
| Occupation | Male | Female |
| Management | 584 (66.0%) | 301 (34.0%) |
| Business & Financial | 90 (49.2%) | 93 (50.8%) |
| Computers, Engineering & Science | 198 (69.0%) | 89 (31.0%) |
| Computers & Mathematics | 119 (73.5%) | 43 (26.5%) |
| Architecture & Engineering | 47 (50.5%) | 46 (49.5%) |
| Life, Physical & Social Science | 32 (100.0%) | 0 (0.0%) |
| Community & Social Service | 213 (38.0%) | 348 (62.0%) |
| Education, Arts & Media | 2 (1.6%) | 123 (98.4%) |
| Legal Services & Support | 46 (90.2%) | 5 (9.8%) |
| Education Instruction & Library | 137 (43.8%) | 176 (56.2%) |
| Arts, Media & Entertainment | 28 (38.9%) | 44 (61.1%) |
| Health Diagnosing & Treating | 54 (14.8%) | 311 (85.2%) |
| Health Technologists | 33 (12.1%) | 239 (87.9%) |
| Total (Category) | 1,139 (49.9%) | 1,142 (50.1%) |
| Total (Overall) | 2,606 (51.3%) | 2,472 (48.7%) |
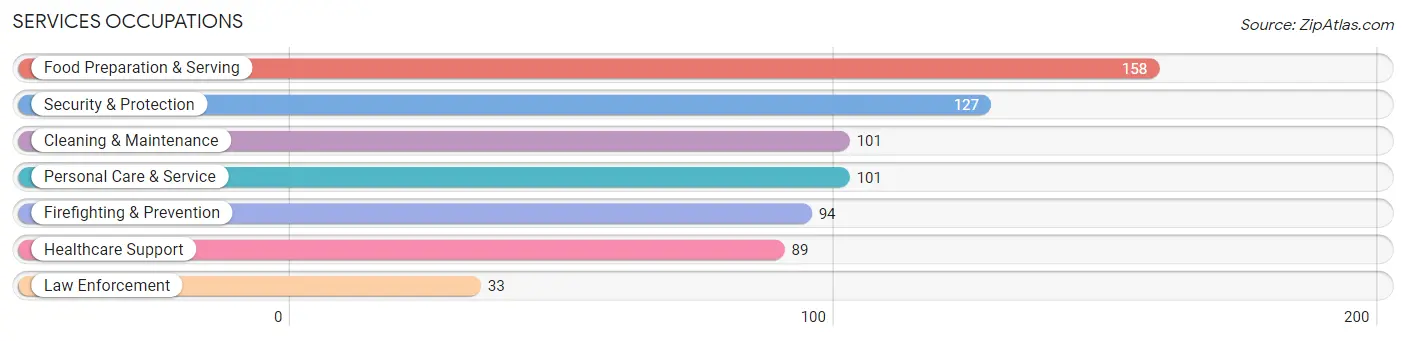
Services Occupations
The most common Services occupations in Bardmoor are Food Preparation & Serving (158 | 3.1%), Security & Protection (127 | 2.5%), Cleaning & Maintenance (101 | 2.0%), Personal Care & Service (101 | 2.0%), and Firefighting & Prevention (94 | 1.8%).
Services Occupations by Sex
Within the Services occupations in Bardmoor, the most male-oriented occupations are Firefighting & Prevention (56.4%), Cleaning & Maintenance (55.4%), and Security & Protection (55.1%), while the most female-oriented occupations are Healthcare Support (75.3%), Personal Care & Service (67.3%), and Food Preparation & Serving (55.7%).
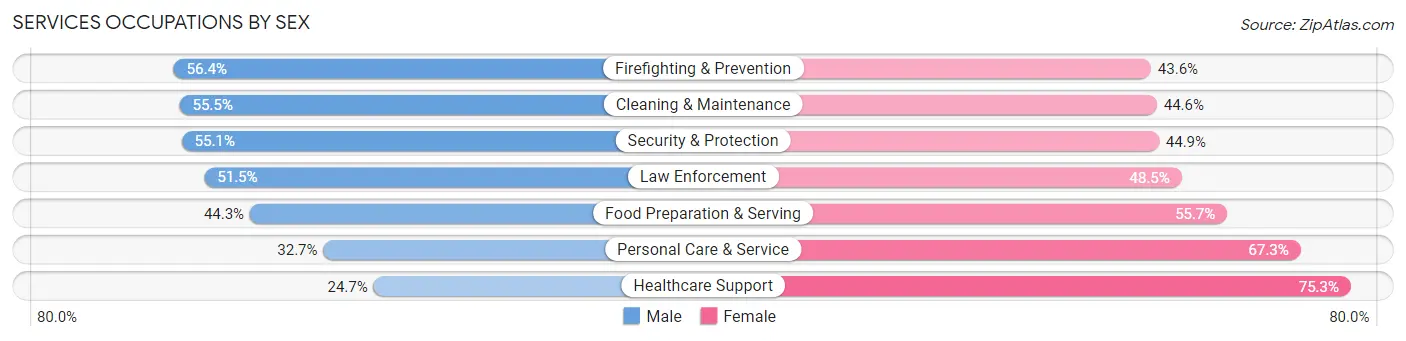
| Occupation | Male | Female |
| Healthcare Support | 22 (24.7%) | 67 (75.3%) |
| Security & Protection | 70 (55.1%) | 57 (44.9%) |
| Firefighting & Prevention | 53 (56.4%) | 41 (43.6%) |
| Law Enforcement | 17 (51.5%) | 16 (48.5%) |
| Food Preparation & Serving | 70 (44.3%) | 88 (55.7%) |
| Cleaning & Maintenance | 56 (55.4%) | 45 (44.6%) |
| Personal Care & Service | 33 (32.7%) | 68 (67.3%) |
| Total (Category) | 251 (43.6%) | 325 (56.4%) |
| Total (Overall) | 2,606 (51.3%) | 2,472 (48.7%) |
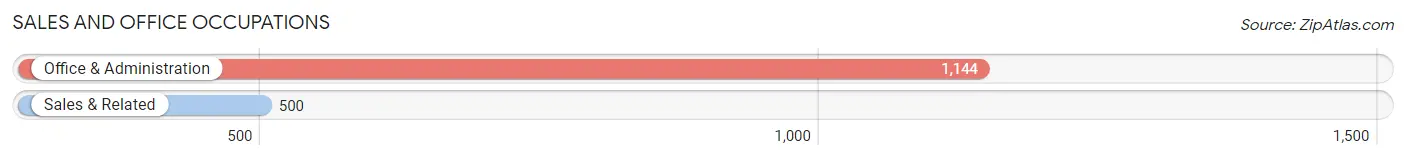
Sales and Office Occupations
The most common Sales and Office occupations in Bardmoor are Office & Administration (1,144 | 22.5%), and Sales & Related (500 | 9.9%).
Sales and Office Occupations by Sex
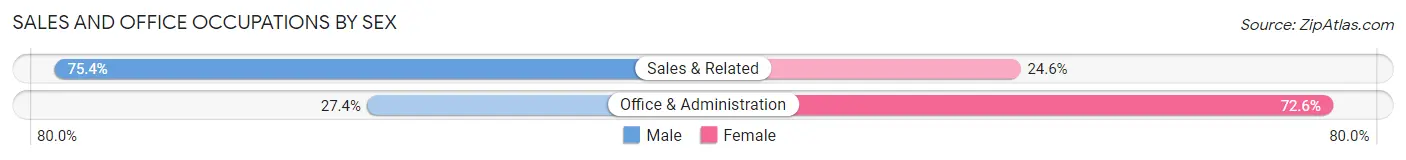
| Occupation | Male | Female |
| Sales & Related | 377 (75.4%) | 123 (24.6%) |
| Office & Administration | 313 (27.4%) | 831 (72.6%) |
| Total (Category) | 690 (42.0%) | 954 (58.0%) |
| Total (Overall) | 2,606 (51.3%) | 2,472 (48.7%) |
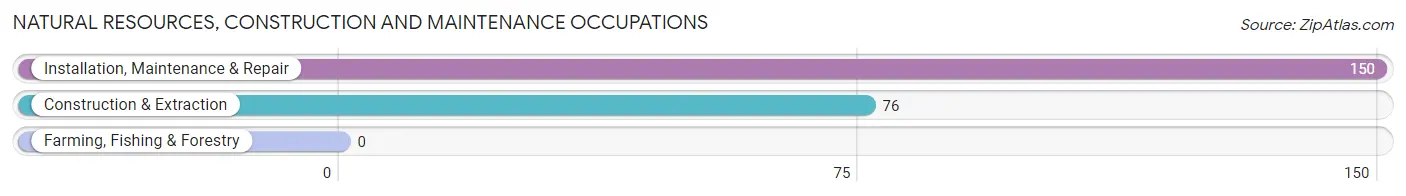
Natural Resources, Construction and Maintenance Occupations
The most common Natural Resources, Construction and Maintenance occupations in Bardmoor are Installation, Maintenance & Repair (150 | 2.9%), and Construction & Extraction (76 | 1.5%).
Natural Resources, Construction and Maintenance Occupations by Sex
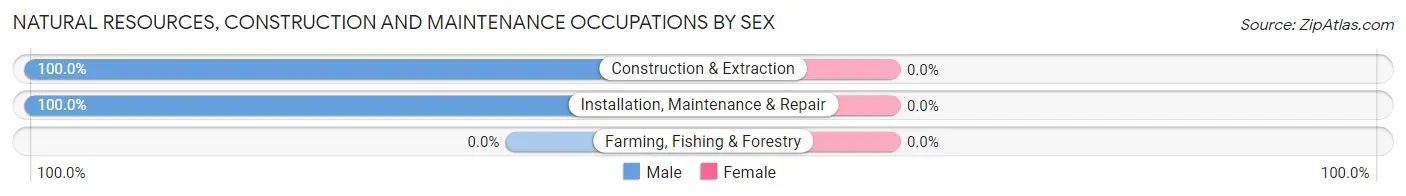
| Occupation | Male | Female |
| Farming, Fishing & Forestry | 0 (0.0%) | 0 (0.0%) |
| Construction & Extraction | 76 (100.0%) | 0 (0.0%) |
| Installation, Maintenance & Repair | 150 (100.0%) | 0 (0.0%) |
| Total (Category) | 226 (100.0%) | 0 (0.0%) |
| Total (Overall) | 2,606 (51.3%) | 2,472 (48.7%) |
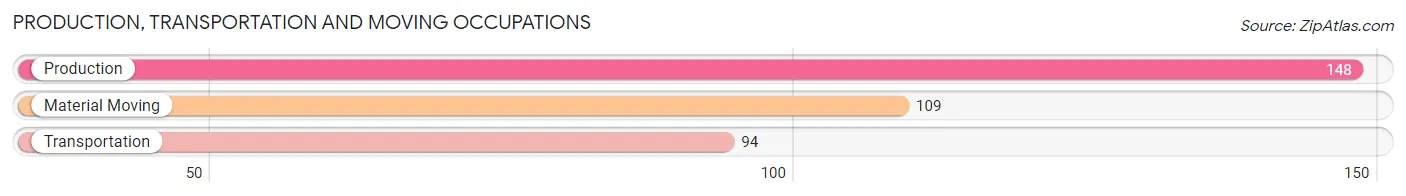
Production, Transportation and Moving Occupations
The most common Production, Transportation and Moving occupations in Bardmoor are Production (148 | 2.9%), Material Moving (109 | 2.1%), and Transportation (94 | 1.8%).
Production, Transportation and Moving Occupations by Sex
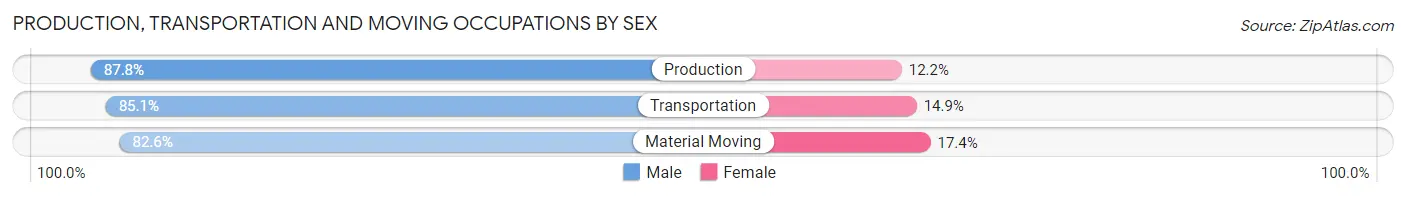
| Occupation | Male | Female |
| Production | 130 (87.8%) | 18 (12.2%) |
| Transportation | 80 (85.1%) | 14 (14.9%) |
| Material Moving | 90 (82.6%) | 19 (17.4%) |
| Total (Category) | 300 (85.5%) | 51 (14.5%) |
| Total (Overall) | 2,606 (51.3%) | 2,472 (48.7%) |
Employment Industries by Sex in Bardmoor
Employment Industries in Bardmoor
The major employment industries in Bardmoor include Health Care & Social Assistance (749 | 14.7%), Retail Trade (736 | 14.5%), Finance & Insurance (497 | 9.8%), Educational Services (468 | 9.2%), and Professional & Scientific (446 | 8.8%).
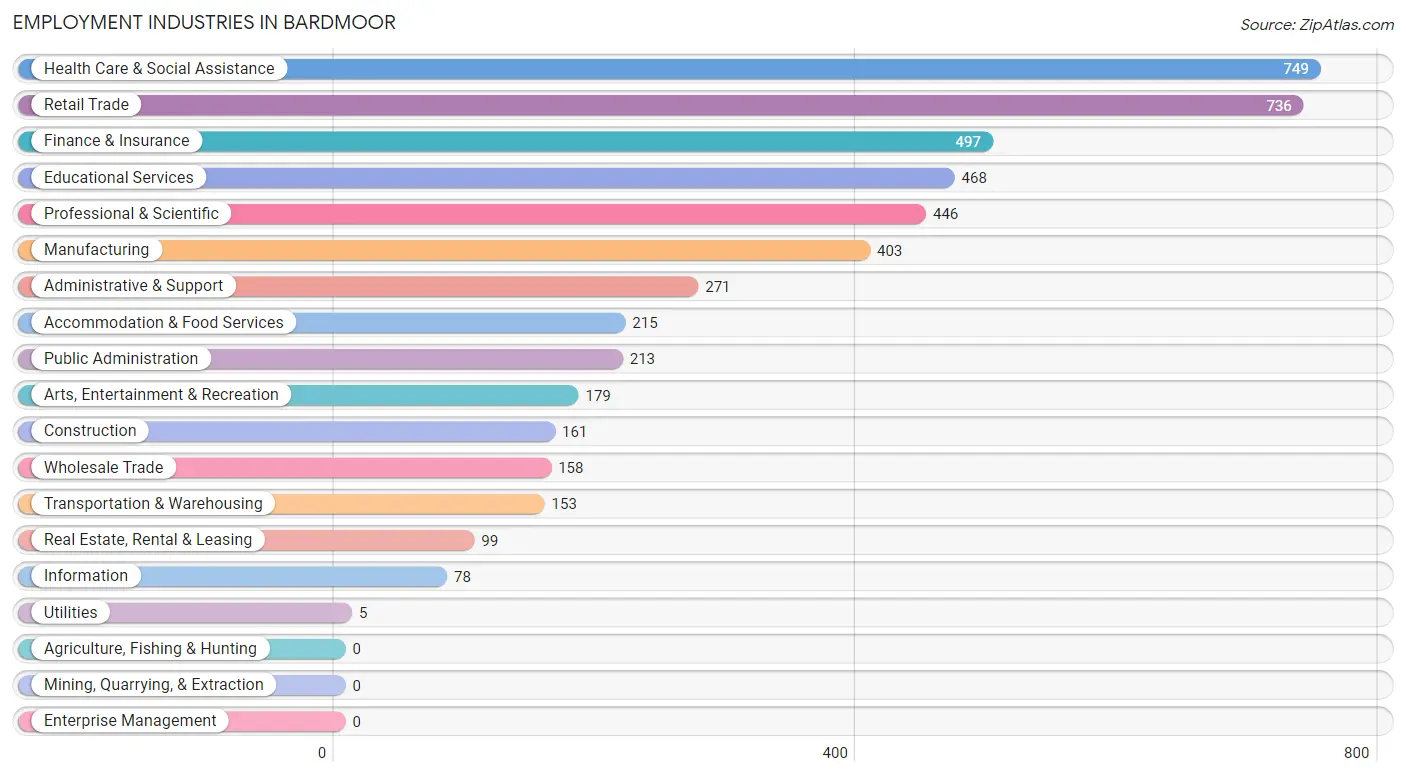
Employment Industries by Sex in Bardmoor
The Bardmoor industries that see more men than women are Real Estate, Rental & Leasing (86.9%), Transportation & Warehousing (84.3%), and Information (73.1%), whereas the industries that tend to have a higher number of women are Utilities (100.0%), Finance & Insurance (79.5%), and Educational Services (66.0%).
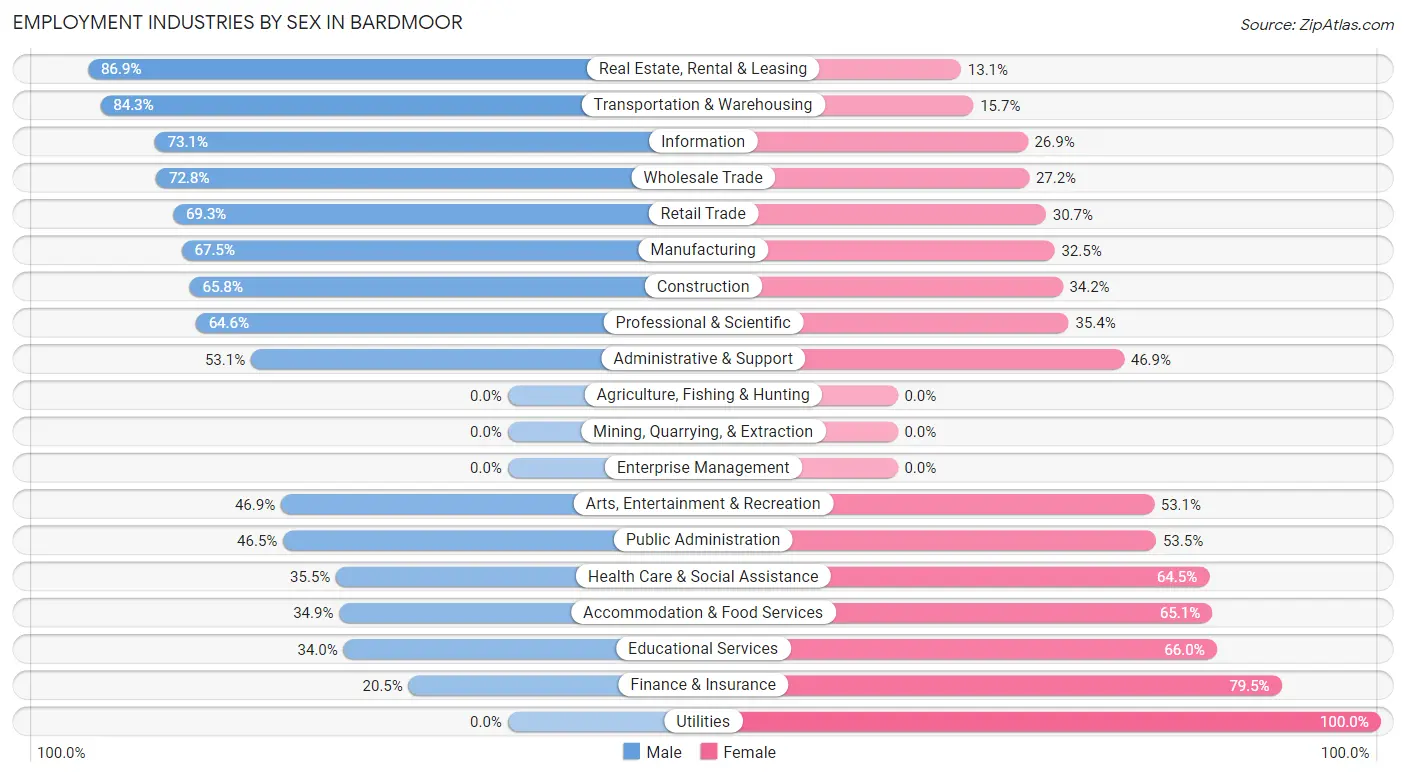
| Industry | Male | Female |
| Agriculture, Fishing & Hunting | 0 (0.0%) | 0 (0.0%) |
| Mining, Quarrying, & Extraction | 0 (0.0%) | 0 (0.0%) |
| Construction | 106 (65.8%) | 55 (34.2%) |
| Manufacturing | 272 (67.5%) | 131 (32.5%) |
| Wholesale Trade | 115 (72.8%) | 43 (27.2%) |
| Retail Trade | 510 (69.3%) | 226 (30.7%) |
| Transportation & Warehousing | 129 (84.3%) | 24 (15.7%) |
| Utilities | 0 (0.0%) | 5 (100.0%) |
| Information | 57 (73.1%) | 21 (26.9%) |
| Finance & Insurance | 102 (20.5%) | 395 (79.5%) |
| Real Estate, Rental & Leasing | 86 (86.9%) | 13 (13.1%) |
| Professional & Scientific | 288 (64.6%) | 158 (35.4%) |
| Enterprise Management | 0 (0.0%) | 0 (0.0%) |
| Administrative & Support | 144 (53.1%) | 127 (46.9%) |
| Educational Services | 159 (34.0%) | 309 (66.0%) |
| Health Care & Social Assistance | 266 (35.5%) | 483 (64.5%) |
| Arts, Entertainment & Recreation | 84 (46.9%) | 95 (53.1%) |
| Accommodation & Food Services | 75 (34.9%) | 140 (65.1%) |
| Public Administration | 99 (46.5%) | 114 (53.5%) |
| Total | 2,606 (51.3%) | 2,472 (48.7%) |
Education in Bardmoor
School Enrollment in Bardmoor
The most common levels of schooling among the 2,601 students in Bardmoor are college / undergraduate (1,020 | 39.2%), middle school (393 | 15.1%), and high school (365 | 14.0%).
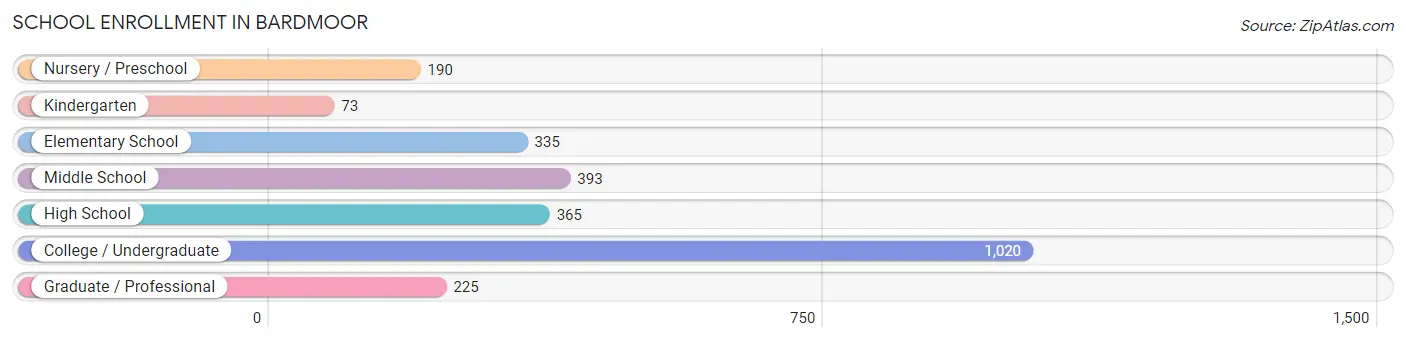
| School Level | # Students | % Students |
| Nursery / Preschool | 190 | 7.3% |
| Kindergarten | 73 | 2.8% |
| Elementary School | 335 | 12.9% |
| Middle School | 393 | 15.1% |
| High School | 365 | 14.0% |
| College / Undergraduate | 1,020 | 39.2% |
| Graduate / Professional | 225 | 8.6% |
| Total | 2,601 | 100.0% |
School Enrollment by Age by Funding Source in Bardmoor
Out of a total of 2,601 students who are enrolled in schools in Bardmoor, 624 (24.0%) attend a private institution, while the remaining 1,977 (76.0%) are enrolled in public schools. The age group of 3 to 4 year olds has the highest likelihood of being enrolled in private schools, with 116 (86.6% in the age bracket) enrolled. Conversely, the age group of 20 to 24 year olds has the lowest likelihood of being enrolled in a private school, with 358 (100.0% in the age bracket) attending a public institution.
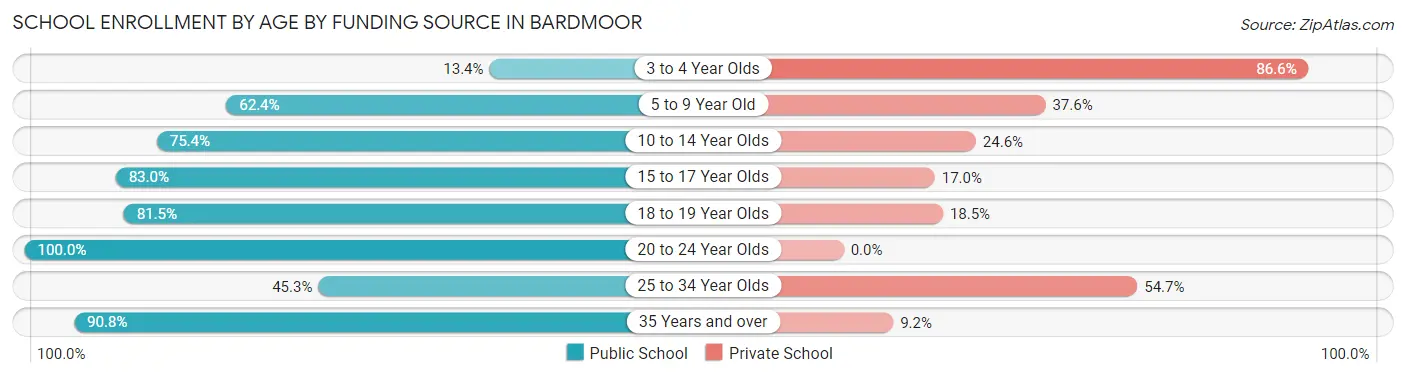
| Age Bracket | Public School | Private School |
| 3 to 4 Year Olds | 18 (13.4%) | 116 (86.6%) |
| 5 to 9 Year Old | 274 (62.4%) | 165 (37.6%) |
| 10 to 14 Year Olds | 358 (75.4%) | 117 (24.6%) |
| 15 to 17 Year Olds | 176 (83.0%) | 36 (17.0%) |
| 18 to 19 Year Olds | 97 (81.5%) | 22 (18.5%) |
| 20 to 24 Year Olds | 358 (100.0%) | 0 (0.0%) |
| 25 to 34 Year Olds | 87 (45.3%) | 105 (54.7%) |
| 35 Years and over | 610 (90.8%) | 62 (9.2%) |
| Total | 1,977 (76.0%) | 624 (24.0%) |
Educational Attainment by Field of Study in Bardmoor
Business (700 | 22.1%), liberal arts & history (445 | 14.1%), education (413 | 13.1%), science & technology (302 | 9.6%), and social sciences (189 | 6.0%) are the most common fields of study among 3,163 individuals in Bardmoor who have obtained a bachelor's degree or higher.
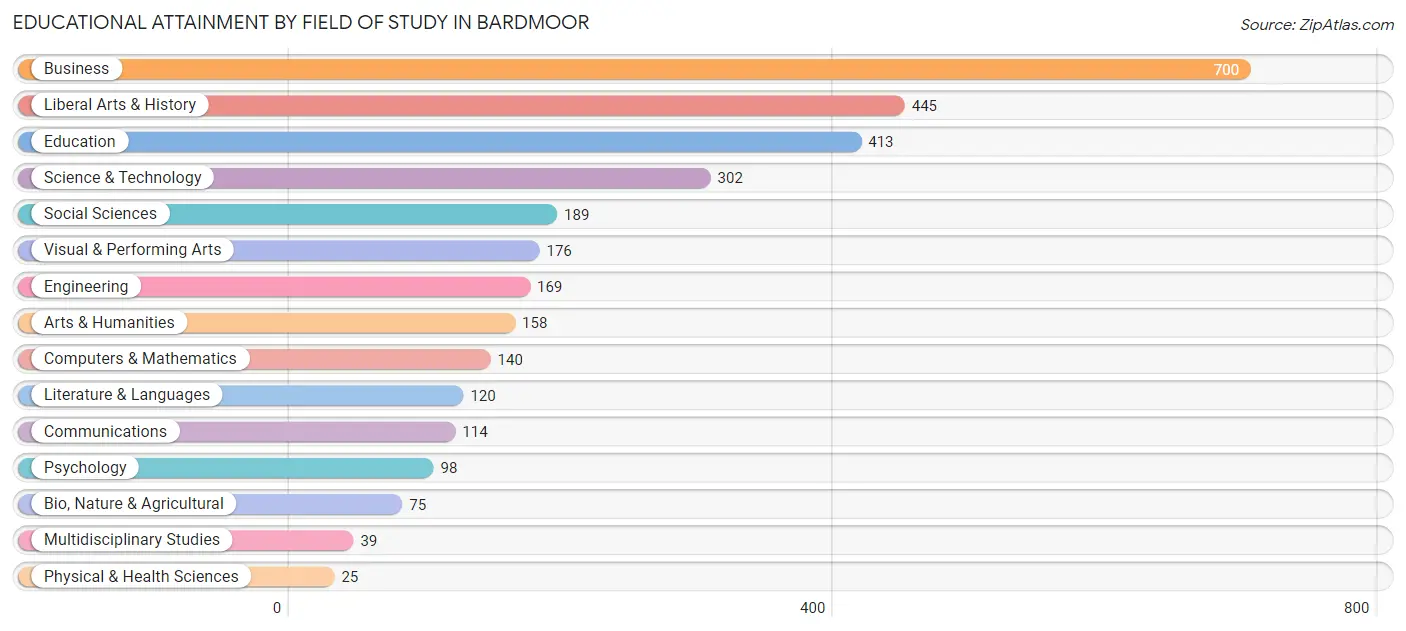
| Field of Study | # Graduates | % Graduates |
| Computers & Mathematics | 140 | 4.4% |
| Bio, Nature & Agricultural | 75 | 2.4% |
| Physical & Health Sciences | 25 | 0.8% |
| Psychology | 98 | 3.1% |
| Social Sciences | 189 | 6.0% |
| Engineering | 169 | 5.3% |
| Multidisciplinary Studies | 39 | 1.2% |
| Science & Technology | 302 | 9.6% |
| Business | 700 | 22.1% |
| Education | 413 | 13.1% |
| Literature & Languages | 120 | 3.8% |
| Liberal Arts & History | 445 | 14.1% |
| Visual & Performing Arts | 176 | 5.6% |
| Communications | 114 | 3.6% |
| Arts & Humanities | 158 | 5.0% |
| Total | 3,163 | 100.0% |
Transportation & Commute in Bardmoor
Vehicle Availability by Sex in Bardmoor
The most prevalent vehicle ownership categories in Bardmoor are males with 2 vehicles (1,148, accounting for 41.8%) and females with 2 vehicles (1,059, making up 48.9%).
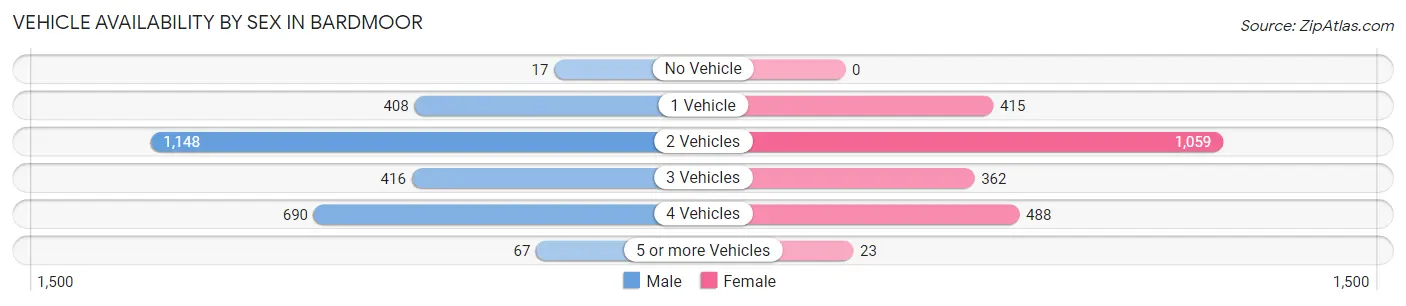
| Vehicles Available | Male | Female |
| No Vehicle | 17 (0.6%) | 0 (0.0%) |
| 1 Vehicle | 408 (14.9%) | 415 (17.7%) |
| 2 Vehicles | 1,148 (41.8%) | 1,059 (45.1%) |
| 3 Vehicles | 416 (15.1%) | 362 (15.4%) |
| 4 Vehicles | 690 (25.1%) | 488 (20.8%) |
| 5 or more Vehicles | 67 (2.4%) | 23 (1.0%) |
| Total | 2,746 (100.0%) | 2,347 (100.0%) |
Commute Time in Bardmoor
The most frequently occuring commute durations in Bardmoor are 15 to 19 minutes (1,063 commuters, 23.4%), 10 to 14 minutes (881 commuters, 19.4%), and 20 to 24 minutes (778 commuters, 17.1%).
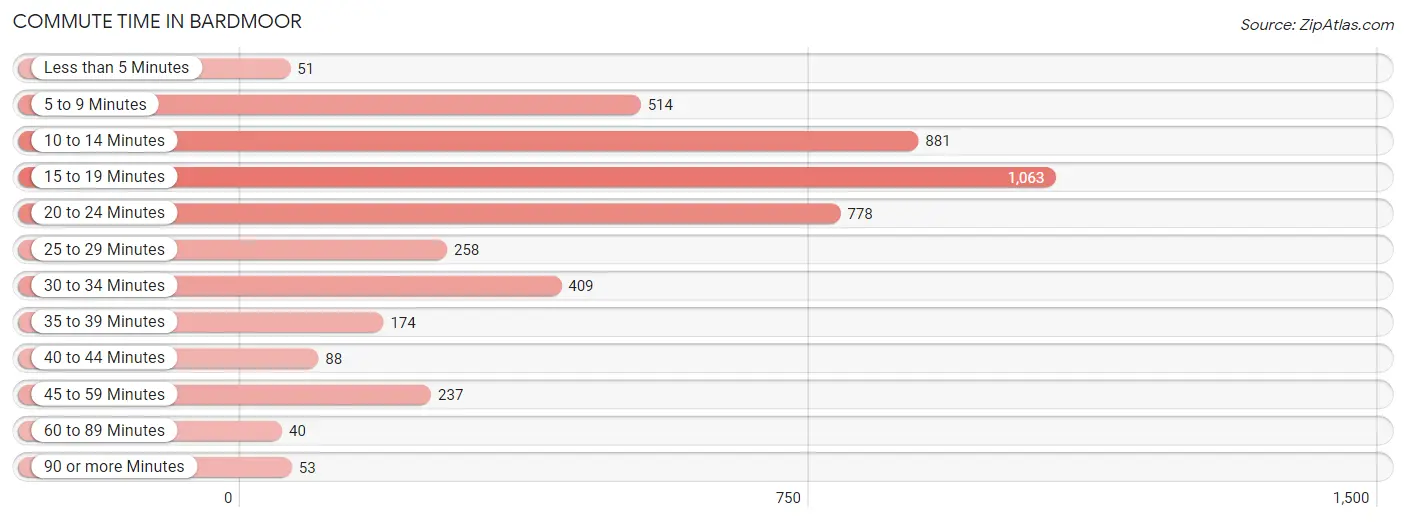
| Commute Time | # Commuters | % Commuters |
| Less than 5 Minutes | 51 | 1.1% |
| 5 to 9 Minutes | 514 | 11.3% |
| 10 to 14 Minutes | 881 | 19.4% |
| 15 to 19 Minutes | 1,063 | 23.4% |
| 20 to 24 Minutes | 778 | 17.1% |
| 25 to 29 Minutes | 258 | 5.7% |
| 30 to 34 Minutes | 409 | 9.0% |
| 35 to 39 Minutes | 174 | 3.8% |
| 40 to 44 Minutes | 88 | 1.9% |
| 45 to 59 Minutes | 237 | 5.2% |
| 60 to 89 Minutes | 40 | 0.9% |
| 90 or more Minutes | 53 | 1.2% |
Commute Time by Sex in Bardmoor
The most common commute times in Bardmoor are 10 to 14 minutes (569 commuters, 22.6%) for males and 15 to 19 minutes (532 commuters, 26.3%) for females.
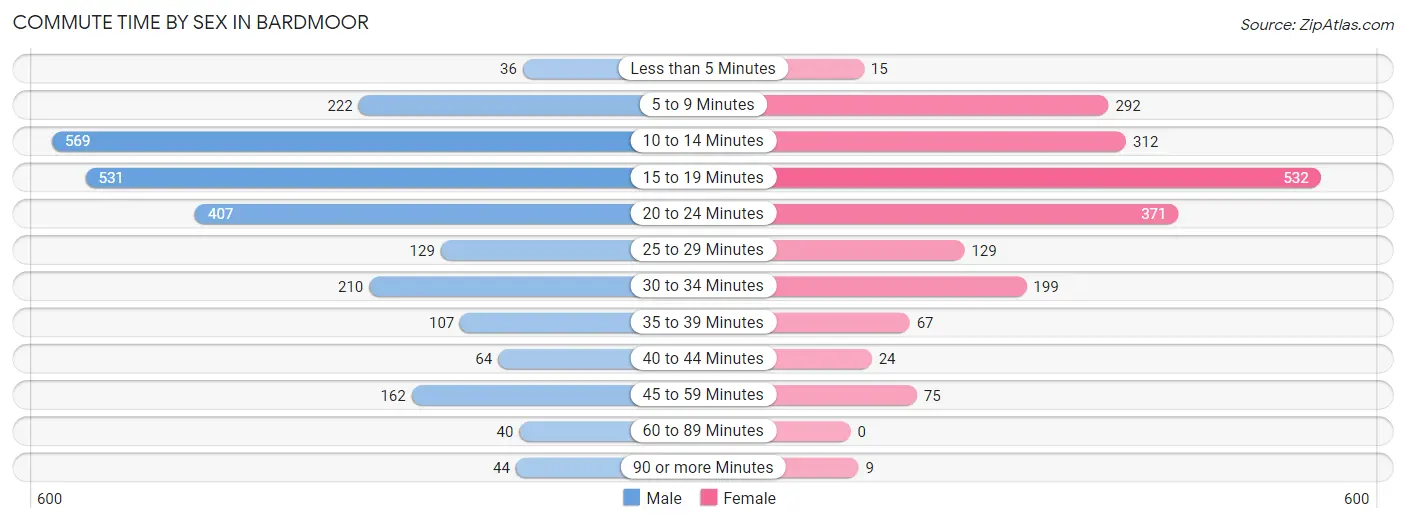
| Commute Time | Male | Female |
| Less than 5 Minutes | 36 (1.4%) | 15 (0.7%) |
| 5 to 9 Minutes | 222 (8.8%) | 292 (14.4%) |
| 10 to 14 Minutes | 569 (22.6%) | 312 (15.4%) |
| 15 to 19 Minutes | 531 (21.1%) | 532 (26.3%) |
| 20 to 24 Minutes | 407 (16.1%) | 371 (18.3%) |
| 25 to 29 Minutes | 129 (5.1%) | 129 (6.4%) |
| 30 to 34 Minutes | 210 (8.3%) | 199 (9.8%) |
| 35 to 39 Minutes | 107 (4.2%) | 67 (3.3%) |
| 40 to 44 Minutes | 64 (2.5%) | 24 (1.2%) |
| 45 to 59 Minutes | 162 (6.4%) | 75 (3.7%) |
| 60 to 89 Minutes | 40 (1.6%) | 0 (0.0%) |
| 90 or more Minutes | 44 (1.8%) | 9 (0.4%) |
Time of Departure to Work by Sex in Bardmoor
The most frequent times of departure to work in Bardmoor are 7:00 AM to 7:29 AM (557, 22.1%) for males and 7:00 AM to 7:29 AM (611, 30.2%) for females.
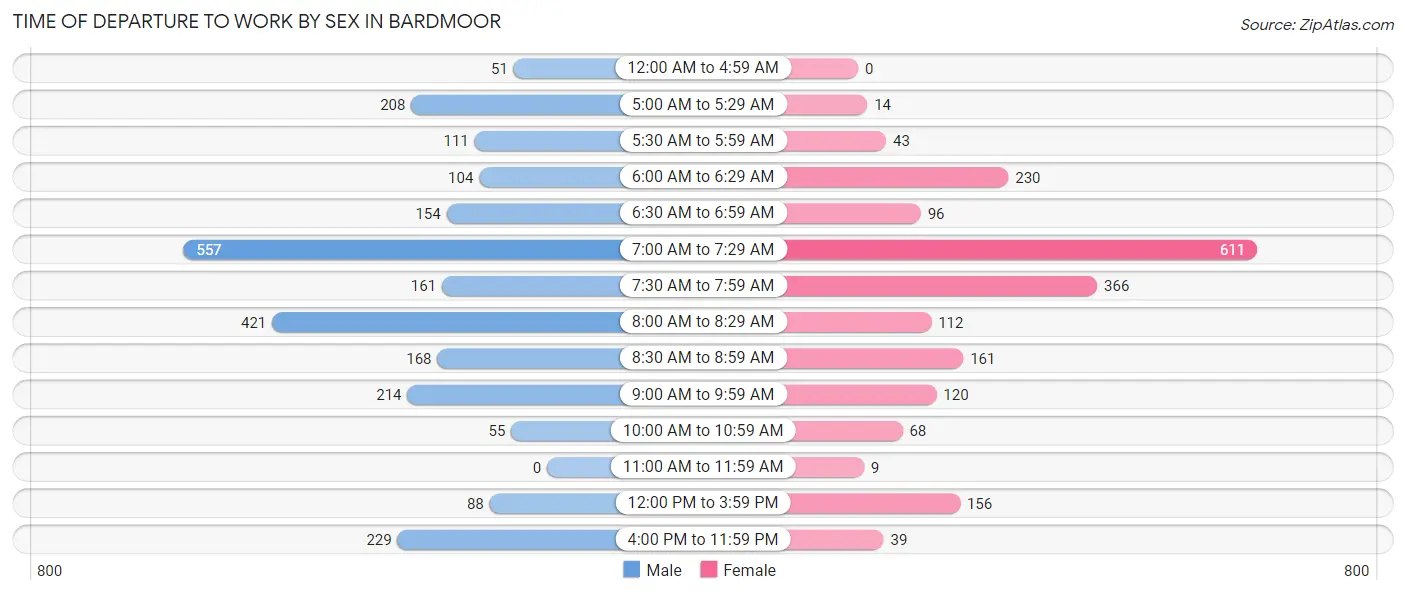
| Time of Departure | Male | Female |
| 12:00 AM to 4:59 AM | 51 (2.0%) | 0 (0.0%) |
| 5:00 AM to 5:29 AM | 208 (8.3%) | 14 (0.7%) |
| 5:30 AM to 5:59 AM | 111 (4.4%) | 43 (2.1%) |
| 6:00 AM to 6:29 AM | 104 (4.1%) | 230 (11.4%) |
| 6:30 AM to 6:59 AM | 154 (6.1%) | 96 (4.7%) |
| 7:00 AM to 7:29 AM | 557 (22.1%) | 611 (30.2%) |
| 7:30 AM to 7:59 AM | 161 (6.4%) | 366 (18.1%) |
| 8:00 AM to 8:29 AM | 421 (16.7%) | 112 (5.5%) |
| 8:30 AM to 8:59 AM | 168 (6.7%) | 161 (8.0%) |
| 9:00 AM to 9:59 AM | 214 (8.5%) | 120 (5.9%) |
| 10:00 AM to 10:59 AM | 55 (2.2%) | 68 (3.4%) |
| 11:00 AM to 11:59 AM | 0 (0.0%) | 9 (0.4%) |
| 12:00 PM to 3:59 PM | 88 (3.5%) | 156 (7.7%) |
| 4:00 PM to 11:59 PM | 229 (9.1%) | 39 (1.9%) |
| Total | 2,521 (100.0%) | 2,025 (100.0%) |
Housing Occupancy in Bardmoor
Occupancy by Ownership in Bardmoor
Of the total 4,017 dwellings in Bardmoor, owner-occupied units account for 3,646 (90.8%), while renter-occupied units make up 371 (9.2%).
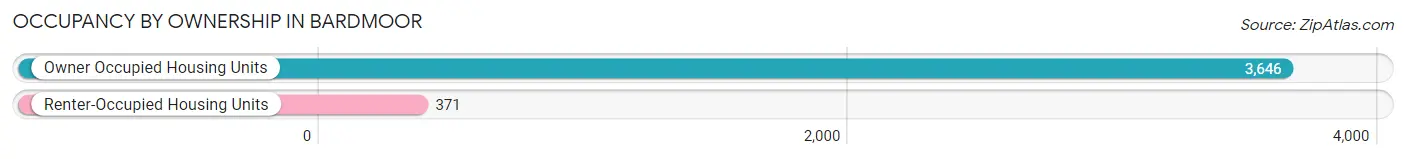
| Occupancy | # Housing Units | % Housing Units |
| Owner Occupied Housing Units | 3,646 | 90.8% |
| Renter-Occupied Housing Units | 371 | 9.2% |
| Total Occupied Housing Units | 4,017 | 100.0% |
Occupancy by Household Size in Bardmoor
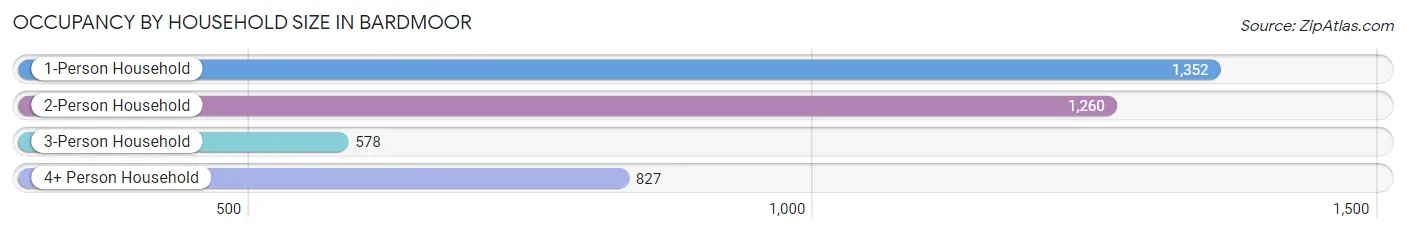
| Household Size | # Housing Units | % Housing Units |
| 1-Person Household | 1,352 | 33.7% |
| 2-Person Household | 1,260 | 31.4% |
| 3-Person Household | 578 | 14.4% |
| 4+ Person Household | 827 | 20.6% |
| Total Housing Units | 4,017 | 100.0% |
Occupancy by Ownership by Household Size in Bardmoor
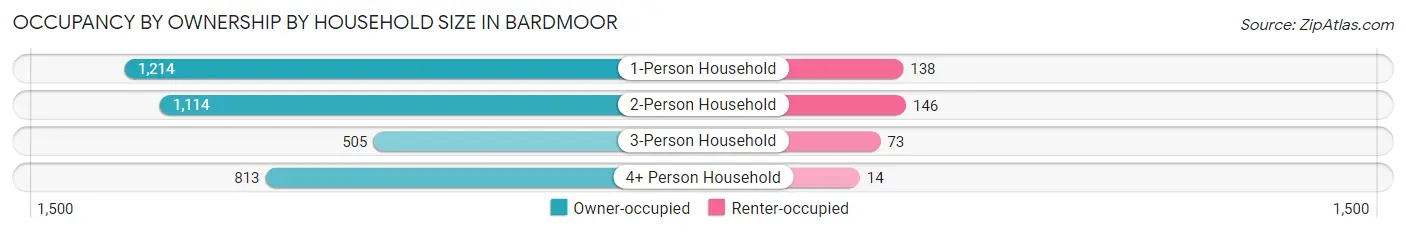
| Household Size | Owner-occupied | Renter-occupied |
| 1-Person Household | 1,214 (89.8%) | 138 (10.2%) |
| 2-Person Household | 1,114 (88.4%) | 146 (11.6%) |
| 3-Person Household | 505 (87.4%) | 73 (12.6%) |
| 4+ Person Household | 813 (98.3%) | 14 (1.7%) |
| Total Housing Units | 3,646 (90.8%) | 371 (9.2%) |
Occupancy by Educational Attainment in Bardmoor
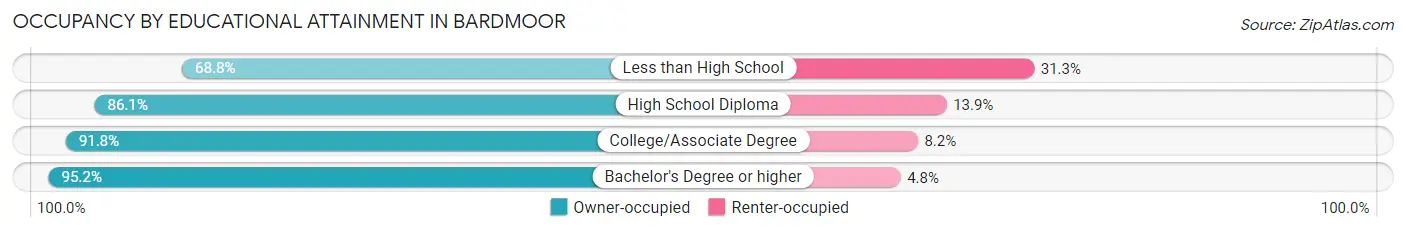
| Household Size | Owner-occupied | Renter-occupied |
| Less than High School | 176 (68.8%) | 80 (31.2%) |
| High School Diploma | 614 (86.1%) | 99 (13.9%) |
| College/Associate Degree | 1,256 (91.8%) | 112 (8.2%) |
| Bachelor's Degree or higher | 1,600 (95.2%) | 80 (4.8%) |
Occupancy by Age of Householder in Bardmoor
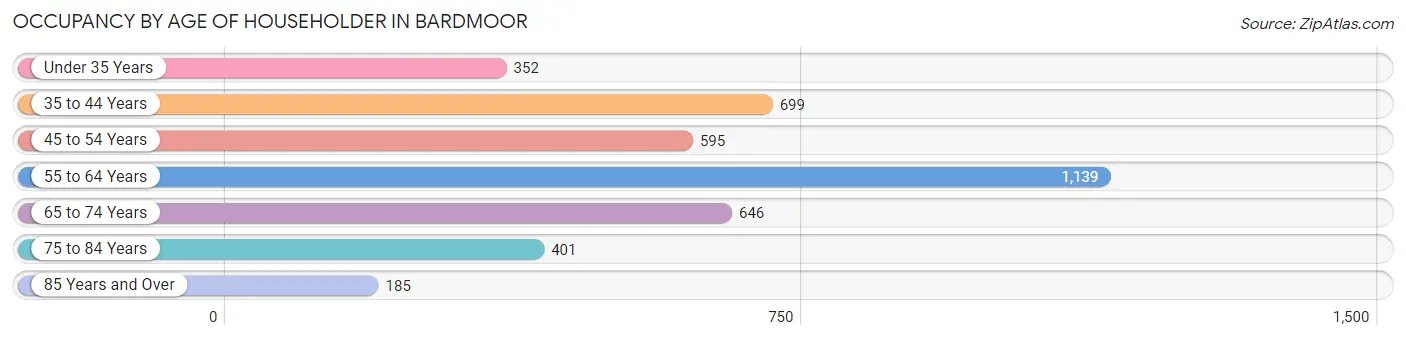
| Age Bracket | # Households | % Households |
| Under 35 Years | 352 | 8.8% |
| 35 to 44 Years | 699 | 17.4% |
| 45 to 54 Years | 595 | 14.8% |
| 55 to 64 Years | 1,139 | 28.3% |
| 65 to 74 Years | 646 | 16.1% |
| 75 to 84 Years | 401 | 10.0% |
| 85 Years and Over | 185 | 4.6% |
| Total | 4,017 | 100.0% |
Housing Finances in Bardmoor
Median Income by Occupancy in Bardmoor
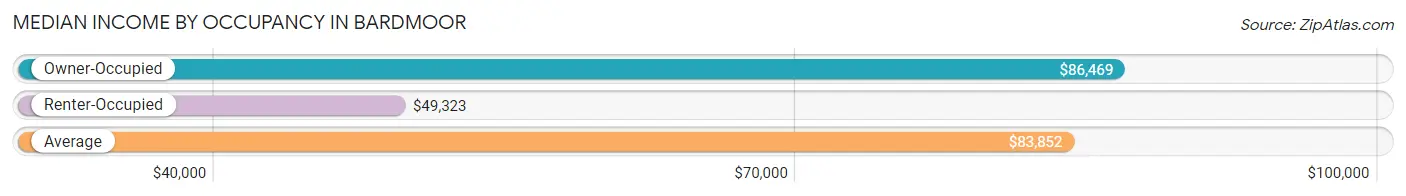
| Occupancy Type | # Households | Median Income |
| Owner-Occupied | 3,646 (90.8%) | $86,469 |
| Renter-Occupied | 371 (9.2%) | $49,323 |
| Average | 4,017 (100.0%) | $83,852 |
Occupancy by Householder Income Bracket in Bardmoor
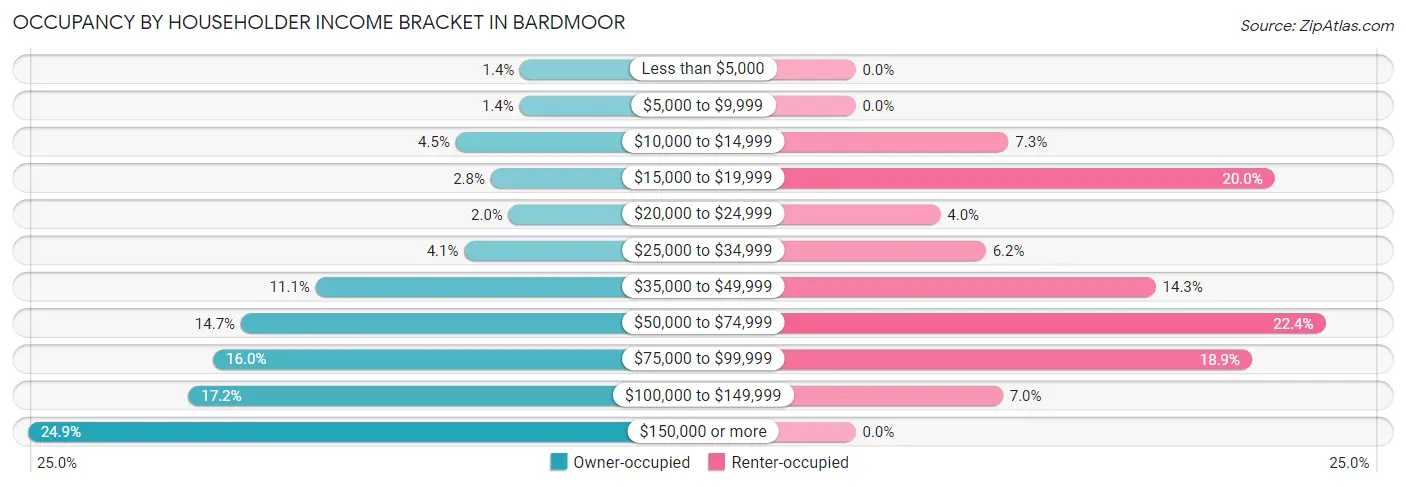
| Income Bracket | Owner-occupied | Renter-occupied |
| Less than $5,000 | 51 (1.4%) | 0 (0.0%) |
| $5,000 to $9,999 | 52 (1.4%) | 0 (0.0%) |
| $10,000 to $14,999 | 163 (4.5%) | 27 (7.3%) |
| $15,000 to $19,999 | 102 (2.8%) | 74 (20.0%) |
| $20,000 to $24,999 | 71 (1.9%) | 15 (4.0%) |
| $25,000 to $34,999 | 148 (4.1%) | 23 (6.2%) |
| $35,000 to $49,999 | 406 (11.1%) | 53 (14.3%) |
| $50,000 to $74,999 | 536 (14.7%) | 83 (22.4%) |
| $75,000 to $99,999 | 584 (16.0%) | 70 (18.9%) |
| $100,000 to $149,999 | 627 (17.2%) | 26 (7.0%) |
| $150,000 or more | 906 (24.8%) | 0 (0.0%) |
| Total | 3,646 (100.0%) | 371 (100.0%) |
Monthly Housing Cost Tiers in Bardmoor
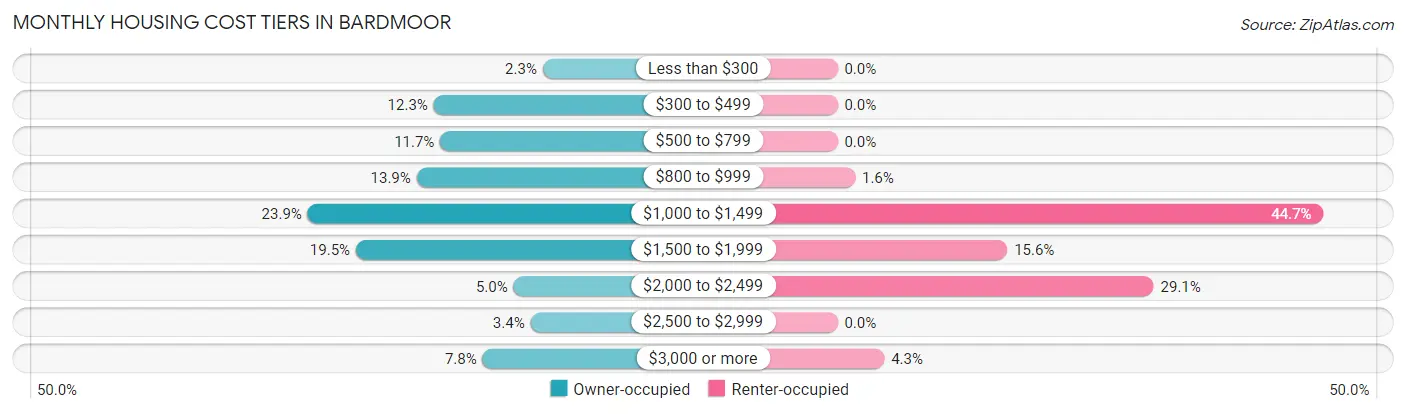
| Monthly Cost | Owner-occupied | Renter-occupied |
| Less than $300 | 84 (2.3%) | 0 (0.0%) |
| $300 to $499 | 450 (12.3%) | 0 (0.0%) |
| $500 to $799 | 428 (11.7%) | 0 (0.0%) |
| $800 to $999 | 507 (13.9%) | 6 (1.6%) |
| $1,000 to $1,499 | 873 (23.9%) | 166 (44.7%) |
| $1,500 to $1,999 | 711 (19.5%) | 58 (15.6%) |
| $2,000 to $2,499 | 182 (5.0%) | 108 (29.1%) |
| $2,500 to $2,999 | 125 (3.4%) | 0 (0.0%) |
| $3,000 or more | 286 (7.8%) | 16 (4.3%) |
| Total | 3,646 (100.0%) | 371 (100.0%) |
Physical Housing Characteristics in Bardmoor
Housing Structures in Bardmoor
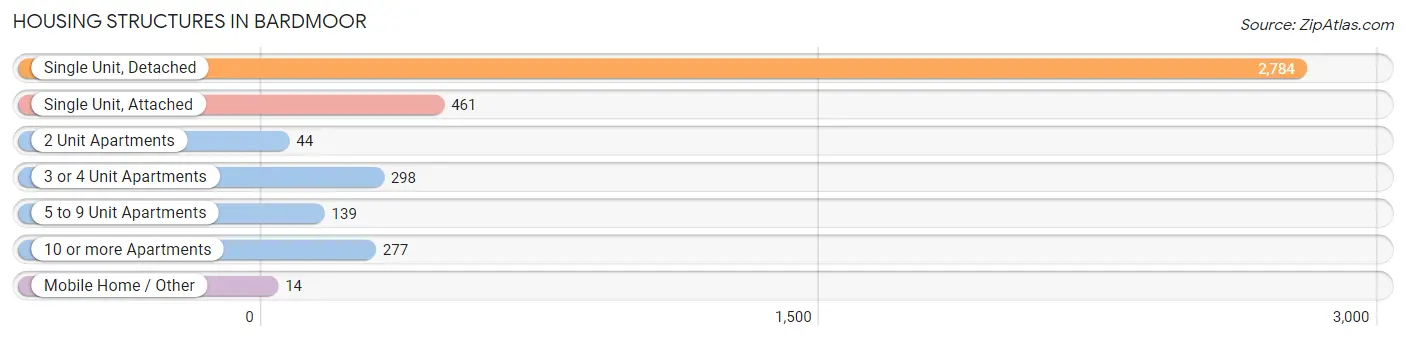
| Structure Type | # Housing Units | % Housing Units |
| Single Unit, Detached | 2,784 | 69.3% |
| Single Unit, Attached | 461 | 11.5% |
| 2 Unit Apartments | 44 | 1.1% |
| 3 or 4 Unit Apartments | 298 | 7.4% |
| 5 to 9 Unit Apartments | 139 | 3.5% |
| 10 or more Apartments | 277 | 6.9% |
| Mobile Home / Other | 14 | 0.4% |
| Total | 4,017 | 100.0% |
Housing Structures by Occupancy in Bardmoor
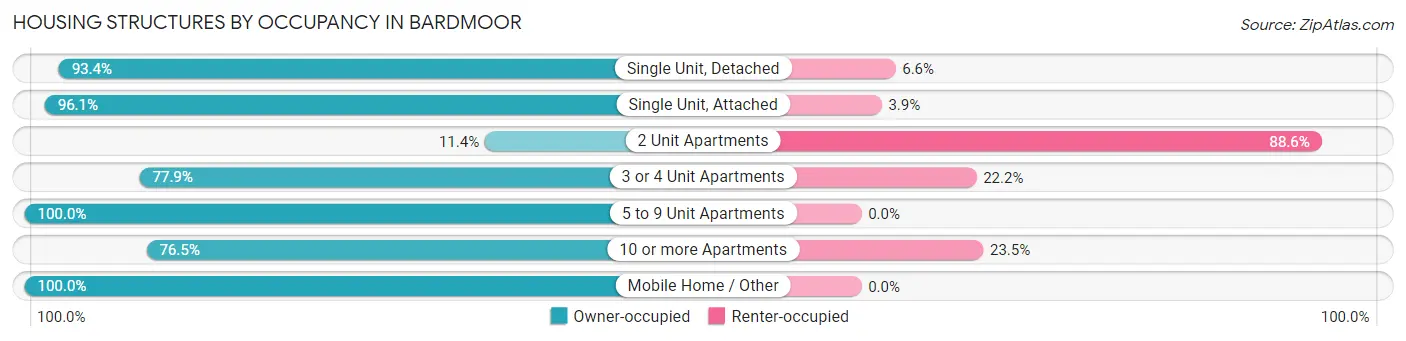
| Structure Type | Owner-occupied | Renter-occupied |
| Single Unit, Detached | 2,601 (93.4%) | 183 (6.6%) |
| Single Unit, Attached | 443 (96.1%) | 18 (3.9%) |
| 2 Unit Apartments | 5 (11.4%) | 39 (88.6%) |
| 3 or 4 Unit Apartments | 232 (77.8%) | 66 (22.2%) |
| 5 to 9 Unit Apartments | 139 (100.0%) | 0 (0.0%) |
| 10 or more Apartments | 212 (76.5%) | 65 (23.5%) |
| Mobile Home / Other | 14 (100.0%) | 0 (0.0%) |
| Total | 3,646 (90.8%) | 371 (9.2%) |
Housing Structures by Number of Rooms in Bardmoor
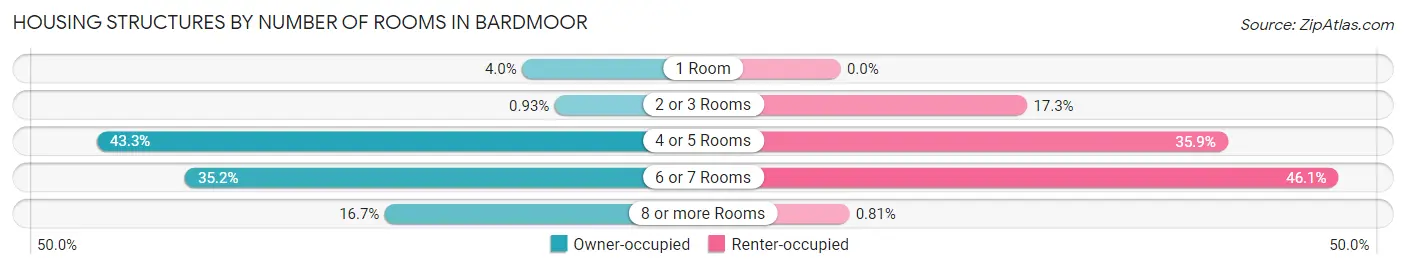
| Number of Rooms | Owner-occupied | Renter-occupied |
| 1 Room | 144 (4.0%) | 0 (0.0%) |
| 2 or 3 Rooms | 34 (0.9%) | 64 (17.2%) |
| 4 or 5 Rooms | 1,579 (43.3%) | 133 (35.8%) |
| 6 or 7 Rooms | 1,282 (35.2%) | 171 (46.1%) |
| 8 or more Rooms | 607 (16.7%) | 3 (0.8%) |
| Total | 3,646 (100.0%) | 371 (100.0%) |
Housing Structure by Heating Type in Bardmoor
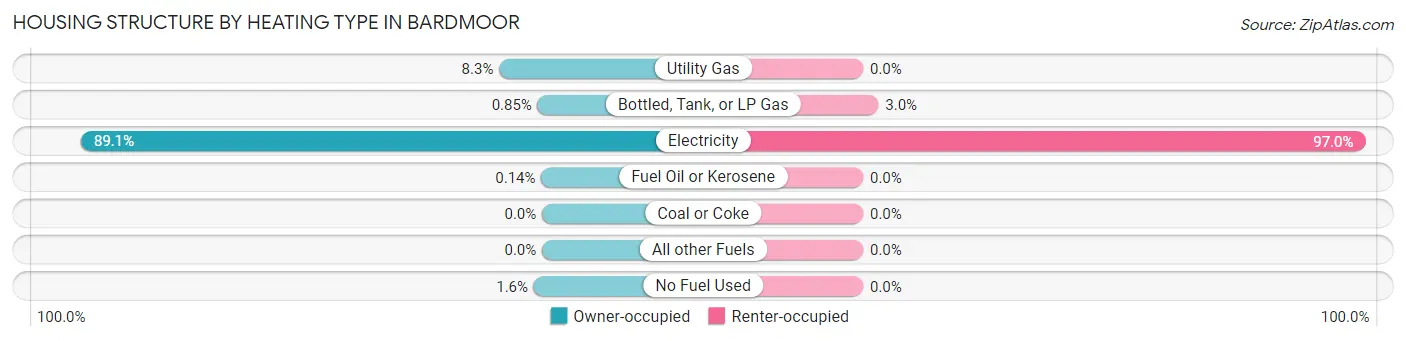
| Heating Type | Owner-occupied | Renter-occupied |
| Utility Gas | 302 (8.3%) | 0 (0.0%) |
| Bottled, Tank, or LP Gas | 31 (0.9%) | 11 (3.0%) |
| Electricity | 3,250 (89.1%) | 360 (97.0%) |
| Fuel Oil or Kerosene | 5 (0.1%) | 0 (0.0%) |
| Coal or Coke | 0 (0.0%) | 0 (0.0%) |
| All other Fuels | 0 (0.0%) | 0 (0.0%) |
| No Fuel Used | 58 (1.6%) | 0 (0.0%) |
| Total | 3,646 (100.0%) | 371 (100.0%) |
Household Vehicle Usage in Bardmoor
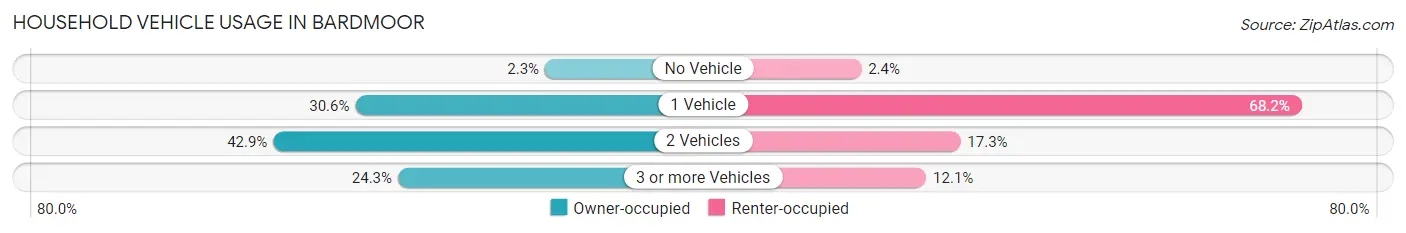
| Vehicles per Household | Owner-occupied | Renter-occupied |
| No Vehicle | 83 (2.3%) | 9 (2.4%) |
| 1 Vehicle | 1,116 (30.6%) | 253 (68.2%) |
| 2 Vehicles | 1,563 (42.9%) | 64 (17.2%) |
| 3 or more Vehicles | 884 (24.2%) | 45 (12.1%) |
| Total | 3,646 (100.0%) | 371 (100.0%) |
Real Estate & Mortgages in Bardmoor
Real Estate and Mortgage Overview in Bardmoor
| Characteristic | Without Mortgage | With Mortgage |
| Housing Units | 1,598 | 2,048 |
| Median Property Value | $244,300 | $262,600 |
| Median Household Income | $59,757 | $685 |
| Monthly Housing Costs | $693 | $286 |
| Real Estate Taxes | $1,493 | $14 |
Property Value by Mortgage Status in Bardmoor
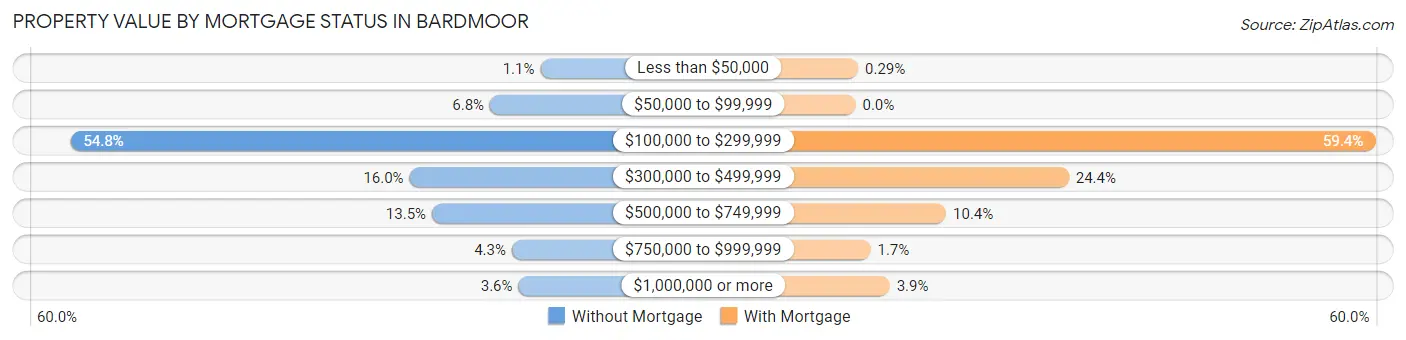
| Property Value | Without Mortgage | With Mortgage |
| Less than $50,000 | 17 (1.1%) | 6 (0.3%) |
| $50,000 to $99,999 | 109 (6.8%) | 0 (0.0%) |
| $100,000 to $299,999 | 875 (54.8%) | 1,216 (59.4%) |
| $300,000 to $499,999 | 256 (16.0%) | 499 (24.4%) |
| $500,000 to $749,999 | 215 (13.5%) | 212 (10.3%) |
| $750,000 to $999,999 | 69 (4.3%) | 35 (1.7%) |
| $1,000,000 or more | 57 (3.6%) | 80 (3.9%) |
| Total | 1,598 (100.0%) | 2,048 (100.0%) |
Household Income by Mortgage Status in Bardmoor
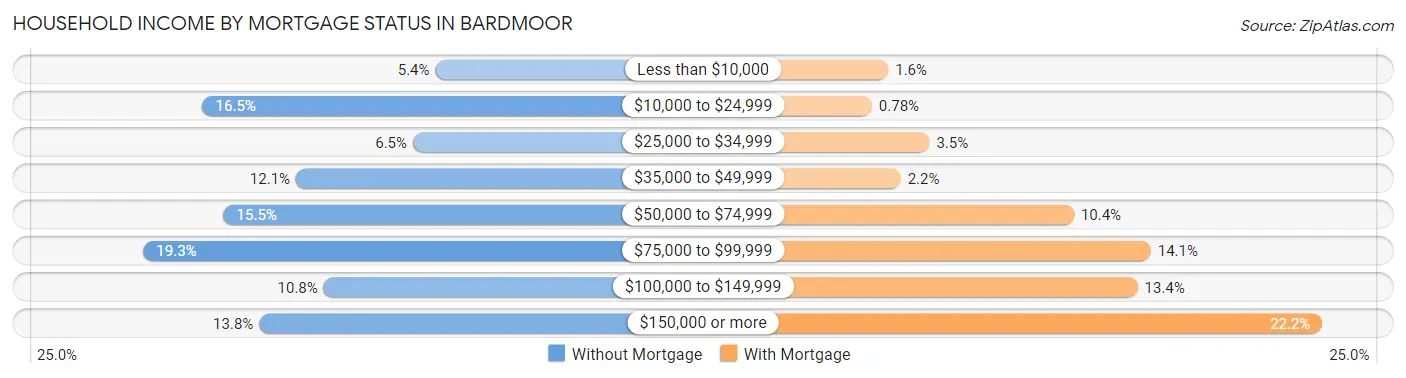
| Household Income | Without Mortgage | With Mortgage |
| Less than $10,000 | 87 (5.4%) | 32 (1.6%) |
| $10,000 to $24,999 | 264 (16.5%) | 16 (0.8%) |
| $25,000 to $34,999 | 104 (6.5%) | 72 (3.5%) |
| $35,000 to $49,999 | 193 (12.1%) | 44 (2.1%) |
| $50,000 to $74,999 | 248 (15.5%) | 213 (10.4%) |
| $75,000 to $99,999 | 309 (19.3%) | 288 (14.1%) |
| $100,000 to $149,999 | 172 (10.8%) | 275 (13.4%) |
| $150,000 or more | 221 (13.8%) | 455 (22.2%) |
| Total | 1,598 (100.0%) | 2,048 (100.0%) |
Property Value to Household Income Ratio in Bardmoor
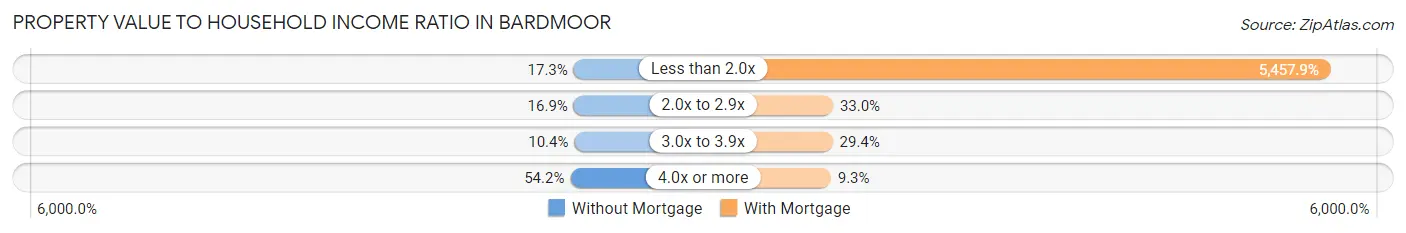
| Value-to-Income Ratio | Without Mortgage | With Mortgage |
| Less than 2.0x | 276 (17.3%) | 111,777 (5,457.9%) |
| 2.0x to 2.9x | 270 (16.9%) | 675 (33.0%) |
| 3.0x to 3.9x | 166 (10.4%) | 601 (29.3%) |
| 4.0x or more | 866 (54.2%) | 190 (9.3%) |
| Total | 1,598 (100.0%) | 2,048 (100.0%) |
Real Estate Taxes by Mortgage Status in Bardmoor
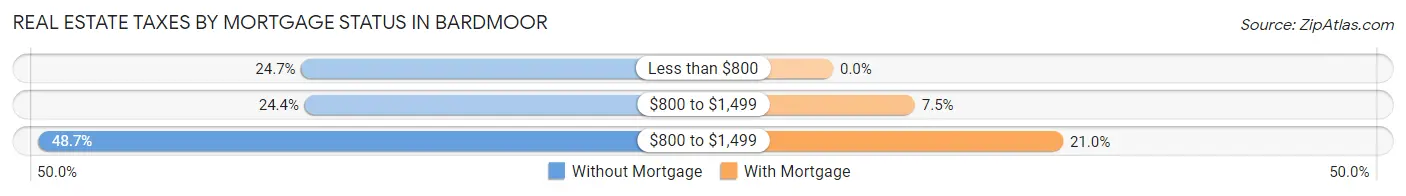
| Property Taxes | Without Mortgage | With Mortgage |
| Less than $800 | 395 (24.7%) | 0 (0.0%) |
| $800 to $1,499 | 390 (24.4%) | 153 (7.5%) |
| $800 to $1,499 | 778 (48.7%) | 430 (21.0%) |
| Total | 1,598 (100.0%) | 2,048 (100.0%) |
Health & Disability in Bardmoor
Health Insurance Coverage by Age in Bardmoor
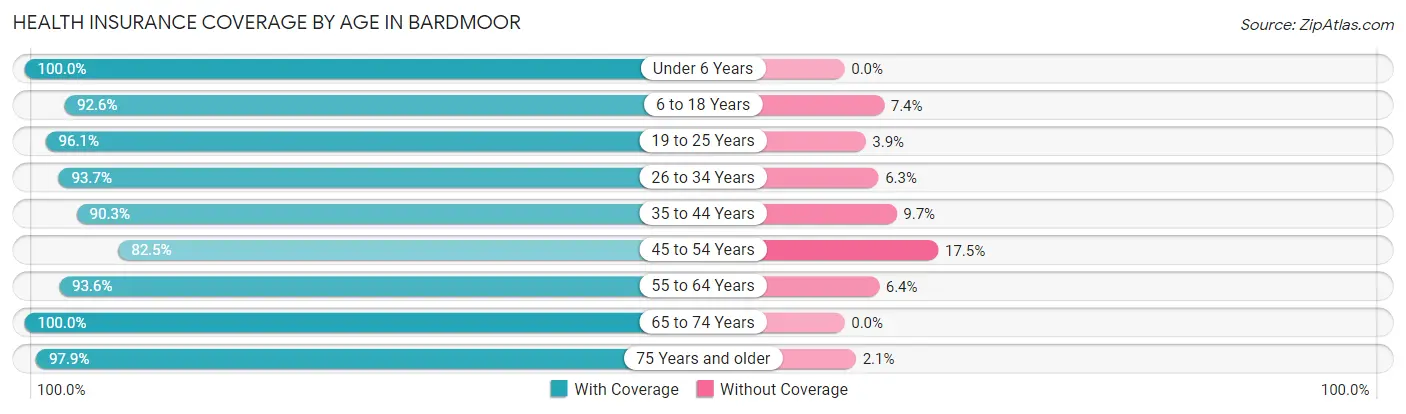
| Age Bracket | With Coverage | Without Coverage |
| Under 6 Years | 782 (100.0%) | 0 (0.0%) |
| 6 to 18 Years | 1,032 (92.6%) | 82 (7.4%) |
| 19 to 25 Years | 612 (96.1%) | 25 (3.9%) |
| 26 to 34 Years | 873 (93.7%) | 59 (6.3%) |
| 35 to 44 Years | 1,164 (90.3%) | 125 (9.7%) |
| 45 to 54 Years | 968 (82.5%) | 205 (17.5%) |
| 55 to 64 Years | 1,688 (93.6%) | 116 (6.4%) |
| 65 to 74 Years | 1,150 (100.0%) | 0 (0.0%) |
| 75 Years and older | 781 (97.9%) | 17 (2.1%) |
| Total | 9,050 (93.5%) | 629 (6.5%) |
Health Insurance Coverage by Citizenship Status in Bardmoor
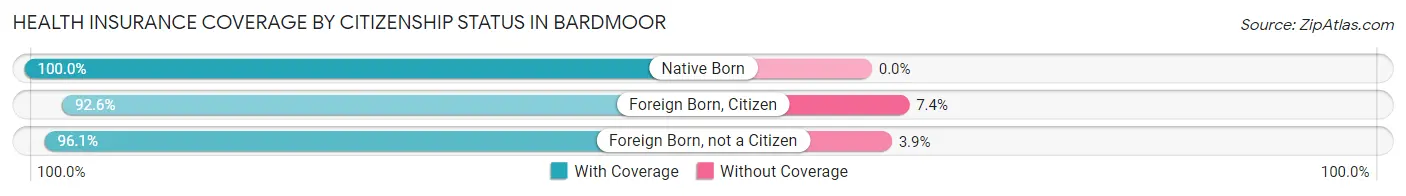
| Citizenship Status | With Coverage | Without Coverage |
| Native Born | 782 (100.0%) | 0 (0.0%) |
| Foreign Born, Citizen | 1,032 (92.6%) | 82 (7.4%) |
| Foreign Born, not a Citizen | 612 (96.1%) | 25 (3.9%) |
Health Insurance Coverage by Household Income in Bardmoor
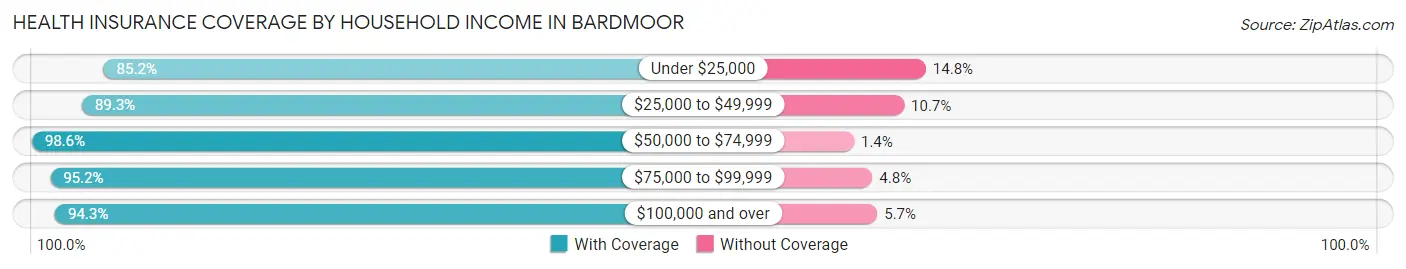
| Household Income | With Coverage | Without Coverage |
| Under $25,000 | 747 (85.2%) | 130 (14.8%) |
| $25,000 to $49,999 | 1,047 (89.3%) | 126 (10.7%) |
| $50,000 to $74,999 | 1,090 (98.6%) | 15 (1.4%) |
| $75,000 to $99,999 | 1,489 (95.2%) | 75 (4.8%) |
| $100,000 and over | 4,677 (94.3%) | 283 (5.7%) |
Public vs Private Health Insurance Coverage by Age in Bardmoor
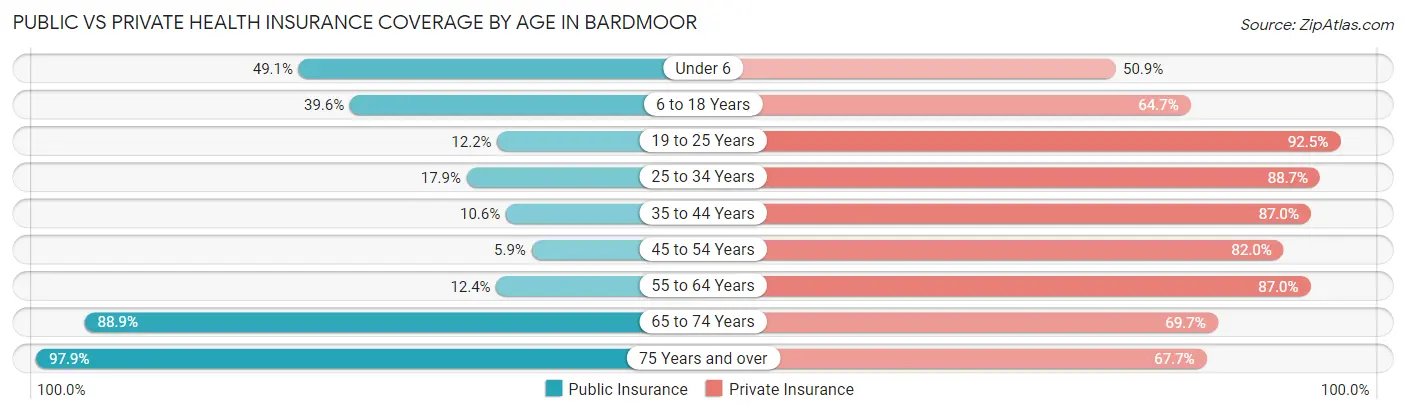
| Age Bracket | Public Insurance | Private Insurance |
| Under 6 | 384 (49.1%) | 398 (50.9%) |
| 6 to 18 Years | 441 (39.6%) | 721 (64.7%) |
| 19 to 25 Years | 78 (12.2%) | 589 (92.5%) |
| 25 to 34 Years | 167 (17.9%) | 827 (88.7%) |
| 35 to 44 Years | 137 (10.6%) | 1,122 (87.0%) |
| 45 to 54 Years | 69 (5.9%) | 962 (82.0%) |
| 55 to 64 Years | 224 (12.4%) | 1,569 (87.0%) |
| 65 to 74 Years | 1,022 (88.9%) | 802 (69.7%) |
| 75 Years and over | 781 (97.9%) | 540 (67.7%) |
| Total | 3,303 (34.1%) | 7,530 (77.8%) |
Disability Status by Sex by Age in Bardmoor
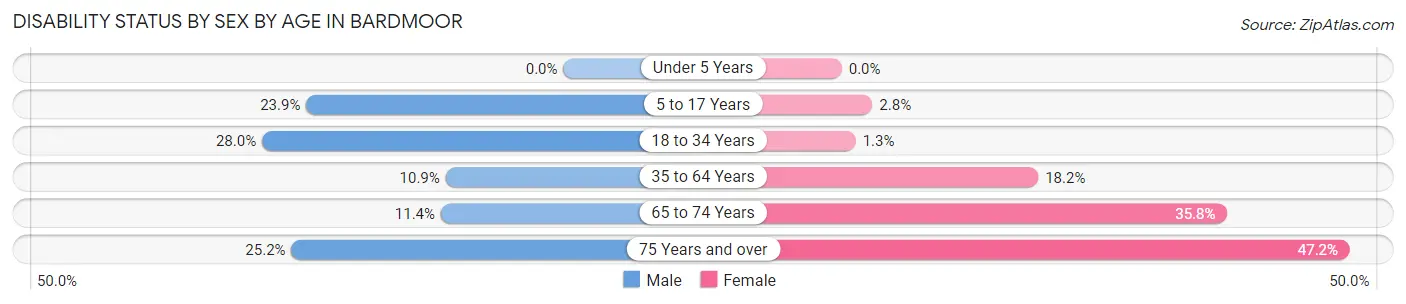
| Age Bracket | Male | Female |
| Under 5 Years | 0 (0.0%) | 0 (0.0%) |
| 5 to 17 Years | 141 (23.9%) | 16 (2.8%) |
| 18 to 34 Years | 245 (28.0%) | 10 (1.3%) |
| 35 to 64 Years | 218 (10.9%) | 414 (18.2%) |
| 65 to 74 Years | 64 (11.4%) | 210 (35.8%) |
| 75 Years and over | 104 (25.2%) | 182 (47.1%) |
Disability Class by Sex by Age in Bardmoor
Disability Class: Hearing Difficulty
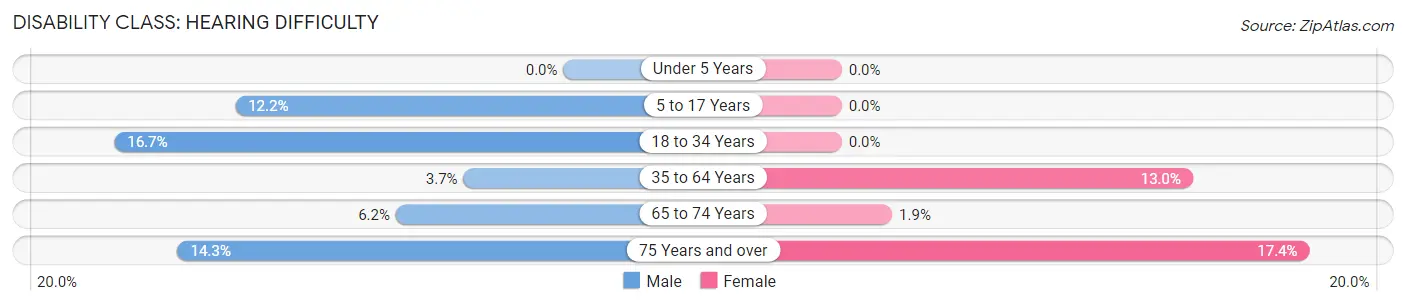
| Age Bracket | Male | Female |
| Under 5 Years | 0 (0.0%) | 0 (0.0%) |
| 5 to 17 Years | 72 (12.2%) | 0 (0.0%) |
| 18 to 34 Years | 146 (16.7%) | 0 (0.0%) |
| 35 to 64 Years | 74 (3.7%) | 296 (13.0%) |
| 65 to 74 Years | 35 (6.2%) | 11 (1.9%) |
| 75 Years and over | 59 (14.3%) | 67 (17.4%) |
Disability Class: Vision Difficulty
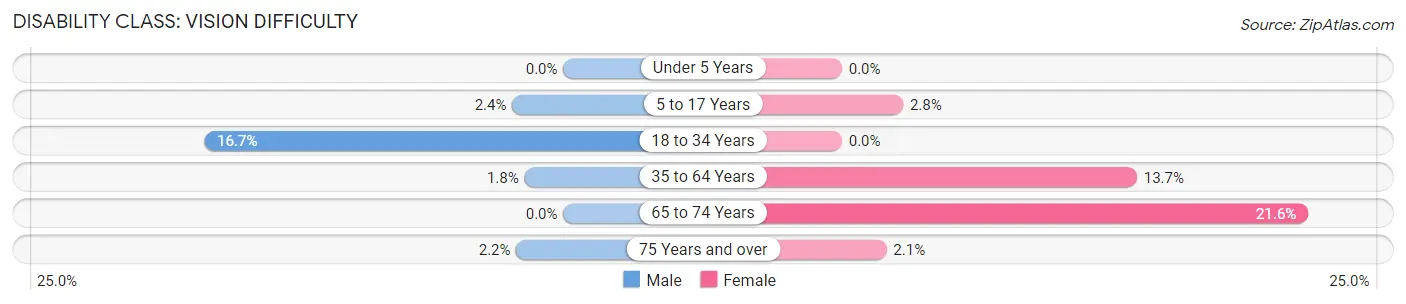
| Age Bracket | Male | Female |
| Under 5 Years | 0 (0.0%) | 0 (0.0%) |
| 5 to 17 Years | 14 (2.4%) | 16 (2.8%) |
| 18 to 34 Years | 146 (16.7%) | 0 (0.0%) |
| 35 to 64 Years | 36 (1.8%) | 311 (13.7%) |
| 65 to 74 Years | 0 (0.0%) | 127 (21.6%) |
| 75 Years and over | 9 (2.2%) | 8 (2.1%) |
Disability Class: Cognitive Difficulty
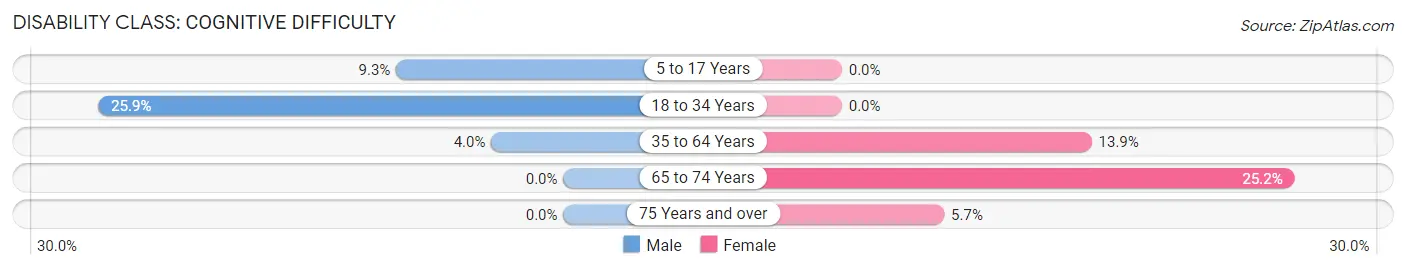
| Age Bracket | Male | Female |
| 5 to 17 Years | 55 (9.3%) | 0 (0.0%) |
| 18 to 34 Years | 227 (25.9%) | 0 (0.0%) |
| 35 to 64 Years | 80 (4.0%) | 316 (13.9%) |
| 65 to 74 Years | 0 (0.0%) | 148 (25.2%) |
| 75 Years and over | 0 (0.0%) | 22 (5.7%) |
Disability Class: Ambulatory Difficulty
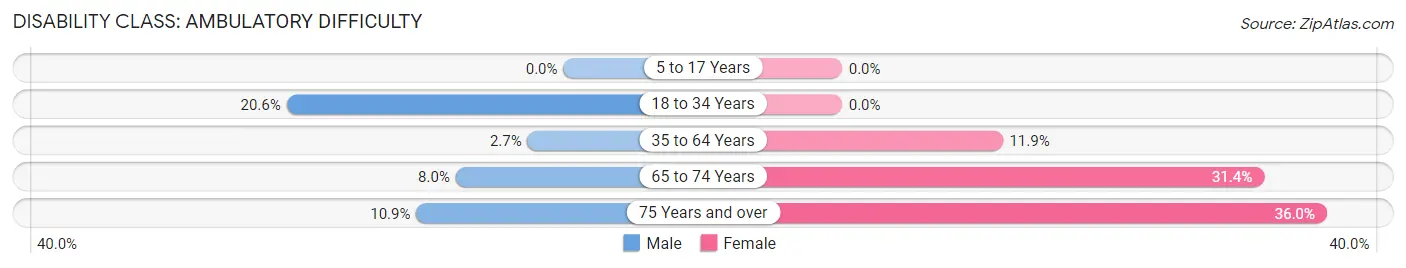
| Age Bracket | Male | Female |
| 5 to 17 Years | 0 (0.0%) | 0 (0.0%) |
| 18 to 34 Years | 180 (20.5%) | 0 (0.0%) |
| 35 to 64 Years | 53 (2.7%) | 271 (11.9%) |
| 65 to 74 Years | 45 (8.0%) | 184 (31.4%) |
| 75 Years and over | 45 (10.9%) | 139 (36.0%) |
Disability Class: Self-Care Difficulty
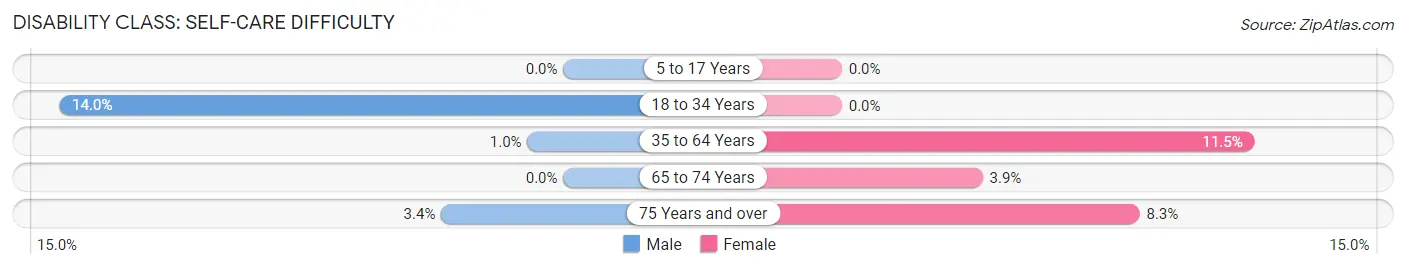
| Age Bracket | Male | Female |
| 5 to 17 Years | 0 (0.0%) | 0 (0.0%) |
| 18 to 34 Years | 123 (14.0%) | 0 (0.0%) |
| 35 to 64 Years | 20 (1.0%) | 261 (11.5%) |
| 65 to 74 Years | 0 (0.0%) | 23 (3.9%) |
| 75 Years and over | 14 (3.4%) | 32 (8.3%) |
Technology Access in Bardmoor
Computing Device Access in Bardmoor
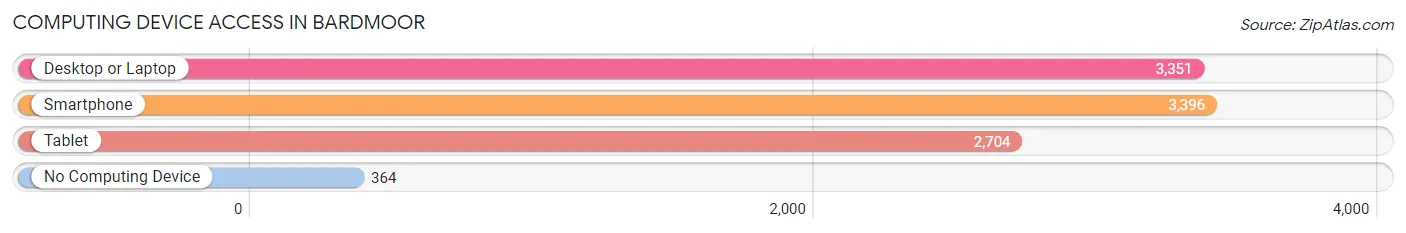
| Device Type | # Households | % Households |
| Desktop or Laptop | 3,351 | 83.4% |
| Smartphone | 3,396 | 84.5% |
| Tablet | 2,704 | 67.3% |
| No Computing Device | 364 | 9.1% |
| Total | 4,017 | 100.0% |
Internet Access in Bardmoor
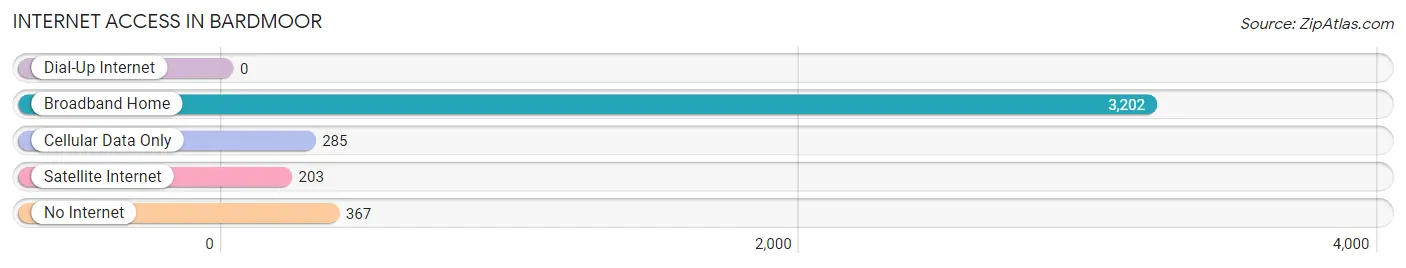
| Internet Type | # Households | % Households |
| Dial-Up Internet | 0 | 0.0% |
| Broadband Home | 3,202 | 79.7% |
| Cellular Data Only | 285 | 7.1% |
| Satellite Internet | 203 | 5.1% |
| No Internet | 367 | 9.1% |
| Total | 4,017 | 100.0% |
Bardmoor Summary
Bardmoor is an unincorporated community located in Pinellas County, Florida. It is located in the northern part of the county, just south of Seminole. The community is bordered by Seminole to the north, Largo to the east, Pinellas Park to the south, and Clearwater to the west. The population of Bardmoor was estimated to be 8,845 in 2019.
Geography
Bardmoor is located in the northern part of Pinellas County, just south of Seminole. The community is bordered by Seminole to the north, Largo to the east, Pinellas Park to the south, and Clearwater to the west. The terrain of the area is mostly flat, with some low hills in the northern part of the community. The highest point in the area is located in the northern part of the community, at an elevation of about 25 feet.
The climate of Bardmoor is classified as humid subtropical, with hot, humid summers and mild winters. The average annual temperature is around 73°F, with an average high of around 90°F in the summer and an average low of around 55°F in the winter. The average annual precipitation is around 50 inches, with most of the rain falling in the summer months.
Economy
The economy of Bardmoor is largely based on the service industry. The largest employers in the area are the local hospitals, schools, and government offices. Other major employers include retail stores, restaurants, and other businesses.
The median household income in Bardmoor is around $50,000, which is slightly higher than the national average. The unemployment rate in the area is around 4%, which is lower than the national average.
Demographics
As of 2019, the population of Bardmoor was estimated to be 8,845. The racial makeup of the community is predominantly white (77.3%), followed by African American (13.2%), Hispanic (4.7%), and Asian (2.7%). The median age in the area is around 42 years old.
The majority of the population (77.3%) is married, with the remaining 22.7% being single. The median household income in Bardmoor is around $50,000, which is slightly higher than the national average. The poverty rate in the area is around 8.3%, which is lower than the national average.
Conclusion
Bardmoor is an unincorporated community located in Pinellas County, Florida. It is located in the northern part of the county, just south of Seminole. The population of Bardmoor was estimated to be 8,845 in 2019. The economy of Bardmoor is largely based on the service industry, with the largest employers being local hospitals, schools, and government offices. The racial makeup of the community is predominantly white, followed by African American, Hispanic, and Asian. The median household income in Bardmoor is around $50,000, which is slightly higher than the national average.
Common Questions
What is Per Capita Income in Bardmoor?
Per Capita income in Bardmoor is $44,445.
What is the Median Family Income in Bardmoor?
Median Family Income in Bardmoor is $111,250.
What is the Median Household income in Bardmoor?
Median Household Income in Bardmoor is $83,852.
What is Income or Wage Gap in Bardmoor?
Income or Wage Gap in Bardmoor is 4.6%.
Women in Bardmoor earn 95.4 cents for every dollar earned by a man.
What is Inequality or Gini Index in Bardmoor?
Inequality or Gini Index in Bardmoor is 0.42.
What is the Total Population of Bardmoor?
Total Population of Bardmoor is 9,834.
What is the Total Male Population of Bardmoor?
Total Male Population of Bardmoor is 4,864.
What is the Total Female Population of Bardmoor?
Total Female Population of Bardmoor is 4,970.
What is the Ratio of Males per 100 Females in Bardmoor?
There are 97.87 Males per 100 Females in Bardmoor.
What is the Ratio of Females per 100 Males in Bardmoor?
There are 102.18 Females per 100 Males in Bardmoor.
What is the Median Population Age in Bardmoor?
Median Population Age in Bardmoor is 45.2 Years.
What is the Average Family Size in Bardmoor
Average Family Size in Bardmoor is 3.1 People.
What is the Average Household Size in Bardmoor
Average Household Size in Bardmoor is 2.5 People.
How Large is the Labor Force in Bardmoor?
There are 5,388 People in the Labor Forcein in Bardmoor.
What is the Percentage of People in the Labor Force in Bardmoor?
66.2% of People are in the Labor Force in Bardmoor.
What is the Unemployment Rate in Bardmoor?
Unemployment Rate in Bardmoor is 3.0%.