Anna Maria, FL Map & Demographics
Anna Maria Map
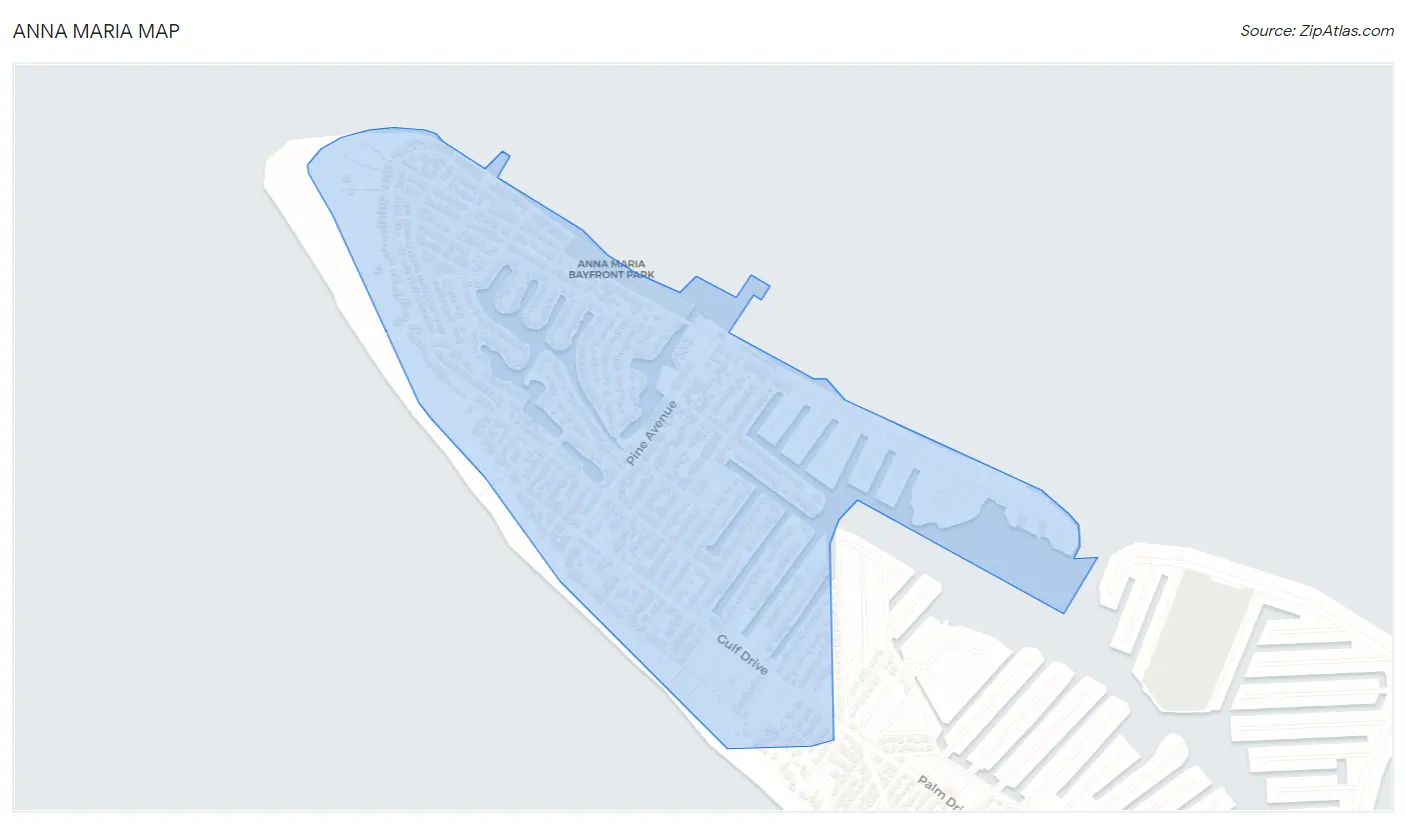
Anna Maria Overview
$81,576
PER CAPITA INCOME
$106,406
AVG FAMILY INCOME
$93,478
AVG HOUSEHOLD INCOME
0.47
INEQUALITY / GINI INDEX
825
TOTAL POPULATION
372
MALE POPULATION
453
FEMALE POPULATION
82.12
MALES / 100 FEMALES
121.77
FEMALES / 100 MALES
67.3
MEDIAN AGE
2.3
AVG FAMILY SIZE
1.7
AVG HOUSEHOLD SIZE
196
LABOR FORCE [ PEOPLE ]
23.8%
PERCENT IN LABOR FORCE
Anna Maria Zip Codes
Anna Maria Area Codes
Income in Anna Maria
Income Overview in Anna Maria
Per Capita Income in Anna Maria is $81,576, while median incomes of families and households are $106,406 and $93,478 respectively.
| Characteristic | Number | Measure |
| Per Capita Income | 825 | $81,576 |
| Median Family Income | 255 | $106,406 |
| Mean Family Income | 255 | $172,356 |
| Median Household Income | 486 | $93,478 |
| Mean Household Income | 486 | $134,633 |
| Income Deficit | 255 | $0 |
| Wage / Income Gap (%) | 825 | 0.00% |
| Wage / Income Gap ($) | 825 | 100.00¢ per $1 |
| Gini / Inequality Index | 825 | 0.47 |
Earnings by Sex in Anna Maria
| Sex | Number | Average Earnings |
| Male | 98 (44.8%) | $0 |
| Female | 121 (55.2%) | $0 |
| Total | 219 (100.0%) | $0 |
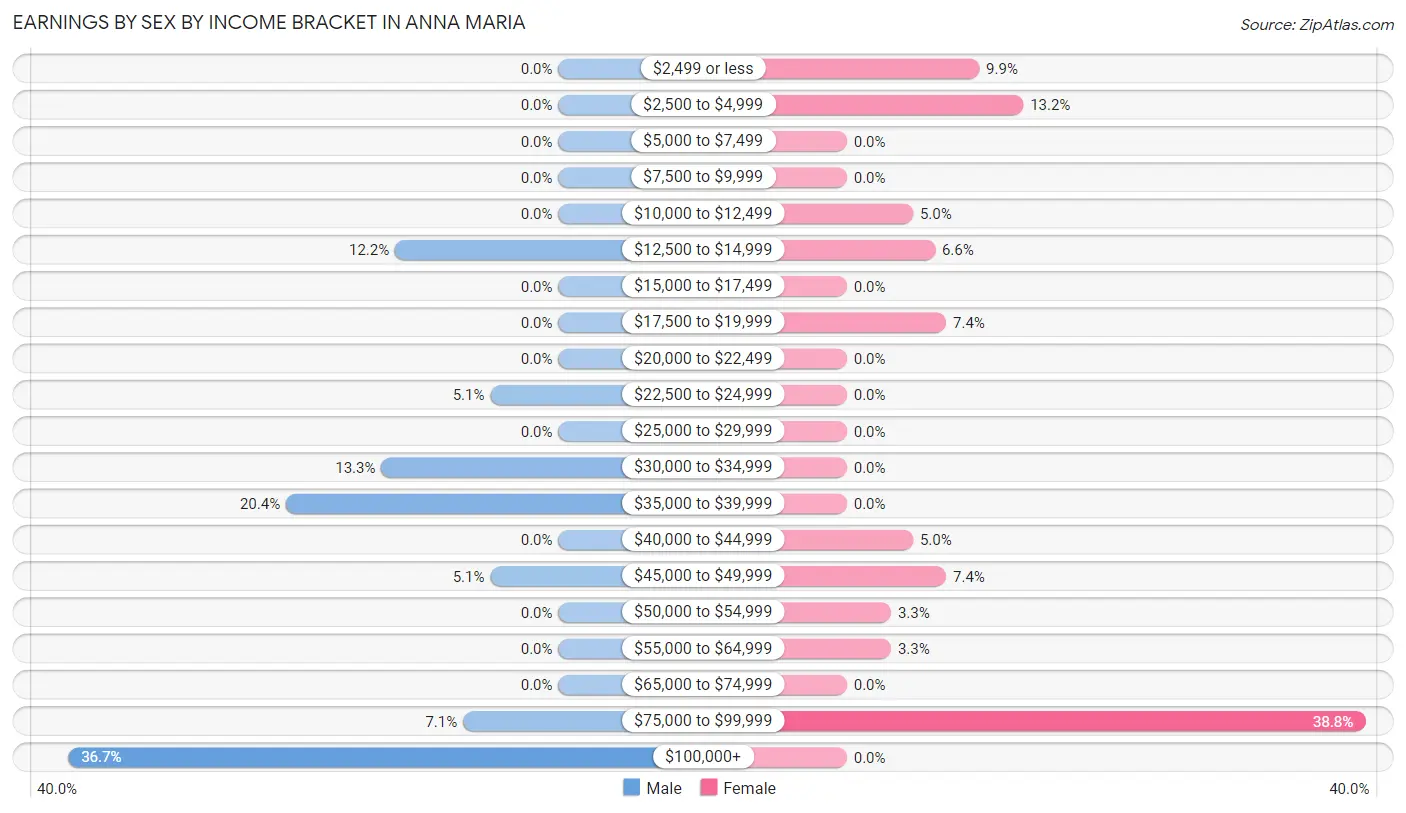
Earnings by Sex by Income Bracket in Anna Maria
The most common earnings brackets in Anna Maria are $100,000+ for men (36 | 36.7%) and $75,000 to $99,999 for women (47 | 38.8%).
| Income | Male | Female |
| $2,499 or less | 0 (0.0%) | 12 (9.9%) |
| $2,500 to $4,999 | 0 (0.0%) | 16 (13.2%) |
| $5,000 to $7,499 | 0 (0.0%) | 0 (0.0%) |
| $7,500 to $9,999 | 0 (0.0%) | 0 (0.0%) |
| $10,000 to $12,499 | 0 (0.0%) | 6 (5.0%) |
| $12,500 to $14,999 | 12 (12.2%) | 8 (6.6%) |
| $15,000 to $17,499 | 0 (0.0%) | 0 (0.0%) |
| $17,500 to $19,999 | 0 (0.0%) | 9 (7.4%) |
| $20,000 to $22,499 | 0 (0.0%) | 0 (0.0%) |
| $22,500 to $24,999 | 5 (5.1%) | 0 (0.0%) |
| $25,000 to $29,999 | 0 (0.0%) | 0 (0.0%) |
| $30,000 to $34,999 | 13 (13.3%) | 0 (0.0%) |
| $35,000 to $39,999 | 20 (20.4%) | 0 (0.0%) |
| $40,000 to $44,999 | 0 (0.0%) | 6 (5.0%) |
| $45,000 to $49,999 | 5 (5.1%) | 9 (7.4%) |
| $50,000 to $54,999 | 0 (0.0%) | 4 (3.3%) |
| $55,000 to $64,999 | 0 (0.0%) | 4 (3.3%) |
| $65,000 to $74,999 | 0 (0.0%) | 0 (0.0%) |
| $75,000 to $99,999 | 7 (7.1%) | 47 (38.8%) |
| $100,000+ | 36 (36.7%) | 0 (0.0%) |
| Total | 98 (100.0%) | 121 (100.0%) |
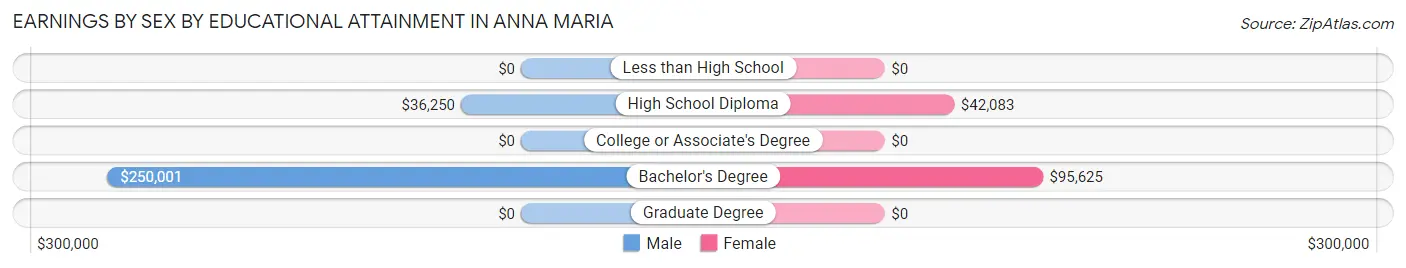
Earnings by Sex by Educational Attainment in Anna Maria
| Educational Attainment | Male Income | Female Income |
| Less than High School | - | - |
| High School Diploma | $36,250 | $42,083 |
| College or Associate's Degree | - | - |
| Bachelor's Degree | $250,001 | $95,625 |
| Graduate Degree | - | - |
| Total | - | - |
Family Income in Anna Maria
Family Income Brackets in Anna Maria
According to the Anna Maria family income data, there are 86 families falling into the $200,000+ income range, which is the most common income bracket and makes up 33.7% of all families.
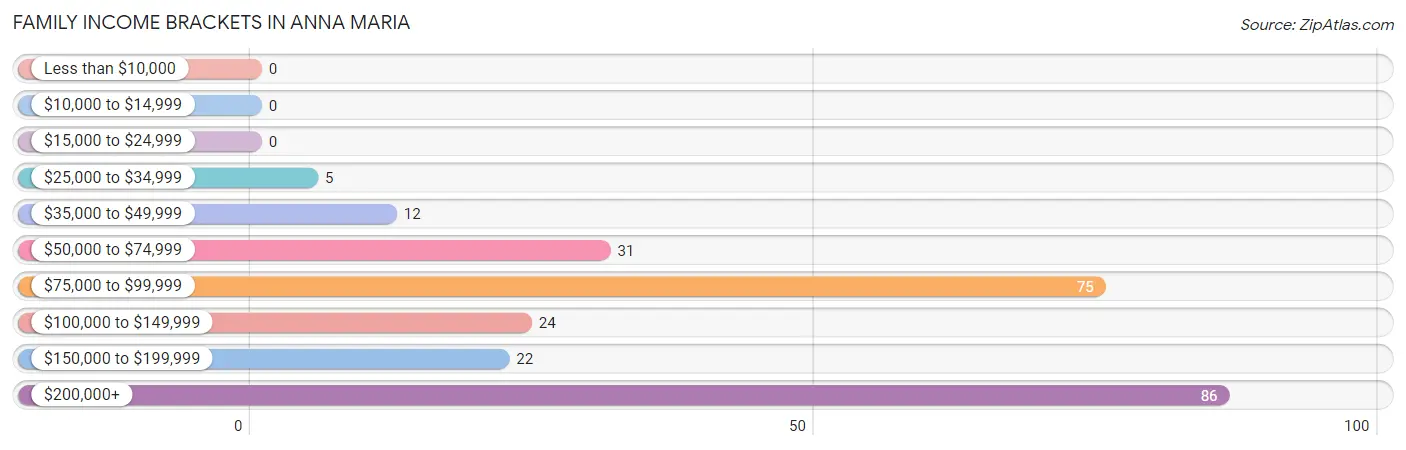
| Income Bracket | # Families | % Families |
| Less than $10,000 | 0 | 0.0% |
| $10,000 to $14,999 | 0 | 0.0% |
| $15,000 to $24,999 | 0 | 0.0% |
| $25,000 to $34,999 | 5 | 2.0% |
| $35,000 to $49,999 | 12 | 4.7% |
| $50,000 to $74,999 | 31 | 12.2% |
| $75,000 to $99,999 | 75 | 29.4% |
| $100,000 to $149,999 | 24 | 9.4% |
| $150,000 to $199,999 | 22 | 8.6% |
| $200,000+ | 86 | 33.7% |
Family Income by Famaliy Size in Anna Maria
2-person families (240 | 94.1%) account for the highest median family income in Anna Maria with $105,938 per family, while 2-person families (240 | 94.1%) have the highest median income of $52,969 per family member.
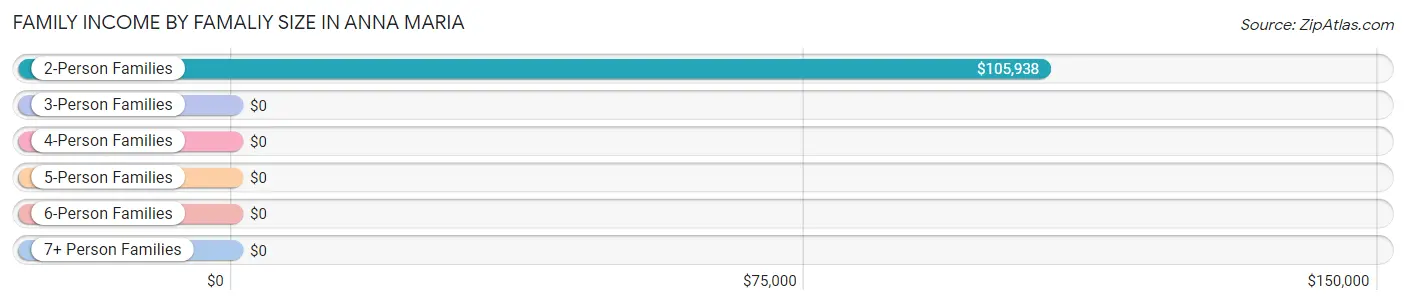
| Income Bracket | # Families | Median Income |
| 2-Person Families | 240 (94.1%) | $105,938 |
| 3-Person Families | 9 (3.5%) | $0 |
| 4-Person Families | 6 (2.4%) | $0 |
| 5-Person Families | 0 (0.0%) | $0 |
| 6-Person Families | 0 (0.0%) | $0 |
| 7+ Person Families | 0 (0.0%) | $0 |
| Total | 255 (100.0%) | $106,406 |
Family Income by Number of Earners in Anna Maria
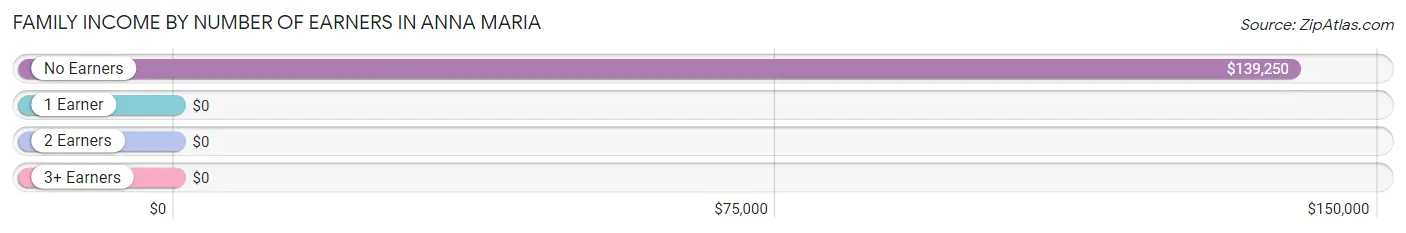
| Number of Earners | # Families | Median Income |
| No Earners | 179 (70.2%) | $139,250 |
| 1 Earner | 33 (12.9%) | $0 |
| 2 Earners | 34 (13.3%) | $0 |
| 3+ Earners | 9 (3.5%) | $0 |
| Total | 255 (100.0%) | $106,406 |
Household Income in Anna Maria
Household Income Brackets in Anna Maria
With 127 households falling in the category, the $75,000 to $99,999 income range is the most frequent in Anna Maria, accounting for 26.1% of all households.
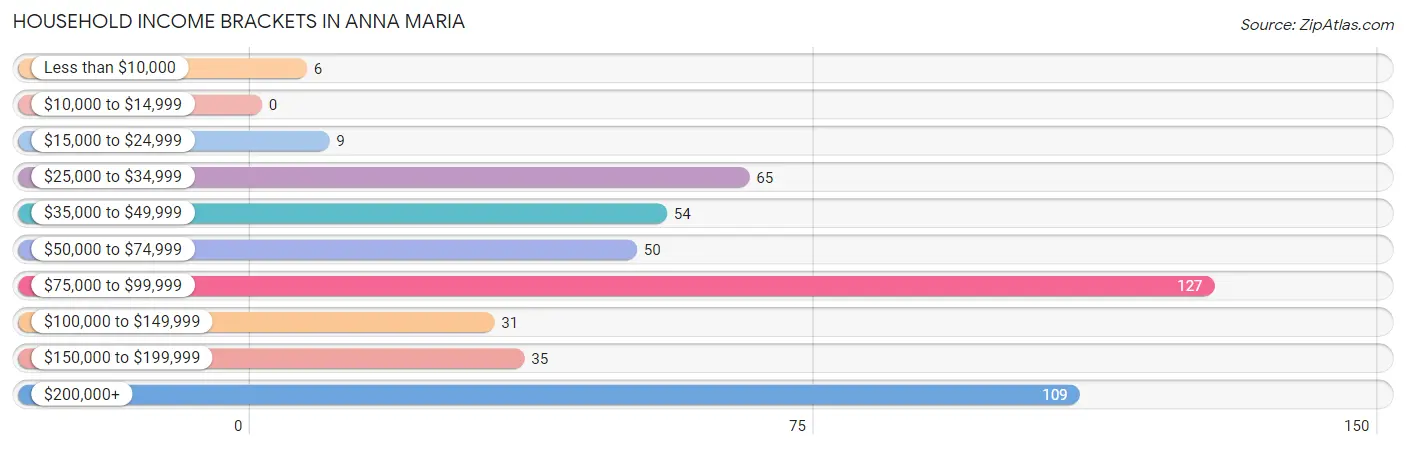
| Income Bracket | # Households | % Households |
| Less than $10,000 | 6 | 1.2% |
| $10,000 to $14,999 | 0 | 0.0% |
| $15,000 to $24,999 | 9 | 1.9% |
| $25,000 to $34,999 | 65 | 13.4% |
| $35,000 to $49,999 | 54 | 11.1% |
| $50,000 to $74,999 | 50 | 10.3% |
| $75,000 to $99,999 | 127 | 26.1% |
| $100,000 to $149,999 | 31 | 6.4% |
| $150,000 to $199,999 | 35 | 7.2% |
| $200,000+ | 109 | 22.4% |
Household Income by Householder Age in Anna Maria
The median household income in Anna Maria is $93,478, with the highest median household income of $59,792 found in the 65+ years age bracket for the primary householder. A total of 301 households (61.9%) fall into this category.
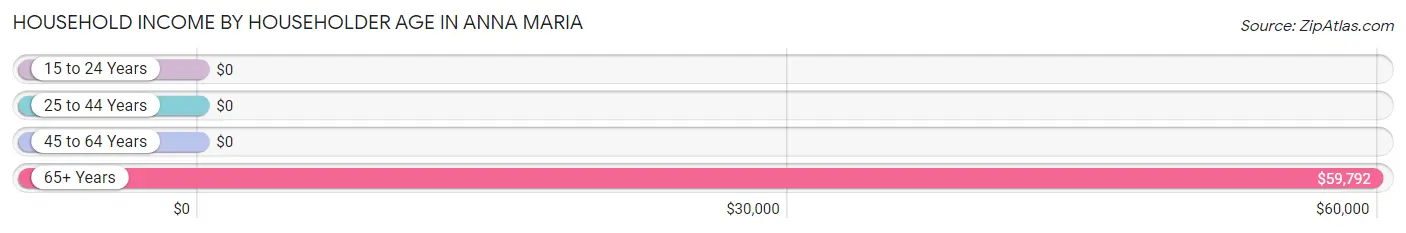
| Income Bracket | # Households | Median Income |
| 15 to 24 Years | 0 (0.0%) | $0 |
| 25 to 44 Years | 2 (0.4%) | $0 |
| 45 to 64 Years | 183 (37.7%) | $0 |
| 65+ Years | 301 (61.9%) | $59,792 |
| Total | 486 (100.0%) | $93,478 |
Poverty in Anna Maria
Income Below Poverty by Sex and Age in Anna Maria
With 2.1% poverty level for males and 2.6% for females among the residents of Anna Maria, 75 year old and over males and 45 to 54 year old females are the most vulnerable to poverty, with 8 males (8.9%) and 6 females (85.7%) in their respective age groups living below the poverty level.
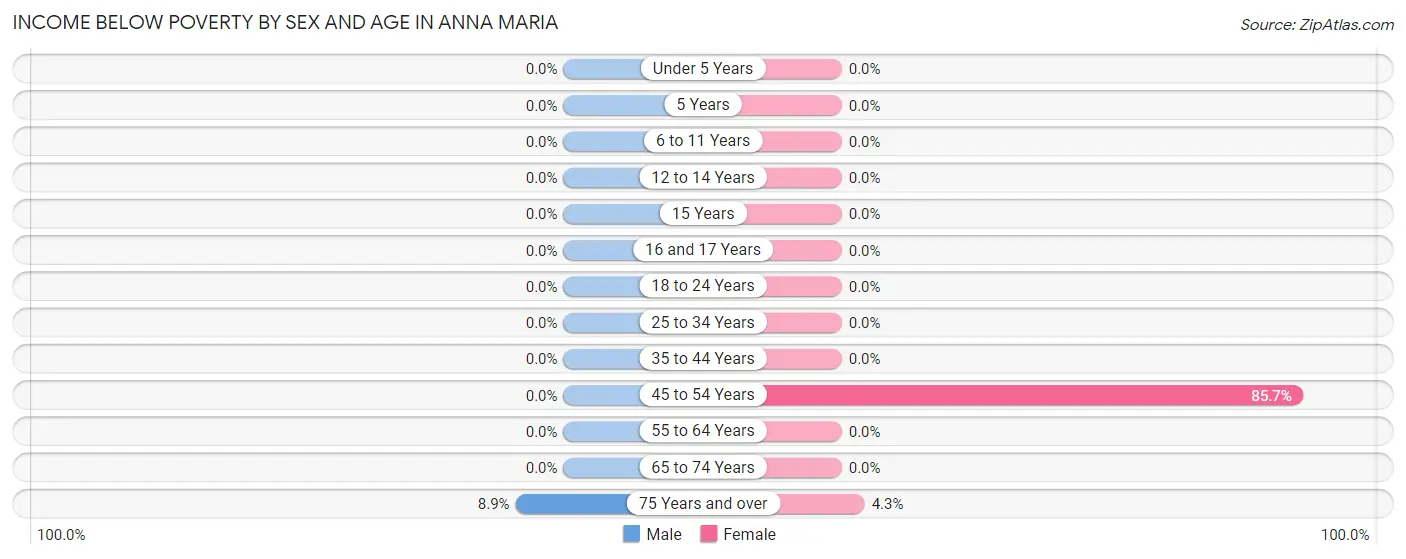
| Age Bracket | Male | Female |
| Under 5 Years | 0 (0.0%) | 0 (0.0%) |
| 5 Years | 0 (0.0%) | 0 (0.0%) |
| 6 to 11 Years | 0 (0.0%) | 0 (0.0%) |
| 12 to 14 Years | 0 (0.0%) | 0 (0.0%) |
| 15 Years | 0 (0.0%) | 0 (0.0%) |
| 16 and 17 Years | 0 (0.0%) | 0 (0.0%) |
| 18 to 24 Years | 0 (0.0%) | 0 (0.0%) |
| 25 to 34 Years | 0 (0.0%) | 0 (0.0%) |
| 35 to 44 Years | 0 (0.0%) | 0 (0.0%) |
| 45 to 54 Years | 0 (0.0%) | 6 (85.7%) |
| 55 to 64 Years | 0 (0.0%) | 0 (0.0%) |
| 65 to 74 Years | 0 (0.0%) | 0 (0.0%) |
| 75 Years and over | 8 (8.9%) | 6 (4.3%) |
| Total | 8 (2.1%) | 12 (2.6%) |
Income Above Poverty by Sex and Age in Anna Maria
According to the poverty statistics in Anna Maria, males aged 12 to 14 years and females aged 16 and 17 years are the age groups that are most secure financially, with 100.0% of males and 100.0% of females in these age groups living above the poverty line.
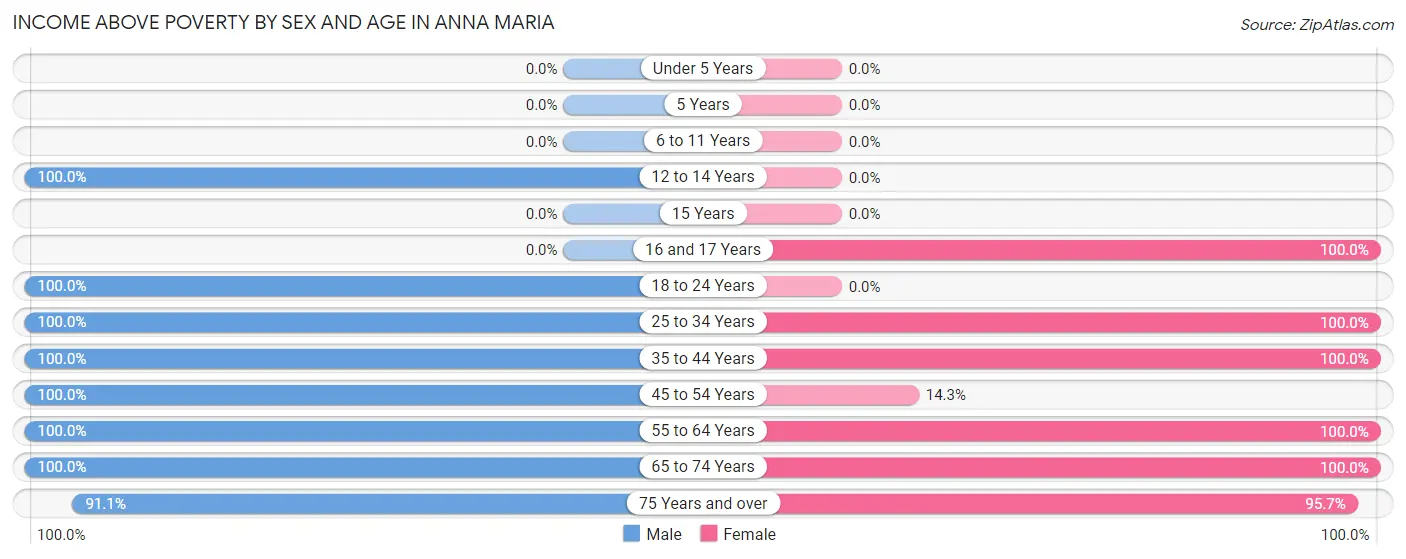
| Age Bracket | Male | Female |
| Under 5 Years | 0 (0.0%) | 0 (0.0%) |
| 5 Years | 0 (0.0%) | 0 (0.0%) |
| 6 to 11 Years | 0 (0.0%) | 0 (0.0%) |
| 12 to 14 Years | 1 (100.0%) | 0 (0.0%) |
| 15 Years | 0 (0.0%) | 0 (0.0%) |
| 16 and 17 Years | 0 (0.0%) | 1 (100.0%) |
| 18 to 24 Years | 8 (100.0%) | 0 (0.0%) |
| 25 to 34 Years | 9 (100.0%) | 9 (100.0%) |
| 35 to 44 Years | 2 (100.0%) | 2 (100.0%) |
| 45 to 54 Years | 28 (100.0%) | 1 (14.3%) |
| 55 to 64 Years | 135 (100.0%) | 176 (100.0%) |
| 65 to 74 Years | 99 (100.0%) | 117 (100.0%) |
| 75 Years and over | 82 (91.1%) | 135 (95.7%) |
| Total | 364 (97.9%) | 441 (97.4%) |
Income Below Poverty Among Married-Couple Families in Anna Maria
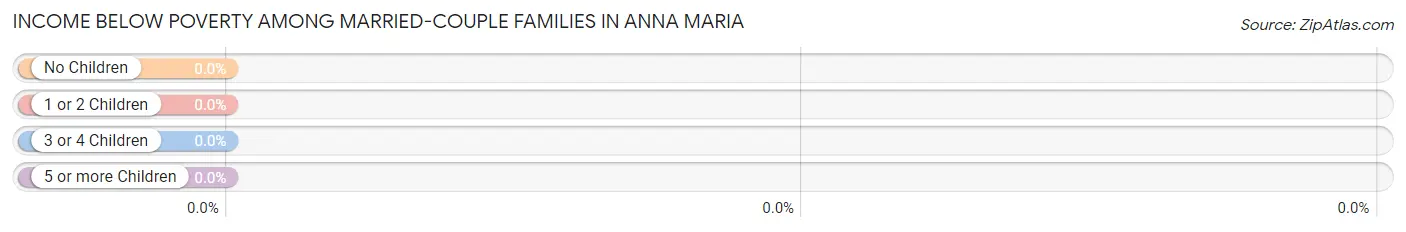
| Children | Above Poverty | Below Poverty |
| No Children | 226 (100.0%) | 0 (0.0%) |
| 1 or 2 Children | 0 (0.0%) | 0 (0.0%) |
| 3 or 4 Children | 0 (0.0%) | 0 (0.0%) |
| 5 or more Children | 0 (0.0%) | 0 (0.0%) |
| Total | 226 (100.0%) | 0 (0.0%) |
Income Below Poverty Among Single-Parent Households in Anna Maria
| Children | Single Father | Single Mother |
| No Children | 0 (0.0%) | 0 (0.0%) |
| 1 or 2 Children | 0 (0.0%) | 0 (0.0%) |
| 3 or 4 Children | 0 (0.0%) | 0 (0.0%) |
| 5 or more Children | 0 (0.0%) | 0 (0.0%) |
| Total | 0 (0.0%) | 0 (0.0%) |
Income Below Poverty Among Married-Couple vs Single-Parent Households in Anna Maria
| Children | Married-Couple Families | Single-Parent Households |
| No Children | 0 (0.0%) | 0 (0.0%) |
| 1 or 2 Children | 0 (0.0%) | 0 (0.0%) |
| 3 or 4 Children | 0 (0.0%) | 0 (0.0%) |
| 5 or more Children | 0 (0.0%) | 0 (0.0%) |
| Total | 0 (0.0%) | 0 (0.0%) |
Race in Anna Maria
The most populous races in Anna Maria are White / Caucasian (811 | 98.3%), Hispanic or Latino (24 | 2.9%), and Two or more Races (11 | 1.3%).
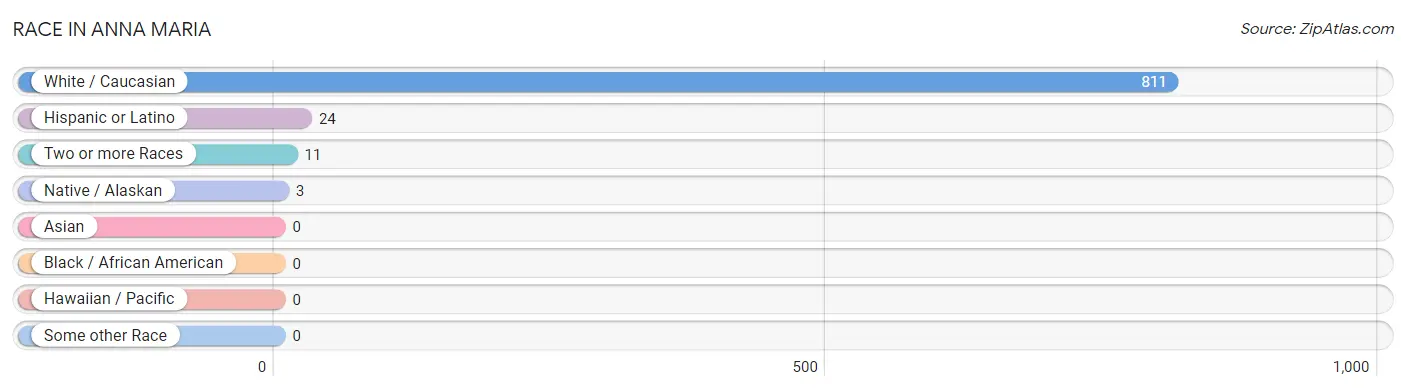
| Race | # Population | % Population |
| Asian | 0 | 0.0% |
| Black / African American | 0 | 0.0% |
| Hawaiian / Pacific | 0 | 0.0% |
| Hispanic or Latino | 24 | 2.9% |
| Native / Alaskan | 3 | 0.4% |
| White / Caucasian | 811 | 98.3% |
| Two or more Races | 11 | 1.3% |
| Some other Race | 0 | 0.0% |
| Total | 825 | 100.0% |
Ancestry in Anna Maria
The most populous ancestries reported in Anna Maria are German (183 | 22.2%), Irish (166 | 20.1%), English (148 | 17.9%), American (108 | 13.1%), and French (56 | 6.8%), together accounting for 80.1% of all Anna Maria residents.
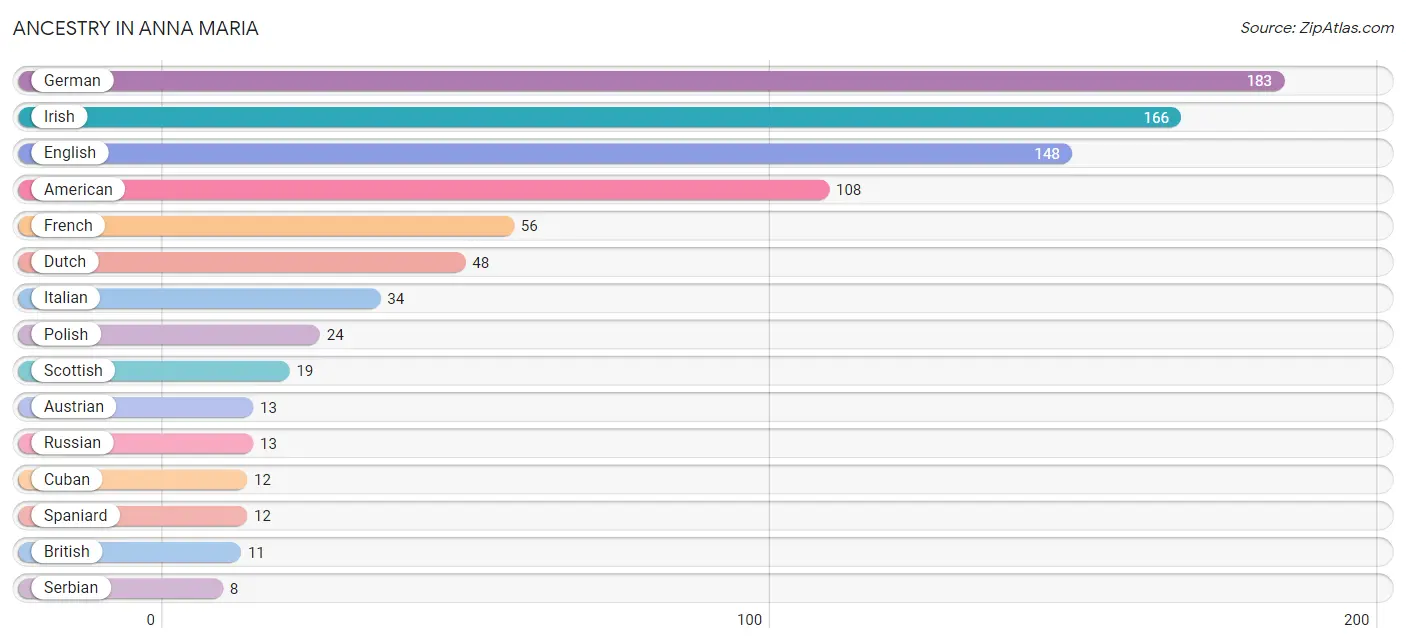
| Ancestry | # Population | % Population |
| American | 108 | 13.1% |
| Austrian | 13 | 1.6% |
| British | 11 | 1.3% |
| Creek | 3 | 0.4% |
| Croatian | 5 | 0.6% |
| Cuban | 12 | 1.5% |
| Czechoslovakian | 6 | 0.7% |
| Danish | 1 | 0.1% |
| Dutch | 48 | 5.8% |
| English | 148 | 17.9% |
| Finnish | 6 | 0.7% |
| French | 56 | 6.8% |
| German | 183 | 22.2% |
| Greek | 5 | 0.6% |
| Hungarian | 6 | 0.7% |
| Irish | 166 | 20.1% |
| Italian | 34 | 4.1% |
| Norwegian | 5 | 0.6% |
| Polish | 24 | 2.9% |
| Russian | 13 | 1.6% |
| Scandinavian | 6 | 0.7% |
| Scottish | 19 | 2.3% |
| Serbian | 8 | 1.0% |
| Spaniard | 12 | 1.5% |
| Swedish | 5 | 0.6% | View All 25 Rows |
Immigrants in Anna Maria
The most numerous immigrant groups reported in Anna Maria came from Europe (45 | 5.4%), Northern Europe (34 | 4.1%), Ireland (22 | 2.7%), Eastern Europe (11 | 1.3%), and Romania (6 | 0.7%), together accounting for 14.3% of all Anna Maria residents.
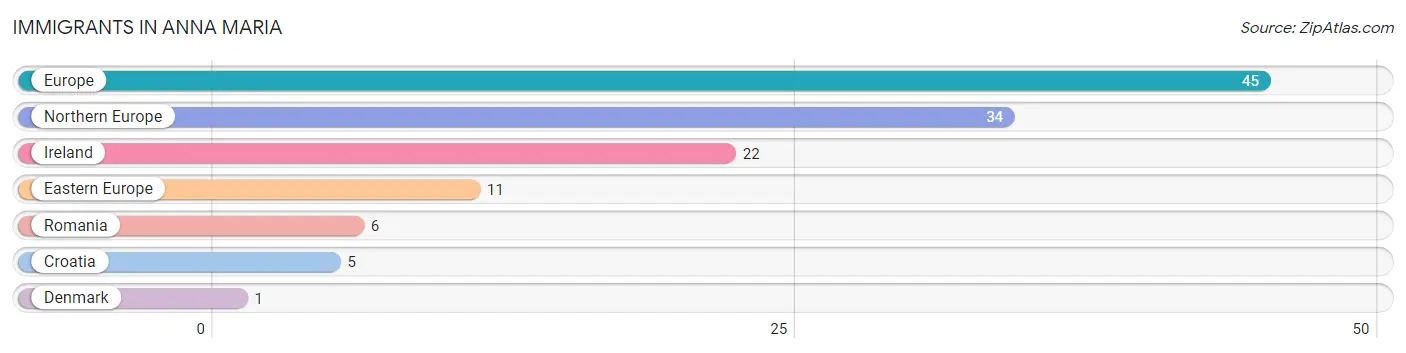
| Immigration Origin | # Population | % Population |
| Croatia | 5 | 0.6% |
| Denmark | 1 | 0.1% |
| Eastern Europe | 11 | 1.3% |
| Europe | 45 | 5.4% |
| Ireland | 22 | 2.7% |
| Northern Europe | 34 | 4.1% |
| Romania | 6 | 0.7% | View All 7 Rows |
Sex and Age in Anna Maria
Sex and Age in Anna Maria
The most populous age groups in Anna Maria are 60 to 64 Years (122 | 32.8%) for men and 60 to 64 Years (146 | 32.2%) for women.
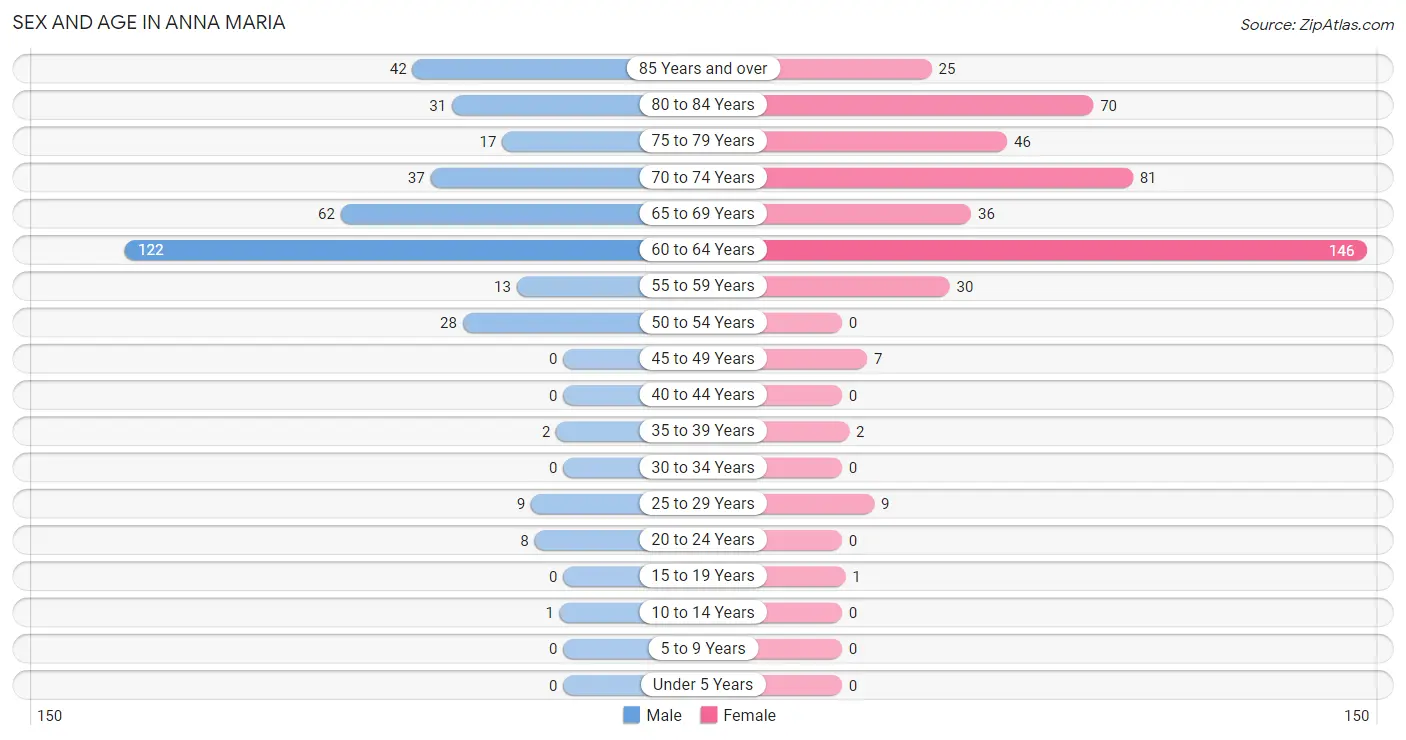
| Age Bracket | Male | Female |
| Under 5 Years | 0 (0.0%) | 0 (0.0%) |
| 5 to 9 Years | 0 (0.0%) | 0 (0.0%) |
| 10 to 14 Years | 1 (0.3%) | 0 (0.0%) |
| 15 to 19 Years | 0 (0.0%) | 1 (0.2%) |
| 20 to 24 Years | 8 (2.1%) | 0 (0.0%) |
| 25 to 29 Years | 9 (2.4%) | 9 (2.0%) |
| 30 to 34 Years | 0 (0.0%) | 0 (0.0%) |
| 35 to 39 Years | 2 (0.5%) | 2 (0.4%) |
| 40 to 44 Years | 0 (0.0%) | 0 (0.0%) |
| 45 to 49 Years | 0 (0.0%) | 7 (1.5%) |
| 50 to 54 Years | 28 (7.5%) | 0 (0.0%) |
| 55 to 59 Years | 13 (3.5%) | 30 (6.6%) |
| 60 to 64 Years | 122 (32.8%) | 146 (32.2%) |
| 65 to 69 Years | 62 (16.7%) | 36 (8.0%) |
| 70 to 74 Years | 37 (10.0%) | 81 (17.9%) |
| 75 to 79 Years | 17 (4.6%) | 46 (10.2%) |
| 80 to 84 Years | 31 (8.3%) | 70 (15.4%) |
| 85 Years and over | 42 (11.3%) | 25 (5.5%) |
| Total | 372 (100.0%) | 453 (100.0%) |
Families and Households in Anna Maria
Median Family Size in Anna Maria
The median family size in Anna Maria is 2.27 persons per family, with single female/mother families (11 | 4.3%) accounting for the largest median family size of 3.27 persons per family. On the other hand, married-couple families (226 | 88.6%) represent the smallest median family size with 2.20 persons per family.
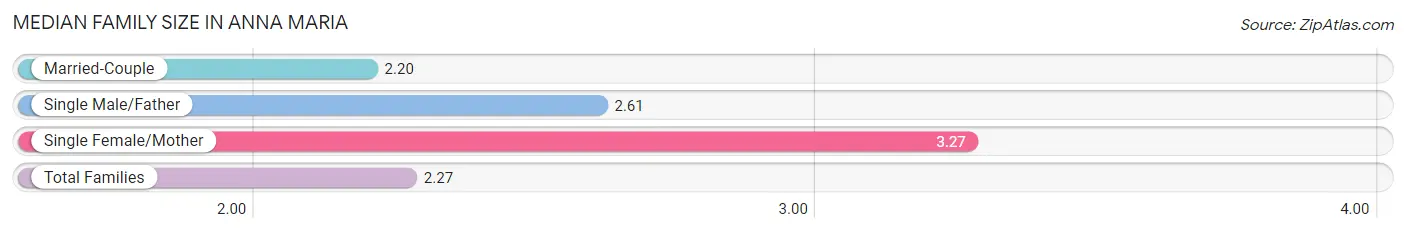
| Family Type | # Families | Family Size |
| Married-Couple | 226 (88.6%) | 2.20 |
| Single Male/Father | 18 (7.1%) | 2.61 |
| Single Female/Mother | 11 (4.3%) | 3.27 |
| Total Families | 255 (100.0%) | 2.27 |
Median Household Size in Anna Maria
The median household size in Anna Maria is 1.70 persons per household, with single female/mother households (11 | 2.3%) accounting for the largest median household size of 3.27 persons per household. non-family households (231 | 47.5%) represent the smallest median household size with 1.06 persons per household.
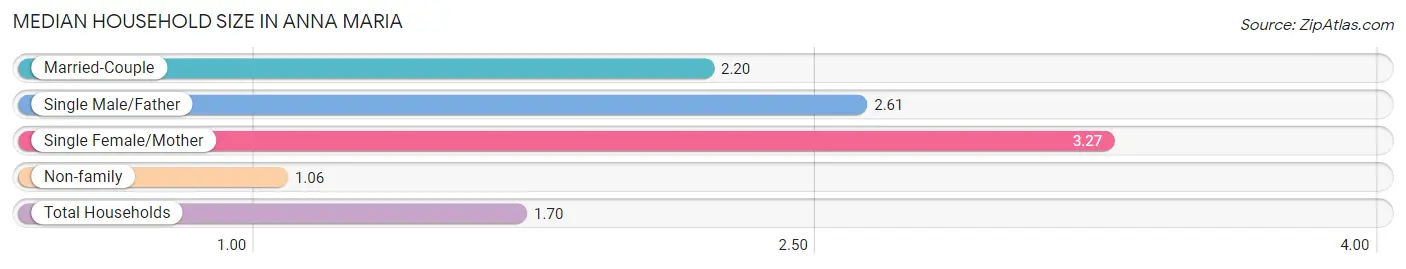
| Household Type | # Households | Household Size |
| Married-Couple | 226 (46.5%) | 2.20 |
| Single Male/Father | 18 (3.7%) | 2.61 |
| Single Female/Mother | 11 (2.3%) | 3.27 |
| Non-family | 231 (47.5%) | 1.06 |
| Total Households | 486 (100.0%) | 1.70 |
Household Size by Marriage Status in Anna Maria
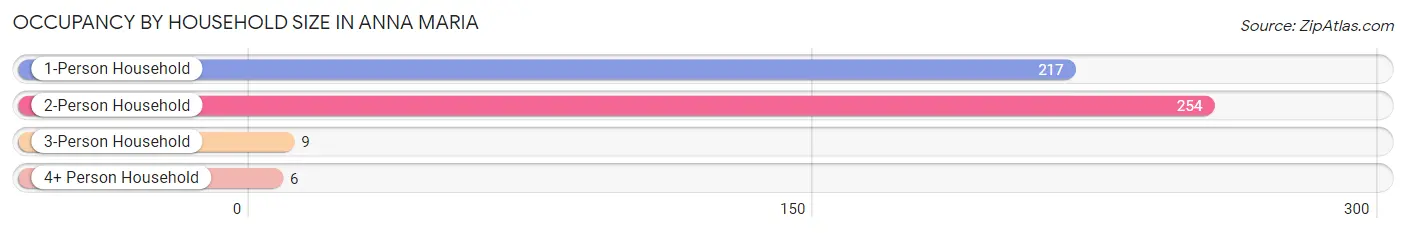
Out of a total of 486 households in Anna Maria, 255 (52.5%) are family households, while 231 (47.5%) are nonfamily households. The most numerous type of family households are 2-person households, comprising 240, and the most common type of nonfamily households are 1-person households, comprising 217.
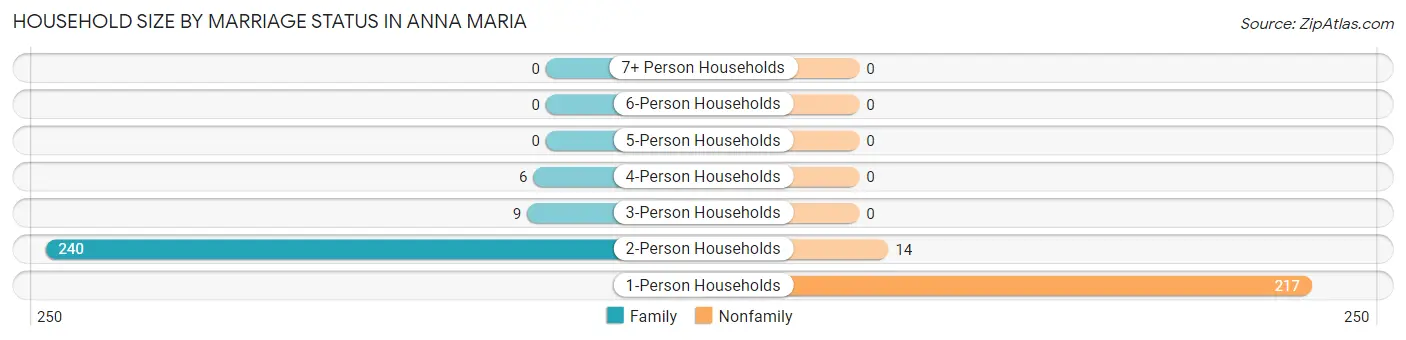
| Household Size | Family Households | Nonfamily Households |
| 1-Person Households | - | 217 (44.7%) |
| 2-Person Households | 240 (49.4%) | 14 (2.9%) |
| 3-Person Households | 9 (1.8%) | 0 (0.0%) |
| 4-Person Households | 6 (1.2%) | 0 (0.0%) |
| 5-Person Households | 0 (0.0%) | 0 (0.0%) |
| 6-Person Households | 0 (0.0%) | 0 (0.0%) |
| 7+ Person Households | 0 (0.0%) | 0 (0.0%) |
| Total | 255 (52.5%) | 231 (47.5%) |
Female Fertility in Anna Maria
Fertility by Age in Anna Maria
| Age Bracket | Women with Births | Births / 1,000 Women |
| 15 to 19 years | 0 (0.0%) | 0.0 |
| 20 to 34 years | 0 (0.0%) | 0.0 |
| 35 to 50 years | 0 (0.0%) | 0.0 |
| Total | 0 (0.0%) | 0.0 |
Fertility by Age by Marriage Status in Anna Maria
| Age Bracket | Married | Unmarried |
| 15 to 19 years | 0 (0.0%) | 0 (0.0%) |
| 20 to 34 years | 0 (0.0%) | 0 (0.0%) |
| 35 to 50 years | 0 (0.0%) | 0 (0.0%) |
| Total | 0 (0.0%) | 0 (0.0%) |
Fertility by Education in Anna Maria
| Educational Attainment | Women with Births | Births / 1,000 Women |
| Less than High School | 0 (0.0%) | 0.0 |
| High School Diploma | 0 (0.0%) | 0.0 |
| College or Associate's Degree | 0 (0.0%) | 0.0 |
| Bachelor's Degree | 0 (0.0%) | 0.0 |
| Graduate Degree | 0 (0.0%) | 0.0 |
| Total | 0 (0.0%) | 0.0 |
Fertility by Education by Marriage Status in Anna Maria
| Educational Attainment | Married | Unmarried |
| Less than High School | 0 (0.0%) | 0 (0.0%) |
| High School Diploma | 0 (0.0%) | 0 (0.0%) |
| College or Associate's Degree | 0 (0.0%) | 0 (0.0%) |
| Bachelor's Degree | 0 (0.0%) | 0 (0.0%) |
| Graduate Degree | 0 (0.0%) | 0 (0.0%) |
| Total | 0 (0.0%) | 0 (0.0%) |
Employment Characteristics in Anna Maria
Employment by Class of Employer in Anna Maria
Among the 196 employed individuals in Anna Maria, private company employees (140 | 71.4%), self-employed (incorporated) (49 | 25.0%), and local government employees (4 | 2.0%) make up the most common classes of employment.
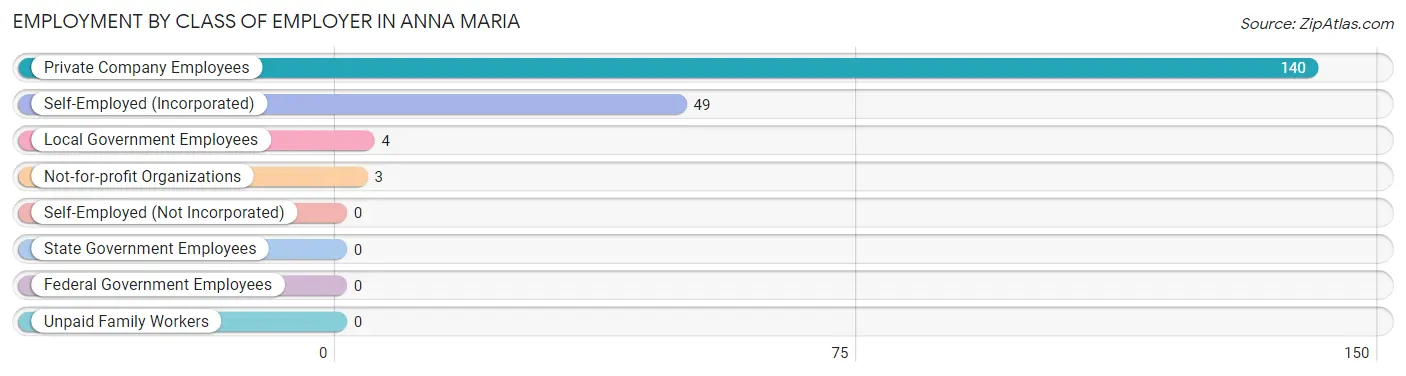
| Employer Class | # Employees | % Employees |
| Private Company Employees | 140 | 71.4% |
| Self-Employed (Incorporated) | 49 | 25.0% |
| Self-Employed (Not Incorporated) | 0 | 0.0% |
| Not-for-profit Organizations | 3 | 1.5% |
| Local Government Employees | 4 | 2.0% |
| State Government Employees | 0 | 0.0% |
| Federal Government Employees | 0 | 0.0% |
| Unpaid Family Workers | 0 | 0.0% |
| Total | 196 | 100.0% |
Employment Status by Age in Anna Maria
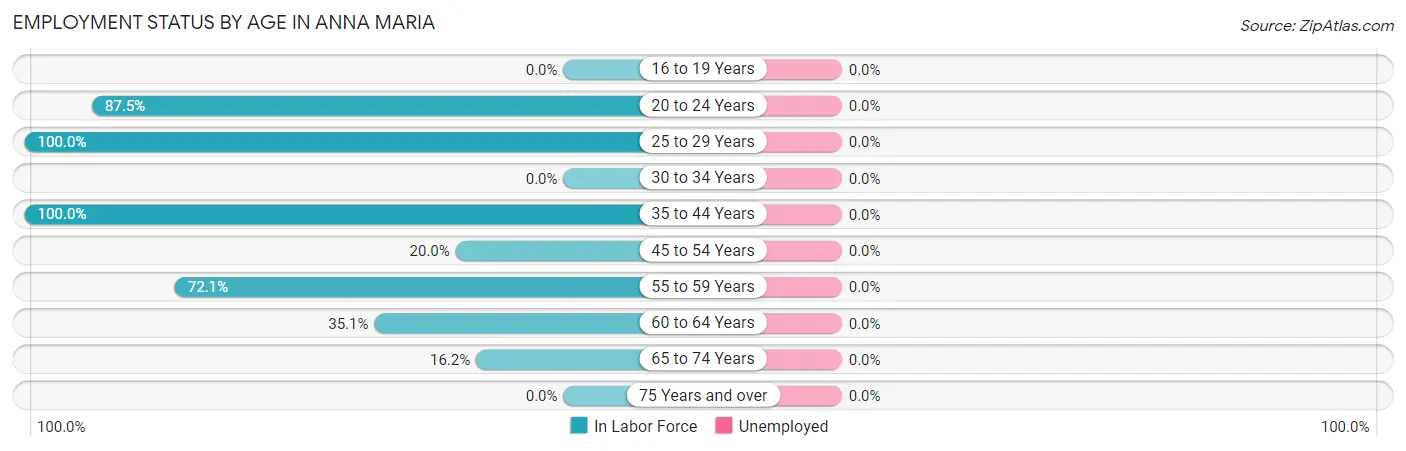
| Age Bracket | In Labor Force | Unemployed |
| 16 to 19 Years | 0 (0.0%) | 0 (0.0%) |
| 20 to 24 Years | 7 (87.5%) | 0 (0.0%) |
| 25 to 29 Years | 18 (100.0%) | 0 (0.0%) |
| 30 to 34 Years | 0 (0.0%) | 0 (0.0%) |
| 35 to 44 Years | 4 (100.0%) | 0 (0.0%) |
| 45 to 54 Years | 7 (20.0%) | 0 (0.0%) |
| 55 to 59 Years | 31 (72.1%) | 0 (0.0%) |
| 60 to 64 Years | 94 (35.1%) | 0 (0.0%) |
| 65 to 74 Years | 35 (16.2%) | 0 (0.0%) |
| 75 Years and over | 0 (0.0%) | 0 (0.0%) |
| Total | 196 (23.8%) | 0 (0.0%) |
Employment Status by Educational Attainment in Anna Maria
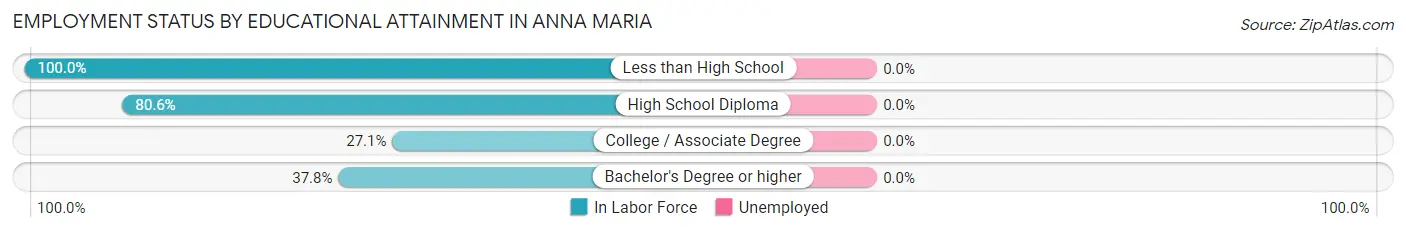
| Educational Attainment | In Labor Force | Unemployed |
| Less than High School | 11 (100.0%) | 0 (0.0%) |
| High School Diploma | 29 (80.6%) | 0 (0.0%) |
| College / Associate Degree | 19 (27.1%) | 0 (0.0%) |
| Bachelor's Degree or higher | 95 (37.8%) | 0 (0.0%) |
| Total | 154 (41.8%) | 0 (0.0%) |
Employment Occupations by Sex in Anna Maria
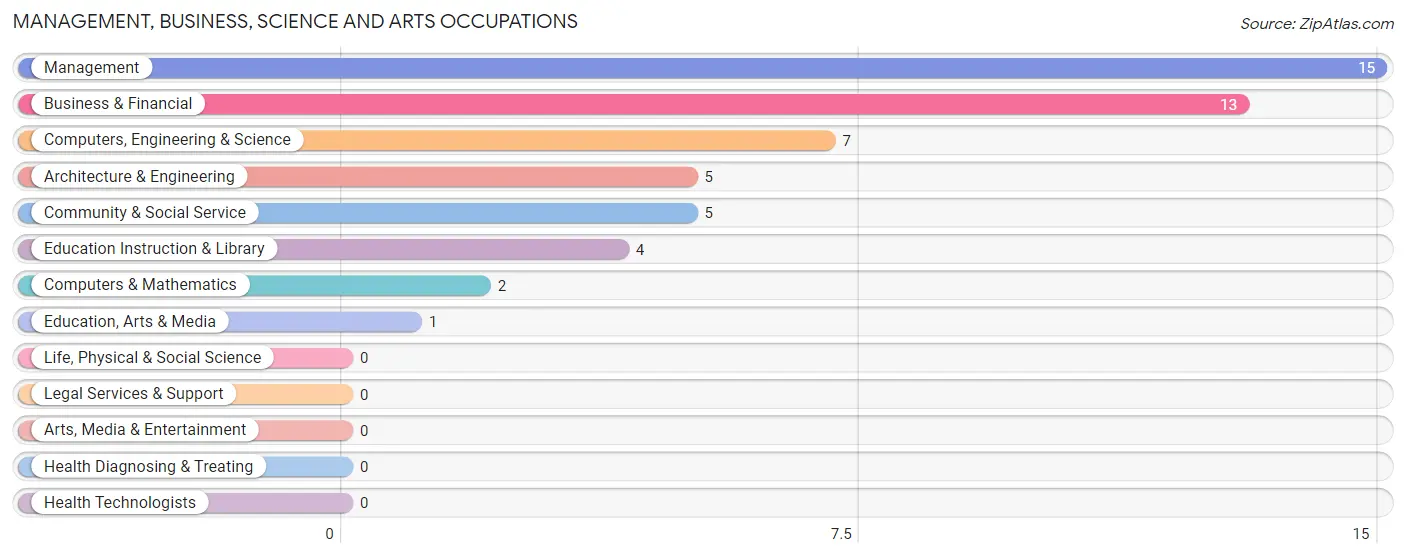
Management, Business, Science and Arts Occupations
The most common Management, Business, Science and Arts occupations in Anna Maria are Management (15 | 7.6%), Business & Financial (13 | 6.6%), Computers, Engineering & Science (7 | 3.6%), Architecture & Engineering (5 | 2.5%), and Community & Social Service (5 | 2.5%).
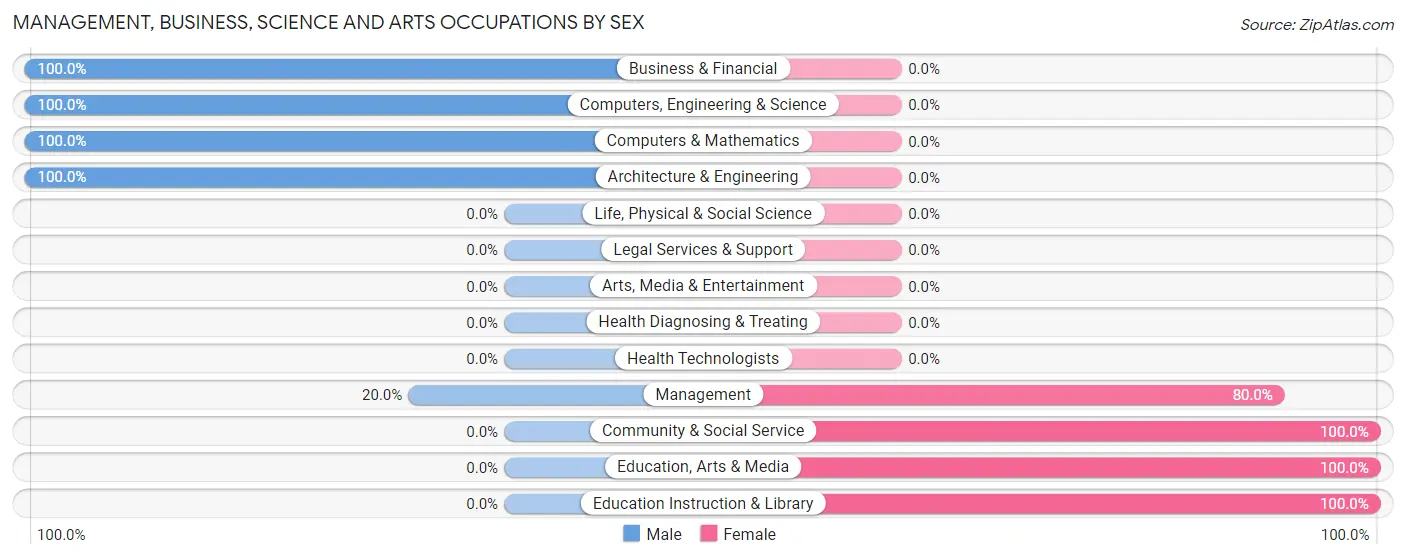
Management, Business, Science and Arts Occupations by Sex
Within the Management, Business, Science and Arts occupations in Anna Maria, the most male-oriented occupations are Business & Financial (100.0%), Computers, Engineering & Science (100.0%), and Computers & Mathematics (100.0%), while the most female-oriented occupations are Community & Social Service (100.0%), Education, Arts & Media (100.0%), and Education Instruction & Library (100.0%).
| Occupation | Male | Female |
| Management | 3 (20.0%) | 12 (80.0%) |
| Business & Financial | 13 (100.0%) | 0 (0.0%) |
| Computers, Engineering & Science | 7 (100.0%) | 0 (0.0%) |
| Computers & Mathematics | 2 (100.0%) | 0 (0.0%) |
| Architecture & Engineering | 5 (100.0%) | 0 (0.0%) |
| Life, Physical & Social Science | 0 (0.0%) | 0 (0.0%) |
| Community & Social Service | 0 (0.0%) | 5 (100.0%) |
| Education, Arts & Media | 0 (0.0%) | 1 (100.0%) |
| Legal Services & Support | 0 (0.0%) | 0 (0.0%) |
| Education Instruction & Library | 0 (0.0%) | 4 (100.0%) |
| Arts, Media & Entertainment | 0 (0.0%) | 0 (0.0%) |
| Health Diagnosing & Treating | 0 (0.0%) | 0 (0.0%) |
| Health Technologists | 0 (0.0%) | 0 (0.0%) |
| Total (Category) | 23 (57.5%) | 17 (42.5%) |
| Total (Overall) | 93 (47.4%) | 103 (52.5%) |
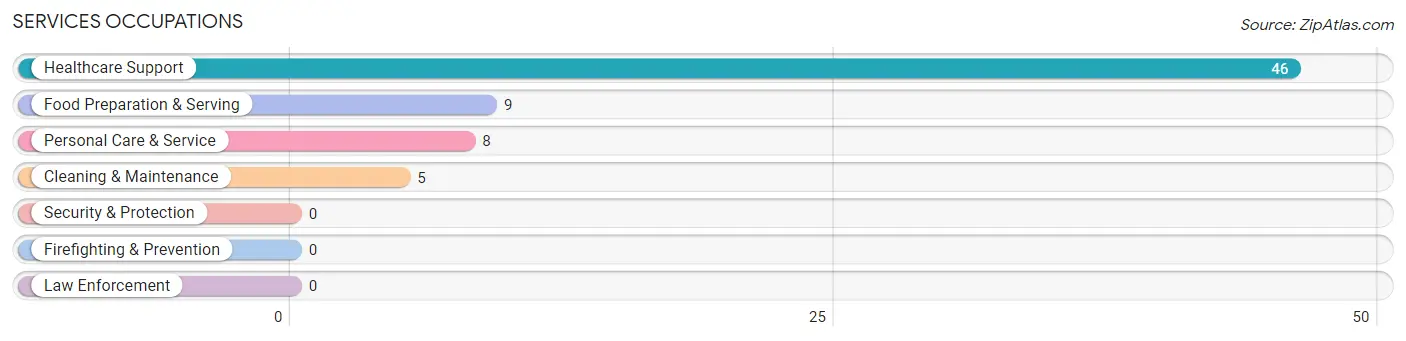
Services Occupations
The most common Services occupations in Anna Maria are Healthcare Support (46 | 23.5%), Food Preparation & Serving (9 | 4.6%), Personal Care & Service (8 | 4.1%), and Cleaning & Maintenance (5 | 2.5%).
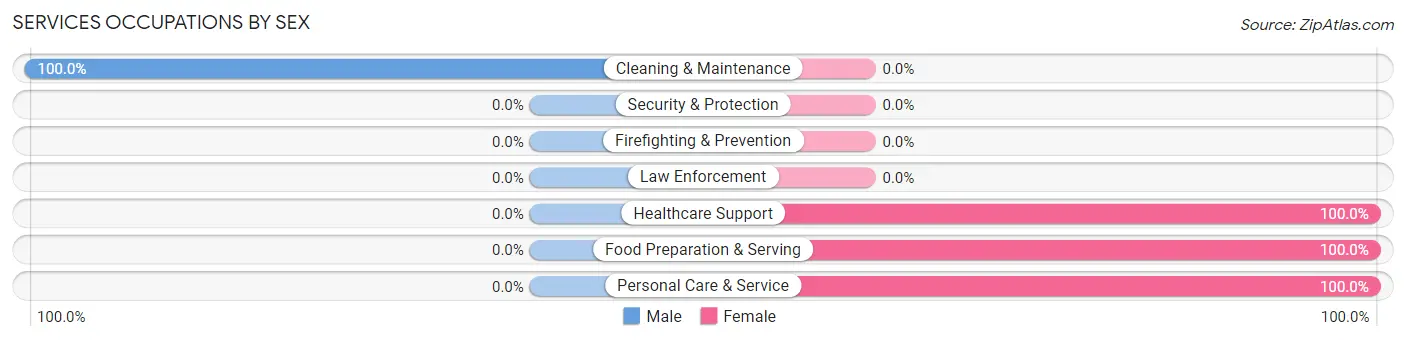
Services Occupations by Sex
| Occupation | Male | Female |
| Healthcare Support | 0 (0.0%) | 46 (100.0%) |
| Security & Protection | 0 (0.0%) | 0 (0.0%) |
| Firefighting & Prevention | 0 (0.0%) | 0 (0.0%) |
| Law Enforcement | 0 (0.0%) | 0 (0.0%) |
| Food Preparation & Serving | 0 (0.0%) | 9 (100.0%) |
| Cleaning & Maintenance | 5 (100.0%) | 0 (0.0%) |
| Personal Care & Service | 0 (0.0%) | 8 (100.0%) |
| Total (Category) | 5 (7.3%) | 63 (92.6%) |
| Total (Overall) | 93 (47.4%) | 103 (52.5%) |
Sales and Office Occupations
The most common Sales and Office occupations in Anna Maria are Sales & Related (42 | 21.4%), and Office & Administration (12 | 6.1%).
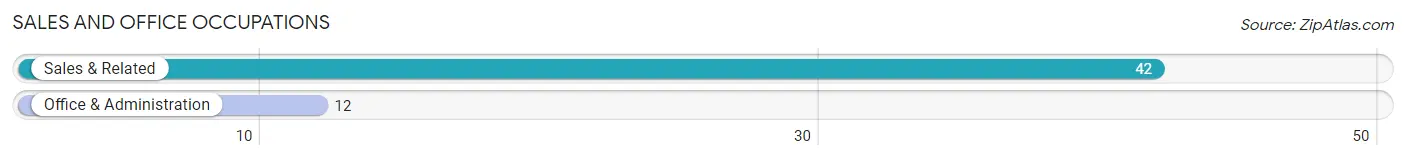
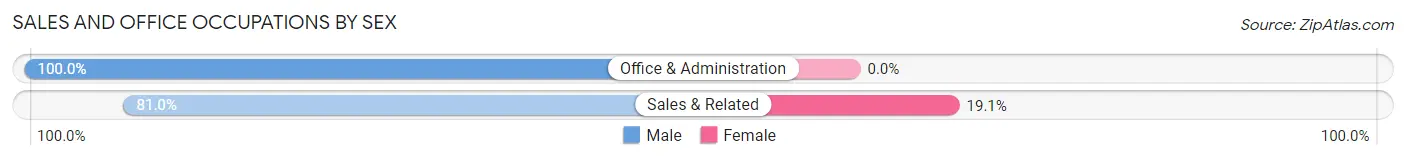
Sales and Office Occupations by Sex
| Occupation | Male | Female |
| Sales & Related | 34 (80.9%) | 8 (19.1%) |
| Office & Administration | 12 (100.0%) | 0 (0.0%) |
| Total (Category) | 46 (85.2%) | 8 (14.8%) |
| Total (Overall) | 93 (47.4%) | 103 (52.5%) |
Natural Resources, Construction and Maintenance Occupations
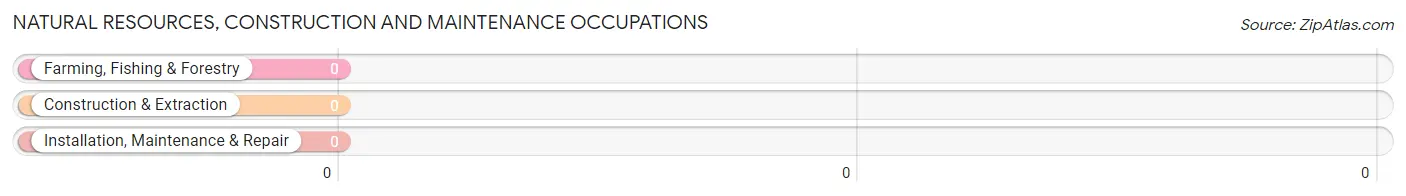
Natural Resources, Construction and Maintenance Occupations by Sex
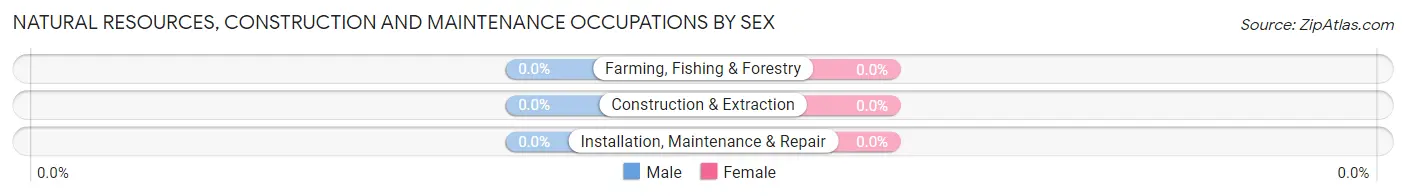
| Occupation | Male | Female |
| Farming, Fishing & Forestry | 0 (0.0%) | 0 (0.0%) |
| Construction & Extraction | 0 (0.0%) | 0 (0.0%) |
| Installation, Maintenance & Repair | 0 (0.0%) | 0 (0.0%) |
| Total (Category) | 0 (0.0%) | 0 (0.0%) |
| Total (Overall) | 93 (47.4%) | 103 (52.5%) |
Production, Transportation and Moving Occupations
The most common Production, Transportation and Moving occupations in Anna Maria are Production (24 | 12.2%), and Transportation (10 | 5.1%).
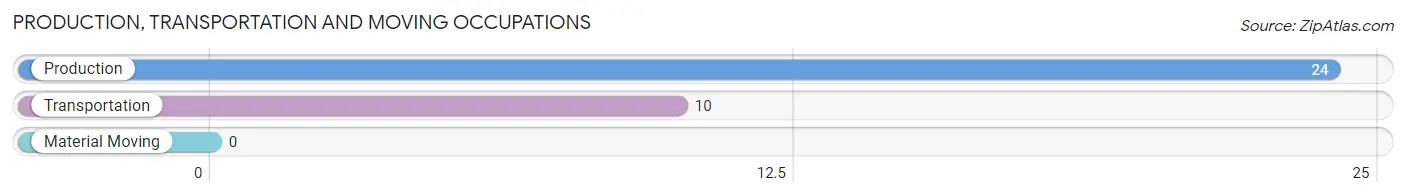
Production, Transportation and Moving Occupations by Sex
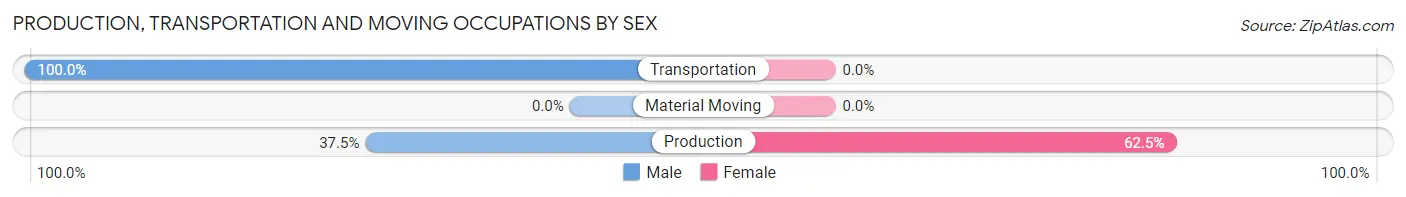
| Occupation | Male | Female |
| Production | 9 (37.5%) | 15 (62.5%) |
| Transportation | 10 (100.0%) | 0 (0.0%) |
| Material Moving | 0 (0.0%) | 0 (0.0%) |
| Total (Category) | 19 (55.9%) | 15 (44.1%) |
| Total (Overall) | 93 (47.4%) | 103 (52.5%) |
Employment Industries by Sex in Anna Maria
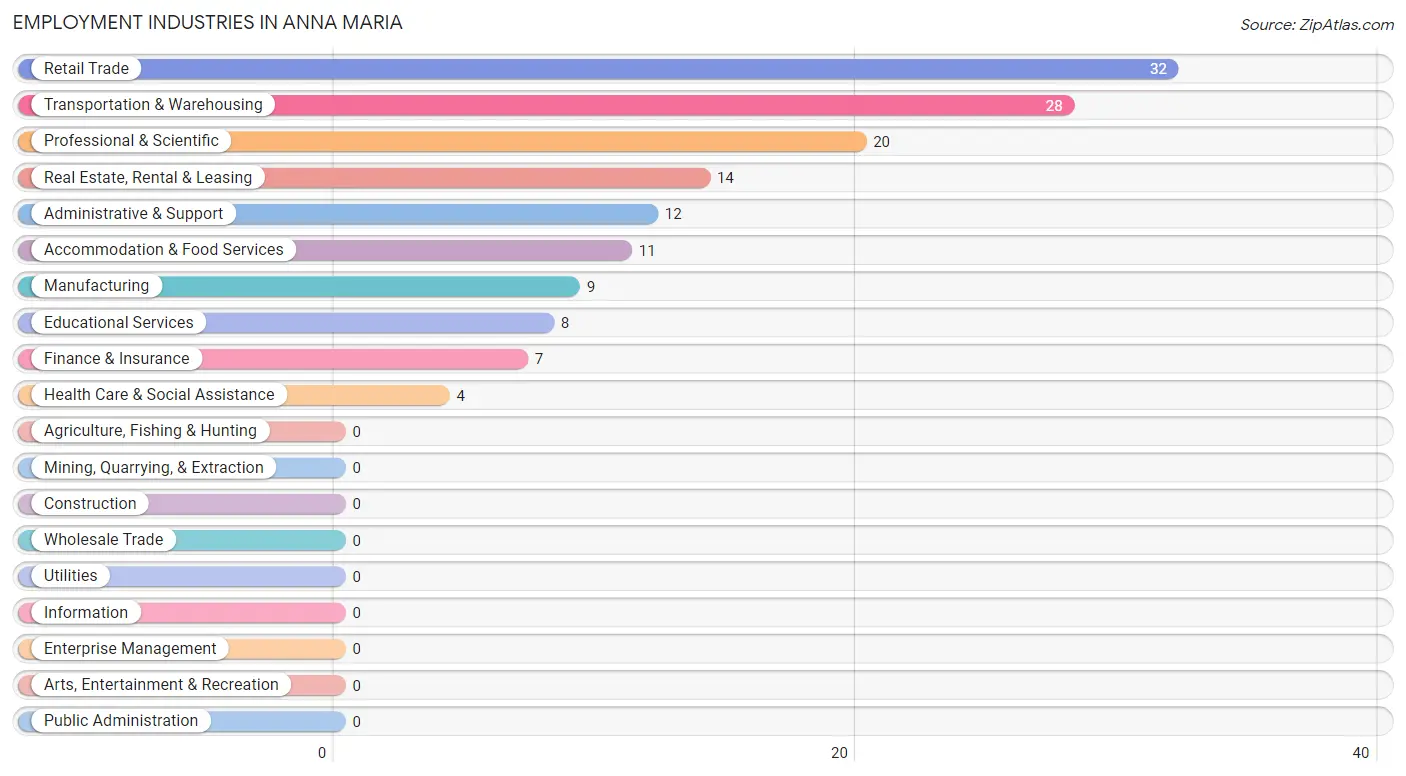
Employment Industries in Anna Maria
The major employment industries in Anna Maria include Retail Trade (32 | 16.3%), Transportation & Warehousing (28 | 14.3%), Professional & Scientific (20 | 10.2%), Real Estate, Rental & Leasing (14 | 7.1%), and Administrative & Support (12 | 6.1%).
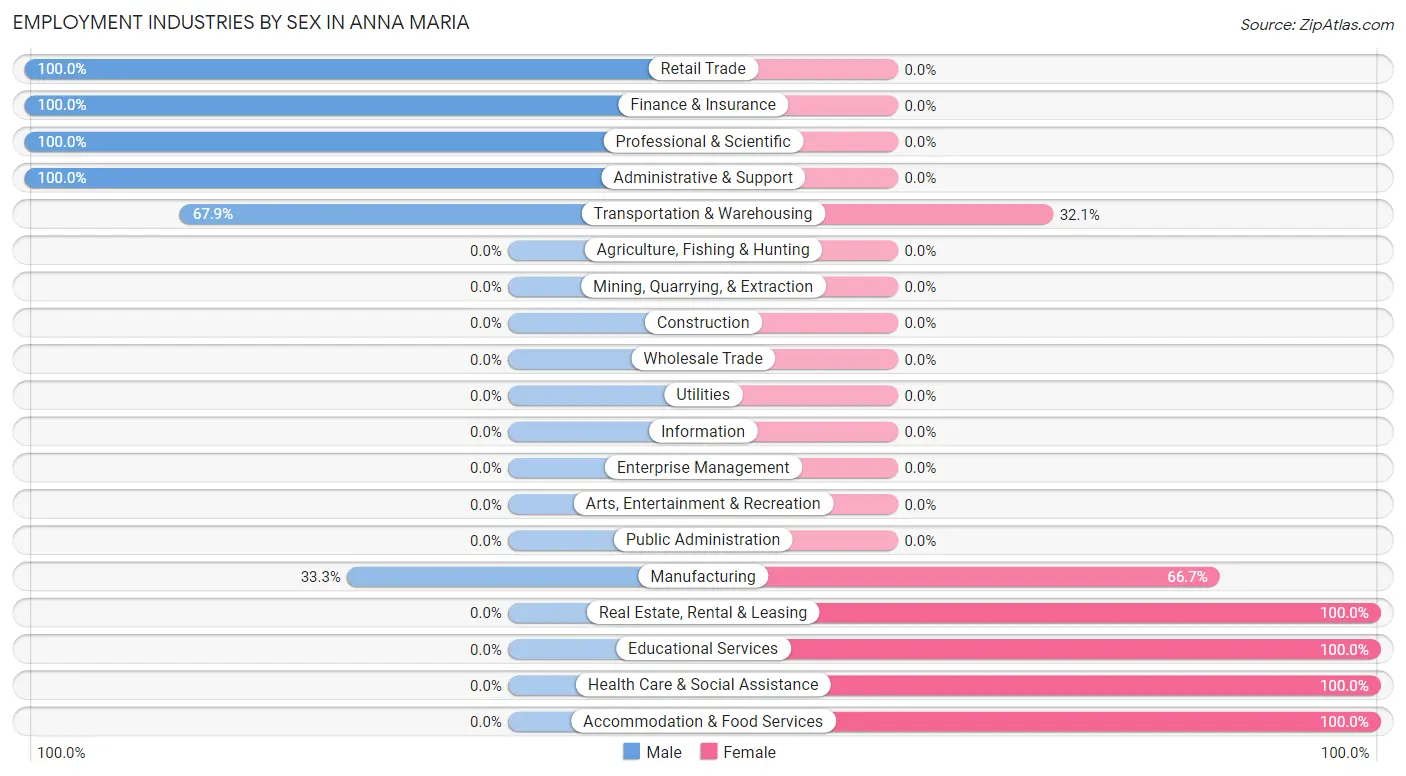
Employment Industries by Sex in Anna Maria
The Anna Maria industries that see more men than women are Retail Trade (100.0%), Finance & Insurance (100.0%), and Professional & Scientific (100.0%), whereas the industries that tend to have a higher number of women are Real Estate, Rental & Leasing (100.0%), Educational Services (100.0%), and Health Care & Social Assistance (100.0%).
| Industry | Male | Female |
| Agriculture, Fishing & Hunting | 0 (0.0%) | 0 (0.0%) |
| Mining, Quarrying, & Extraction | 0 (0.0%) | 0 (0.0%) |
| Construction | 0 (0.0%) | 0 (0.0%) |
| Manufacturing | 3 (33.3%) | 6 (66.7%) |
| Wholesale Trade | 0 (0.0%) | 0 (0.0%) |
| Retail Trade | 32 (100.0%) | 0 (0.0%) |
| Transportation & Warehousing | 19 (67.9%) | 9 (32.1%) |
| Utilities | 0 (0.0%) | 0 (0.0%) |
| Information | 0 (0.0%) | 0 (0.0%) |
| Finance & Insurance | 7 (100.0%) | 0 (0.0%) |
| Real Estate, Rental & Leasing | 0 (0.0%) | 14 (100.0%) |
| Professional & Scientific | 20 (100.0%) | 0 (0.0%) |
| Enterprise Management | 0 (0.0%) | 0 (0.0%) |
| Administrative & Support | 12 (100.0%) | 0 (0.0%) |
| Educational Services | 0 (0.0%) | 8 (100.0%) |
| Health Care & Social Assistance | 0 (0.0%) | 4 (100.0%) |
| Arts, Entertainment & Recreation | 0 (0.0%) | 0 (0.0%) |
| Accommodation & Food Services | 0 (0.0%) | 11 (100.0%) |
| Public Administration | 0 (0.0%) | 0 (0.0%) |
| Total | 93 (47.4%) | 103 (52.5%) |
Education in Anna Maria
School Enrollment in Anna Maria
The most common levels of schooling among the 56 students in Anna Maria are graduate / professional (46 | 82.1%), college / undergraduate (8 | 14.3%), and middle school (1 | 1.8%).
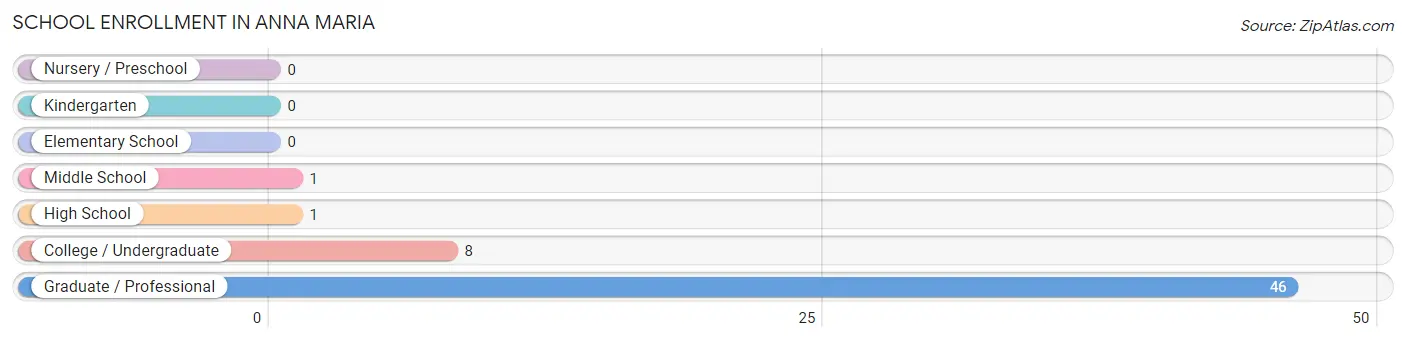
| School Level | # Students | % Students |
| Nursery / Preschool | 0 | 0.0% |
| Kindergarten | 0 | 0.0% |
| Elementary School | 0 | 0.0% |
| Middle School | 1 | 1.8% |
| High School | 1 | 1.8% |
| College / Undergraduate | 8 | 14.3% |
| Graduate / Professional | 46 | 82.1% |
| Total | 56 | 100.0% |
School Enrollment by Age by Funding Source in Anna Maria
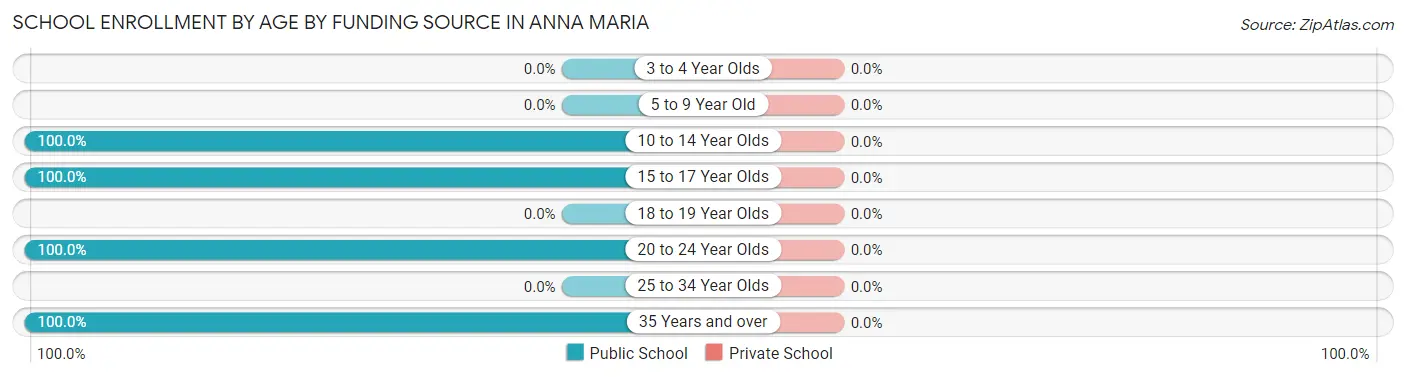
| Age Bracket | Public School | Private School |
| 3 to 4 Year Olds | 0 (0.0%) | 0 (0.0%) |
| 5 to 9 Year Old | 0 (0.0%) | 0 (0.0%) |
| 10 to 14 Year Olds | 1 (100.0%) | 0 (0.0%) |
| 15 to 17 Year Olds | 1 (100.0%) | 0 (0.0%) |
| 18 to 19 Year Olds | 0 (0.0%) | 0 (0.0%) |
| 20 to 24 Year Olds | 8 (100.0%) | 0 (0.0%) |
| 25 to 34 Year Olds | 0 (0.0%) | 0 (0.0%) |
| 35 Years and over | 46 (100.0%) | 0 (0.0%) |
| Total | 56 (100.0%) | 0 (0.0%) |
Educational Attainment by Field of Study in Anna Maria
Business (96 | 19.4%), social sciences (64 | 12.9%), education (63 | 12.7%), bio, nature & agricultural (53 | 10.7%), and psychology (52 | 10.5%) are the most common fields of study among 496 individuals in Anna Maria who have obtained a bachelor's degree or higher.
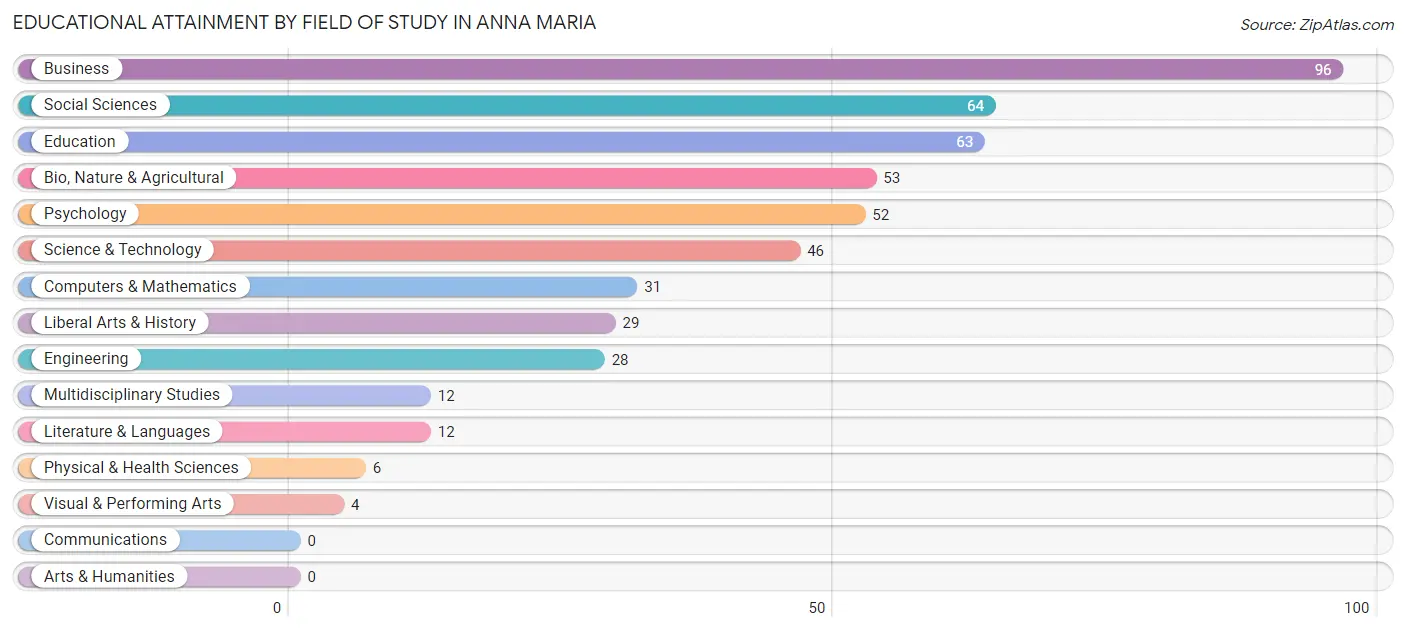
| Field of Study | # Graduates | % Graduates |
| Computers & Mathematics | 31 | 6.2% |
| Bio, Nature & Agricultural | 53 | 10.7% |
| Physical & Health Sciences | 6 | 1.2% |
| Psychology | 52 | 10.5% |
| Social Sciences | 64 | 12.9% |
| Engineering | 28 | 5.7% |
| Multidisciplinary Studies | 12 | 2.4% |
| Science & Technology | 46 | 9.3% |
| Business | 96 | 19.4% |
| Education | 63 | 12.7% |
| Literature & Languages | 12 | 2.4% |
| Liberal Arts & History | 29 | 5.9% |
| Visual & Performing Arts | 4 | 0.8% |
| Communications | 0 | 0.0% |
| Arts & Humanities | 0 | 0.0% |
| Total | 496 | 100.0% |
Transportation & Commute in Anna Maria
Vehicle Availability by Sex in Anna Maria
The most prevalent vehicle ownership categories in Anna Maria are males with 1 vehicle (36, accounting for 38.7%) and females with 1 vehicle (57, making up 34.9%).
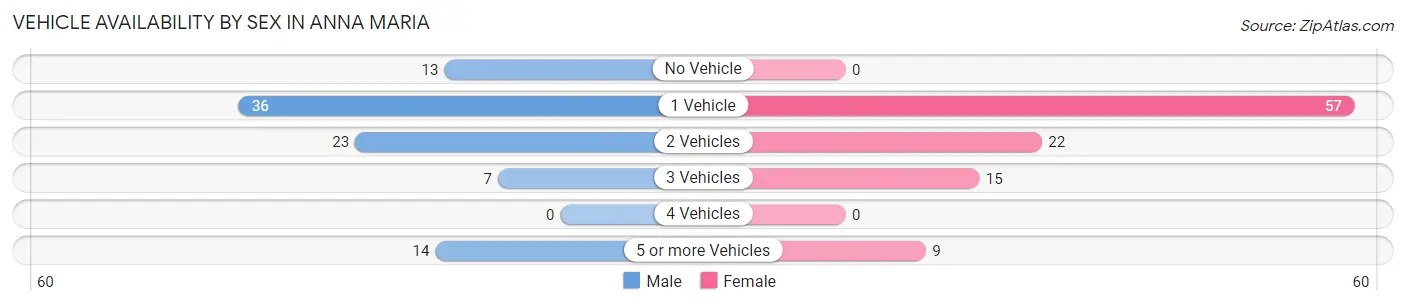
| Vehicles Available | Male | Female |
| No Vehicle | 13 (14.0%) | 0 (0.0%) |
| 1 Vehicle | 36 (38.7%) | 57 (55.3%) |
| 2 Vehicles | 23 (24.7%) | 22 (21.4%) |
| 3 Vehicles | 7 (7.5%) | 15 (14.6%) |
| 4 Vehicles | 0 (0.0%) | 0 (0.0%) |
| 5 or more Vehicles | 14 (15.0%) | 9 (8.7%) |
| Total | 93 (100.0%) | 103 (100.0%) |
Commute Time in Anna Maria
The most frequently occuring commute durations in Anna Maria are less than 5 minutes (57 commuters, 37.2%), 5 to 9 minutes (29 commuters, 19.0%), and 20 to 24 minutes (19 commuters, 12.4%).
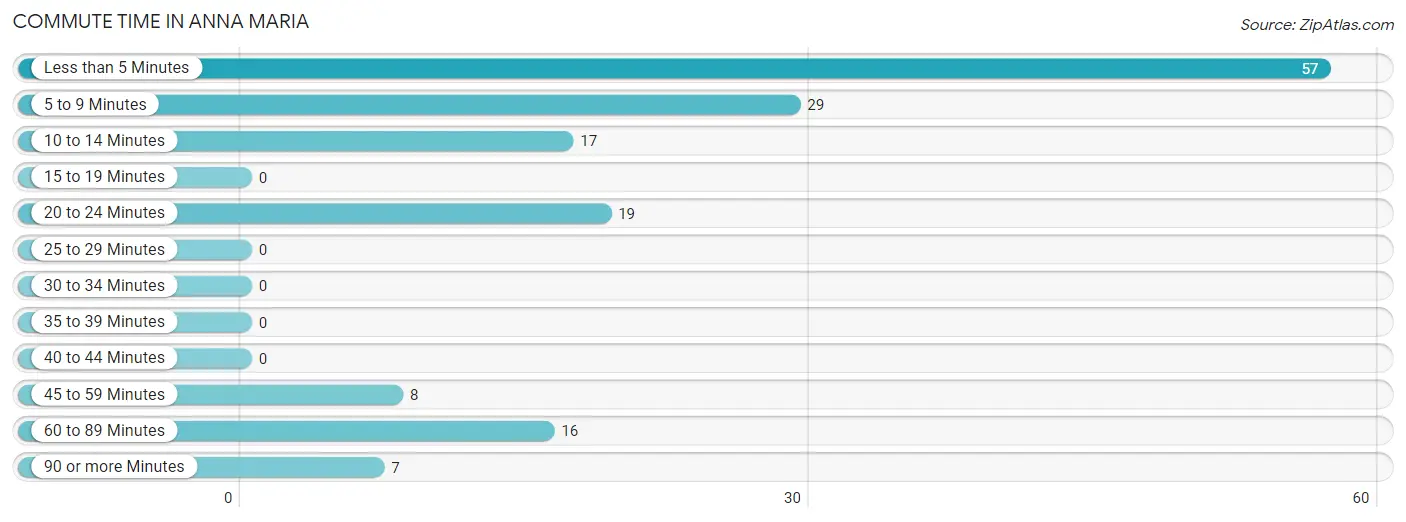
| Commute Time | # Commuters | % Commuters |
| Less than 5 Minutes | 57 | 37.2% |
| 5 to 9 Minutes | 29 | 19.0% |
| 10 to 14 Minutes | 17 | 11.1% |
| 15 to 19 Minutes | 0 | 0.0% |
| 20 to 24 Minutes | 19 | 12.4% |
| 25 to 29 Minutes | 0 | 0.0% |
| 30 to 34 Minutes | 0 | 0.0% |
| 35 to 39 Minutes | 0 | 0.0% |
| 40 to 44 Minutes | 0 | 0.0% |
| 45 to 59 Minutes | 8 | 5.2% |
| 60 to 89 Minutes | 16 | 10.5% |
| 90 or more Minutes | 7 | 4.6% |
Commute Time by Sex in Anna Maria
The most common commute times in Anna Maria are 5 to 9 minutes (20 commuters, 30.8%) for males and less than 5 minutes (57 commuters, 64.8%) for females.
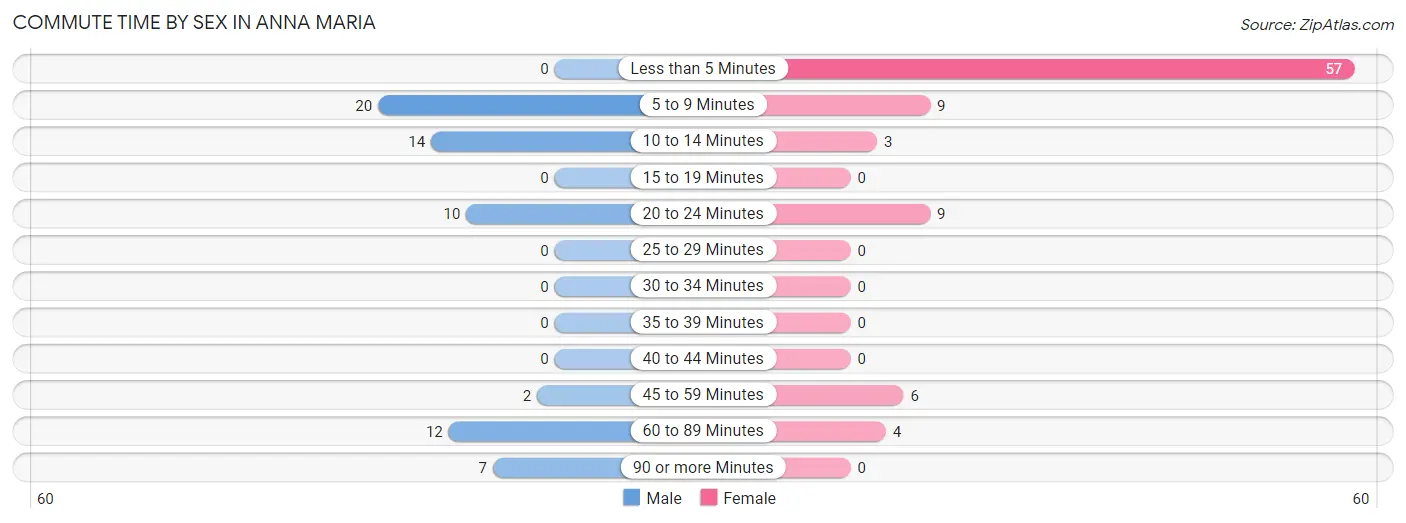
| Commute Time | Male | Female |
| Less than 5 Minutes | 0 (0.0%) | 57 (64.8%) |
| 5 to 9 Minutes | 20 (30.8%) | 9 (10.2%) |
| 10 to 14 Minutes | 14 (21.5%) | 3 (3.4%) |
| 15 to 19 Minutes | 0 (0.0%) | 0 (0.0%) |
| 20 to 24 Minutes | 10 (15.4%) | 9 (10.2%) |
| 25 to 29 Minutes | 0 (0.0%) | 0 (0.0%) |
| 30 to 34 Minutes | 0 (0.0%) | 0 (0.0%) |
| 35 to 39 Minutes | 0 (0.0%) | 0 (0.0%) |
| 40 to 44 Minutes | 0 (0.0%) | 0 (0.0%) |
| 45 to 59 Minutes | 2 (3.1%) | 6 (6.8%) |
| 60 to 89 Minutes | 12 (18.5%) | 4 (4.5%) |
| 90 or more Minutes | 7 (10.8%) | 0 (0.0%) |
Time of Departure to Work by Sex in Anna Maria
The most frequent times of departure to work in Anna Maria are 8:00 AM to 8:29 AM (16, 24.6%) for males and 12:00 AM to 4:59 AM (59, 67.0%) for females.
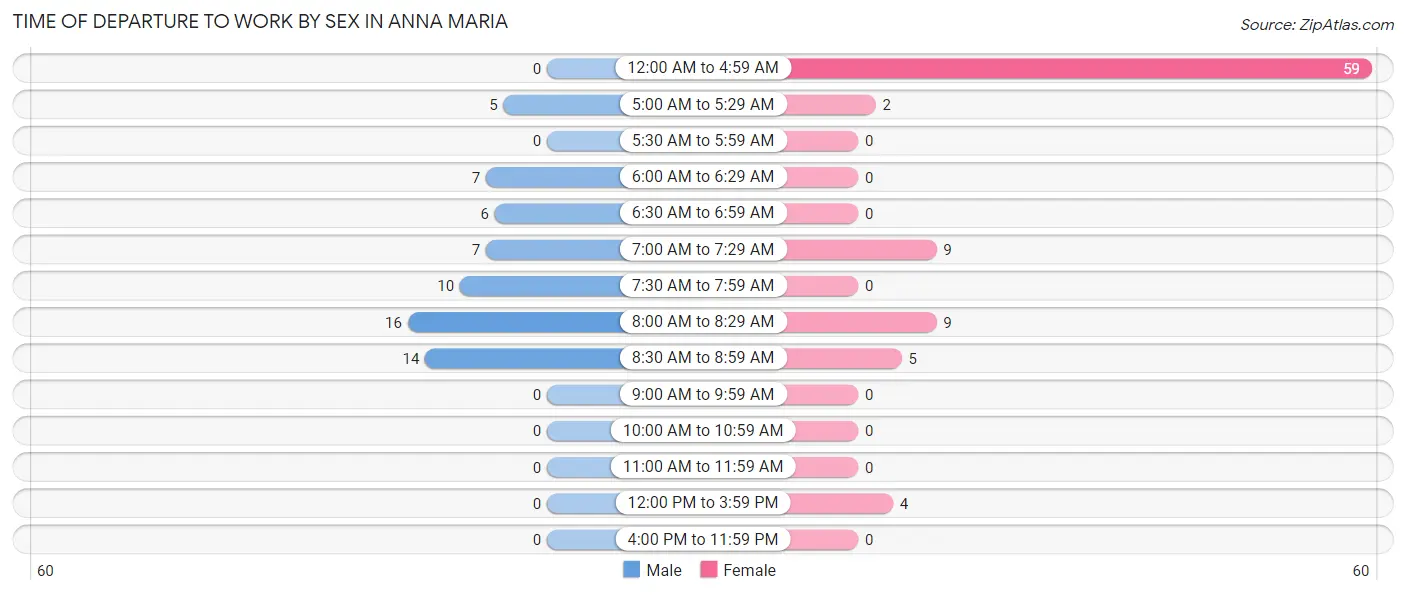
| Time of Departure | Male | Female |
| 12:00 AM to 4:59 AM | 0 (0.0%) | 59 (67.0%) |
| 5:00 AM to 5:29 AM | 5 (7.7%) | 2 (2.3%) |
| 5:30 AM to 5:59 AM | 0 (0.0%) | 0 (0.0%) |
| 6:00 AM to 6:29 AM | 7 (10.8%) | 0 (0.0%) |
| 6:30 AM to 6:59 AM | 6 (9.2%) | 0 (0.0%) |
| 7:00 AM to 7:29 AM | 7 (10.8%) | 9 (10.2%) |
| 7:30 AM to 7:59 AM | 10 (15.4%) | 0 (0.0%) |
| 8:00 AM to 8:29 AM | 16 (24.6%) | 9 (10.2%) |
| 8:30 AM to 8:59 AM | 14 (21.5%) | 5 (5.7%) |
| 9:00 AM to 9:59 AM | 0 (0.0%) | 0 (0.0%) |
| 10:00 AM to 10:59 AM | 0 (0.0%) | 0 (0.0%) |
| 11:00 AM to 11:59 AM | 0 (0.0%) | 0 (0.0%) |
| 12:00 PM to 3:59 PM | 0 (0.0%) | 4 (4.5%) |
| 4:00 PM to 11:59 PM | 0 (0.0%) | 0 (0.0%) |
| Total | 65 (100.0%) | 88 (100.0%) |
Housing Occupancy in Anna Maria
Occupancy by Ownership in Anna Maria
Of the total 486 dwellings in Anna Maria, owner-occupied units account for 464 (95.5%), while renter-occupied units make up 22 (4.5%).
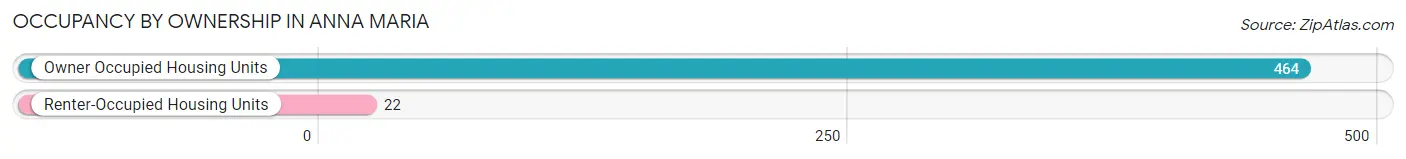
| Occupancy | # Housing Units | % Housing Units |
| Owner Occupied Housing Units | 464 | 95.5% |
| Renter-Occupied Housing Units | 22 | 4.5% |
| Total Occupied Housing Units | 486 | 100.0% |
Occupancy by Household Size in Anna Maria
| Household Size | # Housing Units | % Housing Units |
| 1-Person Household | 217 | 44.7% |
| 2-Person Household | 254 | 52.3% |
| 3-Person Household | 9 | 1.8% |
| 4+ Person Household | 6 | 1.2% |
| Total Housing Units | 486 | 100.0% |
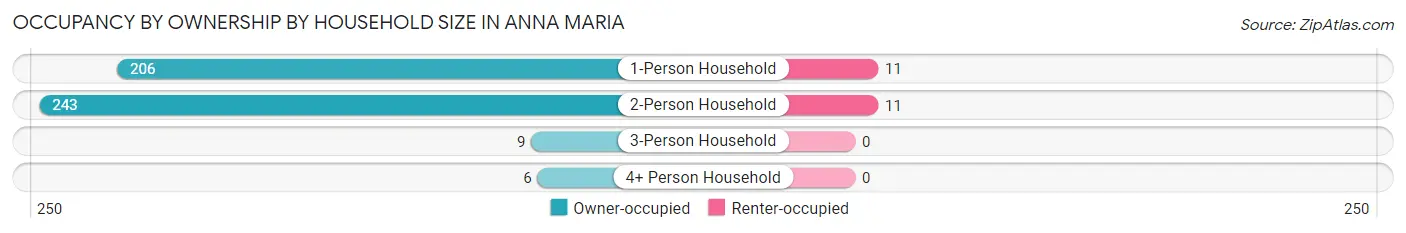
Occupancy by Ownership by Household Size in Anna Maria
| Household Size | Owner-occupied | Renter-occupied |
| 1-Person Household | 206 (94.9%) | 11 (5.1%) |
| 2-Person Household | 243 (95.7%) | 11 (4.3%) |
| 3-Person Household | 9 (100.0%) | 0 (0.0%) |
| 4+ Person Household | 6 (100.0%) | 0 (0.0%) |
| Total Housing Units | 464 (95.5%) | 22 (4.5%) |
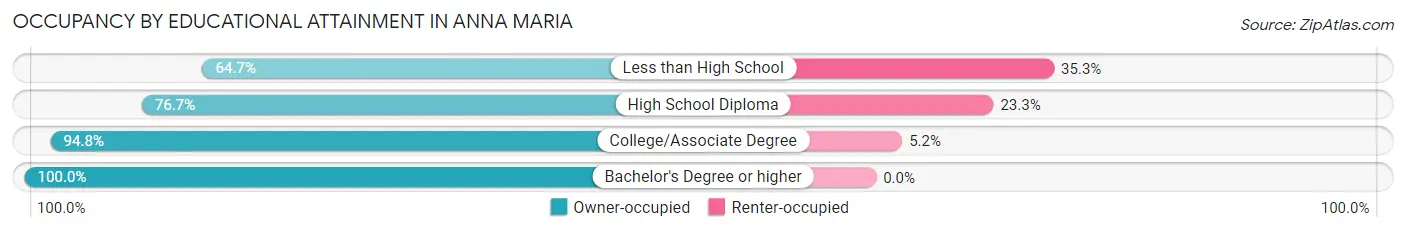
Occupancy by Educational Attainment in Anna Maria
| Household Size | Owner-occupied | Renter-occupied |
| Less than High School | 11 (64.7%) | 6 (35.3%) |
| High School Diploma | 33 (76.7%) | 10 (23.3%) |
| College/Associate Degree | 110 (94.8%) | 6 (5.2%) |
| Bachelor's Degree or higher | 310 (100.0%) | 0 (0.0%) |
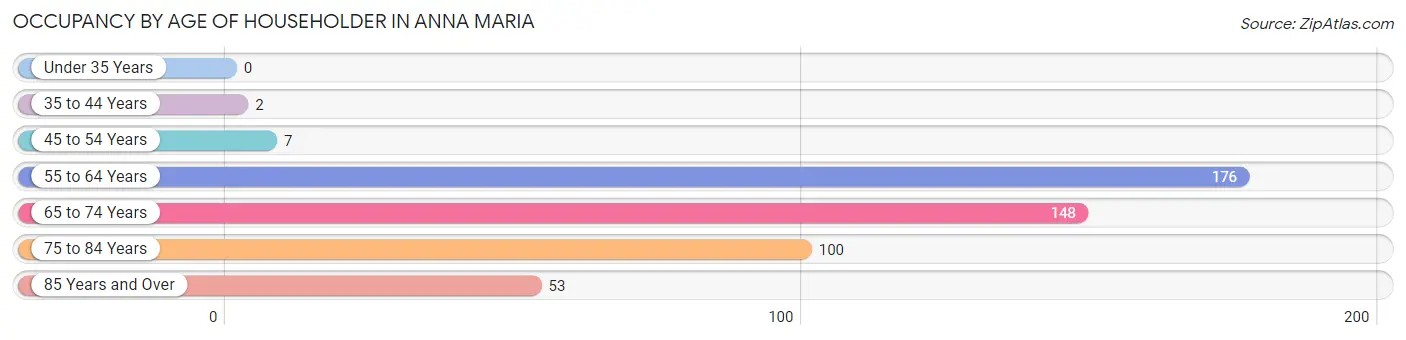
Occupancy by Age of Householder in Anna Maria
| Age Bracket | # Households | % Households |
| Under 35 Years | 0 | 0.0% |
| 35 to 44 Years | 2 | 0.4% |
| 45 to 54 Years | 7 | 1.4% |
| 55 to 64 Years | 176 | 36.2% |
| 65 to 74 Years | 148 | 30.4% |
| 75 to 84 Years | 100 | 20.6% |
| 85 Years and Over | 53 | 10.9% |
| Total | 486 | 100.0% |
Housing Finances in Anna Maria
Median Income by Occupancy in Anna Maria
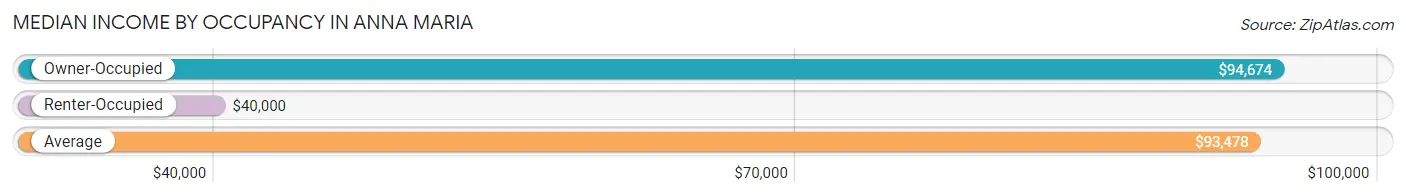
| Occupancy Type | # Households | Median Income |
| Owner-Occupied | 464 (95.5%) | $94,674 |
| Renter-Occupied | 22 (4.5%) | $40,000 |
| Average | 486 (100.0%) | $93,478 |
Occupancy by Householder Income Bracket in Anna Maria
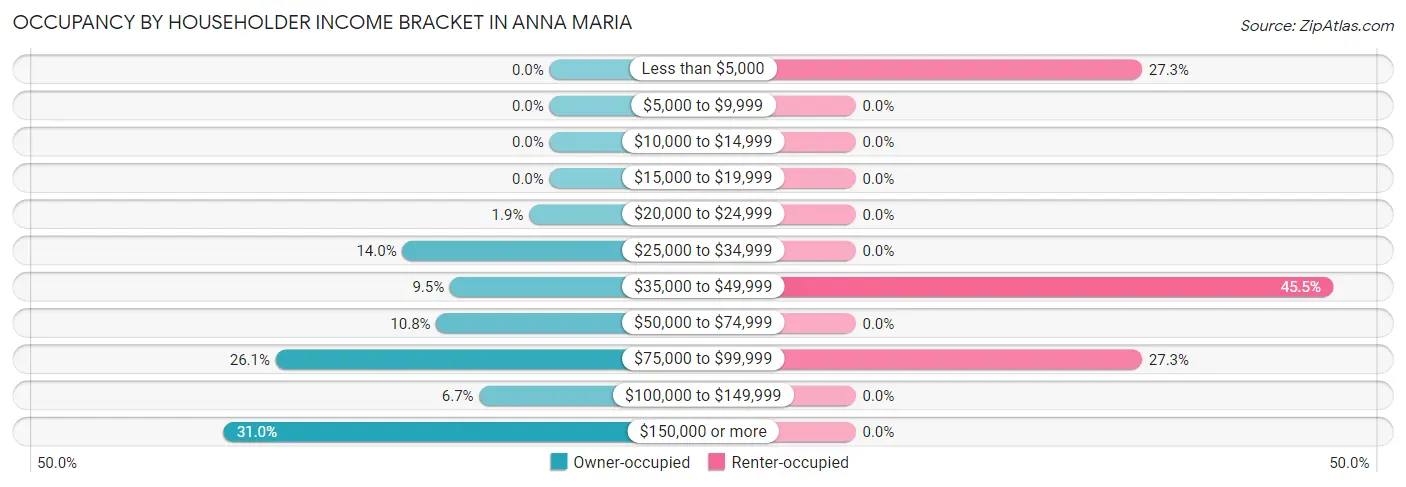
| Income Bracket | Owner-occupied | Renter-occupied |
| Less than $5,000 | 0 (0.0%) | 6 (27.3%) |
| $5,000 to $9,999 | 0 (0.0%) | 0 (0.0%) |
| $10,000 to $14,999 | 0 (0.0%) | 0 (0.0%) |
| $15,000 to $19,999 | 0 (0.0%) | 0 (0.0%) |
| $20,000 to $24,999 | 9 (1.9%) | 0 (0.0%) |
| $25,000 to $34,999 | 65 (14.0%) | 0 (0.0%) |
| $35,000 to $49,999 | 44 (9.5%) | 10 (45.5%) |
| $50,000 to $74,999 | 50 (10.8%) | 0 (0.0%) |
| $75,000 to $99,999 | 121 (26.1%) | 6 (27.3%) |
| $100,000 to $149,999 | 31 (6.7%) | 0 (0.0%) |
| $150,000 or more | 144 (31.0%) | 0 (0.0%) |
| Total | 464 (100.0%) | 22 (100.0%) |
Monthly Housing Cost Tiers in Anna Maria
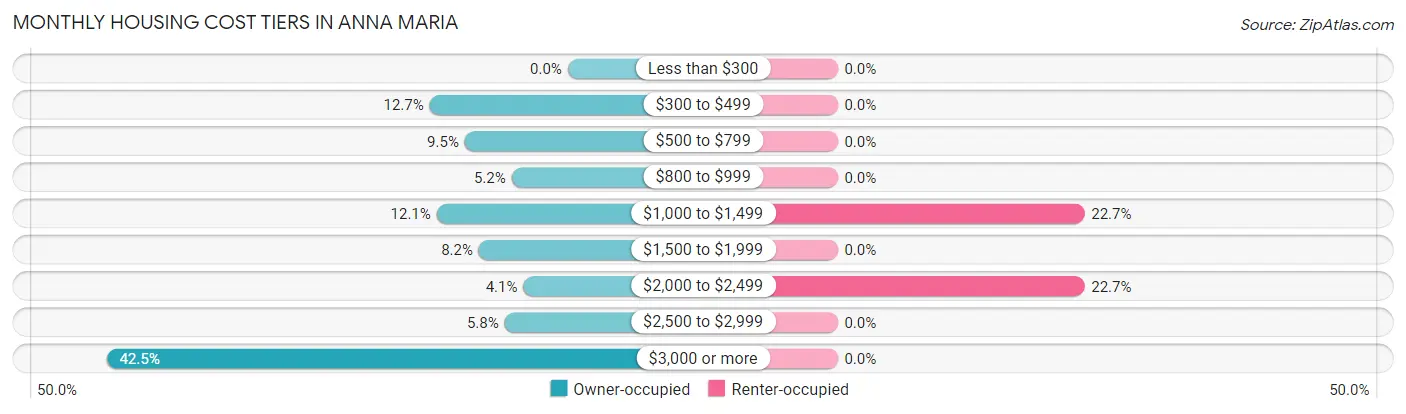
| Monthly Cost | Owner-occupied | Renter-occupied |
| Less than $300 | 0 (0.0%) | 0 (0.0%) |
| $300 to $499 | 59 (12.7%) | 0 (0.0%) |
| $500 to $799 | 44 (9.5%) | 0 (0.0%) |
| $800 to $999 | 24 (5.2%) | 0 (0.0%) |
| $1,000 to $1,499 | 56 (12.1%) | 5 (22.7%) |
| $1,500 to $1,999 | 38 (8.2%) | 0 (0.0%) |
| $2,000 to $2,499 | 19 (4.1%) | 5 (22.7%) |
| $2,500 to $2,999 | 27 (5.8%) | 0 (0.0%) |
| $3,000 or more | 197 (42.5%) | 0 (0.0%) |
| Total | 464 (100.0%) | 22 (100.0%) |
Physical Housing Characteristics in Anna Maria
Housing Structures in Anna Maria
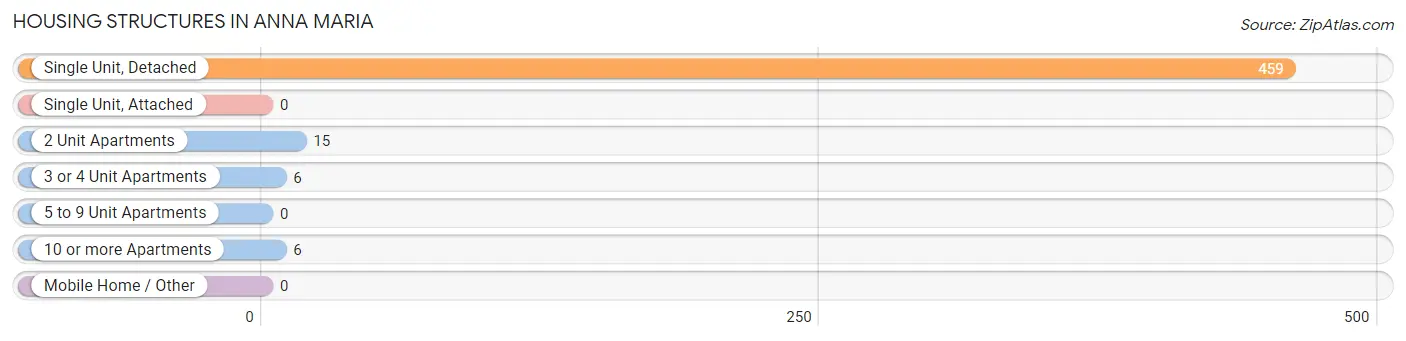
| Structure Type | # Housing Units | % Housing Units |
| Single Unit, Detached | 459 | 94.4% |
| Single Unit, Attached | 0 | 0.0% |
| 2 Unit Apartments | 15 | 3.1% |
| 3 or 4 Unit Apartments | 6 | 1.2% |
| 5 to 9 Unit Apartments | 0 | 0.0% |
| 10 or more Apartments | 6 | 1.2% |
| Mobile Home / Other | 0 | 0.0% |
| Total | 486 | 100.0% |
Housing Structures by Occupancy in Anna Maria
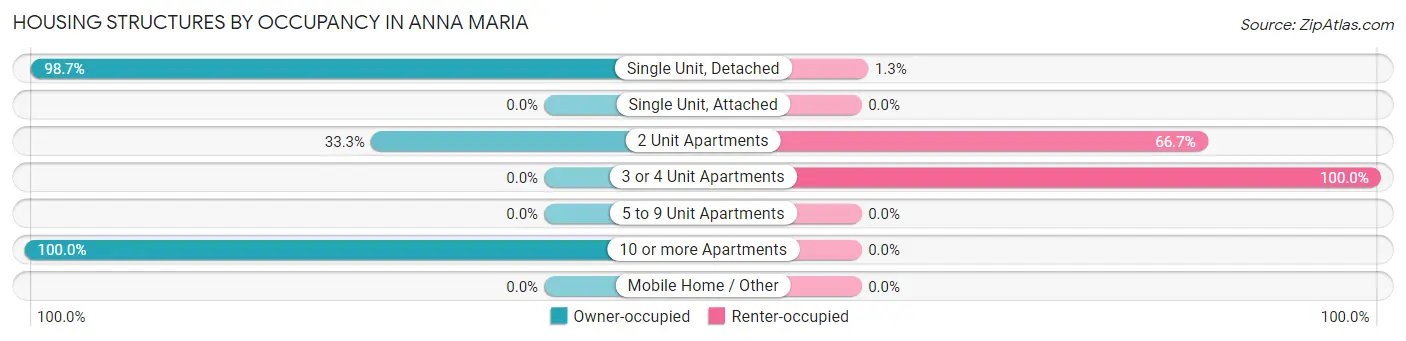
| Structure Type | Owner-occupied | Renter-occupied |
| Single Unit, Detached | 453 (98.7%) | 6 (1.3%) |
| Single Unit, Attached | 0 (0.0%) | 0 (0.0%) |
| 2 Unit Apartments | 5 (33.3%) | 10 (66.7%) |
| 3 or 4 Unit Apartments | 0 (0.0%) | 6 (100.0%) |
| 5 to 9 Unit Apartments | 0 (0.0%) | 0 (0.0%) |
| 10 or more Apartments | 6 (100.0%) | 0 (0.0%) |
| Mobile Home / Other | 0 (0.0%) | 0 (0.0%) |
| Total | 464 (95.5%) | 22 (4.5%) |
Housing Structures by Number of Rooms in Anna Maria
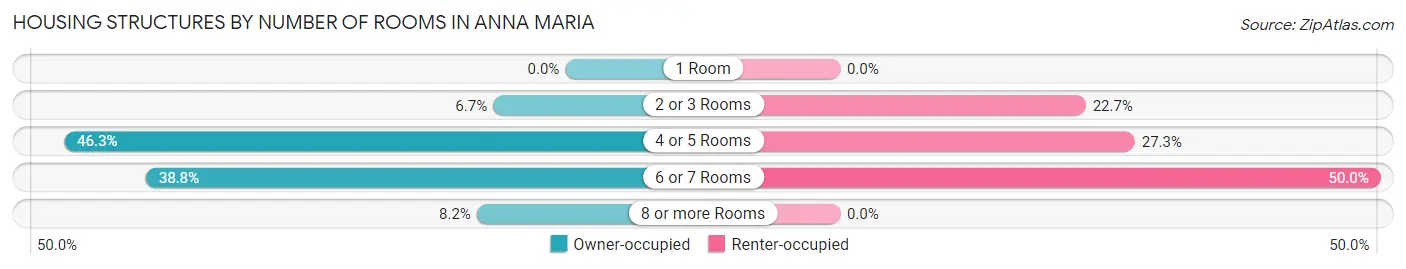
| Number of Rooms | Owner-occupied | Renter-occupied |
| 1 Room | 0 (0.0%) | 0 (0.0%) |
| 2 or 3 Rooms | 31 (6.7%) | 5 (22.7%) |
| 4 or 5 Rooms | 215 (46.3%) | 6 (27.3%) |
| 6 or 7 Rooms | 180 (38.8%) | 11 (50.0%) |
| 8 or more Rooms | 38 (8.2%) | 0 (0.0%) |
| Total | 464 (100.0%) | 22 (100.0%) |
Housing Structure by Heating Type in Anna Maria
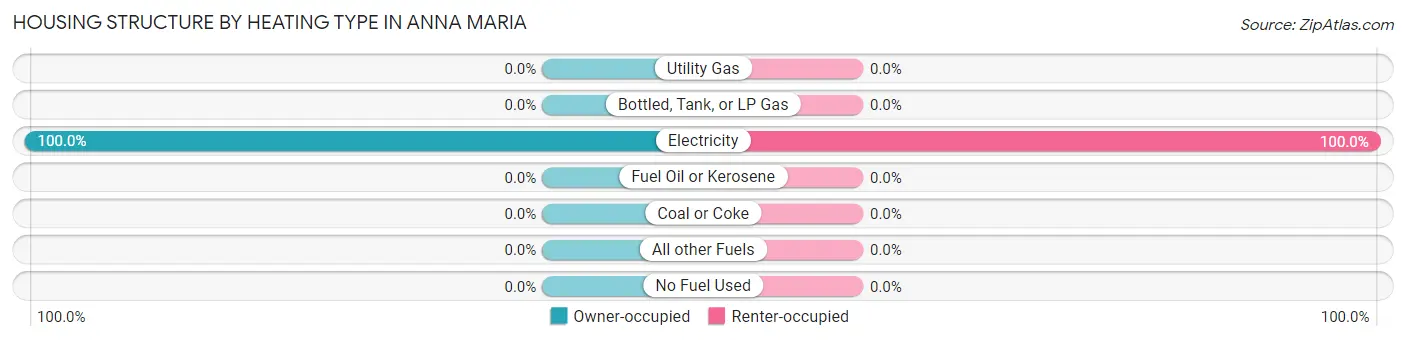
| Heating Type | Owner-occupied | Renter-occupied |
| Utility Gas | 0 (0.0%) | 0 (0.0%) |
| Bottled, Tank, or LP Gas | 0 (0.0%) | 0 (0.0%) |
| Electricity | 464 (100.0%) | 22 (100.0%) |
| Fuel Oil or Kerosene | 0 (0.0%) | 0 (0.0%) |
| Coal or Coke | 0 (0.0%) | 0 (0.0%) |
| All other Fuels | 0 (0.0%) | 0 (0.0%) |
| No Fuel Used | 0 (0.0%) | 0 (0.0%) |
| Total | 464 (100.0%) | 22 (100.0%) |
Household Vehicle Usage in Anna Maria
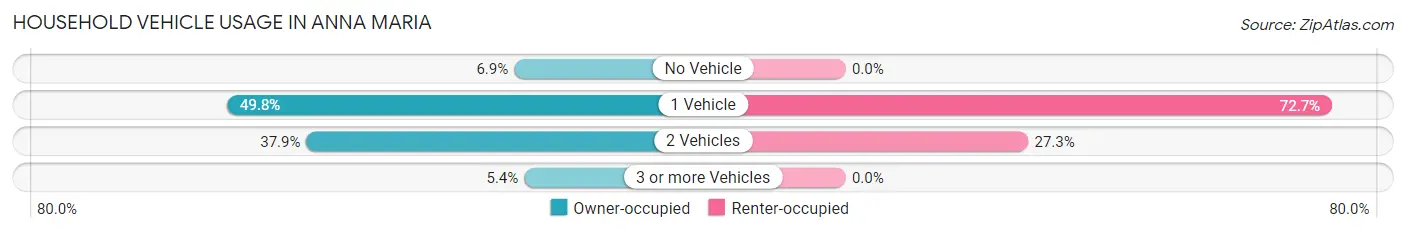
| Vehicles per Household | Owner-occupied | Renter-occupied |
| No Vehicle | 32 (6.9%) | 0 (0.0%) |
| 1 Vehicle | 231 (49.8%) | 16 (72.7%) |
| 2 Vehicles | 176 (37.9%) | 6 (27.3%) |
| 3 or more Vehicles | 25 (5.4%) | 0 (0.0%) |
| Total | 464 (100.0%) | 22 (100.0%) |
Real Estate & Mortgages in Anna Maria
Real Estate and Mortgage Overview in Anna Maria
| Characteristic | Without Mortgage | With Mortgage |
| Housing Units | 285 | 179 |
| Median Property Value | $1,043,800 | $989,500 |
| Median Household Income | $95,299 | $58 |
| Monthly Housing Costs | $1,086 | $149 |
| Real Estate Taxes | $7,426 | $0 |
Property Value by Mortgage Status in Anna Maria
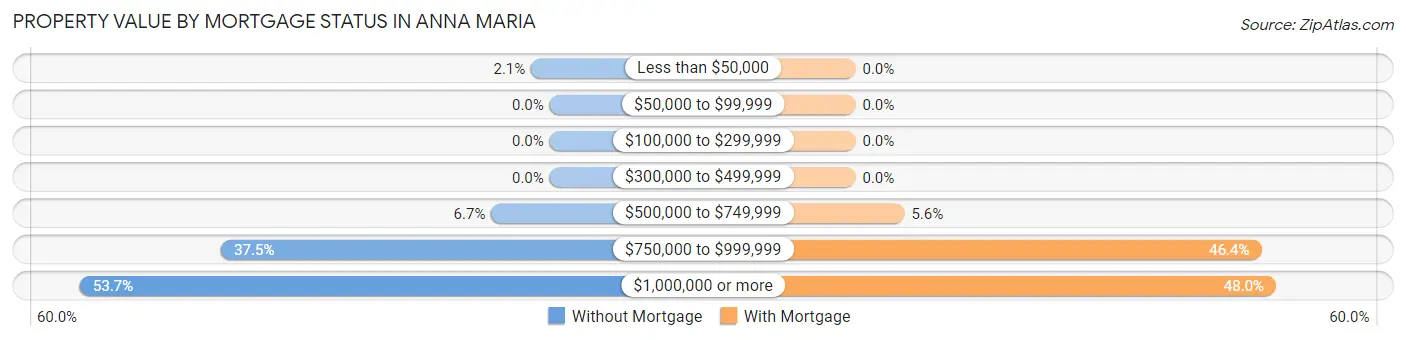
| Property Value | Without Mortgage | With Mortgage |
| Less than $50,000 | 6 (2.1%) | 0 (0.0%) |
| $50,000 to $99,999 | 0 (0.0%) | 0 (0.0%) |
| $100,000 to $299,999 | 0 (0.0%) | 0 (0.0%) |
| $300,000 to $499,999 | 0 (0.0%) | 0 (0.0%) |
| $500,000 to $749,999 | 19 (6.7%) | 10 (5.6%) |
| $750,000 to $999,999 | 107 (37.5%) | 83 (46.4%) |
| $1,000,000 or more | 153 (53.7%) | 86 (48.0%) |
| Total | 285 (100.0%) | 179 (100.0%) |
Household Income by Mortgage Status in Anna Maria
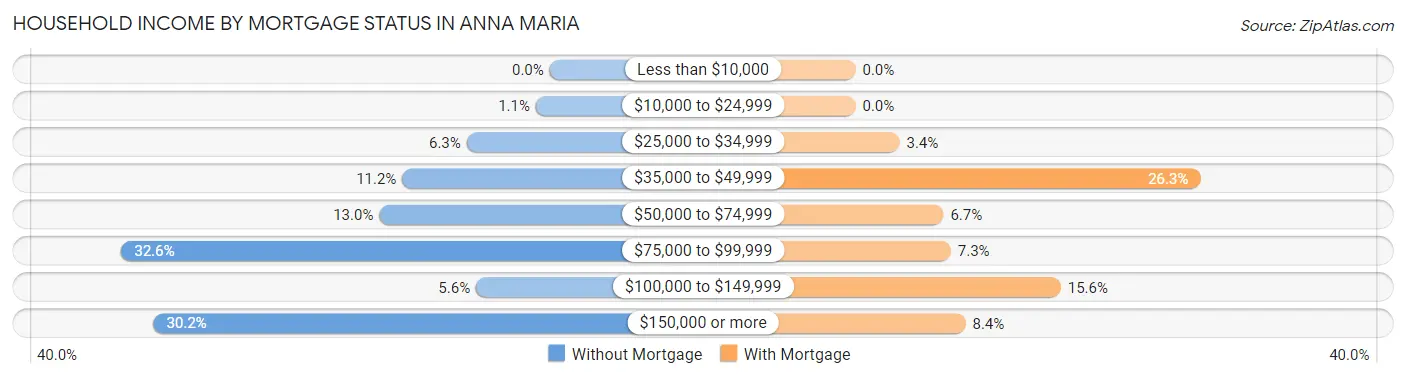
| Household Income | Without Mortgage | With Mortgage |
| Less than $10,000 | 0 (0.0%) | 0 (0.0%) |
| $10,000 to $24,999 | 3 (1.1%) | 0 (0.0%) |
| $25,000 to $34,999 | 18 (6.3%) | 6 (3.4%) |
| $35,000 to $49,999 | 32 (11.2%) | 47 (26.3%) |
| $50,000 to $74,999 | 37 (13.0%) | 12 (6.7%) |
| $75,000 to $99,999 | 93 (32.6%) | 13 (7.3%) |
| $100,000 to $149,999 | 16 (5.6%) | 28 (15.6%) |
| $150,000 or more | 86 (30.2%) | 15 (8.4%) |
| Total | 285 (100.0%) | 179 (100.0%) |
Property Value to Household Income Ratio in Anna Maria
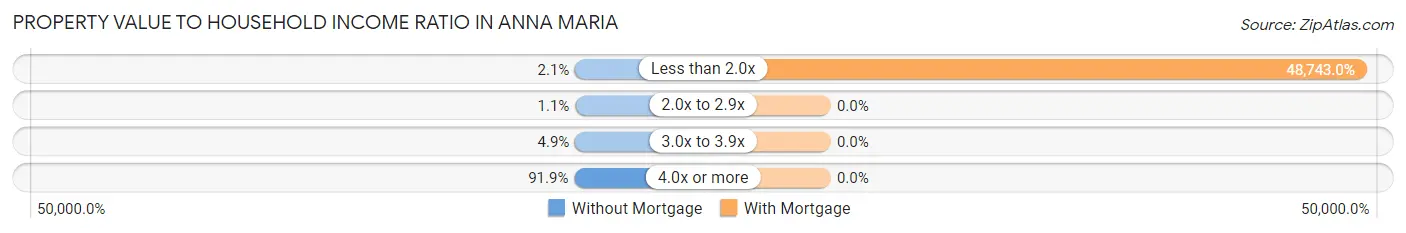
| Value-to-Income Ratio | Without Mortgage | With Mortgage |
| Less than 2.0x | 6 (2.1%) | 87,250 (48,743.0%) |
| 2.0x to 2.9x | 3 (1.1%) | 0 (0.0%) |
| 3.0x to 3.9x | 14 (4.9%) | 0 (0.0%) |
| 4.0x or more | 262 (91.9%) | 0 (0.0%) |
| Total | 285 (100.0%) | 179 (100.0%) |
Real Estate Taxes by Mortgage Status in Anna Maria
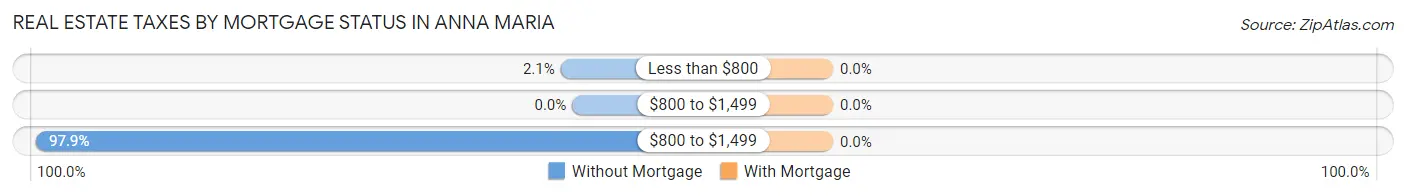
| Property Taxes | Without Mortgage | With Mortgage |
| Less than $800 | 6 (2.1%) | 0 (0.0%) |
| $800 to $1,499 | 0 (0.0%) | 0 (0.0%) |
| $800 to $1,499 | 279 (97.9%) | 0 (0.0%) |
| Total | 285 (100.0%) | 179 (100.0%) |
Health & Disability in Anna Maria
Health Insurance Coverage by Age in Anna Maria
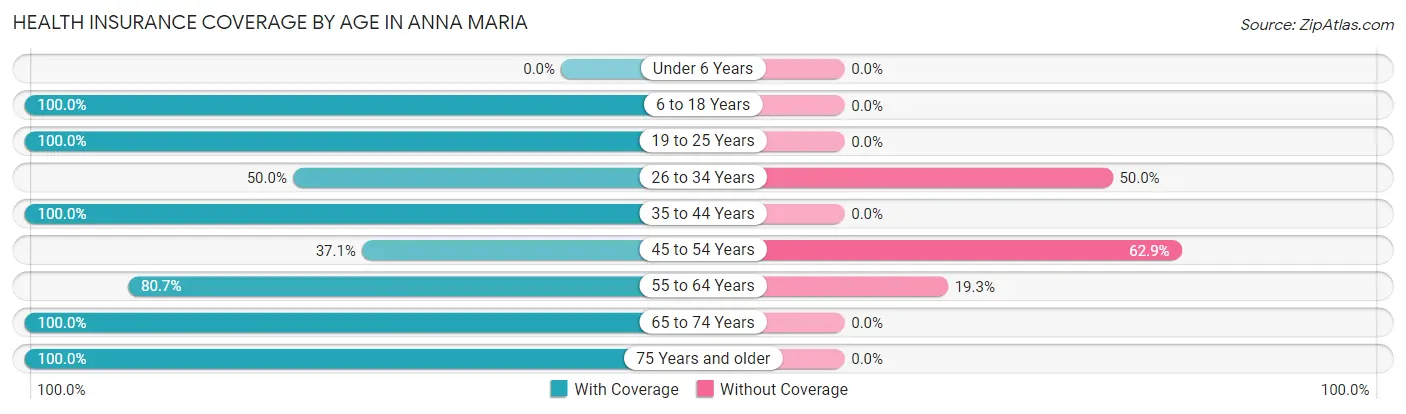
| Age Bracket | With Coverage | Without Coverage |
| Under 6 Years | 0 (0.0%) | 0 (0.0%) |
| 6 to 18 Years | 2 (100.0%) | 0 (0.0%) |
| 19 to 25 Years | 8 (100.0%) | 0 (0.0%) |
| 26 to 34 Years | 9 (50.0%) | 9 (50.0%) |
| 35 to 44 Years | 4 (100.0%) | 0 (0.0%) |
| 45 to 54 Years | 13 (37.1%) | 22 (62.9%) |
| 55 to 64 Years | 251 (80.7%) | 60 (19.3%) |
| 65 to 74 Years | 216 (100.0%) | 0 (0.0%) |
| 75 Years and older | 231 (100.0%) | 0 (0.0%) |
| Total | 734 (89.0%) | 91 (11.0%) |
Health Insurance Coverage by Citizenship Status in Anna Maria
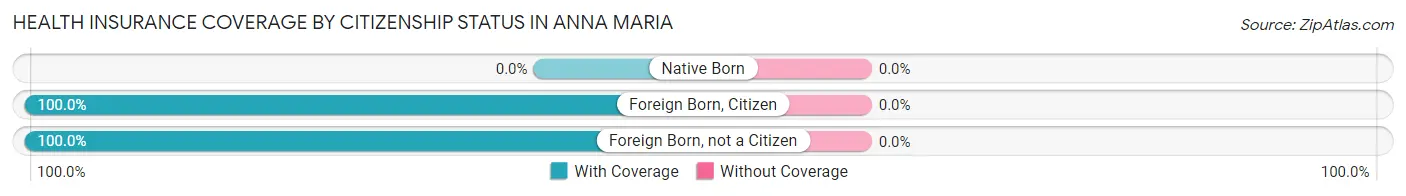
| Citizenship Status | With Coverage | Without Coverage |
| Native Born | 0 (0.0%) | 0 (0.0%) |
| Foreign Born, Citizen | 2 (100.0%) | 0 (0.0%) |
| Foreign Born, not a Citizen | 8 (100.0%) | 0 (0.0%) |
Health Insurance Coverage by Household Income in Anna Maria
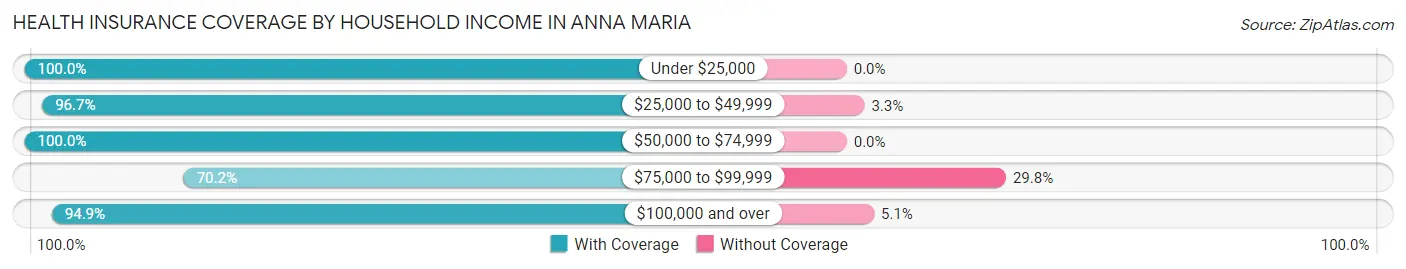
| Household Income | With Coverage | Without Coverage |
| Under $25,000 | 15 (100.0%) | 0 (0.0%) |
| $25,000 to $49,999 | 146 (96.7%) | 5 (3.3%) |
| $50,000 to $74,999 | 79 (100.0%) | 0 (0.0%) |
| $75,000 to $99,999 | 160 (70.2%) | 68 (29.8%) |
| $100,000 and over | 334 (94.9%) | 18 (5.1%) |
Public vs Private Health Insurance Coverage by Age in Anna Maria
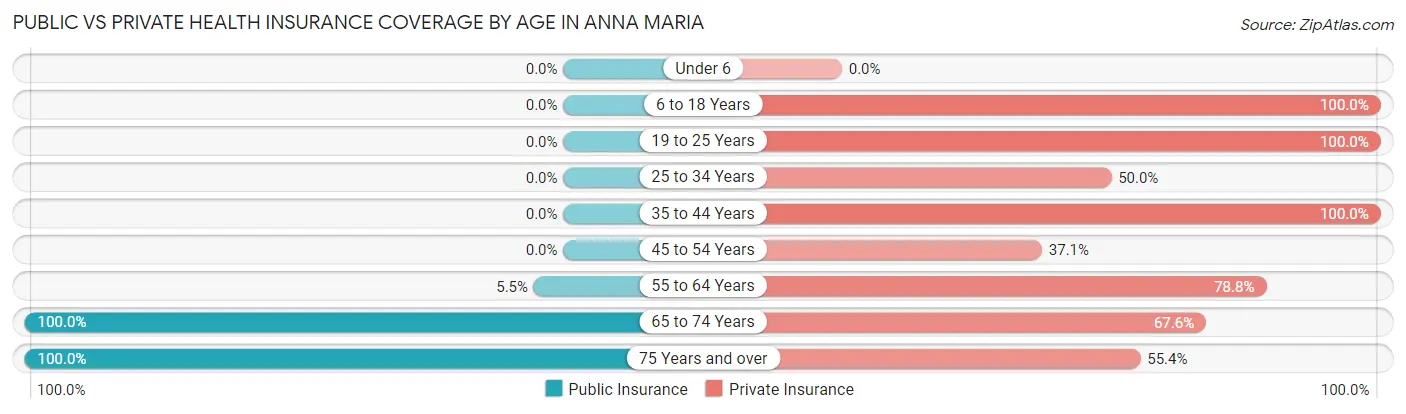
| Age Bracket | Public Insurance | Private Insurance |
| Under 6 | 0 (0.0%) | 0 (0.0%) |
| 6 to 18 Years | 0 (0.0%) | 2 (100.0%) |
| 19 to 25 Years | 0 (0.0%) | 8 (100.0%) |
| 25 to 34 Years | 0 (0.0%) | 9 (50.0%) |
| 35 to 44 Years | 0 (0.0%) | 4 (100.0%) |
| 45 to 54 Years | 0 (0.0%) | 13 (37.1%) |
| 55 to 64 Years | 17 (5.5%) | 245 (78.8%) |
| 65 to 74 Years | 216 (100.0%) | 146 (67.6%) |
| 75 Years and over | 231 (100.0%) | 128 (55.4%) |
| Total | 464 (56.2%) | 555 (67.3%) |
Disability Status by Sex by Age in Anna Maria
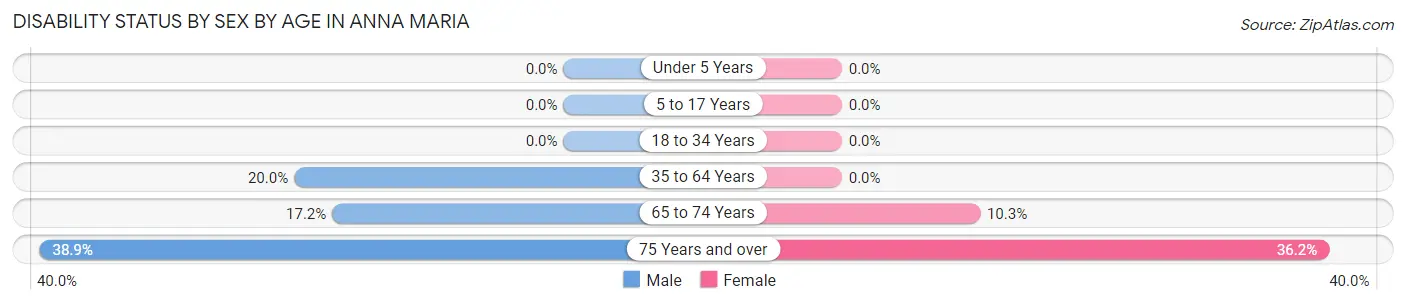
| Age Bracket | Male | Female |
| Under 5 Years | 0 (0.0%) | 0 (0.0%) |
| 5 to 17 Years | 0 (0.0%) | 0 (0.0%) |
| 18 to 34 Years | 0 (0.0%) | 0 (0.0%) |
| 35 to 64 Years | 33 (20.0%) | 0 (0.0%) |
| 65 to 74 Years | 17 (17.2%) | 12 (10.3%) |
| 75 Years and over | 35 (38.9%) | 51 (36.2%) |
Disability Class by Sex by Age in Anna Maria
Disability Class: Hearing Difficulty
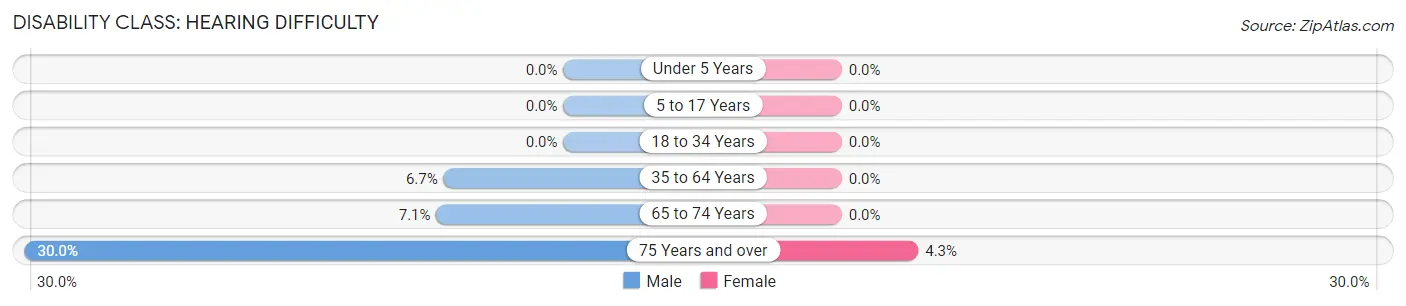
| Age Bracket | Male | Female |
| Under 5 Years | 0 (0.0%) | 0 (0.0%) |
| 5 to 17 Years | 0 (0.0%) | 0 (0.0%) |
| 18 to 34 Years | 0 (0.0%) | 0 (0.0%) |
| 35 to 64 Years | 11 (6.7%) | 0 (0.0%) |
| 65 to 74 Years | 7 (7.1%) | 0 (0.0%) |
| 75 Years and over | 27 (30.0%) | 6 (4.3%) |
Disability Class: Vision Difficulty
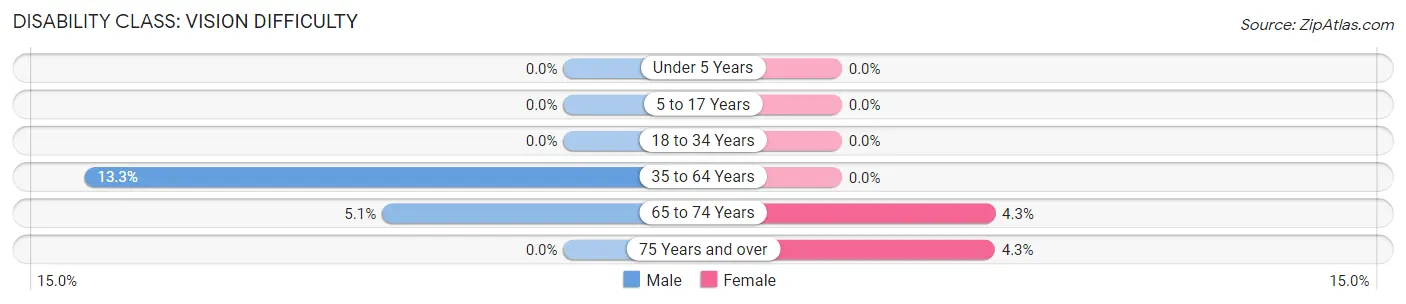
| Age Bracket | Male | Female |
| Under 5 Years | 0 (0.0%) | 0 (0.0%) |
| 5 to 17 Years | 0 (0.0%) | 0 (0.0%) |
| 18 to 34 Years | 0 (0.0%) | 0 (0.0%) |
| 35 to 64 Years | 22 (13.3%) | 0 (0.0%) |
| 65 to 74 Years | 5 (5.1%) | 5 (4.3%) |
| 75 Years and over | 0 (0.0%) | 6 (4.3%) |
Disability Class: Cognitive Difficulty
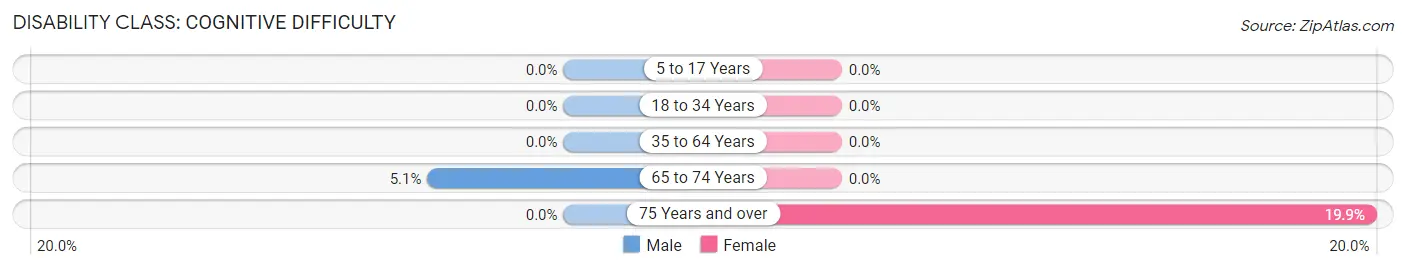
| Age Bracket | Male | Female |
| 5 to 17 Years | 0 (0.0%) | 0 (0.0%) |
| 18 to 34 Years | 0 (0.0%) | 0 (0.0%) |
| 35 to 64 Years | 0 (0.0%) | 0 (0.0%) |
| 65 to 74 Years | 5 (5.1%) | 0 (0.0%) |
| 75 Years and over | 0 (0.0%) | 28 (19.9%) |
Disability Class: Ambulatory Difficulty
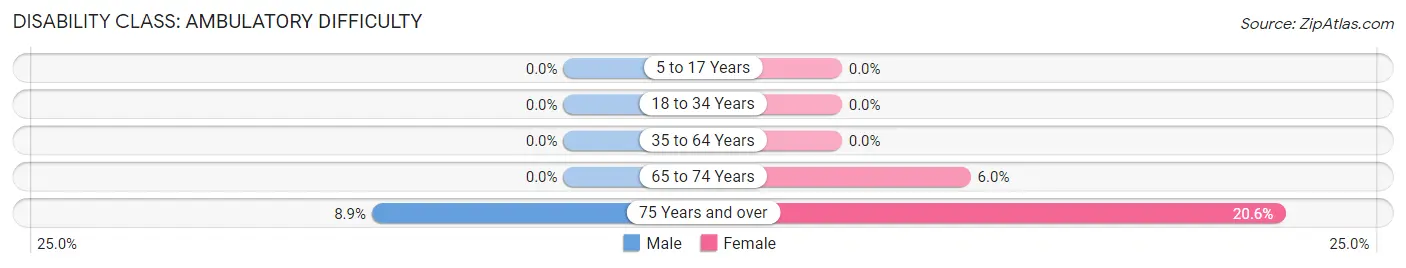
| Age Bracket | Male | Female |
| 5 to 17 Years | 0 (0.0%) | 0 (0.0%) |
| 18 to 34 Years | 0 (0.0%) | 0 (0.0%) |
| 35 to 64 Years | 0 (0.0%) | 0 (0.0%) |
| 65 to 74 Years | 0 (0.0%) | 7 (6.0%) |
| 75 Years and over | 8 (8.9%) | 29 (20.6%) |
Disability Class: Self-Care Difficulty
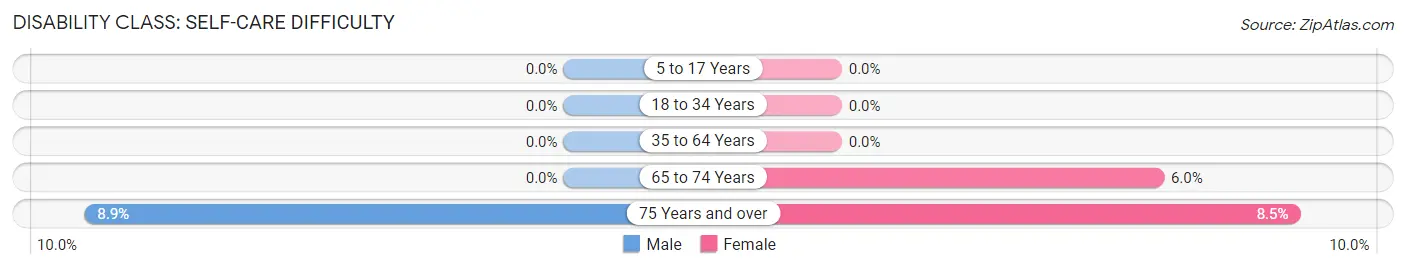
| Age Bracket | Male | Female |
| 5 to 17 Years | 0 (0.0%) | 0 (0.0%) |
| 18 to 34 Years | 0 (0.0%) | 0 (0.0%) |
| 35 to 64 Years | 0 (0.0%) | 0 (0.0%) |
| 65 to 74 Years | 0 (0.0%) | 7 (6.0%) |
| 75 Years and over | 8 (8.9%) | 12 (8.5%) |
Technology Access in Anna Maria
Computing Device Access in Anna Maria
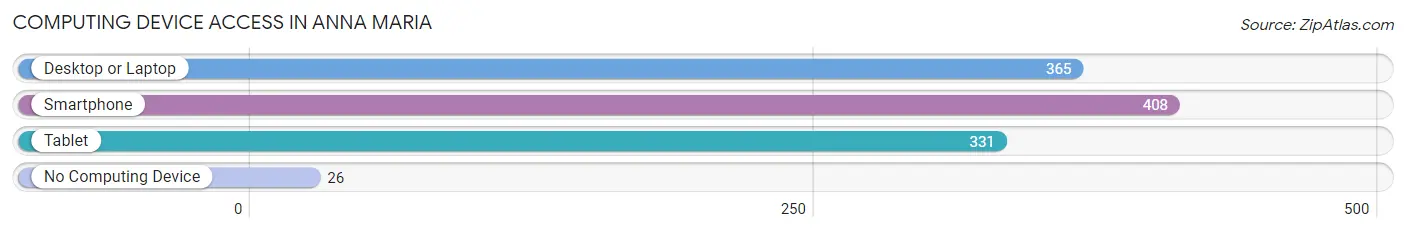
| Device Type | # Households | % Households |
| Desktop or Laptop | 365 | 75.1% |
| Smartphone | 408 | 84.0% |
| Tablet | 331 | 68.1% |
| No Computing Device | 26 | 5.3% |
| Total | 486 | 100.0% |
Internet Access in Anna Maria
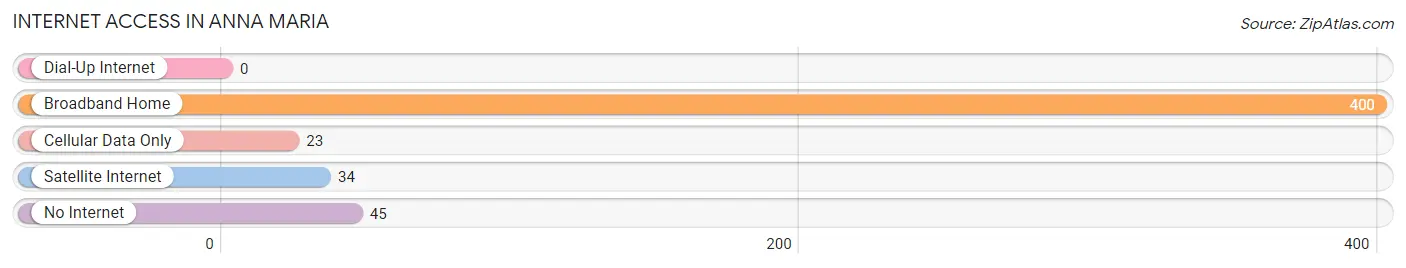
| Internet Type | # Households | % Households |
| Dial-Up Internet | 0 | 0.0% |
| Broadband Home | 400 | 82.3% |
| Cellular Data Only | 23 | 4.7% |
| Satellite Internet | 34 | 7.0% |
| No Internet | 45 | 9.3% |
| Total | 486 | 100.0% |
Anna Maria Summary
Anna Maria is a city located on the northern tip of Anna Maria Island in Manatee County, Florida. It is part of the Bradenton-Sarasota-Venice Metropolitan Statistical Area. The city is known for its white sand beaches, fishing, and laid-back atmosphere.
History
Anna Maria was first settled in the late 1800s by a group of settlers from the Bahamas. The city was named after the daughter of one of the settlers, Anna Maria Wood. The city was incorporated in 1921 and has since become a popular tourist destination.
Geography
Anna Maria is located on the northern tip of Anna Maria Island, which is located in the Gulf of Mexico off the coast of Florida. The city is bordered by the cities of Bradenton Beach and Holmes Beach. The city has a total area of 1.2 square miles, all of which is land.
Climate
Anna Maria has a humid subtropical climate, with hot, humid summers and mild winters. The average temperature in the summer is around 90°F, while in the winter it is around 70°F. The city receives an average of 54 inches of rain per year.
Economy
The economy of Anna Maria is largely based on tourism. The city is home to several resorts, hotels, and restaurants, as well as a variety of shops and boutiques. Fishing is also a major industry in the city, with many charter boats offering deep sea fishing trips.
Demographics
As of the 2010 census, Anna Maria had a population of 1,814. The racial makeup of the city was 94.3% White, 1.2% African American, 0.3% Native American, 0.9% Asian, 0.1% Pacific Islander, 1.7% from other races, and 1.6% from two or more races. Hispanic or Latino of any race were 5.2% of the population.
The median income for a household in the city was $50,977, and the median income for a family was $60,938. The per capita income for the city was $30,945. About 8.2% of families and 11.2% of the population were below the poverty line, including 16.2% of those under age 18 and 4.2% of those age 65 or over.
Anna Maria is a popular tourist destination, and the city has a vibrant economy and a diverse population. The city is known for its white sand beaches, fishing, and laid-back atmosphere, and it is a great place to visit or live.
Common Questions
What is Per Capita Income in Anna Maria?
Per Capita income in Anna Maria is $81,576.
What is the Median Family Income in Anna Maria?
Median Family Income in Anna Maria is $106,406.
What is the Median Household income in Anna Maria?
Median Household Income in Anna Maria is $93,478.
What is Inequality or Gini Index in Anna Maria?
Inequality or Gini Index in Anna Maria is 0.47.
What is the Total Population of Anna Maria?
Total Population of Anna Maria is 825.
What is the Total Male Population of Anna Maria?
Total Male Population of Anna Maria is 372.
What is the Total Female Population of Anna Maria?
Total Female Population of Anna Maria is 453.
What is the Ratio of Males per 100 Females in Anna Maria?
There are 82.12 Males per 100 Females in Anna Maria.
What is the Ratio of Females per 100 Males in Anna Maria?
There are 121.77 Females per 100 Males in Anna Maria.
What is the Median Population Age in Anna Maria?
Median Population Age in Anna Maria is 67.3 Years.
What is the Average Family Size in Anna Maria
Average Family Size in Anna Maria is 2.3 People.
What is the Average Household Size in Anna Maria
Average Household Size in Anna Maria is 1.7 People.
How Large is the Labor Force in Anna Maria?
There are 196 People in the Labor Forcein in Anna Maria.
What is the Percentage of People in the Labor Force in Anna Maria?
23.8% of People are in the Labor Force in Anna Maria.