Subsaharan African vs Immigrants from Eritrea Births to Unmarried Women
COMPARE
Subsaharan African
Immigrants from Eritrea
Births to Unmarried Women
Births to Unmarried Women Comparison
Sub-Saharan Africans
Immigrants from Eritrea
36.7%
BIRTHS TO UNMARRIED WOMEN
0.1/ 100
METRIC RATING
264th/ 347
METRIC RANK
31.7%
BIRTHS TO UNMARRIED WOMEN
50.4/ 100
METRIC RATING
172nd/ 347
METRIC RANK
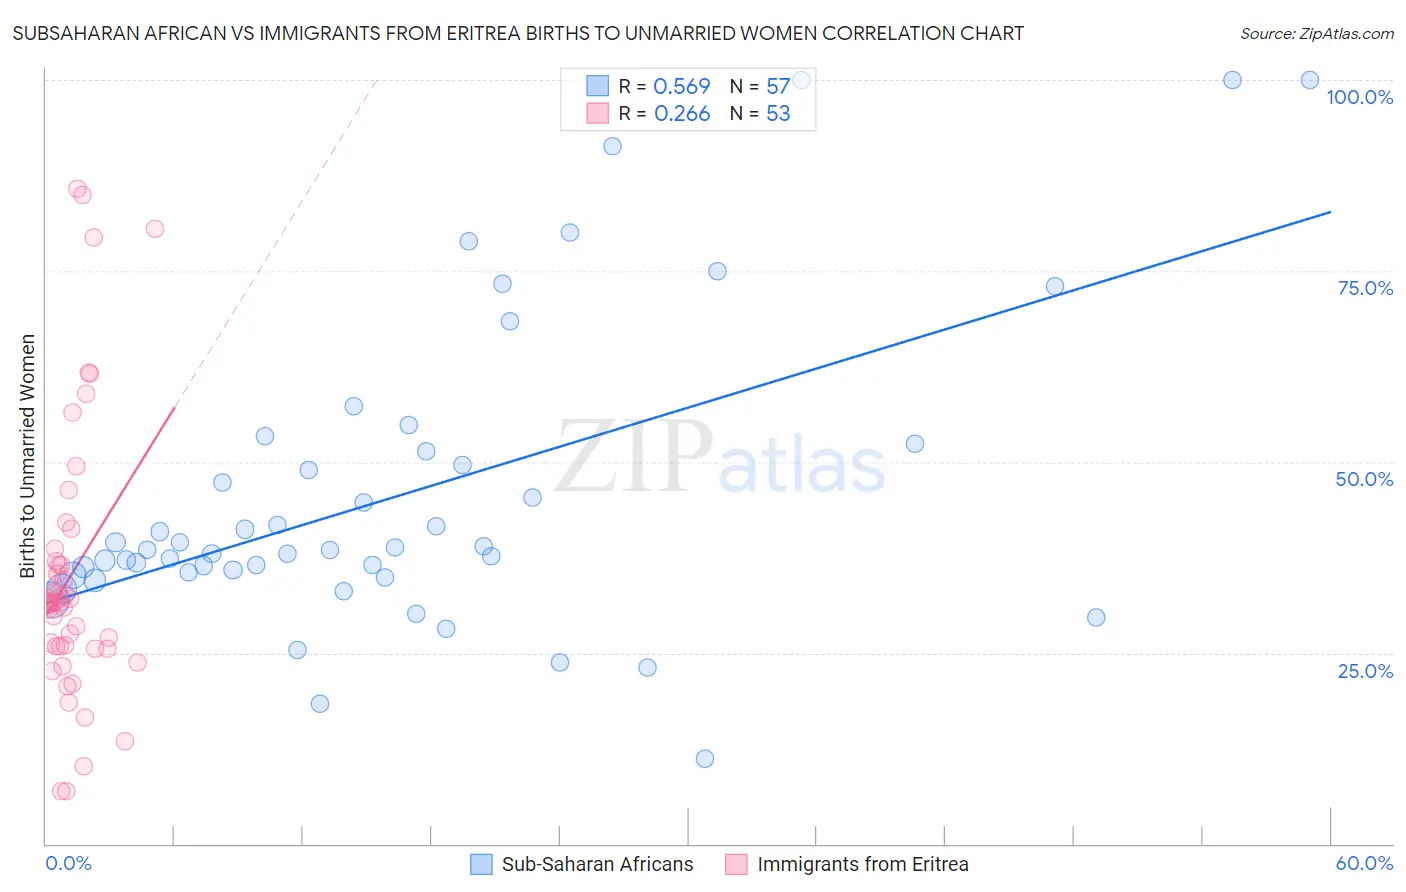
Subsaharan African vs Immigrants from Eritrea Births to Unmarried Women Correlation Chart
The statistical analysis conducted on geographies consisting of 468,897,335 people shows a substantial positive correlation between the proportion of Sub-Saharan Africans and percentage of births to unmarried women in the United States with a correlation coefficient (R) of 0.569 and weighted average of 36.7%. Similarly, the statistical analysis conducted on geographies consisting of 103,370,880 people shows a weak positive correlation between the proportion of Immigrants from Eritrea and percentage of births to unmarried women in the United States with a correlation coefficient (R) of 0.266 and weighted average of 31.7%, a difference of 15.8%.
Births to Unmarried Women Correlation Summary
| Measurement | Subsaharan African | Immigrants from Eritrea |
| Minimum | 11.1% | 6.8% |
| Maximum | 100.0% | 85.7% |
| Range | 88.9% | 78.9% |
| Mean | 45.9% | 35.2% |
| Median | 38.5% | 31.6% |
| Interquartile 25% (IQ1) | 35.3% | 25.8% |
| Interquartile 75% (IQ3) | 51.9% | 37.8% |
| Interquartile Range (IQR) | 16.5% | 12.0% |
| Standard Deviation (Sample) | 20.2% | 18.1% |
| Standard Deviation (Population) | 20.0% | 17.9% |
Similar Demographics by Births to Unmarried Women
Demographics Similar to Sub-Saharan Africans by Births to Unmarried Women
In terms of births to unmarried women, the demographic groups most similar to Sub-Saharan Africans are Cherokee (36.7%, a difference of 0.050%), Immigrants from Senegal (36.7%, a difference of 0.10%), Nicaraguan (36.6%, a difference of 0.12%), French American Indian (36.6%, a difference of 0.14%), and Central American (36.7%, a difference of 0.17%).
| Demographics | Rating | Rank | Births to Unmarried Women |
| Immigrants | Grenada | 0.2 /100 | #257 | Tragic 36.3% |
| Americans | 0.2 /100 | #258 | Tragic 36.4% |
| Immigrants | El Salvador | 0.2 /100 | #259 | Tragic 36.4% |
| Ottawa | 0.2 /100 | #260 | Tragic 36.5% |
| Trinidadians and Tobagonians | 0.2 /100 | #261 | Tragic 36.5% |
| French American Indians | 0.1 /100 | #262 | Tragic 36.6% |
| Nicaraguans | 0.1 /100 | #263 | Tragic 36.6% |
| Sub-Saharan Africans | 0.1 /100 | #264 | Tragic 36.7% |
| Cherokee | 0.1 /100 | #265 | Tragic 36.7% |
| Immigrants | Senegal | 0.1 /100 | #266 | Tragic 36.7% |
| Central Americans | 0.1 /100 | #267 | Tragic 36.7% |
| Comanche | 0.1 /100 | #268 | Tragic 36.7% |
| Senegalese | 0.1 /100 | #269 | Tragic 36.8% |
| Immigrants | Congo | 0.1 /100 | #270 | Tragic 36.8% |
| Immigrants | Barbados | 0.1 /100 | #271 | Tragic 36.8% |
Demographics Similar to Immigrants from Eritrea by Births to Unmarried Women
In terms of births to unmarried women, the demographic groups most similar to Immigrants from Eritrea are Finnish (31.7%, a difference of 0.010%), Immigrants from Yemen (31.7%, a difference of 0.020%), Venezuelan (31.7%, a difference of 0.040%), Guamanian/Chamorro (31.6%, a difference of 0.090%), and Immigrants from Venezuela (31.7%, a difference of 0.12%).
| Demographics | Rating | Rank | Births to Unmarried Women |
| Immigrants | Somalia | 58.1 /100 | #165 | Average 31.4% |
| Peruvians | 55.5 /100 | #166 | Average 31.5% |
| Dutch | 55.3 /100 | #167 | Average 31.5% |
| Belgians | 52.4 /100 | #168 | Average 31.6% |
| Slavs | 52.0 /100 | #169 | Average 31.6% |
| Guamanians/Chamorros | 51.3 /100 | #170 | Average 31.6% |
| Finns | 50.5 /100 | #171 | Average 31.7% |
| Immigrants | Eritrea | 50.4 /100 | #172 | Average 31.7% |
| Immigrants | Yemen | 50.2 /100 | #173 | Average 31.7% |
| Venezuelans | 50.0 /100 | #174 | Average 31.7% |
| Immigrants | Venezuela | 49.2 /100 | #175 | Average 31.7% |
| Scottish | 48.1 /100 | #176 | Average 31.7% |
| South American Indians | 47.7 /100 | #177 | Average 31.7% |
| English | 47.4 /100 | #178 | Average 31.7% |
| South Americans | 46.9 /100 | #179 | Average 31.8% |