Subsaharan African vs Native Hawaiian Births to Unmarried Women
COMPARE
Subsaharan African
Native Hawaiian
Births to Unmarried Women
Births to Unmarried Women Comparison
Sub-Saharan Africans
Native Hawaiians
36.7%
BIRTHS TO UNMARRIED WOMEN
0.1/ 100
METRIC RATING
264th/ 347
METRIC RANK
34.3%
BIRTHS TO UNMARRIED WOMEN
2.9/ 100
METRIC RATING
231st/ 347
METRIC RANK
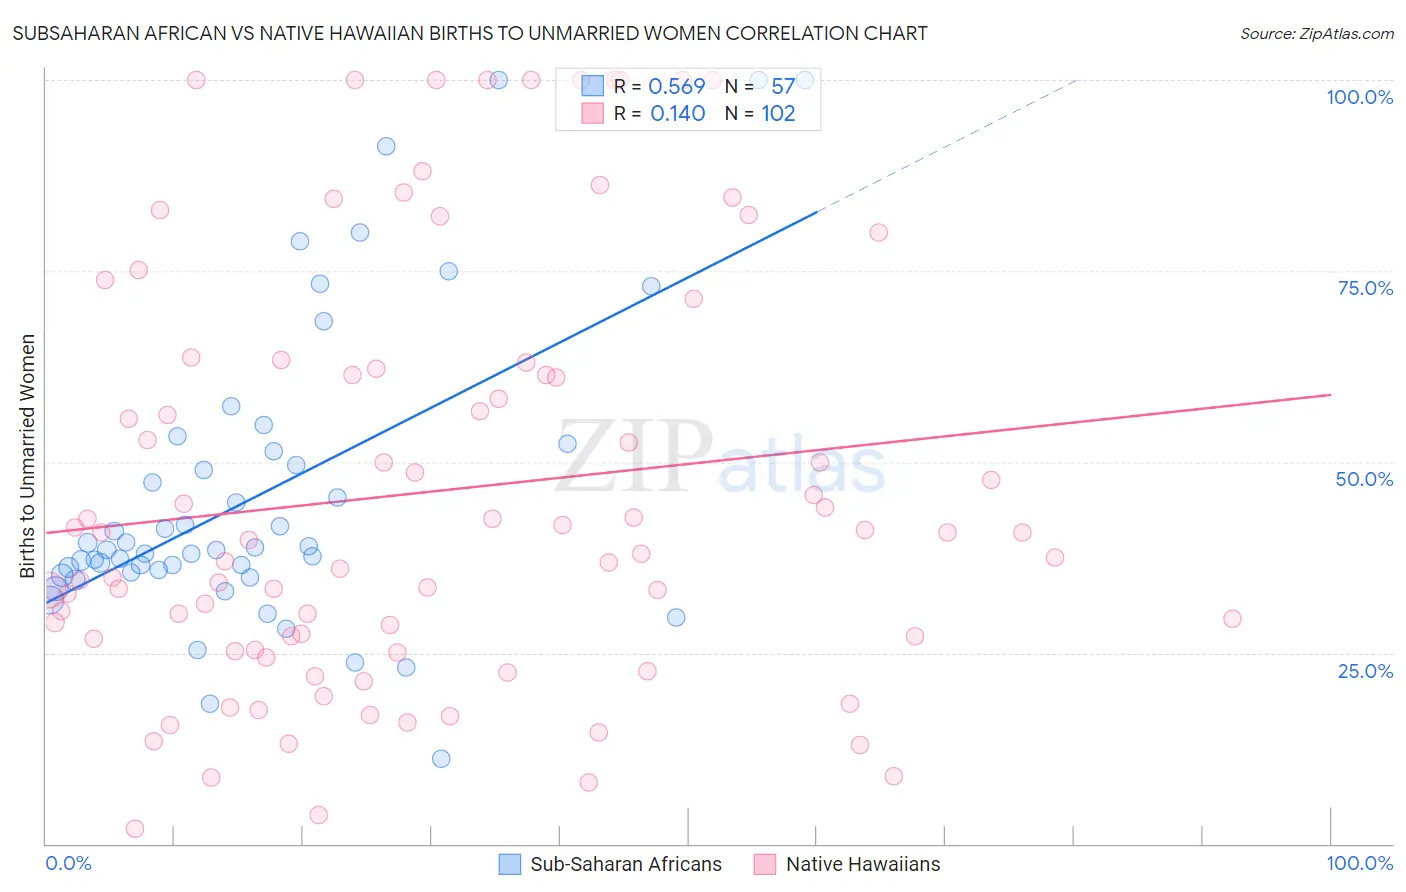
Subsaharan African vs Native Hawaiian Births to Unmarried Women Correlation Chart
The statistical analysis conducted on geographies consisting of 468,897,335 people shows a substantial positive correlation between the proportion of Sub-Saharan Africans and percentage of births to unmarried women in the United States with a correlation coefficient (R) of 0.569 and weighted average of 36.7%. Similarly, the statistical analysis conducted on geographies consisting of 315,286,073 people shows a poor positive correlation between the proportion of Native Hawaiians and percentage of births to unmarried women in the United States with a correlation coefficient (R) of 0.140 and weighted average of 34.3%, a difference of 6.9%.
Births to Unmarried Women Correlation Summary
| Measurement | Subsaharan African | Native Hawaiian |
| Minimum | 11.1% | 1.9% |
| Maximum | 100.0% | 100.0% |
| Range | 88.9% | 98.1% |
| Mean | 45.9% | 46.1% |
| Median | 38.5% | 40.2% |
| Interquartile 25% (IQ1) | 35.3% | 26.8% |
| Interquartile 75% (IQ3) | 51.9% | 62.2% |
| Interquartile Range (IQR) | 16.5% | 35.4% |
| Standard Deviation (Sample) | 20.2% | 27.3% |
| Standard Deviation (Population) | 20.0% | 27.1% |
Similar Demographics by Births to Unmarried Women
Demographics Similar to Sub-Saharan Africans by Births to Unmarried Women
In terms of births to unmarried women, the demographic groups most similar to Sub-Saharan Africans are Cherokee (36.7%, a difference of 0.050%), Immigrants from Senegal (36.7%, a difference of 0.10%), Nicaraguan (36.6%, a difference of 0.12%), French American Indian (36.6%, a difference of 0.14%), and Central American (36.7%, a difference of 0.17%).
| Demographics | Rating | Rank | Births to Unmarried Women |
| Immigrants | Grenada | 0.2 /100 | #257 | Tragic 36.3% |
| Americans | 0.2 /100 | #258 | Tragic 36.4% |
| Immigrants | El Salvador | 0.2 /100 | #259 | Tragic 36.4% |
| Ottawa | 0.2 /100 | #260 | Tragic 36.5% |
| Trinidadians and Tobagonians | 0.2 /100 | #261 | Tragic 36.5% |
| French American Indians | 0.1 /100 | #262 | Tragic 36.6% |
| Nicaraguans | 0.1 /100 | #263 | Tragic 36.6% |
| Sub-Saharan Africans | 0.1 /100 | #264 | Tragic 36.7% |
| Cherokee | 0.1 /100 | #265 | Tragic 36.7% |
| Immigrants | Senegal | 0.1 /100 | #266 | Tragic 36.7% |
| Central Americans | 0.1 /100 | #267 | Tragic 36.7% |
| Comanche | 0.1 /100 | #268 | Tragic 36.7% |
| Senegalese | 0.1 /100 | #269 | Tragic 36.8% |
| Immigrants | Congo | 0.1 /100 | #270 | Tragic 36.8% |
| Immigrants | Barbados | 0.1 /100 | #271 | Tragic 36.8% |
Demographics Similar to Native Hawaiians by Births to Unmarried Women
In terms of births to unmarried women, the demographic groups most similar to Native Hawaiians are Ghanaian (34.3%, a difference of 0.14%), Immigrants from Sierra Leone (34.2%, a difference of 0.17%), Panamanian (34.2%, a difference of 0.28%), French Canadian (34.4%, a difference of 0.30%), and Immigrants from Panama (34.2%, a difference of 0.31%).
| Demographics | Rating | Rank | Births to Unmarried Women |
| Immigrants | Laos | 4.3 /100 | #224 | Tragic 34.0% |
| Spanish | 4.0 /100 | #225 | Tragic 34.1% |
| Delaware | 3.3 /100 | #226 | Tragic 34.2% |
| Immigrants | Panama | 3.3 /100 | #227 | Tragic 34.2% |
| Panamanians | 3.3 /100 | #228 | Tragic 34.2% |
| Immigrants | Sierra Leone | 3.1 /100 | #229 | Tragic 34.2% |
| Ghanaians | 3.1 /100 | #230 | Tragic 34.3% |
| Native Hawaiians | 2.9 /100 | #231 | Tragic 34.3% |
| French Canadians | 2.5 /100 | #232 | Tragic 34.4% |
| Bangladeshis | 2.5 /100 | #233 | Tragic 34.4% |
| Immigrants | Zaire | 2.3 /100 | #234 | Tragic 34.5% |
| Immigrants | Ghana | 2.2 /100 | #235 | Tragic 34.5% |
| Immigrants | Cameroon | 1.6 /100 | #236 | Tragic 34.7% |
| Marshallese | 1.6 /100 | #237 | Tragic 34.8% |
| Immigrants | Cambodia | 1.6 /100 | #238 | Tragic 34.8% |