Subsaharan African vs Immigrants from Ecuador Births to Unmarried Women
COMPARE
Subsaharan African
Immigrants from Ecuador
Births to Unmarried Women
Births to Unmarried Women Comparison
Sub-Saharan Africans
Immigrants from Ecuador
36.7%
BIRTHS TO UNMARRIED WOMEN
0.1/ 100
METRIC RATING
264th/ 347
METRIC RANK
33.7%
BIRTHS TO UNMARRIED WOMEN
5.9/ 100
METRIC RATING
218th/ 347
METRIC RANK
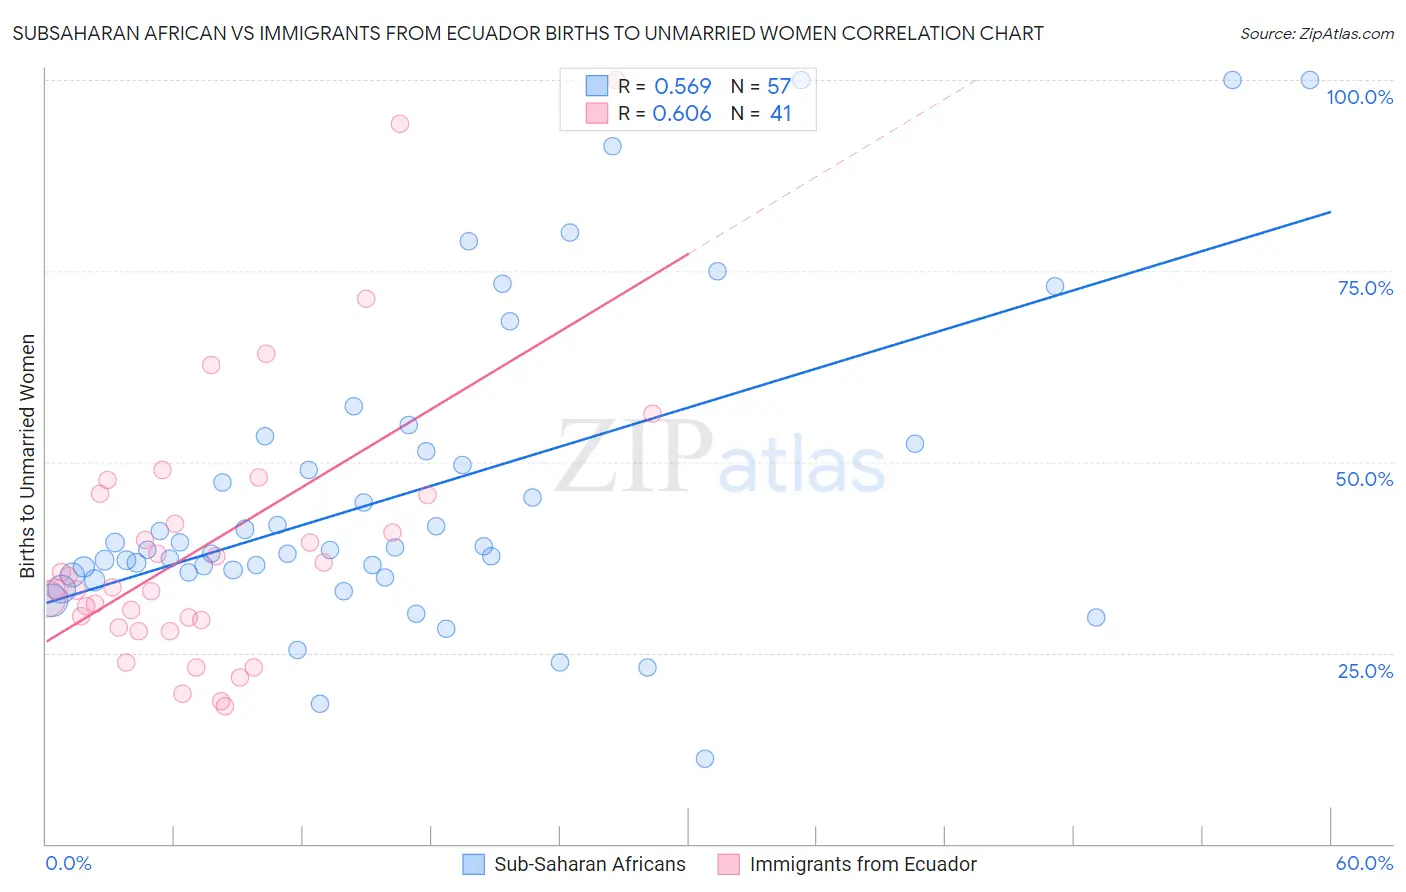
Subsaharan African vs Immigrants from Ecuador Births to Unmarried Women Correlation Chart
The statistical analysis conducted on geographies consisting of 468,897,335 people shows a substantial positive correlation between the proportion of Sub-Saharan Africans and percentage of births to unmarried women in the United States with a correlation coefficient (R) of 0.569 and weighted average of 36.7%. Similarly, the statistical analysis conducted on geographies consisting of 257,926,700 people shows a significant positive correlation between the proportion of Immigrants from Ecuador and percentage of births to unmarried women in the United States with a correlation coefficient (R) of 0.606 and weighted average of 33.7%, a difference of 8.6%.
Births to Unmarried Women Correlation Summary
| Measurement | Subsaharan African | Immigrants from Ecuador |
| Minimum | 11.1% | 18.0% |
| Maximum | 100.0% | 100.0% |
| Range | 88.9% | 82.0% |
| Mean | 45.9% | 39.2% |
| Median | 38.5% | 33.6% |
| Interquartile 25% (IQ1) | 35.3% | 28.8% |
| Interquartile 75% (IQ3) | 51.9% | 45.7% |
| Interquartile Range (IQR) | 16.5% | 17.0% |
| Standard Deviation (Sample) | 20.2% | 18.0% |
| Standard Deviation (Population) | 20.0% | 17.8% |
Similar Demographics by Births to Unmarried Women
Demographics Similar to Sub-Saharan Africans by Births to Unmarried Women
In terms of births to unmarried women, the demographic groups most similar to Sub-Saharan Africans are Cherokee (36.7%, a difference of 0.050%), Immigrants from Senegal (36.7%, a difference of 0.10%), Nicaraguan (36.6%, a difference of 0.12%), French American Indian (36.6%, a difference of 0.14%), and Central American (36.7%, a difference of 0.17%).
| Demographics | Rating | Rank | Births to Unmarried Women |
| Immigrants | Grenada | 0.2 /100 | #257 | Tragic 36.3% |
| Americans | 0.2 /100 | #258 | Tragic 36.4% |
| Immigrants | El Salvador | 0.2 /100 | #259 | Tragic 36.4% |
| Ottawa | 0.2 /100 | #260 | Tragic 36.5% |
| Trinidadians and Tobagonians | 0.2 /100 | #261 | Tragic 36.5% |
| French American Indians | 0.1 /100 | #262 | Tragic 36.6% |
| Nicaraguans | 0.1 /100 | #263 | Tragic 36.6% |
| Sub-Saharan Africans | 0.1 /100 | #264 | Tragic 36.7% |
| Cherokee | 0.1 /100 | #265 | Tragic 36.7% |
| Immigrants | Senegal | 0.1 /100 | #266 | Tragic 36.7% |
| Central Americans | 0.1 /100 | #267 | Tragic 36.7% |
| Comanche | 0.1 /100 | #268 | Tragic 36.7% |
| Senegalese | 0.1 /100 | #269 | Tragic 36.8% |
| Immigrants | Congo | 0.1 /100 | #270 | Tragic 36.8% |
| Immigrants | Barbados | 0.1 /100 | #271 | Tragic 36.8% |
Demographics Similar to Immigrants from Ecuador by Births to Unmarried Women
In terms of births to unmarried women, the demographic groups most similar to Immigrants from Ecuador are Alsatian (33.8%, a difference of 0.22%), Portuguese (33.8%, a difference of 0.24%), Spaniard (33.6%, a difference of 0.40%), Malaysian (33.9%, a difference of 0.41%), and Immigrants from Uruguay (33.9%, a difference of 0.48%).
| Demographics | Rating | Rank | Births to Unmarried Women |
| Ecuadorians | 10.5 /100 | #211 | Poor 33.3% |
| Celtics | 10.2 /100 | #212 | Poor 33.3% |
| Immigrants | Costa Rica | 9.5 /100 | #213 | Tragic 33.4% |
| Slovaks | 9.3 /100 | #214 | Tragic 33.4% |
| French | 8.7 /100 | #215 | Tragic 33.4% |
| Nepalese | 7.8 /100 | #216 | Tragic 33.5% |
| Spaniards | 7.0 /100 | #217 | Tragic 33.6% |
| Immigrants | Ecuador | 5.9 /100 | #218 | Tragic 33.7% |
| Alsatians | 5.4 /100 | #219 | Tragic 33.8% |
| Portuguese | 5.4 /100 | #220 | Tragic 33.8% |
| Malaysians | 5.0 /100 | #221 | Tragic 33.9% |
| Immigrants | Uruguay | 4.8 /100 | #222 | Tragic 33.9% |
| Pennsylvania Germans | 4.3 /100 | #223 | Tragic 34.0% |
| Immigrants | Laos | 4.3 /100 | #224 | Tragic 34.0% |
| Spanish | 4.0 /100 | #225 | Tragic 34.1% |