Ugandan vs Lumbee Births to Unmarried Women
COMPARE
Ugandan
Lumbee
Births to Unmarried Women
Births to Unmarried Women Comparison
Ugandans
Lumbee
30.1%
BIRTHS TO UNMARRIED WOMEN
89.2/ 100
METRIC RATING
120th/ 347
METRIC RANK
48.2%
BIRTHS TO UNMARRIED WOMEN
0.0/ 100
METRIC RATING
339th/ 347
METRIC RANK
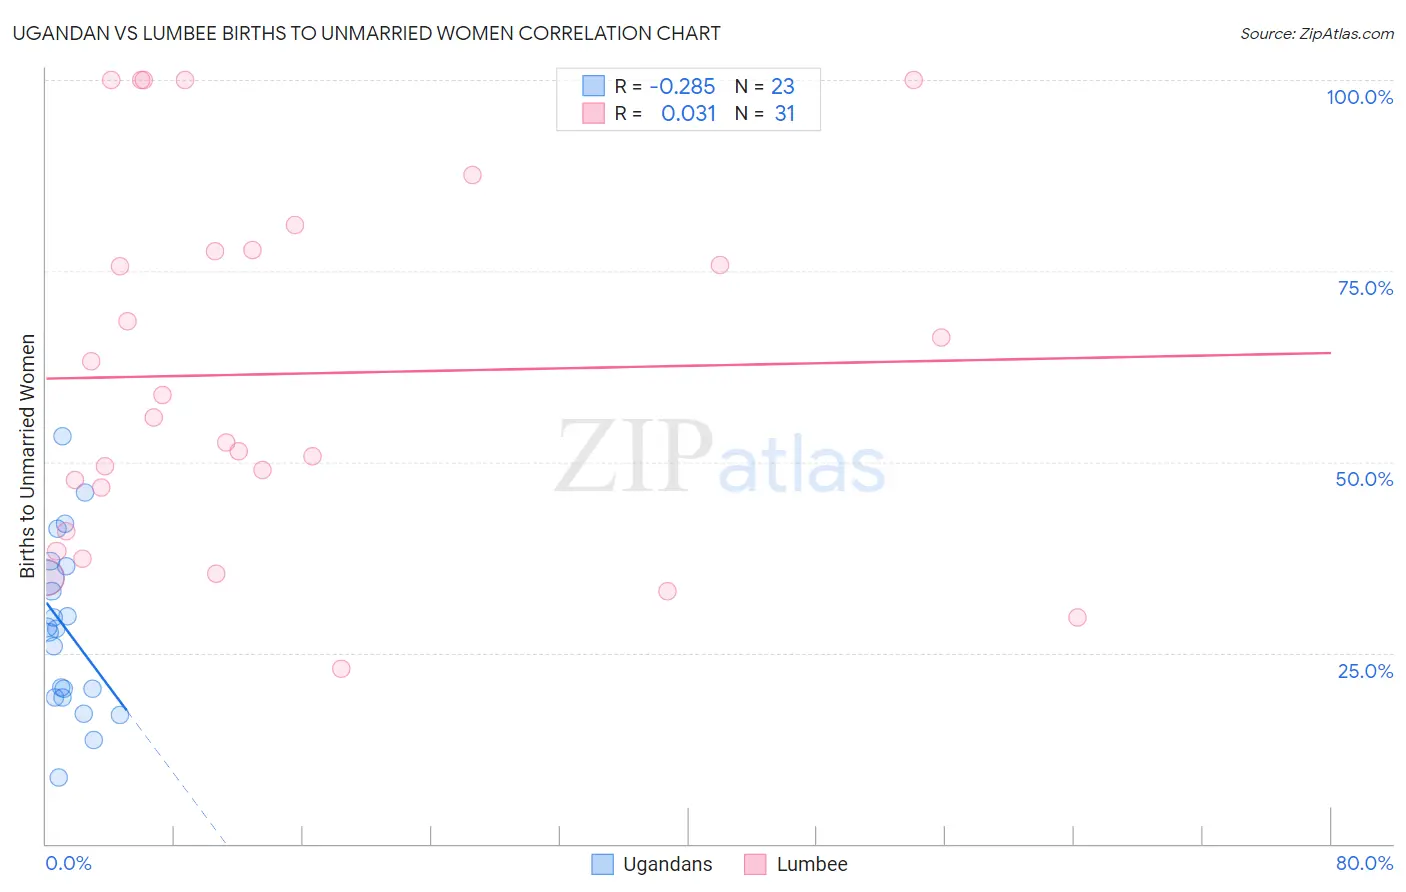
Ugandan vs Lumbee Births to Unmarried Women Correlation Chart
The statistical analysis conducted on geographies consisting of 92,593,945 people shows a weak negative correlation between the proportion of Ugandans and percentage of births to unmarried women in the United States with a correlation coefficient (R) of -0.285 and weighted average of 30.1%. Similarly, the statistical analysis conducted on geographies consisting of 89,846,476 people shows no correlation between the proportion of Lumbee and percentage of births to unmarried women in the United States with a correlation coefficient (R) of 0.031 and weighted average of 48.2%, a difference of 60.2%.
Births to Unmarried Women Correlation Summary
| Measurement | Ugandan | Lumbee |
| Minimum | 8.7% | 22.9% |
| Maximum | 53.4% | 100.0% |
| Range | 44.7% | 77.1% |
| Mean | 28.2% | 61.5% |
| Median | 28.1% | 55.9% |
| Interquartile 25% (IQ1) | 19.1% | 40.9% |
| Interquartile 75% (IQ3) | 36.4% | 77.7% |
| Interquartile Range (IQR) | 17.3% | 36.8% |
| Standard Deviation (Sample) | 11.1% | 23.6% |
| Standard Deviation (Population) | 10.9% | 23.3% |
Similar Demographics by Births to Unmarried Women
Demographics Similar to Ugandans by Births to Unmarried Women
In terms of births to unmarried women, the demographic groups most similar to Ugandans are Korean (30.1%, a difference of 0.070%), Immigrants from Argentina (30.1%, a difference of 0.12%), Syrian (30.2%, a difference of 0.25%), Croatian (30.2%, a difference of 0.29%), and Argentinean (30.0%, a difference of 0.36%).
| Demographics | Rating | Rank | Births to Unmarried Women |
| Scandinavians | 92.7 /100 | #113 | Exceptional 29.8% |
| Immigrants | Croatia | 92.6 /100 | #114 | Exceptional 29.8% |
| Ethiopians | 91.9 /100 | #115 | Exceptional 29.8% |
| Immigrants | Italy | 91.7 /100 | #116 | Exceptional 29.9% |
| Immigrants | Netherlands | 91.1 /100 | #117 | Exceptional 29.9% |
| Immigrants | Norway | 91.0 /100 | #118 | Exceptional 29.9% |
| Argentineans | 90.5 /100 | #119 | Exceptional 30.0% |
| Ugandans | 89.2 /100 | #120 | Excellent 30.1% |
| Koreans | 88.9 /100 | #121 | Excellent 30.1% |
| Immigrants | Argentina | 88.7 /100 | #122 | Excellent 30.1% |
| Syrians | 88.2 /100 | #123 | Excellent 30.2% |
| Croatians | 88.0 /100 | #124 | Excellent 30.2% |
| Vietnamese | 87.7 /100 | #125 | Excellent 30.2% |
| Europeans | 87.2 /100 | #126 | Excellent 30.2% |
| Chinese | 87.1 /100 | #127 | Excellent 30.2% |
Demographics Similar to Lumbee by Births to Unmarried Women
In terms of births to unmarried women, the demographic groups most similar to Lumbee are Arapaho (47.1%, a difference of 2.3%), Tohono O'odham (49.8%, a difference of 3.4%), Houma (46.6%, a difference of 3.5%), Hopi (50.8%, a difference of 5.4%), and Puerto Rican (45.7%, a difference of 5.5%).
| Demographics | Rating | Rank | Births to Unmarried Women |
| Kiowa | 0.0 /100 | #332 | Tragic 43.1% |
| Blacks/African Americans | 0.0 /100 | #333 | Tragic 44.3% |
| Yuman | 0.0 /100 | #334 | Tragic 44.4% |
| Colville | 0.0 /100 | #335 | Tragic 45.3% |
| Puerto Ricans | 0.0 /100 | #336 | Tragic 45.7% |
| Houma | 0.0 /100 | #337 | Tragic 46.6% |
| Arapaho | 0.0 /100 | #338 | Tragic 47.1% |
| Lumbee | 0.0 /100 | #339 | Tragic 48.2% |
| Tohono O'odham | 0.0 /100 | #340 | Tragic 49.8% |
| Hopi | 0.0 /100 | #341 | Tragic 50.8% |
| Menominee | 0.0 /100 | #342 | Tragic 51.1% |
| Pima | 0.0 /100 | #343 | Tragic 51.5% |
| Navajo | 0.0 /100 | #344 | Tragic 51.5% |
| Inupiat | 0.0 /100 | #345 | Tragic 52.1% |
| Pueblo | 0.0 /100 | #346 | Tragic 53.7% |