Subsaharan African vs Immigrants from Liberia Births to Unmarried Women
COMPARE
Subsaharan African
Immigrants from Liberia
Births to Unmarried Women
Births to Unmarried Women Comparison
Sub-Saharan Africans
Immigrants from Liberia
36.7%
BIRTHS TO UNMARRIED WOMEN
0.1/ 100
METRIC RATING
264th/ 347
METRIC RANK
37.6%
BIRTHS TO UNMARRIED WOMEN
0.0/ 100
METRIC RATING
288th/ 347
METRIC RANK
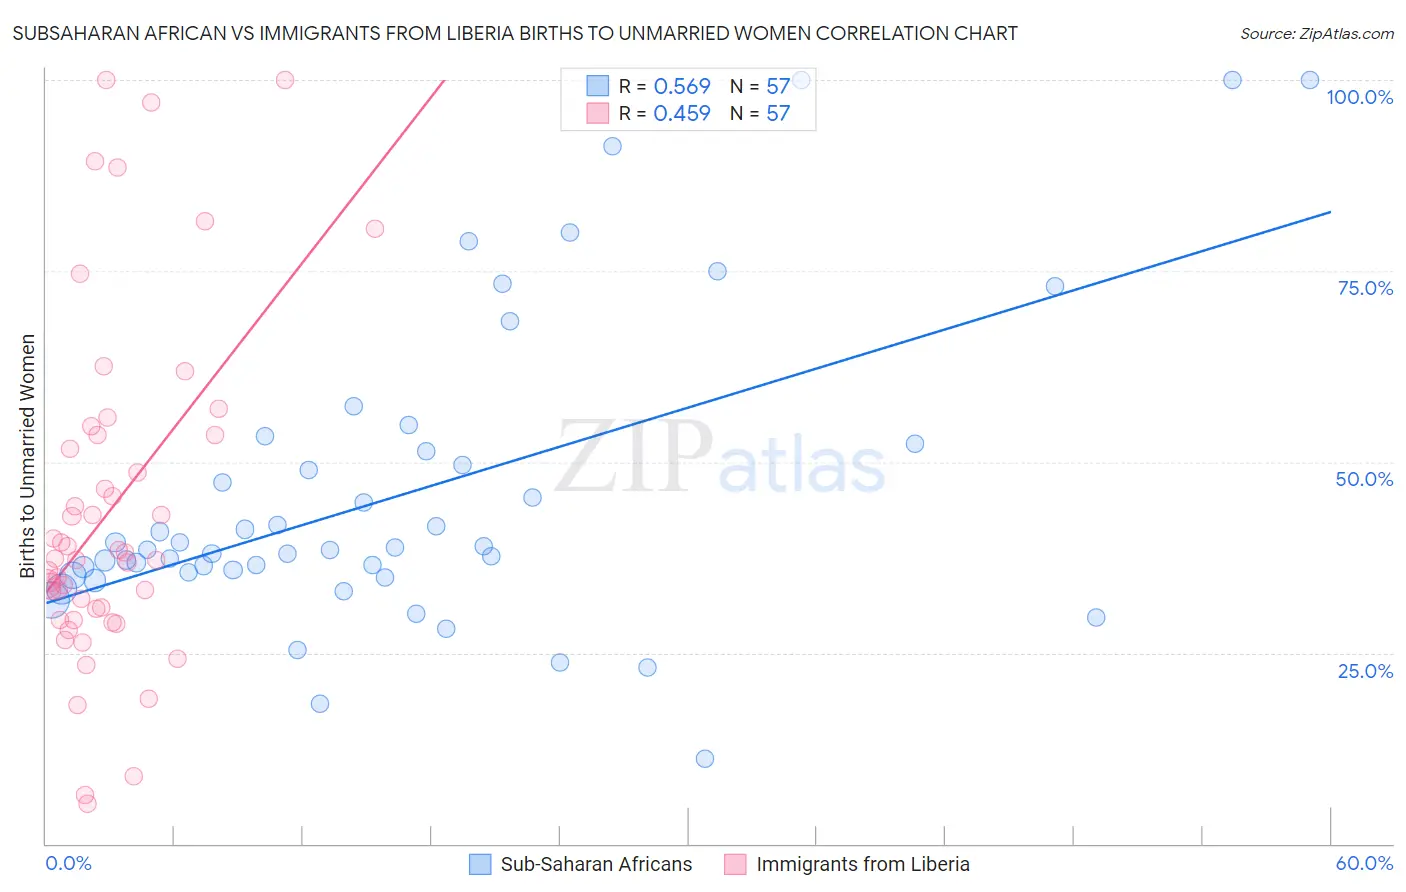
Subsaharan African vs Immigrants from Liberia Births to Unmarried Women Correlation Chart
The statistical analysis conducted on geographies consisting of 468,897,335 people shows a substantial positive correlation between the proportion of Sub-Saharan Africans and percentage of births to unmarried women in the United States with a correlation coefficient (R) of 0.569 and weighted average of 36.7%. Similarly, the statistical analysis conducted on geographies consisting of 132,597,891 people shows a moderate positive correlation between the proportion of Immigrants from Liberia and percentage of births to unmarried women in the United States with a correlation coefficient (R) of 0.459 and weighted average of 37.6%, a difference of 2.7%.
Births to Unmarried Women Correlation Summary
| Measurement | Subsaharan African | Immigrants from Liberia |
| Minimum | 11.1% | 5.3% |
| Maximum | 100.0% | 100.0% |
| Range | 88.9% | 94.7% |
| Mean | 45.9% | 43.7% |
| Median | 38.5% | 37.4% |
| Interquartile 25% (IQ1) | 35.3% | 30.1% |
| Interquartile 75% (IQ3) | 51.9% | 53.5% |
| Interquartile Range (IQR) | 16.5% | 23.4% |
| Standard Deviation (Sample) | 20.2% | 22.3% |
| Standard Deviation (Population) | 20.0% | 22.1% |
Similar Demographics by Births to Unmarried Women
Demographics Similar to Sub-Saharan Africans by Births to Unmarried Women
In terms of births to unmarried women, the demographic groups most similar to Sub-Saharan Africans are Cherokee (36.7%, a difference of 0.050%), Immigrants from Senegal (36.7%, a difference of 0.10%), Nicaraguan (36.6%, a difference of 0.12%), French American Indian (36.6%, a difference of 0.14%), and Central American (36.7%, a difference of 0.17%).
| Demographics | Rating | Rank | Births to Unmarried Women |
| Immigrants | Grenada | 0.2 /100 | #257 | Tragic 36.3% |
| Americans | 0.2 /100 | #258 | Tragic 36.4% |
| Immigrants | El Salvador | 0.2 /100 | #259 | Tragic 36.4% |
| Ottawa | 0.2 /100 | #260 | Tragic 36.5% |
| Trinidadians and Tobagonians | 0.2 /100 | #261 | Tragic 36.5% |
| French American Indians | 0.1 /100 | #262 | Tragic 36.6% |
| Nicaraguans | 0.1 /100 | #263 | Tragic 36.6% |
| Sub-Saharan Africans | 0.1 /100 | #264 | Tragic 36.7% |
| Cherokee | 0.1 /100 | #265 | Tragic 36.7% |
| Immigrants | Senegal | 0.1 /100 | #266 | Tragic 36.7% |
| Central Americans | 0.1 /100 | #267 | Tragic 36.7% |
| Comanche | 0.1 /100 | #268 | Tragic 36.7% |
| Senegalese | 0.1 /100 | #269 | Tragic 36.8% |
| Immigrants | Congo | 0.1 /100 | #270 | Tragic 36.8% |
| Immigrants | Barbados | 0.1 /100 | #271 | Tragic 36.8% |
Demographics Similar to Immigrants from Liberia by Births to Unmarried Women
In terms of births to unmarried women, the demographic groups most similar to Immigrants from Liberia are Creek (37.6%, a difference of 0.17%), Alaskan Athabascan (37.7%, a difference of 0.23%), Hispanic or Latino (37.8%, a difference of 0.37%), Immigrants from Guatemala (37.5%, a difference of 0.40%), and Immigrants from Mexico (37.5%, a difference of 0.41%).
| Demographics | Rating | Rank | Births to Unmarried Women |
| Immigrants | Belize | 0.1 /100 | #281 | Tragic 37.3% |
| Liberians | 0.0 /100 | #282 | Tragic 37.4% |
| Spanish American Indians | 0.0 /100 | #283 | Tragic 37.4% |
| Immigrants | Central America | 0.0 /100 | #284 | Tragic 37.4% |
| Immigrants | Mexico | 0.0 /100 | #285 | Tragic 37.5% |
| Immigrants | Guatemala | 0.0 /100 | #286 | Tragic 37.5% |
| Creek | 0.0 /100 | #287 | Tragic 37.6% |
| Immigrants | Liberia | 0.0 /100 | #288 | Tragic 37.6% |
| Alaskan Athabascans | 0.0 /100 | #289 | Tragic 37.7% |
| Hispanics or Latinos | 0.0 /100 | #290 | Tragic 37.8% |
| Seminole | 0.0 /100 | #291 | Tragic 37.9% |
| Blackfeet | 0.0 /100 | #292 | Tragic 37.9% |
| Immigrants | Nicaragua | 0.0 /100 | #293 | Tragic 38.0% |
| British West Indians | 0.0 /100 | #294 | Tragic 38.0% |
| Iroquois | 0.0 /100 | #295 | Tragic 38.2% |