Tlingit-Haida vs Lumbee Births to Unmarried Women
COMPARE
Tlingit-Haida
Lumbee
Births to Unmarried Women
Births to Unmarried Women Comparison
Tlingit-Haida
Lumbee
32.2%
BIRTHS TO UNMARRIED WOMEN
32.6/ 100
METRIC RATING
190th/ 347
METRIC RANK
48.2%
BIRTHS TO UNMARRIED WOMEN
0.0/ 100
METRIC RATING
339th/ 347
METRIC RANK
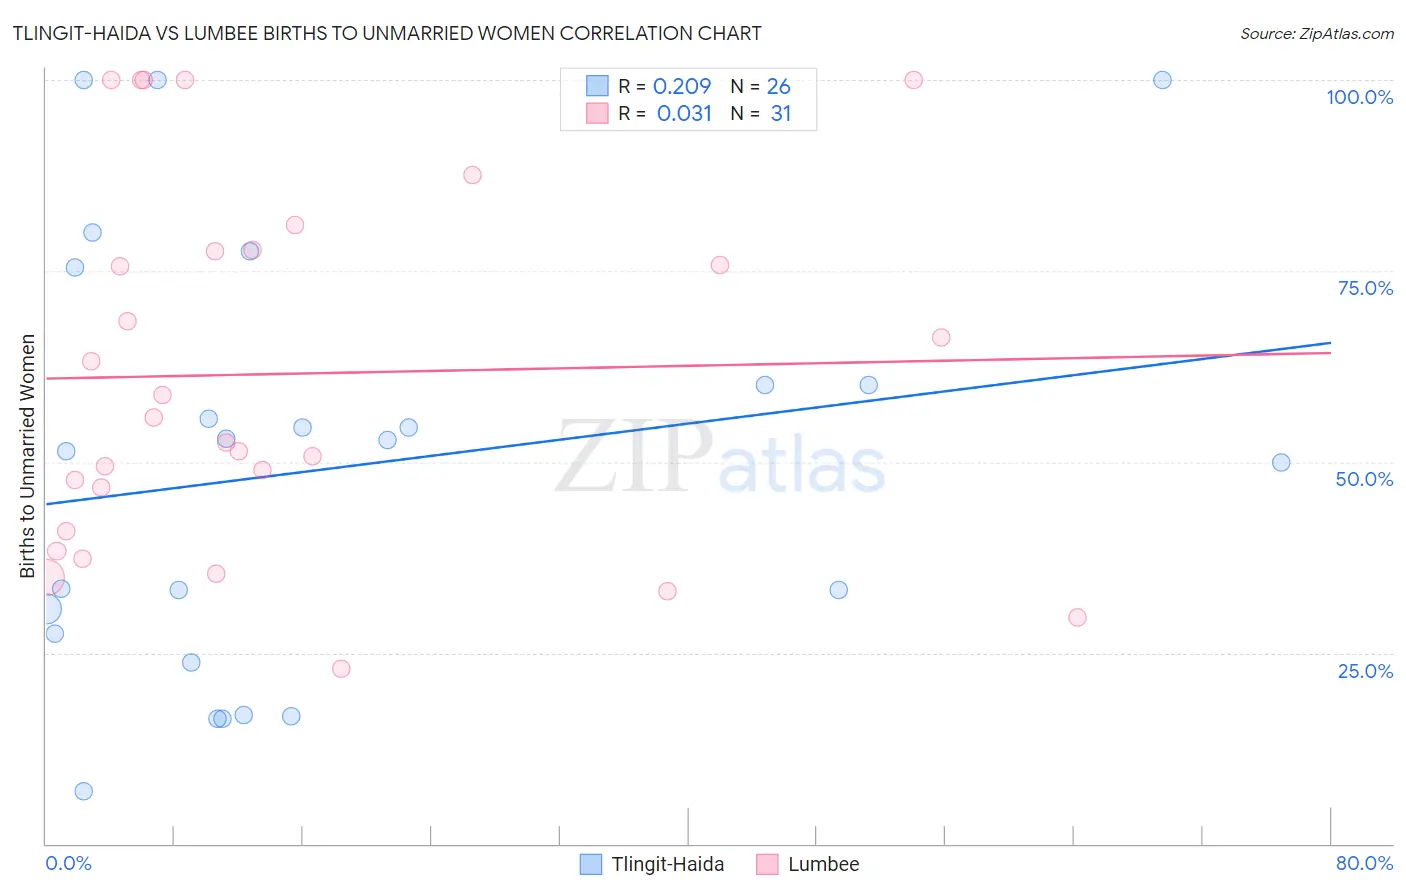
Tlingit-Haida vs Lumbee Births to Unmarried Women Correlation Chart
The statistical analysis conducted on geographies consisting of 59,376,059 people shows a weak positive correlation between the proportion of Tlingit-Haida and percentage of births to unmarried women in the United States with a correlation coefficient (R) of 0.209 and weighted average of 32.2%. Similarly, the statistical analysis conducted on geographies consisting of 89,846,476 people shows no correlation between the proportion of Lumbee and percentage of births to unmarried women in the United States with a correlation coefficient (R) of 0.031 and weighted average of 48.2%, a difference of 49.6%.
Births to Unmarried Women Correlation Summary
| Measurement | Tlingit-Haida | Lumbee |
| Minimum | 6.9% | 22.9% |
| Maximum | 100.0% | 100.0% |
| Range | 93.1% | 77.1% |
| Mean | 49.2% | 61.5% |
| Median | 52.2% | 55.9% |
| Interquartile 25% (IQ1) | 27.6% | 40.9% |
| Interquartile 75% (IQ3) | 60.0% | 77.7% |
| Interquartile Range (IQR) | 32.4% | 36.8% |
| Standard Deviation (Sample) | 27.4% | 23.6% |
| Standard Deviation (Population) | 26.9% | 23.3% |
Similar Demographics by Births to Unmarried Women
Demographics Similar to Tlingit-Haida by Births to Unmarried Women
In terms of births to unmarried women, the demographic groups most similar to Tlingit-Haida are Irish (32.2%, a difference of 0.020%), Colombian (32.2%, a difference of 0.080%), Fijian (32.3%, a difference of 0.17%), Immigrants from Kenya (32.1%, a difference of 0.44%), and Osage (32.1%, a difference of 0.47%).
| Demographics | Rating | Rank | Births to Unmarried Women |
| Canadians | 41.4 /100 | #183 | Average 31.9% |
| Immigrants | South America | 40.7 /100 | #184 | Average 32.0% |
| Germans | 39.5 /100 | #185 | Fair 32.0% |
| Welsh | 38.2 /100 | #186 | Fair 32.0% |
| Czechoslovakians | 38.0 /100 | #187 | Fair 32.0% |
| Osage | 37.1 /100 | #188 | Fair 32.1% |
| Immigrants | Kenya | 36.9 /100 | #189 | Fair 32.1% |
| Tlingit-Haida | 32.6 /100 | #190 | Fair 32.2% |
| Irish | 32.4 /100 | #191 | Fair 32.2% |
| Colombians | 31.9 /100 | #192 | Fair 32.2% |
| Fijians | 31.1 /100 | #193 | Fair 32.3% |
| Sudanese | 27.3 /100 | #194 | Fair 32.4% |
| Samoans | 21.9 /100 | #195 | Fair 32.6% |
| Immigrants | Colombia | 21.7 /100 | #196 | Fair 32.6% |
| Immigrants | Immigrants | 20.6 /100 | #197 | Fair 32.7% |
Demographics Similar to Lumbee by Births to Unmarried Women
In terms of births to unmarried women, the demographic groups most similar to Lumbee are Arapaho (47.1%, a difference of 2.3%), Tohono O'odham (49.8%, a difference of 3.4%), Houma (46.6%, a difference of 3.5%), Hopi (50.8%, a difference of 5.4%), and Puerto Rican (45.7%, a difference of 5.5%).
| Demographics | Rating | Rank | Births to Unmarried Women |
| Kiowa | 0.0 /100 | #332 | Tragic 43.1% |
| Blacks/African Americans | 0.0 /100 | #333 | Tragic 44.3% |
| Yuman | 0.0 /100 | #334 | Tragic 44.4% |
| Colville | 0.0 /100 | #335 | Tragic 45.3% |
| Puerto Ricans | 0.0 /100 | #336 | Tragic 45.7% |
| Houma | 0.0 /100 | #337 | Tragic 46.6% |
| Arapaho | 0.0 /100 | #338 | Tragic 47.1% |
| Lumbee | 0.0 /100 | #339 | Tragic 48.2% |
| Tohono O'odham | 0.0 /100 | #340 | Tragic 49.8% |
| Hopi | 0.0 /100 | #341 | Tragic 50.8% |
| Menominee | 0.0 /100 | #342 | Tragic 51.1% |
| Pima | 0.0 /100 | #343 | Tragic 51.5% |
| Navajo | 0.0 /100 | #344 | Tragic 51.5% |
| Inupiat | 0.0 /100 | #345 | Tragic 52.1% |
| Pueblo | 0.0 /100 | #346 | Tragic 53.7% |