Subsaharan African vs Immigrants from Asia Births to Unmarried Women
COMPARE
Subsaharan African
Immigrants from Asia
Births to Unmarried Women
Births to Unmarried Women Comparison
Sub-Saharan Africans
Immigrants from Asia
36.7%
BIRTHS TO UNMARRIED WOMEN
0.1/ 100
METRIC RATING
264th/ 347
METRIC RANK
26.8%
BIRTHS TO UNMARRIED WOMEN
99.9/ 100
METRIC RATING
27th/ 347
METRIC RANK
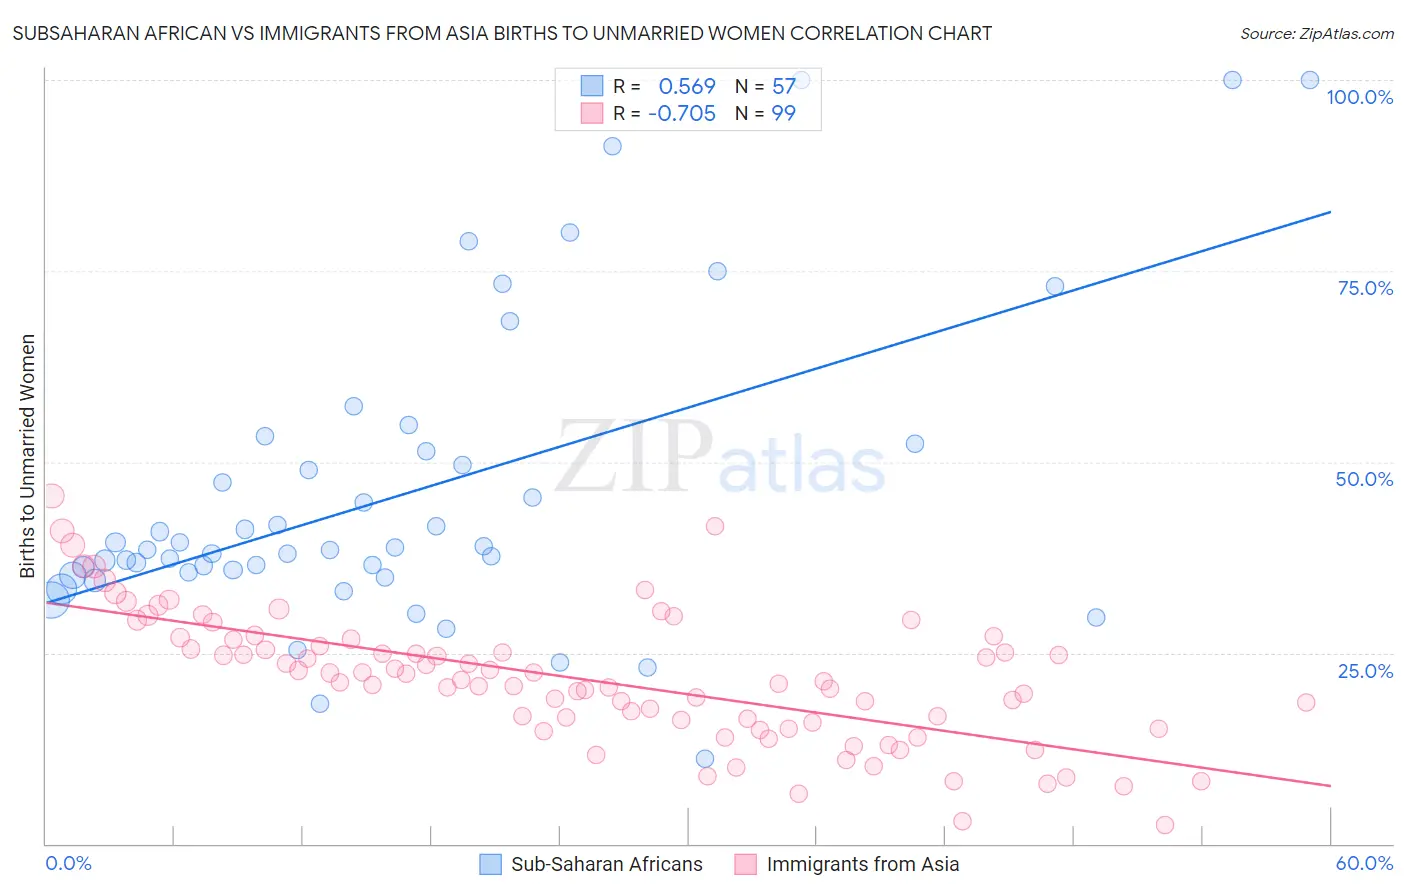
Subsaharan African vs Immigrants from Asia Births to Unmarried Women Correlation Chart
The statistical analysis conducted on geographies consisting of 468,897,335 people shows a substantial positive correlation between the proportion of Sub-Saharan Africans and percentage of births to unmarried women in the United States with a correlation coefficient (R) of 0.569 and weighted average of 36.7%. Similarly, the statistical analysis conducted on geographies consisting of 494,104,926 people shows a strong negative correlation between the proportion of Immigrants from Asia and percentage of births to unmarried women in the United States with a correlation coefficient (R) of -0.705 and weighted average of 26.8%, a difference of 36.8%.
Births to Unmarried Women Correlation Summary
| Measurement | Subsaharan African | Immigrants from Asia |
| Minimum | 11.1% | 2.4% |
| Maximum | 100.0% | 45.5% |
| Range | 88.9% | 43.1% |
| Mean | 45.9% | 21.5% |
| Median | 38.5% | 21.3% |
| Interquartile 25% (IQ1) | 35.3% | 15.8% |
| Interquartile 75% (IQ3) | 51.9% | 26.7% |
| Interquartile Range (IQR) | 16.5% | 10.9% |
| Standard Deviation (Sample) | 20.2% | 8.5% |
| Standard Deviation (Population) | 20.0% | 8.5% |
Similar Demographics by Births to Unmarried Women
Demographics Similar to Sub-Saharan Africans by Births to Unmarried Women
In terms of births to unmarried women, the demographic groups most similar to Sub-Saharan Africans are Cherokee (36.7%, a difference of 0.050%), Immigrants from Senegal (36.7%, a difference of 0.10%), Nicaraguan (36.6%, a difference of 0.12%), French American Indian (36.6%, a difference of 0.14%), and Central American (36.7%, a difference of 0.17%).
| Demographics | Rating | Rank | Births to Unmarried Women |
| Immigrants | Grenada | 0.2 /100 | #257 | Tragic 36.3% |
| Americans | 0.2 /100 | #258 | Tragic 36.4% |
| Immigrants | El Salvador | 0.2 /100 | #259 | Tragic 36.4% |
| Ottawa | 0.2 /100 | #260 | Tragic 36.5% |
| Trinidadians and Tobagonians | 0.2 /100 | #261 | Tragic 36.5% |
| French American Indians | 0.1 /100 | #262 | Tragic 36.6% |
| Nicaraguans | 0.1 /100 | #263 | Tragic 36.6% |
| Sub-Saharan Africans | 0.1 /100 | #264 | Tragic 36.7% |
| Cherokee | 0.1 /100 | #265 | Tragic 36.7% |
| Immigrants | Senegal | 0.1 /100 | #266 | Tragic 36.7% |
| Central Americans | 0.1 /100 | #267 | Tragic 36.7% |
| Comanche | 0.1 /100 | #268 | Tragic 36.7% |
| Senegalese | 0.1 /100 | #269 | Tragic 36.8% |
| Immigrants | Congo | 0.1 /100 | #270 | Tragic 36.8% |
| Immigrants | Barbados | 0.1 /100 | #271 | Tragic 36.8% |
Demographics Similar to Immigrants from Asia by Births to Unmarried Women
In terms of births to unmarried women, the demographic groups most similar to Immigrants from Asia are Asian (26.8%, a difference of 0.010%), Cambodian (26.7%, a difference of 0.40%), Okinawan (26.9%, a difference of 0.51%), Immigrants from Australia (26.6%, a difference of 0.62%), and Cypriot (27.0%, a difference of 0.87%).
| Demographics | Rating | Rank | Births to Unmarried Women |
| Immigrants | Korea | 99.9 /100 | #20 | Exceptional 26.3% |
| Soviet Union | 99.9 /100 | #21 | Exceptional 26.3% |
| Burmese | 99.9 /100 | #22 | Exceptional 26.4% |
| Immigrants | Japan | 99.9 /100 | #23 | Exceptional 26.4% |
| Immigrants | Australia | 99.9 /100 | #24 | Exceptional 26.6% |
| Cambodians | 99.9 /100 | #25 | Exceptional 26.7% |
| Asians | 99.9 /100 | #26 | Exceptional 26.8% |
| Immigrants | Asia | 99.9 /100 | #27 | Exceptional 26.8% |
| Okinawans | 99.8 /100 | #28 | Exceptional 26.9% |
| Cypriots | 99.8 /100 | #29 | Exceptional 27.0% |
| Bulgarians | 99.8 /100 | #30 | Exceptional 27.1% |
| Immigrants | Iraq | 99.8 /100 | #31 | Exceptional 27.1% |
| Immigrants | Russia | 99.8 /100 | #32 | Exceptional 27.1% |
| Immigrants | Sri Lanka | 99.8 /100 | #33 | Exceptional 27.2% |
| Immigrants | Pakistan | 99.8 /100 | #34 | Exceptional 27.2% |