Yuman vs Lumbee Births to Unmarried Women
COMPARE
Yuman
Lumbee
Births to Unmarried Women
Births to Unmarried Women Comparison
Yuman
Lumbee
44.4%
BIRTHS TO UNMARRIED WOMEN
0.0/ 100
METRIC RATING
334th/ 347
METRIC RANK
48.2%
BIRTHS TO UNMARRIED WOMEN
0.0/ 100
METRIC RATING
339th/ 347
METRIC RANK
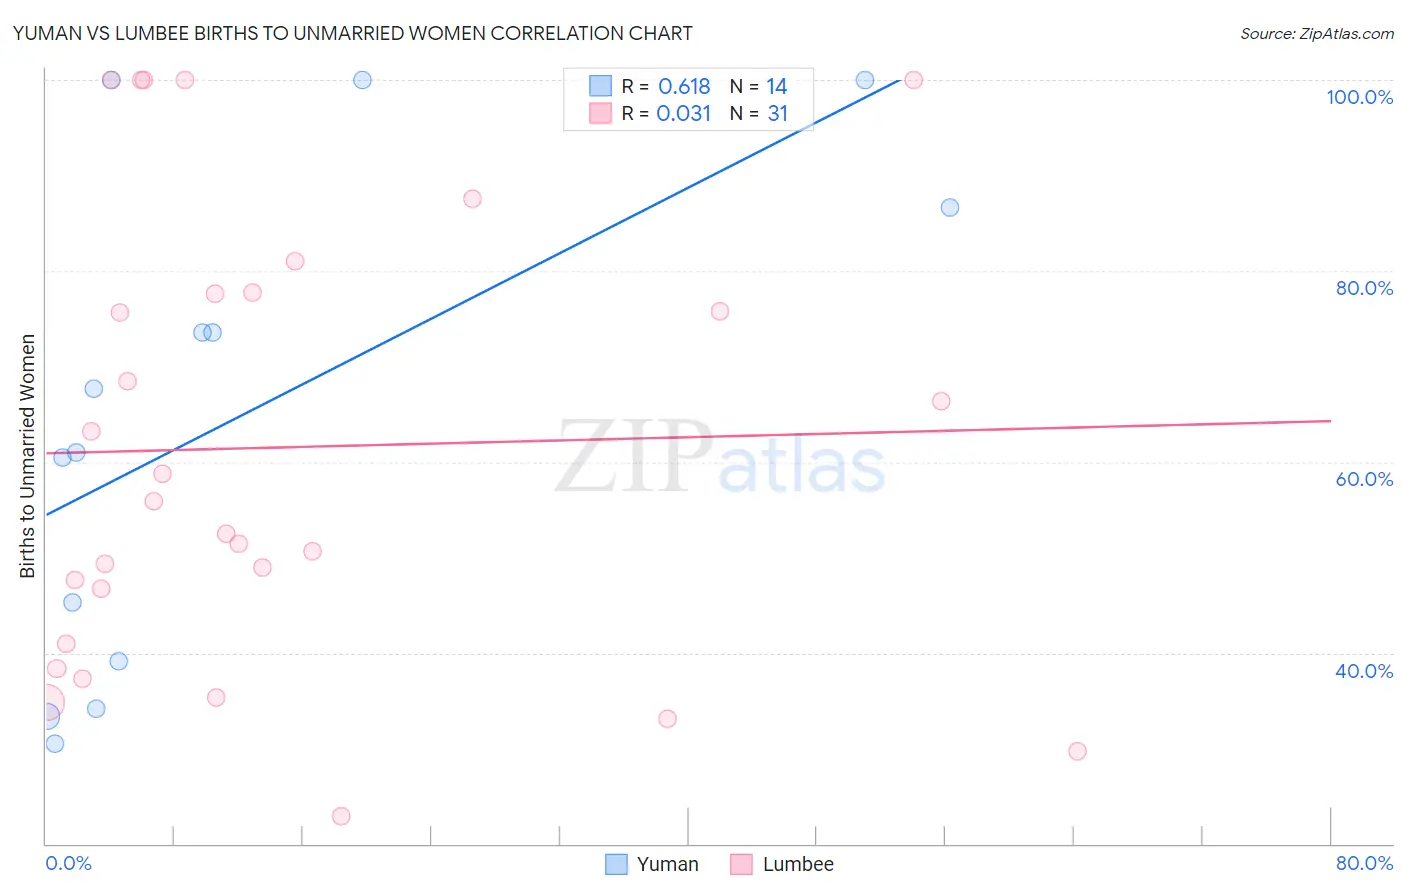
Yuman vs Lumbee Births to Unmarried Women Correlation Chart
The statistical analysis conducted on geographies consisting of 40,299,721 people shows a significant positive correlation between the proportion of Yuman and percentage of births to unmarried women in the United States with a correlation coefficient (R) of 0.618 and weighted average of 44.4%. Similarly, the statistical analysis conducted on geographies consisting of 89,846,476 people shows no correlation between the proportion of Lumbee and percentage of births to unmarried women in the United States with a correlation coefficient (R) of 0.031 and weighted average of 48.2%, a difference of 8.6%.
Births to Unmarried Women Correlation Summary
| Measurement | Yuman | Lumbee |
| Minimum | 30.5% | 22.9% |
| Maximum | 100.0% | 100.0% |
| Range | 69.5% | 77.1% |
| Mean | 64.7% | 61.5% |
| Median | 64.3% | 55.9% |
| Interquartile 25% (IQ1) | 39.1% | 40.9% |
| Interquartile 75% (IQ3) | 86.7% | 77.7% |
| Interquartile Range (IQR) | 47.6% | 36.8% |
| Standard Deviation (Sample) | 25.6% | 23.6% |
| Standard Deviation (Population) | 24.7% | 23.3% |
Demographics Similar to Yuman and Lumbee by Births to Unmarried Women
In terms of births to unmarried women, the demographic groups most similar to Yuman are Black/African American (44.3%, a difference of 0.17%), Colville (45.3%, a difference of 2.1%), Kiowa (43.1%, a difference of 2.9%), Puerto Rican (45.7%, a difference of 2.9%), and Native/Alaskan (43.0%, a difference of 3.2%). Similarly, the demographic groups most similar to Lumbee are Arapaho (47.1%, a difference of 2.3%), Tohono O'odham (49.8%, a difference of 3.4%), Houma (46.6%, a difference of 3.5%), Hopi (50.8%, a difference of 5.4%), and Puerto Rican (45.7%, a difference of 5.5%).
| Demographics | Rating | Rank | Births to Unmarried Women |
| Immigrants | Cuba | 0.0 /100 | #326 | Tragic 41.5% |
| Tsimshian | 0.0 /100 | #327 | Tragic 42.2% |
| Immigrants | Cabo Verde | 0.0 /100 | #328 | Tragic 42.2% |
| Paiute | 0.0 /100 | #329 | Tragic 42.5% |
| Chippewa | 0.0 /100 | #330 | Tragic 42.6% |
| Natives/Alaskans | 0.0 /100 | #331 | Tragic 43.0% |
| Kiowa | 0.0 /100 | #332 | Tragic 43.1% |
| Blacks/African Americans | 0.0 /100 | #333 | Tragic 44.3% |
| Yuman | 0.0 /100 | #334 | Tragic 44.4% |
| Colville | 0.0 /100 | #335 | Tragic 45.3% |
| Puerto Ricans | 0.0 /100 | #336 | Tragic 45.7% |
| Houma | 0.0 /100 | #337 | Tragic 46.6% |
| Arapaho | 0.0 /100 | #338 | Tragic 47.1% |
| Lumbee | 0.0 /100 | #339 | Tragic 48.2% |
| Tohono O'odham | 0.0 /100 | #340 | Tragic 49.8% |
| Hopi | 0.0 /100 | #341 | Tragic 50.8% |
| Menominee | 0.0 /100 | #342 | Tragic 51.1% |
| Pima | 0.0 /100 | #343 | Tragic 51.5% |
| Navajo | 0.0 /100 | #344 | Tragic 51.5% |
| Inupiat | 0.0 /100 | #345 | Tragic 52.1% |
| Pueblo | 0.0 /100 | #346 | Tragic 53.7% |