Subsaharan African vs Austrian Births to Unmarried Women
COMPARE
Subsaharan African
Austrian
Births to Unmarried Women
Births to Unmarried Women Comparison
Sub-Saharan Africans
Austrians
36.7%
BIRTHS TO UNMARRIED WOMEN
0.1/ 100
METRIC RATING
264th/ 347
METRIC RANK
31.0%
BIRTHS TO UNMARRIED WOMEN
69.9/ 100
METRIC RATING
158th/ 347
METRIC RANK
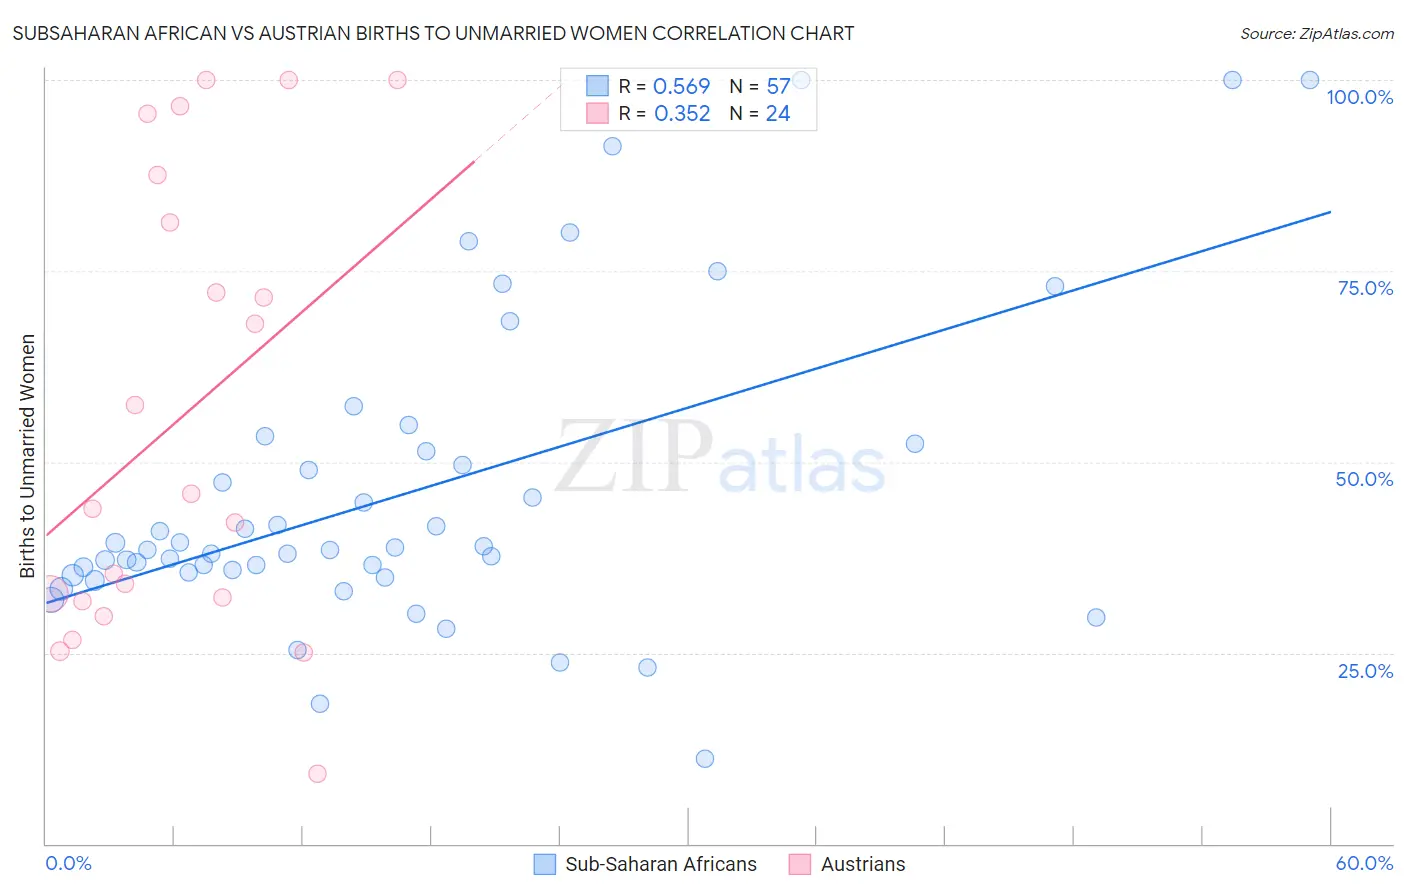
Subsaharan African vs Austrian Births to Unmarried Women Correlation Chart
The statistical analysis conducted on geographies consisting of 468,897,335 people shows a substantial positive correlation between the proportion of Sub-Saharan Africans and percentage of births to unmarried women in the United States with a correlation coefficient (R) of 0.569 and weighted average of 36.7%. Similarly, the statistical analysis conducted on geographies consisting of 412,149,174 people shows a mild positive correlation between the proportion of Austrians and percentage of births to unmarried women in the United States with a correlation coefficient (R) of 0.352 and weighted average of 31.0%, a difference of 18.1%.
Births to Unmarried Women Correlation Summary
| Measurement | Subsaharan African | Austrian |
| Minimum | 11.1% | 9.1% |
| Maximum | 100.0% | 100.0% |
| Range | 88.9% | 90.9% |
| Mean | 45.9% | 56.0% |
| Median | 38.5% | 44.8% |
| Interquartile 25% (IQ1) | 35.3% | 32.1% |
| Interquartile 75% (IQ3) | 51.9% | 84.4% |
| Interquartile Range (IQR) | 16.5% | 52.4% |
| Standard Deviation (Sample) | 20.2% | 29.5% |
| Standard Deviation (Population) | 20.0% | 28.9% |
Similar Demographics by Births to Unmarried Women
Demographics Similar to Sub-Saharan Africans by Births to Unmarried Women
In terms of births to unmarried women, the demographic groups most similar to Sub-Saharan Africans are Cherokee (36.7%, a difference of 0.050%), Immigrants from Senegal (36.7%, a difference of 0.10%), Nicaraguan (36.6%, a difference of 0.12%), French American Indian (36.6%, a difference of 0.14%), and Central American (36.7%, a difference of 0.17%).
| Demographics | Rating | Rank | Births to Unmarried Women |
| Immigrants | Grenada | 0.2 /100 | #257 | Tragic 36.3% |
| Americans | 0.2 /100 | #258 | Tragic 36.4% |
| Immigrants | El Salvador | 0.2 /100 | #259 | Tragic 36.4% |
| Ottawa | 0.2 /100 | #260 | Tragic 36.5% |
| Trinidadians and Tobagonians | 0.2 /100 | #261 | Tragic 36.5% |
| French American Indians | 0.1 /100 | #262 | Tragic 36.6% |
| Nicaraguans | 0.1 /100 | #263 | Tragic 36.6% |
| Sub-Saharan Africans | 0.1 /100 | #264 | Tragic 36.7% |
| Cherokee | 0.1 /100 | #265 | Tragic 36.7% |
| Immigrants | Senegal | 0.1 /100 | #266 | Tragic 36.7% |
| Central Americans | 0.1 /100 | #267 | Tragic 36.7% |
| Comanche | 0.1 /100 | #268 | Tragic 36.7% |
| Senegalese | 0.1 /100 | #269 | Tragic 36.8% |
| Immigrants | Congo | 0.1 /100 | #270 | Tragic 36.8% |
| Immigrants | Barbados | 0.1 /100 | #271 | Tragic 36.8% |
Demographics Similar to Austrians by Births to Unmarried Women
In terms of births to unmarried women, the demographic groups most similar to Austrians are Immigrants from England (31.1%, a difference of 0.060%), Immigrants from Western Europe (31.1%, a difference of 0.060%), Immigrants from Southern Europe (31.1%, a difference of 0.13%), Immigrants from Eastern Africa (31.0%, a difference of 0.27%), and Carpatho Rusyn (30.9%, a difference of 0.44%).
| Demographics | Rating | Rank | Births to Unmarried Women |
| Italians | 77.0 /100 | #151 | Good 30.8% |
| Poles | 76.2 /100 | #152 | Good 30.8% |
| British | 76.0 /100 | #153 | Good 30.8% |
| Yugoslavians | 75.1 /100 | #154 | Good 30.8% |
| Immigrants | Bangladesh | 73.9 /100 | #155 | Good 30.9% |
| Carpatho Rusyns | 73.5 /100 | #156 | Good 30.9% |
| Immigrants | Eastern Africa | 72.1 /100 | #157 | Good 31.0% |
| Austrians | 69.9 /100 | #158 | Good 31.0% |
| Immigrants | England | 69.4 /100 | #159 | Good 31.1% |
| Immigrants | Western Europe | 69.3 /100 | #160 | Good 31.1% |
| Immigrants | Southern Europe | 68.7 /100 | #161 | Good 31.1% |
| Slovenes | 65.9 /100 | #162 | Good 31.2% |
| Immigrants | Chile | 65.7 /100 | #163 | Good 31.2% |
| Hungarians | 64.1 /100 | #164 | Good 31.2% |
| Immigrants | Somalia | 58.1 /100 | #165 | Average 31.4% |