Immigrants from Oceania vs Hungarian Births to Unmarried Women
COMPARE
Immigrants from Oceania
Hungarian
Births to Unmarried Women
Births to Unmarried Women Comparison
Immigrants from Oceania
Hungarians
30.6%
BIRTHS TO UNMARRIED WOMEN
81.2/ 100
METRIC RATING
147th/ 347
METRIC RANK
31.2%
BIRTHS TO UNMARRIED WOMEN
64.1/ 100
METRIC RATING
164th/ 347
METRIC RANK
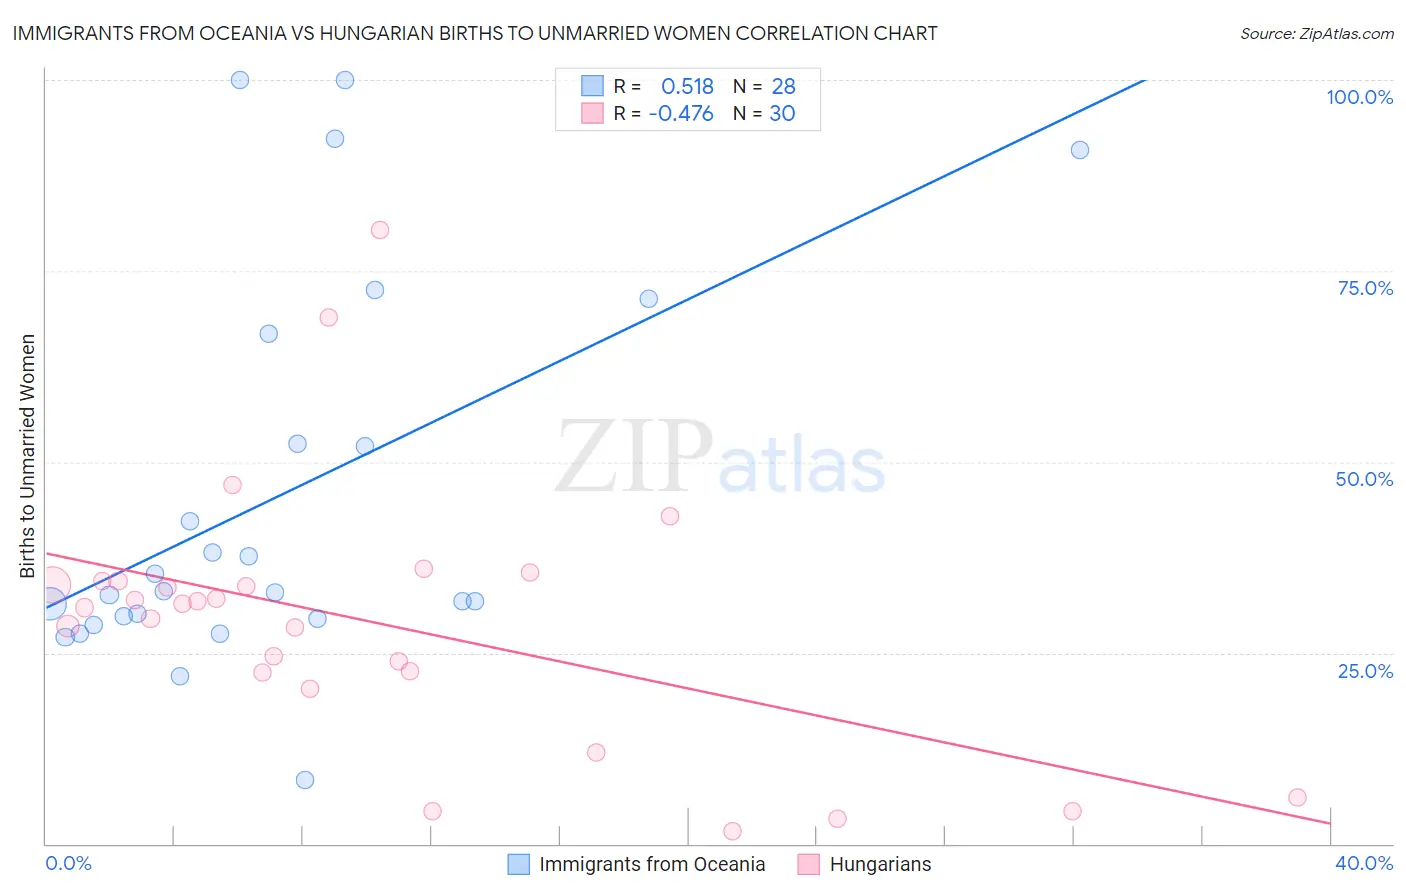
Immigrants from Oceania vs Hungarian Births to Unmarried Women Correlation Chart
The statistical analysis conducted on geographies consisting of 287,126,305 people shows a substantial positive correlation between the proportion of Immigrants from Oceania and percentage of births to unmarried women in the United States with a correlation coefficient (R) of 0.518 and weighted average of 30.6%. Similarly, the statistical analysis conducted on geographies consisting of 440,971,373 people shows a moderate negative correlation between the proportion of Hungarians and percentage of births to unmarried women in the United States with a correlation coefficient (R) of -0.476 and weighted average of 31.2%, a difference of 2.2%.
Births to Unmarried Women Correlation Summary
| Measurement | Immigrants from Oceania | Hungarian |
| Minimum | 8.4% | 1.6% |
| Maximum | 100.0% | 80.4% |
| Range | 91.6% | 78.8% |
| Mean | 45.6% | 29.0% |
| Median | 33.0% | 31.2% |
| Interquartile 25% (IQ1) | 29.6% | 22.4% |
| Interquartile 75% (IQ3) | 59.6% | 34.3% |
| Interquartile Range (IQR) | 29.9% | 12.0% |
| Standard Deviation (Sample) | 25.4% | 17.3% |
| Standard Deviation (Population) | 24.9% | 17.0% |
Demographics Similar to Immigrants from Oceania and Hungarians by Births to Unmarried Women
In terms of births to unmarried women, the demographic groups most similar to Immigrants from Oceania are Northern European (30.6%, a difference of 0.030%), Immigrants from North America (30.6%, a difference of 0.050%), Chilean (30.7%, a difference of 0.33%), Serbian (30.7%, a difference of 0.37%), and Somali (30.7%, a difference of 0.52%). Similarly, the demographic groups most similar to Hungarians are Immigrants from Chile (31.2%, a difference of 0.17%), Slovene (31.2%, a difference of 0.19%), Immigrants from Southern Europe (31.1%, a difference of 0.50%), Immigrants from England (31.1%, a difference of 0.57%), and Immigrants from Western Europe (31.1%, a difference of 0.57%).
| Demographics | Rating | Rank | Births to Unmarried Women |
| Immigrants | North America | 81.5 /100 | #145 | Excellent 30.6% |
| Northern Europeans | 81.4 /100 | #146 | Excellent 30.6% |
| Immigrants | Oceania | 81.2 /100 | #147 | Excellent 30.6% |
| Chileans | 79.1 /100 | #148 | Good 30.7% |
| Serbians | 78.8 /100 | #149 | Good 30.7% |
| Somalis | 77.8 /100 | #150 | Good 30.7% |
| Italians | 77.0 /100 | #151 | Good 30.8% |
| Poles | 76.2 /100 | #152 | Good 30.8% |
| British | 76.0 /100 | #153 | Good 30.8% |
| Yugoslavians | 75.1 /100 | #154 | Good 30.8% |
| Immigrants | Bangladesh | 73.9 /100 | #155 | Good 30.9% |
| Carpatho Rusyns | 73.5 /100 | #156 | Good 30.9% |
| Immigrants | Eastern Africa | 72.1 /100 | #157 | Good 31.0% |
| Austrians | 69.9 /100 | #158 | Good 31.0% |
| Immigrants | England | 69.4 /100 | #159 | Good 31.1% |
| Immigrants | Western Europe | 69.3 /100 | #160 | Good 31.1% |
| Immigrants | Southern Europe | 68.7 /100 | #161 | Good 31.1% |
| Slovenes | 65.9 /100 | #162 | Good 31.2% |
| Immigrants | Chile | 65.7 /100 | #163 | Good 31.2% |
| Hungarians | 64.1 /100 | #164 | Good 31.2% |
| Immigrants | Somalia | 58.1 /100 | #165 | Average 31.4% |