Scotch-Irish vs Hungarian Median Household Income
COMPARE
Scotch-Irish
Hungarian
Median Household Income
Median Household Income Comparison
Scotch-Irish
Hungarians
$80,972
MEDIAN HOUSEHOLD INCOME
6.6/ 100
METRIC RATING
225th/ 347
METRIC RANK
$86,920
MEDIAN HOUSEHOLD INCOME
76.3/ 100
METRIC RATING
151st/ 347
METRIC RANK
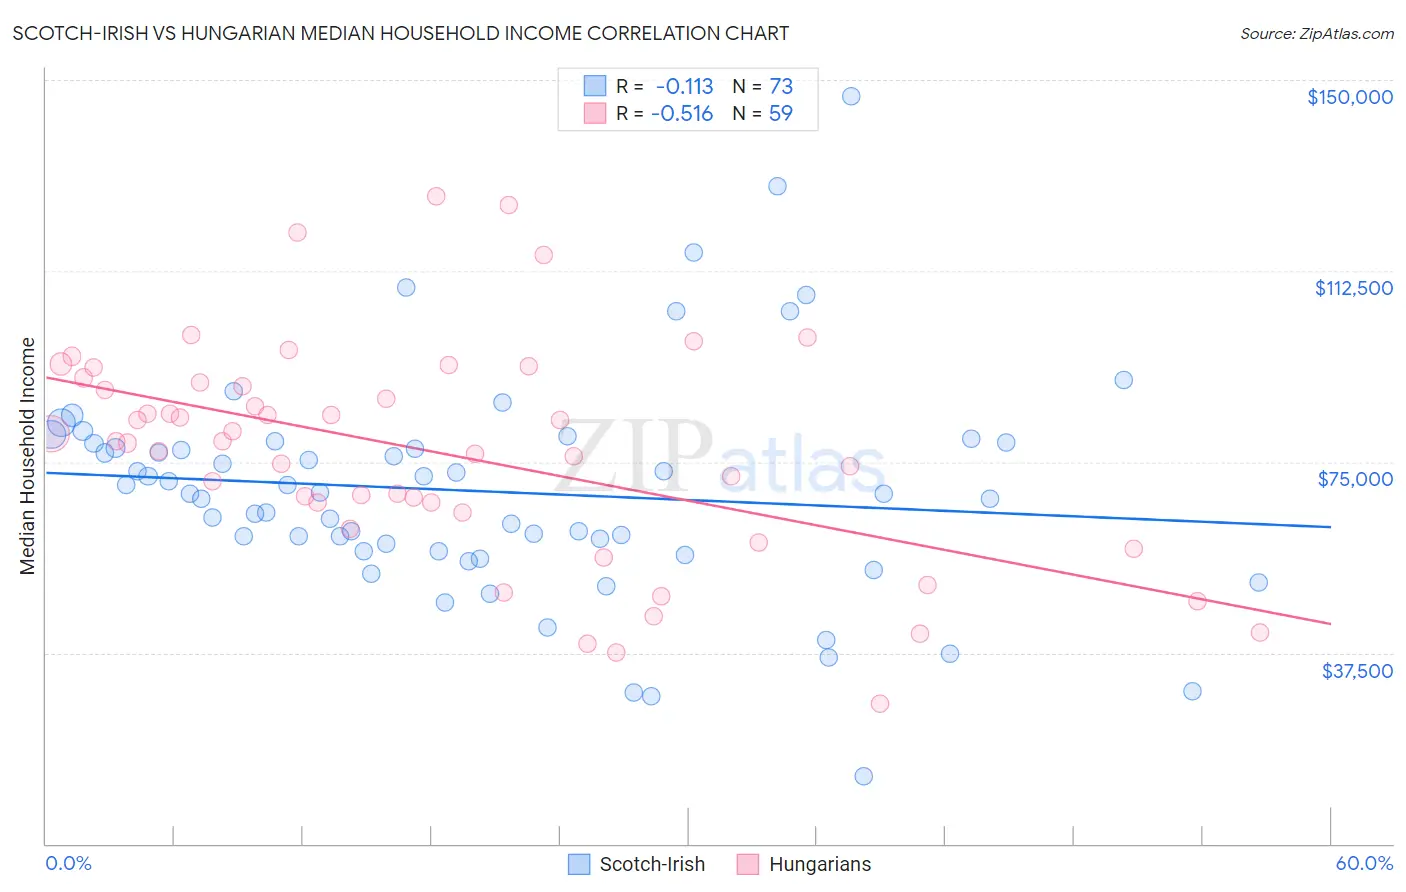
Scotch-Irish vs Hungarian Median Household Income Correlation Chart
The statistical analysis conducted on geographies consisting of 548,026,119 people shows a poor negative correlation between the proportion of Scotch-Irish and median household income in the United States with a correlation coefficient (R) of -0.113 and weighted average of $80,972. Similarly, the statistical analysis conducted on geographies consisting of 485,741,386 people shows a substantial negative correlation between the proportion of Hungarians and median household income in the United States with a correlation coefficient (R) of -0.516 and weighted average of $86,920, a difference of 7.3%.
Median Household Income Correlation Summary
| Measurement | Scotch-Irish | Hungarian |
| Minimum | $13,333 | $27,488 |
| Maximum | $146,875 | $127,161 |
| Range | $133,542 | $99,673 |
| Mean | $69,187 | $76,828 |
| Median | $68,778 | $79,103 |
| Interquartile 25% (IQ1) | $57,401 | $65,060 |
| Interquartile 75% (IQ3) | $78,673 | $90,559 |
| Interquartile Range (IQR) | $21,272 | $25,499 |
| Standard Deviation (Sample) | $22,180 | $21,600 |
| Standard Deviation (Population) | $22,027 | $21,417 |
Similar Demographics by Median Household Income
Demographics Similar to Scotch-Irish by Median Household Income
In terms of median household income, the demographic groups most similar to Scotch-Irish are Malaysian ($81,064, a difference of 0.11%), Immigrants from Panama ($80,873, a difference of 0.12%), Guyanese ($80,734, a difference of 0.29%), Immigrants from El Salvador ($81,213, a difference of 0.30%), and Immigrants from Bangladesh ($80,722, a difference of 0.31%).
| Demographics | Rating | Rank | Median Household Income |
| Whites/Caucasians | 12.2 /100 | #218 | Poor $82,029 |
| Nigerians | 10.3 /100 | #219 | Poor $81,725 |
| Immigrants | Venezuela | 9.0 /100 | #220 | Tragic $81,506 |
| Immigrants | Ghana | 9.0 /100 | #221 | Tragic $81,489 |
| Immigrants | Nigeria | 7.7 /100 | #222 | Tragic $81,236 |
| Immigrants | El Salvador | 7.6 /100 | #223 | Tragic $81,213 |
| Malaysians | 7.0 /100 | #224 | Tragic $81,064 |
| Scotch-Irish | 6.6 /100 | #225 | Tragic $80,972 |
| Immigrants | Panama | 6.2 /100 | #226 | Tragic $80,873 |
| Guyanese | 5.7 /100 | #227 | Tragic $80,734 |
| Immigrants | Bangladesh | 5.7 /100 | #228 | Tragic $80,722 |
| Delaware | 5.0 /100 | #229 | Tragic $80,527 |
| Bermudans | 4.7 /100 | #230 | Tragic $80,406 |
| Trinidadians and Tobagonians | 4.7 /100 | #231 | Tragic $80,402 |
| Immigrants | Trinidad and Tobago | 4.6 /100 | #232 | Tragic $80,373 |
Demographics Similar to Hungarians by Median Household Income
In terms of median household income, the demographic groups most similar to Hungarians are Immigrants from Saudi Arabia ($86,875, a difference of 0.050%), Basque ($87,001, a difference of 0.090%), South American ($86,824, a difference of 0.11%), Immigrants from Nepal ($87,046, a difference of 0.15%), and Immigrants from Germany ($86,764, a difference of 0.18%).
| Demographics | Rating | Rank | Median Household Income |
| Serbians | 83.0 /100 | #144 | Excellent $87,572 |
| Ugandans | 82.9 /100 | #145 | Excellent $87,557 |
| Immigrants | Uganda | 82.8 /100 | #146 | Excellent $87,553 |
| South American Indians | 81.8 /100 | #147 | Excellent $87,446 |
| Costa Ricans | 80.0 /100 | #148 | Excellent $87,262 |
| Immigrants | Nepal | 77.7 /100 | #149 | Good $87,046 |
| Basques | 77.2 /100 | #150 | Good $87,001 |
| Hungarians | 76.3 /100 | #151 | Good $86,920 |
| Immigrants | Saudi Arabia | 75.8 /100 | #152 | Good $86,875 |
| South Americans | 75.1 /100 | #153 | Good $86,824 |
| Immigrants | Germany | 74.4 /100 | #154 | Good $86,764 |
| Carpatho Rusyns | 72.8 /100 | #155 | Good $86,635 |
| Immigrants | Albania | 71.5 /100 | #156 | Good $86,534 |
| Samoans | 71.0 /100 | #157 | Good $86,498 |
| Moroccans | 70.6 /100 | #158 | Good $86,468 |