Immigrants from Congo vs Hungarian Births to Unmarried Women
COMPARE
Immigrants from Congo
Hungarian
Births to Unmarried Women
Births to Unmarried Women Comparison
Immigrants from Congo
Hungarians
36.8%
BIRTHS TO UNMARRIED WOMEN
0.1/ 100
METRIC RATING
270th/ 347
METRIC RANK
31.2%
BIRTHS TO UNMARRIED WOMEN
64.1/ 100
METRIC RATING
164th/ 347
METRIC RANK
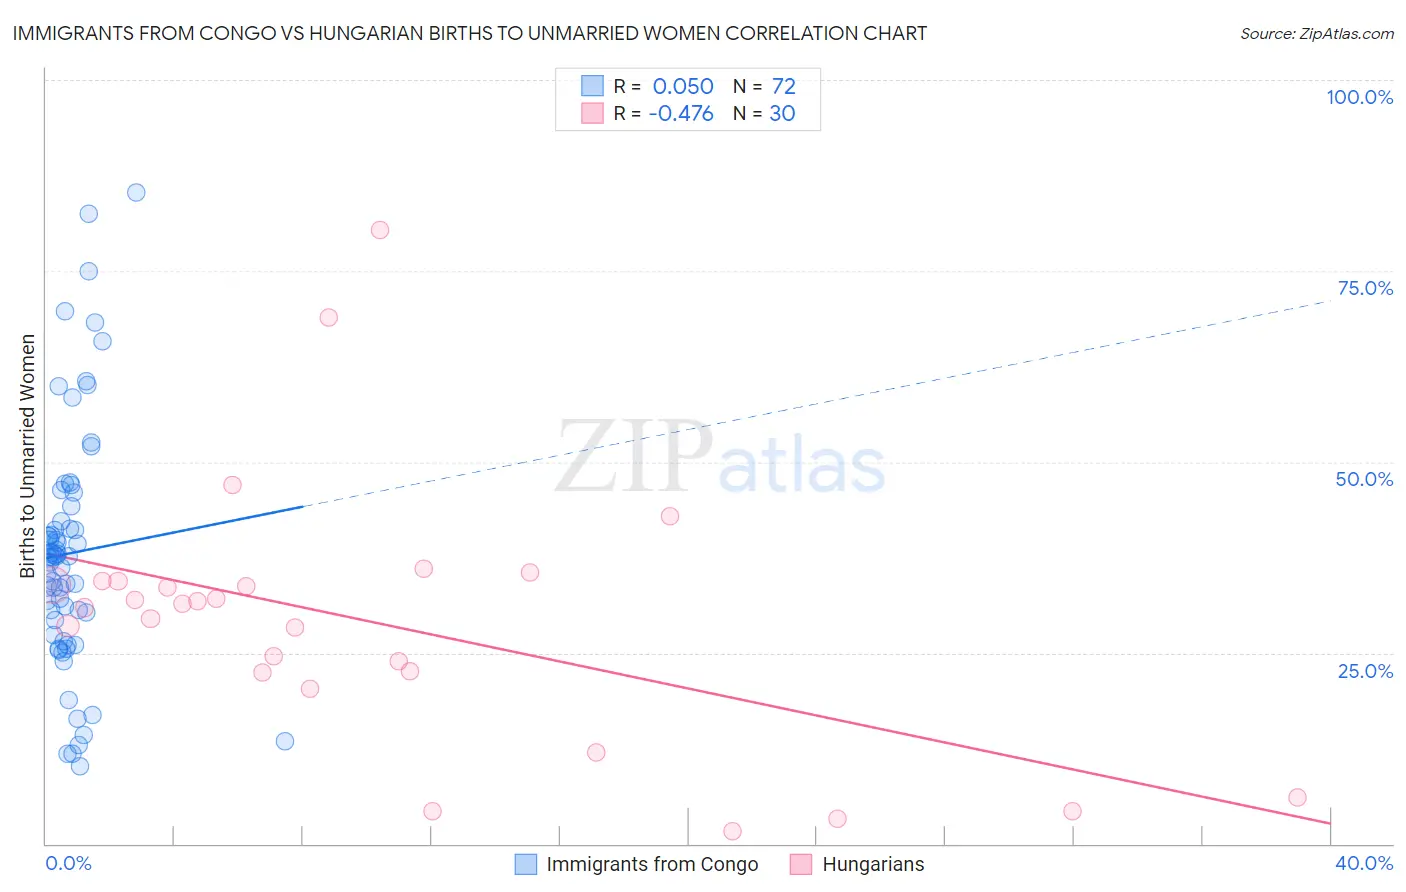
Immigrants from Congo vs Hungarian Births to Unmarried Women Correlation Chart
The statistical analysis conducted on geographies consisting of 91,138,649 people shows no correlation between the proportion of Immigrants from Congo and percentage of births to unmarried women in the United States with a correlation coefficient (R) of 0.050 and weighted average of 36.8%. Similarly, the statistical analysis conducted on geographies consisting of 440,971,373 people shows a moderate negative correlation between the proportion of Hungarians and percentage of births to unmarried women in the United States with a correlation coefficient (R) of -0.476 and weighted average of 31.2%, a difference of 17.8%.
Births to Unmarried Women Correlation Summary
| Measurement | Immigrants from Congo | Hungarian |
| Minimum | 10.2% | 1.6% |
| Maximum | 85.3% | 80.4% |
| Range | 75.1% | 78.8% |
| Mean | 38.0% | 29.0% |
| Median | 37.5% | 31.2% |
| Interquartile 25% (IQ1) | 28.3% | 22.4% |
| Interquartile 75% (IQ3) | 43.2% | 34.3% |
| Interquartile Range (IQR) | 14.9% | 12.0% |
| Standard Deviation (Sample) | 16.0% | 17.3% |
| Standard Deviation (Population) | 15.9% | 17.0% |
Similar Demographics by Births to Unmarried Women
Demographics Similar to Immigrants from Congo by Births to Unmarried Women
In terms of births to unmarried women, the demographic groups most similar to Immigrants from Congo are Immigrants from Barbados (36.8%, a difference of 0.030%), Senegalese (36.8%, a difference of 0.080%), Comanche (36.7%, a difference of 0.20%), Central American (36.7%, a difference of 0.21%), and Choctaw (36.9%, a difference of 0.24%).
| Demographics | Rating | Rank | Births to Unmarried Women |
| Nicaraguans | 0.1 /100 | #263 | Tragic 36.6% |
| Sub-Saharan Africans | 0.1 /100 | #264 | Tragic 36.7% |
| Cherokee | 0.1 /100 | #265 | Tragic 36.7% |
| Immigrants | Senegal | 0.1 /100 | #266 | Tragic 36.7% |
| Central Americans | 0.1 /100 | #267 | Tragic 36.7% |
| Comanche | 0.1 /100 | #268 | Tragic 36.7% |
| Senegalese | 0.1 /100 | #269 | Tragic 36.8% |
| Immigrants | Congo | 0.1 /100 | #270 | Tragic 36.8% |
| Immigrants | Barbados | 0.1 /100 | #271 | Tragic 36.8% |
| Choctaw | 0.1 /100 | #272 | Tragic 36.9% |
| Mexicans | 0.1 /100 | #273 | Tragic 36.9% |
| Cree | 0.1 /100 | #274 | Tragic 37.0% |
| Barbadians | 0.1 /100 | #275 | Tragic 37.0% |
| Belizeans | 0.1 /100 | #276 | Tragic 37.0% |
| Guatemalans | 0.1 /100 | #277 | Tragic 37.1% |
Demographics Similar to Hungarians by Births to Unmarried Women
In terms of births to unmarried women, the demographic groups most similar to Hungarians are Immigrants from Chile (31.2%, a difference of 0.17%), Slovene (31.2%, a difference of 0.19%), Immigrants from Southern Europe (31.1%, a difference of 0.50%), Immigrants from England (31.1%, a difference of 0.57%), and Immigrants from Western Europe (31.1%, a difference of 0.57%).
| Demographics | Rating | Rank | Births to Unmarried Women |
| Immigrants | Eastern Africa | 72.1 /100 | #157 | Good 31.0% |
| Austrians | 69.9 /100 | #158 | Good 31.0% |
| Immigrants | England | 69.4 /100 | #159 | Good 31.1% |
| Immigrants | Western Europe | 69.3 /100 | #160 | Good 31.1% |
| Immigrants | Southern Europe | 68.7 /100 | #161 | Good 31.1% |
| Slovenes | 65.9 /100 | #162 | Good 31.2% |
| Immigrants | Chile | 65.7 /100 | #163 | Good 31.2% |
| Hungarians | 64.1 /100 | #164 | Good 31.2% |
| Immigrants | Somalia | 58.1 /100 | #165 | Average 31.4% |
| Peruvians | 55.5 /100 | #166 | Average 31.5% |
| Dutch | 55.3 /100 | #167 | Average 31.5% |
| Belgians | 52.4 /100 | #168 | Average 31.6% |
| Slavs | 52.0 /100 | #169 | Average 31.6% |
| Guamanians/Chamorros | 51.3 /100 | #170 | Average 31.6% |
| Finns | 50.5 /100 | #171 | Average 31.7% |