Pakistani vs U.S. Virgin Islander Average Family Size
COMPARE
Pakistani
U.S. Virgin Islander
Average Family Size
Average Family Size Comparison
Pakistanis
U.S. Virgin Islanders
3.22
AVERAGE FAMILY SIZE
33.7/ 100
METRIC RATING
189th/ 347
METRIC RANK
3.29
AVERAGE FAMILY SIZE
98.8/ 100
METRIC RATING
96th/ 347
METRIC RANK
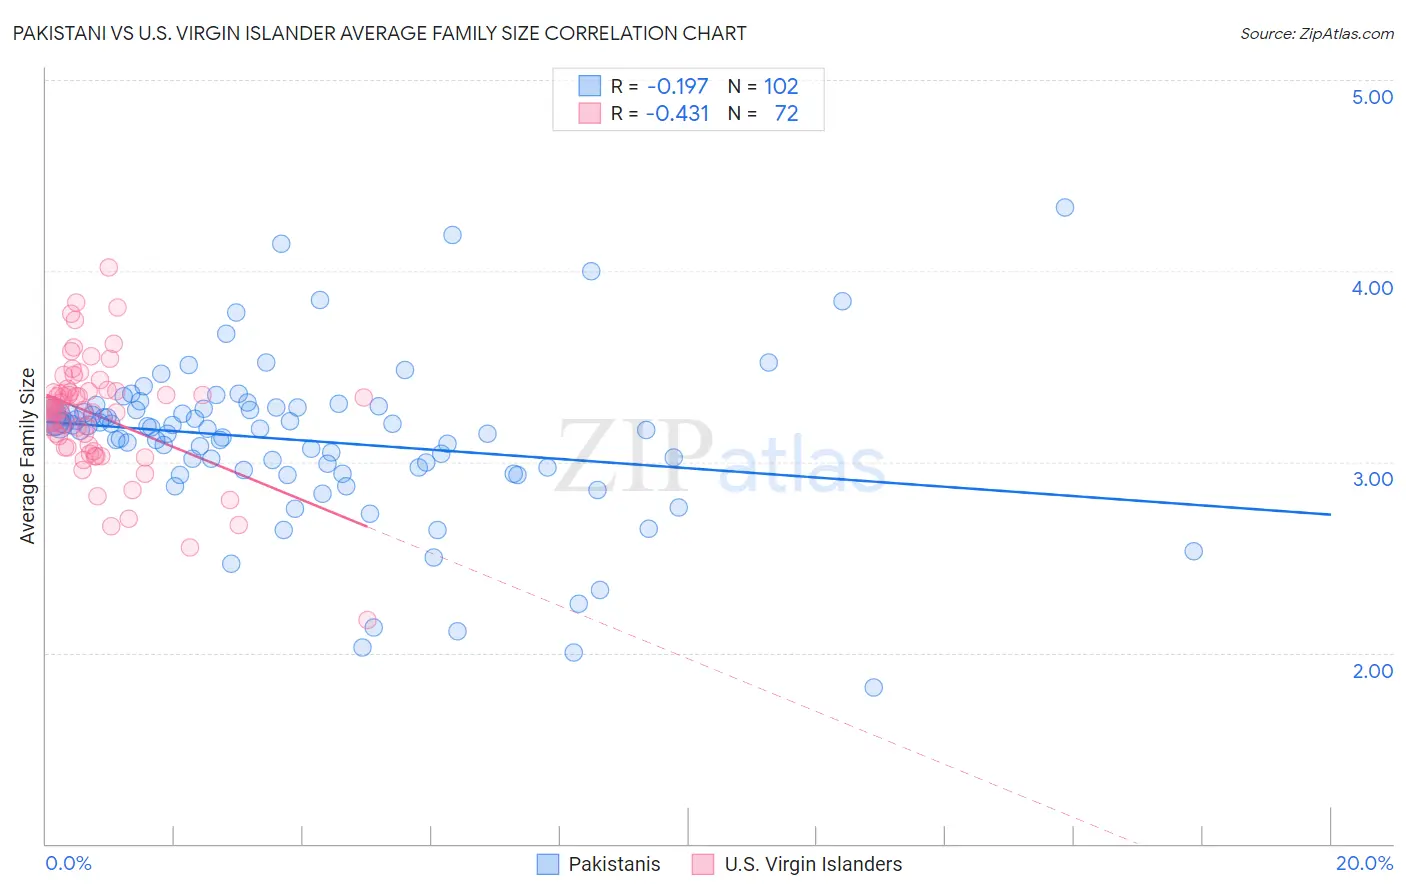
Pakistani vs U.S. Virgin Islander Average Family Size Correlation Chart
The statistical analysis conducted on geographies consisting of 335,179,605 people shows a poor negative correlation between the proportion of Pakistanis and average family size in the United States with a correlation coefficient (R) of -0.197 and weighted average of 3.22. Similarly, the statistical analysis conducted on geographies consisting of 87,507,759 people shows a moderate negative correlation between the proportion of U.S. Virgin Islanders and average family size in the United States with a correlation coefficient (R) of -0.431 and weighted average of 3.29, a difference of 2.3%.
Average Family Size Correlation Summary
| Measurement | Pakistani | U.S. Virgin Islander |
| Minimum | 1.82 | 2.17 |
| Maximum | 4.33 | 4.02 |
| Range | 2.51 | 1.85 |
| Mean | 3.11 | 3.24 |
| Median | 3.17 | 3.27 |
| Interquartile 25% (IQ1) | 2.96 | 3.08 |
| Interquartile 75% (IQ3) | 3.28 | 3.37 |
| Interquartile Range (IQR) | 0.32 | 0.29 |
| Standard Deviation (Sample) | 0.42 | 0.30 |
| Standard Deviation (Population) | 0.42 | 0.30 |
Similar Demographics by Average Family Size
Demographics Similar to Pakistanis by Average Family Size
In terms of average family size, the demographic groups most similar to Pakistanis are Burmese (3.22, a difference of 0.060%), Immigrants from Zaire (3.22, a difference of 0.070%), Immigrants from Eastern Africa (3.22, a difference of 0.080%), Thai (3.22, a difference of 0.090%), and Immigrants from Israel (3.22, a difference of 0.090%).
| Demographics | Rating | Rank | Average Family Size |
| Moroccans | 44.2 /100 | #182 | Average 3.22 |
| Immigrants | Northern Africa | 41.7 /100 | #183 | Average 3.22 |
| Immigrants | Eastern Asia | 40.8 /100 | #184 | Average 3.22 |
| Immigrants | Sri Lanka | 39.8 /100 | #185 | Fair 3.22 |
| Immigrants | Argentina | 39.8 /100 | #186 | Fair 3.22 |
| Immigrants | Malaysia | 39.0 /100 | #187 | Fair 3.22 |
| Thais | 38.3 /100 | #188 | Fair 3.22 |
| Pakistanis | 33.7 /100 | #189 | Fair 3.22 |
| Burmese | 31.0 /100 | #190 | Fair 3.22 |
| Immigrants | Zaire | 30.5 /100 | #191 | Fair 3.22 |
| Immigrants | Eastern Africa | 30.1 /100 | #192 | Fair 3.22 |
| Immigrants | Israel | 29.3 /100 | #193 | Fair 3.22 |
| Immigrants | Sudan | 29.1 /100 | #194 | Fair 3.22 |
| Choctaw | 28.3 /100 | #195 | Fair 3.21 |
| Senegalese | 28.2 /100 | #196 | Fair 3.21 |
Demographics Similar to U.S. Virgin Islanders by Average Family Size
In terms of average family size, the demographic groups most similar to U.S. Virgin Islanders are Immigrants from Oceania (3.29, a difference of 0.040%), Barbadian (3.29, a difference of 0.040%), Nigerian (3.29, a difference of 0.050%), Guamanian/Chamorro (3.29, a difference of 0.050%), and Immigrants from Burma/Myanmar (3.29, a difference of 0.070%).
| Demographics | Rating | Rank | Average Family Size |
| Malaysians | 99.6 /100 | #89 | Exceptional 3.31 |
| Menominee | 99.4 /100 | #90 | Exceptional 3.30 |
| Immigrants | Pakistan | 99.2 /100 | #91 | Exceptional 3.30 |
| Immigrants | Cameroon | 99.2 /100 | #92 | Exceptional 3.30 |
| Peruvians | 99.2 /100 | #93 | Exceptional 3.30 |
| Sierra Leoneans | 99.0 /100 | #94 | Exceptional 3.30 |
| Immigrants | Lebanon | 99.0 /100 | #95 | Exceptional 3.30 |
| U.S. Virgin Islanders | 98.8 /100 | #96 | Exceptional 3.29 |
| Immigrants | Oceania | 98.7 /100 | #97 | Exceptional 3.29 |
| Barbadians | 98.6 /100 | #98 | Exceptional 3.29 |
| Nigerians | 98.6 /100 | #99 | Exceptional 3.29 |
| Guamanians/Chamorros | 98.6 /100 | #100 | Exceptional 3.29 |
| Immigrants | Burma/Myanmar | 98.6 /100 | #101 | Exceptional 3.29 |
| West Indians | 98.5 /100 | #102 | Exceptional 3.29 |
| Immigrants | Western Africa | 98.4 /100 | #103 | Exceptional 3.29 |