Pakistani vs Immigrants from Jordan Average Family Size
COMPARE
Pakistani
Immigrants from Jordan
Average Family Size
Average Family Size Comparison
Pakistanis
Immigrants from Jordan
3.22
AVERAGE FAMILY SIZE
33.7/ 100
METRIC RATING
189th/ 347
METRIC RANK
3.24
AVERAGE FAMILY SIZE
75.7/ 100
METRIC RATING
147th/ 347
METRIC RANK
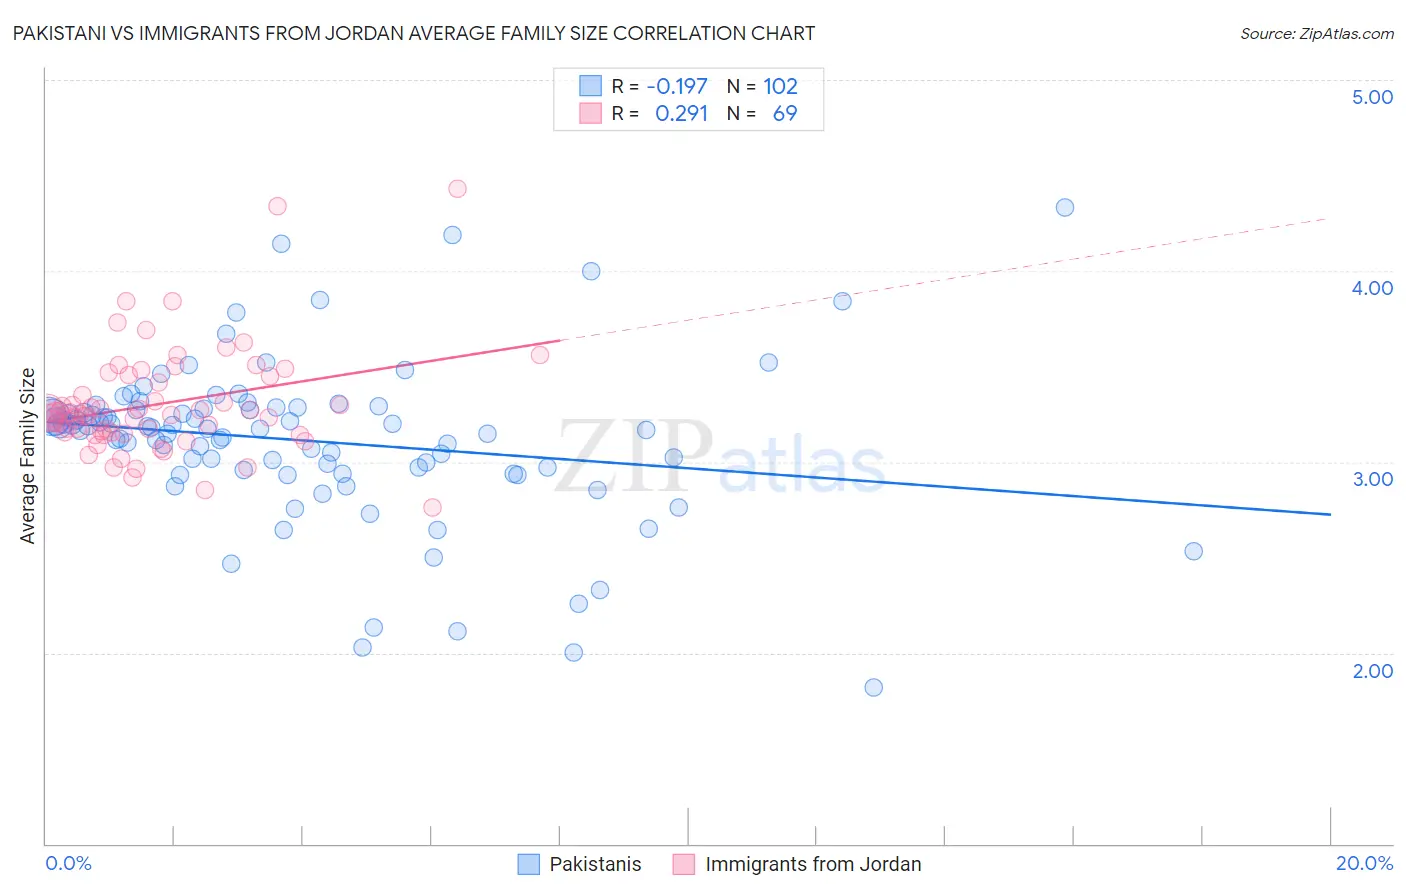
Pakistani vs Immigrants from Jordan Average Family Size Correlation Chart
The statistical analysis conducted on geographies consisting of 335,179,605 people shows a poor negative correlation between the proportion of Pakistanis and average family size in the United States with a correlation coefficient (R) of -0.197 and weighted average of 3.22. Similarly, the statistical analysis conducted on geographies consisting of 181,252,628 people shows a weak positive correlation between the proportion of Immigrants from Jordan and average family size in the United States with a correlation coefficient (R) of 0.291 and weighted average of 3.24, a difference of 0.83%.
Average Family Size Correlation Summary
| Measurement | Pakistani | Immigrants from Jordan |
| Minimum | 1.82 | 2.76 |
| Maximum | 4.33 | 4.43 |
| Range | 2.51 | 1.67 |
| Mean | 3.11 | 3.30 |
| Median | 3.17 | 3.25 |
| Interquartile 25% (IQ1) | 2.96 | 3.15 |
| Interquartile 75% (IQ3) | 3.28 | 3.45 |
| Interquartile Range (IQR) | 0.32 | 0.30 |
| Standard Deviation (Sample) | 0.42 | 0.29 |
| Standard Deviation (Population) | 0.42 | 0.28 |
Similar Demographics by Average Family Size
Demographics Similar to Pakistanis by Average Family Size
In terms of average family size, the demographic groups most similar to Pakistanis are Burmese (3.22, a difference of 0.060%), Immigrants from Zaire (3.22, a difference of 0.070%), Immigrants from Eastern Africa (3.22, a difference of 0.080%), Thai (3.22, a difference of 0.090%), and Immigrants from Israel (3.22, a difference of 0.090%).
| Demographics | Rating | Rank | Average Family Size |
| Moroccans | 44.2 /100 | #182 | Average 3.22 |
| Immigrants | Northern Africa | 41.7 /100 | #183 | Average 3.22 |
| Immigrants | Eastern Asia | 40.8 /100 | #184 | Average 3.22 |
| Immigrants | Sri Lanka | 39.8 /100 | #185 | Fair 3.22 |
| Immigrants | Argentina | 39.8 /100 | #186 | Fair 3.22 |
| Immigrants | Malaysia | 39.0 /100 | #187 | Fair 3.22 |
| Thais | 38.3 /100 | #188 | Fair 3.22 |
| Pakistanis | 33.7 /100 | #189 | Fair 3.22 |
| Burmese | 31.0 /100 | #190 | Fair 3.22 |
| Immigrants | Zaire | 30.5 /100 | #191 | Fair 3.22 |
| Immigrants | Eastern Africa | 30.1 /100 | #192 | Fair 3.22 |
| Immigrants | Israel | 29.3 /100 | #193 | Fair 3.22 |
| Immigrants | Sudan | 29.1 /100 | #194 | Fair 3.22 |
| Choctaw | 28.3 /100 | #195 | Fair 3.21 |
| Senegalese | 28.2 /100 | #196 | Fair 3.21 |
Demographics Similar to Immigrants from Jordan by Average Family Size
In terms of average family size, the demographic groups most similar to Immigrants from Jordan are Blackfeet (3.24, a difference of 0.020%), Assyrian/Chaldean/Syriac (3.24, a difference of 0.050%), Indian (Asian) (3.24, a difference of 0.050%), Jordanian (3.24, a difference of 0.050%), and Armenian (3.25, a difference of 0.060%).
| Demographics | Rating | Rank | Average Family Size |
| Sub-Saharan Africans | 81.6 /100 | #140 | Excellent 3.25 |
| Venezuelans | 81.4 /100 | #141 | Excellent 3.25 |
| Liberians | 81.2 /100 | #142 | Excellent 3.25 |
| Bhutanese | 81.0 /100 | #143 | Excellent 3.25 |
| Tsimshian | 80.2 /100 | #144 | Excellent 3.25 |
| Armenians | 78.2 /100 | #145 | Good 3.25 |
| Immigrants | Africa | 77.9 /100 | #146 | Good 3.25 |
| Immigrants | Jordan | 75.7 /100 | #147 | Good 3.24 |
| Blackfeet | 75.0 /100 | #148 | Good 3.24 |
| Assyrians/Chaldeans/Syriacs | 73.8 /100 | #149 | Good 3.24 |
| Indians (Asian) | 73.6 /100 | #150 | Good 3.24 |
| Jordanians | 73.5 /100 | #151 | Good 3.24 |
| Spanish Americans | 72.5 /100 | #152 | Good 3.24 |
| Immigrants | Eritrea | 71.4 /100 | #153 | Good 3.24 |
| Immigrants | Egypt | 70.0 /100 | #154 | Good 3.24 |